Preparation and Characterization of Self-Healing Mortar Based on “Build-In” Carbonation


Abstract
1. Introduction
2. Experiments
2.1. Raw Materials
2.2. Preparation and Test of CHPs
2.2.1. Pelletization Process
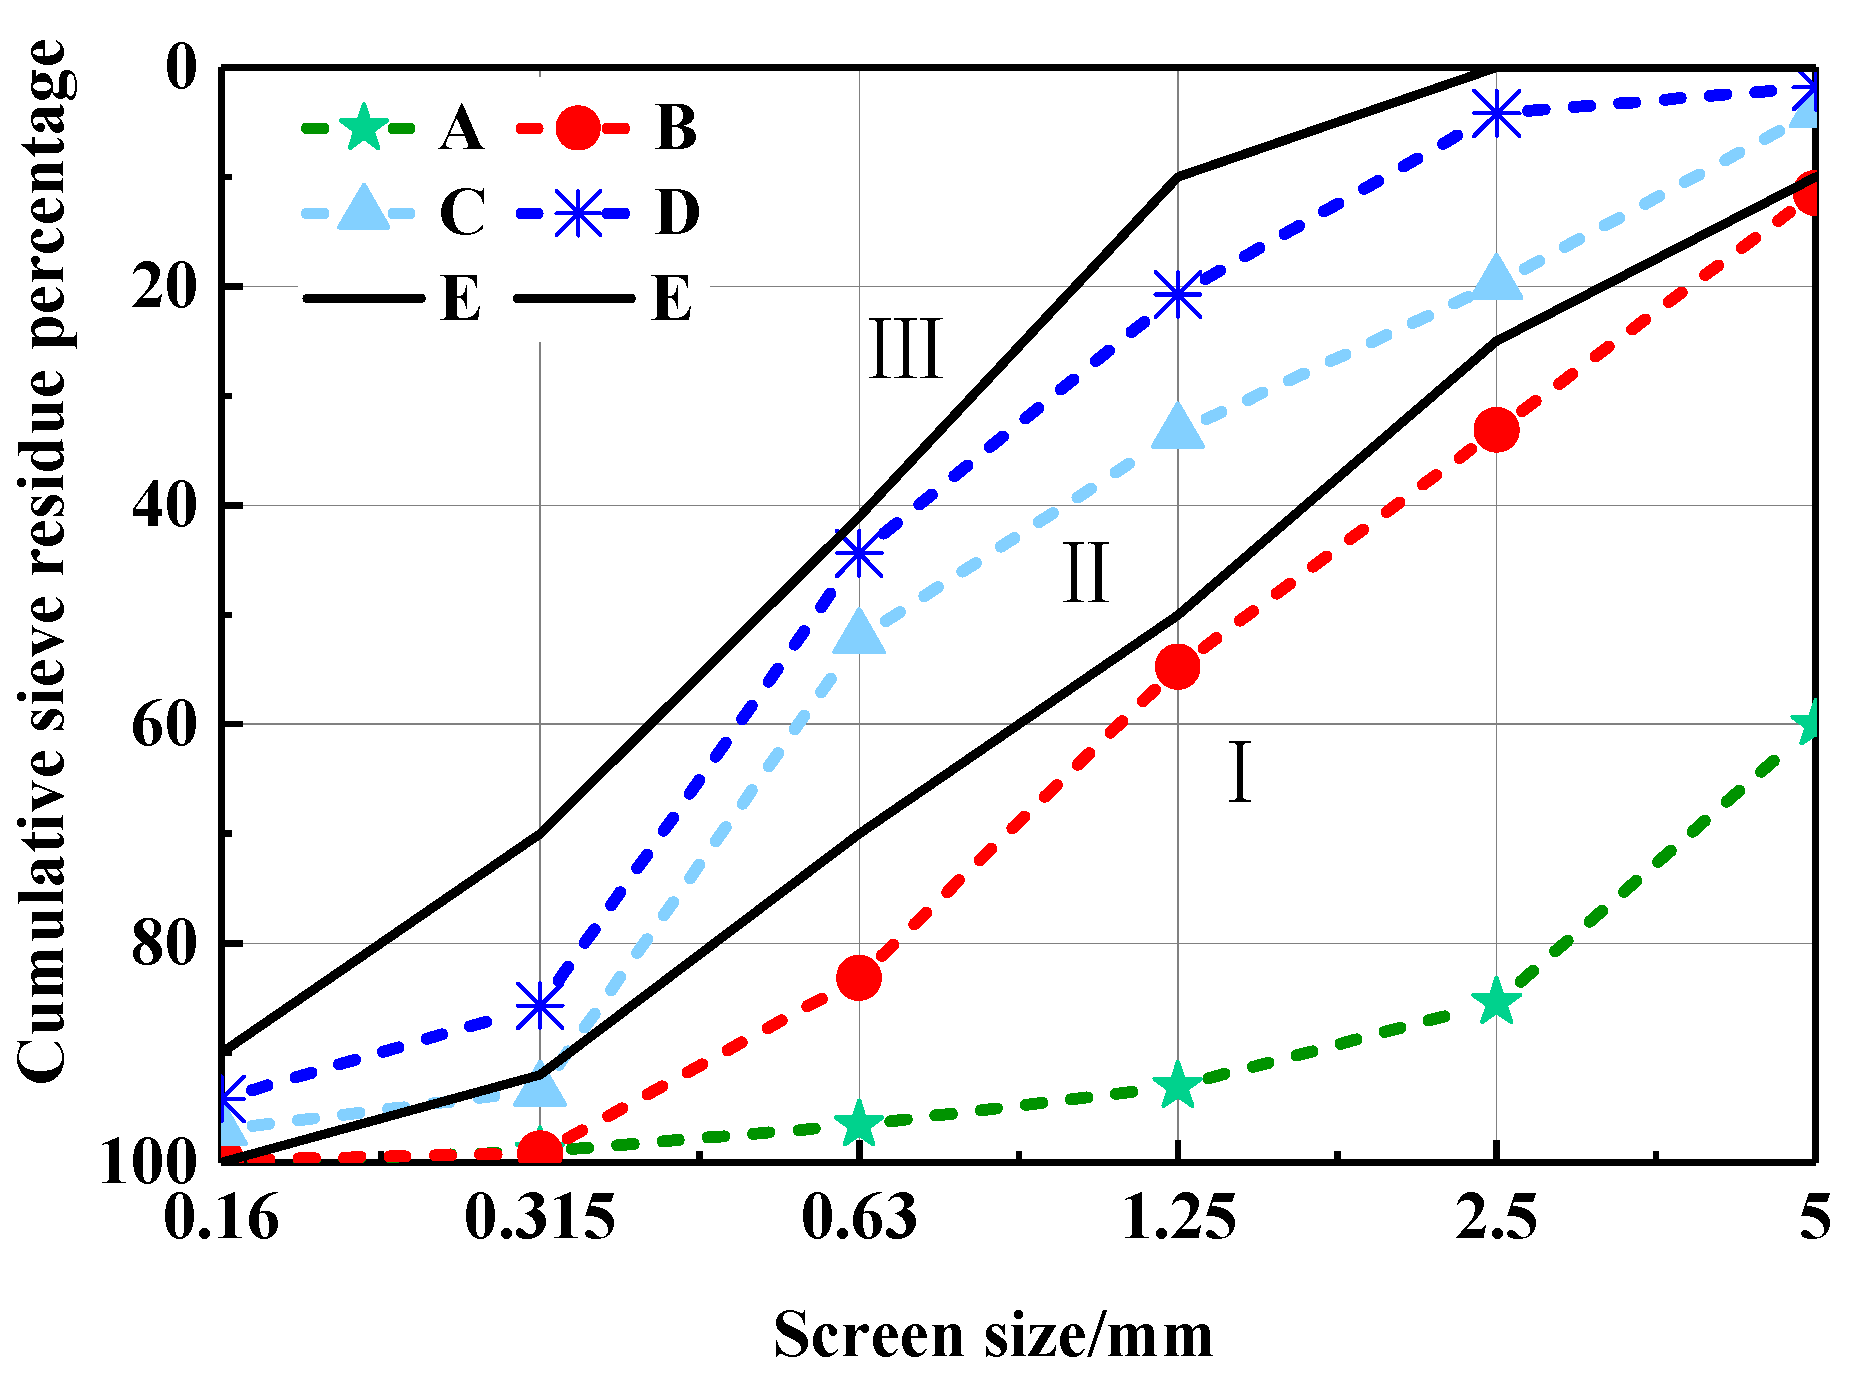
2.2.2. Size Grading and Bulk Density
2.2.3. Microstructural Tests
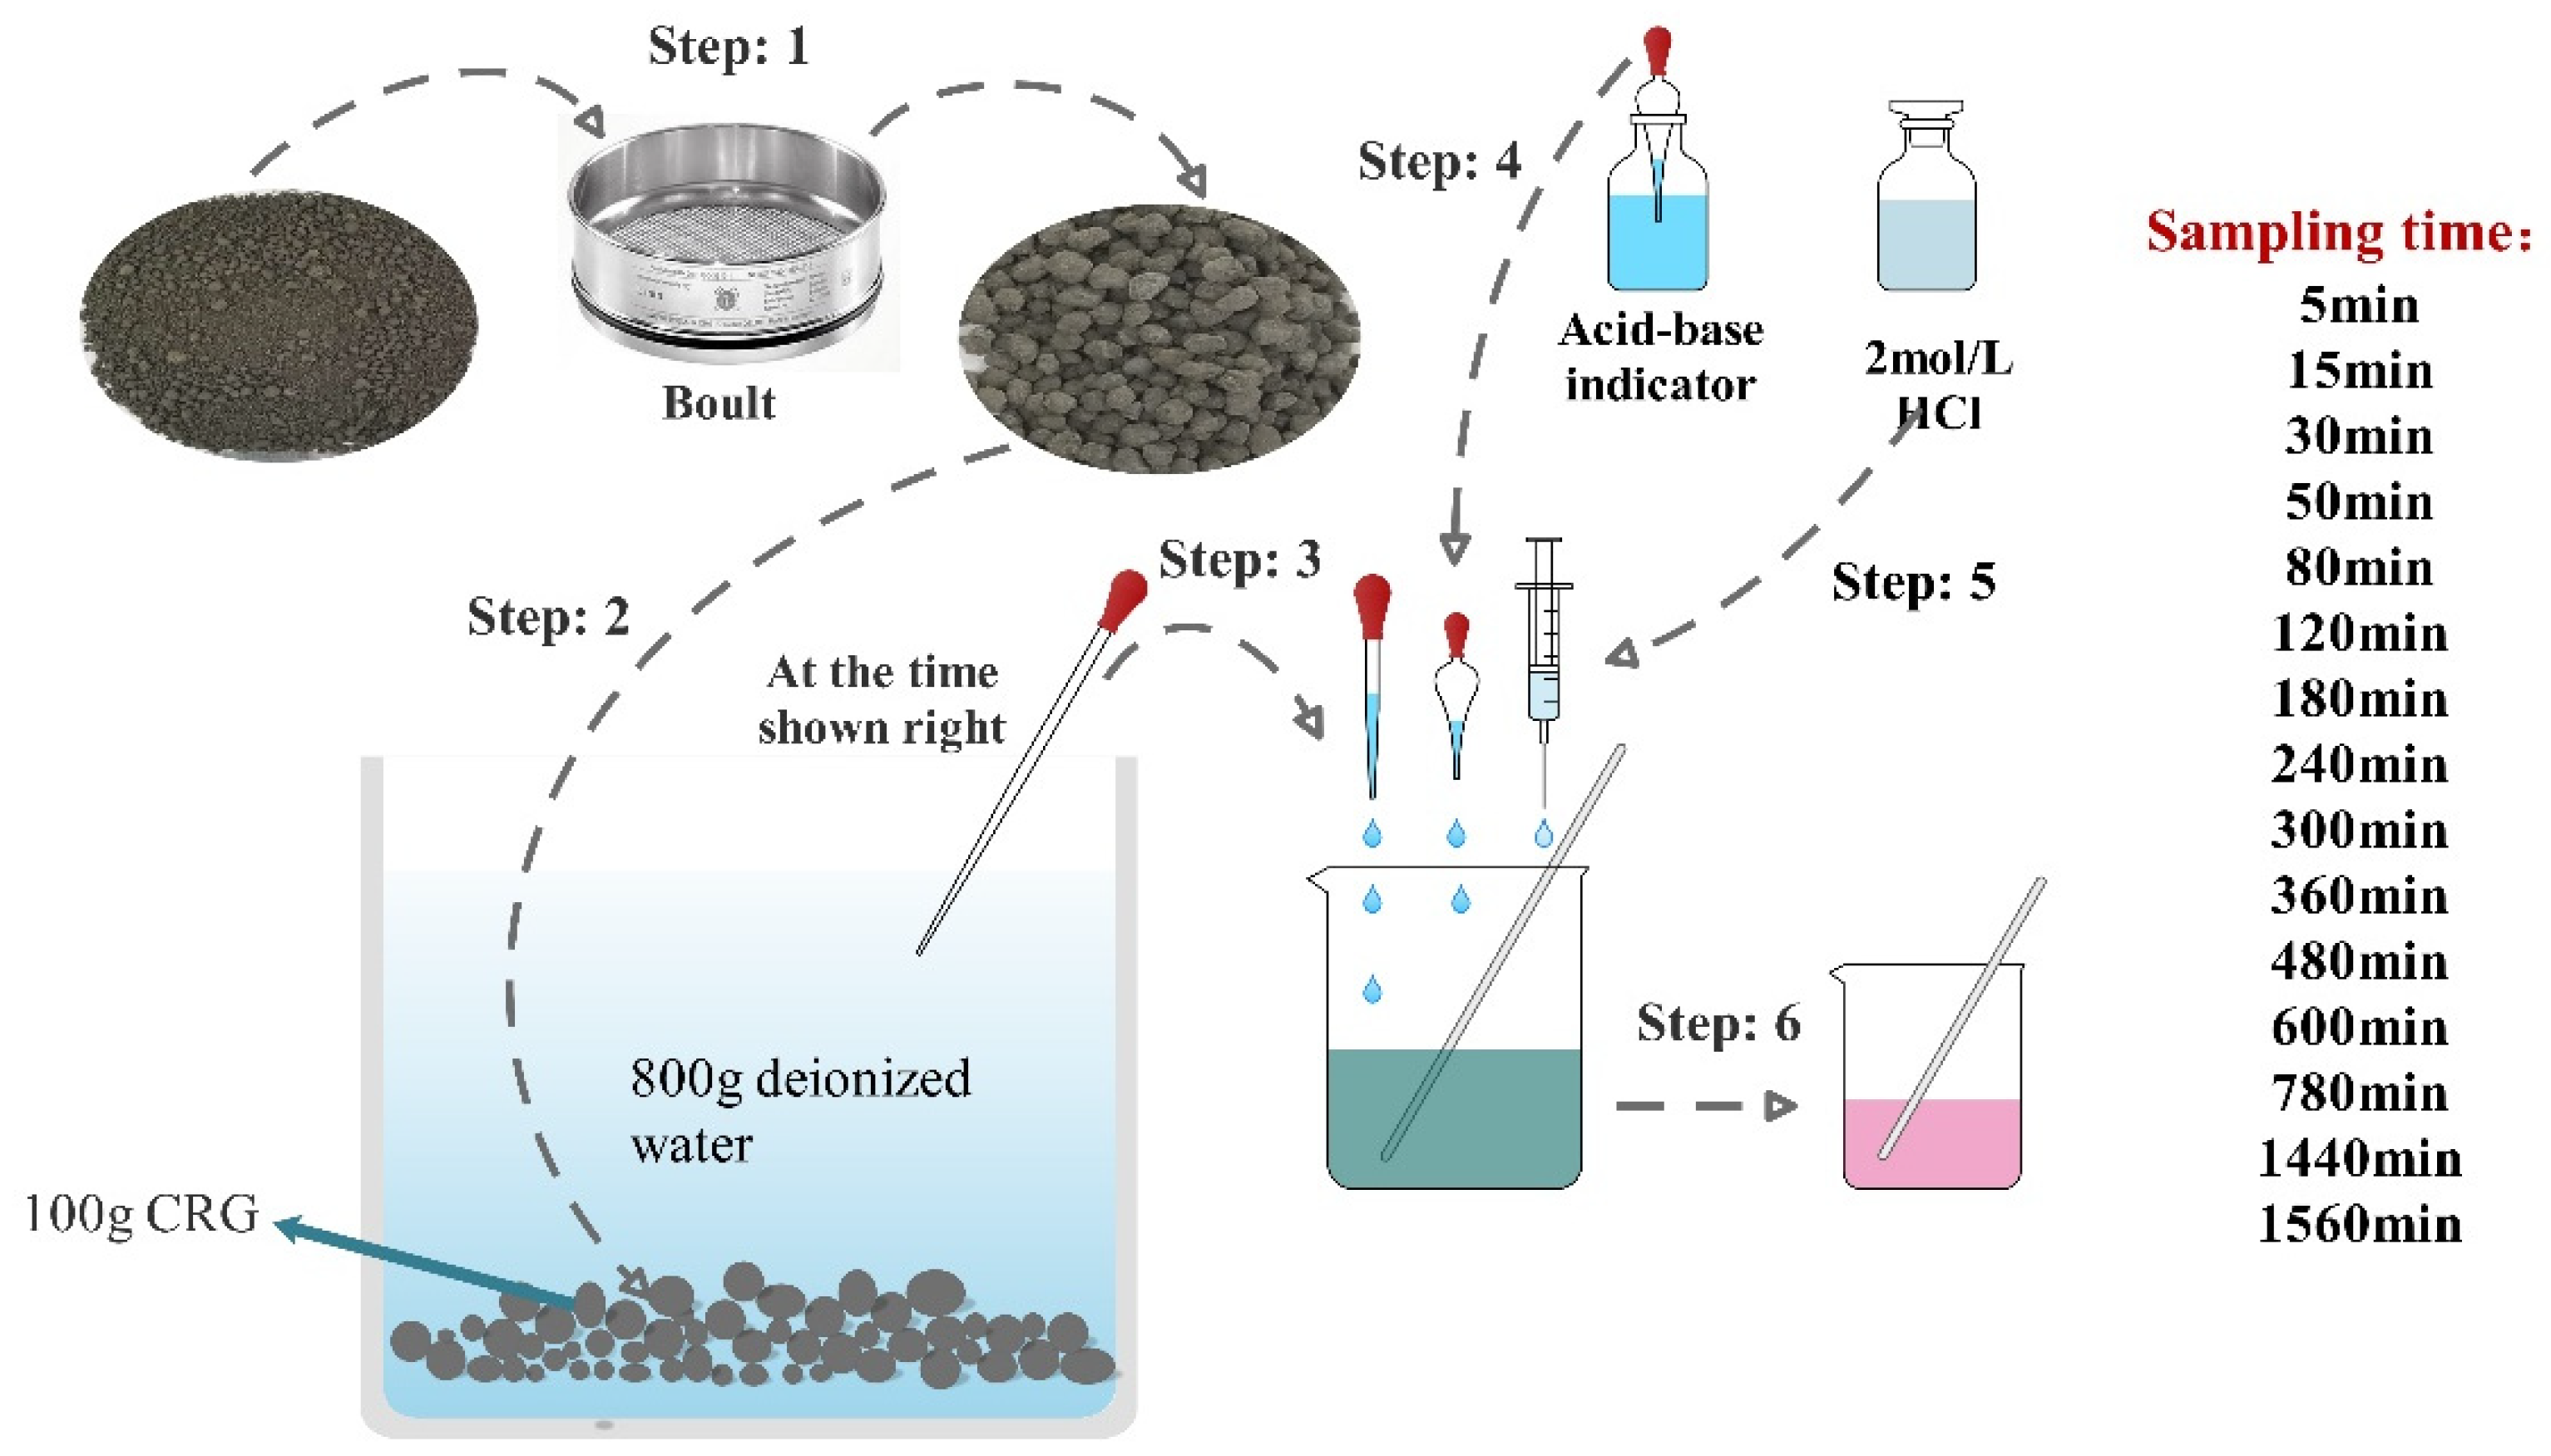
2.2.4. The Ion Exchange Rate of CHPs
2.3. Preparation and Test of Mortar
2.3.1. Preparation of Mortar
2.3.2. Workability Test
Fluidity and Setting Time of Fresh Mortar
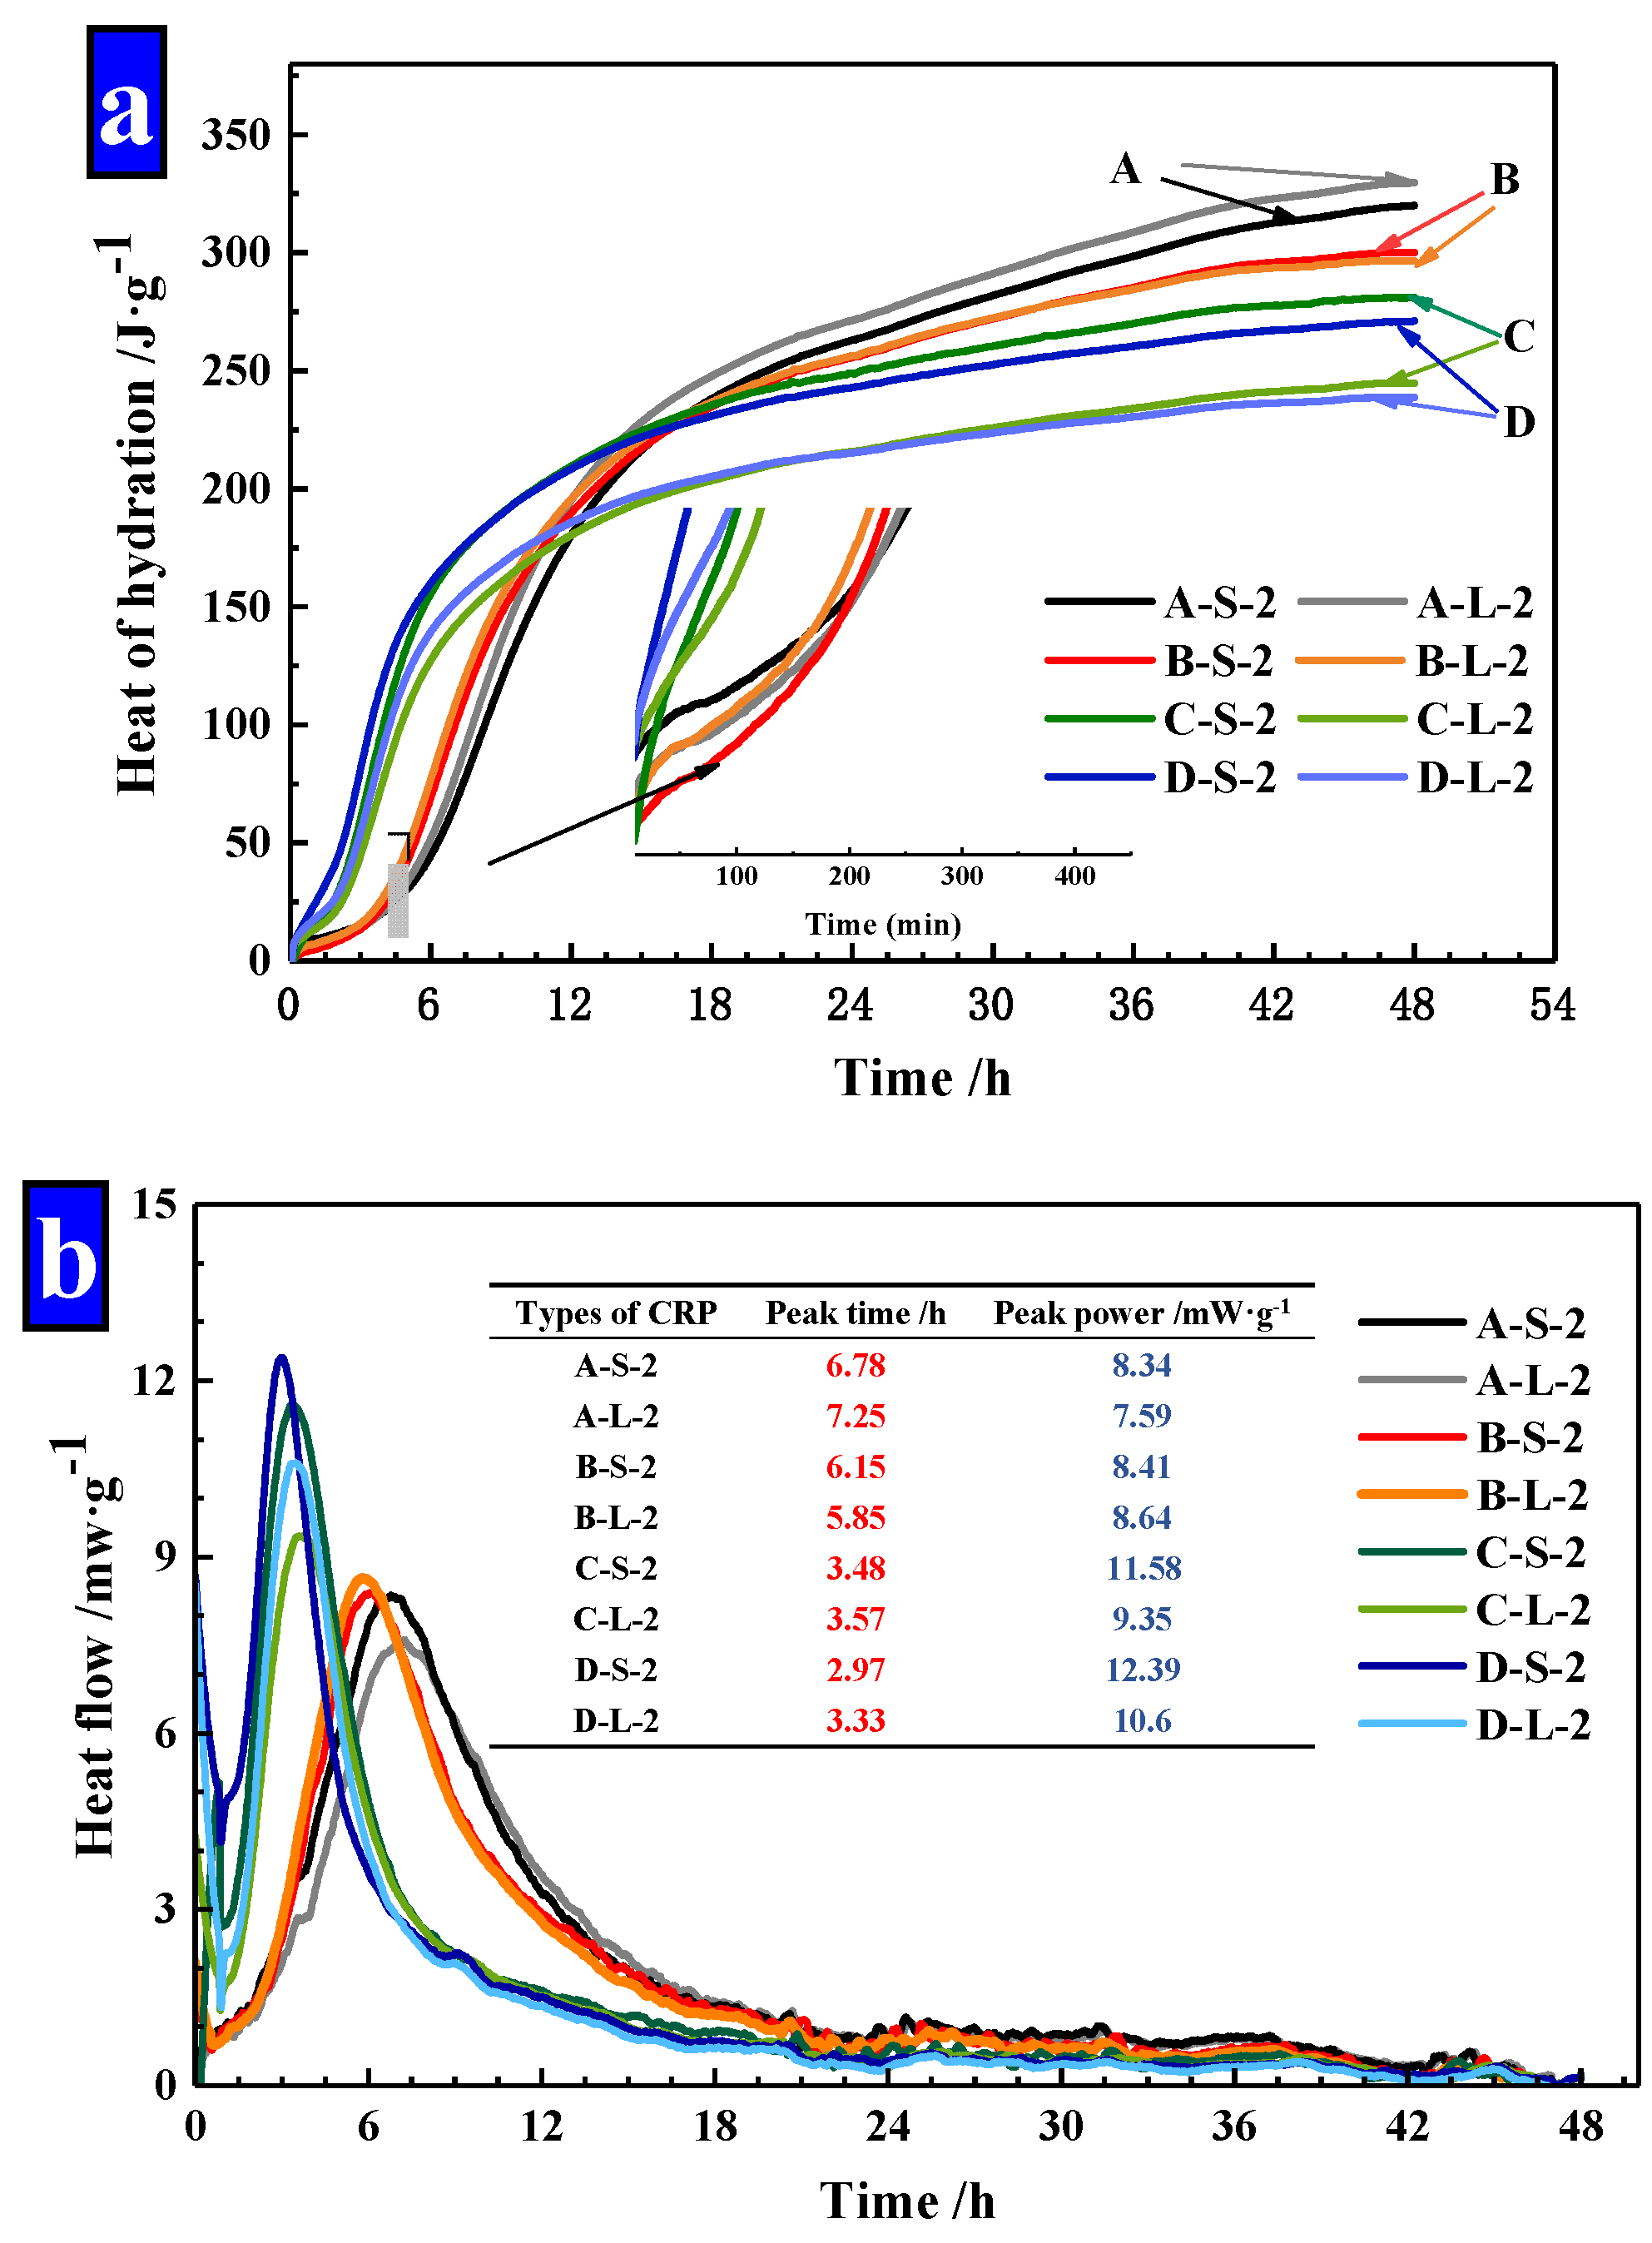
Isothermal Calorimetry
2.3.3. Mechanical Test
Compressive Strength
Flexural Strength
Healing Rate of Flexural Strength
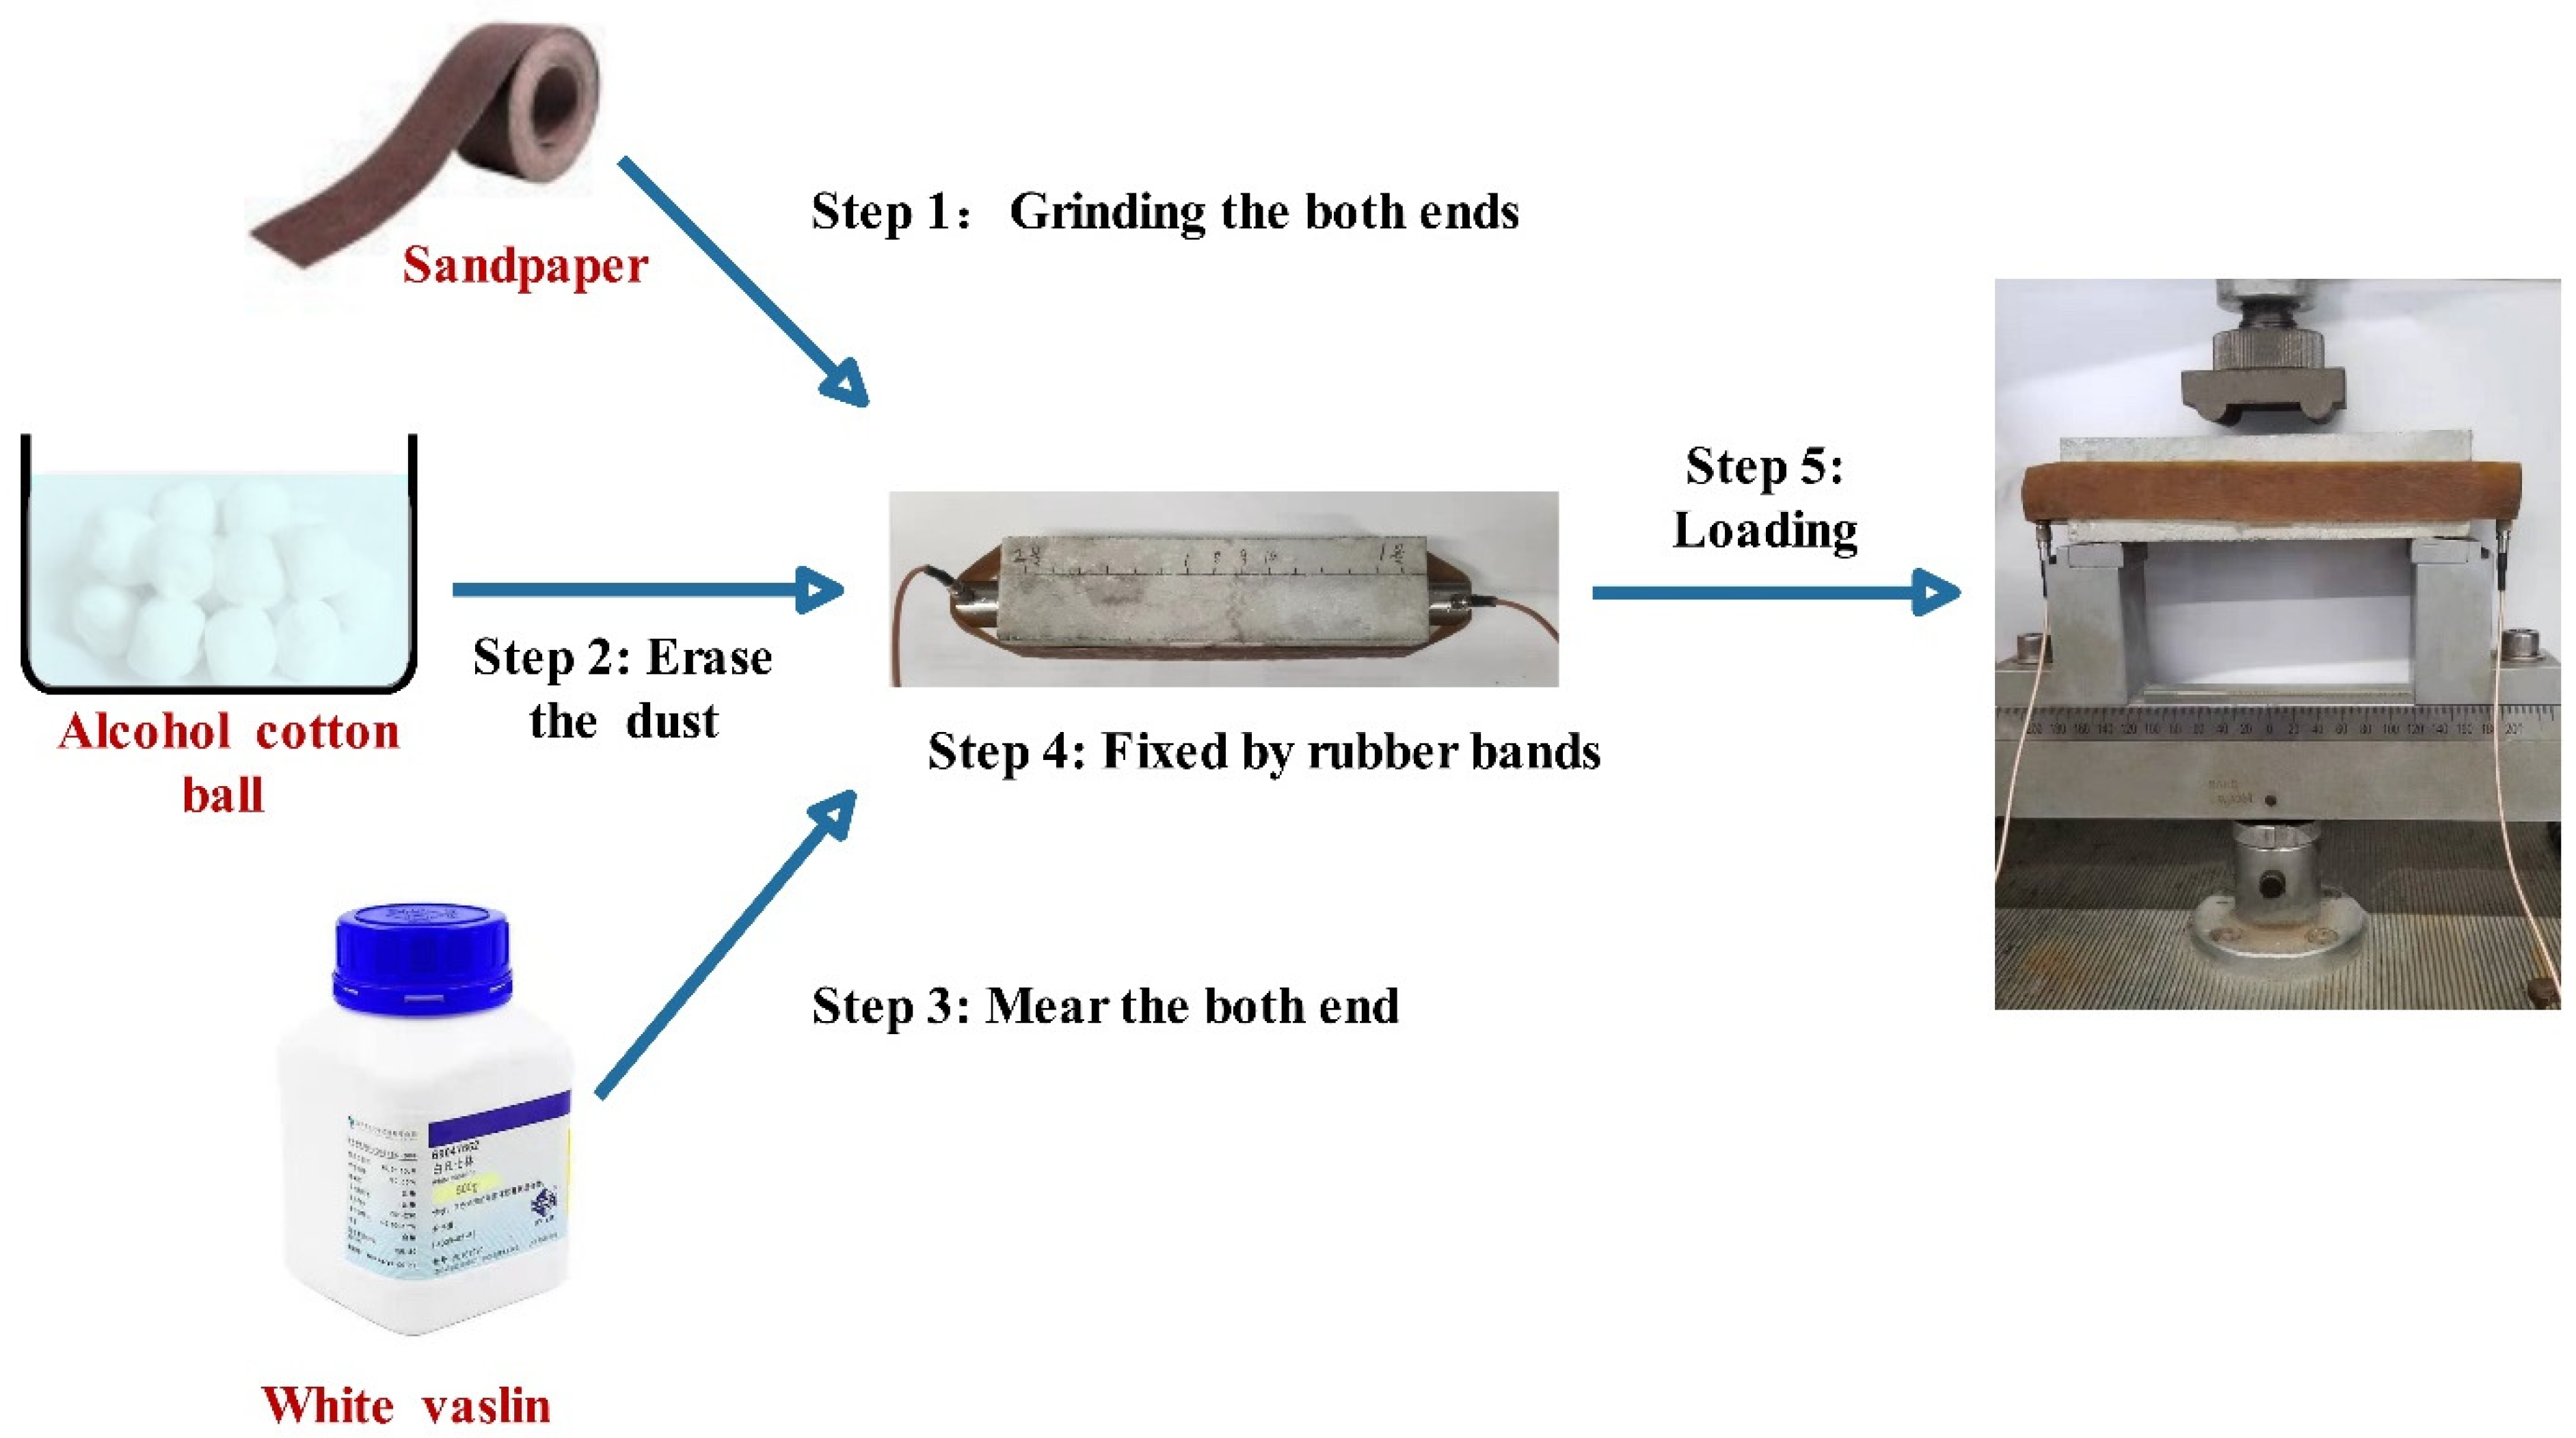
2.3.4. Acoustic Emission Test
Active AE
Passive AE
3. Results and Discussion
3.1. Characterization of CHPs
3.1.1. Size Grading and Bulk Density
3.1.2. Microstructural Tests
3.1.3. The Ion Release Rate of CHPs
3.2. The Workability of Mortar with CHPs
3.2.1. Fluidity and setting Time of Fresh Mortar
3.2.2. Isothermal Calorimetry
3.3. The Mechanical Property of Specimens with CHPs
3.3.1. Compressive Strength
3.3.2. Flexural Strengths
3.3.3. The Healing Rate of Flexural Strength
3.4. Evaluation of Healing effect
3.4.1. Active AE
3.4.2. Passive AE
4. Conclusions
Author Contributions
Funding
Conflicts of Interest
References
- De Belie, N.; Gruyaert, E.; Al-Tabbaa, A.; Antonaci, P.; Baera, C.; Bajare, D.; Darquennes, A.; Davies, R.; Ferrara, L.; Jefferson, T.; et al. A review of self-healing concrete for damage management of structures. Adv. Mater. Interfaces 2018. [Google Scholar] [CrossRef]
- Mihashi, H.; Kaneko, Y.; Nishiwaki, T.; Otsuka, K. Fundamental study on development of intelligent concrete characterized by self-healing capability for strength. Trans. Jpn. Concr. Inst. 2001, 22, 441–450. [Google Scholar]
- Soroker, V.J.; Denson, A.J. Autogenous healing of concrete. Zement 1926, 25, 76. [Google Scholar]
- Brandeis, F. Autogenous healing of concrete. Beton u Eisen 1937, 12, 36. [Google Scholar]
- Wu, M.; Johannesson, B.; Geiker, M. A review: Self-healing in cementitious materials and engineered cementitious composite as a self-healing material. Constr. Build. Mater. 2012, 28, 571–583. [Google Scholar] [CrossRef]
- De Rooij, M.; Van Tittelboom, K.; De Belie, N.; Schlangen, E. Self-Healing Phenomena in Cement-Based Materials, State-of-the-Art Report of RILEM Technical Committee 221-SHC; Springer: Dordrecht, The Netherlands, 2013. [Google Scholar]
- Sanjun, M.A. Effectiveness of crack control at early age on the corrosion of steel bars in low modulus sisal and coconut fiber-reinforced mortar. Cem. Concr. Res. 1998, 28, 555–565. [Google Scholar] [CrossRef]
- Jacobsen, S. SEM Observations of the microstructure of frost deteriorated and self-healed concrete. Cem. Concr. Res. 1995, 25, 1781–1790. [Google Scholar] [CrossRef]
- Van Tittelboom, K.; De Belie, N. Self-healing in cementitious materials—A review. Materials 2013, 6, 2182–2217. [Google Scholar] [CrossRef]
- Mihashi, H.; Nishiwaki, T. Development of engineered self-healing and self-repairing concrete-state-of-the-art report. J. Adv. Concr. Technol. 2012, 10, 170. [Google Scholar] [CrossRef]
- Edvardsen, C. Water permeability and autogenous healing of cracks in concrete. ACI Mater. J. 1999, 96, 448. [Google Scholar]
- Huang, H.; Ye, G.; Qian, C.; Schlangen, E. Self-healing in cementitious materials: Materials, methods and service conditions. Mater. Des. 2016, 92, 499–511. [Google Scholar] [CrossRef]
- Li, W.; Dong, B.; Yang, Z.; Xu, J.; Chen, Q.; Li, H.; Xing, F.; Jiang, Z. Recent Advances in Intrinsic Self-Healing Cementitious Materials. Adv. Mater. 2018, 30, 1705679. [Google Scholar] [CrossRef] [PubMed]
- Kishi, T.; Ahn, T.H.; Hosoda, A.; Suzuki, S.; Takaoka, H. Self-healing behaviour by cementitious recrystallization of cracked concrete incorporating expansive agent. In Proceedings of the 1st International Conference on Self-healing Materials, Dordrecht, The Netherlands, 18–20 April 2007. [Google Scholar]
- Ahn, T.H.; Kishi, T. Crack self-healing behavior of cementitious composites incorporating various mineral admixtures. J. Adv. Concr. Technol. 2010, 8, 171–186. [Google Scholar] [CrossRef]
- Kishi, T.H.; Ahn, T.H.; Morita, M.; Koide, T. Field test of self-healing concrete on the recovery of water tightness to leakage through cracks. In Proceedings of the 3rd International Conference on Self-healing Materials, Bath, UK, 27–29 June 2011. [Google Scholar]
- Sisomphon, K.; Copuroglu, O.; Koenders, E.A.B. Self-healing of surface cracks in mortar with expansive additive and crystalline additive. Cem. Concr. Compos. 2012, 34, 566–574. [Google Scholar] [CrossRef]
- Jiang, Z.; Li, W.; Yuan, Z. Influence of mineral additives and environmental conditions on the self-healing capabilities of cementitious materials. Cem. Concr. Compos. 2015, 57, 116–127. [Google Scholar] [CrossRef]
- Li, W.; Ling, C.; Jiang, Z. Evaluation of the potential use of form-stable phase change materials to improve the freeze-thaw resistance of concrete. Constr. Build. Mater. 2019, 203, 621–632. [Google Scholar] [CrossRef]
- Wang, X.; Fang, C.; Li, D.; Han, N.; Xing, F. A self-healing cementitious composite with mineral admixtures and built-in carbonate. Cem. Concr. Compos. 2018, 92, 216–229. [Google Scholar] [CrossRef]
- Alghamri, R.; Kanellopoulos, A.; Litina, C.; Al-Tabbaa, A. Preparation and polymeric encapsulation of powder mineral pellets for self-healing cement based materials. Constr. Build. Mater. 2018, 186, 247–262. [Google Scholar] [CrossRef]
- Alghamri, R.; Kanellopoulos, K.; Al-Tabbaa, A. Impregnation and encapsulation of lightweight aggregates for self-healing concrete. Constr. Build. Mater. 2016, 124, 910–921. [Google Scholar] [CrossRef]
- Choi, H.; Inoue, M.; Kim, D.; Choi, H.; Sengoku, R. Effect of Addition of Ca2+ and CO32− Ions with Temperature Control on Self-Healing of Hardened Cement Paste. Materials 2019, 12, 2456. [Google Scholar] [CrossRef]
- Choi, H.; Choi, H.; Inoue, M.; Sengoku, R. Control of the polymorphism of calcium carbonate produced by self-healing in the cracked part of cementitious materials. Appl. Sci. 2017, 7, 546. [Google Scholar] [CrossRef]
- Reddy, V.V.; Rao, H.S.; Jayaveera, K.N. Influence of strong alkaline substances (sodium carbonate and sodium bicarbonate) in mixing water on strength and setting properties of concrete. Indian J. Eng. Mater. Sci. (IJEMS) 2006, 13, 123–128. [Google Scholar]
- Ostrowski, K.; Stefaniuk, D.; Sadowski, Ł.; Krzywiński, K.; Gicala, M.; Różańska, M. Potential use of granite waste sourced from rock processing for the application as coarse aggregate in high-performance self-compacting concrete. Constr. Build. Mater. 2020, 238, 117794. [Google Scholar] [CrossRef]
- Ostrowski, K.; Sadowski, Ł.; Stefaniuk, D.; Wałach, D.; Gawenda, T.; Oleksik, K.; Usydus, I. The Effect of the Morphology of Coarse Aggregate on the Properties of Self-Compacting High-Performance Fibre-Reinforced Concrete. Materials 2018, 11, 1372. [Google Scholar] [CrossRef] [PubMed]
- Li, W.; Zhu, X.; Zhao, N.; Jiang, Z. Preparation and Properties of Melamine Urea-Formaldehyde Microcapsules for Self-Healing of Cementitious Materials. Materials 2016, 9, 152. [Google Scholar] [CrossRef]
- Lee, Y.-S.; Ryou, J.-S. Self-healing behavior for crack closing of expansive agent via granulation/film coating method. Constr. Build. Mater. 2014, 71, 188–193. [Google Scholar] [CrossRef]
- De Koster, S.A.L.; Mors, R.M.; Nugteren, H.W.; Jonkers, H.M.; Meesters, G.M.H.; van Ommen, J.R. Geopolymer coating of bacteria-containing granules for use in self-healing concrete. Proc. Eng. 2015, 102, 475–484. [Google Scholar]
- Standard Test Methods for Analysis of Soda Ash (Sodium Carbonate); ASTM E359-17; ASTM International: West Conshocken, PA, USA, 2017.
- Standard for Technical Requirements and Test Method of Sand and Crushed Stone (or Gravel) for Ordinary Concrete; JGJ-52-2006; China Architecture & Building Press: Beijing, China, 2006.
- Method of Testing Cements-Determination of Strength; BS EN 196-1:2016; CSBTS: Beijing, China, 1999.
- Methods of Test for Mortar for Masonry. Determination of Consistence of Fresh Mortar; BS EN 1015-3:1999; BSI: Brussels, Belgium, 1999.
- Chinese Construction Industry Standards: Standards for Test Method of Basic Properties of Construction Mortar; JGJ/T 70-2009; China Architecture & Building Press: Beijing, China, 2009.
- Test Methods for Heat of Hydration of Cement; GB/T 12959-2008; Standards Press of China: Beijing, China, 2008.
- Standard for Test Method of Performance on Building Mortar; JGJ 70-90; National Standards of Peoples Republic of China: Beijing, China, 2009.
- Standard Test Method for Flexural Strength of Hydraulic Cement Mortar; ASTM C348-08; ASTM International: West Conshocken, PA, USA, 2008.
- He, B.; Gao, Y.; Qu, L.; Duan, K.; Zhou, W.; Pei, G. Characteristics analysis of self-luminescent cement-based composite materials with self-cleaning effect. J. Clean. Prod. 2019, 225, 1169–1183. [Google Scholar] [CrossRef]
- Gao, Y.; He, B.; Li, Y.; Tang, J.; Qu, L. Effects of nano-particles on improvement in wear resistance and drying shrinkage of road fly ash concrete. Constr. Build. Mater. 2017, 151, 228–235. [Google Scholar] [CrossRef]
- Li, W.; Jiang, Z.; Yang, Z. Acoustic characterization of damage and healing of microencapsulation-based self-healing cement matrices. Cem. Concr. Compos. 2017, 84, 48–61. [Google Scholar] [CrossRef]
- Ren, Q.; Zeng, Z.; Jiang, Z.; Li, H. Functionalization of renewable bamboo charcoal to improve indoor environment quality in a sustainable way. J. Clean. Product. 2020, 246, 119028. [Google Scholar] [CrossRef]
- Janotka, I. Hydration of the cement paste with Na2CO3 addition. Ceram.-Silik. 2001, 45, 16–23. [Google Scholar]
- Wong, H.S.; Pappas, A.M.; Zimmermanb, R.W.; Buenfeld, N.R. Effect of entrained air voids on the microstructure and mass transport properties of concrete. Cem. Concr. Res. 2011, 41, 1067–1077. [Google Scholar] [CrossRef]
- Gallucci, E.; Scrivener, K.; Groso, A.; Stampanoni, M.; Margaritondo, G. 3D experimental investigation of the microstructure of cement pastes using synchrotron X-ray microtomography (μCT). Cem. Concr. Res. 2007, 37, 360–368. [Google Scholar] [CrossRef]
- Lam, L.; Wong, Y.L.; Poon, C.S. Degree of hydration and gel/space ratio of high-volume fly ash/cement systems. Cem. Concr. Res. 2000, 30, 747–756. [Google Scholar] [CrossRef]
- Bentz, D.P.; Haecker, J.C. An argument for using coarse cements in high-performance concretes. Cem. Concr. Res. 1999, 29, 615–618. [Google Scholar] [CrossRef]


| Materials | CaO | SiO2 | Al2O3 | Fe2O3 | SO3 | K2O | MgO | TiO2 | Cl |
|---|---|---|---|---|---|---|---|---|---|
| CEM | 65 | 20.90 | 4.56 | 3.23 | 2.65 | 0.87 | 0.65 | 0.22 | 0.05 |
| Quartz sand | 0.05 | 99.27 | 0.3 | 0.03 | - | 0.1 | 0.05 | - | - |
| Types | CEM/g | Water/g | Na2CO3/g | Quartz Sand/g | |
|---|---|---|---|---|---|
| A | 0% | 100 | 22 | 0 | 30 |
| B | 5% | 100 | 22 | 5 | 30 |
| C | 10% | 100 | 22 | 10 | 30 |
| D | 15% | 100 | 22 | 15 | 30 |
| Groups | CHPs | Size | CEM/g | Water/g | River Sand/g | |
|---|---|---|---|---|---|---|
| K | - | - | 0 | 500 | 250 | 1250 |
| A-L-1 | A | Large | 10 | 1125 | ||
| A-L-2 | Large | 25 | 937.5 | |||
| A-L-3 | Large | 40 | 750 | |||
| A-S-1 | small | 10 | 1125 | |||
| A-S-2 | small | 25 | 937.5 | |||
| A-S-3 | small | 40 | 750 | |||
| B-L-1 | B | Large | 10 | 1125 | ||
| B-L-2 | Large | 25 | 937.5 | |||
| B-L-3 | Large | 40 | 750 | |||
| B-S-1 | small | 10 | 1125 | |||
| B-S-2 | small | 25 | 937.5 | |||
| B-S-3 | small | 40 | 750 | |||
| C-L-1 | C | Large | 10 | 1125 | ||
| C-L-2 | Large | 25 | 937.5 | |||
| C-L-3 | Large | 40 | 750 | |||
| C-S-1 | small | 10 | 1125 | |||
| C-S-2 | small | 25 | 937.5 | |||
| C-S-3 | small | 40 | 750 | |||
| D-L-1 | D | Large | 10 | 1125 | ||
| D-L-2 | Large | 25 | 937.5 | |||
| D-L-3 | Large | 40 | 750 | |||
| D-S-1 | small | 10 | 1125 | |||
| D-S-2 | small | 25 | 937.5 | |||
| D-S-3 | small | 40 | 750 |
| Size/mm | 0.315–0.63 | 0.63–1.25 | 1.25–2.5 | 2.5–5 |
|---|---|---|---|---|
| Bulk density/g·cm-3 | 1.166 | 1.133 | 1.124 | 1.128 |
| Types of CHPs | Mass Fraction/% |
|---|---|
| A | 0 |
| B | 0.5966 |
| C | 1.2968 |
| D | 1.7748 |
© 2020 by the authors. Licensee MDPI, Basel, Switzerland. This article is an open access article distributed under the terms and conditions of the Creative Commons Attribution (CC BY) license (http://creativecommons.org/licenses/by/4.0/).
Share and Cite
Wang, X.; Li, W.; Jiang, Z. Preparation and Characterization of Self-Healing Mortar Based on “Build-In” Carbonation. Materials 2020, 13, 644. https://doi.org/10.3390/ma13030644
Wang X, Li W, Jiang Z. Preparation and Characterization of Self-Healing Mortar Based on “Build-In” Carbonation. Materials. 2020; 13(3):644. https://doi.org/10.3390/ma13030644
Chicago/Turabian StyleWang, Xin, Wenting Li, and Zhengwu Jiang. 2020. "Preparation and Characterization of Self-Healing Mortar Based on “Build-In” Carbonation" Materials 13, no. 3: 644. https://doi.org/10.3390/ma13030644
APA StyleWang, X., Li, W., & Jiang, Z. (2020). Preparation and Characterization of Self-Healing Mortar Based on “Build-In” Carbonation. Materials, 13(3), 644. https://doi.org/10.3390/ma13030644