First Large Scale Application with Self-Healing Concrete in Belgium: Analysis of the Laboratory Control Tests


Abstract
1. Introduction
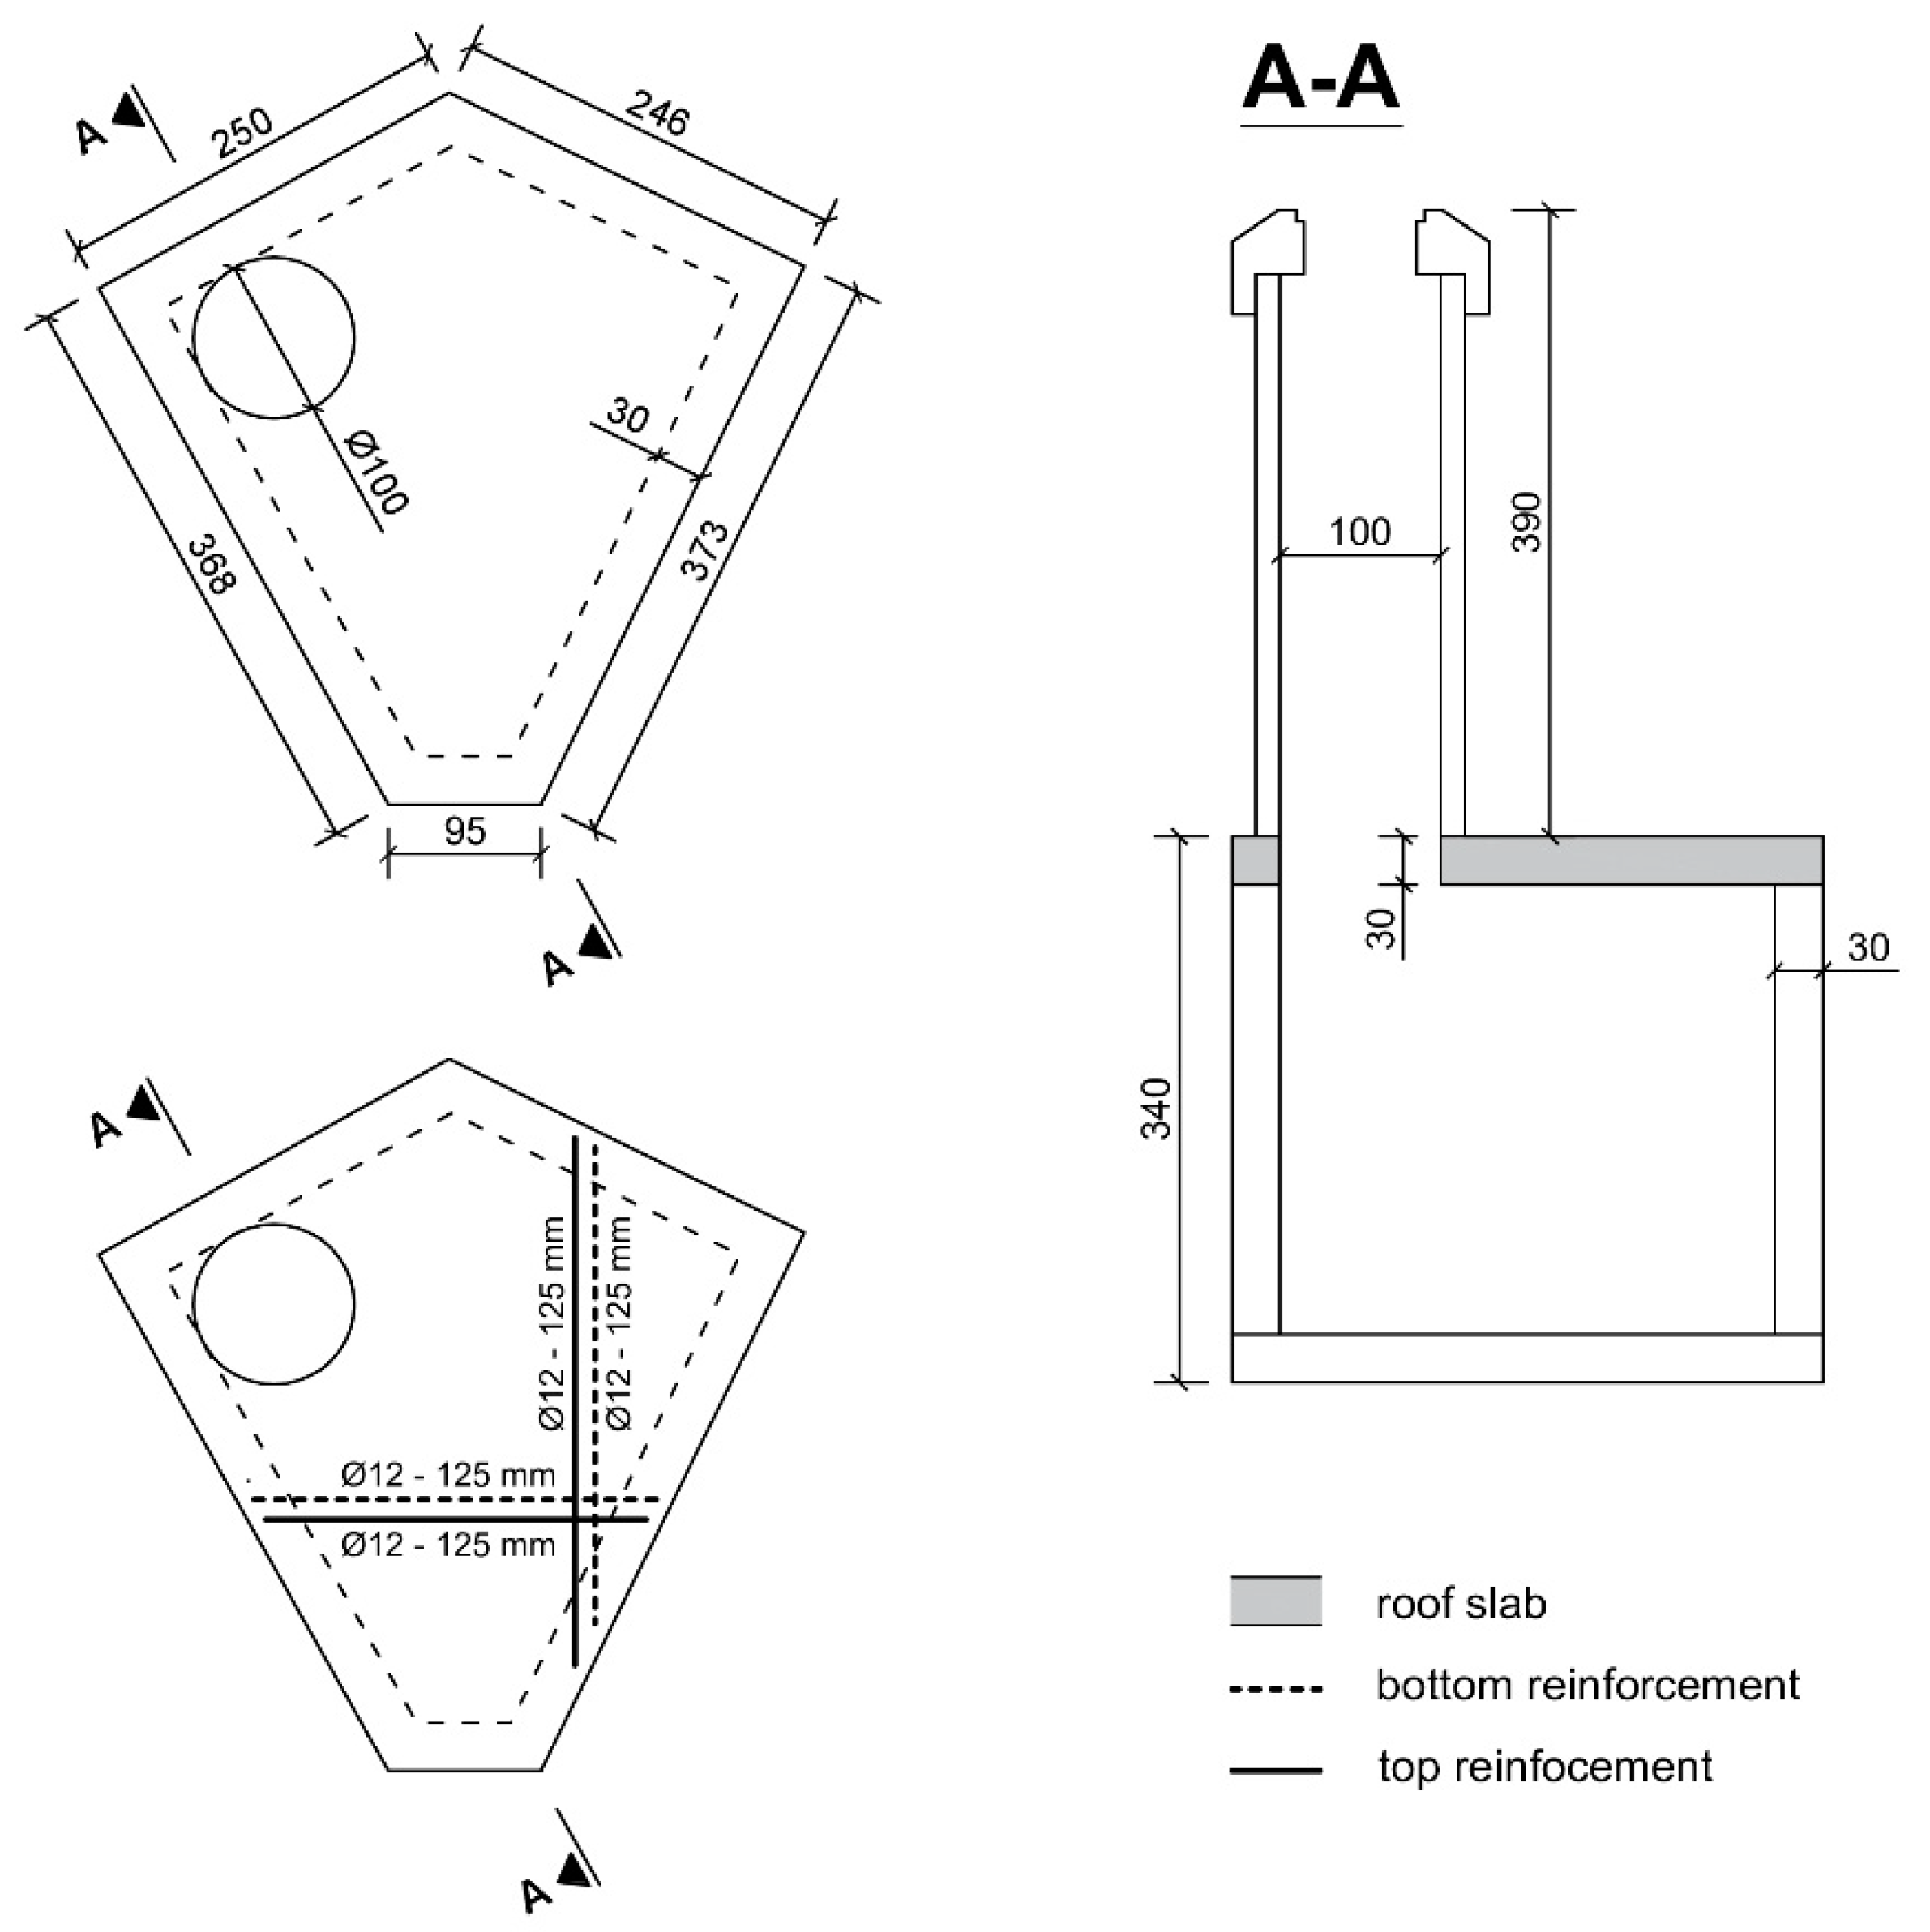
2. Trial Site
3. Materials and Methods
3.1. Bacterial Healing Agent
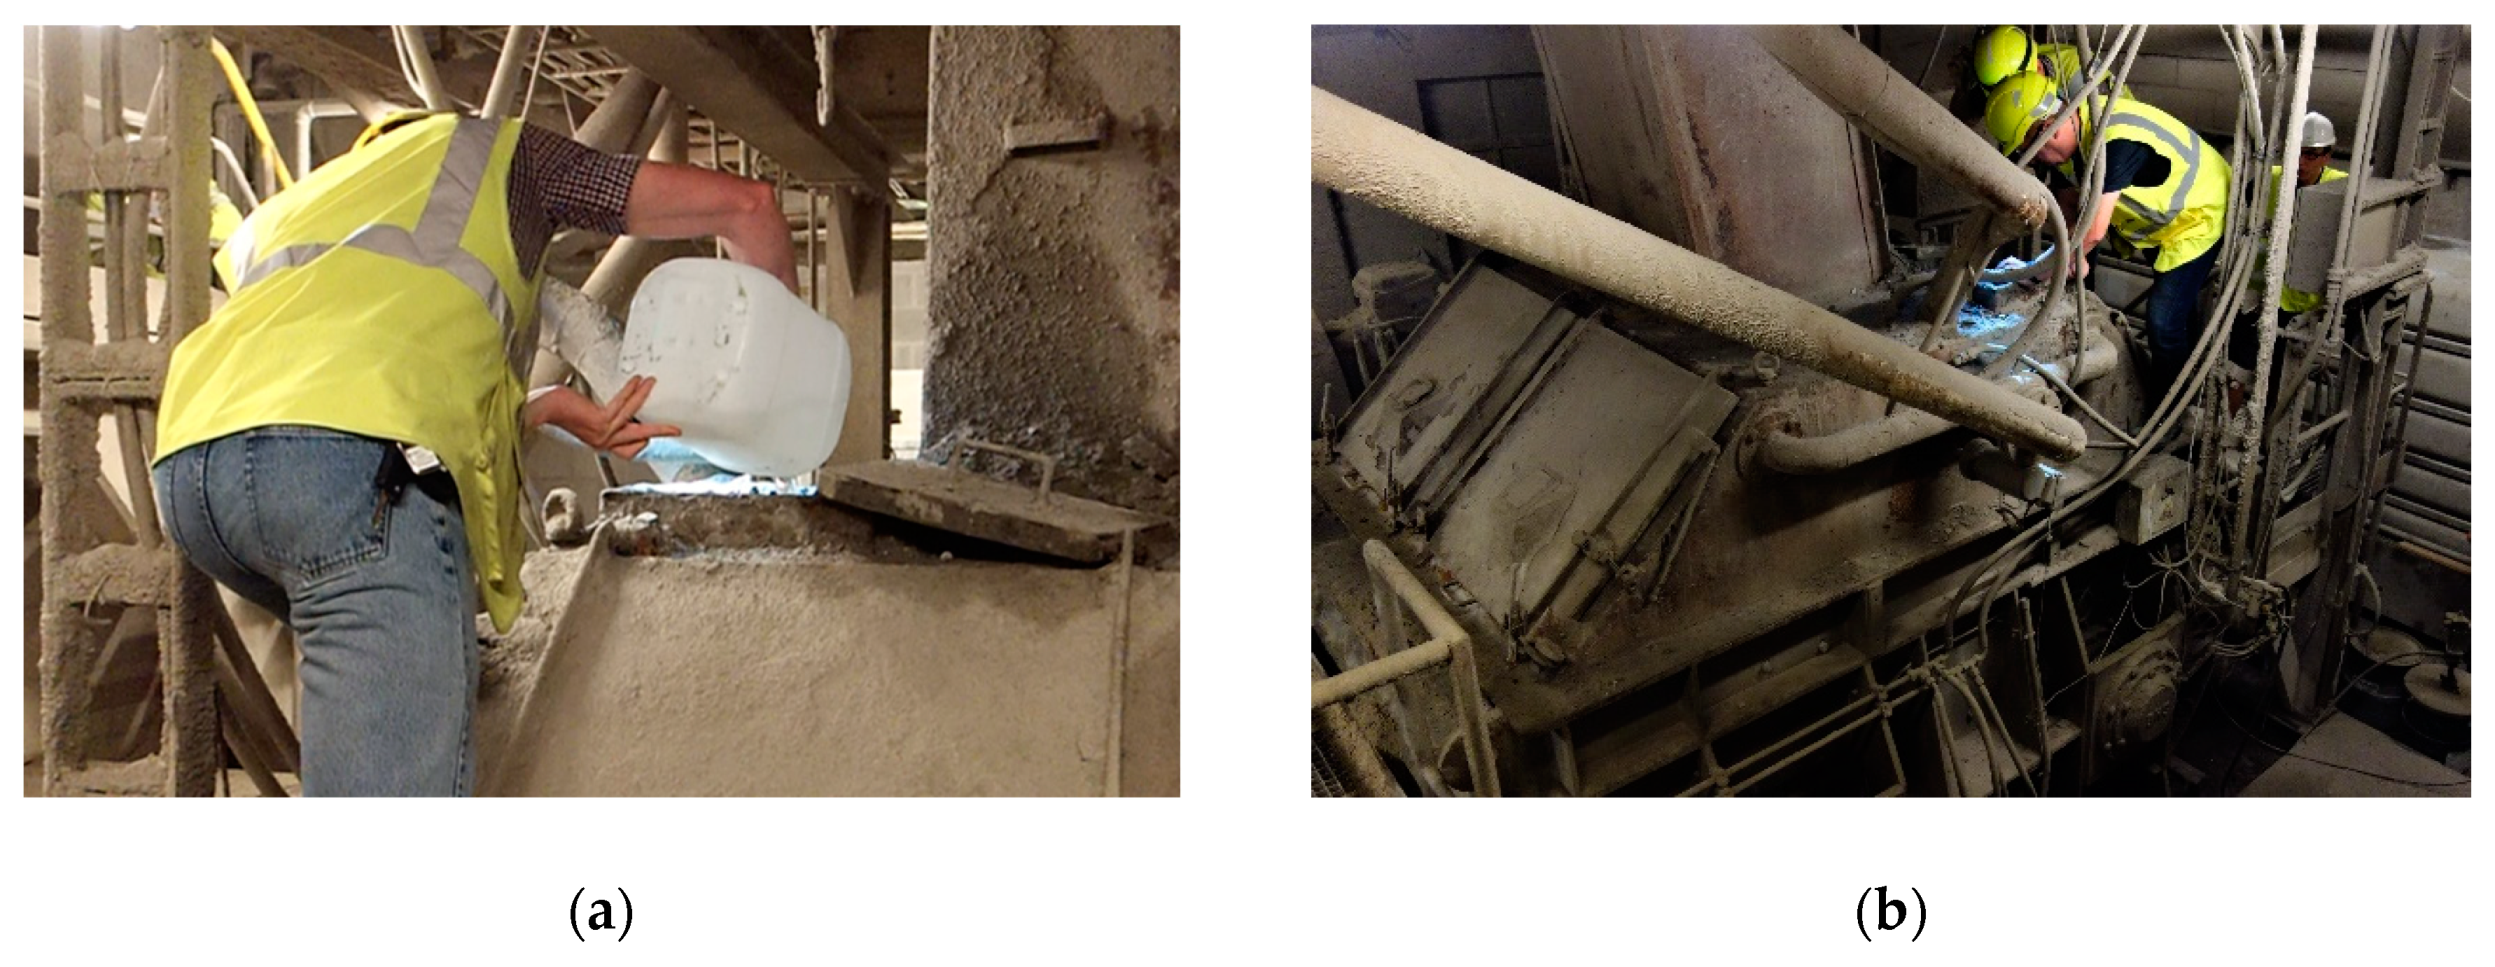
3.2. Concrete Composition and Casting
3.3. Laboratory Control Tests
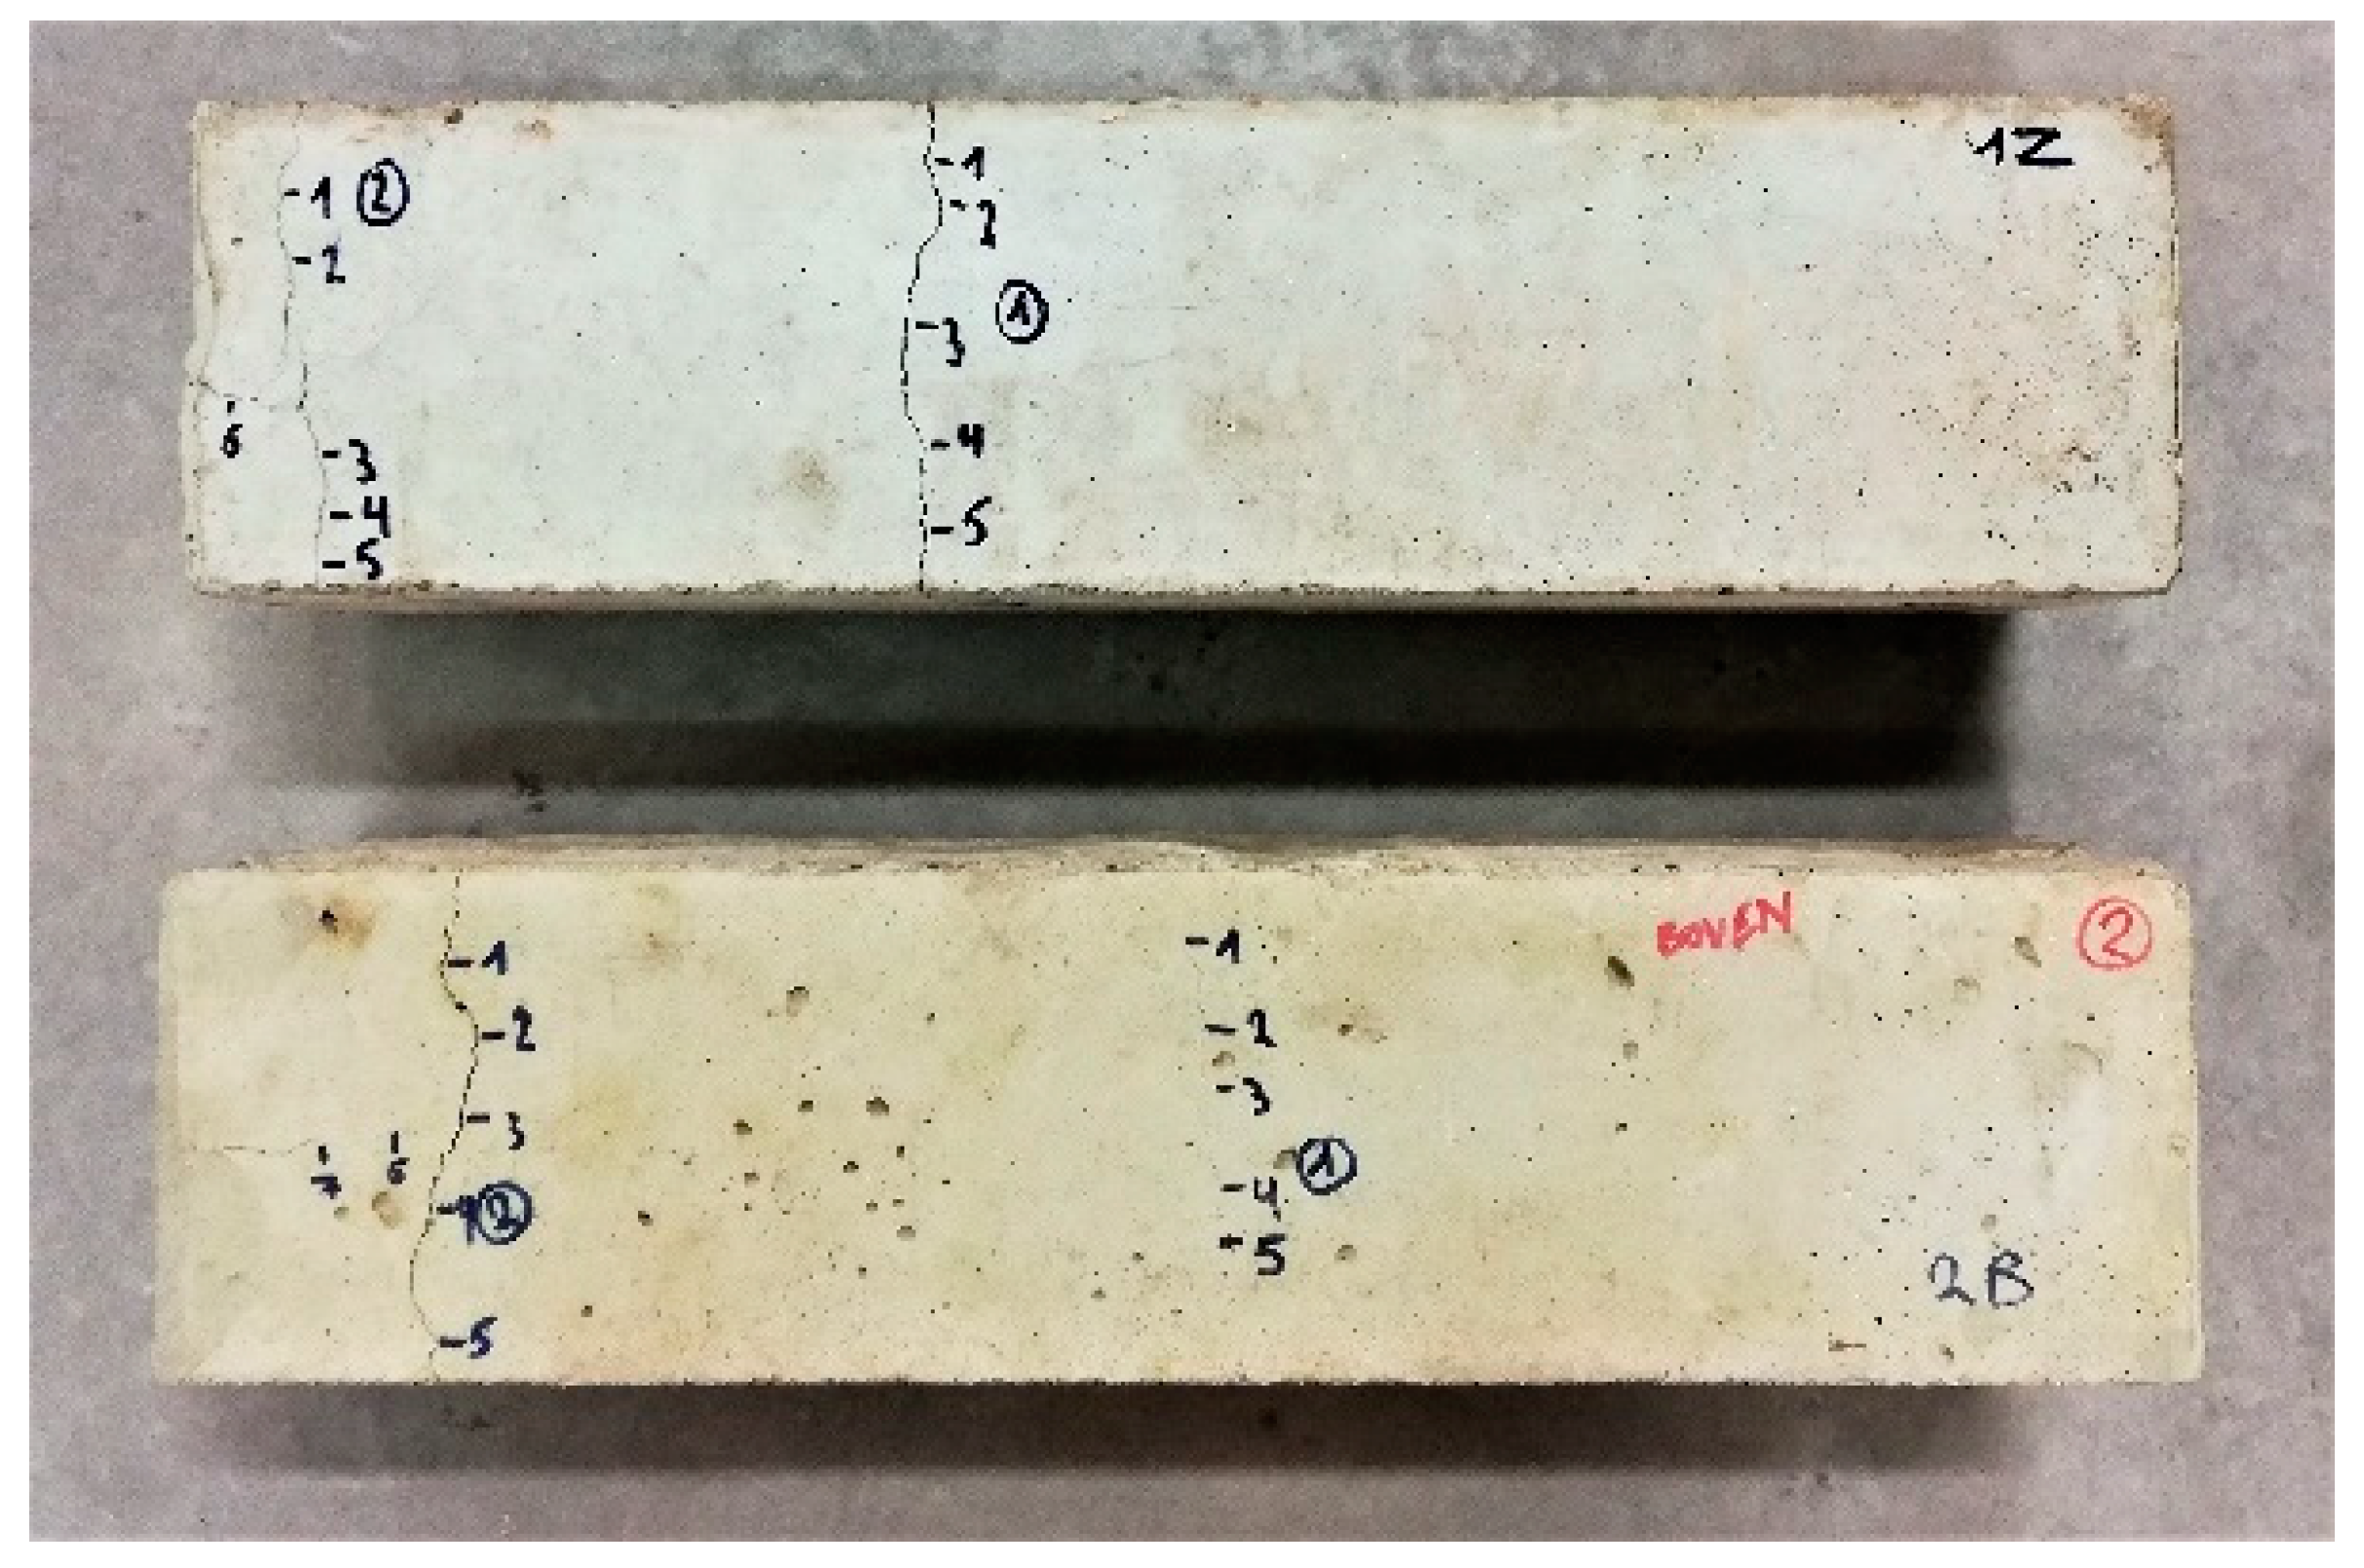
3.3.1. Visual Crack Healing
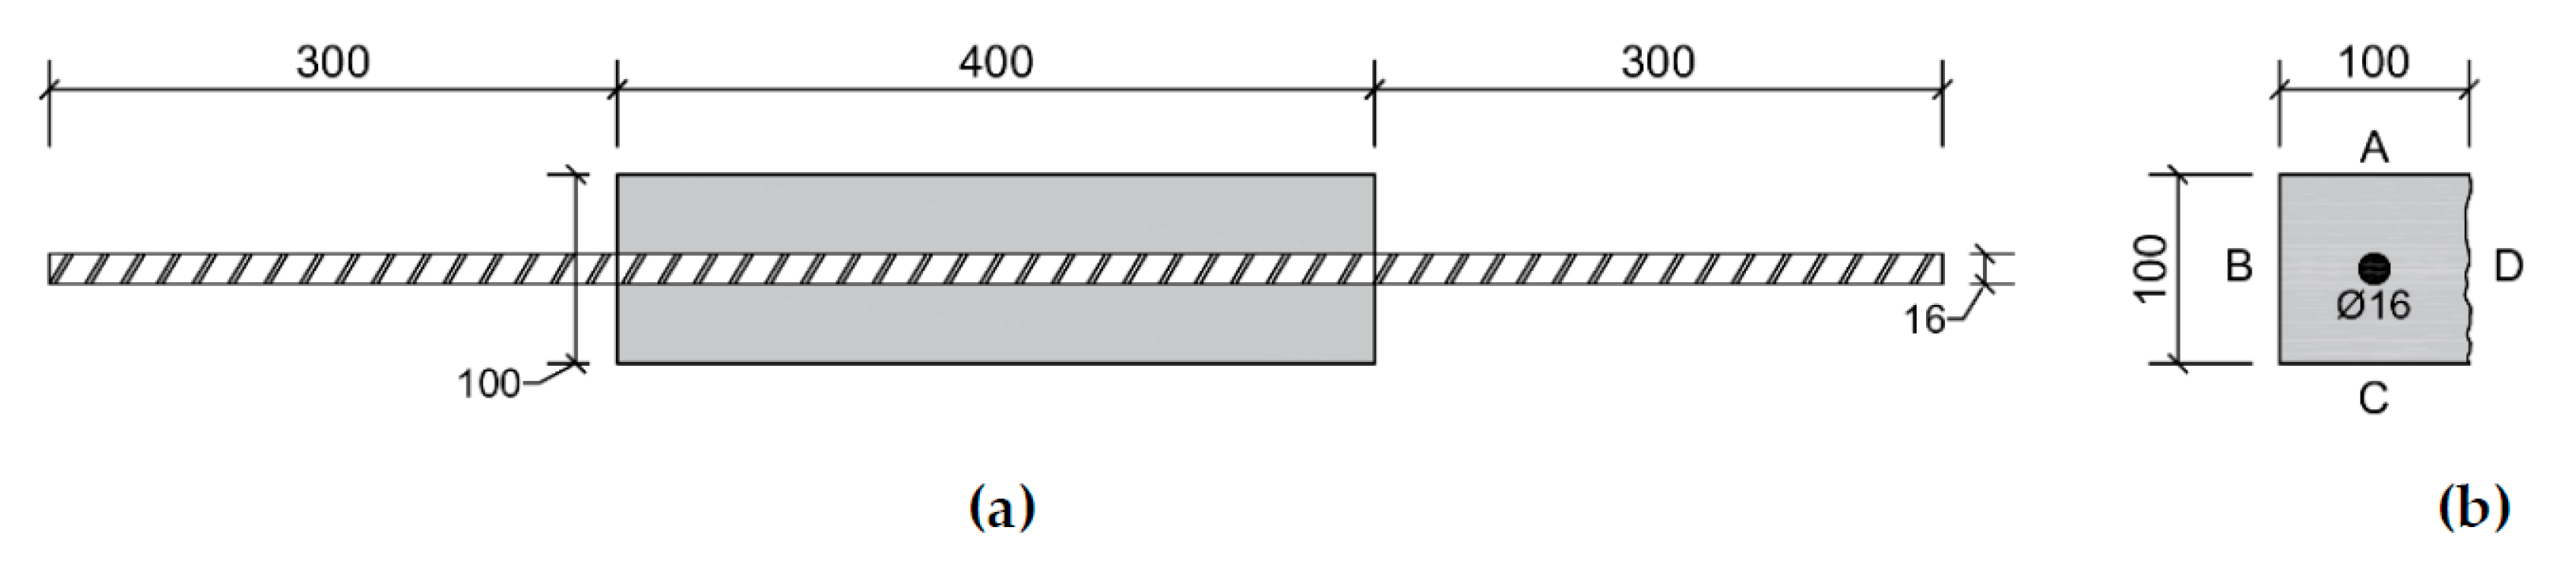
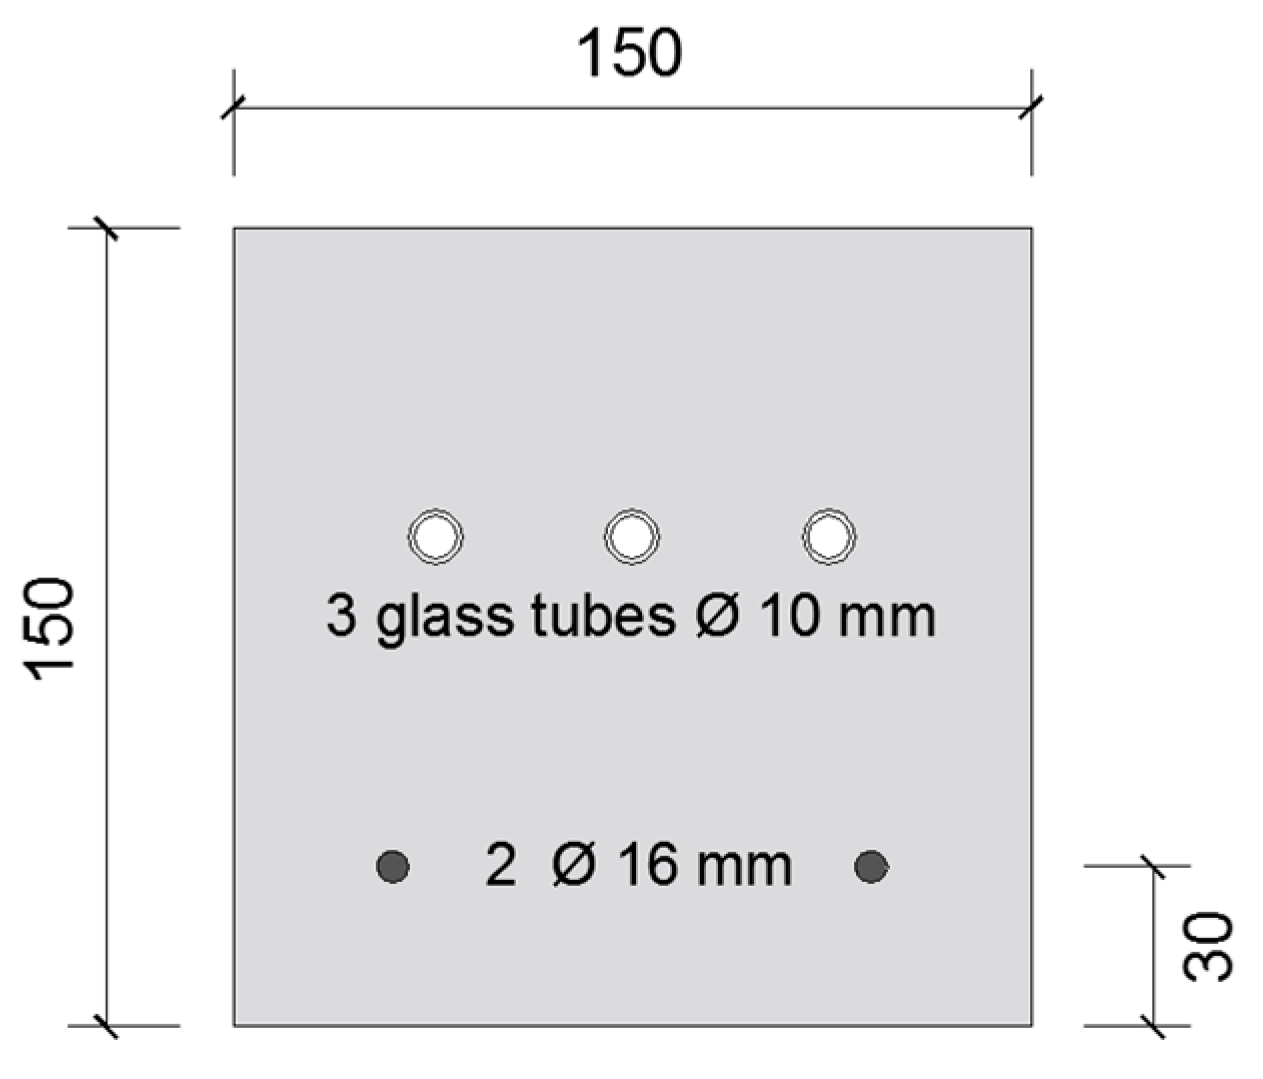
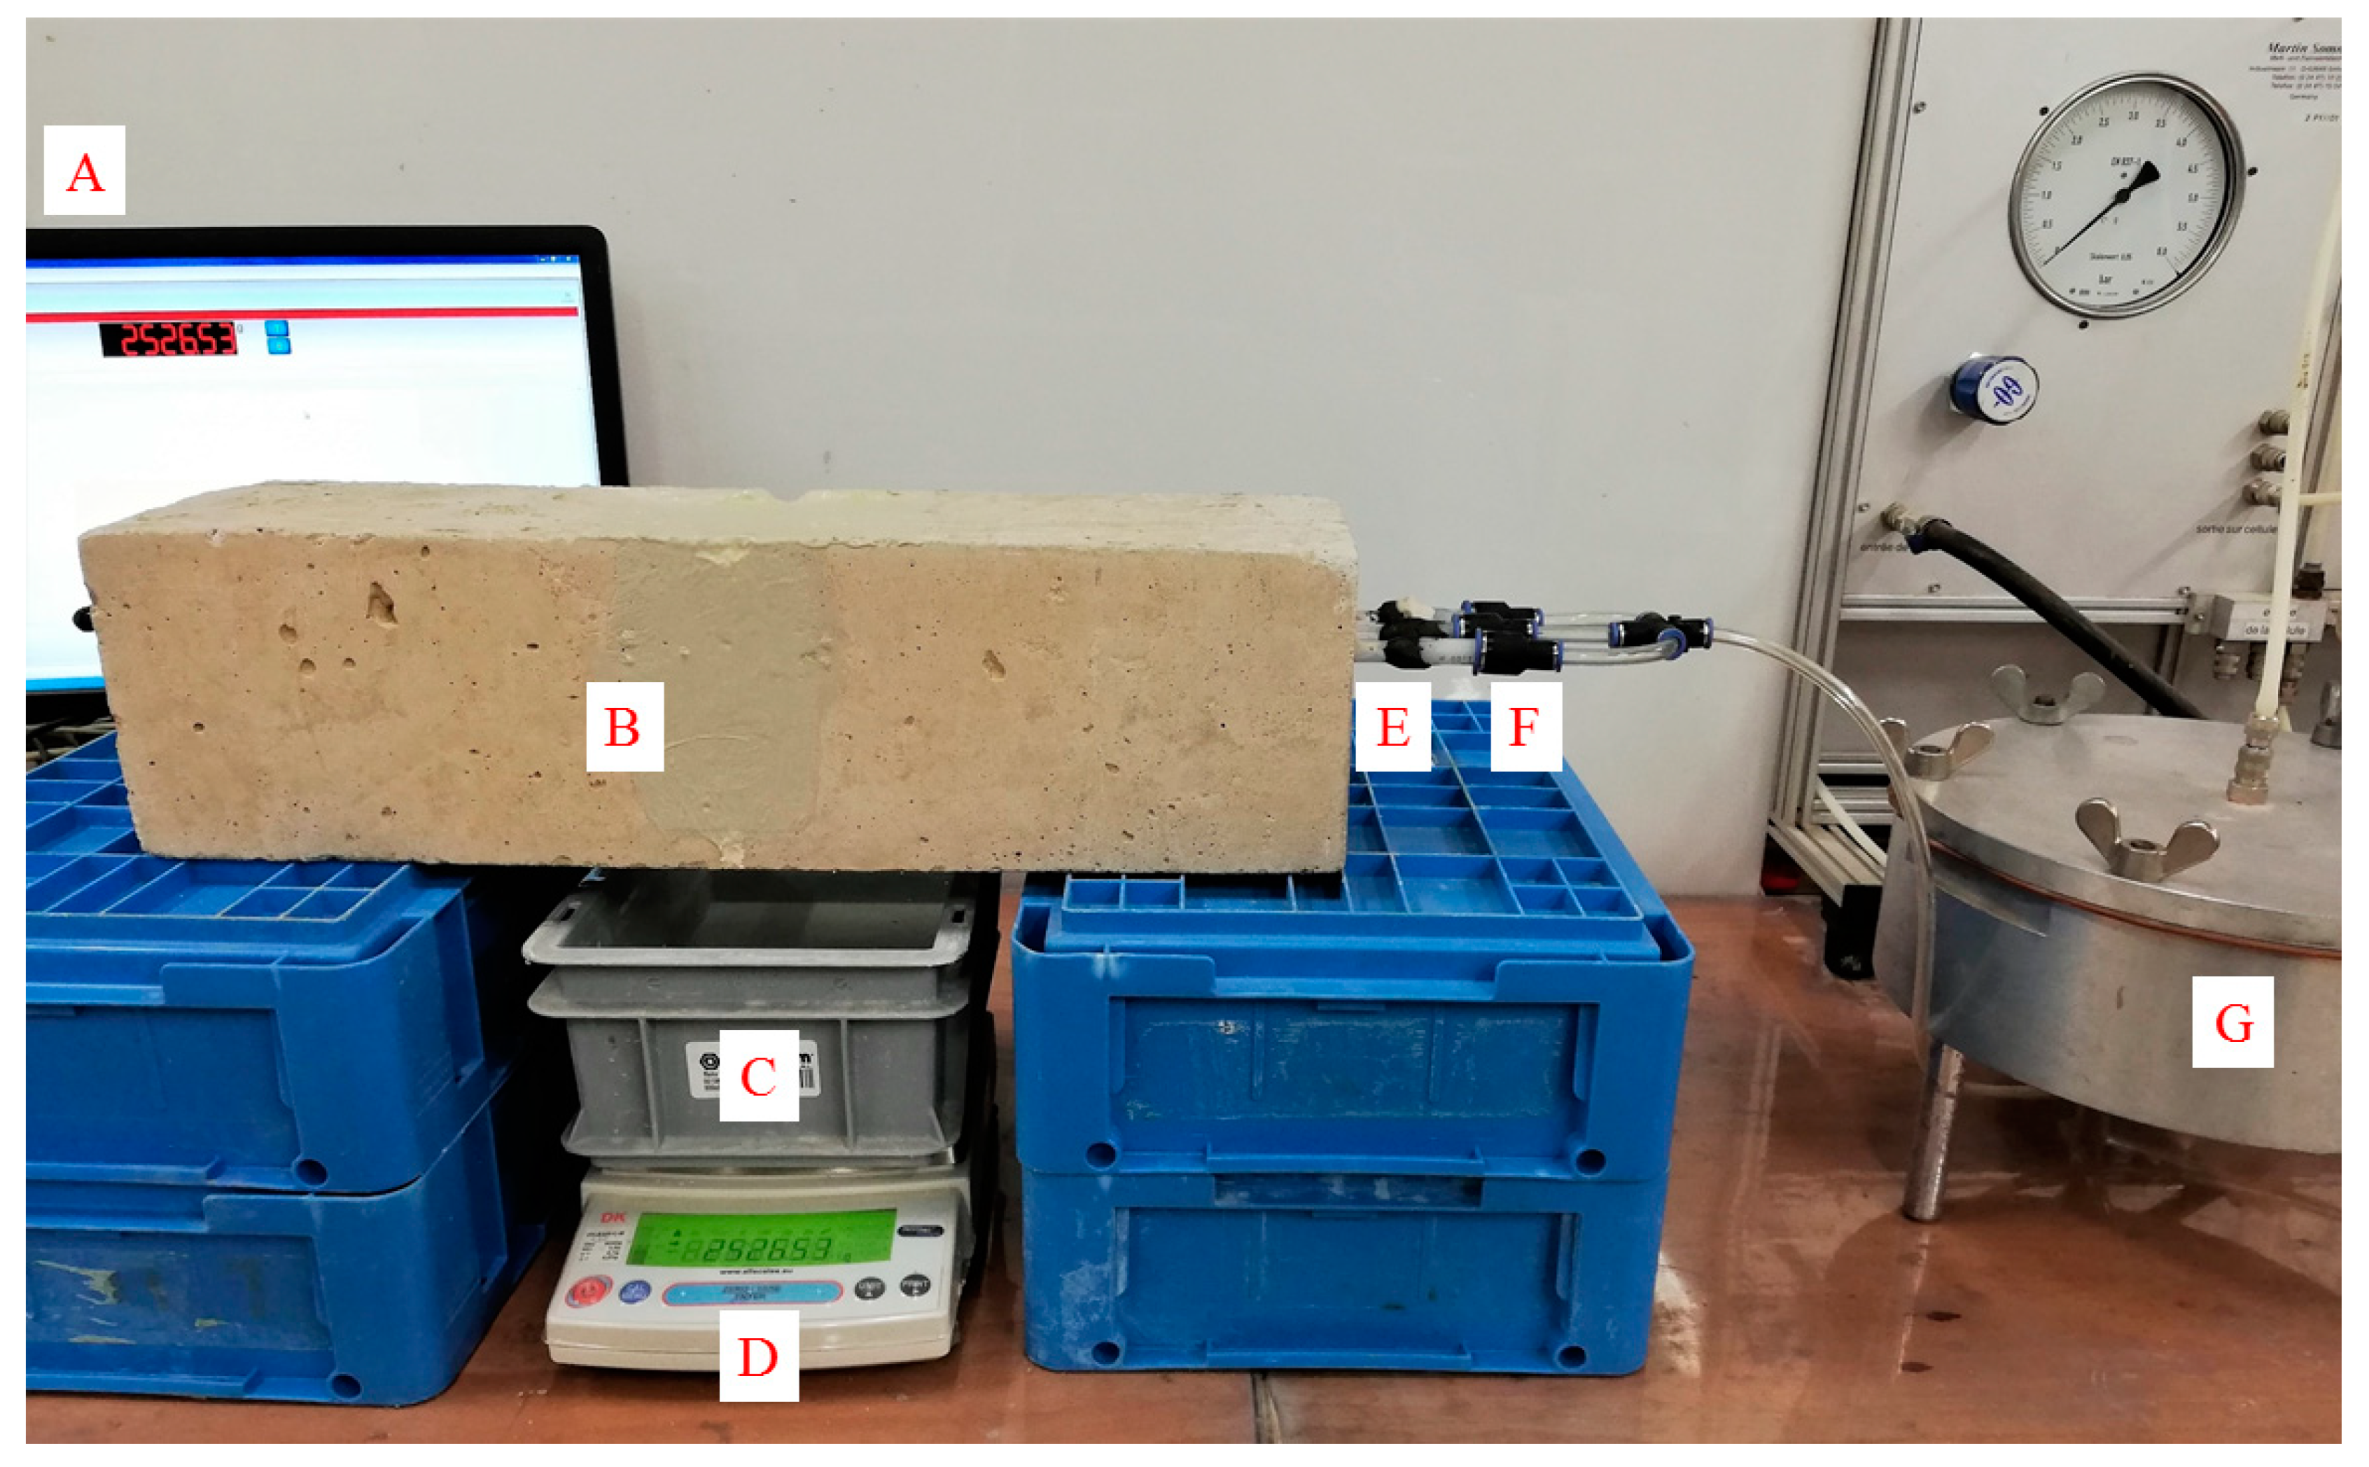
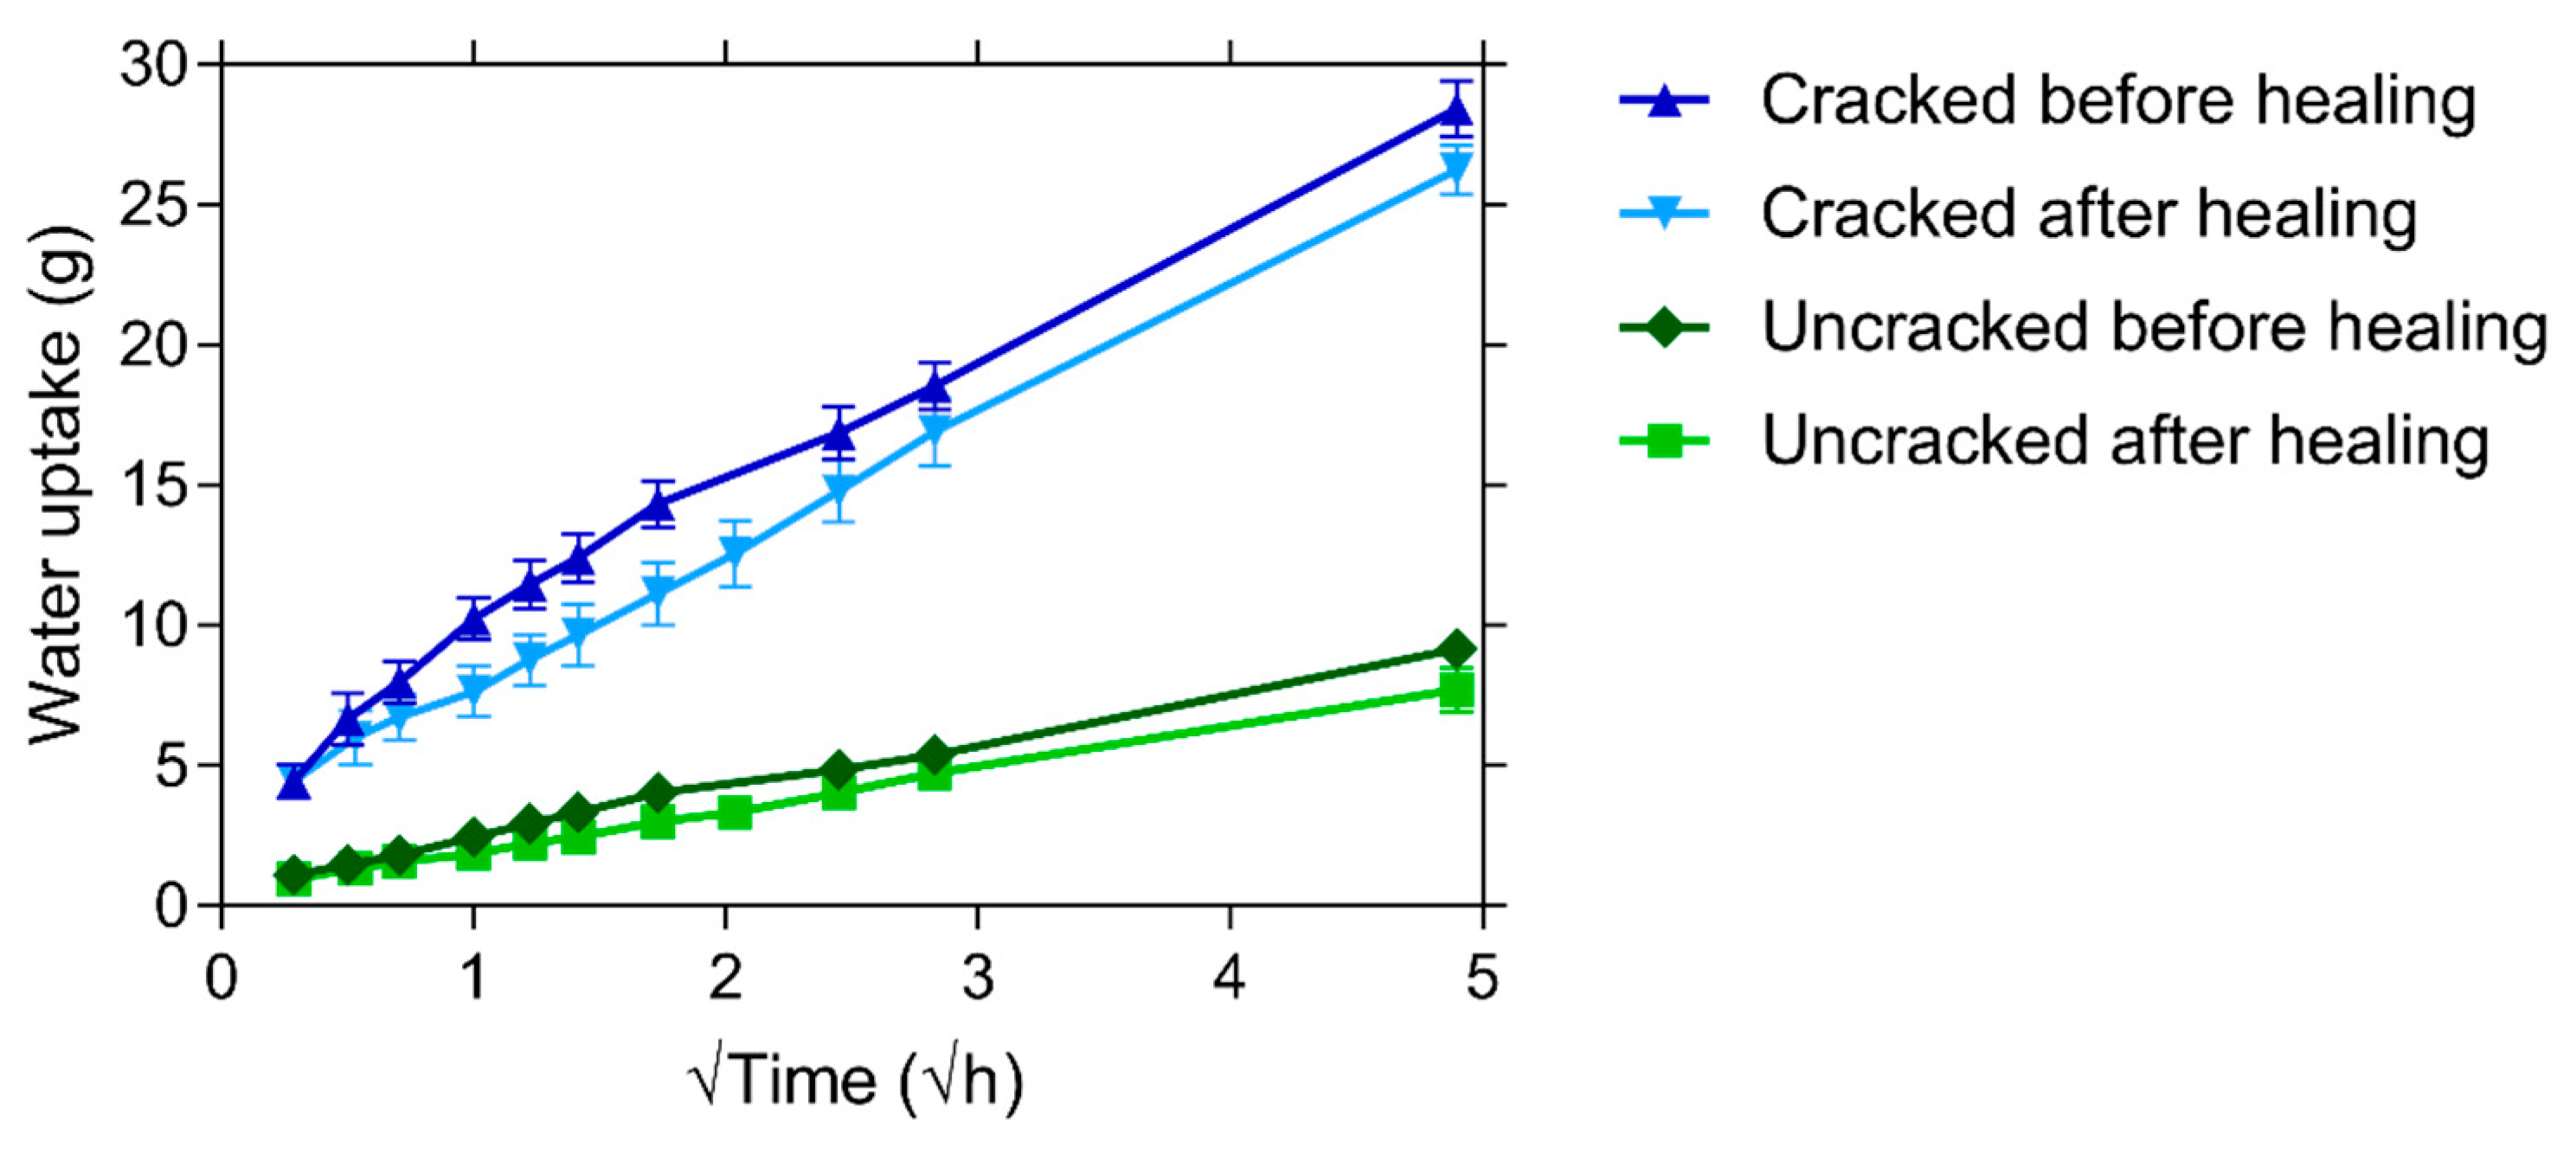
3.3.2. Capillary Water Absorption
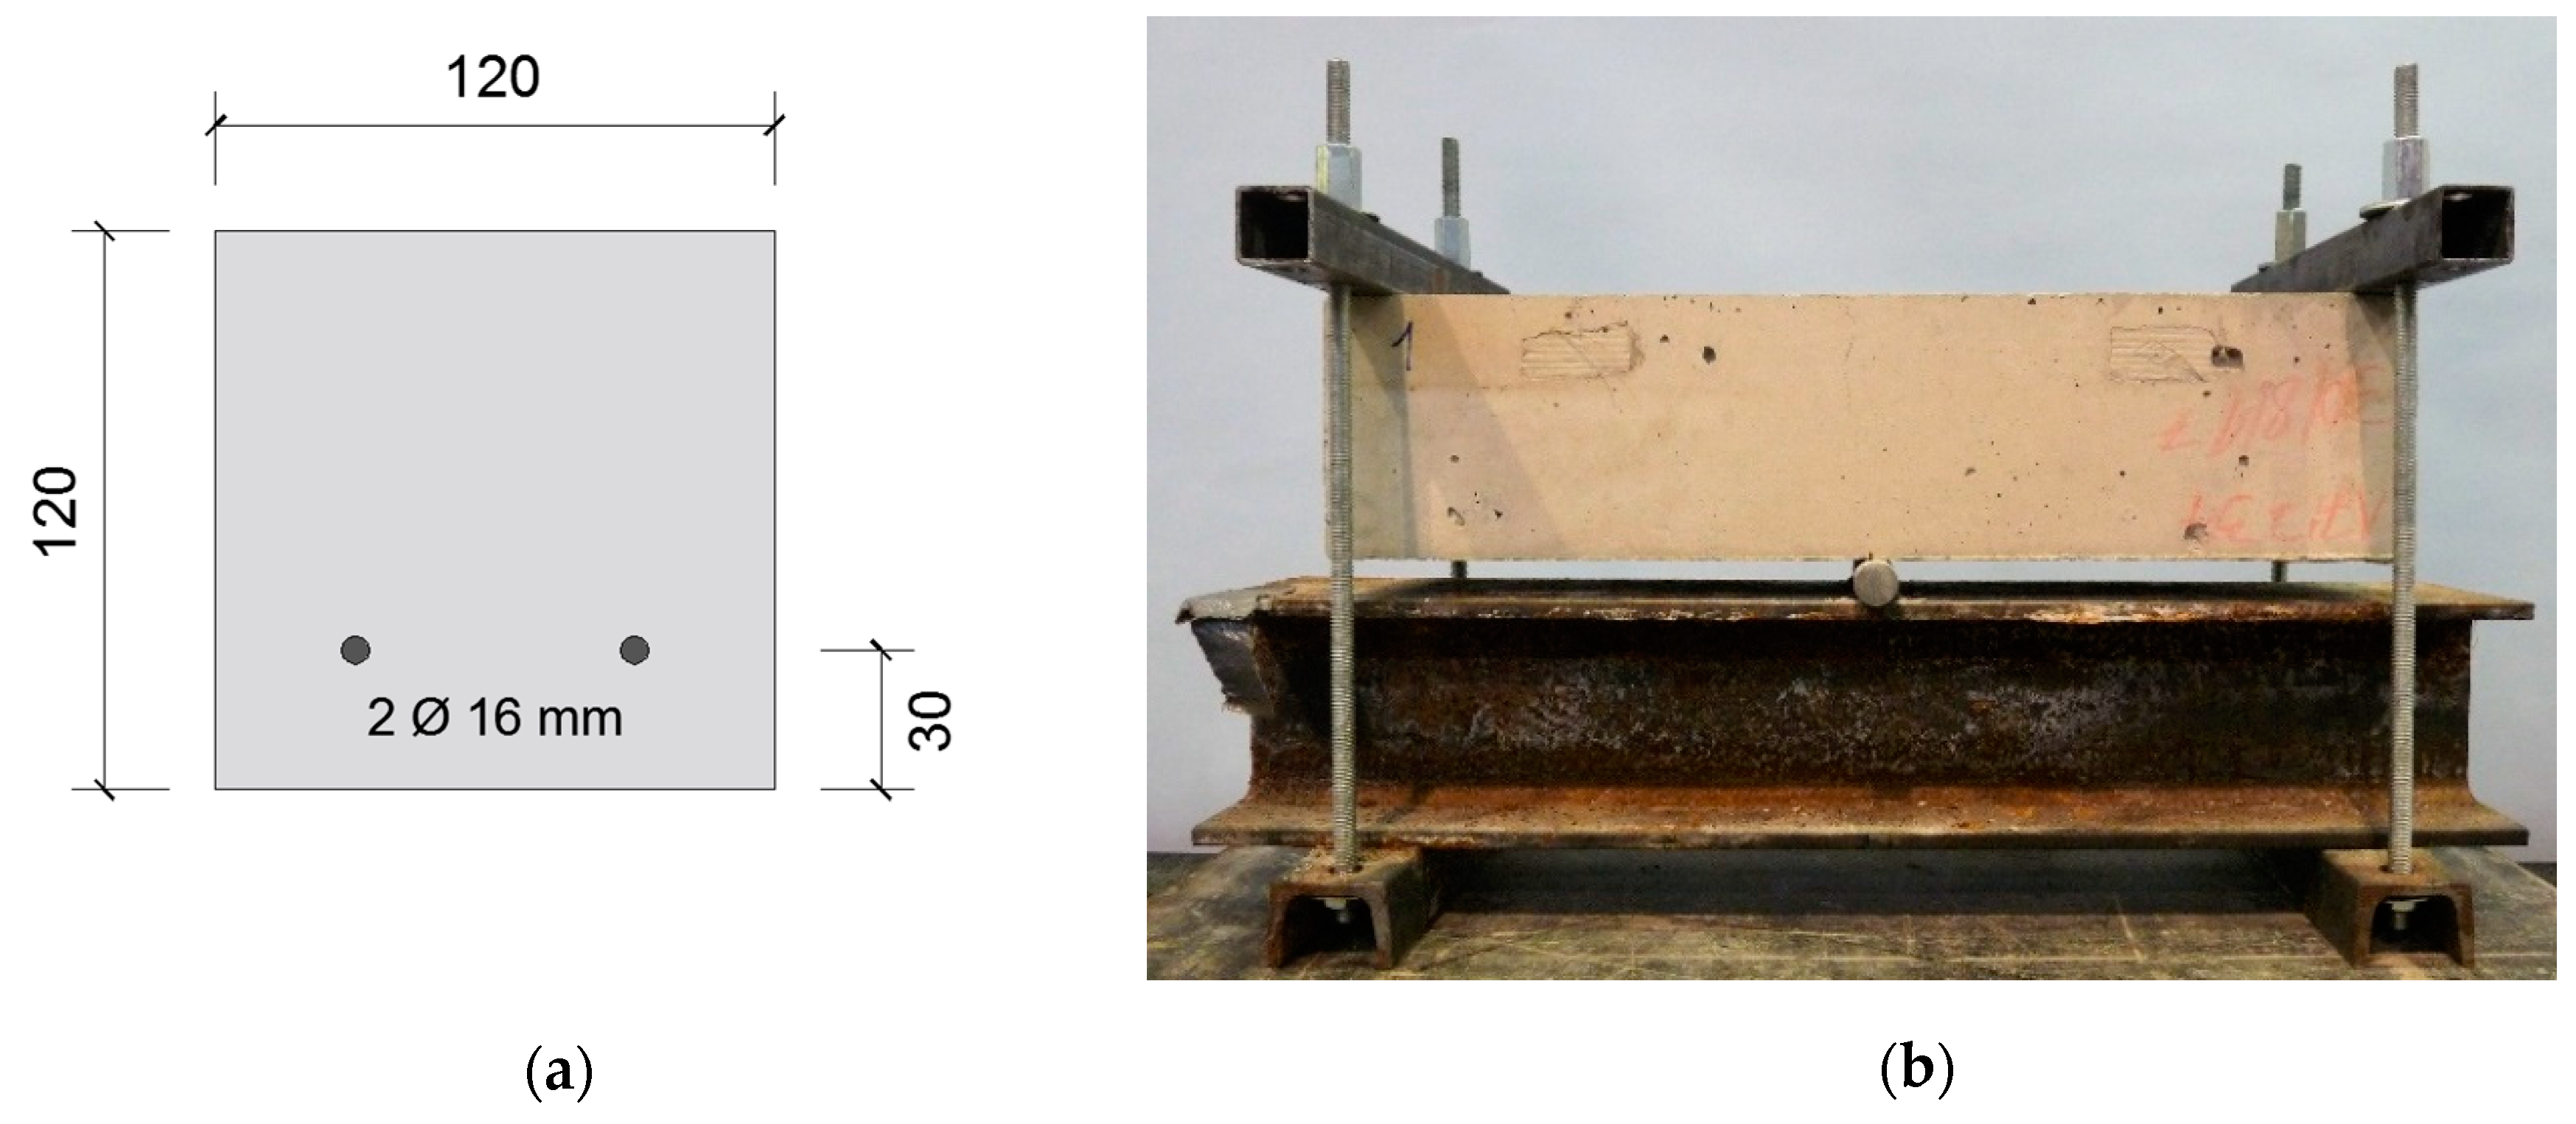
3.3.3. Water Permeability
4. Results and Discussion of Laboratory Control Tests
4.1. Compressive Strength and Modulus of Elasticity
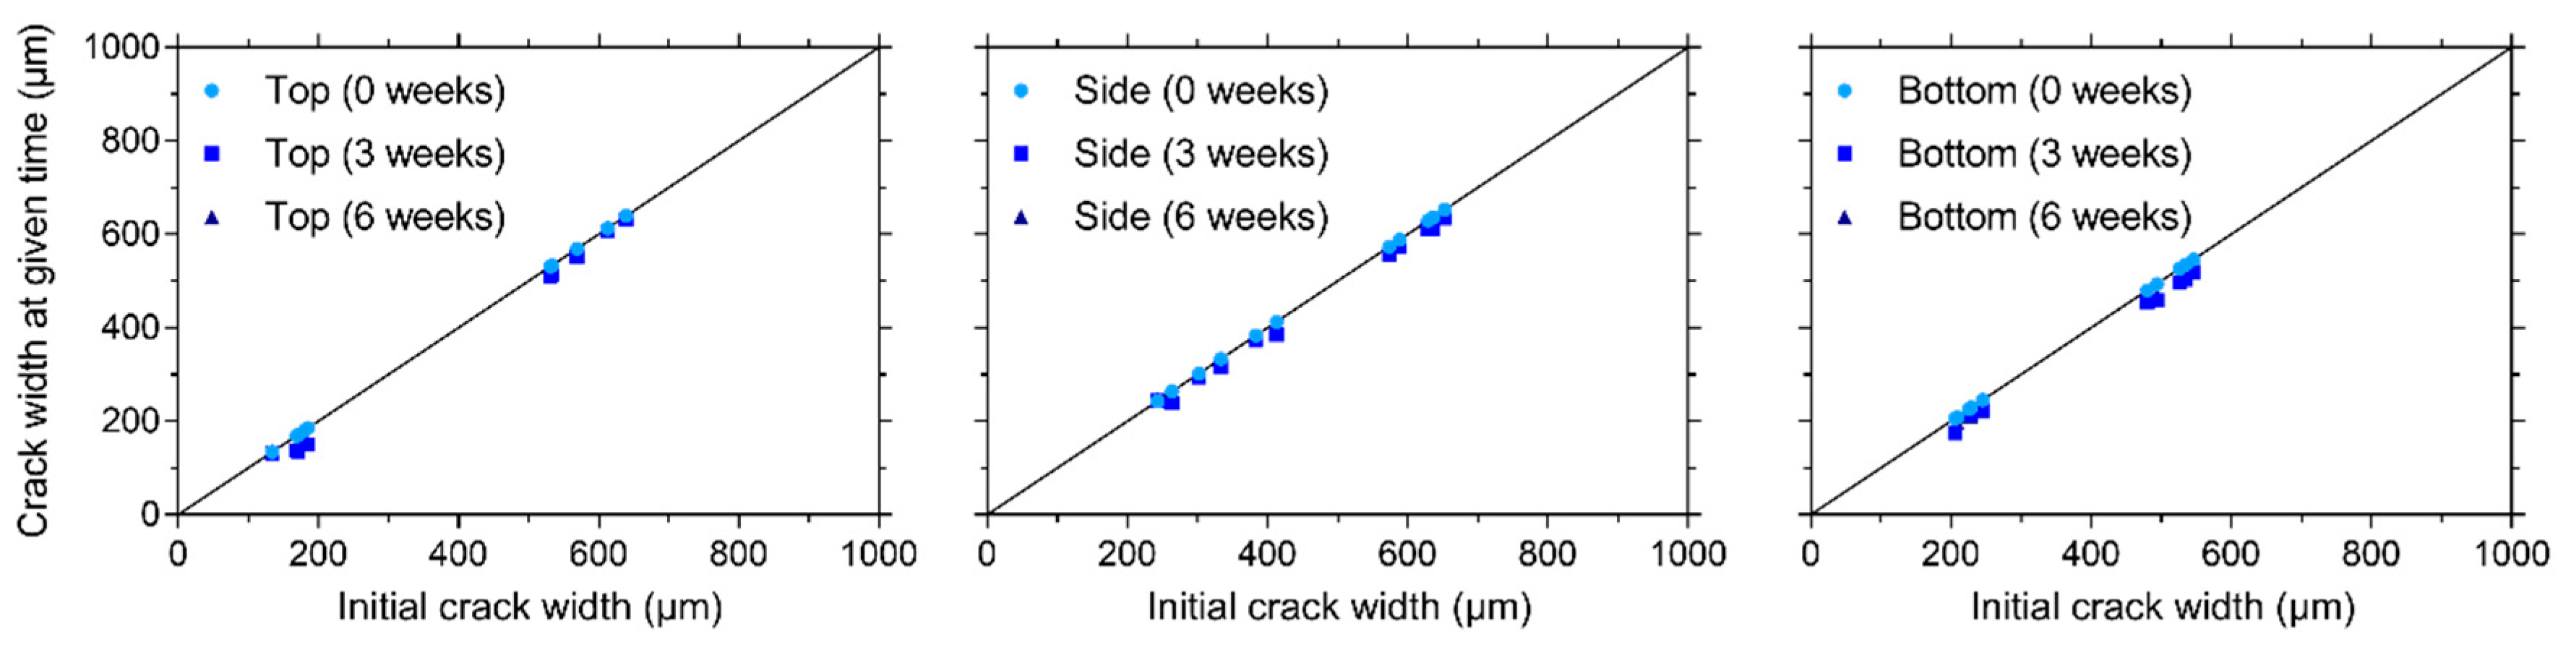
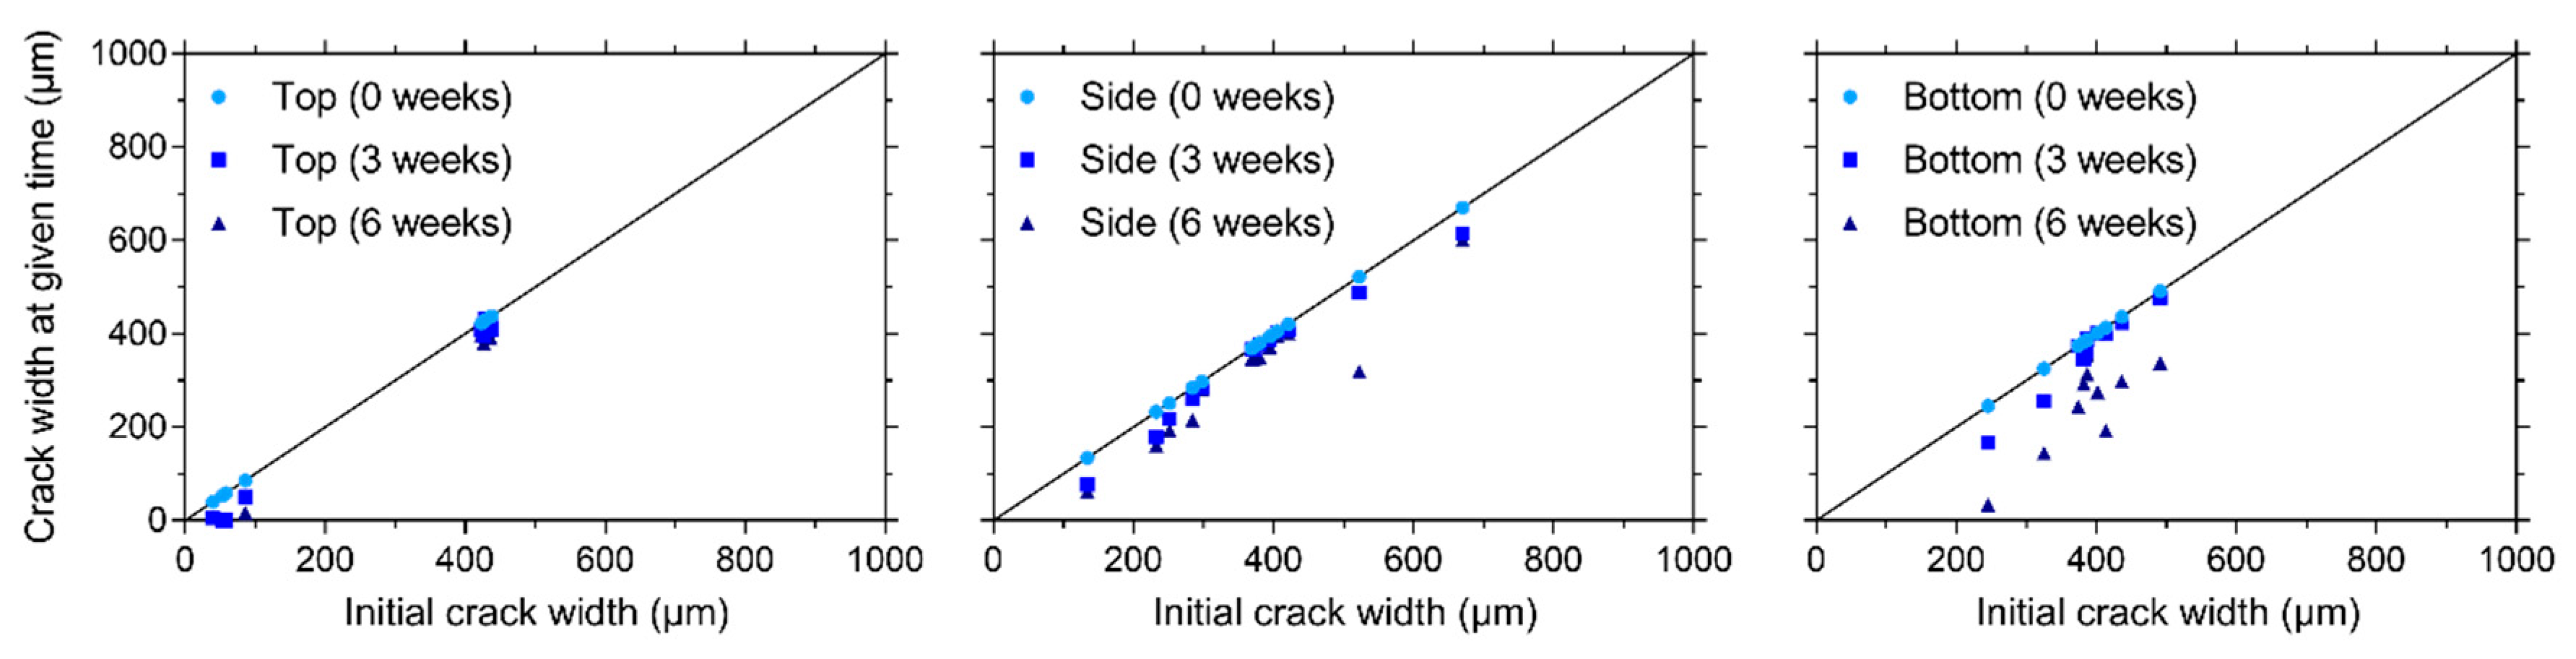
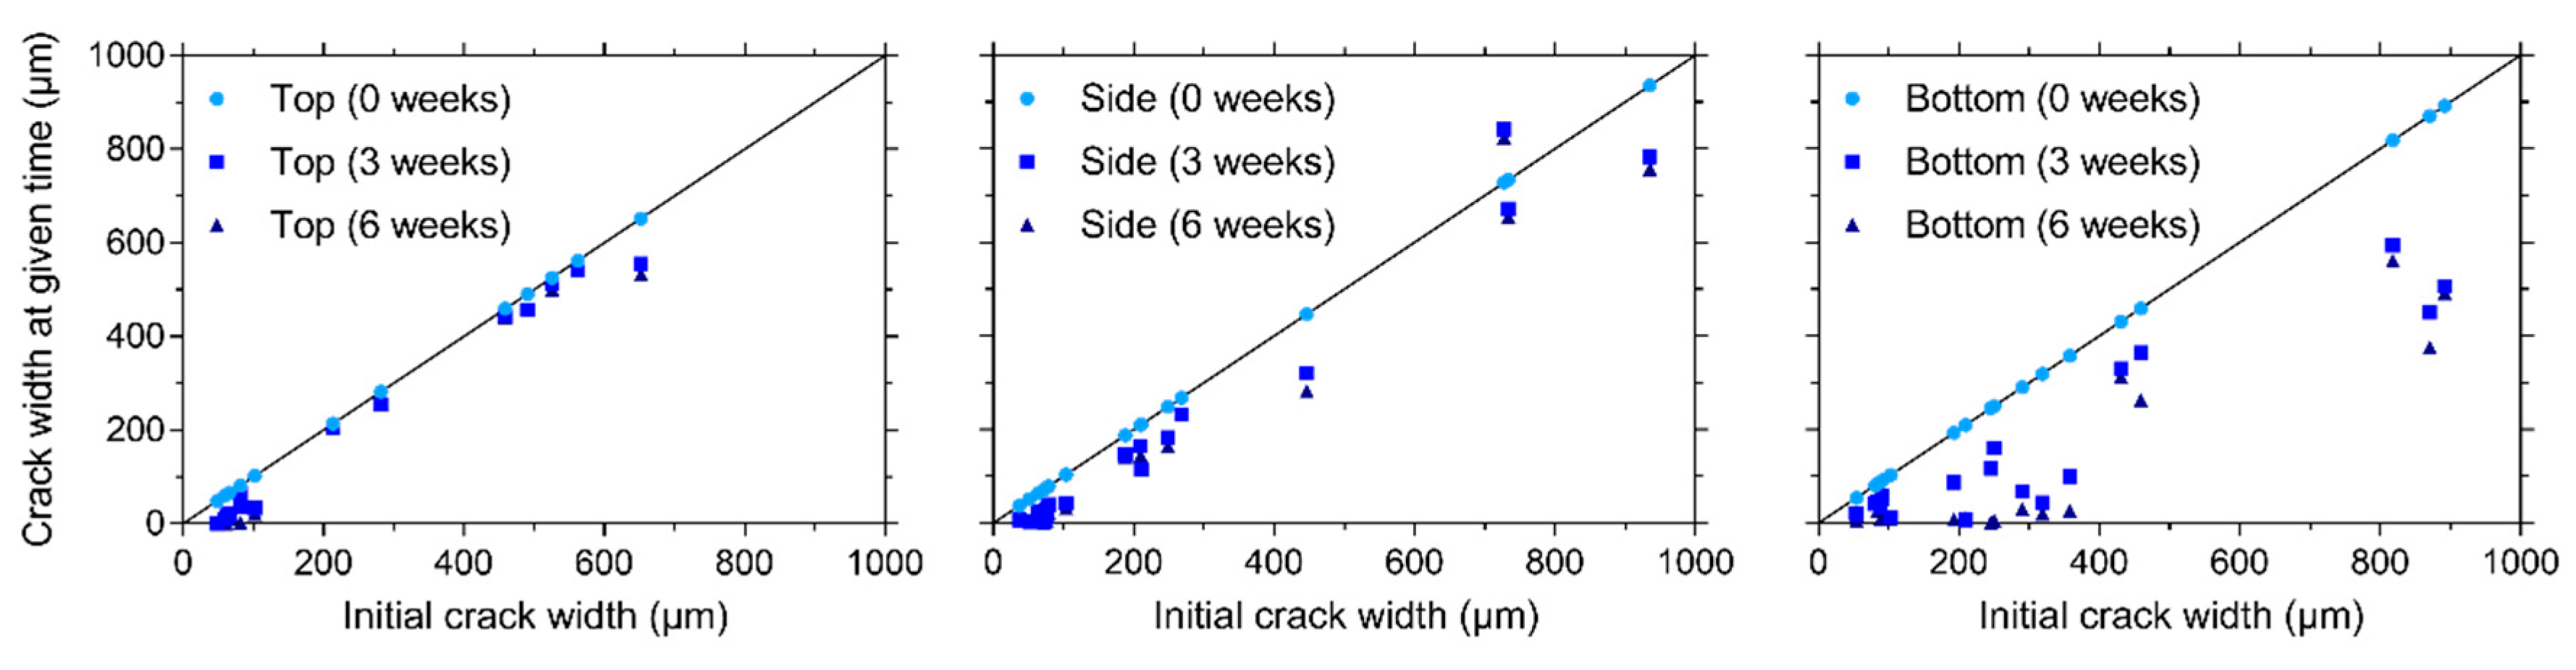
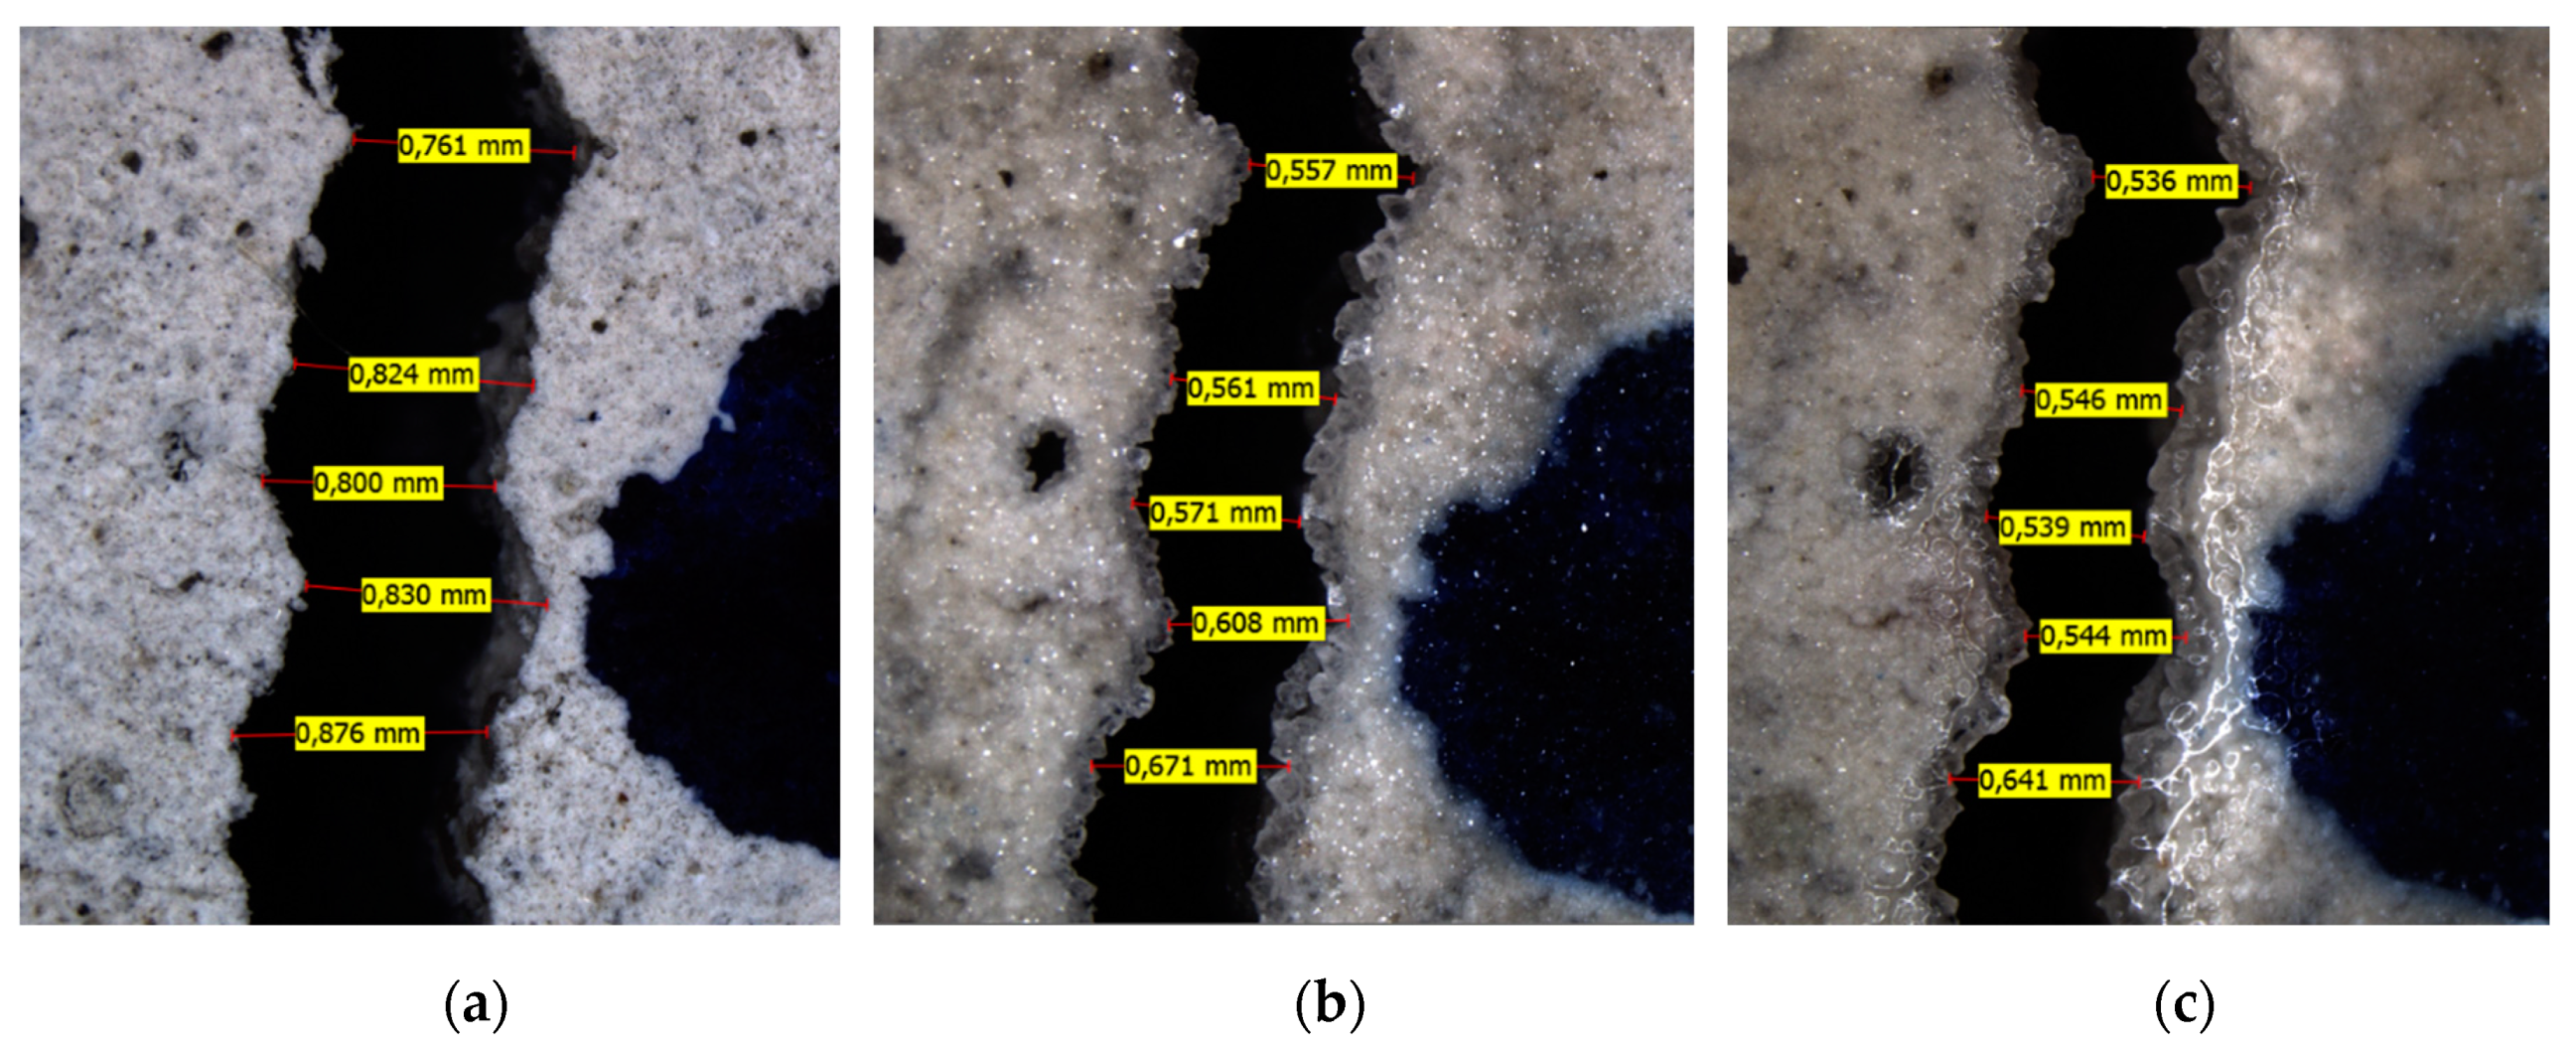
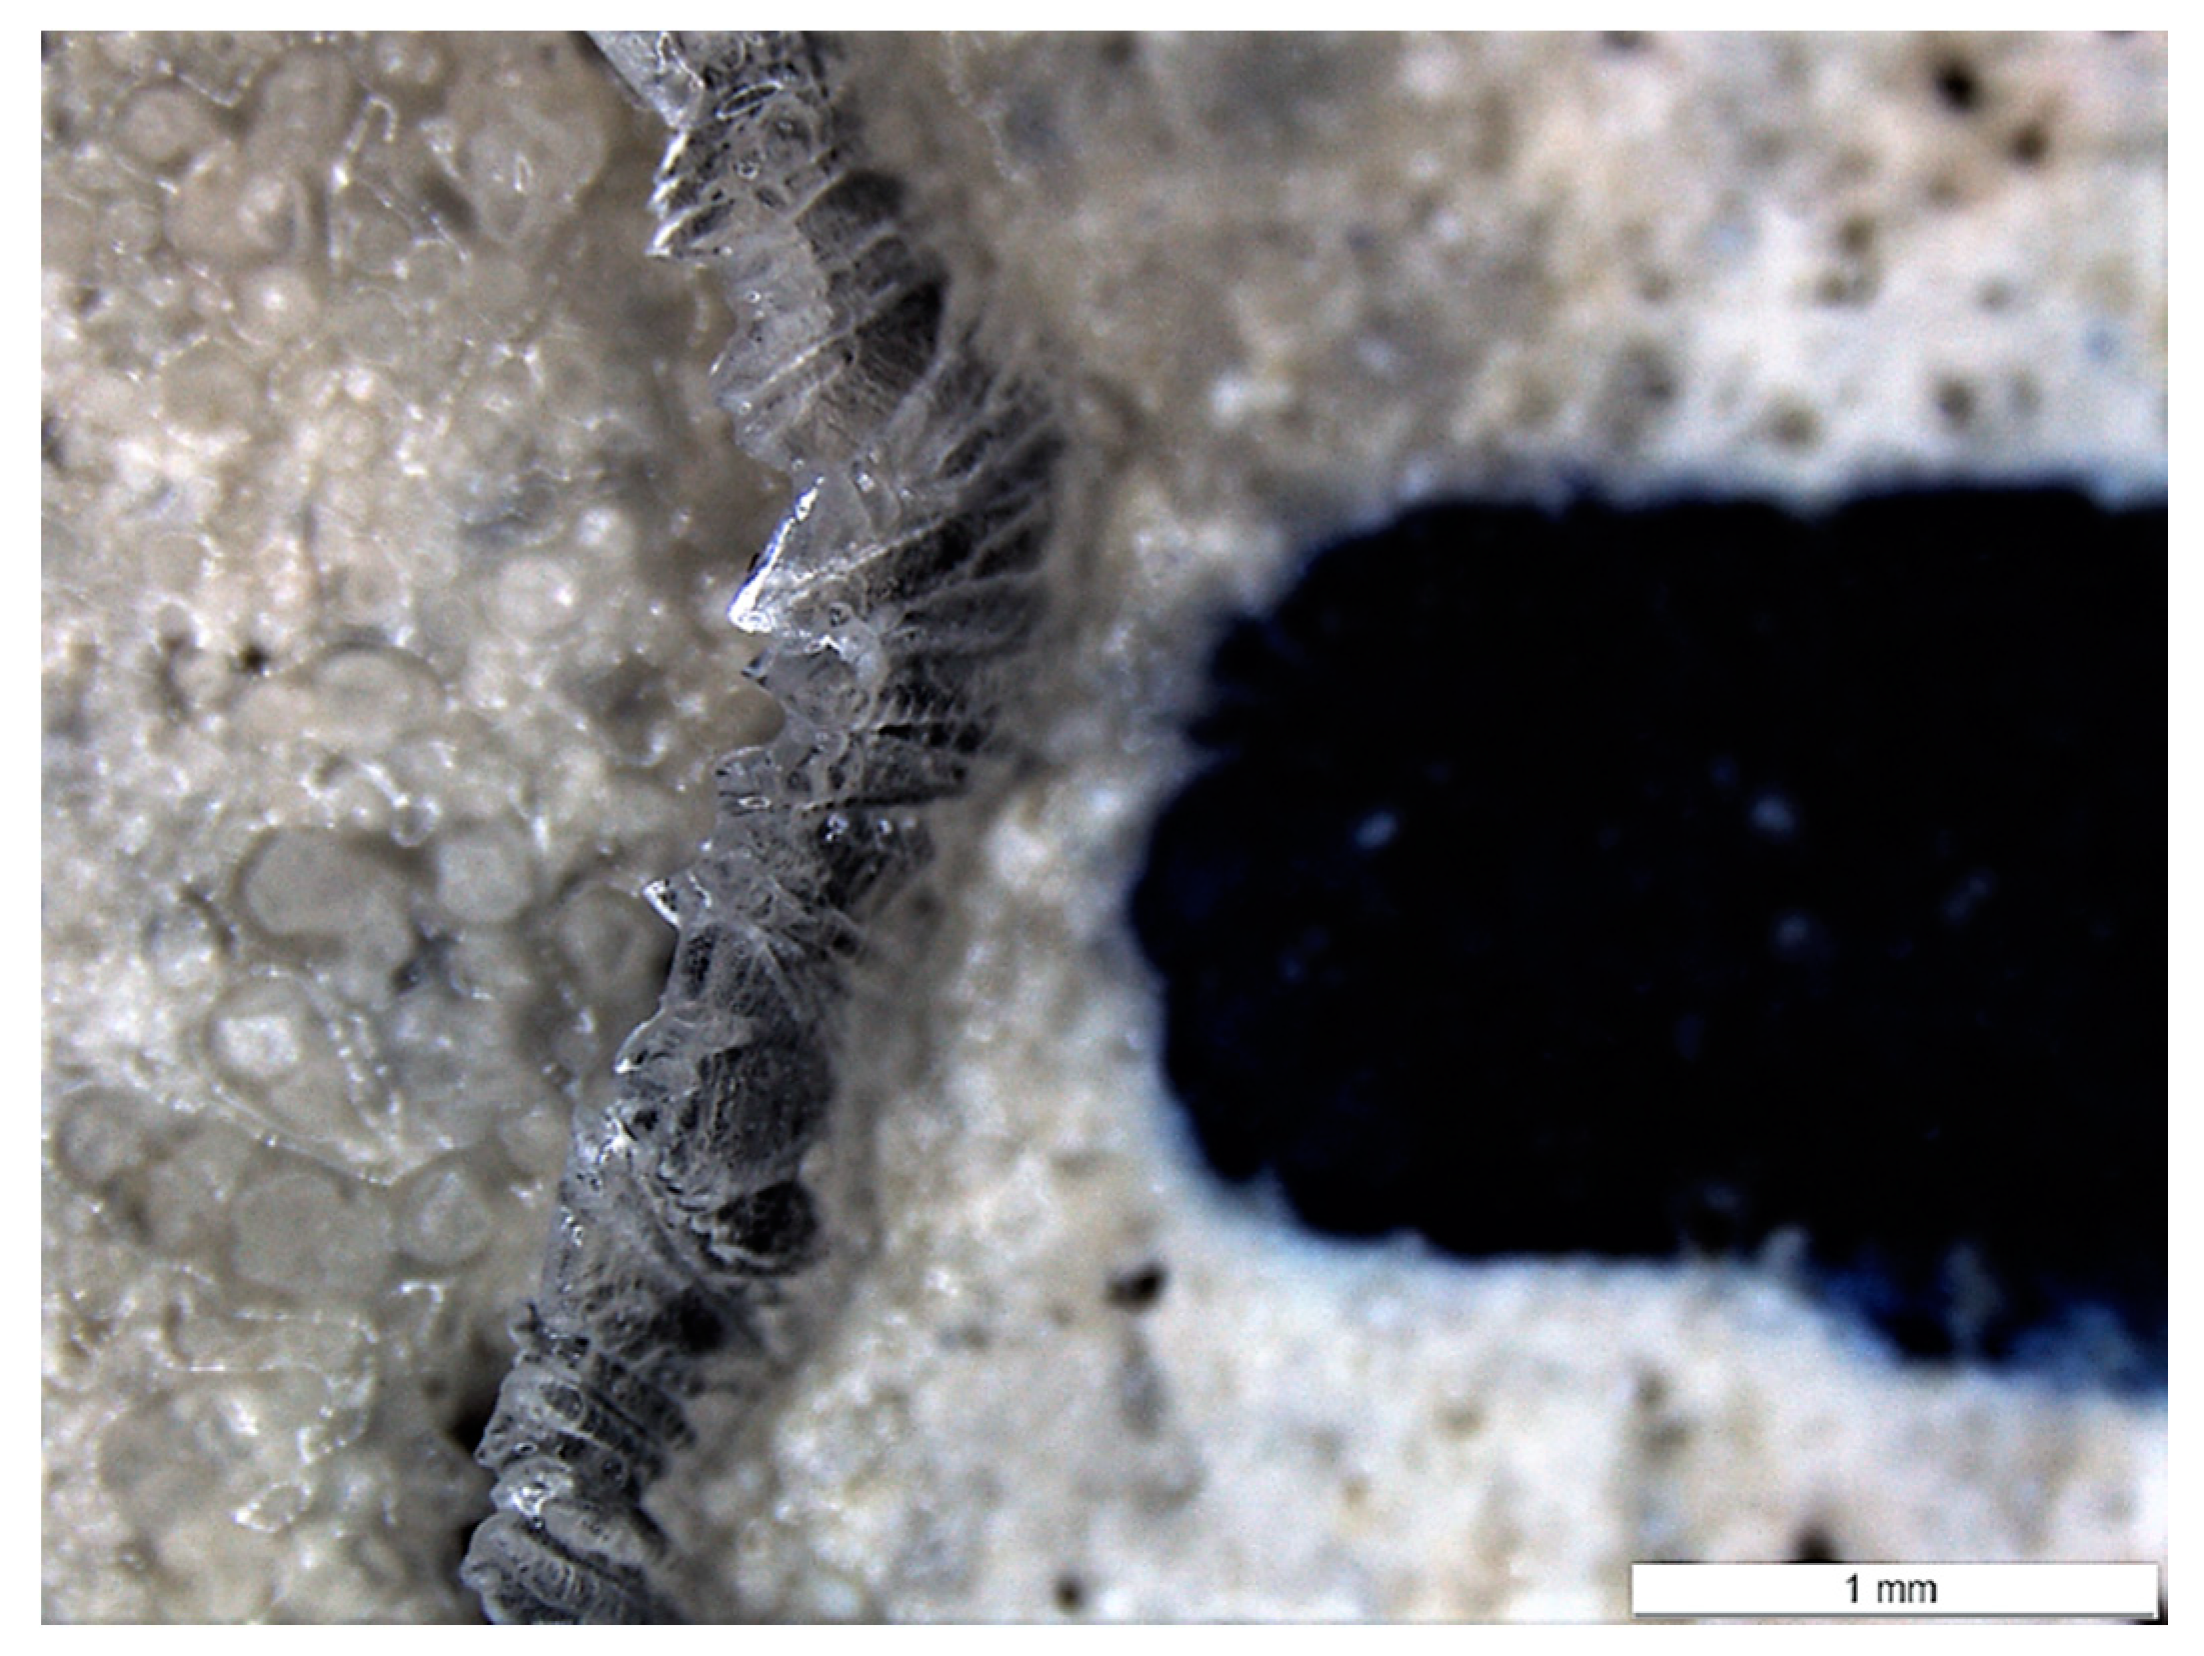
4.2. Visual Crack Healing
4.3. Capillary Water Absorption
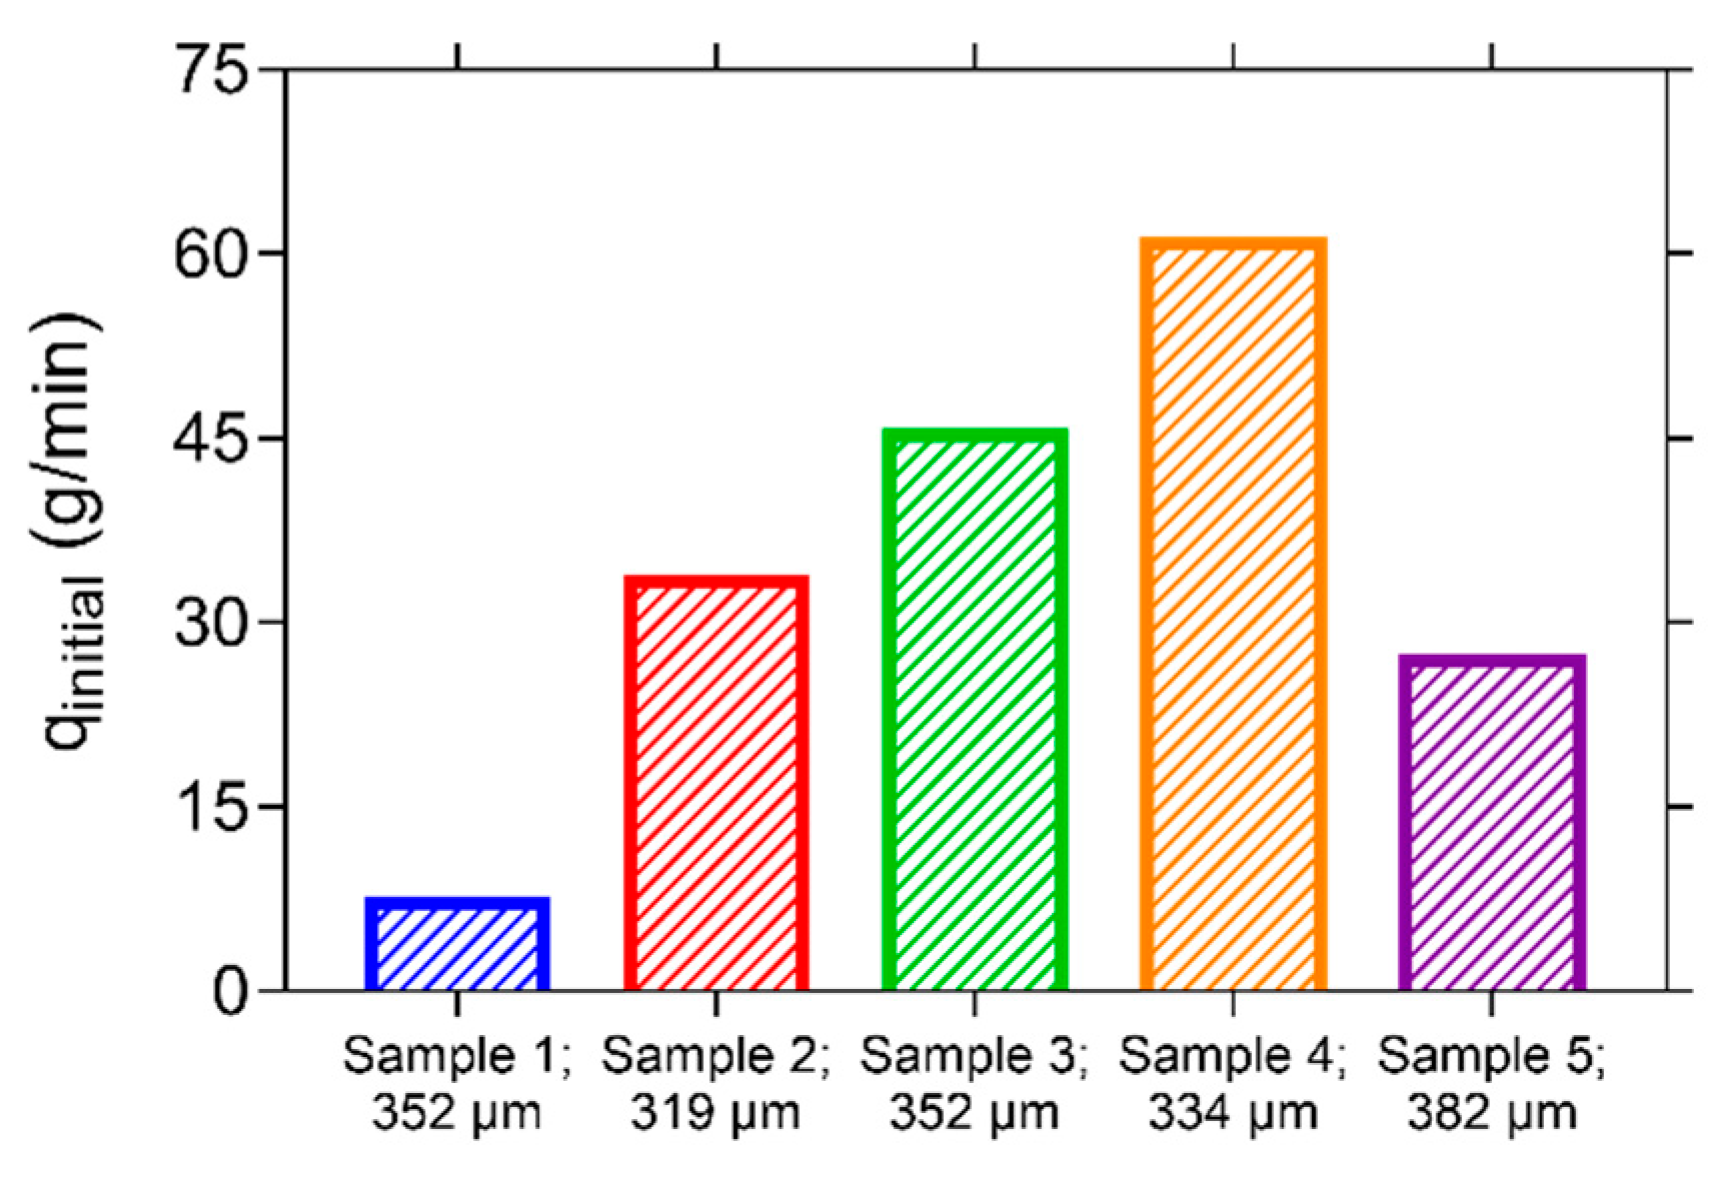
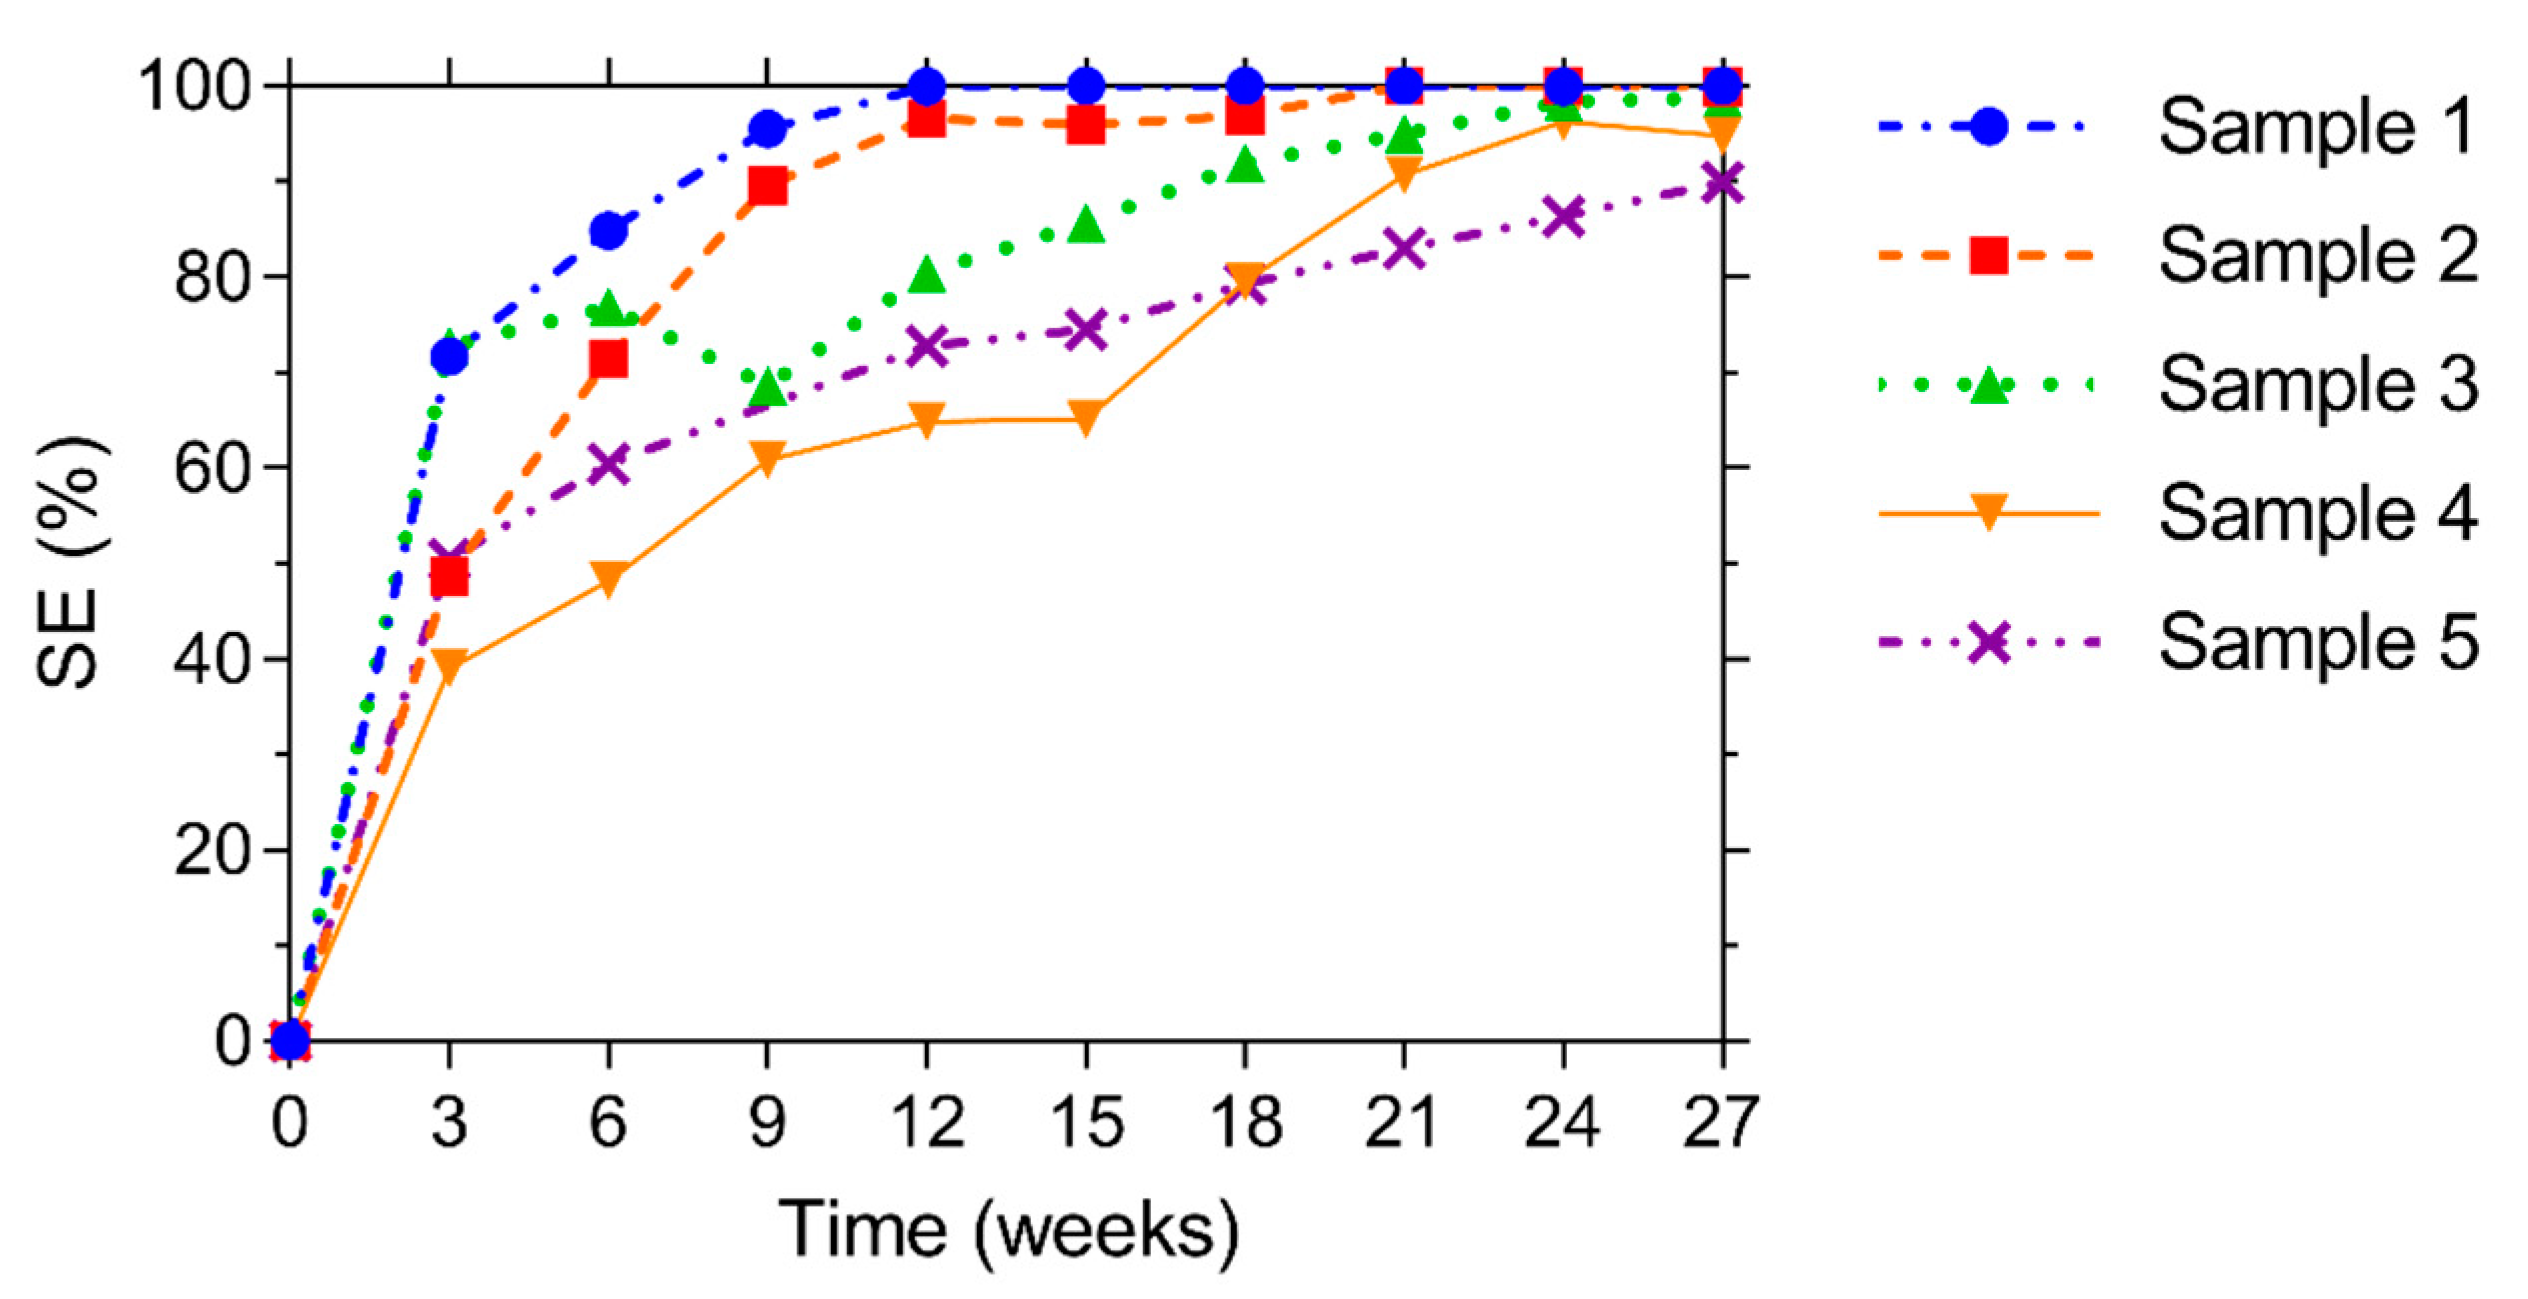
4.4. Water Permeability
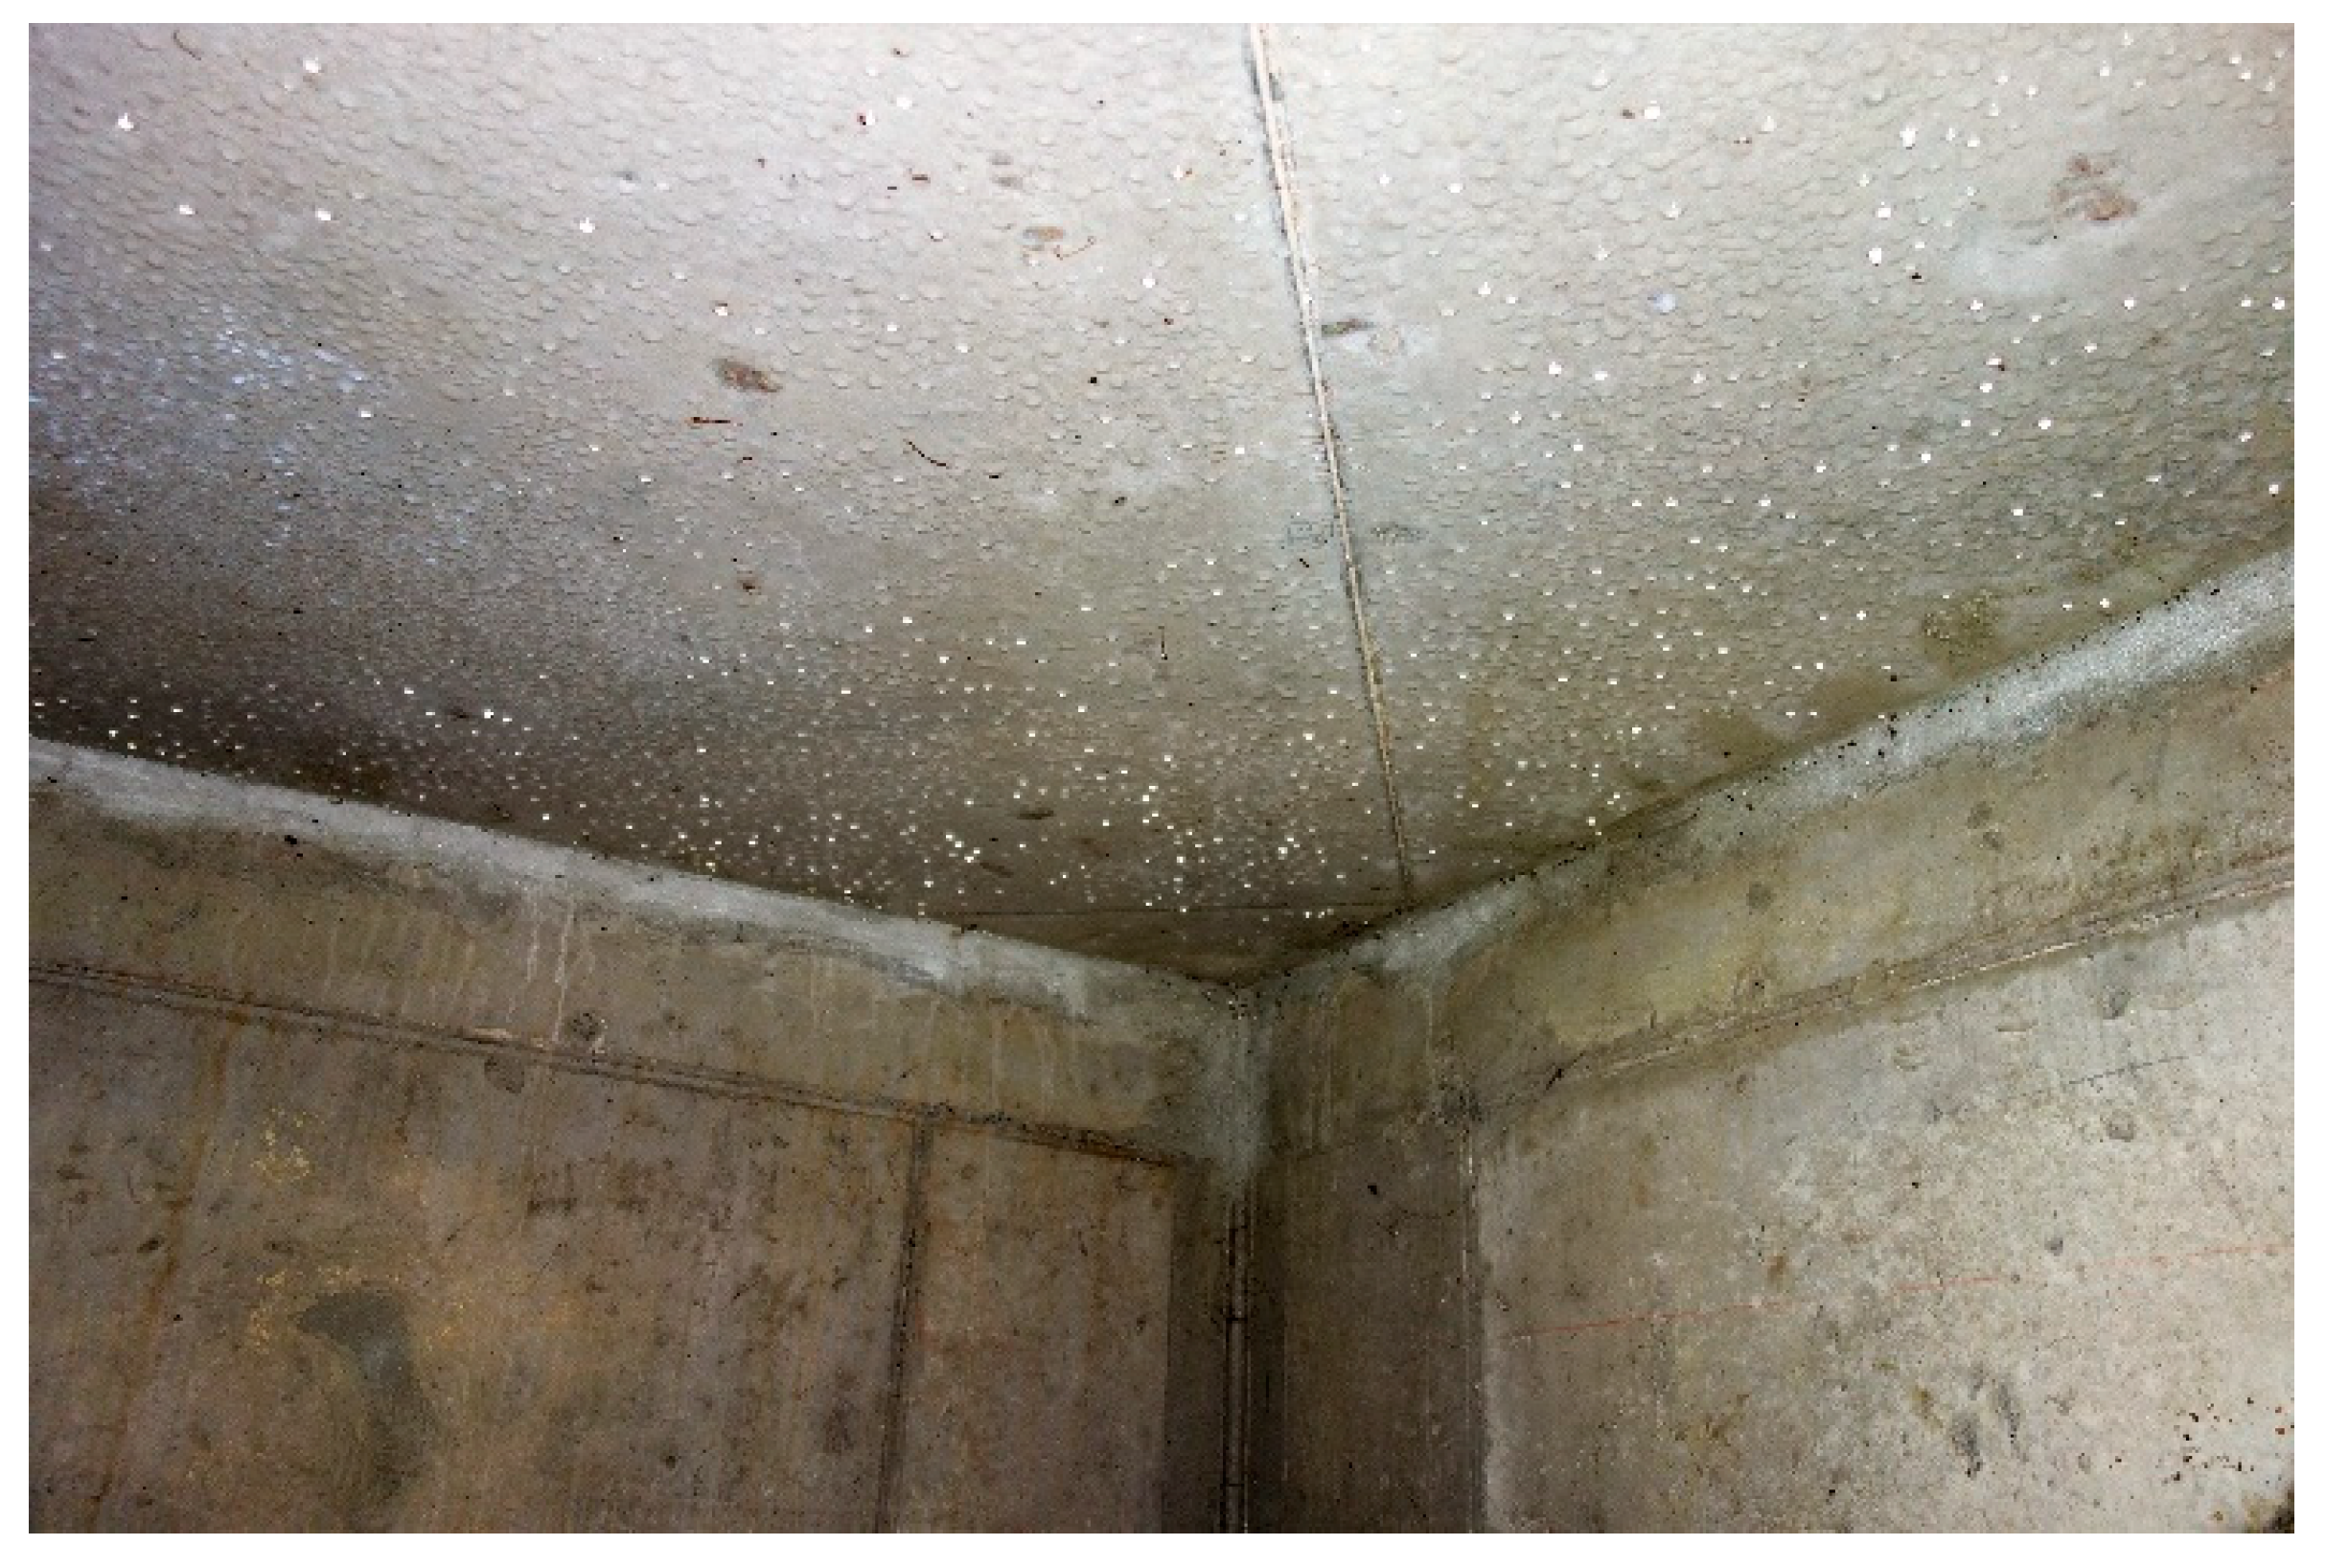
5. Inspection of the Trial Site
6. Conclusions
- (1)
- The need for liquid water to start CaCO3 production of the bacteria;
- (2)
- The best visual crack closure for specimens subjected to wet-dry conditions, compared to humid conditions (>95% RH) or permanent saturation;
- (3)
- A more consistent visual crack closure (also at higher mean crack widths) for crack locations at the bottom of specimens, compared to cracks on the top or on the side of specimens;
- (4)
- A negligible improvement in capillary water absorption after healing for cracks larger than 300 µm, which can be attributed to an incomplete crack closure at the surface;
- (5)
- A large influence of the crack tortuosity on the initial water permeability of different specimens, when the crack width is nearly constant;
- (6)
- A nearly perfect regain in liquid tightness tested by water permeability (>90%, for three out of five specimens >98.5%), which can be explained by smaller crack widths at the location of the water introduction in the specimens than at the surface of the specimens (>300 µm).
- (7)
- An on-site inspection, more than 1 year after casting, showed no sign of cracking at the bottom of the roof slab. Most likely the design cracking load was not obtained. However, the inspection showed favorable conditions for healing if the slab would crack in the future.
Author Contributions
Funding
Acknowledgments
Conflicts of Interest
References
- Cailleux, E.; Pollet, V. Investigations on the development of self-healing properties in protective coatings for concrete and repair mortars. In Proceedings of the 2nd International Conference on Self-Healing Materials, Chicago, IL, USA, 28 June–1 July 2009. [Google Scholar]
- De Maria, J.; Caprani, C.; Guo, D. Long span bridges-current age & design life—A global survey. In International Conference on Bridge Maintenance, Safety and Management (IABMAS) 2018; CRC Press: Melbourne, Australia, 2018; pp. 1417–1426. [Google Scholar]
- Steel, T. Belgische investeringen in beton lopen hopeloos achter. De Tijd, 17 August 2018. [Google Scholar]
- Huang, L.; Krigsvoll, G.; Johansen, F.; Liu, Y.; Zhang, X. Carbon emission of global construction sector. Renew. Sustain. Energy Rev. 2018, 81, 1906–1916. [Google Scholar] [CrossRef]
- De Belie, N.; Gruyaert, E.; Al-Tabbaa, A.; Antonaci, P.; Baera, C.; Bajare, D.; Darquennes, A.; Davies, R.; Ferrara, L.; Jefferson, T. A review of self-healing concrete for damage management of structures. Adv. Mater. Interfaces 2018, 5, 1800074. [Google Scholar] [CrossRef]
- Ferrara, L.; Van Mullem, T.; Alonso, M.C.; Antonaci, P.; Borg, R.P.; Cuenca, E.; Jefferson, A.; Ng, P.-L.; Peled, A.; Roig-Flores, M.; et al. Experimental characterization of the self-healing capacity of cement based materials and its effects on the material performance: A state of the art report by COST Action SARCOS WG2. Constr. Build. Mater. 2018, 167, 115–142. [Google Scholar] [CrossRef]
- Jefferson, T.; Javierre, E.; Freeman, B.; Zaoui, A.; Koenders, E.; Ferrara, L. Research Progress on Numerical Models for Self-Healing Cementitious Materials. Adv. Mater. Interfaces 2018, 5, 1701378. [Google Scholar] [CrossRef]
- Tittelboom, K.V.; Wang, J.; Araújo, M.; Snoeck, D.; Gruyaert, E.; Debbaut, B.; Derluyn, H.; Cnudde, V.; Tsangouri, E.; Van Hemelrijck, D. Comparison of different approaches for self-healing concrete in a large-scale lab test. Constr. Build. Mater. 2016, 107, 125–137. [Google Scholar] [CrossRef]
- Tziviloglou, E.; Van Tittelboom, K.; Palin, D.; Wang, J.; Sierra-Beltrán, M.G.; Erşan, Y.Ç.; Mors, R.; Wiktor, V.; Jonkers, H.; Schlangen, E.; et al. Bio-Based Self-Healing Concrete: From Research to Field Application. In Fortschritte der Hochpolymeren-Forschung; Springer Science and Business Media LLC: Berlin, Germany, 2016; pp. 345–385. [Google Scholar]
- Araújo, M.; Chatrabhuti, S.; Gurdebeke, S.; Alderete, N.; Van Tittelboom, K.; Raquez, J.-M.; Cnudde, V.; Van Vlierberghe, S.; De Belie, N.; Gruyaert, E. Poly(methyl methacrylate) capsules as an alternative to the “proof-of-concept” glass capsules used in self-healing concrete. Cem. Concr. Compos. 2018, 89, 260–271. [Google Scholar] [CrossRef]
- Gruyaert, E.; Debbaut, B.; Kaasgaard, M.; Sorensen, H.E.; Pelto, J.; Branco, V.; Malm, F.; Grosse, C.; Price, E.; Krüger, M.; et al. Evaluation of the performance of self-healing concrete at small and large scale under laboratory conditions. In 14th International Conference on Durability of Building Materials and Components (XIV DBMC), Ghent, Belgium, 29–31 May 2017; Schutter, G.D., De Belie, N., Janssens, A., Bossche, N.V.D., Eds.; RILEM Publications: Paris, France, 2017. [Google Scholar]
- Keskin, S.B.; Keskin, O.K.; Anil, O.; Şahmaran, M.; Alyousif, A.; Lachemi, M.; Amleh, L.; Ashour, A.F. Self-healing capability of large-scale engineered cementitious composites beams. Compos. Part B Eng. 2016, 101, 1–13. [Google Scholar] [CrossRef]
- Ferrara, L.; Albertini, I.; Gettu, R.; Krelani, V.; Moscato, S.; Pirritano, F.; Flores, M.R.; Pedro, S.; Theeda, S.M. Self healing of Cement Based Materials Engineered Through Crystalline Admixtures: Experimental Results from A Multinational University Network. Spec. Publ. 2015, 305, 13.1–13.10. [Google Scholar]
- Luo, M.; Qian, C.-X.; Li, R.-Y. Factors affecting crack repairing capacity of bacteria-based self-healing concrete. Constr. Build. Mater. 2015, 87, 1–7. [Google Scholar] [CrossRef]
- Roig-Flores, M.; Moscato, S.; Serna, P.; Ferrara, L. Self-healing capability of concrete with crystalline admixtures in different environments. Constr. Build. Mater. 2015, 86, 1–11. [Google Scholar] [CrossRef]
- Wang, J.; Dewanckele, J.; Cnudde, V.; Van Vlierberghe, S.; Verstraete, W.; De Belie, N. X-ray computed tomography proof of bacterial-based self-healing in concrete. Cem. Concr. Compos. 2014, 53, 289–304. [Google Scholar] [CrossRef]
- Snoeck, D.; Van Tittelboom, K.; Steuperaert, S.; Dubruel, P.; De Belie, N. Self-healing cementitious materials by the combination of microfibres and superabsorbent polymers. J. Intell. Mater. Syst. Struct. 2014, 25, 13–24. [Google Scholar] [CrossRef]
- Van Tittelboom, K.; De Belie, N. Self-healing in cementitious materials—A review. Materials 2013, 6, 2182–2217. [Google Scholar] [CrossRef] [PubMed]
- Dry, C. In-Service Repair of Highway Bridges and Pavements by Internal Time-Release Repair Chemicals; Transport Research Centre’s International Transport Research Documentation: Washington, DC, USA, 2001. [Google Scholar]
- Beltran, M.; Jonkers, H. Crack self-healing technology based on bacteria. J. Ceram. Process. Res. 2015, 16, 33–39. [Google Scholar]
- Wiktor, V.; Jonkers, H. Bacteria-based concrete: From concept to market. Smart Mater. Struct. 2016, 25, 084006. [Google Scholar] [CrossRef]
- Davies, R.; Teall, O.; Pilegis, M.; Kanellopoulos, A.; Sharma, T.; Jefferson, A.; Gardner, D.; Al-Tabbaa, A.; Paine, K.; Lark, R.J. Large scale application of self-healing concrete: Design, construction and testing. Front. Mater. 2018, 5, 51. [Google Scholar] [CrossRef]
- Teall, O.; Davies, R.; Pilegis, M.; Kanellopoulos, A.; Sharma, T.; Paine, K.; Jefferson, A.; Lark, R.; Gardner, D.; Al-Tabbaa, A. Self-healing concrete full-scale site trials. In Proceedings of the 11th fib International PhD Symposium in Civil Engineering, Tokyo, Japan, 29–31 August 2016; pp. 639–646. [Google Scholar]
- Al-Tabbaa, A.; Litina, C.; Giannaros, P.; Kanellopoulos, A.; Souza, L. First UK field application and performance of microcapsule-based self-healing concrete. Constr. Build. Mater. 2019, 208, 669–685. [Google Scholar] [CrossRef]
- Wiktor, V.; Jonkers, H. Field performance of bacteria-based repair system: Pilot study in a parking garage. Case Stud. Constr. Mater. 2015, 2, 11–17. [Google Scholar] [CrossRef]
- Gruyaert, E.; Debbaut, B.; Wang, J.; Arizo, A.; Branco, V.; Alakomi, H.-L.; Beirao, A.; De Belie, N. Evaluation of the self-healing efficiency of cracks in mortar by bioprecipitation or applications of hydrogels. In Proceedings of the HEALCON Conference Self-Healing Concrete for Prolonged Lifetime, Delft, The Netherlands, 28–29 November 2016; pp. 1–4. [Google Scholar]
- De Belie, N.; Araújo, M.; Van Mullem, T.; Gruyaert, E. Demonstration projects with self-healing capsule-based and bacteria-based concrete. In Proceedings of the International Conference on Interdisciplinary Approaches for Cement-Based Materials and Structural Concrete (SynerCrete’18), Madeira Island, Funchal, Portugal, 24–26 October 2018; RILEM Publications; pp. 29–38. [Google Scholar]
- De Belie, N.; Van Mullem, T.; Gruyaert, E.; Van den Heede, P. Self-healing concrete to increase service life of a roof plate for an inspection pit in the Oosterweel link: Healing efficiency and preliminary service life estimation. In Proceedings of the 4th International Conference on Service Life Design for Infrastructures (SLD4), Delft, The Netherlands, 27–30 August 2018; RILEM Publications; pp. 429–436. [Google Scholar]
- Lantis The Oosterweel Link. Available online: https://www.oosterweelverbinding.be/oosterweel-link# (accessed on 21 January 2020).
- Bravo da Silva, F. Up-Scaling the Production of Bacteria for Self-Healing Concrete Application. Ph.D. Thesis, Faculty of Bioscience Engineering, Ghent University, Ghent, Belgium, 21 May 2015. [Google Scholar]
- Bravo da Silva, F.; De Belie, N.; Boon, N.; Verstraete, W. Production of non-axenic ureolytic spores for self-healing concrete applications. Constr. Build. Mater. 2015, 93, 1034–1041. [Google Scholar] [CrossRef]
- CEN Eurocode 2: Design of Concrete Structures-Part 1-1: General Rules and Rules for Buildings; CEN: Brussel, Belgium, 2005.
- Feiteira, J. Self-Healing concrete-Encapsulated polymer precursors as healing agents for active cracks. Ph.D. Thesis, Ghent University, Faculty of Engineering and Architecture, Ghent, Belgium, 2017. [Google Scholar]
- Van Mullem, T.; Gruyaert, E.; Debbaut, B.; Caspeele, R.; De Belie, N. Novel active crack width control technique to reduce the variation on water permeability results for self-healing concrete. Constr. Build. Mater. 2019, 203, 541–551. [Google Scholar] [CrossRef]
- Reinhardt, H.; Jonkers, H.; Van Tittelboom, K.; Snoeck, D.; De Belie, N.; De Muynck, W.; Verstraete, W.; Wang, J.; Mechtcherine, V. Recovery against Environmental Action. In RILEM State-of-the-Art Reports; Springer Science and Business Media LLC: Dordrecht, The Netherlands, 2013; Volume 11, pp. 65–117. [Google Scholar]
- Edvardsen, C. Water permeability and autogenous healing of cracks in concrete. Mater. J. 1999, 96, 448–454. [Google Scholar]
- Van Tittelboom, K.; Gruyaert, E.; Rahier, H.; De Belie, N. Influence of mix composition on the extent of autogenous crack healing by continued hydration or calcium carbonate formation. Constr. Build. Mater. 2012, 37, 349–359. [Google Scholar] [CrossRef]
- Neville, A. Autogenous healing—A concrete miracle? Concr. Int. 2002, 24, 76–82. [Google Scholar]
- Homma, D.; Mihashi, H.; Nishiwaki, T. Self-healing capability of fibre reinforced cementitious composites. J. Adv. Concr. Technol. 2009, 7, 217–228. [Google Scholar] [CrossRef]


| Components | Amount |
|---|---|
| CEM III/B 42.5 N (kg/m³) | 430 |
| Aggregate (0−2 mm) (kg/m³) | 171 |
| Aggregate (0−4 mm) (kg/m³) | 581 |
| Aggregate (2−6 mm) (kg/m³) | 162 |
| Aggregate (8−22 mm) (kg/m³) | 815 |
| Water/Cement (-) | 0.46 |
| Superplasticizer A (m% of Cement) | 0.26 |
| Superplasticizer B (m% of Cement) | 0.23 |
| Self-Healing Agent MUC+ (kg/m³) | 4.3 |
| Urea (kg/m³) | 4.3 |
| Calcium Nitrate Tetrahydrate (kg/m³) | 4.3 |
| Age | Compressive Strength |
|---|---|
| 7 days | 30.7 MPa |
| 28 days | 45.0 MPa |
| 93 days | 54.7 MPa |
| Before Healing | After Healing | SE | |||||
|---|---|---|---|---|---|---|---|
| Cracked | Uncracked | Cracked | Uncracked | ||||
| Crack Width (µm) | SCcrack. (g/√h) | SCuncr. (g/√h) | Crack Width (µm) | SCcrack. (g/√h) | SCuncr. (g/√h) | ||
| 1 | 335 | 5.239 | 1.696 | 53 | 4.662 | 1.322 | 15.3% |
| 2 | 374 | 4.844 | 1.823 | 156 | 4.814 | 1.570 | 0.9% |
| 3 | 351 | 4.832 | 1.664 | 184 | 4.687 | 1.509 | 4.3% |
| Mean | 353 | 4.97 | 1.73 | 131 | 4.72 | 1.47 | 6.8% |
© 2020 by the authors. Licensee MDPI, Basel, Switzerland. This article is an open access article distributed under the terms and conditions of the Creative Commons Attribution (CC BY) license (http://creativecommons.org/licenses/by/4.0/).
Share and Cite
Van Mullem, T.; Gruyaert, E.; Caspeele, R.; De Belie, N. First Large Scale Application with Self-Healing Concrete in Belgium: Analysis of the Laboratory Control Tests. Materials 2020, 13, 997. https://doi.org/10.3390/ma13040997
Van Mullem T, Gruyaert E, Caspeele R, De Belie N. First Large Scale Application with Self-Healing Concrete in Belgium: Analysis of the Laboratory Control Tests. Materials. 2020; 13(4):997. https://doi.org/10.3390/ma13040997
Chicago/Turabian StyleVan Mullem, Tim, Elke Gruyaert, Robby Caspeele, and Nele De Belie. 2020. "First Large Scale Application with Self-Healing Concrete in Belgium: Analysis of the Laboratory Control Tests" Materials 13, no. 4: 997. https://doi.org/10.3390/ma13040997
APA StyleVan Mullem, T., Gruyaert, E., Caspeele, R., & De Belie, N. (2020). First Large Scale Application with Self-Healing Concrete in Belgium: Analysis of the Laboratory Control Tests. Materials, 13(4), 997. https://doi.org/10.3390/ma13040997