Article

Experimental Investigation on Mechanism of Latent Heat Reduction of Sodium Acetate Trihydrate Phase Change Materials

1
School of Materials Science and Engineering, Hebei University of Technology, Tianjin 300130, China
2
National Engineering Laboratory for Hydrometallurgical Cleaner Production Technology, Key Laboratory of Green Process and Engineering, Institute of Process Engineering, Chinese Academy of Sciences, Beijing 100190, China
*
Authors to whom correspondence should be addressed.
Materials 2020, 13(3), 584; https://doi.org/10.3390/ma13030584
Submission received: 25 November 2019 / Revised: 22 January 2020 / Accepted: 23 January 2020 / Published: 26 January 2020
(This article belongs to the Special Issue Phase Change Materials for Thermal Energy Storage)

Abstract

:
Sodium acetate trihydrate (SAT) phase change material (PCM) has been well known for thermal energy storage due to its high latent heat and resource abundance. However, SAT suffers from severe latent heat reduction after heating and cooling cycles. Although a few of previous researches showed the reduction could be effectively inhibited by using thickeners, the mechanisms of the reduction process and thickeners’ inhibition have not been deeply explored till now. In this work, SAT modified by 5 wt.% nucleating agent of disodium hydrogen phosphate dodecahydrate (SAT/5 wt.% DSP) was prepared and 200 thermal cycles were carried out. The differential scanning calorimeter, Rheometer, X-ray diffractometry, and scanning electron microscope were used to investigate the extent of latent heat reduction, viscosity, phase composition and microstructure, respectively, and the infrared thermal imaging method was used to evaluate heat storage capacity. It was found that the latent heat of SAT/5 wt.% DSP dropped dramatically and the relative decrease in latent heat was measured to be 22.44%. The lower layer of SAT/5 wt.% DSP contained 24.1 wt.% CH3COONa, which was quantitatively consistent with the reduction extent. Furthermore, the phase change endothermic time of the lower layer was only 44.1% of that of the upper. SAT/5 wt.% DSP was further modified by 3 wt.% thickener of carboxymethyl cellulose (SAT/5 wt.% DSP/3 wt.% CMC) and endured 200 thermal cycles. The extent of the latent heat reduction of SAT/5 wt.% DSP/3 wt.% CMC was only 9.29%, and phase compositions were more homogeneous. The 3 wt.% CMC increased viscosity by 14 times, which effectively prevented the Stokes sedimentation velocity of CH3COONa in melts and inhibited the final macroscopic phase separation.

1. Introduction

Phase change materials (PCMs) for storing and releasing energy represent promising energy storage media to solve the mismatch between energy supply and demand [1,2,3,4,5,6]. In recent years, it has been widely used in the field of thermal energy storage, such as industrial waste heat recovery [7,8], building heating [9,10,11,12], as well as solar energy systems [13,14,15]. Inorganic salt hydrate PCMs are considered as promising candidates owing to their merits of high latent heat, non-flammability, constant phase change temperature, and low cost [16,17]. As a typical inorganic salt hydrate PCM, sodium acetate trihydrate (SAT, CH3COONa·3H2O) possesses high latent heat over 250 kJ/kg compared with other hydrated salt PCMs and a phase change temperature of 58 °C, which offers great potential applications in the field of thermal energy storage [18,19,20].
Unfortunately, SAT suffers from large supercooling, which results in unpredictable crystallization that prevents stored heat from being released at phase change temperature during the cooling process [21,22]. Hence, considerable efforts have been made to overcome this shortcoming in recent years. Hu et al. [23] used AlN (aluminium nitride) nanoparticles as nucleating agent of SAT. The supercooling degree of SAT could be reduced to 0–2.4 °C by adding 3–5 wt.% AlN nanoparticles. Mao et al. [24] investigated the effect of several nucleating agents on the supercooling of SAT. The results indicated that the minimum supercooling degree was 1.5 °C when the addition amount of disodium hydrogen phosphate dodecahydrate (DSP) was 6 wt.% in SAT. Similarly, silver nanoparticles [25], nano-copper [26] and iron oxide nanoparticles (α-Fe2O3) [27] were used as nucleating agents to reduce the supercooling of SAT by researchers. Among which, DSP is an ideal nucleating agent considering the cost of the large-scale practical application of SAT compared with nanoparticles nucleating agents. Moreover, severe phase separation still occurs in SAT when the supercooling is lower [28]. Cabeza et al. [29] showed that cellulose was the appropriate thickener compared with starch and bentonite. The effect of thickeners including super-absorbent polymers, polyvinyl alcohol and carboxymethyl cellulose (CMC) on SAT was reported by Ryu et al. [30]. The phase separation of SAT was successfully inhibited by thickening with CMC. Furthermore, Dannemand et al. [31] discovered that the latent heat reduction of SAT composite PCMs could be effectively inhibited by using CMC as a thickener, and latent heat was consistently around 205 kJ/kg over the six test cycles. However, thickeners (such as CMC) are used to inhibit the phase separation of hydrated salt PCMs, but the current thickeners still cannot fundamentally solve the latent heat reduction of hydrated salts. Solving the latent heat reduction of hydrated salt PCMs in practical applications is still a challenging research direction.
In this work, the latent heat reduction process of SAT was analyzed during 200 heating and cooling cycles. Importantly, the mechanism of the thickener inhibiting latent heat reduction was analyzed. A small amount of CMC increased the viscosity of solution, which prevented effectively the Stokes sedimentation velocity of CH3COONa in melts and inhibited the final macroscopic phase separation. This study provides theoretical guidance for latent heat reduction studies of SAT and other hydrated salts in practical applications.

2. Materials and Methods

2.1. Materials

SAT (CH3COONa·3H2O), DSP (Na2HPO4·12H2O) and CMC (carboxymethyl cellulose, analytical reagent grade, purity > 99%) were purchased from Sinopharm Chemical Reagent Co., Ltd. (Beijing, China).

2.2. Preparation of SAT Composite PCMs

CMC and DSP were used as thickener and nucleating agent to restrain phase separation and reduce supercooling, respectively. The composition of SAT/DSP/CMC (SAT modified by DSP and CMC) is listed in Table 1. It was reported that when the addition amount of CMC is 3 wt.%, the phase separation of SAT was effectively inhibited, and the phase change performance was optimal [24]. Every sample was thoroughly mixed by magnetic stirring in a 150-mL beaker in a water bath with a constant temperature of 80 °C, and then transferred to a 50 mL centrifuge tube with a cover, avoiding water evaporation.

2.3. Characterization

The viscosity (liquid state) was measured by Rheometer (DHR-2, TA Instruments, New Castle, DE, USA) at 80 °C. The latent heat was measured using the differential scanning calorimeter (DSC, Mettler-Toledo, Stockholm, Sweden), setting temperature from 25 to 90 °C with a heating/cooling rate of 10 °C/min under N2 at a flow rate of 50 mL/min. The component was analyzed by X-ray diffractometry (XRD, Smartlab, Rigaku Corporation, Tokyo, Japan). The morphology of the sample was observed by an environmental scanning electron microscope (ESEM, Quanta Feg 250, FEI Corporation, Hillsboro, OR, USA). The temperature of the sample was recorded using an infrared thermal camera (226, Fotric, Allen, TX, USA).

2.4. Supercooling Determination

The supercooling degree ΔT of the PCM can be calculated by the following formula [12]:
Δ T = T m T s
where Tm is the melting temperature and Ts represents the solidification temperature. The purpose of this work is to study the reduction of latent heat of SAT during practical application, so DSP was used to reduce the supercooling of SAT. The cooling curve method was used to determine the supercooling degree of SAT composite PCMs. The as-prepared samples in the 50 mL centrifuge tubes were melted in a water bath with a constant temperature of 80 °C, and then cooled naturally at room temperature. Further, the temperatures of samples were recorded once a second by multichannel temperature recorder. Every sample was tested three times.

2.5. Heat Storage Capacity Determination

The heat storage capacity was qualitatively assessed by comparing the phase change time of samples under the same heating condition. Infrared thermal imaging method was used to observe the temperature changes of sample in heating and cooling process. The samples were pressed into wafers with the diameter of 2 cm and the quantity of 1 g, and then put in a glass dish without covering, floating above the oil bath of 80 °C. The temperatures of samples were recorded using an infrared thermal camera. The equipment is shown in Figure 1.

2.6. Thermal Stability Determination

The thermal stabilities of SAT/5 wt.% DSP and SAT/5 wt.% DSP/3 wt.% CMC were determined by comparing the latent heat changes before and after heating and cooling cycles. Four 1-g samples of SAT/5 wt.% DSP were placed in 1.5 mL centrifuge tubes. Then these centrifuge tubes were immersed in a water bath at the constant temperature of 80 °C. When the temperatures of samples didn’t change, they were quickly placed into the 20 °C water bath. Four samples were cycled 40, 80, 150, and 200 times as described above. Then every resulting sample was taken out of the centrifuge tubes, and ground uniformly, and then a few milligrams of powder sample were used for DSC testing. Same thermal stability test process of SAT/5 wt.% DSP/3 wt.% CMC was carried out. Every sample was tested five times. The error of the DSC test result is no more than 10 J/g.

3. Results and Discussion

3.1. Influence of DSP on Supercooling

Cooling curves and supercooling degrees of SAT modified by different contents of DSP are illustrated in Figure 2. It can be observed that the SAT/1 wt.% DSP (SAT with 1 wt.% DSP) doesn’t solidify, while the SAT with 3 wt.% to 10 wt.% DSP solidified with some extent of supercooling. When the content of DSP is 5 wt.%, the supercooling degree is 2.9 °C, which is the lowest as shown in Figure 2b.

3.2. The Analysis of Latent Heat Reduction

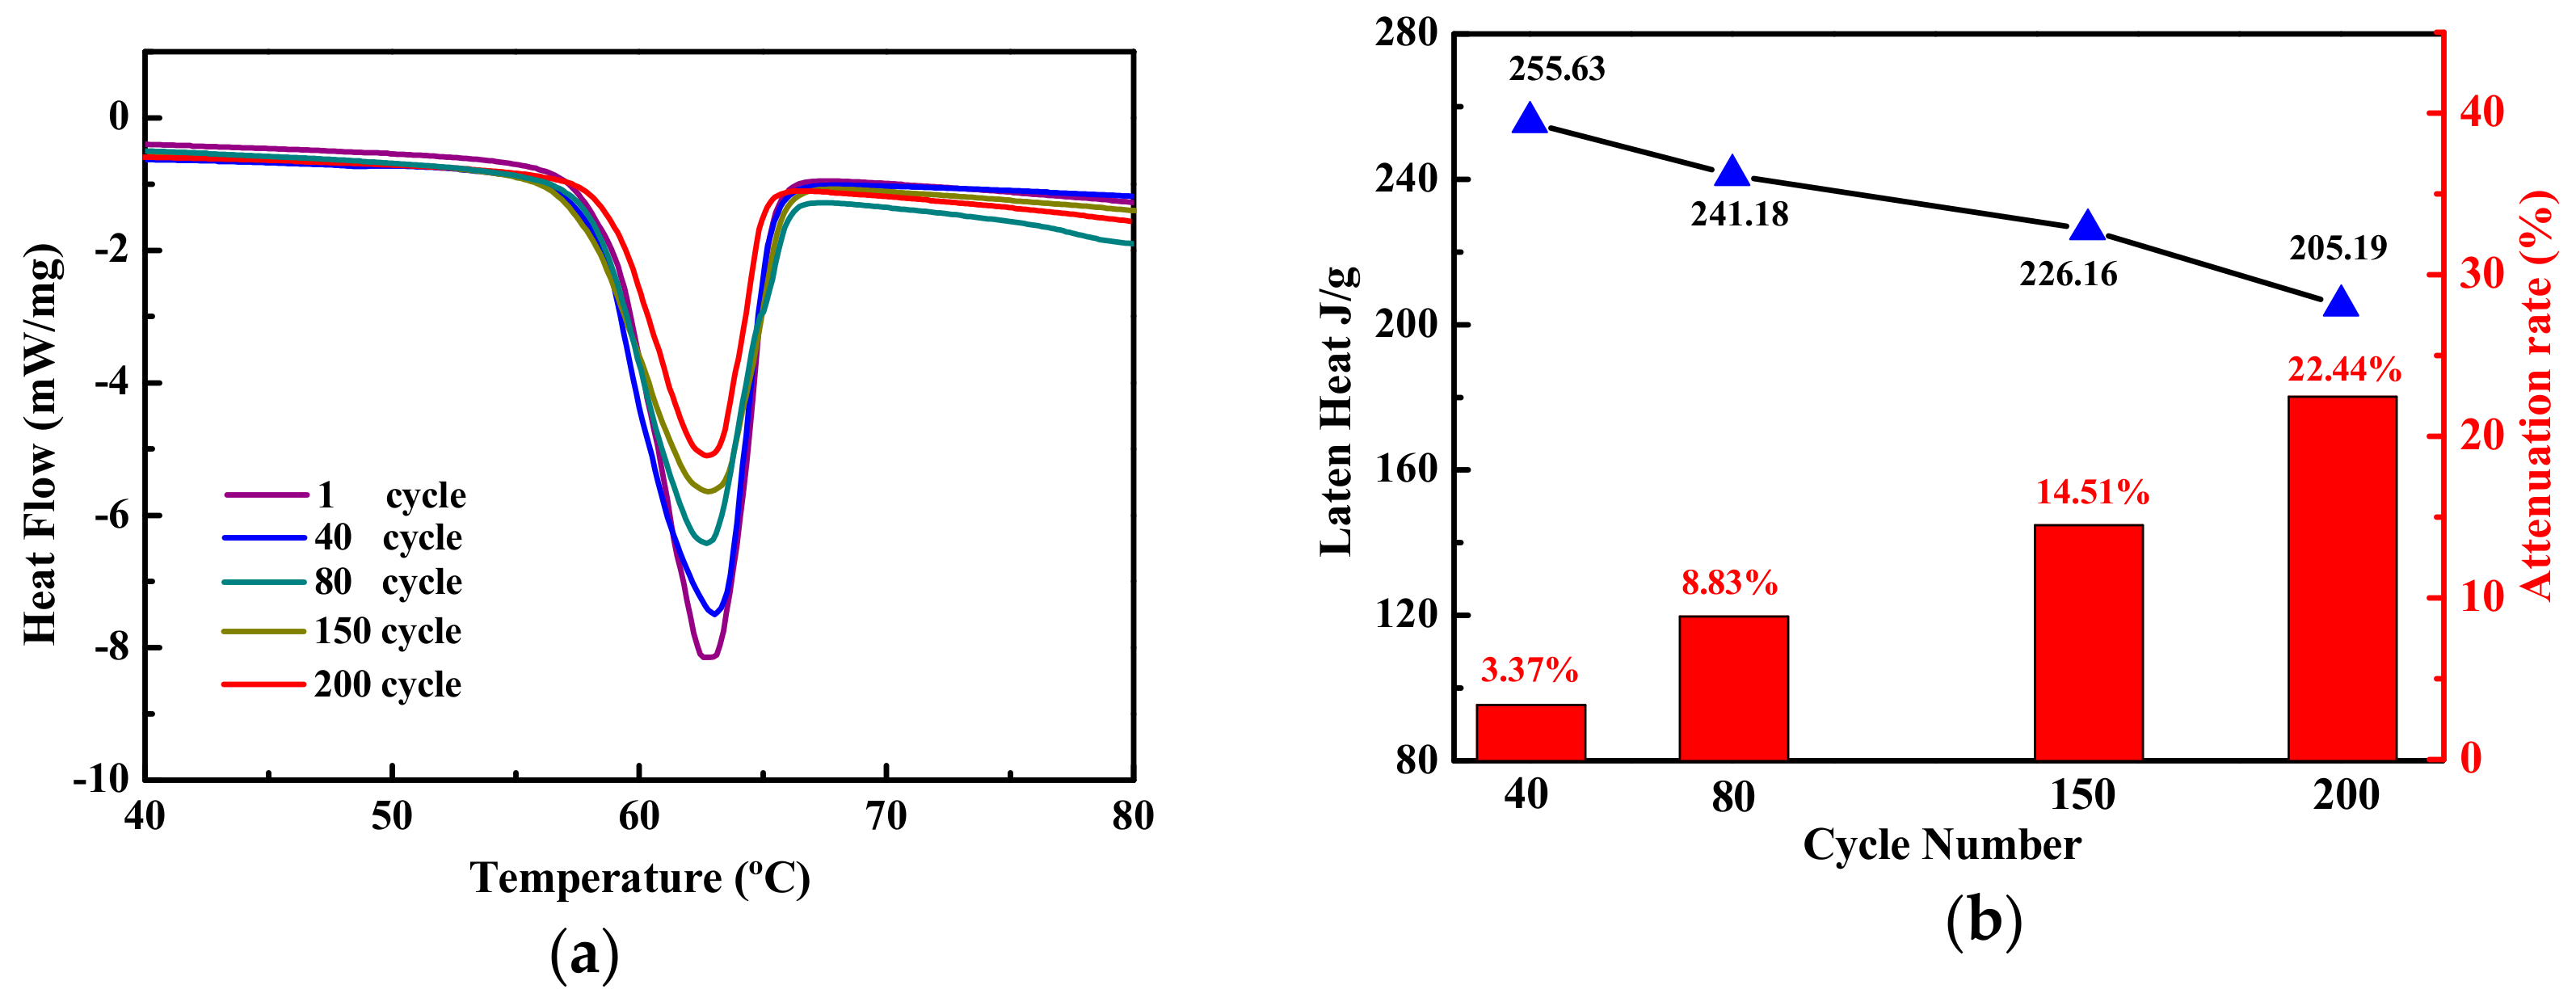
The 200 heating and cooling cycles of SAT/5 wt.% DSP were carried out. The DSC measurements of SAT/5 wt.% DSP in different cycles are shown in Figure 3, and a concave peak is observed in each DSC melting curve. As the number of cycles increases, the area of the peak decreases. This indicates that the latent heat of SAT/5 wt.% DSP is decreasing during 200 heating and cooling cycles. The extent of latent heat reduction was calculated by the following formula [32]:
α = ( Δ H 1 Δ H 2 ) Δ H 1 × 100 %
where α is the extent of latent heat reduction, ΔH1 represents the latent heat of the initial sample, and ΔH2 is the latent heat of sample after different thermal cycles.
The five DSC test results of the SAT/5 wt.% DSP are shown in Table 2. The experimental results are the mean values of five test results. The standard deviations of the latent heat for 40, 80, 150, 200 cycles are calculated respectively as 4.72, 5.03, 4.58, 4.52. After 200 heating and cooling cycles, the latent heat of SAT/5 wt.% DSP drops to 205.19 J/g as shown in Figure 3b. The extent of latent heat reduction of SAT/5 wt.% DSP increases from 3.37% in 40 cycles to 22.44% in 200 cycles.
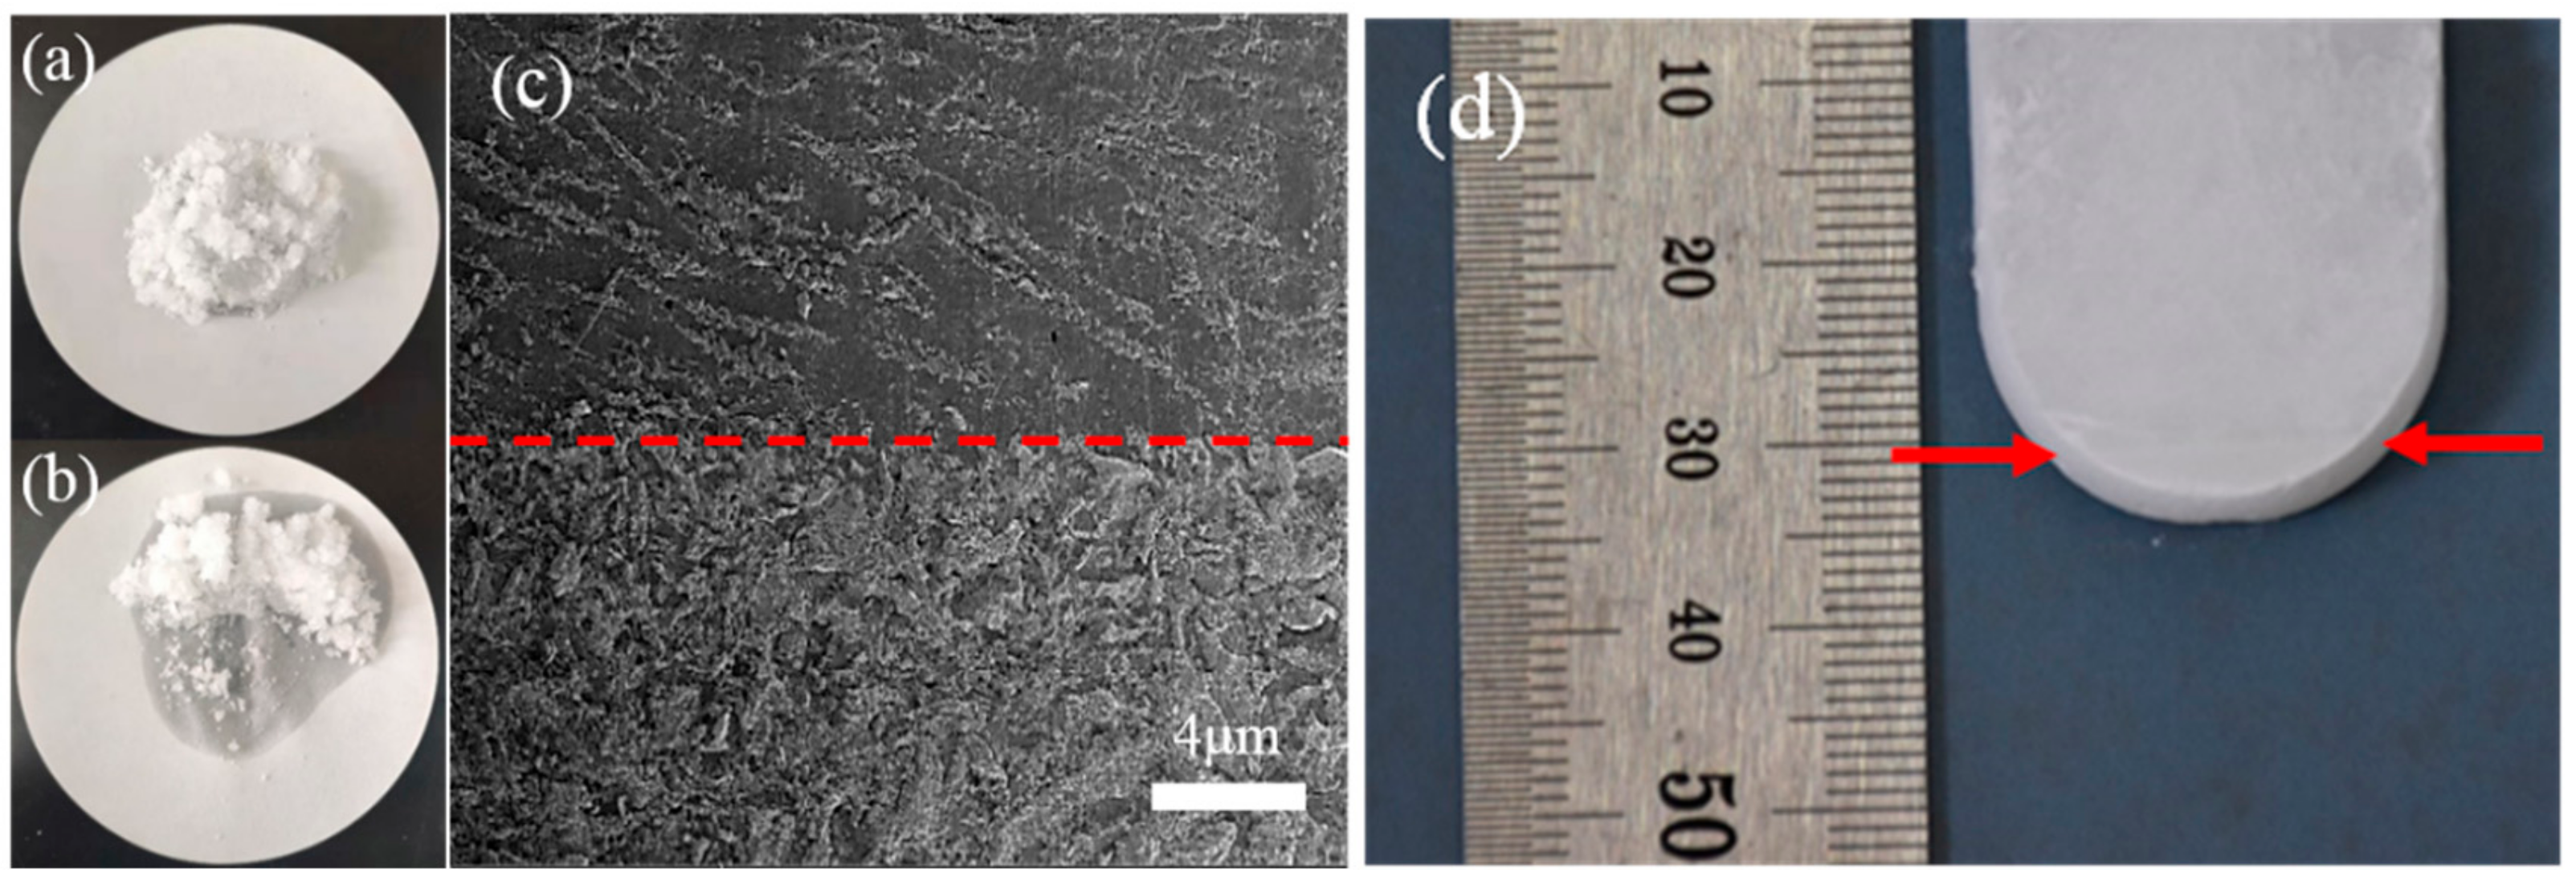
Figure 4a is the 52.5g original sample of SAT/5 wt.% DSP and Figure 4b shows the sample cycled 200 times. The uncrystallized liquid phase was observed in SAT/5 wt.% DSP after 200 heating and cooling cycles in Figure 4b. The 200 cycled sample in the 50 mL centrifuge tube was cut vertically from the top to the bottom of the centrifuge tube, and the profile is shown in Figure 4d. The morphology at a bottom height of 3 cm of SAT/5 wt.% DSP is illustrated in Figure 4c. Different morphologies are observed on both sides of the interface, which indicates that the components on both sides of the interface are different. It should be pointed out that phase separation occurs in SAT/5 wt.% DSP after 200 heating and cooling cycles.
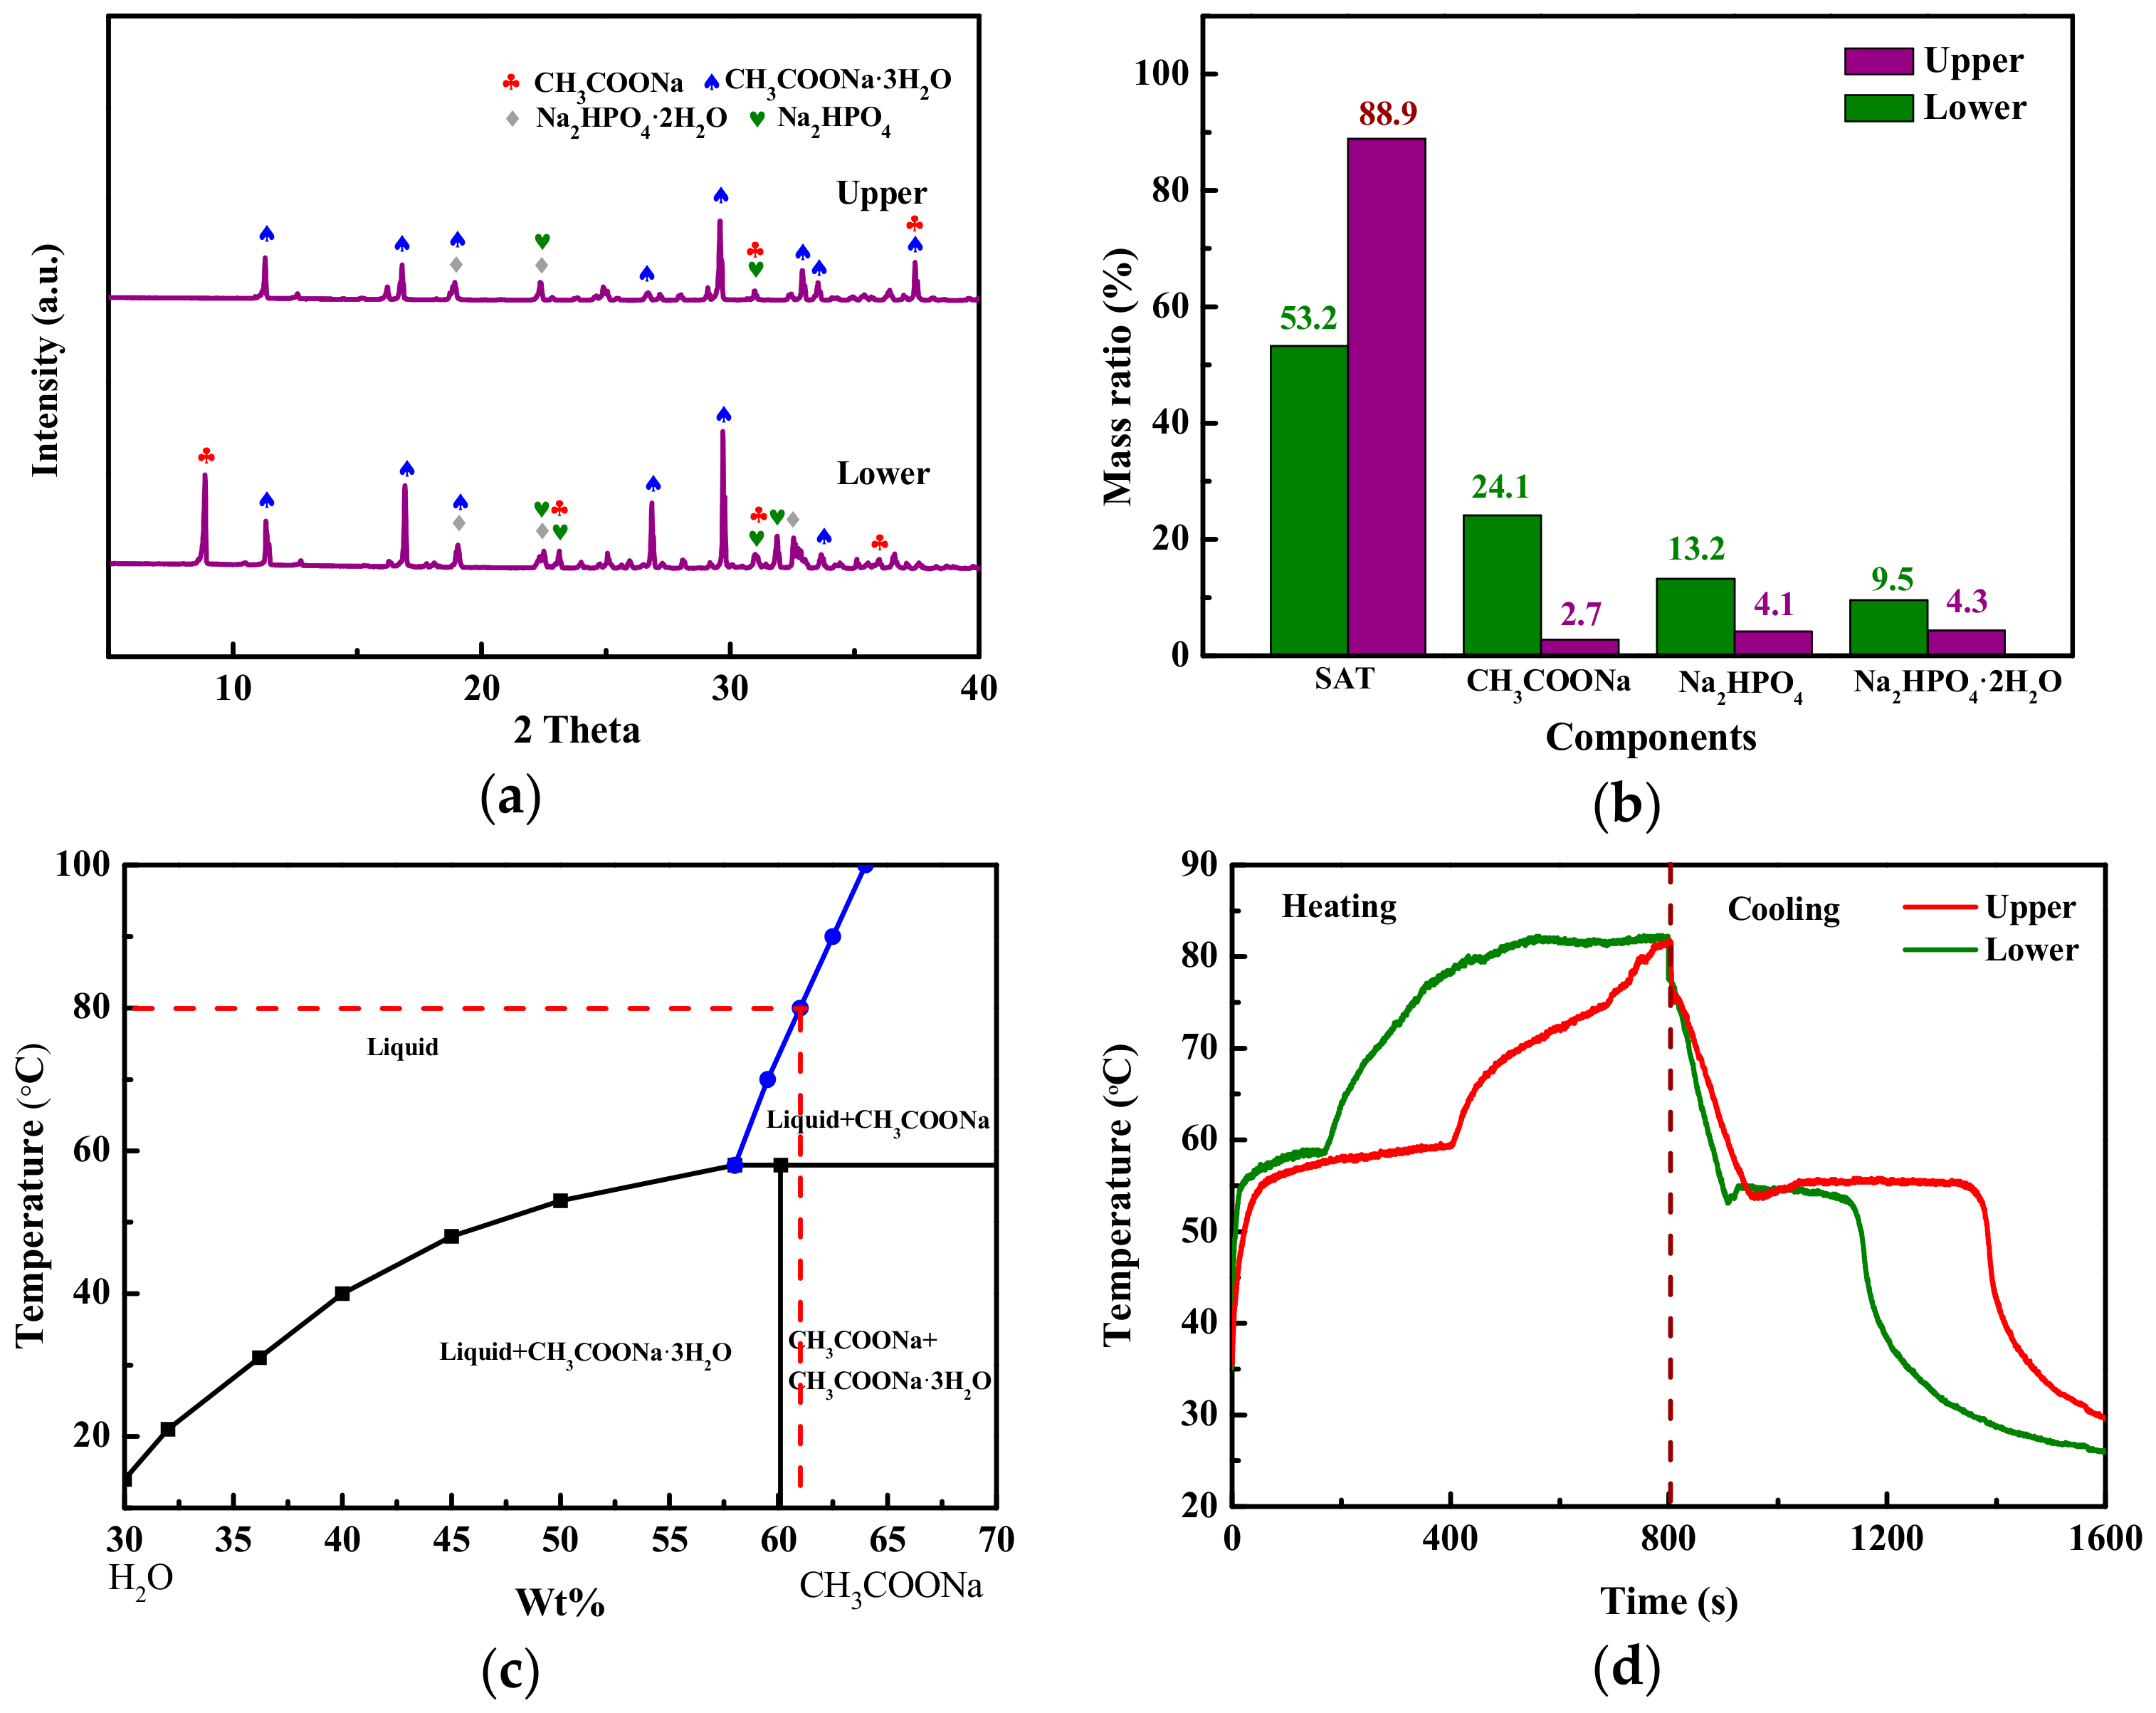
Furthermore, the SAT/5 wt.% DSP was cut horizontally at the interface and divided into two layers: the upper and lower samples. The crystalline phases of upper and lower samples were analyzed by XRD as shown in Figure 5a. SAT exhibits strong peaks at 11.3°, 16.8°, and 29.58° (2 Theta) observing in the XRD pattern of the upper sample. Furthermore, Na2HPO4·2H2O and Na2HPO4 show weak peaks, which is caused by the decomposition of DSP [33,34]. The CH3COONa is observed at 8.83° and 23.08° in the XRD pattern of the lower sample, which confirms that phase separation has occurred in SAT/5 wt.% DSP. Figure 5b shows the semi-quantitative analysis results of the upper and lower samples by k value method. It can be seen from the Figure 5b that the component of lower sample is mainly SAT with a mass ratio of 53.2%, and the 24.1 wt.% of CH3COONa of lower sample is much higher than 2.7 wt.% of the upper sample. As presented in Figure 5c, SAT melts to form saturated sodium acetate solution at 80 °C [13]. The saturated sodium acetate solution and CH3COONa have densities of 1280 kg/m3 and 1517 kg/m3 [13]. Therefore, CH3COONa sinks to the bottom owing to higher density when SAT/5 wt.% DSP is in a molten state, leading to aggregate at the lower layer and the formation of an interface between the sediment and liquid phase.
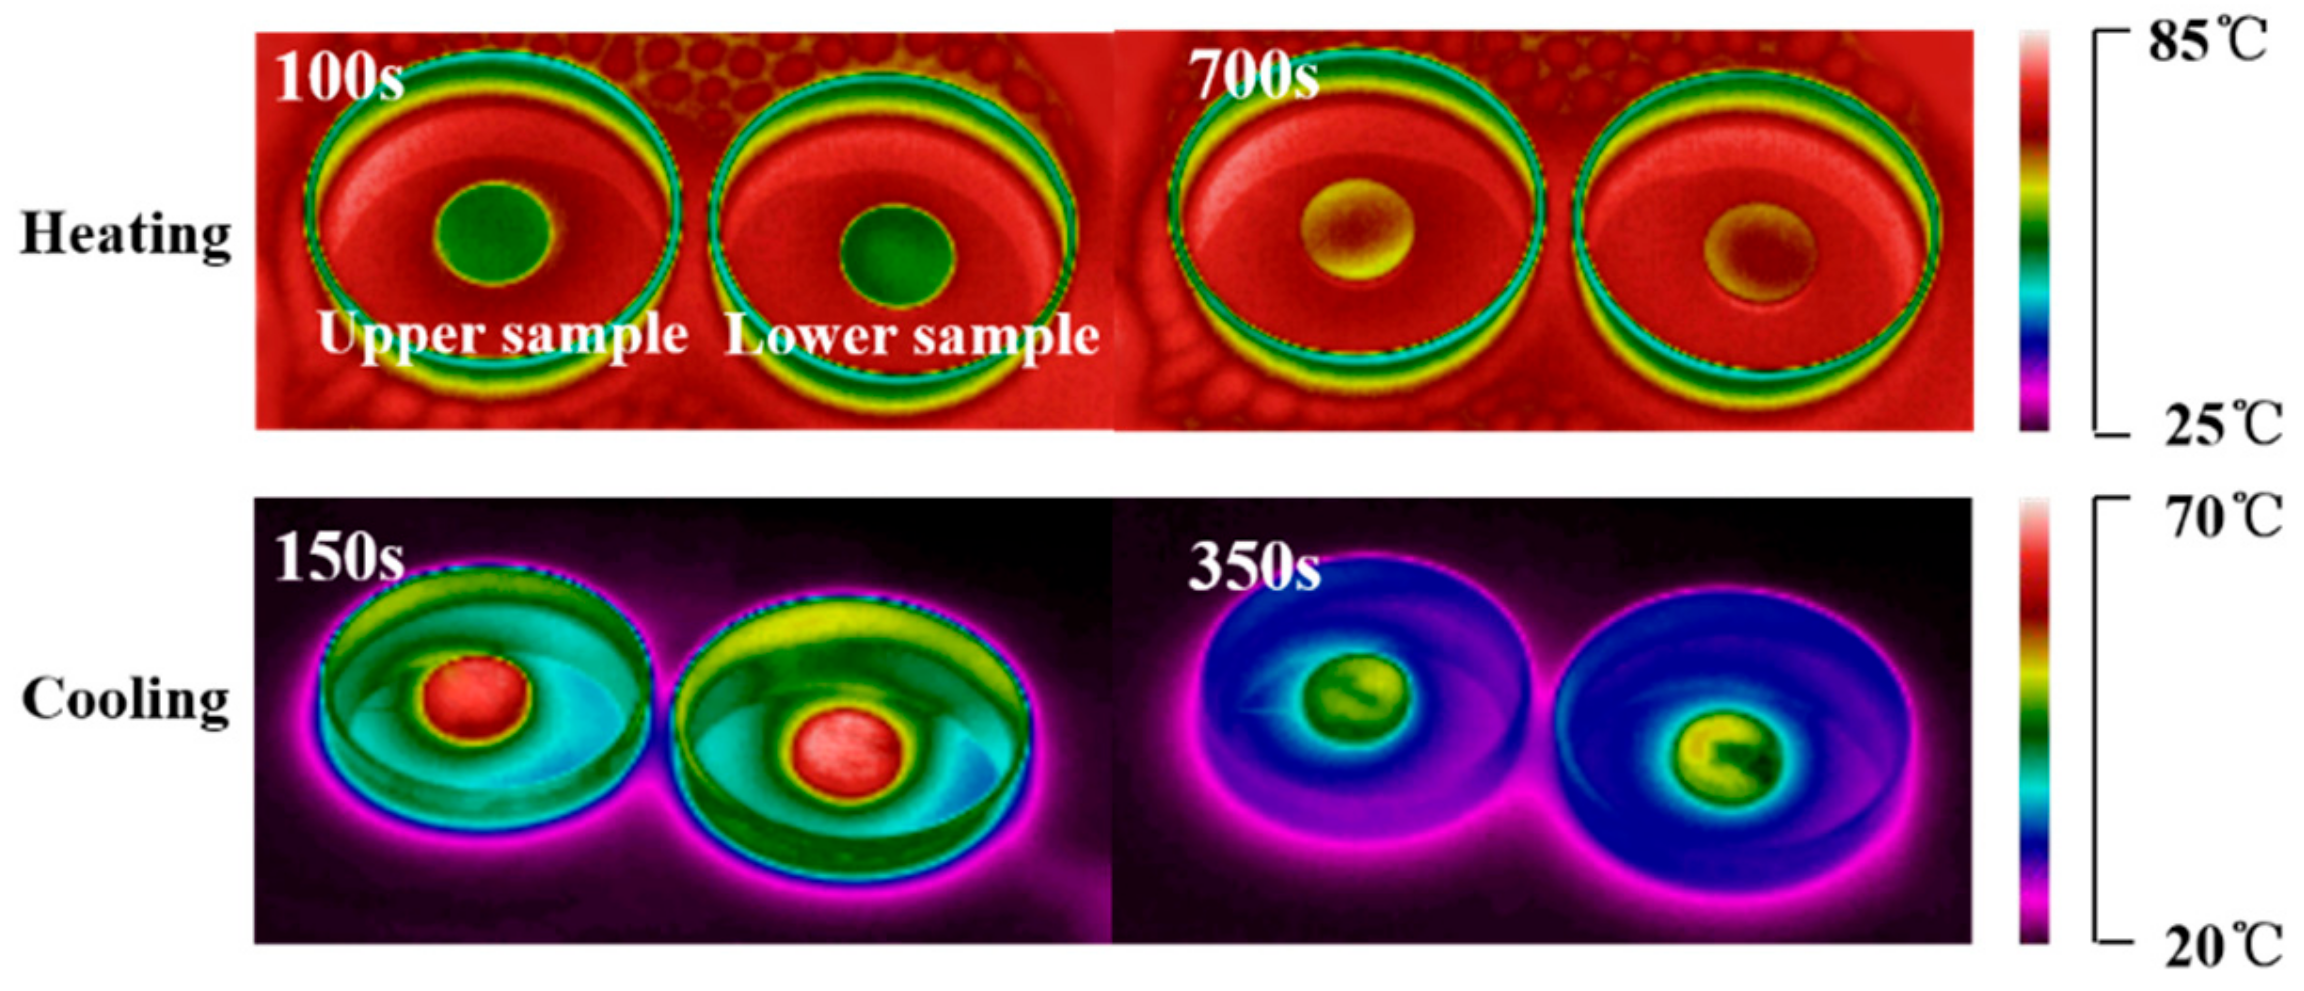
The temperature–time curves (Figure 5d) and temperature-distribution images (Figure 6) of upper and lower samples of SAT/5 wt.% DSP were obtained using an infrared thermal camera. As shown in Figure 5d, the temperature-time curves of the upper and lower samples have two temperature plateaus around 55–58 °C, which represent thermal energy storage and release in the form of latent heat. The phase change endothermic time of the lower sample is only 150s, but 340s of that for the upper sample. The shorter phase change endothermic time of the lower sample is due to the fact that it only contains 53.2 wt.% SAT. It is worth noting that the phase change of lower sample firstly occurs when the heating time is 25s, because its sensible heat is lower than that of the upper sample. When the heating time is 350s, the temperature of the upper sample is 58 °C indicating that the phase change is still under way, while the lower sample has ended the phase change process and its temperature reaches to 77 °C. It can be inferred that the latent heat of SAT/5 wt.% DSP decreases by 22.44%, which is because 24.1 wt.% CH3COONa without heat storage capacity aggregates at the lower layer.

3.3. The Analysis of Inhibiting Latent Heat Reduction

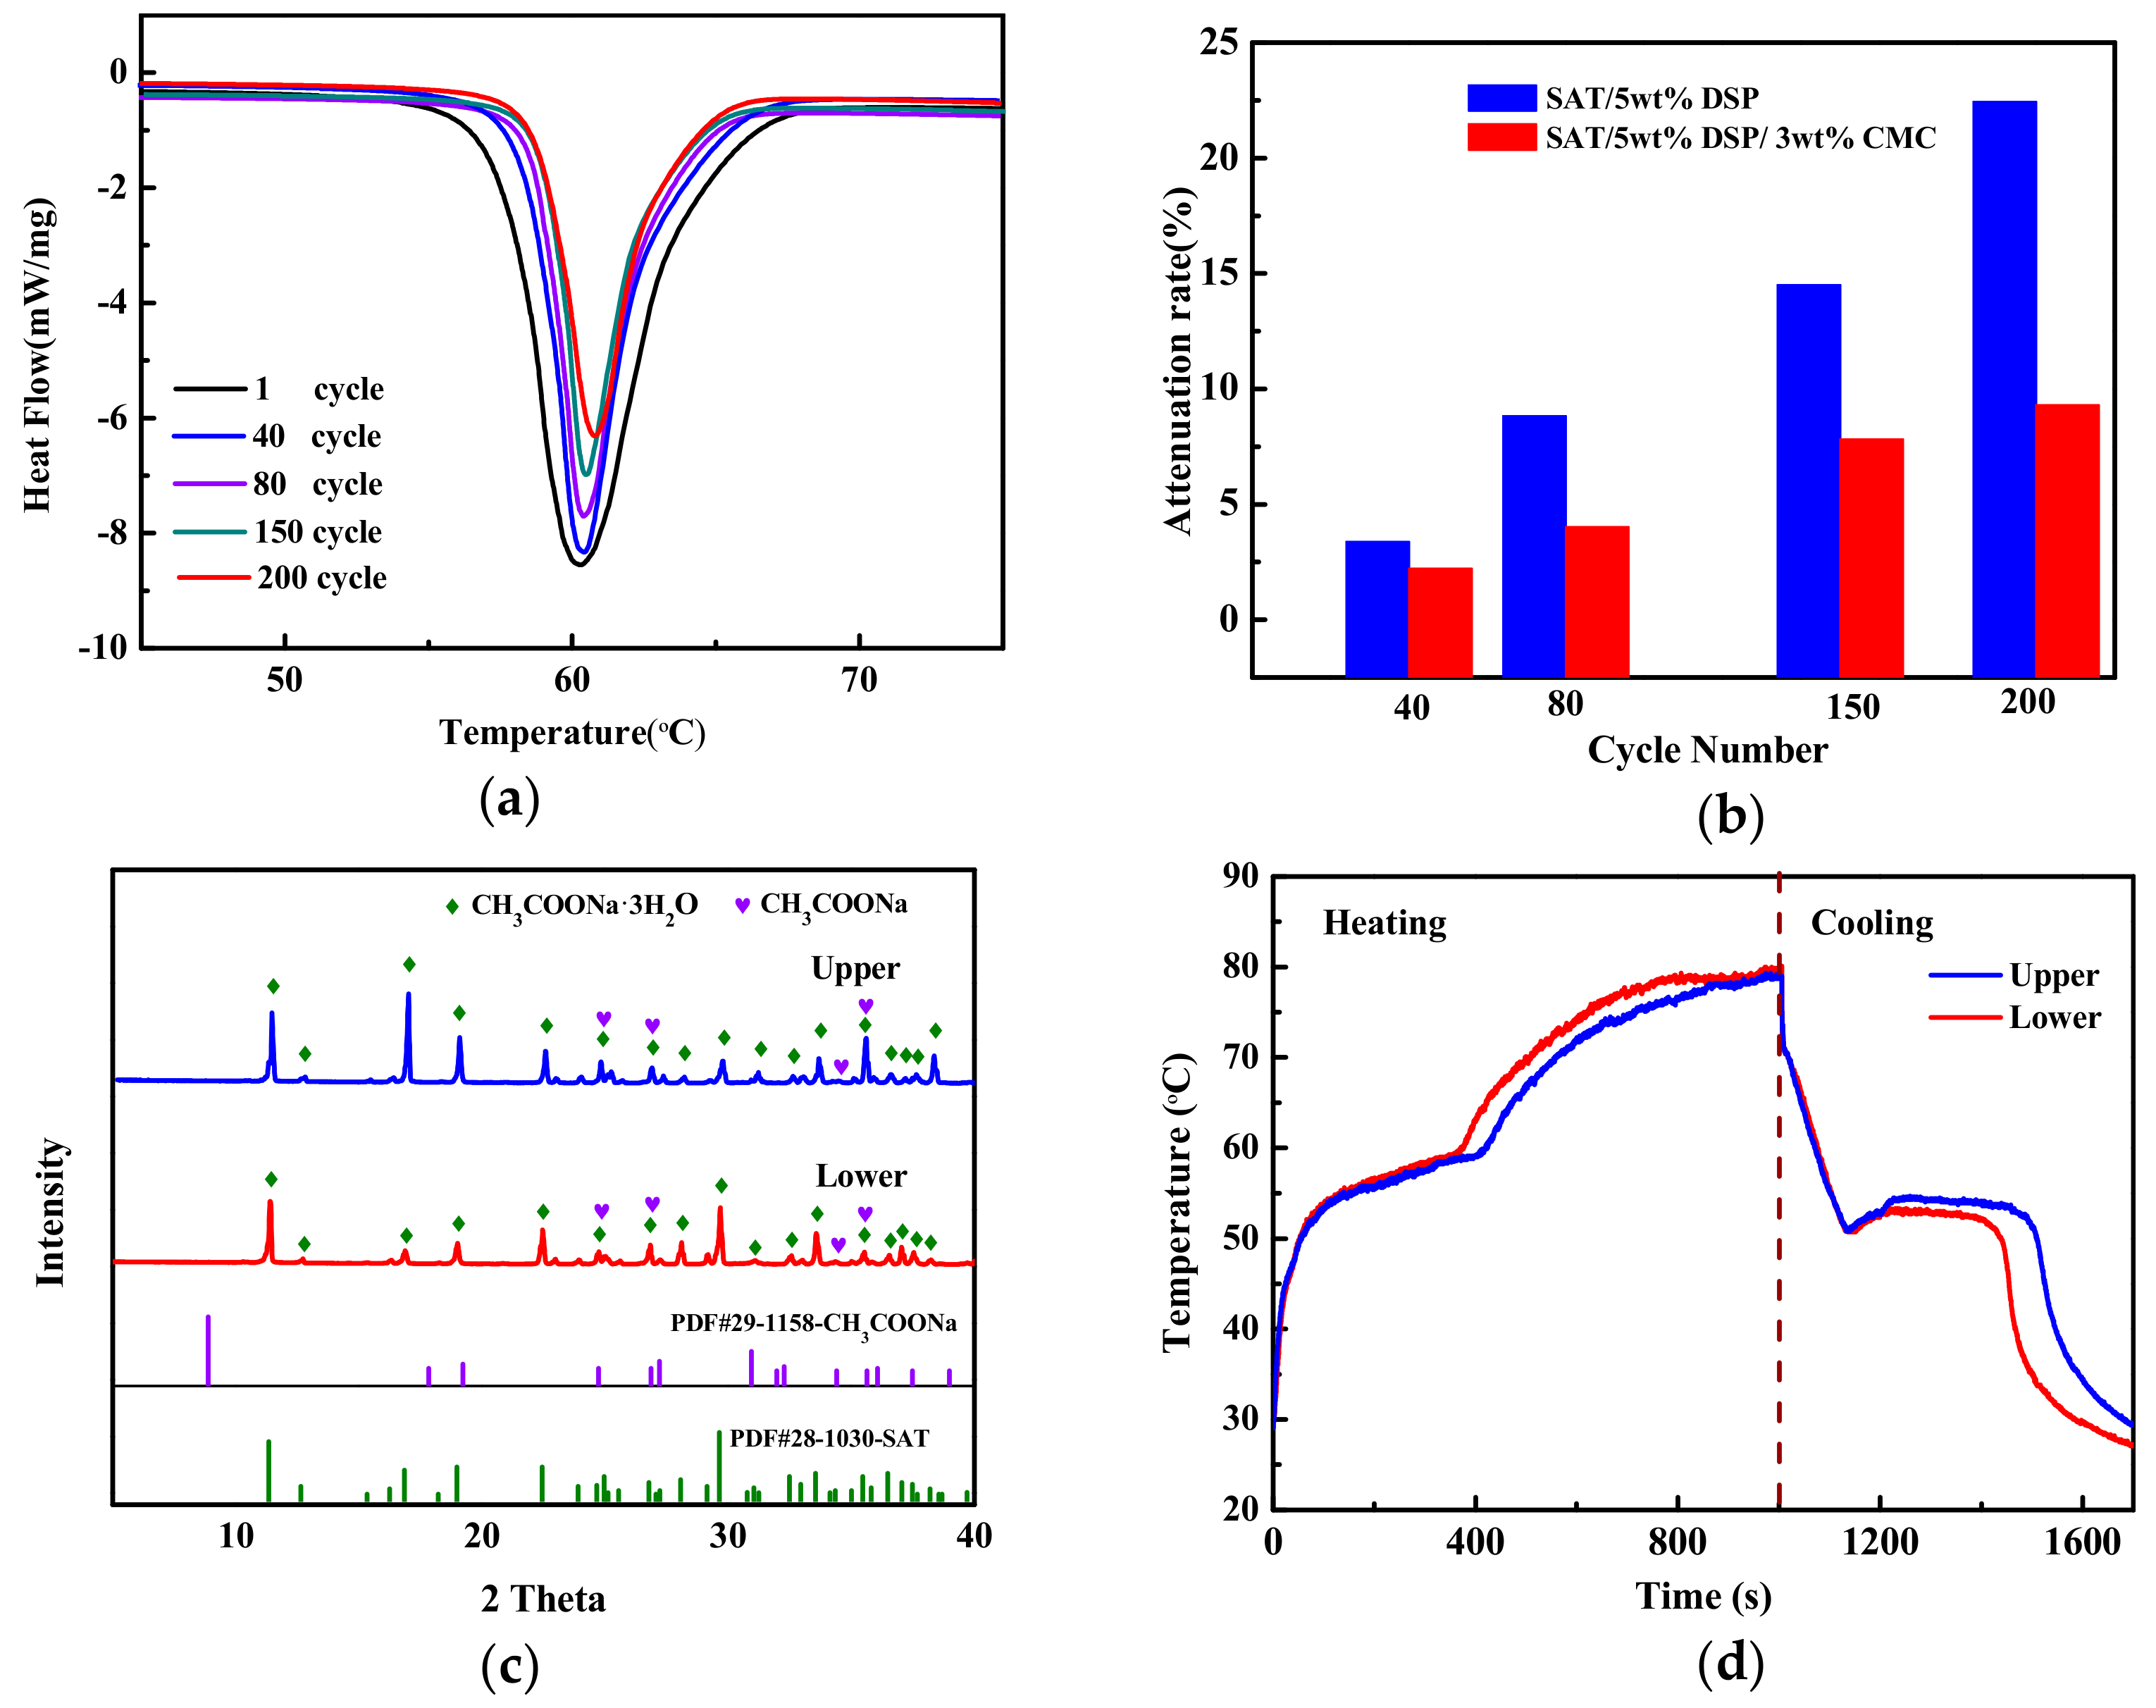
The DSC measurements of SAT/5 wt.% DSP/3 wt.% CMC during different heating and cooling cycles was shown in Figure 7a. The areas of concave peak decrease with the increase of the cycle number of SAT/5 wt.% DSP/3 wt.% CMC. The extent of latent heat reduction of SAT/5 wt.% DSP/3 wt.% CMC was calculated by formula (2) as presented in Figure 7b. The 3 wt.% CMC reduces the extent of latent heat reduction of SAT/5 wt.% DSP from 22.44% to 9.29%. The SAT/5 wt.% DSP/3 wt.% CMC was divided into two layers (the upper and lower samples) in the same way as that of SAT/5 wt.% DSP. Figure 7c represents the XRD patterns of upper and lower sample of SAT/5 wt.% DSP/3 wt.% CMC, and the characteristic peaks of SAT at 11.3°, 16.8°, and 29.58° (2 Theta) are observed in the XRD patterns of the upper and lower samples. The CH3COONa shows weak peaks at 24.73°, 26.86°, 34.41°, and 35.62° (2 Theta) in the XRD patterns of the upper and lower samples. The results indicate that there is slight phase separation in SAT/5 wt.% DSP/3 wt.% CMC.
The temperature–time curves and temperature-distribution images of upper and lower samples of SAT/5 wt.% DSP/3 wt.% CMC are shown in Figure 7d and Figure 8, respectively. As illustrated in Figure 7d, there are two temperature plateaus with only slight changes on the temperature–time curves of upper and lower samples of SAT/5 wt.% DSP/3 wt.% CMC. This indicates that the phase change endothermic time of the lower sample of SAT/5 wt.% DSP/3 wt.% CMC is consistent with that of the upper, which is attributed to the uniform composition of the upper and lower samples. It can be concluded that 3 wt.% CMC can effectively slow down the extent of latent heat reduction of SAT by inhibiting the phase separation.
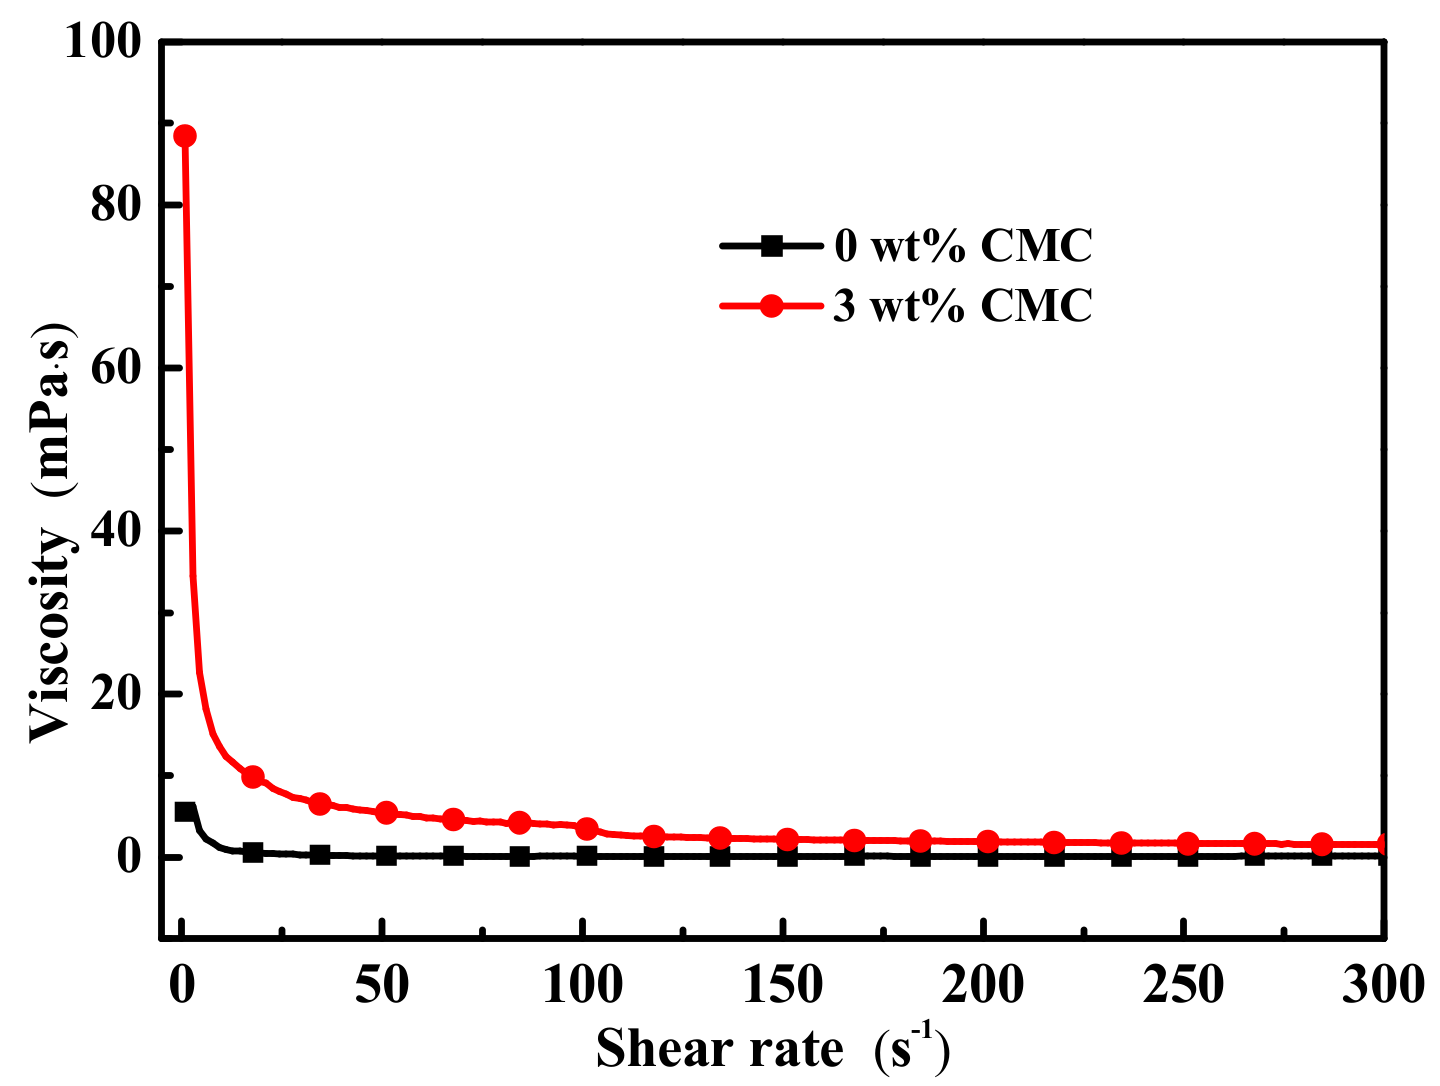
To further investigate the mechanism of thickeners’ inhibition, the viscosity of the sample was measured. The viscosity curves of SAT/5 wt.% DSP and SAT/5 wt.% DSP/3 wt.% CMC after 200 heating and cooling cycles at 80 °C are shown in Figure 9. The viscosities of SAT/5 wt.% DSP and SAT/5 wt.% DSP/3 wt.% CMC are 6.02 mPa·s and 88.50 mPa·s, respectively. The relationship between the Stokes settling velocity of anhydrous salt and viscosity of solution can be evaluated by Stokes law [35]:
V = D ρ p ρ b r 2 η
where V is the Stokes settling velocity of anhydrous salt, D is constant, ρp and ρb represent anhydrous salt density and solution density, r is radius of anhydrous salt, and η is the viscosity of solution.
According to the Stokes law, the Stokes settling velocity of anhydrous salt is inversely proportional to the viscosity of solution. Provided that r of CH3COONa in SAT/5 wt.% DSP and SAT/5 wt.% DSP/3 wt.% CMC does not change. The Stokes settling velocity of CH3COONa in SAT/5 wt.% DSP/3 wt.% CMC is 0.0027r2 m/s, which is 8.07 times lower than 0.0218r2 m/s of SAT/5 wt.% DSP. During the heating process of SAT/5 wt.% DSP, CH3COONa rapidly settles to the bottom on account of low viscosity and forms a solid-liquid interface, which prevents the combination of CH3COONa below the interface with the liquid phase in cooling process. When SAT/5 wt.% DSP is cooling, the CH3COONa under the interface does not undergo phase change. During certain heating and cooling cycles, as the heating and cooling cycle increases, more and more CH3COONa without heat storage capacity will settle down, resulting in the reduction of latent heat. Inversely, the settling velocity of CH3COONa is significantly reduced due to the higher viscosity during the heating process of SAT/5 wt.% DSP/3 wt.% CMC, so that a large proportion of CH3COONa can’t aggregate at the lower layer and continue to phase change in cooling process. Thus, its latent heat is relative reduced.

4. Conclusions

The mechanisms of SAT latent heat reduction process and the thickeners’ inhibition were investigated. SAT modified by 5 wt.% disodium hydrogen phosphate dodecahydrate (SAT/5 wt.% DSP) and further modified by 3 wt.% carboxymethyl cellulose (SAT/5 wt.% DSP/3 wt.% CMC) were prepared and 200 heating and cooling cycles were carried out. For the SAT/5 wt.% DSP, the results showed that 24.1 wt.% CH3COONa aggregated at the lower layer of SAT/5 wt.% DSP, forming a solid-liquid interface and preventing the phase change of CH3COONa under the interface during the cooling process. As a result, the latent heat of SAT/5 wt.% DSP decreased with the increase of the heating and cooling cycles. In contrast, the phase composition of SAT/5 wt.% DSP/3 wt.% CMC was more homogeneous. The viscosity of SAT/5 wt.% DSP/3 wt.% CMC was 14 times higher than that of SAT/5 wt.% DSP, and the settling velocity of CH3COONa in SAT/5 wt.% DSP/3 wt.% CMC reduced by 8.07 times. Therefore, a large proportion of CH3COONa interacted with liquid phase during cooling process, which slow down the extent of latent heat reduction.

Author Contributions

Conceptualization, L.W. and J.L.; methodology, L.W., H.W. and Y.Z.; validation, J.L.; formal analysis, L.W., H.W. and Y.Z.; investigation, L.W., Y.G. and J.Z.; data curation, L.W.; writing—original draft preparation, L.W.; writing—review and editing, L.W., Y.Z., L.G. and S.F.; supervision, J.L. and X.W.; project administration, J.L., X.W. and L.G.; funding acquisition, J.L. All authors have read and agreed to the published version of the manuscript.

Funding

This research was funded by the National Key Research and Development Program of China (2016YFC0700905 and 2017YFC0703200) and Transformational Technologies for Clean Energy and Demonstration Strategic Priority Research Program of the Chinese Academy of Sciences (Grant No. XDA21070302).

Conflicts of Interest

The authors declare no conflict of interest.

References

  1. Shchukina, E.M.; Graham, M.; Zheng, Z.; Shchukin, D.G. Nanoencapsulation of phase change materials for advanced thermal energy storage systems. Chem. Soc. Rev. 2018, 47, 4156–4175. [Google Scholar] [CrossRef] [Green Version]
  2. Zalba, B.; Marín, J.M.A.; Cabeza, L.F.; Mehling, H. Review on thermal energy storage with phase change: materials, heat transfer analysis and applications. Appl. Therm. Eng. 2003, 23, 251–283. [Google Scholar] [CrossRef]
  3. Lin, Y.; Jia, Y.; Alva, G.; Fang, G. Review on thermal conductivity enhancement, thermal properties and applications of phase change materials in thermal energy storage. Renew. Sustain. Energy Rev. 2018, 82, 2730–2742. [Google Scholar] [CrossRef]
  4. Pandey, A.K.; Hossain, M.S.; Tyagi, V.V.; Abd Rahim, N.; Selvaraj, J.A.L.; Sari, A. Novel approaches and recent developments on potential applications of phase change materials in solar energy. Renew. Sustain. Energy Rev. 2018, 82, 281–323. [Google Scholar] [CrossRef]
  5. Zhang, Y.; Li, X.; Li, J.; Ma, C.; Guo, L.; Meng, X. Solar-driven phase change microencapsulation with efficient Ti4O7 nanoconverter for latent heat storage. Nano Energy 2018, 53, 579–586. [Google Scholar] [CrossRef]
  6. Hohlein, S.; Konig-Haagen, A.; Bruggemann, D. Thermophysical characterization of MgCl2·6H2O, xylitol and erythritol as phase change materials (PCM) for latent heat thermal energy storage (LHTES). Materials 2017, 10, 444. [Google Scholar] [CrossRef] [PubMed] [Green Version]
  7. Miró, L.; Gasia, J.; Cabeza, L.F. Thermal energy storage (TES) for industrial waste heat (IWH) recovery: A review. Appl. Energy 2016, 179, 284–301. [Google Scholar] [CrossRef] [Green Version]
  8. Xu, H.; Romagnoli, A.; Sze, J.Y.; Py, X. Application of material assessment methodology in latent heat thermal energy storage for waste heat recovery. Appl. Energy 2017, 187, 281–290. [Google Scholar] [CrossRef]
  9. Qian, Z.; Shen, H.; Fang, X.; Fan, L.; Zhao, N.; Xu, J. Phase change materials of paraffin in h-BN porous scaffolds with enhanced thermal conductivity and form stability. Energy Build. 2018, 158, 1184–1188. [Google Scholar] [CrossRef]
  10. Jin, X.; Zhang, S.; Xu, X.; Zhang, X. Effects of PCM state on its phase change performance and the thermal performance of building walls. Build Env. 2014, 81, 334–339. [Google Scholar] [CrossRef]
  11. Fang, Y.; Ding, Y.; Tang, Y.; Liang, X.; Jin, C.; Wang, S.; Gao, X.; Zhang, Z. Thermal properties enhancement and application of a novel sodium acetate trihydrate-formamide/expanded graphite shape-stabilized composite phase change material for electric radiant floor heating. Appl. Therm. Eng. 2019, 150, 1177–1185. [Google Scholar] [CrossRef]
  12. Wang, H.; Guo, L.; Liu, K.; Song, Z.; Wu, L.; Fang, M.; Li, J. Investigation of magnesium nitrate hexahydrate based phase change materials containing nanoparticles for thermal energy storage. Mater. Res. Express 2019, 6, 105512. [Google Scholar] [CrossRef]
  13. Ma, Z.; Bao, H.; Roskilly, A.P. Study on solidification process of sodium acetate trihydrate for seasonal solar thermal energy storage. Sol. Energy Mater. Sol. Cells 2017, 172, 99–107. [Google Scholar] [CrossRef]
  14. Dannemand, M.; Johansen, J.B.; Furbo, S. Solidification behavior and thermal conductivity of bulk sodium acetate trihydrate composites with thickening agents and graphite. Sol. Energy Mater. Sol. Cells 2016, 145, 287–295. [Google Scholar] [CrossRef] [Green Version]
  15. Stritih, U.; Charvat, P.; Koželj, R.; Klimes, L.; Osterman, E.; Ostry, M.; Butala, V. PCM thermal energy storage in solar heating of ventilation air—Experimental and numerical investigations. Sustain. Cities. Soc 2018, 37, 104–115. [Google Scholar] [CrossRef]
  16. Kenisarin, M.; Mahkamov, K. Salt hydrates as latent heat storage materials: Thermophysical properties and costs. Sol. Energy Mater. Sol. Cells 2016, 145, 255–286. [Google Scholar] [CrossRef]
  17. Wang, H.; Chen, Y.; Li, J.; Guo, L.; Fang, M. Review of encapsulated salt hydrate core-shell phase change materials. Kona. Powder. Part. J 2020, 1, 2020010. [Google Scholar] [CrossRef] [Green Version]
  18. Jin, X.; Zhang, S.; Medina, M.A.; Zhang, X. Experimental study of the cooling process of partially-melted sodium acetate trihydrate. Energy Build. 2014, 76, 654–660. [Google Scholar] [CrossRef]
  19. Zhou, D.; Zhao, C.Y.; Tian, Y. Review on thermal energy storage with phase change materials (PCMs) in building applications. Appl. Energy 2012, 92, 593–605. [Google Scholar] [CrossRef] [Green Version]
  20. Pielichowska, K.; Pielichowski, K. Phase change materials for thermal energy storage. Prog. Mater. Sci 2014, 65, 67–123. [Google Scholar] [CrossRef]
  21. Beaupere, N.; Soupremanien, U.; Zalewski, L. Nucleation triggering methods in supercooled phase change materials (PCM), a review. Thermochim. Acta 2018, 670, 184–201. [Google Scholar] [CrossRef]
  22. Jin, X.; Medina, M.A.; Zhang, X.; Zhang, S. Phase-change characteristic analysis of partially melted sodium acetate trihydrate using DSC. Int. J. 2014, 35, 45–52. [Google Scholar] [CrossRef]
  23. Hu, P.; Lu, D.-J.; Fan, X.-Y.; Zhou, X.; Chen, Z.-S. Phase change performance of sodium acetate trihydrate with AlN nanoparticles and CMC. Sol. Energy Mater. Sol. Cells 2011, 95, 2645–2649. [Google Scholar] [CrossRef]
  24. Mao, J.; Dong, X.; Hou, P.; Lian, H. Preparation research of novel composite phase change materials based on sodium acetate trihydrate. Appl. Therm. Eng. 2017, 118, 817–825. [Google Scholar] [CrossRef]
  25. Garay Ramirez, B.M.L.; Glorieux, C.; San Martin Martinez, E.; Flores Cuautle, J.J.A. Tuning of thermal properties of sodium acetate trihydrate by blending with polymer and silver nanoparticles. Appl. Therm. Eng. 2014, 62, 838–844. [Google Scholar] [CrossRef]
  26. Cui, W.; Yuan, Y.; Sun, L.; Cao, X.; Yang, X. Experimental studies on the supercooling and melting/freezing characteristics of nano-copper/sodium acetate trihydrate composite phase change materials. Renew. Energy 2016, 99, 1029–1037. [Google Scholar] [CrossRef]
  27. He, Y.; Zhang, N.; Yuan, Y.; Cao, X.; Sun, L.; Song, Y. Improvement of supercooling and thermal conductivity of the sodium acetate trihydrate for thermal energy storage with α-Fe2O3 as addictive. J. Therm. Anal. Calorim 2018, 133, 859–867. [Google Scholar] [CrossRef]
  28. Kong, W.; Dannemand, M.; Johansen, J.B.; Fan, J.; Dragsted, J.; Englmair, G.; Furbo, S. Experimental investigations on heat content of supercooled sodium acetate trihydrate by a simple heat loss method. Sol. Energy 2016, 139, 249–257. [Google Scholar] [CrossRef] [Green Version]
  29. Cabeza, L.F.; Svensson, G.; Hiebler, S.; Mehling, H. Thermal performance of sodium acetate trihydrate thickened with different materials as phase change energy storage material. Appl. Therm. Eng. 2003, 23, 1697–1704. [Google Scholar] [CrossRef]
  30. Ryu, H.W.; Woo, S.W.; Shin, B.C.; Kim, S.D. Prevention of supercooling and stabilization of inorganic salt hydrates as latent heat storage materials. Sol. Energy Mater. Sol. Cells 1992, 27, 161–172. [Google Scholar] [CrossRef]
  31. Dannemand, M.; Dragsted, J.; Fan, J.; Johansen, J.B.; Kong, W.; Furbo, S. Experimental investigations on prototype heat storage units utilizing stable supercooling of sodium acetate trihydrate mixtures. Appl. Energy 2016, 169, 72–80. [Google Scholar] [CrossRef] [Green Version]
  32. Li, X.; Zhou, Y.; Nian, H.; Zhang, X.; Dong, O.; Ren, X.; Zeng, J.; Hai, C.; Shen, Y. Advanced nanocomposite phase change material based on calcium chloride hexahydrate with aluminum oxide nanoparticles for thermal energy storage. Energy Fuel 2017, 31, 6560–6567. [Google Scholar] [CrossRef]
  33. Ghule, A.; Bhongale, C.; Chang, H. Monitoring dehydration and condensation processes of Na2HPO4·12H2O using thermo-Raman spectroscopy. Spectrochim. Acta. A 2003, 59, 1529–1539. [Google Scholar] [CrossRef]
  34. Huang, J.; Wang, T.; Zhu, P.; Xiao, J. Preparation, characterization, and thermal properties of the microencapsulation of a hydrated salt as phase change energy storage materials. Thermochim. Acta 2013, 557, 1–6. [Google Scholar] [CrossRef]
  35. Calbo, L.J. Comprehensive Collection of Coating Additives; Shanghai Science and Technology Academic Press: Shanghai, China, 2000; pp. 336–338. [Google Scholar]
Figure 1. The equipment of heat storage capacity determination.
Materials 13 00584 g001
Figure 2. (a) Cooling curves and (b) supercooling degrees of SAT modified by different contents of DSP.
Materials 13 00584 g002
Figure 3. (a) DSC melting curves, (b) latent heat change curve and reduction extent of SAT/5 wt.% DSP at different cycles.
Materials 13 00584 g003
Figure 4. (a) The original sample of SAT/5wt%DSP and (b) the sample cycled 200 times; (c) SEM image of lower sample of SAT/5wt%DSP; (d) the profile of SAT/5wt%DSP.
Materials 13 00584 g004
Figure 5. (a) XRD patterns and (b) semi-quantitative analyses of upper and lower samples of SAT/5 wt.% DSP; (c) Phase diagram of sodium acetate-water system [13]; (d) Temperature–time curves of upper and lower samples of SAT/5 wt.% DSP.
Materials 13 00584 g005
Figure 6. Infrared ray (IR) images of upper and lower samples of SAT/5 wt.% DSP during heating and cooling process.
Materials 13 00584 g006
Figure 7. (a) DSC melting curves of SAT/5 wt.% DSP/3 wt.% CMC and (b) the extent of latent heat reduction of SAT/5 wt.% DSP and SAT/5 wt.% DSP/3 wt.% CMC at different cycles; (c) XRD patterns and (d) temperature–time curves of upper and lower samples of SAT/5 wt.% DSP/3 wt.% CMC.
Materials 13 00584 g007
Figure 8. IR images of upper and lower samples of SAT/5 wt.% DSP/3 wt.% CMC during heating and cooling process.
Materials 13 00584 g008
Figure 9. Viscosity curves of SAT/5 wt.% DSP and SAT/5 wt.% DSP/3 wt.% CMC at 80°C.
Materials 13 00584 g009
Table 1. Samples composition of SAT/DSP/CMC.
SamplesSAT (g)DSP (g)CMC (g)The mass ratio of SAT:DSP:CMC
1500.501:0.01:0
2501.501:0.03:0
3502.501:0.05:0
4503.501:0.07:0
5505.001:0.1:0
6502.51.51:0.05:0.03
Table 2. The five DSC test results of the SAT/5 wt.% DSP.
Test Frequency40 Cycle (J/g)80 Cycle (J/g)150 Cycle (J/g)200 Cycle (J/g)
1251.84236.15220.73199.65
2253.67248.23233.59202.37
3262.98239.82222.64203.28
4259.15245.83228.76208.43
5250.51235.87225.08212.22