1. Introduction
Concrete is a widely used building material in engineering constructions [
1]. With the large-scale construction of long-span bridges, super-high-rise buildings, high-grade highways, large-scale water conservancy facilities, and cross harbor tunnels, concrete materials are endowed with higher expectations [
2]. More problems have been caused by traditional concrete materials, such as the crack propagation inside concrete materials and the lack of durability [
1]. Therefore, it is crucial to optimize the mix proportion and improve the compressive strength of concrete [
3]. Recently, researchers have added nanofiber additives in the concrete mixing process to optimize the performance of concrete.
Cementitious materials are becoming increasingly important for the future of the automated building industry [
4]. Related research results indicated that cementitious materials work against environmental pollution by minimizing the emission of CO
2, other pollutant gases and waste dust, exhibit important feasibility and application prospects, and may become an appropriate substitute for traditional cement mortar in the future [
5]. Some researchers have produced some new materials to replace the traditional cement totally or in part, such as concrete incorporating ferronickel slag (FNS) as a replacement of natural sand [
6] and engineered cementitious composite layered reinforced concrete beams [
7]. Simultaneously, descriptions of fibers in cementitious composites containing polydispersed hollow and core–shell microparticles [
8], waste recycled hollow glass microspheres [
9], multiwalled carbon nanotubes [
10], nano reservoir silts [
11], SiO
2 nanoparticles [
12], palm oil fuel ash [
13], inclined steel fiber [
14], cellulose nanocrystals [
15], cobalt ferrite and nanoparticles [
16] are abundant. Polyvinyl alcohol (PVA) fiber-reinforced engineering cementitious composite is a kind of new high-performance cementitious material which exhibits the features of strain hardening, multiple-cracking high durability [
17], and narrow crack width [
18,
19,
20]. Additionally, it exhibits the characteristics of multislit cracking and strain hardening [
21] and possesses a broad application prospect [
22]. In recent years, PVA fiber-reinforced engineering cementitious composite has been extensively studied [
23]. Li and Gao discussed the multiple effects of the fluidity, microstructure, and bending performance of cementitious composites with high-toughness reinforced by nano-SiO
2 and hybrid fiber [
24]. The results demonstrated that composites incorporated with 1.4% steel fibers and 2.5% PVA fibers exhibited good flexural performance. Qiu and Lim conducted an experimental study on the fatigue strength degradation of micro-PVA fiber in a cement matrix [
25]. They discovered that the fiber embedded in the cement matrix reduced the in-situ strength of the fiber, and changed the fatigue properties of the fiber. Ranjbarian and Mechtcherine established a pre pull-out locking model for PVA microfibers embedded in a cementitious matrix [
26].
Owing to the high nonlinearity and strong generalization ability of the neural network model, it is extensively used in the classification and prediction of complicated models. Recently, neural networks have been widely applied to the research and prediction of concrete material properties to study the nonlinear and complex relationships between concrete material properties and mix proportion. A large number of studies indicated that the nonlinear mapping relationship constructed using neural networks could deliver the performance of concrete materials, and neural network could be used to optimize the mix proportion of concrete materials. Tanja and Ivana processed a database compiled based on their experimental results of recycled brick aggregate concrete using neural network to obtain a reliable prediction, and they proposed an optimized quantitative model for proportioning concrete mixtures [
27]. Haissam and Sudhir developed simple multilayer perceptron structure of Artificial Neural Network models using Marshall mix design data, and the models were called by a non-linear constrained genetic algorithm to optimize the asphalt mix, so as to achieve the prediction and optimization of asphalt mixture composition [
28]. On the basis of a time-series model, Wang created an artificial neural network model of data mining to access the influence of cement curing stage on pozzolanic activity [
29] and subsequently predicted the pozzolanic activity. Based on a series of tests, Ji and Lin established a prediction model of concrete strength and slump based on an artificial neural network [
30]. Through the reverse derivation of the two prediction models, the calculation models to obtain the equivalent ratio of cement to water and the average paste thickness were established. The concrete designed using this algorithm had small cement and water content, more excellent durability, and higher economic and ecological benefits. Qi and Fourier used the neural network and particle swarm optimization algorithm to predict the unconfined compressive strength of cement paste filling [
31], and the results indicated that the optimal artificial neural network model was highly accurate for the prediction of cemented paste backfill strength. Jian and Roy investigated the debonding behavior of high-performance fiber concrete and traditional concrete under a direct shear load and established a robust machine learning model to calculate the shear debonding strength of the concrete with influence parameters [
32], which should corroborate the validity of the model in describing the debonding response of the concrete.
With the development of deep research on nanoparticles and the gradual reduction in manufacturing costs for nanoparticles [
33], nanoparticles have been gradually extended to the application of civil engineering owing to their characteristic nano effects [
34]. Simultaneously, fiber-reinforced composites are also widely used in the construction and building industry, such as plastic fibers as the only reinforcement for flat suspended slabs [
35] and polyolefin fiber-reinforced concrete for infrastructure applications [
36,
37]. However, currently, systematic studies on PVA fiber-reinforced cementitious composites containing nano-SiO
2 are very rare. Only a few studies reported the model establishment, prediction, and optimization for the mix proportions and compressive strength of PVA fiber-reinforced cementitious composites containing nano-SiO
2. Besides, the mix proportion optimization of composite materials is generally determined experimentally, which resulted in a large amount of manpower and material resource consumption [
38]. To reduce test consumption, improve test productiveness, and rapidly determine the best mix proportion of the composites, it is crucial to establish a suitable model to predict the compressive strength. In this study, the BP neural network will be used to propose a method for compressive strength prediction of PVA fiber-reinforced cementitious composites containing nano-SiO
2. The BP neural network has been proven to exhibit a strong nonlinear mapping ability, and it can be extensively used in the construction and prediction of complex nonlinear models [
39]. Besides, orthogonal test was conducted to establish a precise BP neural network, which can avoid the disadvantages of a neural network that cannot converge and fall into the local optimal solution and contains a certain reference value. Simultaneously, the genetic algorithm was applied to optimize the mix proportion of PVA fiber-reinforced cementitious composites containing nano-SiO
2. The results of this study can effectively guide the mix proportion test of composite materials, reduce the human and material consumption, and improve the test efficiency.
2. Preliminary Processing and Analysis of Original Data
When executing a neural network, a certain number of training samples must be used; those used in this study were from Reference [
40] and were processed as shown in
Table 1 below. The mixtures 1–12 were prepared to study the influence of PAV fiber content on the compressive strength of cementitious composites. The mixtures 12–15 were prepared to study the influence of nanoparticle content on compressive strength of cementitious composites. Mixtures 15–18 were prepared to study the influence of quartz sand diameter on the compressive strength of cementitious composites. Mixture 19 was taken as the control mixture.
The concrete function of normalization is to induce the statistical distribution of unified samples. If the original data are used for analysis, the singular data in the sample will interfere with the test, which may increase the network training time or cause a convergence failure in the network. To avoid the phenomenon above and eliminate the calculation error caused by different data units and the system error caused by the difference in factor magnitude, the sample data shall be normalized [
41] before further data analysis and processing, as follows:
where,
is the content of component
in the mix proportion
;
is 1–19,
is 1–7, which corresponds to water, cement, quartz sand, fly ash, PVA fiber, nanoparticles, water reducing agent, respectively;
is the compressive strength corresponding to the mix proportion
;
is the minimum compressive strength of 19 composite specimens with different mix proportion;
is the maximum compressive strength of 19 composite specimens with different mix proportion;
is the normalized compressive strength of composite
.
According to the procedures shown in
Figure 1, a multiple linear regression model [
42] was built for the connection between the composite’s mix proportion and its compressive strength, based on the stepwise regression method, which was obtained as follows:
where,
is the normalized cement dosage;
is the amount of quartz sand after normalization;
is the amount of PVA fiber after normalization.
Utilizing the obtained linear regression model, the prediction results of the last four groups of data in
Table 1 are presented in
Table 2 below. From the prediction results, it can be perceived that the prediction results of the linear regression model for the compressive strength of PVA fiber-reinforced cementitious composites containing nano-SiO
2 exhibits a large deviation.
Pearson correlation analysis [
43] and variance analysis were performed to analyze the compressive strength of the composites obtained from the linear regression equation above and the actual compressive strength to assess the degree of interdependence between the two variables. Results from the Pearson correlation analysis are presented in
Table 3, and the results of the variance analysis of the regression equation are presented in
Table 4. As shown in
Table 3, the conspicuousness is 0.652, which is a moderate correlation between 0.5 and 0.8 [
44,
45]. Therefore, according to the Pearson correlation analysis, the significance of this linear regression model is moderate. The variance analysis shown in
Table 4 shows that the significance P > 0.05, i.e., when the error is 0.05 [
46], no significant difference appears between the predicted and actual compressive strength values.
In general, when applying the linear regression method to predict the compressive strength of composite materials, many factors affect the compressive strength. Owing to the complex relationship between mix proportion and compressive strength, the linear regression method cannot reflect the relationship between mix proportion and compressive strength well enough to accurately predict the compressive strength of PVA fiber cementitious composites containing nano-SiO2.
To further prove the superiority of neural network, a quadratic multiple regression process is established as follows:
where,
is the normalized cement dosage;
is the amount of quartz sand after normalization;
is the amount of PVA fiber after normalization;
is the amount of Nano-SiO
2 after normalization.
As shown in
Table 5 and
Table 6, the fitting result of the quadratic nonlinear regression equation is better than that of linear equation, but the fitting effect is still general, and the prediction error is large, which is not suitable for prediction and optimization. Hence, the BP neural network was used to construct a nonlinear mapping relationship to predict the compressive strength of PVA fiber-reinforced cementitious composites.
4. Model Parameter Optimization and Validation
4.1. Parameter Optimization
Based on the previous section, we can obtain the effect of each parameter change on the model and ultimately determine the best value of each parameter through range analysis, which can be determined in
Table 12 and expressed as follows:
where
is the number of tests performed at a certain level;
is the result of the test conducted at level
;
is the influence factor;
is the number of test parameters; and
is the test parameter number.
The results of range analysis reveal that the larger the range, the more significant is the parameter, which illustrates that the number of neurons in the hidden layer is the most remarkable. Other factors, including the learning rate, number of display intervals, and momentum factors affect the experiment results, whose degrees of effect are almost the same, which is consistent with the results of variance analysis.
According to the principle that the smaller the parameter value, the higher the utilization rate of the neural network and the better is the performance, when the parameter change does not significantly affect the model, the factor level value with the smaller performance index should be selected. Meanwhile, although the interval times, learning rate, mean square error, and momentum factor have little effect on the test results, their interactions impose definite effects on the test results. Therefore, the value should be selected such that its effect on the test results should be reduced to obtain more accurate test results and a higher degree of model fitting.
Combined with the analysis of range and variance, the training times and number of neurons in the hidden layer are significant when they function individually, whereas the number of neurons in the hidden layer, learning rate, and momentum factor are significant when they interact with each other. Meanwhile, the mean square error and number of display intervals are relatively small. Considering the operation performance of the neural network, the best parameter combination of the BP neural network is obtained: Training times 100 (Level 1), hidden layer neurons 2 (Level 1), mean square error 0.001 (level), learning rate 0.5006 (Level 2), display interval times 52 (Level 2), and momentum factor 0.503 (Level 2).
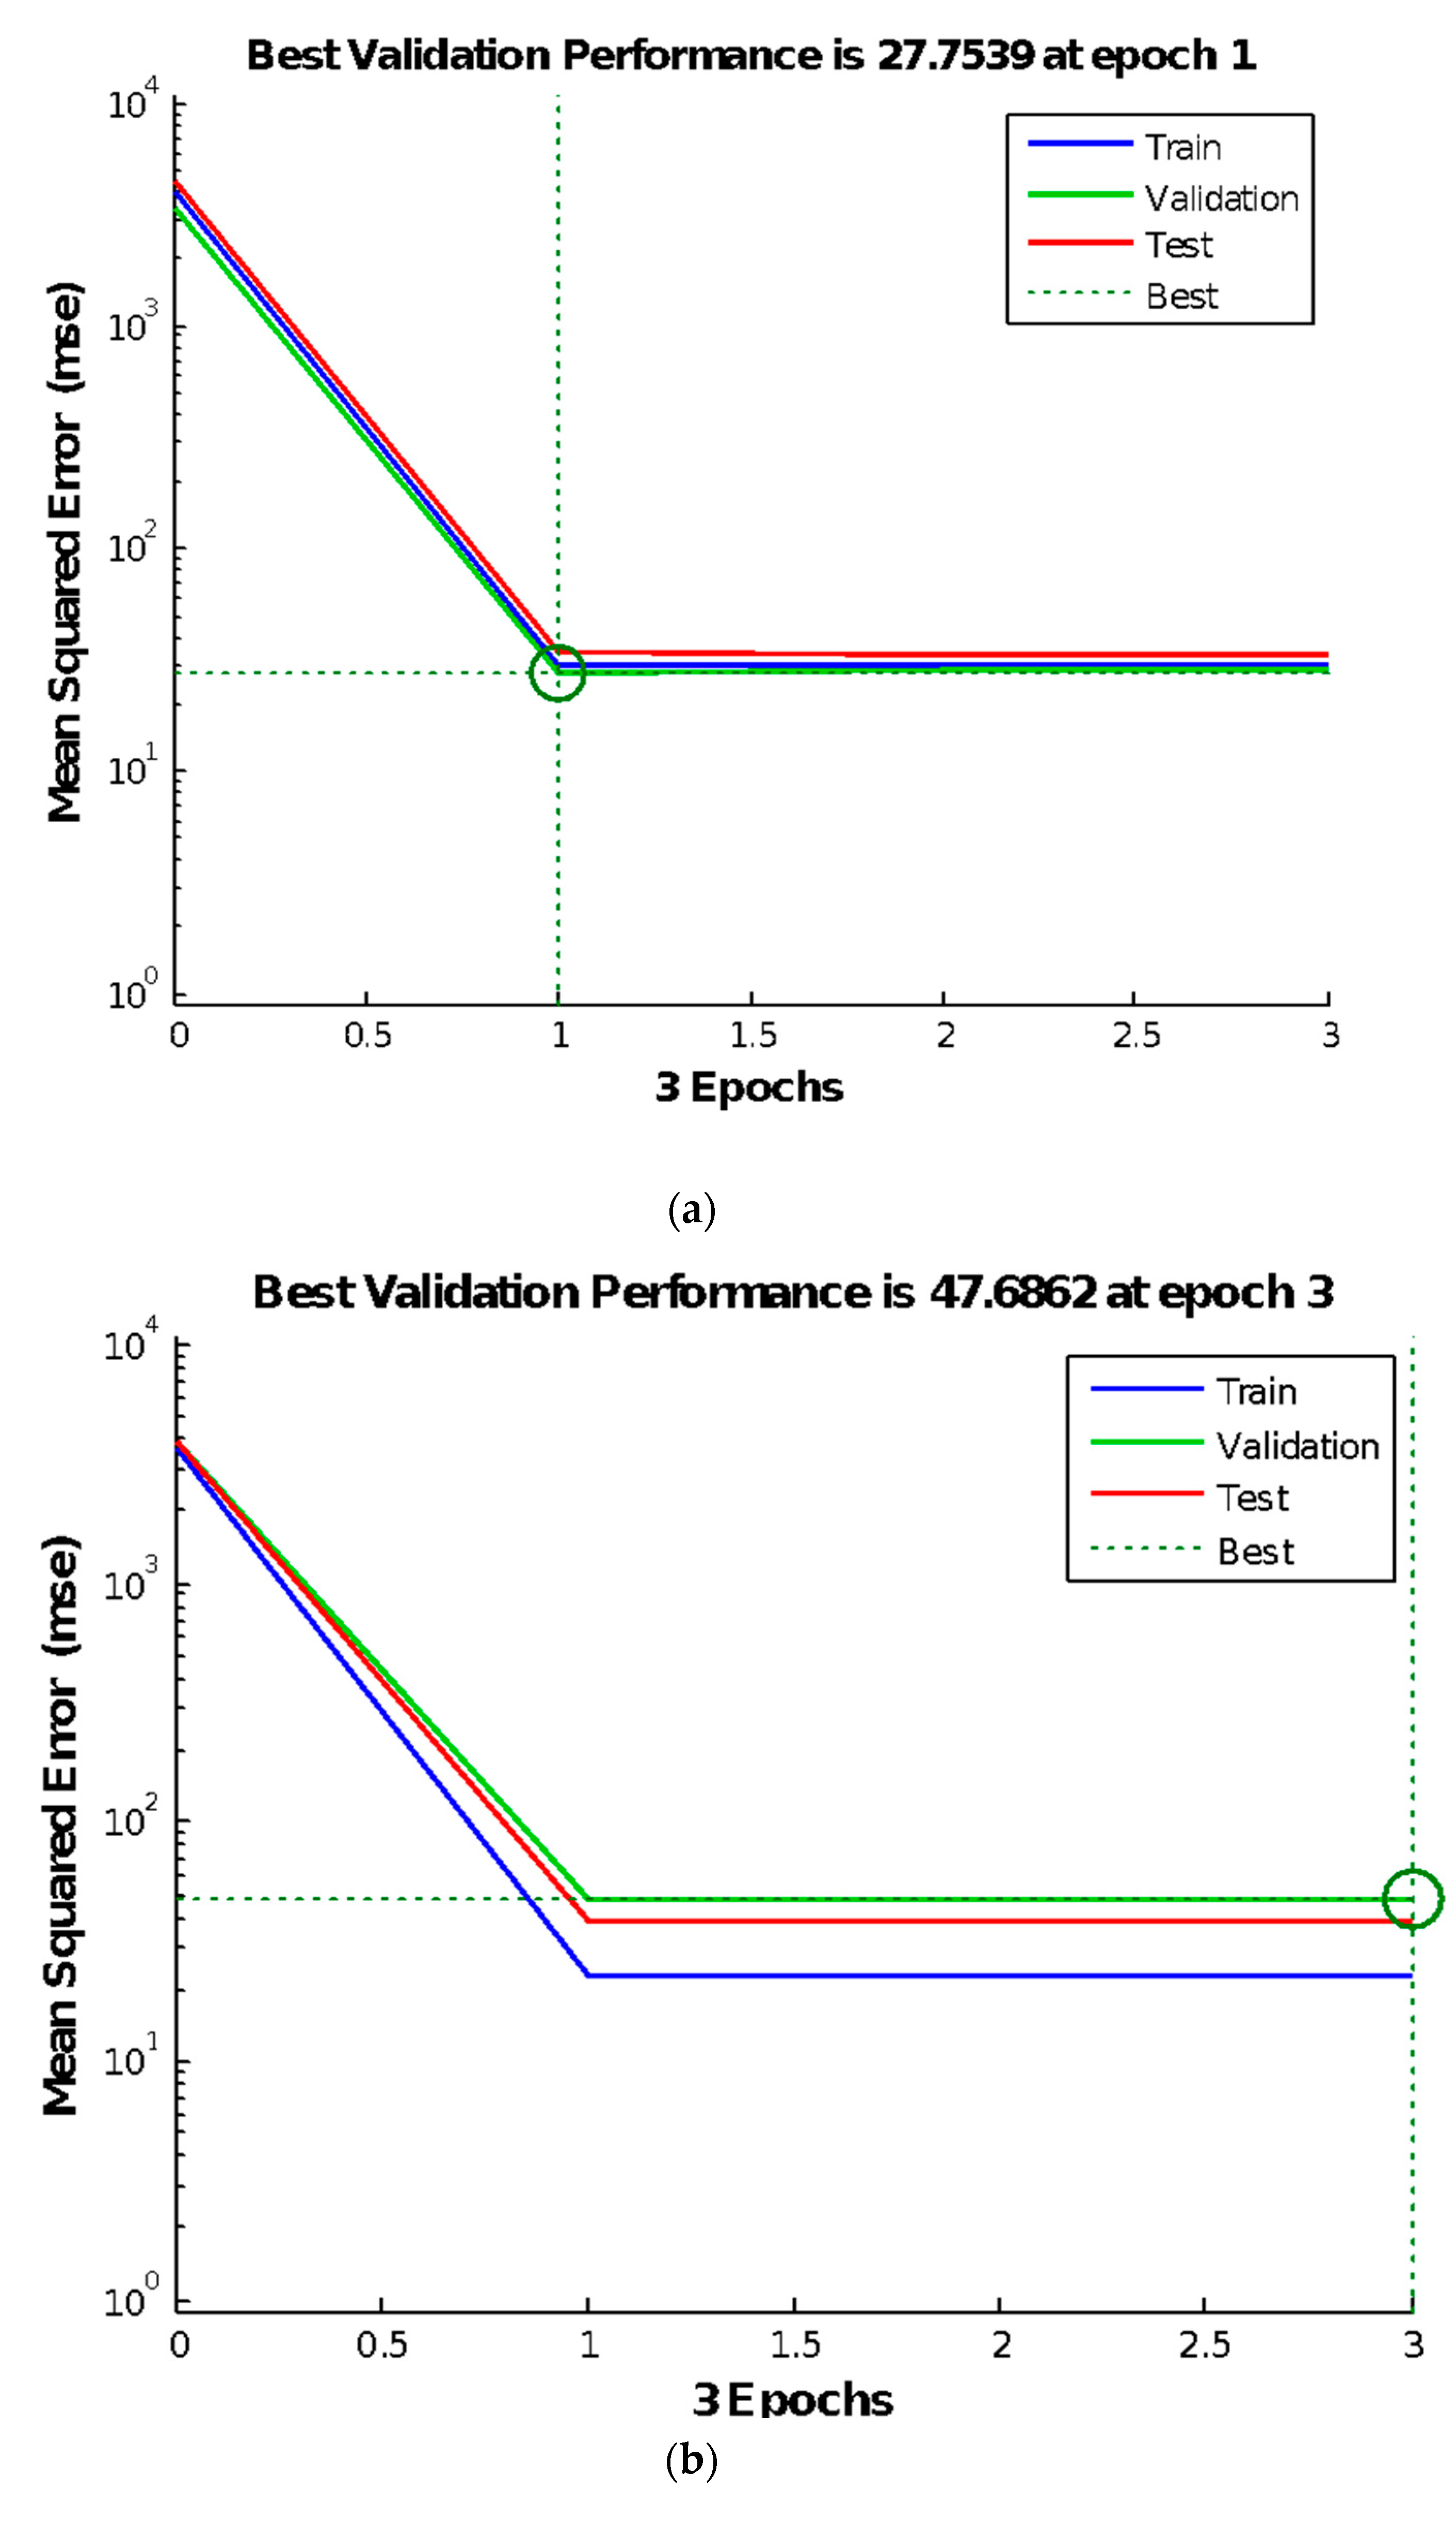
4.2. The Model Test
It was discovered that the predicted compressive strength was 59.2 MPa, which was closer to the real compressive strength of 58.2 MPa compared with any group of orthogonal experiments. Subsequently, we must examine the generalization ability of the constructed neural network, and then assess whether the network has been equated, in which an outstanding neural network is trained to forecast the last three groups of data in
Table 1, whose results are shown in
Table 13 below. It is clear that the error of the network’s simulation results can be controlled to within 11%, thereby avoiding over-fitting in training.
5. Results and Discussion
By applying the genetic algorithm in Matlab to optimize the mix proportion of the composite materials [
60], two iterations of the genetic algorithm are performed in the main process [
61]. One performs before the BP neural network to obtain individual population and fitness values for training the BP neural network. However, the other is performed after the BP neural network to obtain individuals that are brought into the BP neural network again to train the network, rendering the network more accurate. The individual fitness of the latter is obtained partly by the fitness function of the BP model and partly by the initial fitness function. The latter part is substituted into the BP neural network to render it more accurate. When the nonlinear mapping relationship established in the BP neural network is substituted as the fitness function, it can be inferred from a previous study that the fitness function can be calculated as follows [
62]:
According to the Chinese Standard [
63] and the literature [
40], the water-binder ratio is 0.35–0.41; the water-cement ratio is 0.5–0.65; the cement-sand ratio is 1.22–1.36; the volume content of PVA fiber is 0–1.5%; the content of nano-SiO
2 is 0–2.5%. The mathematical model is as follows [
64]:
where
is the input vector;
is the target vector;
,
,
,
, are the input and output layer weight and threshold matrices, respectively;
is the nonlinear mapping constructed in the neural network model;
are the mix proportions of the composite material.
To improve the efficiency of searching for the maximum, the chromosome code was written in real numbers, with a crossover probability of 0.6 and a mutation probability of 0.01 for executing the algorithm, while the number of single chromosome corresponded to the number of variables, which was 8 [
60]. For each iteration through the algorithm, the current optimal individual was forced to participate in the next generation evolution. After 100 generations, the best mixture ratio was as follows: Water: cement: quartz sand: fly ash: PVA fiber: nano-SiO
2: water reducer = 384:649:508:349:9.5:8.1:3.0. The BP neural network predicted the corresponding compressive strength, i.e., 68.7, which is superior to most of the compressive strengths in
Table 1 (except for mixtures 13 and 16).
The differences from the best mix proportion in the literature [
40] are shown in
Table 14. As is shown in
Table 14, the differences between the two optimal mix proportions are within 0.1%. According to the literature [
40], the compressive strength of PVA fiber-reinforced cementitious composites containing nano-SiO
2 can be enhanced when the content of PVA is 0–0.6%. Besides, with the increase of PVA fiber content, the compressive strength has no obvious increase or decrease trend. Therefore, the difference of PVA content can be ignored. Moreover, the compressive strength values of the two mix proportions are close, so the two mix proportions can be understood as the same mix proportion, which reflects the reliability of the BP neural network.
6. Conclusions
(1) The BP neural network model could reflect the complex nonlinear mapping relationship between the compressive strength and its mix proportion, which could facilitate in predicting the compressive strength of PVA fiber-reinforced cementitious composites. Moreover, using the genetic algorithm to optimize the BP neural network could effectively optimize the mix proportion of composite materials, whose results could be used in the composite mix proportion test and improve the test efficiency.
(2) The parameters of the BP neural network could be determined by an orthogonal test that considered the effect of the interaction among the parameters on the performance of the neural network for achieving a BP neural network model with good performance. The conspicuousness of each parameter for the performance of the BP neural network was from strong to weak in the following sequence: The interaction between the number of hidden neurons and learning rate, the number of hidden neurons, training times, the interaction between training times and mean square error, the interaction between number of hidden neurons and mean square error, the number of display intervals, the learning rate, the mean square error, and the momentum factor.
(3) The optimal mix proportion of the PVA fiber cementitious composite was water: cement: quartz sand: fly ash: PVA fiber: nano-SiO2: water reducer = 384:649:508:349:9.5:8.1:3.0, whose predicted compressive strength was 68.7 MPa. It was verified that the experimental results could be used to optimize the compressive strength of cementitious composites reinforced by PVA fibers.


