An Experimental Assessment of the Water Permeability of Concrete with a Superplasticizer and Admixtures


Abstract
1. Introduction
2. Research Materials and Testing Methods
2.1. Materials
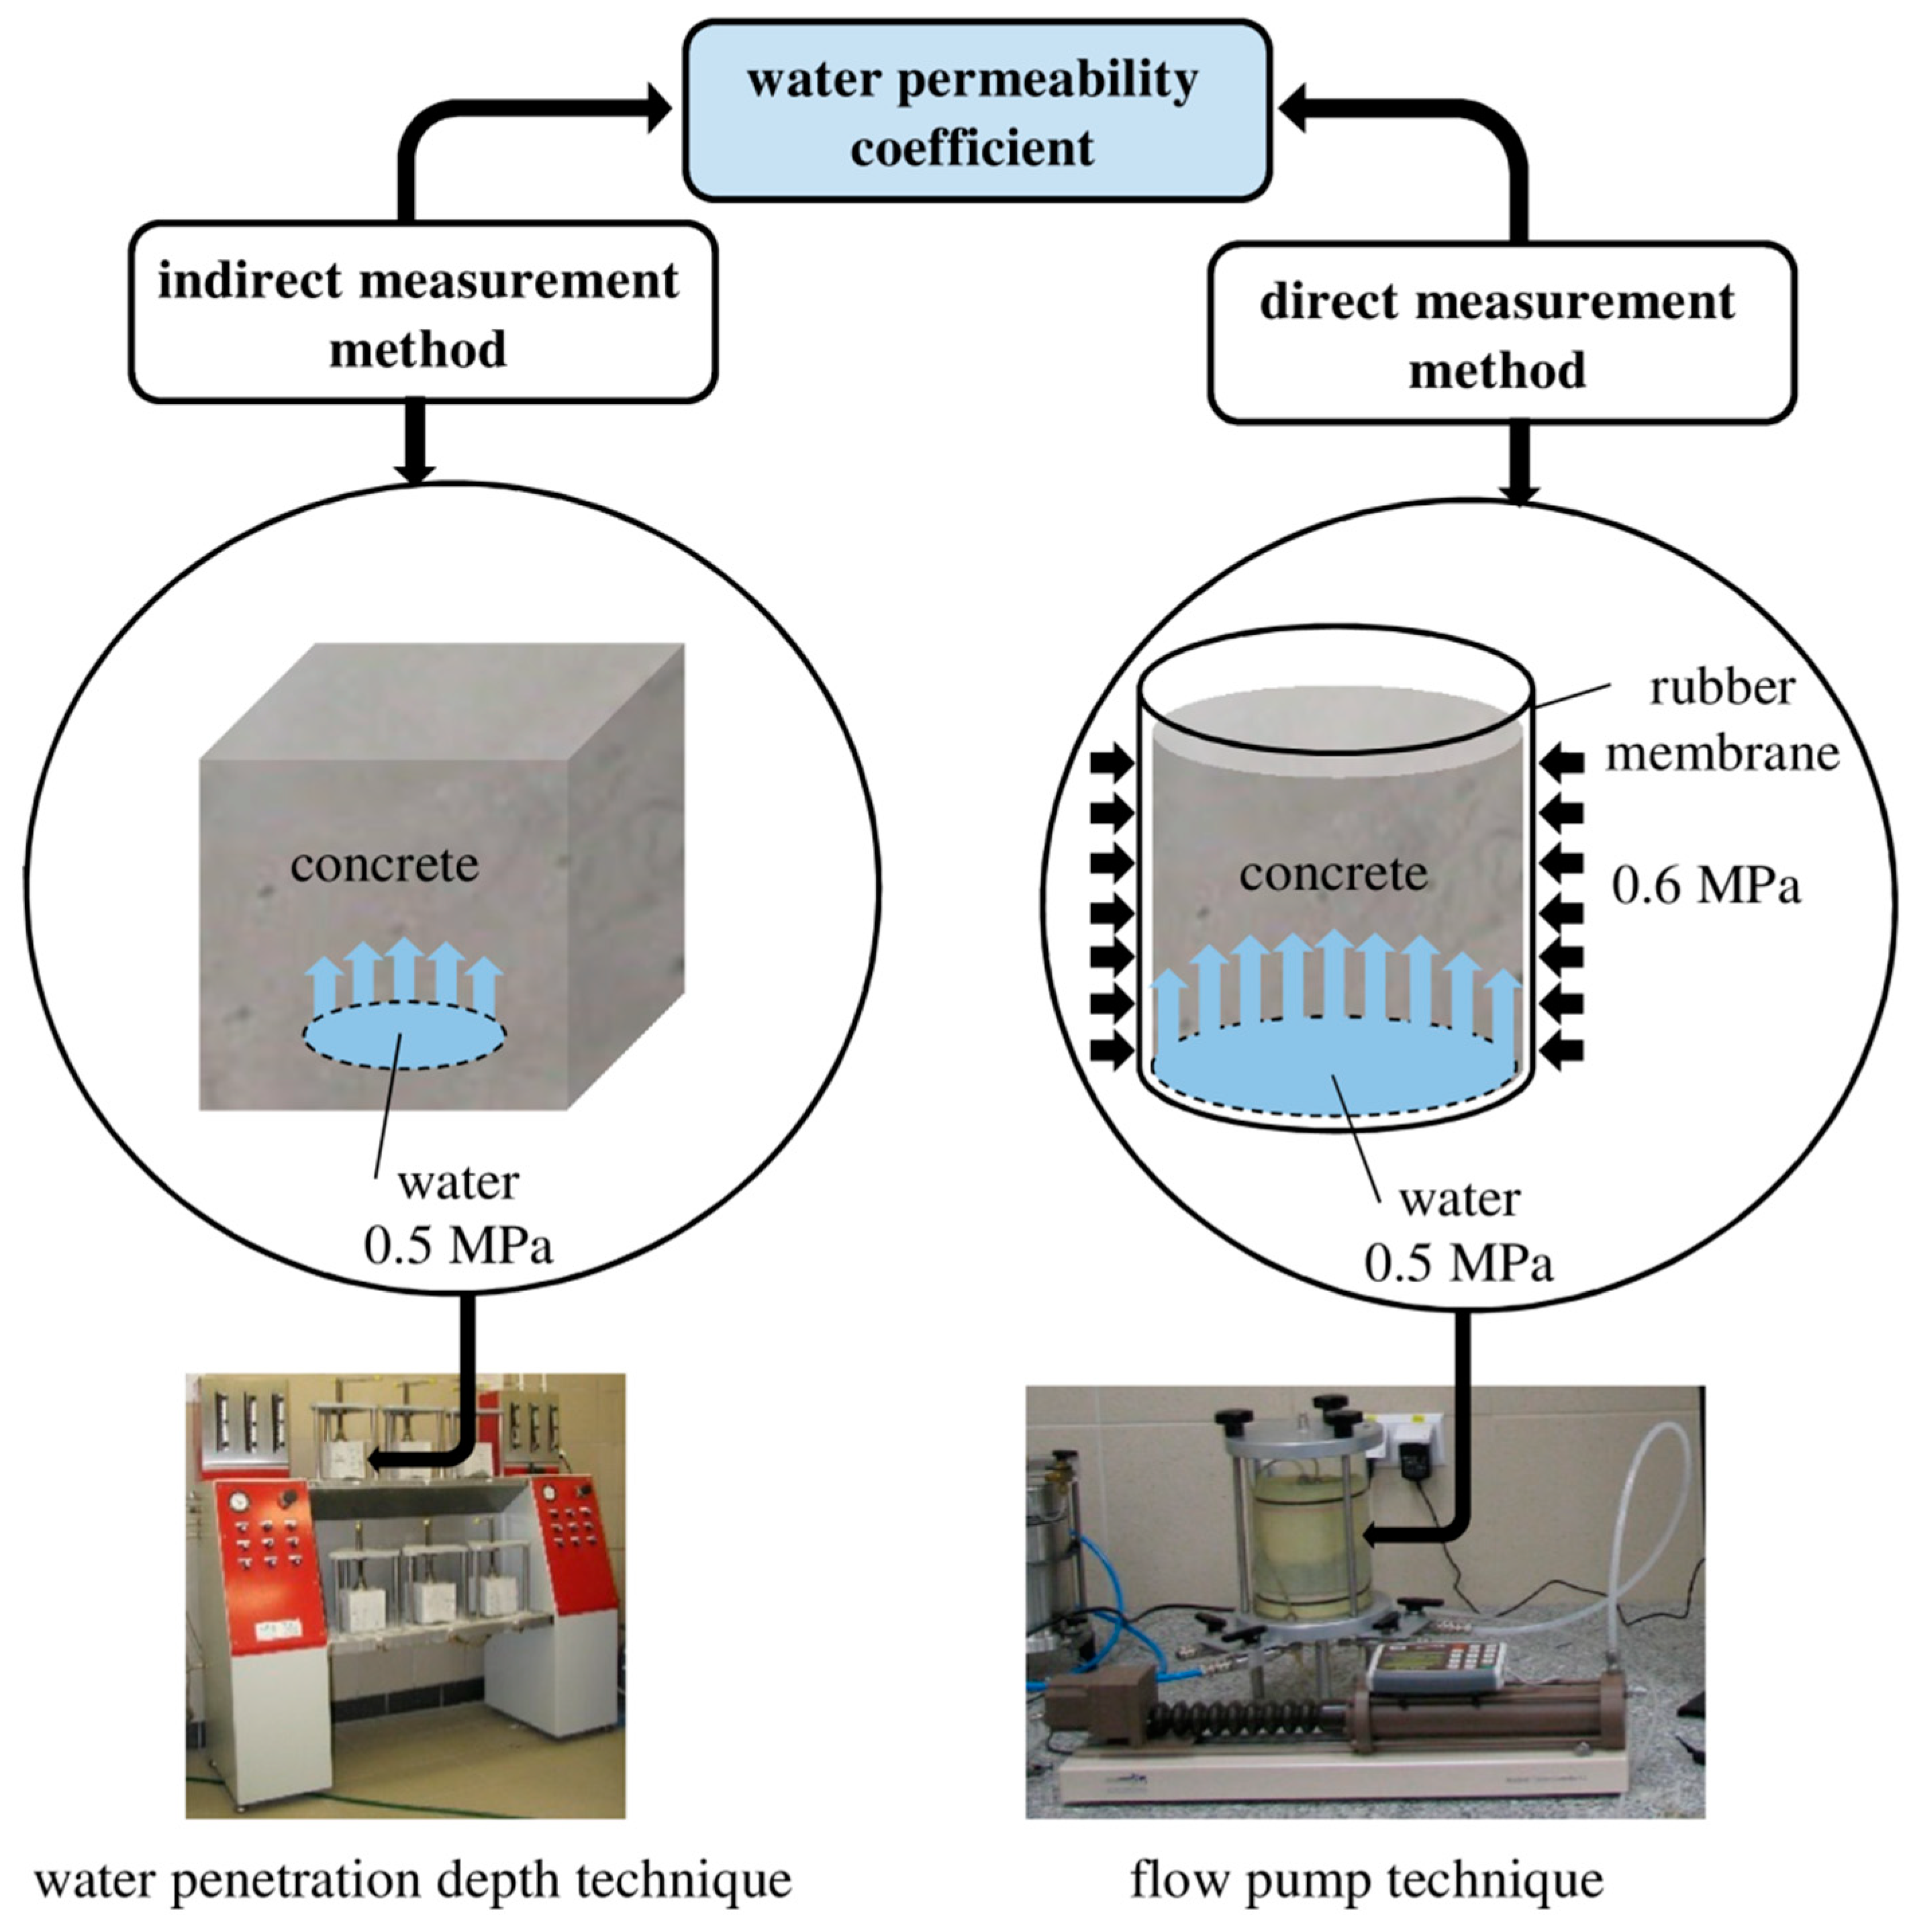
2.2. Water Permeability of the Concrete Obtained by the Depth Penetration Method
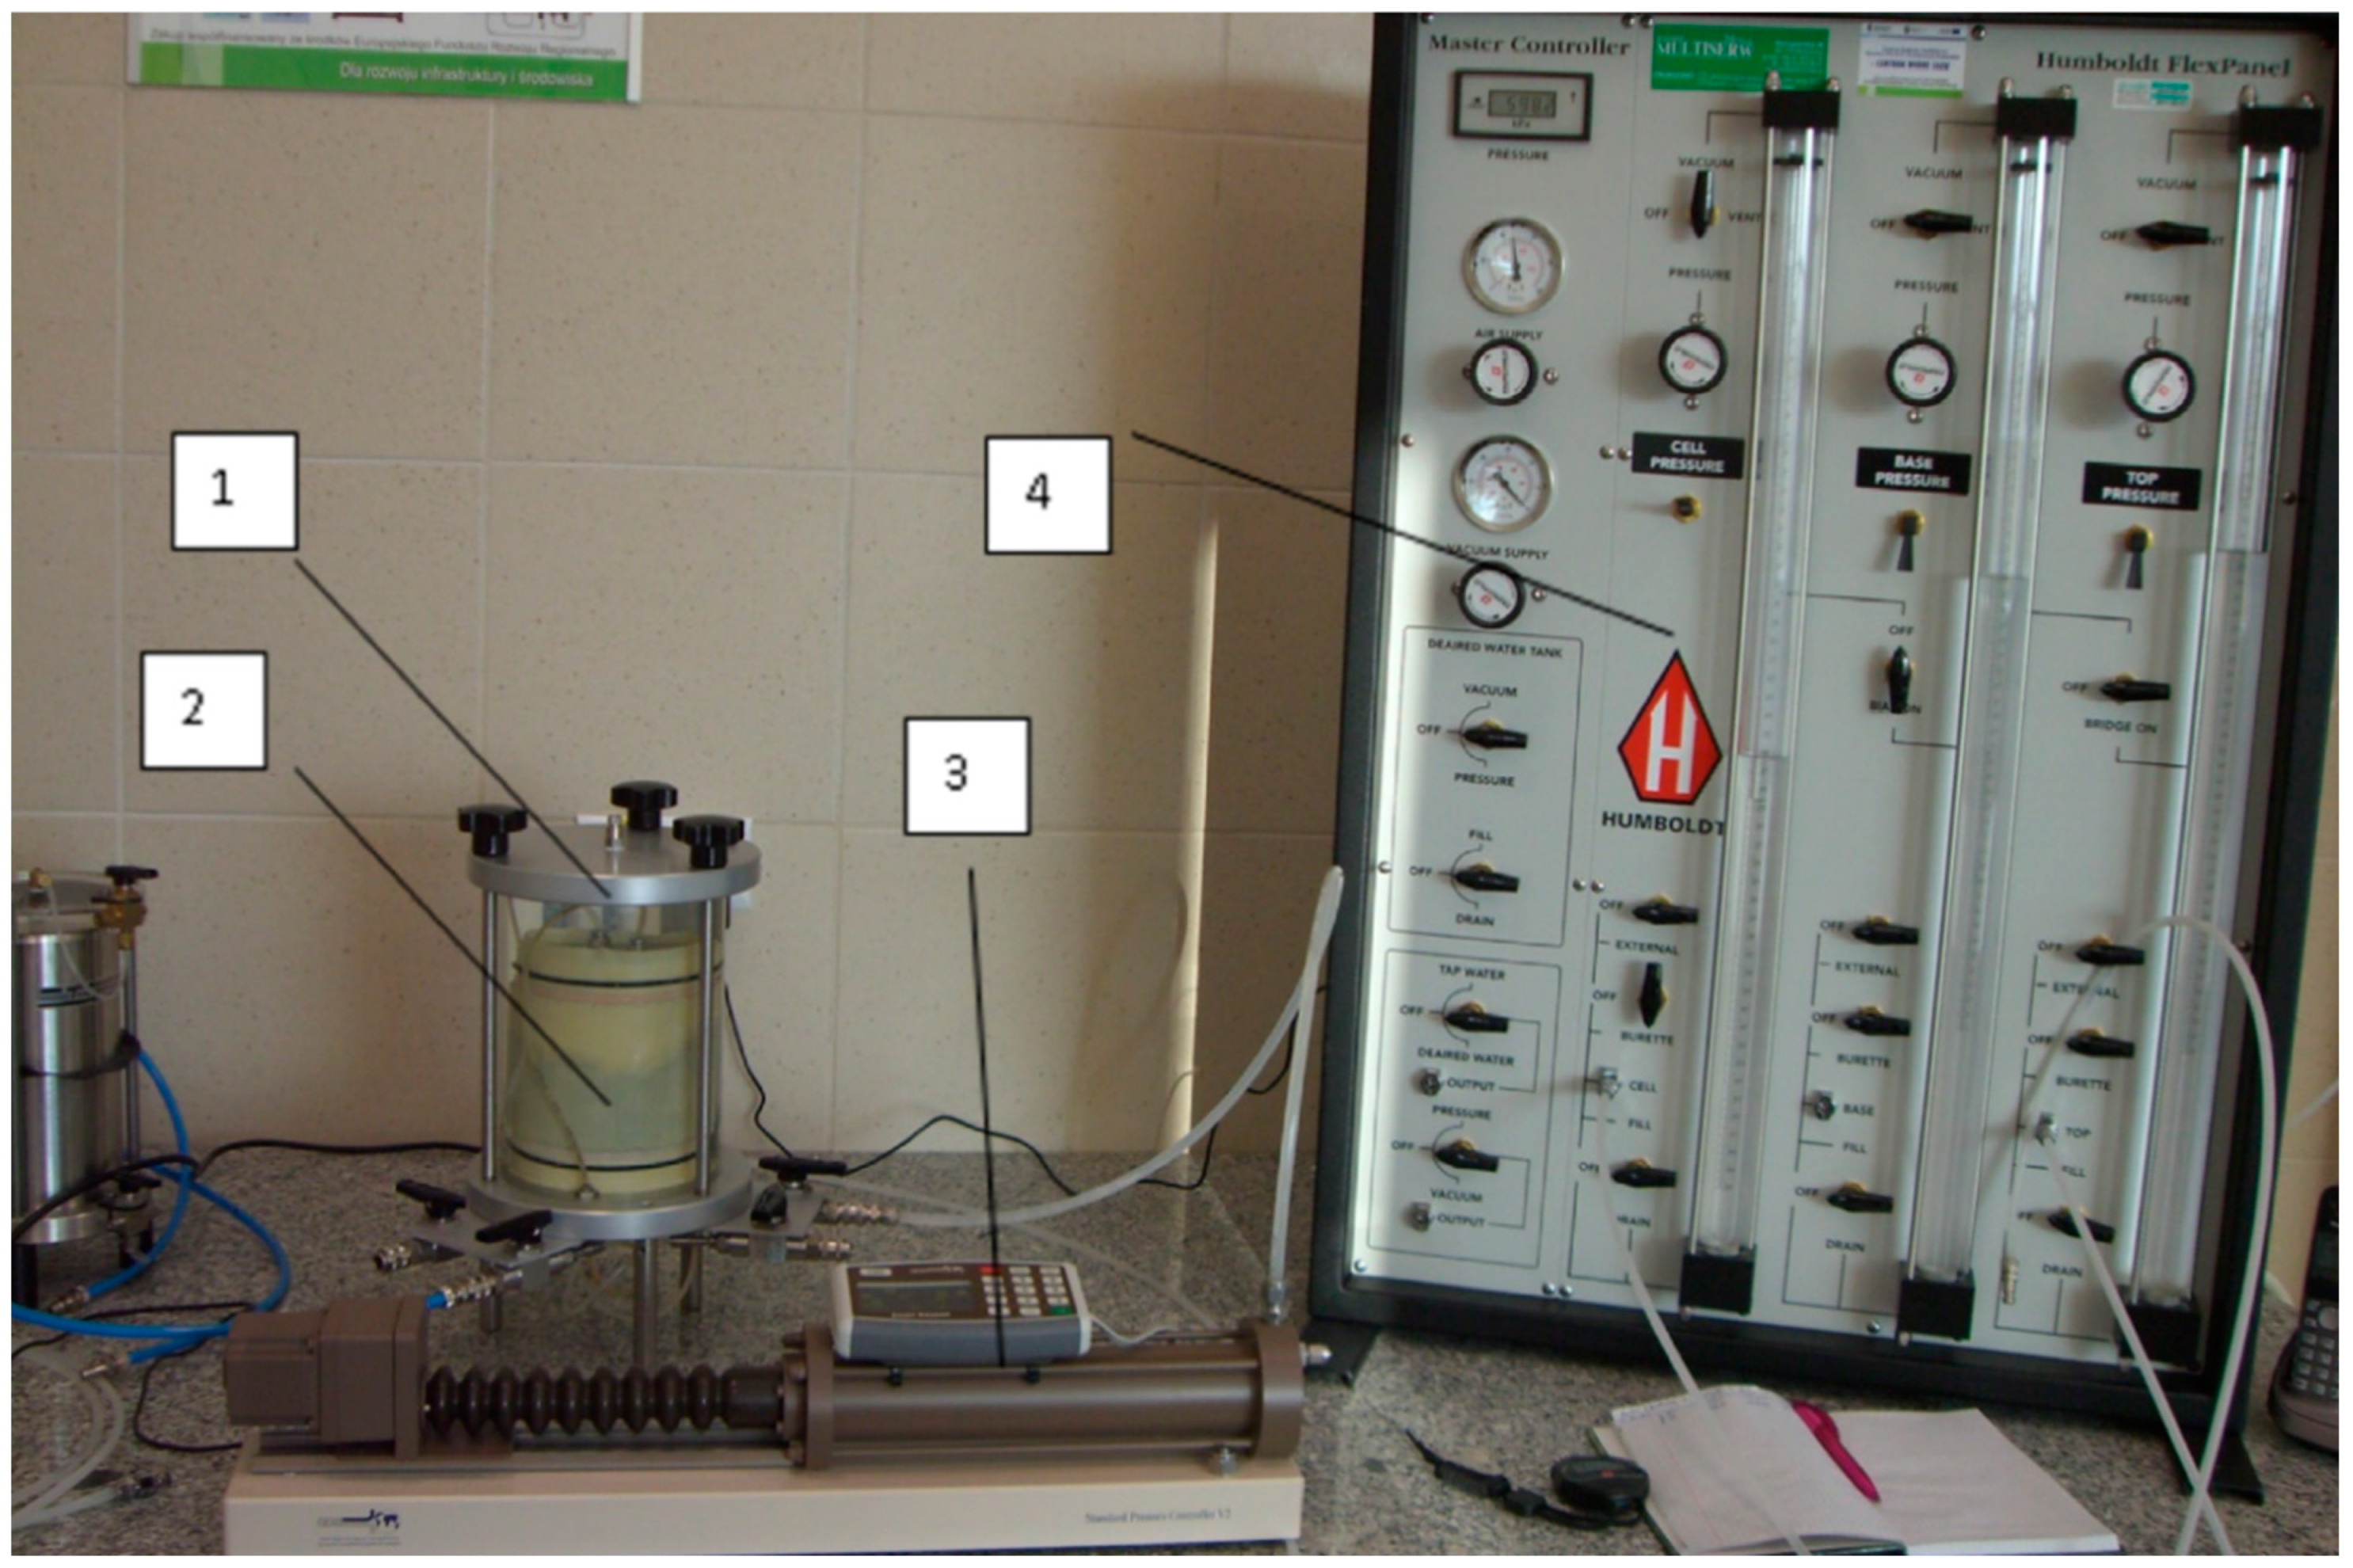
2.3. Coefficient of Permeability Obtained by the Flow Pump Technique
3. Test Results
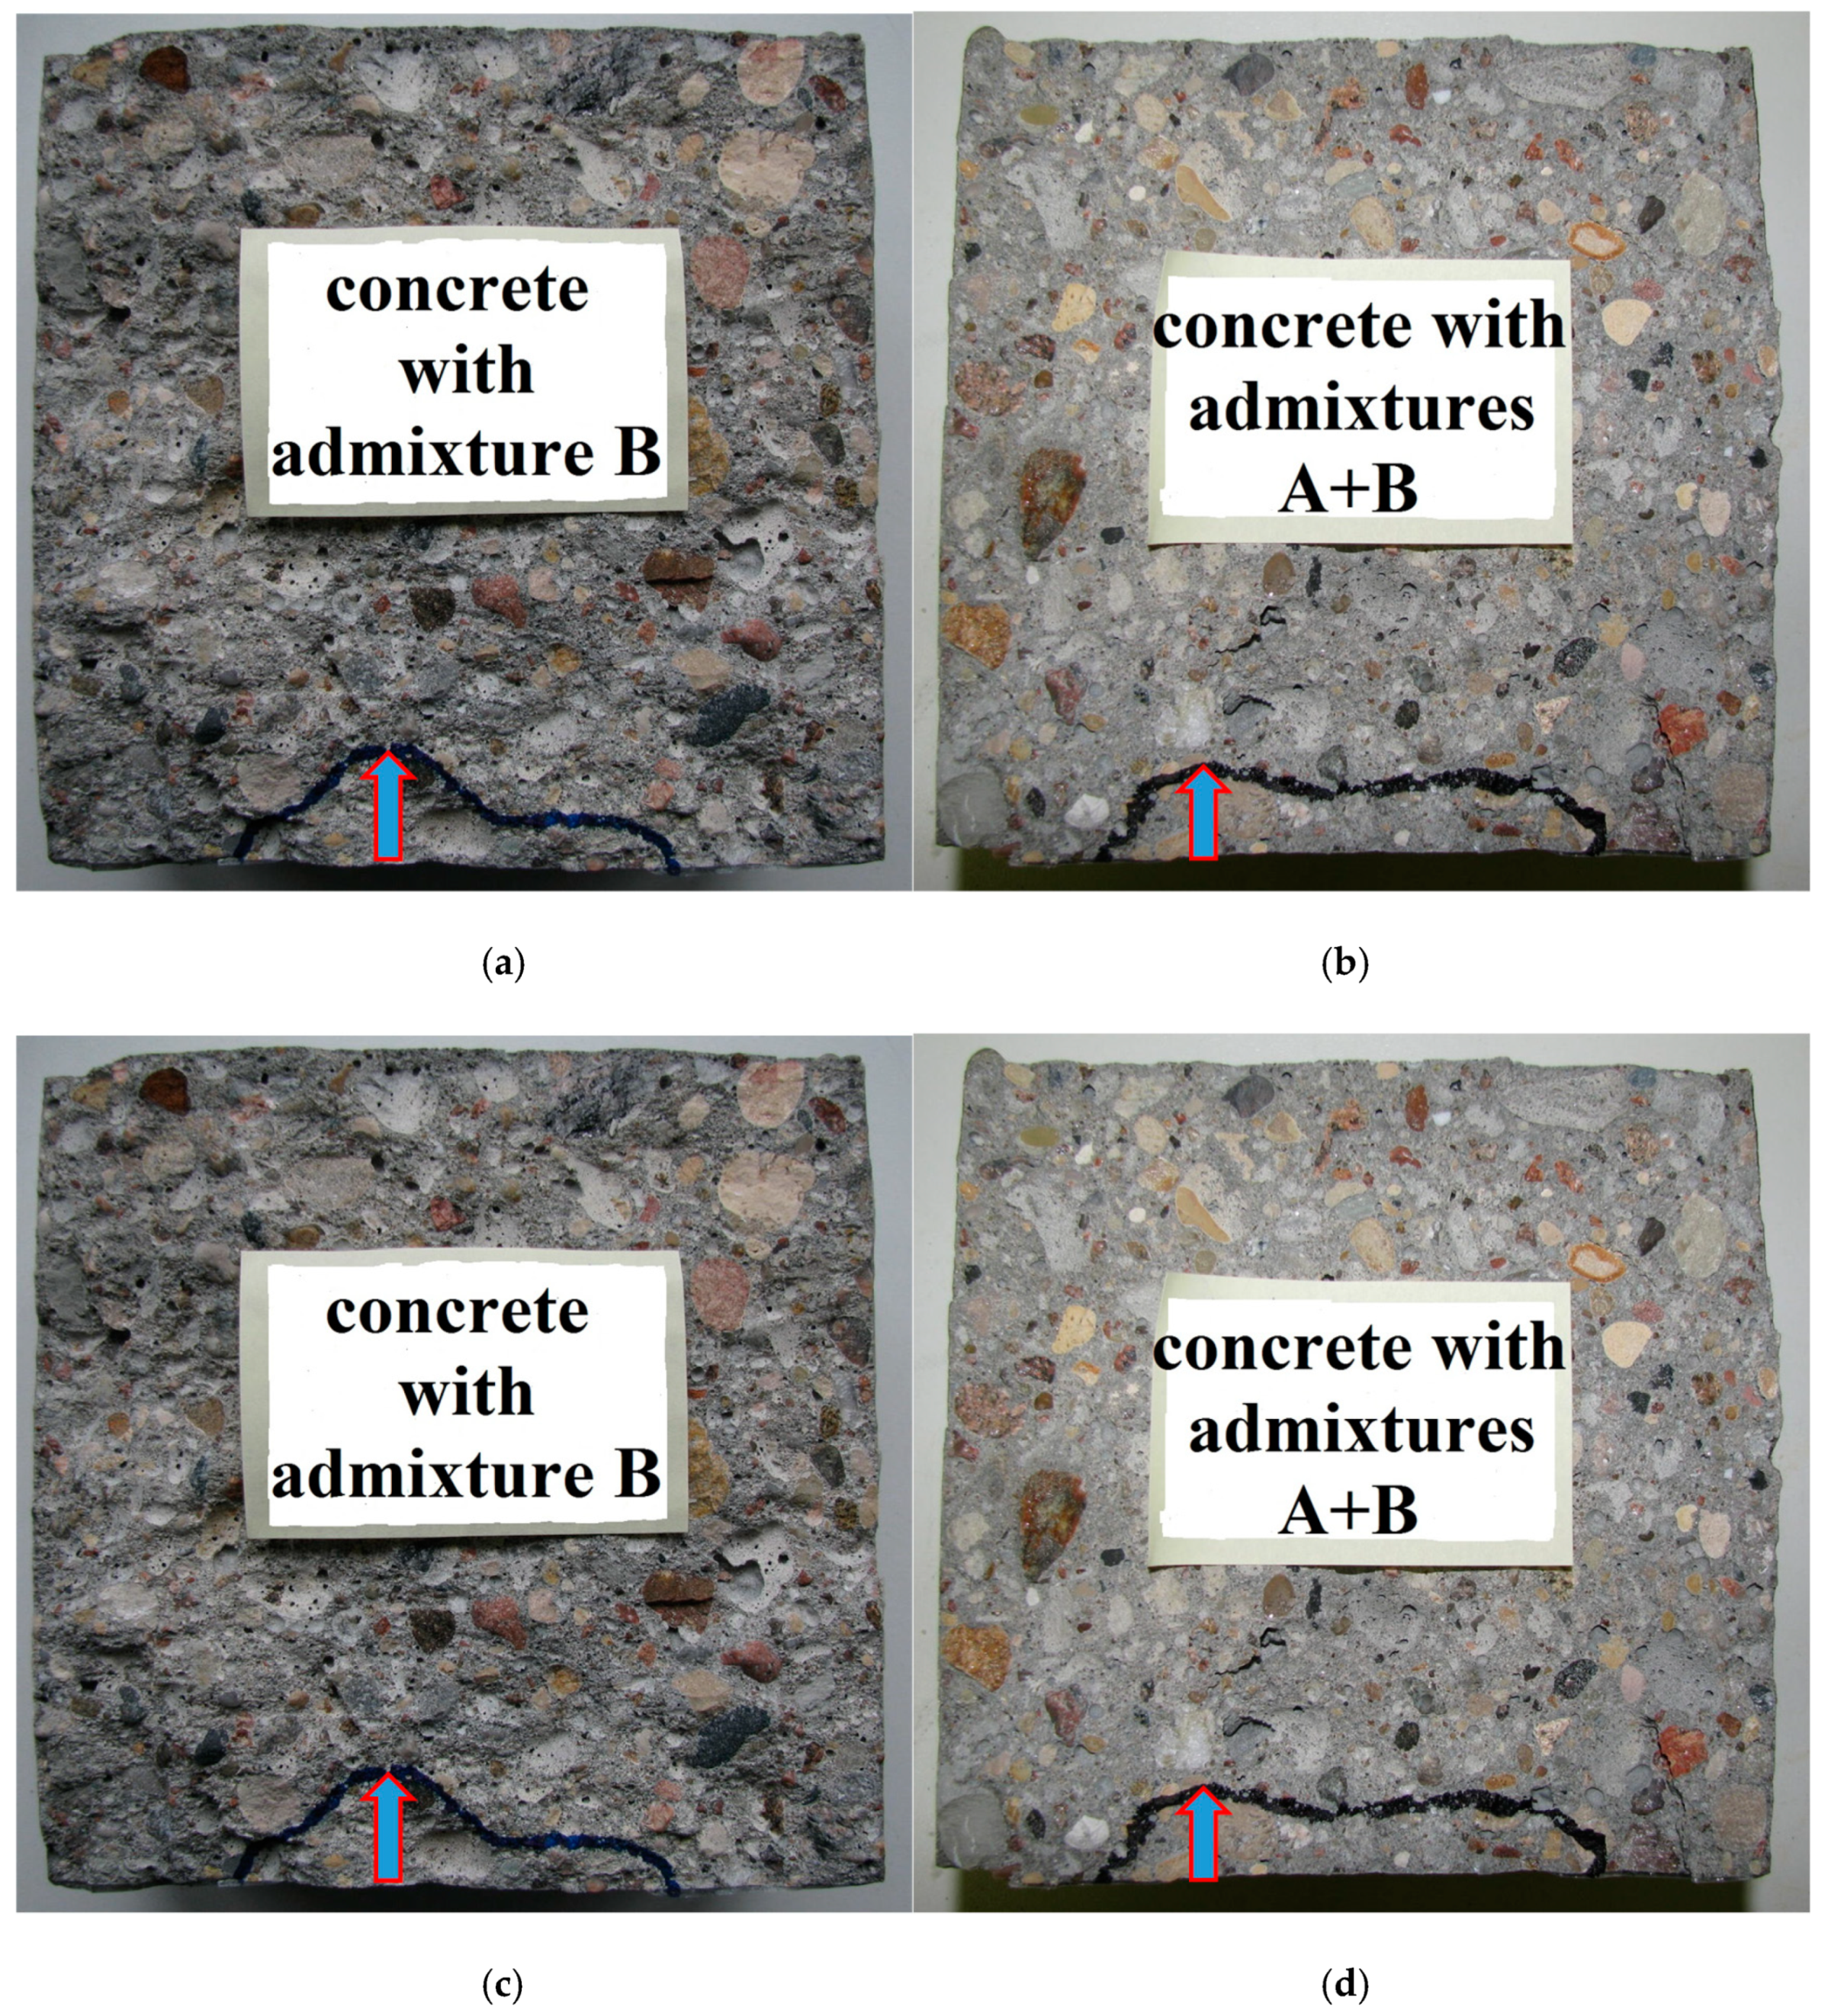
3.1. Values of the Concrete Permeability Coefficient Obtained by the Depth Penetration Method
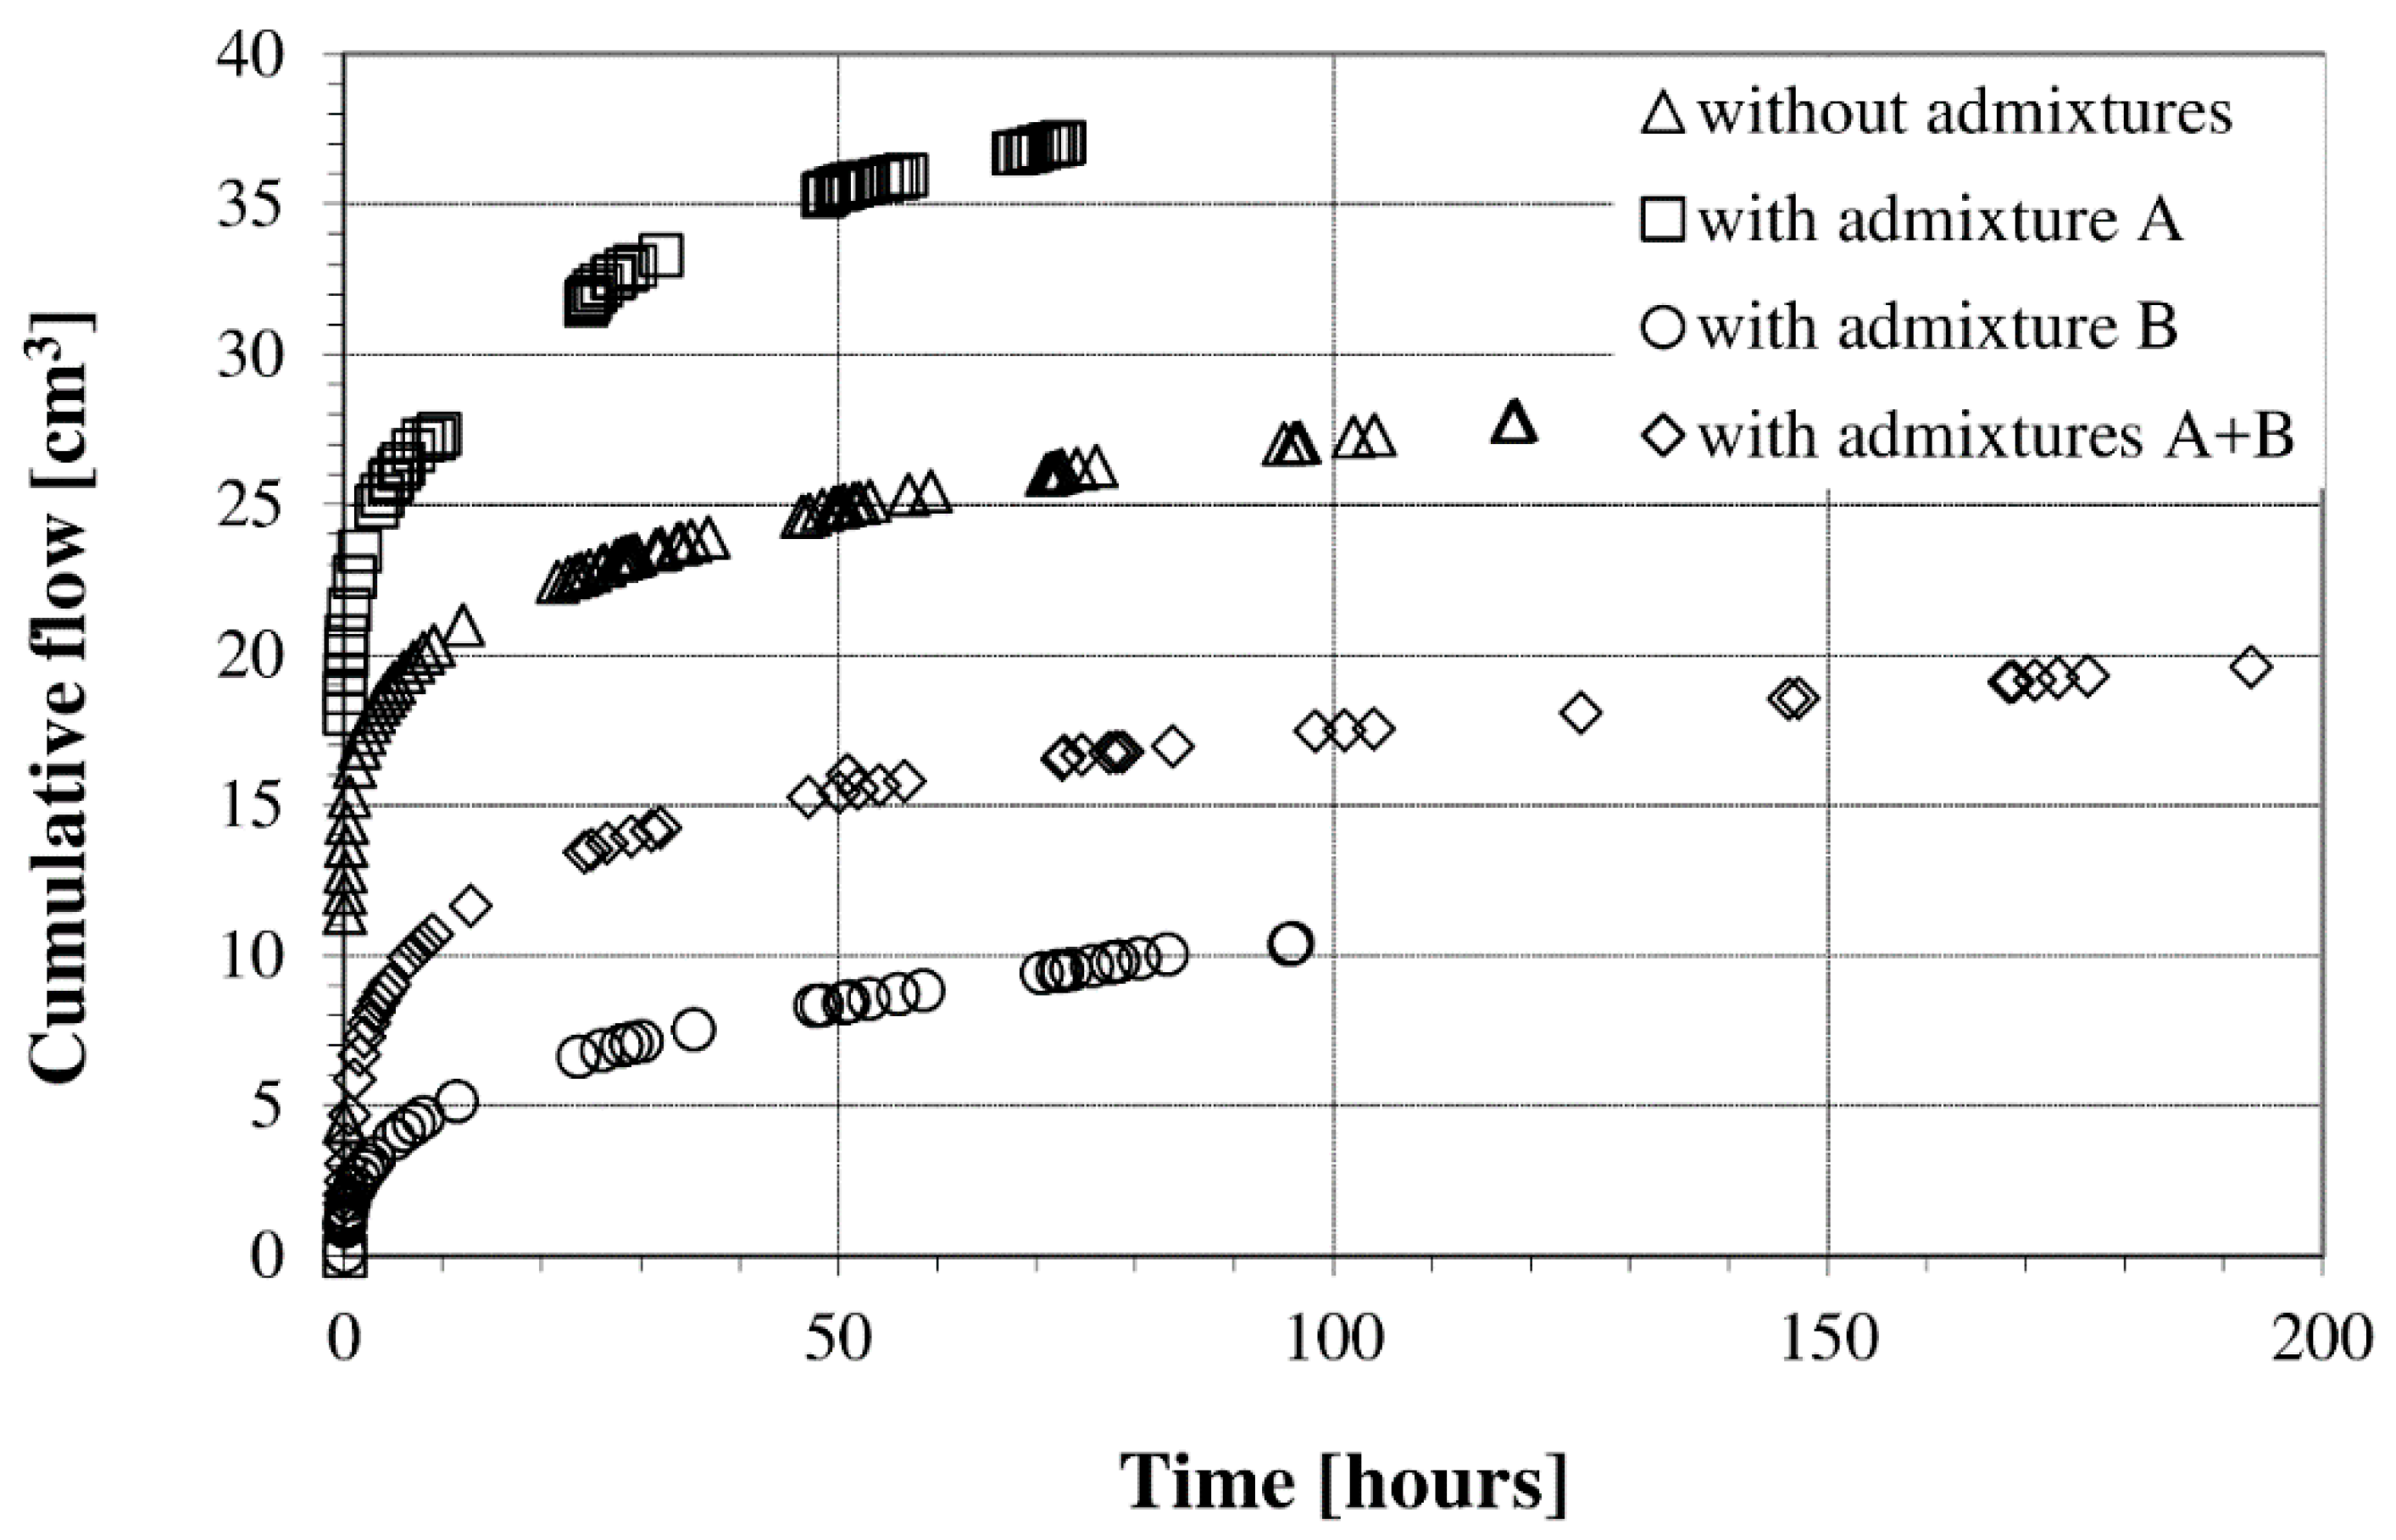
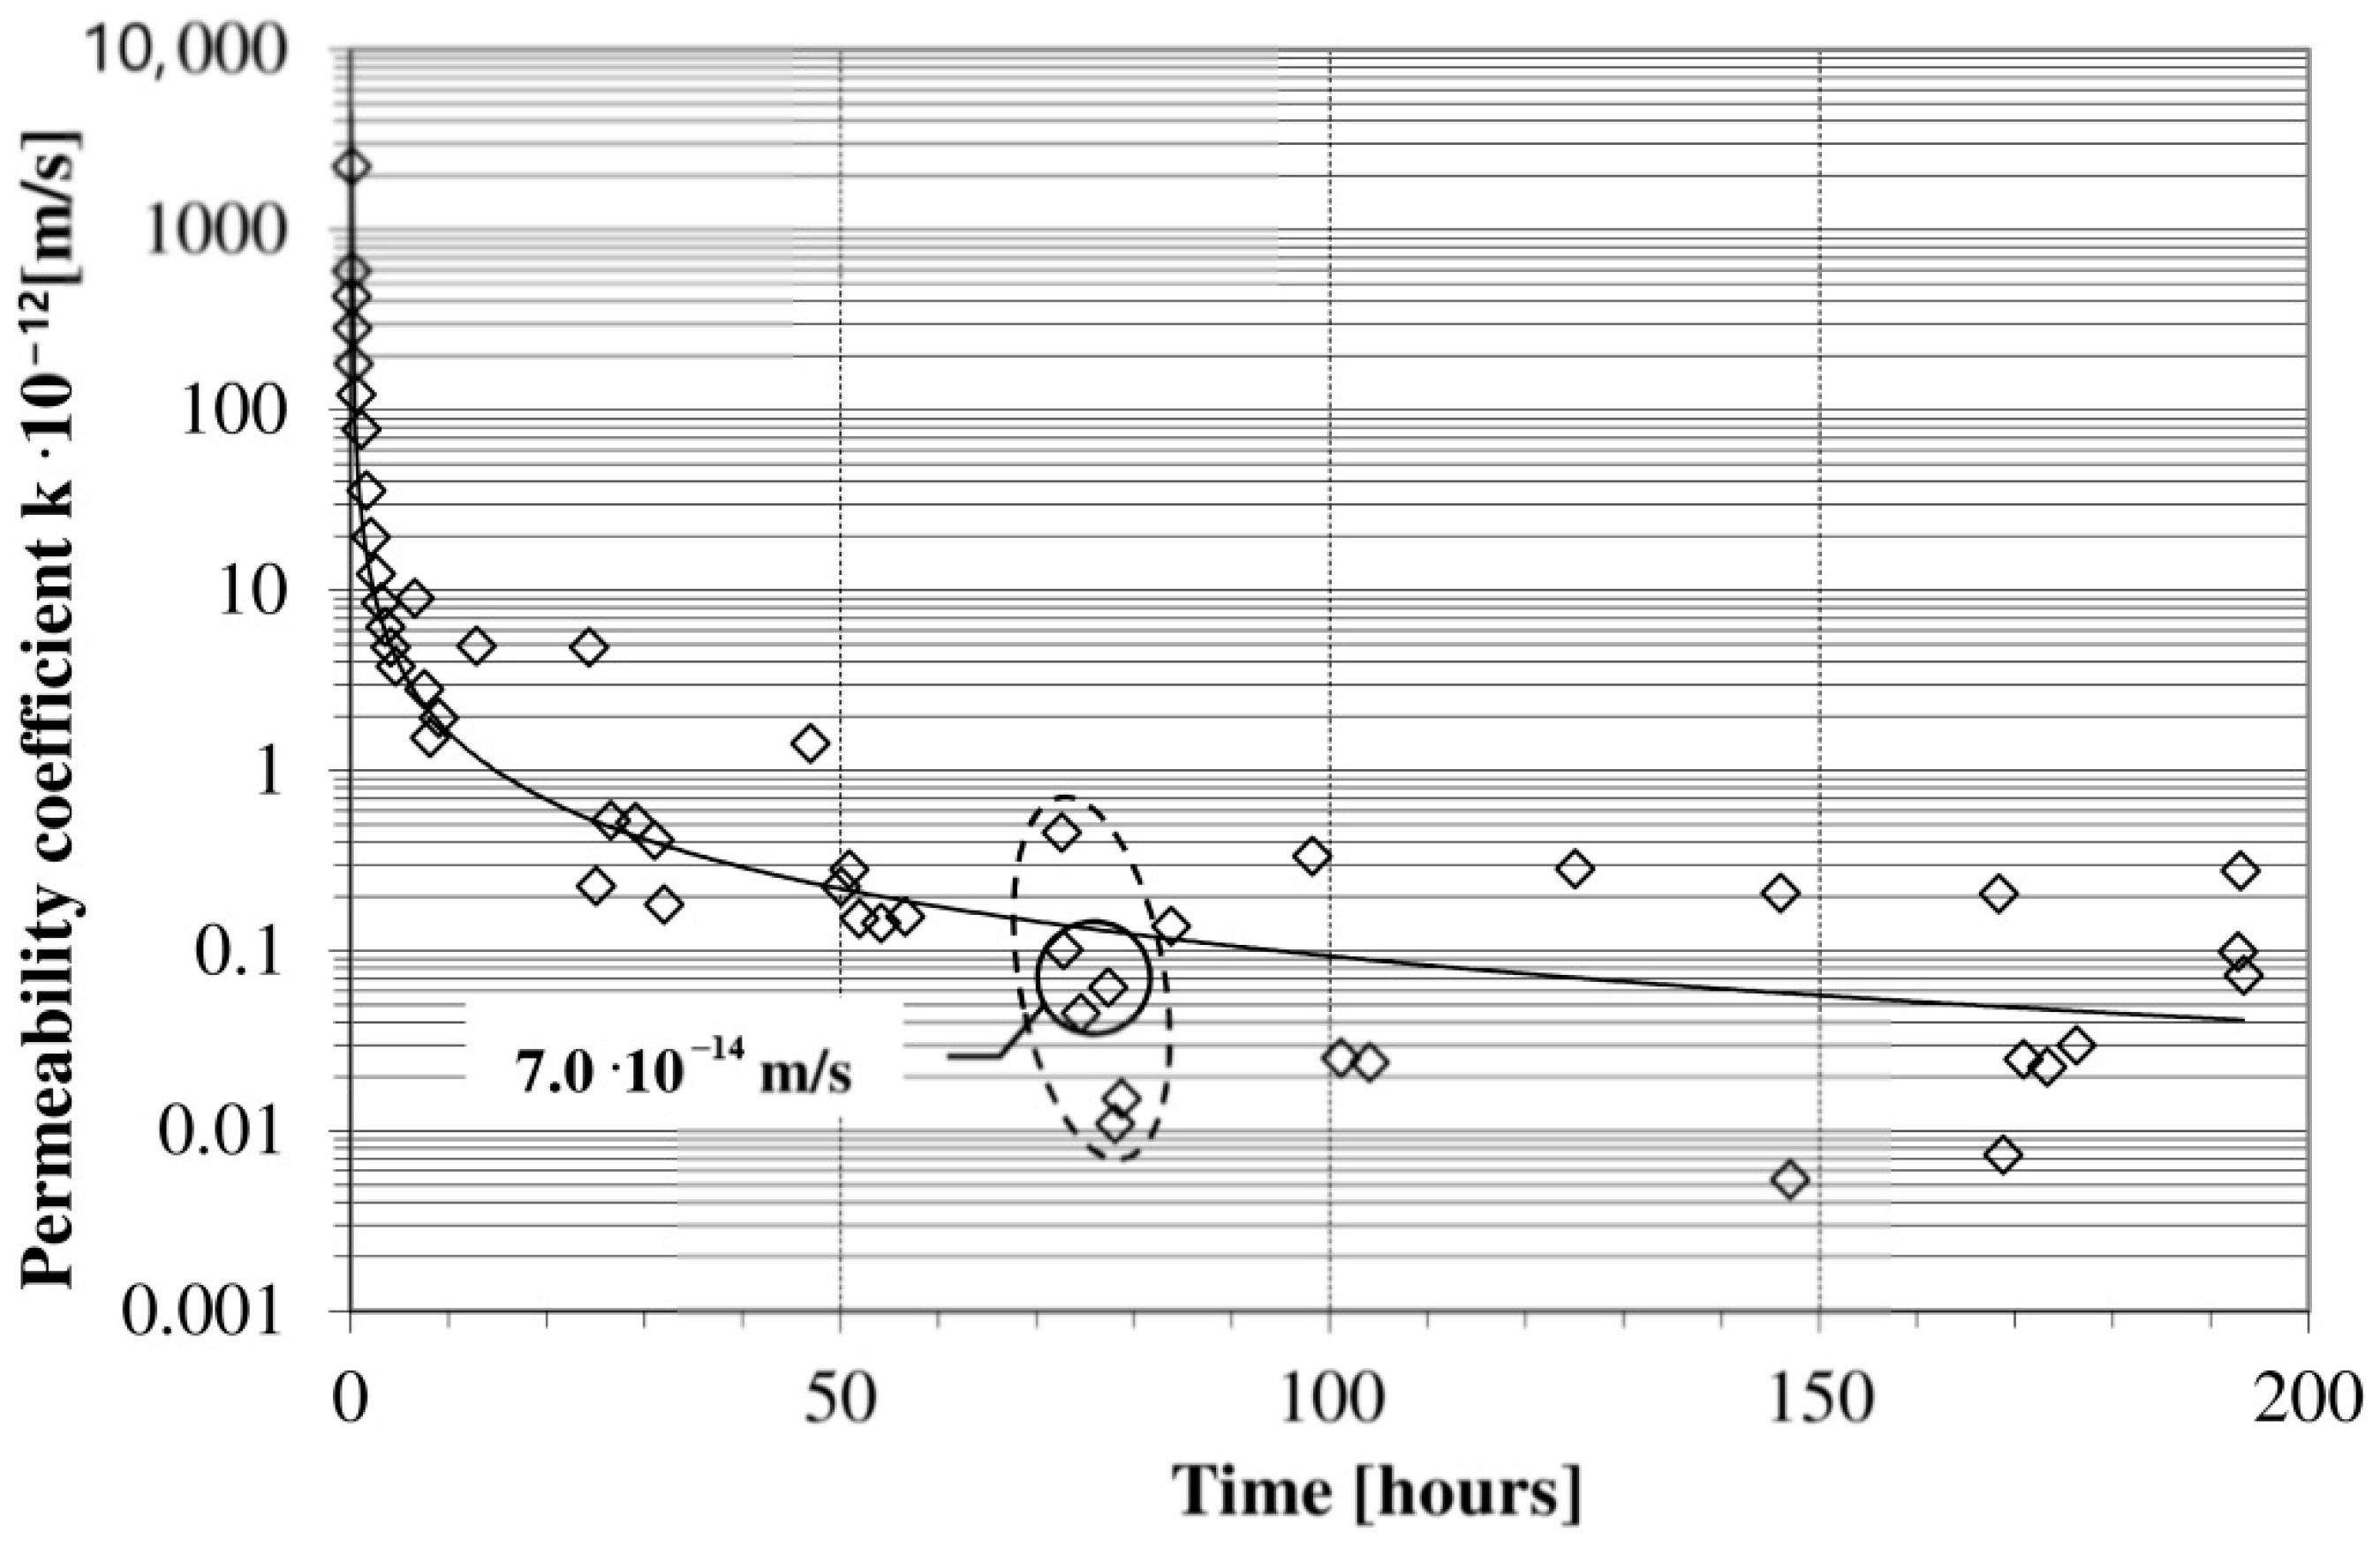
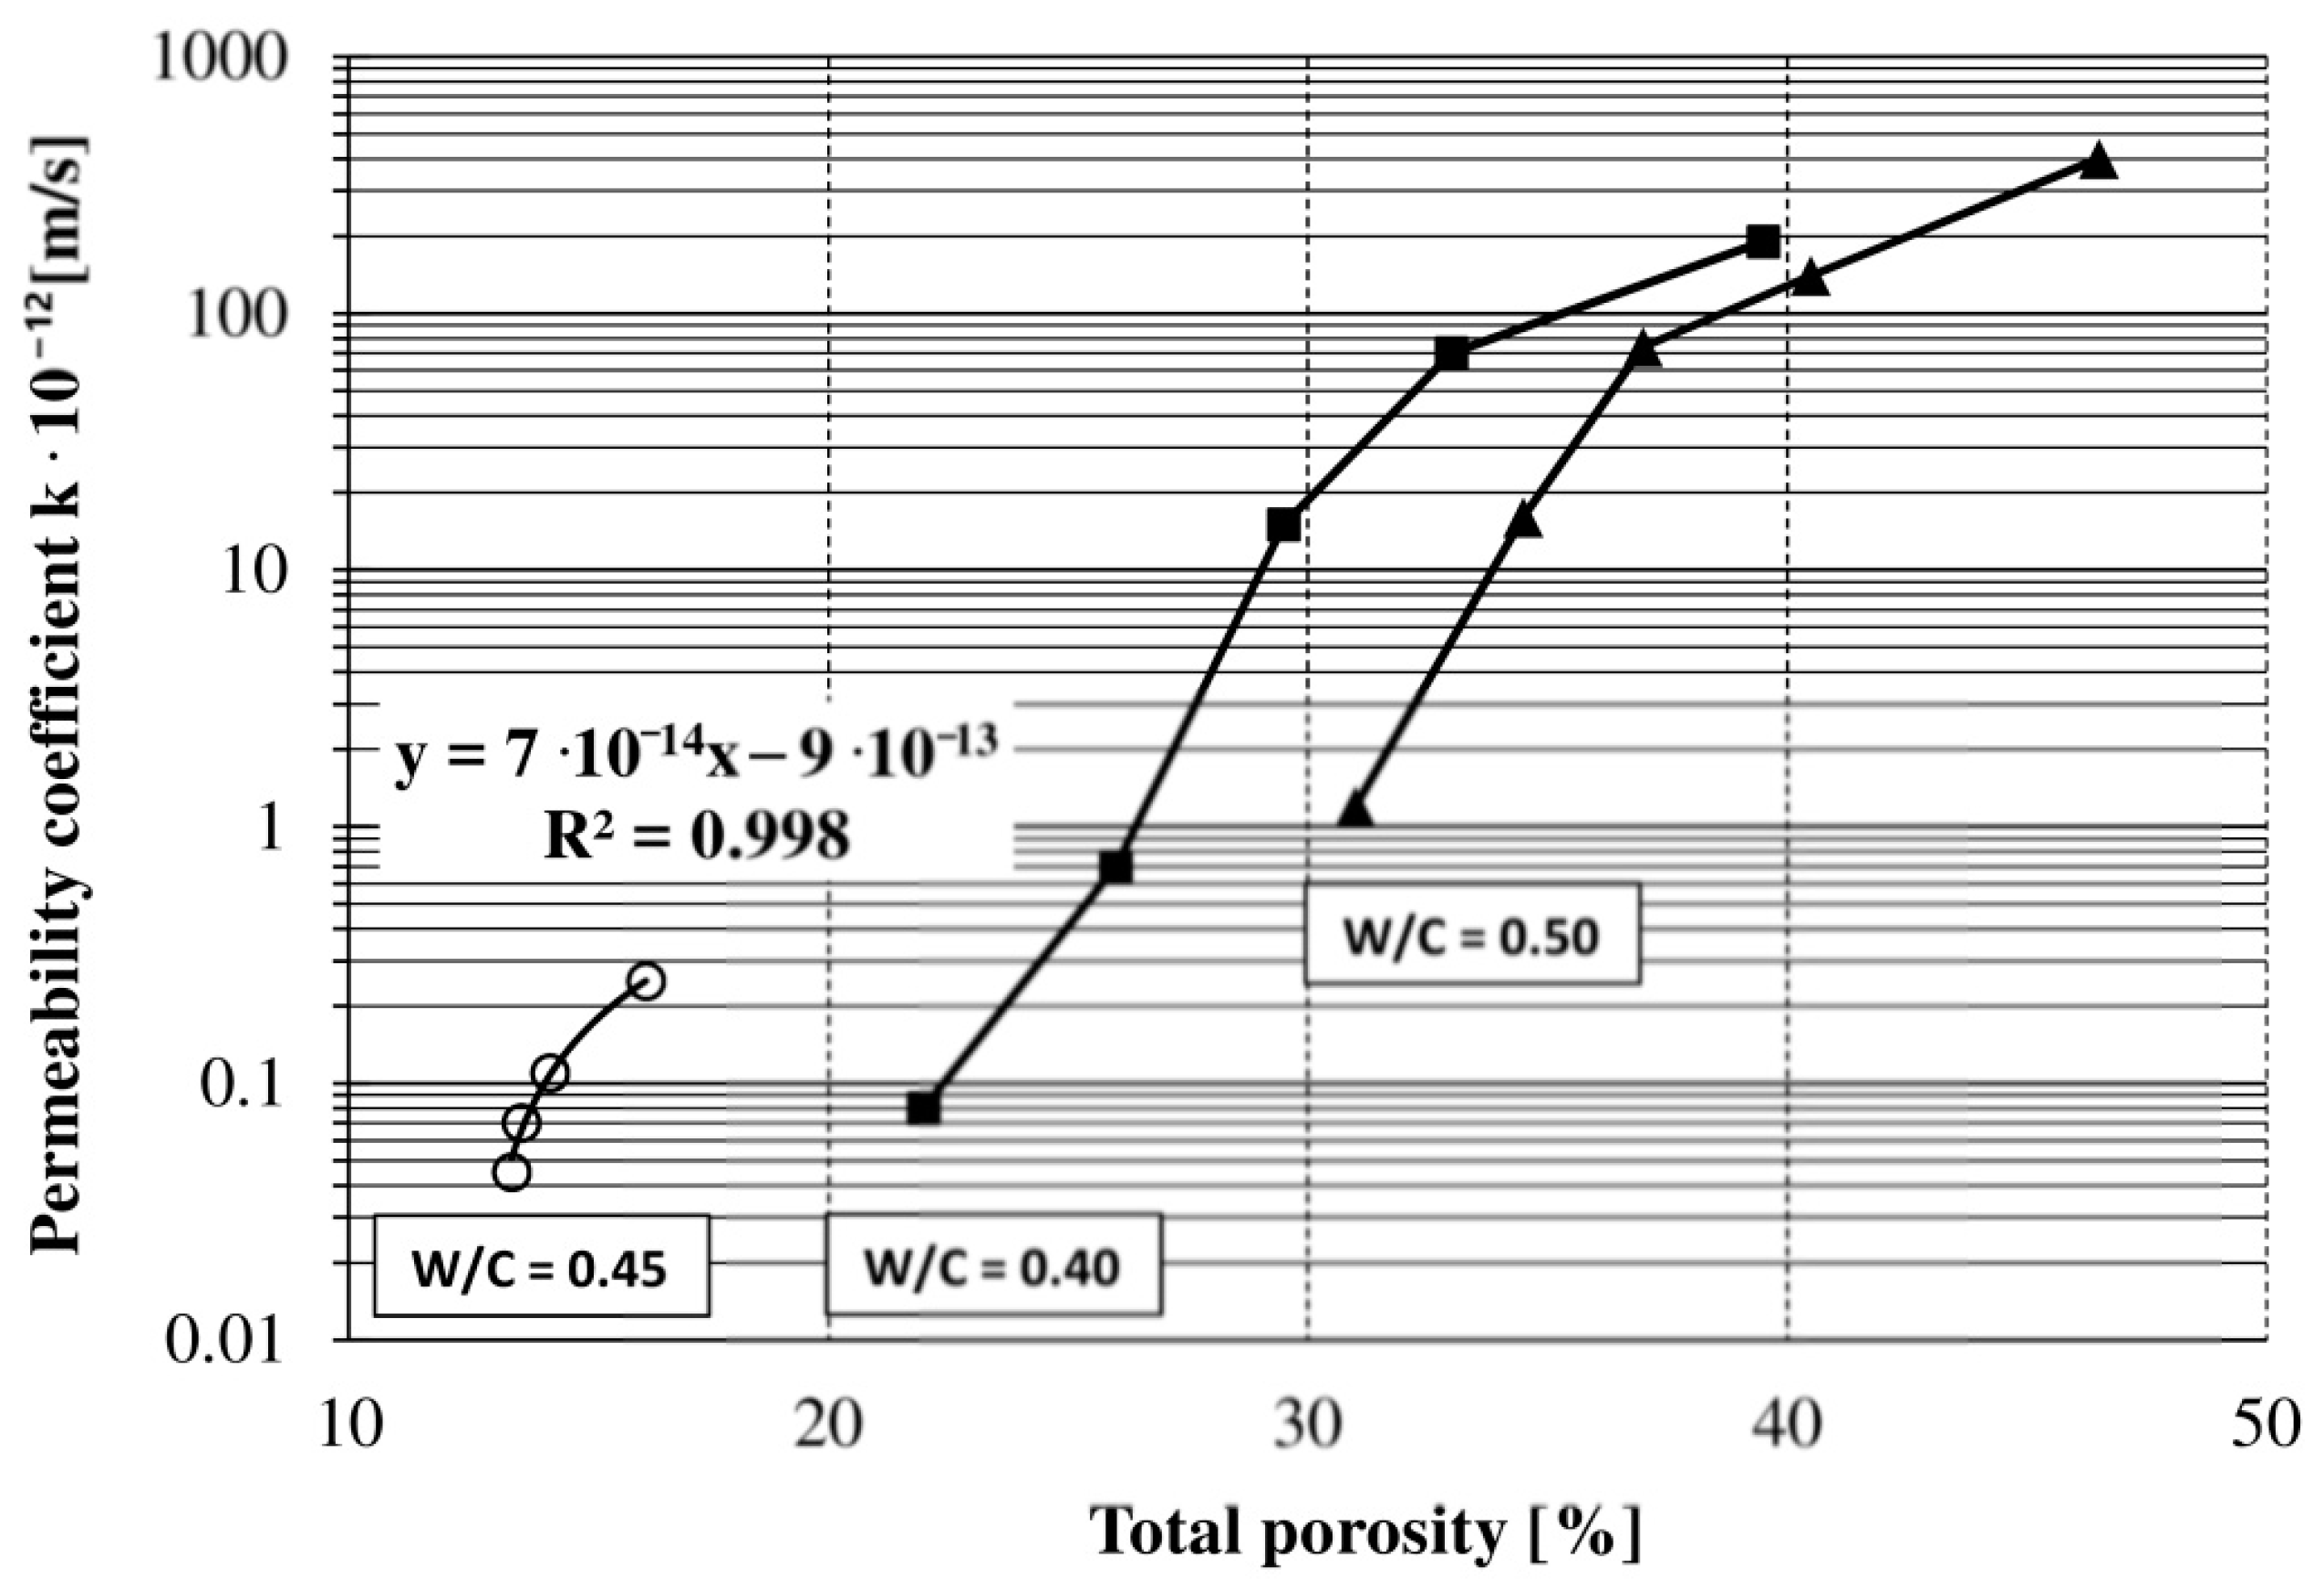
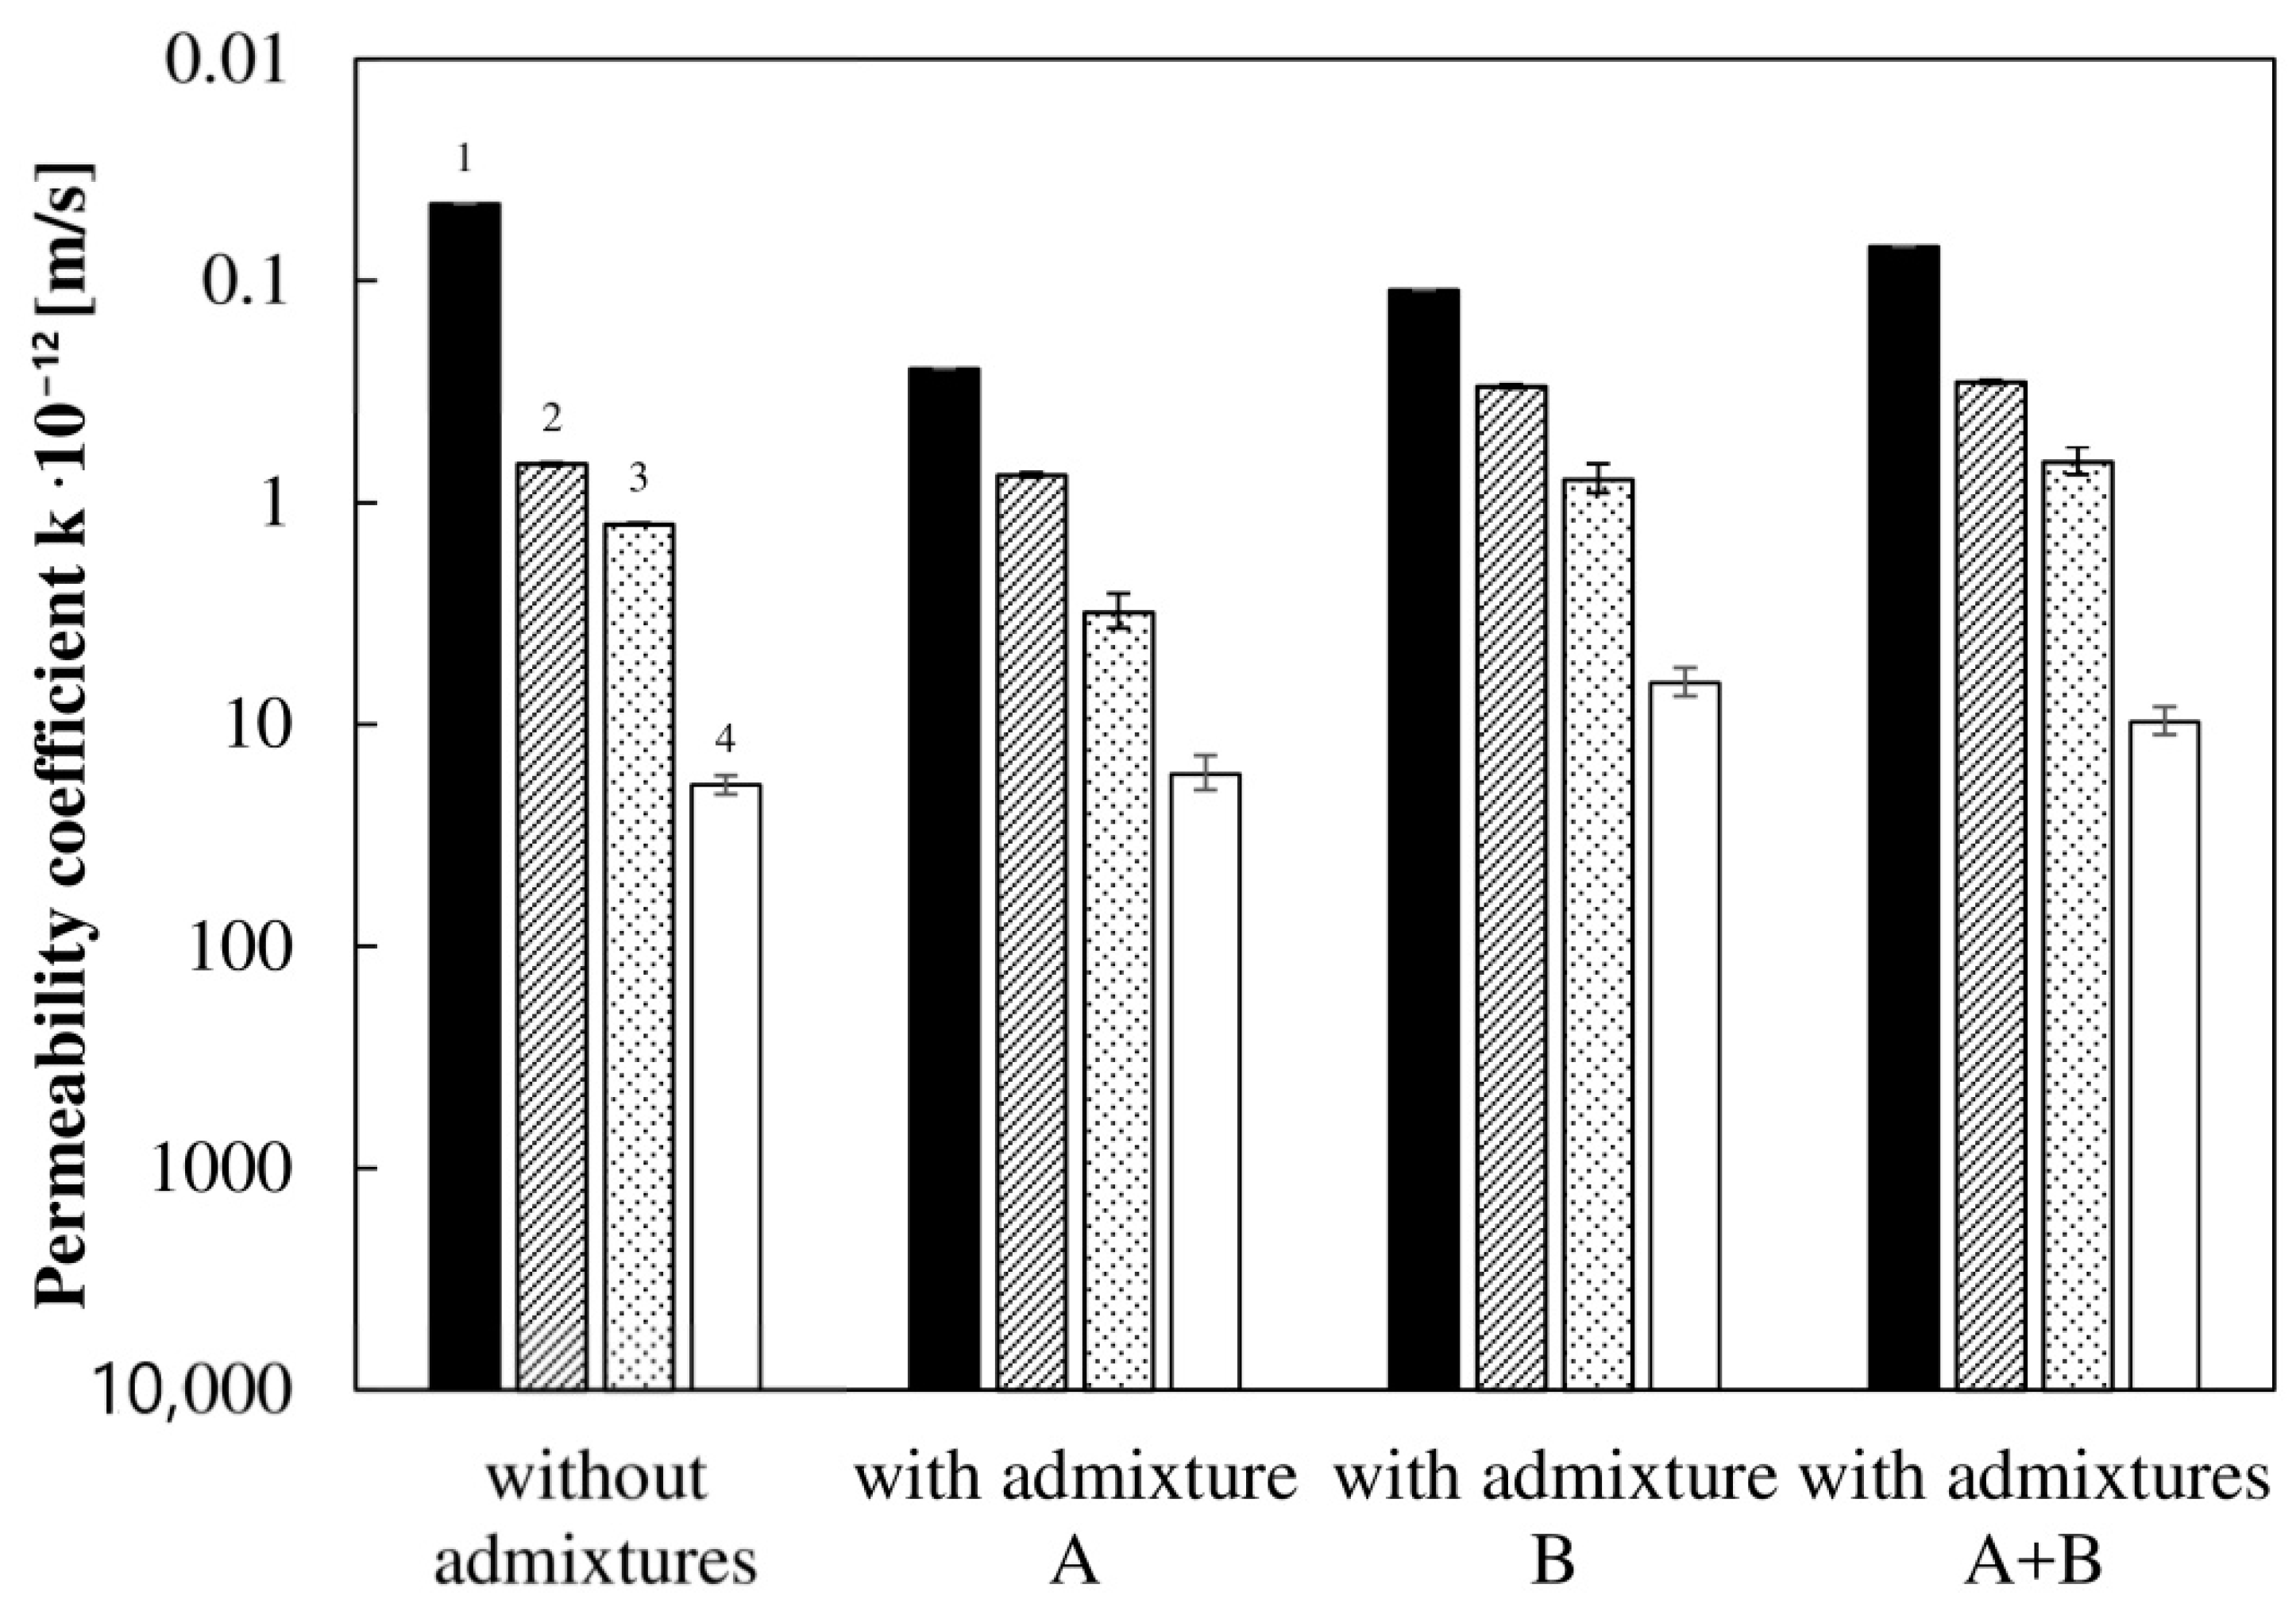
3.2. Values of the Concrete Permeability Coefficient Obtained by the Flow Pump Technique at a Constant Level of Hydraulic Head
4. Discussion
5. Conclusions
Author Contributions
Funding
Acknowledgments
Conflicts of Interest
References
- Robalo, K.; Soldado, E.; Costa, H.; Carvalho, L.; do Carmo, R.; Júlio, E. Durability and Time-Dependent Properties of Low-Cement Concrete. Materials 2020, 13, 3583. [Google Scholar] [CrossRef]
- Czarnecki, L.; Geryło, R.; Kuczyński, K. Concrete Repair Durability. Materials 2020, 13, 4535. [Google Scholar] [CrossRef]
- Starck, S.; Beushausen, H.; Alexander, M.; Torrent, R. Complementarity of in situ and laboratory-based concrete permeability measurements. Mater. Struct. 2017, 50, 177. [Google Scholar] [CrossRef]
- Phung, Q.T.; Maes, N.; De Schutter, G.; Jacques, G.; Ye, G. Determination of water permeability of cementitious materials using a controlled constant flow method. Const. Build. Mater. 2013, 47, 1488–1496. [Google Scholar] [CrossRef]
- Aldea, C.M.; Shah, S.P.; Karr, A. Permeability of cracked concrete. Mater. Struct. 1999, 32, 370–376. [Google Scholar] [CrossRef]
- Nokken, M.R.; Hooton, Ć.R.D. Using pore parameters to estimate permeability or conductivity of concrete. Mater. Struct. 2008, 41, 1. [Google Scholar] [CrossRef]
- Ramachandran, V.S.; Beaudoin, J.J. Handbook of Analytical Techniques in Concrete Science and Technology. Principles, Techniques and Applications; William Andrew Publishing LLC: Norwich, NY, USA, 2001. [Google Scholar]
- Kameche, Z.A.; Ghomari, F.; Choinska, M.; Khelidj, A. Assessment of liquid water and gas permeabilities of partially saturated ordinary concrete. Constr. Build. Mater. 2014, 65, 551–565. [Google Scholar] [CrossRef]
- Nguyen, M.H.; Nakarai, K.; Kubori, Y.; Nishio, S. Validation of simple nondestructive method for evaluation of cover concrete quality. Constr. Build. Mater. 2019, 201, 430–438. [Google Scholar] [CrossRef]
- El-Dieb, A.S.; Hooton, R.D. Water-permeability measurement of high performance concrete using a high-pressure triaxial cell. Cem. Concr. Res. 1995, 25, 1199–1208. [Google Scholar] [CrossRef]
- Yonghao, F.; Zhongli, W.; Yue, Z. Time-dependent water permeation behavior of concrete under constant hydraulic pressure. Water Sci. Eng. 2008, 1, 61–66. [Google Scholar] [CrossRef]
- Aiban, S.A.; Znidarčic, D. Evaluation of the flow-pump and constant head techniques for permeability measurements. Geotechnique 1989, 39, 655–666. [Google Scholar] [CrossRef]
- Head, K.H. Manual of Soil Laboratory Testing, 2nd ed.; Pentech Press: London, UK, 1992. [Google Scholar]
- Esaki, T.; Zhang, M.; Takeshita, A.; Mitani, Y. Rigorous theoretical analysis of a flow pump permeability test. Geotech. Test. J. 1996, 19, 241–246. [Google Scholar]
- Zhang, M.; Esaki, T.; Olsen, H.W.; Mitani, Y. Integrated shear and flow parameter measurement. Geotech. Test. J. 1997, 20, 296–303. [Google Scholar] [CrossRef]
- Zhang, M.; Takahashi, M.; Morin, R.H.; Esaki, T. Theoretical Evaluation of the Transient Response of Constant Head and Constant Flow Rate Permeability Tests. Geotech. Test. J. 1998, 21, 52–57. [Google Scholar] [CrossRef]
- Sobolewski, M. Various methods of the measurement of the permeability coefficient in soils—Possibilities and application. Electron. J. Pol. Agric. Univ. 2005, 8, 13. [Google Scholar]
- Koda, E.; Osinski, P. Bentonite cut-off walls: Solution for landfill remedial works. Environ. Geotech. 2017, 4, 223–232. [Google Scholar] [CrossRef]
- Cabalar, A.F.; Wiszniewski, M.; Skutnik, Z. Effects of xanthan gum biopolymer on the permeability, odometer, unconfined compressive and triaxial shear behavior of a sand. Soil Mech. Found. Eng. 2017, 54, 356–361. [Google Scholar] [CrossRef]
- Olsen, H.W. Darcy’s Law in Saturated Kaolinite. Water Resour. Res. 1966, 2, 287–295. [Google Scholar] [CrossRef]
- Olsen, H.W.; Nichols, R.W.; Rice, T.L. Low gradient permeability measurements in triaxial system. Geotechnique 1985, 35, 145–157. [Google Scholar] [CrossRef]
- Pazderka, J.; Hájková, E. The speed of the crystalline admixture’s waterproofing effect in concrete. Key Eng. Mater. 2016, 722, 108–112. [Google Scholar] [CrossRef]
- Li, H.; Sun, D.; Wang, Z.; Huang, F.; Yi, Z.; Yang, Z.; Zhang, Y. A Review on the Pumping Behavior of Modern Concrete. J. Advan. Concr. Technol. 2020, 18, 352–363. [Google Scholar] [CrossRef]
- Plank, J.; Sakai, E.; Miao, C.W.; Yu, C.; Hong, J.X. Chemical admixtures—Chemistry, applications and their impact on concrete microstructure and durability. Cem. Concr. Res. 2015, 78, 81–99. [Google Scholar] [CrossRef]
- Coppola, L.; Coffetti, D.; Crotti, E. Innovative carboxylic acid waterproofing admixture for self-sealing watertight concretes. Constr. Build. Mater. 2018, 171, 817–824. [Google Scholar] [CrossRef]
- Zhang, Y.; Kong, X. Correlations of the dispersing capability of NSF and PCE types of superplasticizer and their impacts on cement hydration with the adsorption in fresh cement pastes. Cem. Concr. Res. 2015, 69, 1–9. [Google Scholar] [CrossRef]
- Ao, L.; Zhao, W.; Lei, Q.; Wang, D.; Guan, Y.; Liu, K.; Guo, T.; Fan, X.; Wei, X. Synthesis of a novel polycarboxylate superplasticizer with hyperbranched structure. ChemistrySelect 2018, 3, 13493–13496. [Google Scholar] [CrossRef]
- CEN. Testing Hardened Concrete. Depth of Penetration of Water under Pressure; EN 12390-8:2009; CEN: Brussels, Belgium, 2009. [Google Scholar]
- CEN. Cement—Part1: Composition, Specifications and Conformity Criteria for Common Cements; EN 197-1:2011; CEN: Brussels, Belgium, 2011. [Google Scholar]
- Coppola, L.; Lorenzi, S.; Kara, P.; Garlati, S. Performance and Compatibility of Phosphonate-Based Superplasticizers for Concrete. Buildings 2017, 7, 62. [Google Scholar] [CrossRef]
- Lee, J.; Lee, T.; Choi, H.; Lee, D.-E. Assessment of Optimum CaO Content Range for High Volume FA Based Concrete Considering Durability Properties. Appl. Sci. 2020, 10, 6944. [Google Scholar] [CrossRef]
- CEN. Testing Fresh Concrete. Density; EN 12350-6:2009; CEN: Brussels, Belgium, 2009. [Google Scholar]
- CEN. Testing Fresh Concrete. Air Content. Pressure Methods; EN 12350-7:2009; CEN: Brussels, Belgium, 2009. [Google Scholar]
- Webb, P.A.; Orr, C.; Camp, R.W.; Olivier, J.P.; Yunes, Y.S. Analytical Methods in Fine Particle Technology; Micromeritics Instruments Corporation: Norcross, GA, USA, 1997. [Google Scholar]
- Ibrahim, M.; Issa, M. Evaluation of chloride and water penetration in concrete with cement containing limestone and IPA. Constr. Build. Mater. 2016, 129, 278–288. [Google Scholar] [CrossRef]
- Śliwiński, J. Water permeability of concrete effect of tests conditions on coefficient from depth penetration method. Arch. Civ. Eng. 2001, XLVII, 201–213. [Google Scholar]
- Hedegaard, S.E.; Hansen, T.C. Water permeability of fly ash concretes. Mater. Struct. 1992, 25, 381–387. [Google Scholar] [CrossRef]
- Chen, J.J.; Kwan, A.K.H.; Jiang, Y. Adding limestone fines as cement paste replacement to reduce water permeability and sorptivity of concrete. Constr. Build. Mater. 2014, 56, 87–93. [Google Scholar] [CrossRef]
- Scherer, G.W.; Valenza, J.J.; Simmons, G. New method to measure liquid permeability in porous materials. Cem. Concr. Res. 2007, 37, 386–397. [Google Scholar] [CrossRef]
- Ludirdja, D.; Berger, R.L.; Young, J.F. Simple method for measuring water permeability of concrete. ACI Mater. J. 1989, 86, 433–439. [Google Scholar] [CrossRef]
- Vuorinen, J. Application of diffusion theory to permeability tests on concrete. Part I: Depth of water penetration into concrete and coefficient of permeability. Mag. Concr. Res. 1985, 37, 153–161. [Google Scholar] [CrossRef]
- Neville, A.M. Properties of concrete, Edition Eyrolles, 4th ed.; Longman Group Ltd.: Longman, UK, 2000. [Google Scholar]
- ASTM. Standard Test Method for Permeability of Granular Soils (Constant Head); D2434-68:2006; ASTM International: West Conshohocken, PA, USA, 2006. [Google Scholar]
- Banthia, N.; Biparva, A.; Mindess, S. Permeability of concrete under stress. Cem. Concr. Res. 2005, 35, 1651–1655. [Google Scholar] [CrossRef]
- Choinska, M.; Khelidj, A.; Chatzigeorgiou, G.; Pijaudier-Cabot, G. Effects and interactions of temperature and stress-level related damage on permeability of concrete. Cem. Concr. Res. 2007, 37, 79–88. [Google Scholar] [CrossRef]
- Hoseini, M.; Bindiganavile, V.; Banthia, N. The effect of mechanical stress on permeability of concrete: A review. Cem. Concr. Compos. 2009, 31, 213–220. [Google Scholar] [CrossRef]
- Amriou, A.; Bencheikh, M. New experimental method for evaluating the water permeability of concrete by a lateral flow procedure on a hollow cylindrical test piece. Constr. Build. Mater. 2017, 151, 642–649. [Google Scholar] [CrossRef]
- Desmettre, C.; Charron, J.-P. Novel water permeability device for reinforced concrete under load. Mater. Struct. 2011, 44, 1713–1723. [Google Scholar] [CrossRef]
- Tsivilis, S.; Tsantilas, J.; Kakali, G.; Chaniotakis, E.; Sakellariou, A. The permeability of Portland limestone cement concrete. Cem. Concr. Res. 2003, 33, 1465–1471. [Google Scholar] [CrossRef]
- DIN 1045: 1988. Beton und Stahlbeton, Bemessung und Ausfürung; Beuth Verlag GmbH: Berlin, Germany, 1988. [Google Scholar]
- Safiuddin, M.; Hearn, N. Comparison of ASTM saturation techniques for measuring the permeable porosity of concrete. Cem. Concr. Res. 2005, 35, 1008–1013. [Google Scholar] [CrossRef]
- Das, B.B.; Kondraivendhan, B. Implication of pore size distribution parameters on compressive strength, permeability and hydraulic diffusivity of concrete. Constr. Build. Mater. 2012, 28, 382–386. [Google Scholar] [CrossRef]
- Amnadnua, K.; Tangchirapat, W.; Jaturapitakkul, C.H. Strength, water permeability, and heat evolution of high strength concrete made from the mixture of calcium carbide residue and fly ash. Mater. Des. 2013, 51, 894–901. [Google Scholar] [CrossRef]
- Martin, W.D.; Kaye, N.B.; Putman, B.J. Impact of vertical porosity distribution on the permeability of pervious concrete. Constr. Build. Mater. 2014, 59, 78–84. [Google Scholar] [CrossRef]
- Chandrappa, A.K.; Biligiri, K.P. Comprehensive investigation of permeability characteristics of pervious concrete. A hydrodynamic approach. Constr. Build. Mater. 2016, 123, 627–637. [Google Scholar] [CrossRef]
- Skutnik, Z.; Bajda, M.; Lech, M. The selection of sealing technologies of the subsoil and hydrotechnical structures and quality assurance. Open Eng. 2020, 9, 420–427. [Google Scholar] [CrossRef]
- Issaadi, N.; Hamami, A.A.; Belarbi, R.; Ait-Mokhtar, A. Experimental assessment of the spatial variability of porosity, permeability and sorption isotherms in an ordinary building concrete. Int. J. Heat Mass Transf. 2017, 53, 3037–3048. [Google Scholar] [CrossRef]
- Szpetulski, J. Impact of care on selected concrete properties. Acta Sci. Pol. Archit. 2019, 18, 23–32. [Google Scholar] [CrossRef]
- Ye, G.; Lura, P.; van Breugel, K. Modelling of water permeability in cementitious materials. Mater. Struct. 2006, 39, 877–885. [Google Scholar] [CrossRef]


| Component | Content |
|---|---|
| Cement CEM I 32.5 R (C), kg | 300 |
| Water (W), dm3 | 135 |
| Sand 0–2 mm, kg | 713 |
| Gravel 2–16 mm, kg | 1323 |
| W/C A/C (% by cement weight) | 0.45 1.6 |
| B/C (% by cement weight) | 0.8 |
| Type of Material | Concrete Mix | Hardened Concrete | ||||
|---|---|---|---|---|---|---|
| Density (kg/m3) | Apparent Air Content (%) | Total Porosity (%) | Coefficient of Variation n * = 6 (%) | Concrete Compressive Strength at 28 Days (MPa) | Coefficient of Variation n = 4 (%) | |
| Without admixture | 2367 | 2.8 | 13.4 | 0.3 | 39.8 | 3.0 |
| With admixture A | 2306 | 5.4 | 16.2 | 0.3 | 47.8 | 2.2 |
| With superplasticizer B | 2341 | 4.2 | 14.2 | 0.4 | 44.0 | 3.5 |
| With admixtures A + B | 2343 | 3.2 | 13.6 | 0.3 | 47.4 | 2.8 |
| Type of Concrete | MWPD (cm) | CV n = 3 (%) | AWPD (cm) | Permeability Coefficient | CV n = 3 (%) | ||
|---|---|---|---|---|---|---|---|
| vpawf (m/s) | a/mpd (m/s) | aac (m/s) | |||||
| Without admixture | 3.4 | 2.4 | 2.2 | 6.69 × 10⁻¹³ | 1.88 × 10⁻¹¹ | 1.25 × 10⁻¹² | 4.8 |
| With admixture A | 3.9 | 4.4 | 2.1 | 7.51 × 10⁻¹³ | 1.68 × 10⁻¹¹ | 3.12 × 10⁻¹² | 8.9 |
| With admixture B | 2.2 | 3.7 | 1.3 | 2.99 × 10⁻¹³ | 6.51 × 10⁻¹² | 7.85 × 10⁻¹³ | 7.4 |
| With admixtures A + B | 2.3 | 3.5 | 1.6 | 2.86 × 10⁻¹³ | 9.73 × 10⁻¹² | 6.54 × 10⁻¹³ | 7.1 |
| Type of Concrete | Water Pressure (MPa) | Pressure Duration Time (hours) | Relative Content of Pores Filled with Water (%) | Total Porosity (%) | Permeability Coefficient (m/s) |
|---|---|---|---|---|---|
| Without admixture | 0.5 | 72 | 1.5 | 13.4 | 4.50 × 10⁻¹⁴ |
| With admixture A | 0.5 | 72 | 1.3 | 16.2 | 2.5 × 10⁻¹³ |
| With superplasticizer B | 0.5 | 72 | 1.6 | 14.2 | 1.1 × 10⁻¹³ |
| With admixtures A + B | 0.5 | 72 | 1.4 | 13.6 | 7.0 × 10⁻¹⁴ |
Publisher’s Note: MDPI stays neutral with regard to jurisdictional claims in published maps and institutional affiliations. |
© 2020 by the authors. Licensee MDPI, Basel, Switzerland. This article is an open access article distributed under the terms and conditions of the Creative Commons Attribution (CC BY) license (http://creativecommons.org/licenses/by/4.0/).
Share and Cite
Skutnik, Z.; Sobolewski, M.; Koda, E. An Experimental Assessment of the Water Permeability of Concrete with a Superplasticizer and Admixtures. Materials 2020, 13, 5624. https://doi.org/10.3390/ma13245624
Skutnik Z, Sobolewski M, Koda E. An Experimental Assessment of the Water Permeability of Concrete with a Superplasticizer and Admixtures. Materials. 2020; 13(24):5624. https://doi.org/10.3390/ma13245624
Chicago/Turabian StyleSkutnik, Zdzisław, Mariusz Sobolewski, and Eugeniusz Koda. 2020. "An Experimental Assessment of the Water Permeability of Concrete with a Superplasticizer and Admixtures" Materials 13, no. 24: 5624. https://doi.org/10.3390/ma13245624
APA StyleSkutnik, Z., Sobolewski, M., & Koda, E. (2020). An Experimental Assessment of the Water Permeability of Concrete with a Superplasticizer and Admixtures. Materials, 13(24), 5624. https://doi.org/10.3390/ma13245624