Figure 1.
Pavement structure at the arch expansion section.
Figure 1.
Pavement structure at the arch expansion section.
Figure 2.
The details of the salt content of the test process.
Figure 2.
The details of the salt content of the test process.
Figure 3.
The maximum temperature and the minimum temperature each month.
Figure 3.
The maximum temperature and the minimum temperature each month.
Figure 4.
The aggregates screen size: (a) 0~0.075 mm, (b) 0.075~0.6 mm, (c) 0.6~2.36 mm, (d) 2.36~4.75 mm, (e) 4.75~9.5 mm, (f) 9.5~19 mm, (g) 19~31.5 mm.
Figure 4.
The aggregates screen size: (a) 0~0.075 mm, (b) 0.075~0.6 mm, (c) 0.6~2.36 mm, (d) 2.36~4.75 mm, (e) 4.75~9.5 mm, (f) 9.5~19 mm, (g) 19~31.5 mm.
Figure 5.
Solubility of thenardite and mirabilite versus temperature (The data digitized from Steiger and Asmussen, 2008) [
29].
Figure 5.
Solubility of thenardite and mirabilite versus temperature (The data digitized from Steiger and Asmussen, 2008) [
29].
Figure 6.
Effect of temperature on the amount of sodium sulfate dissolved in water. (a) 1% sodium sulfate. (b) 3% sodium sulfate.
Figure 6.
Effect of temperature on the amount of sodium sulfate dissolved in water. (a) 1% sodium sulfate. (b) 3% sodium sulfate.
Figure 7.
The relationship curves between water content and dry density.
Figure 7.
The relationship curves between water content and dry density.
Figure 8.
The influence of temperature on the compaction results.
Figure 8.
The influence of temperature on the compaction results.
Figure 9.
Scanning electron microscopy (SEM) image of specimens with different temperature. (a) Cement: 3%, sodium sulfate: 3%, temperature: 10 °C. (b) Cement: 3%, sodium sulfate: 3%, temperature: 20 °C. (c) Cement: 3%, sodium sulfate: 3%, temperature: 35 °C.
Figure 9.
Scanning electron microscopy (SEM) image of specimens with different temperature. (a) Cement: 3%, sodium sulfate: 3%, temperature: 10 °C. (b) Cement: 3%, sodium sulfate: 3%, temperature: 20 °C. (c) Cement: 3%, sodium sulfate: 3%, temperature: 35 °C.
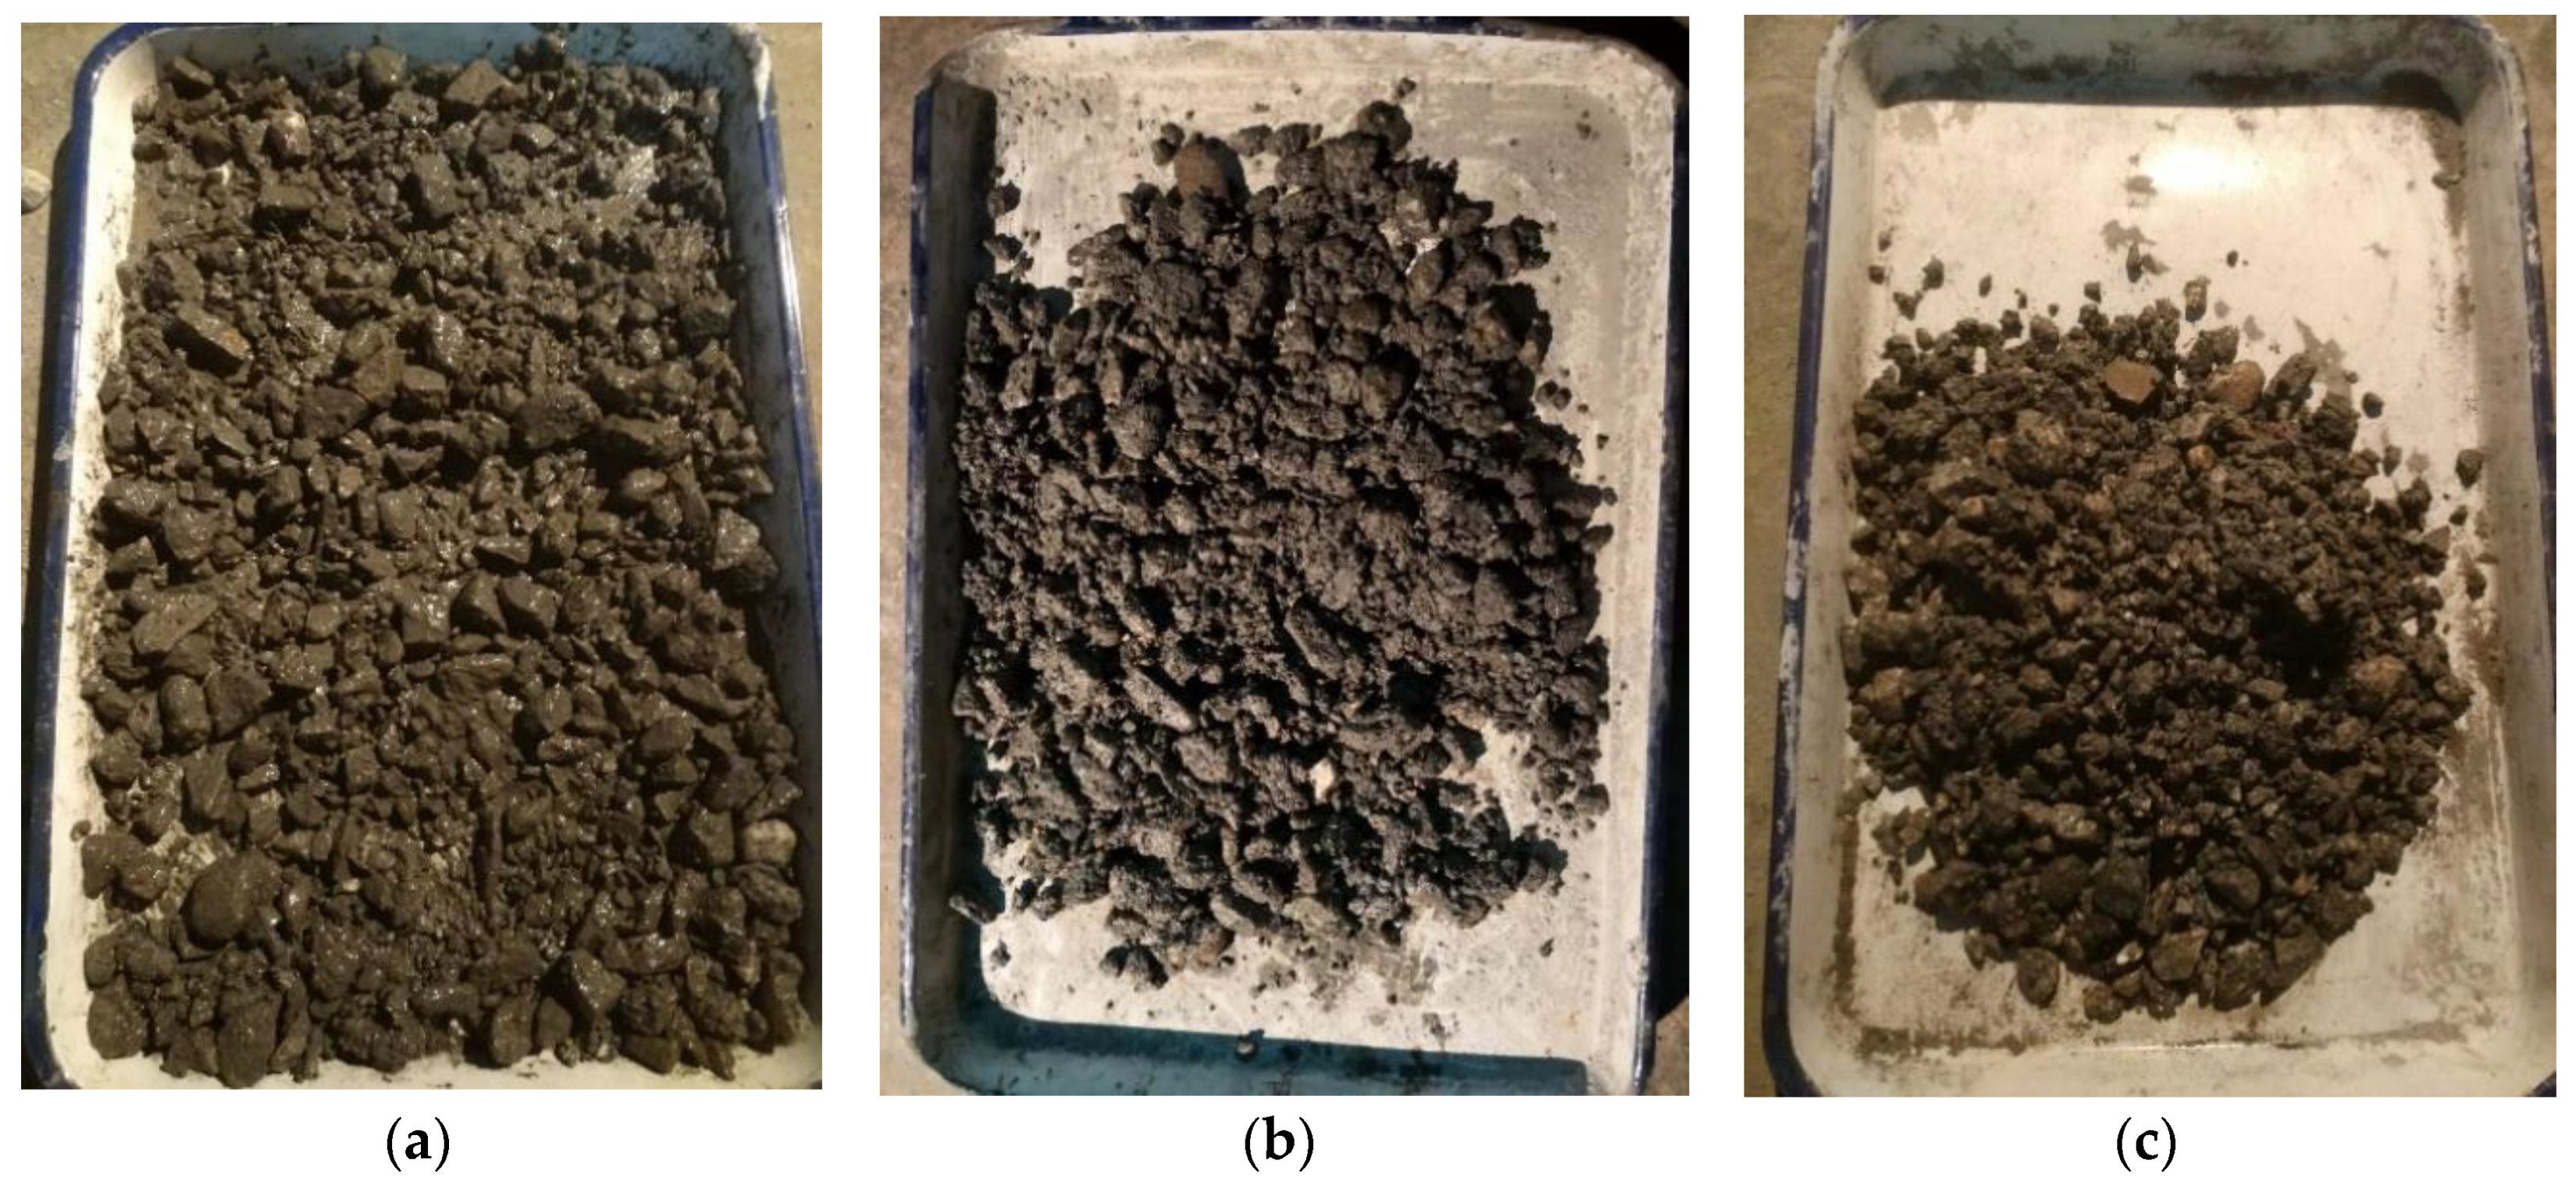
Figure 10.
The unreal dry phenomenon in mixing the cement stabilized macadam materials. (a) 0% sodium sulfate. (b) 1% sodium sulfate. (c) 3% sodium sulfate.
Figure 10.
The unreal dry phenomenon in mixing the cement stabilized macadam materials. (a) 0% sodium sulfate. (b) 1% sodium sulfate. (c) 3% sodium sulfate.
Figure 11.
The relationship curves between water content and dry density.
Figure 11.
The relationship curves between water content and dry density.
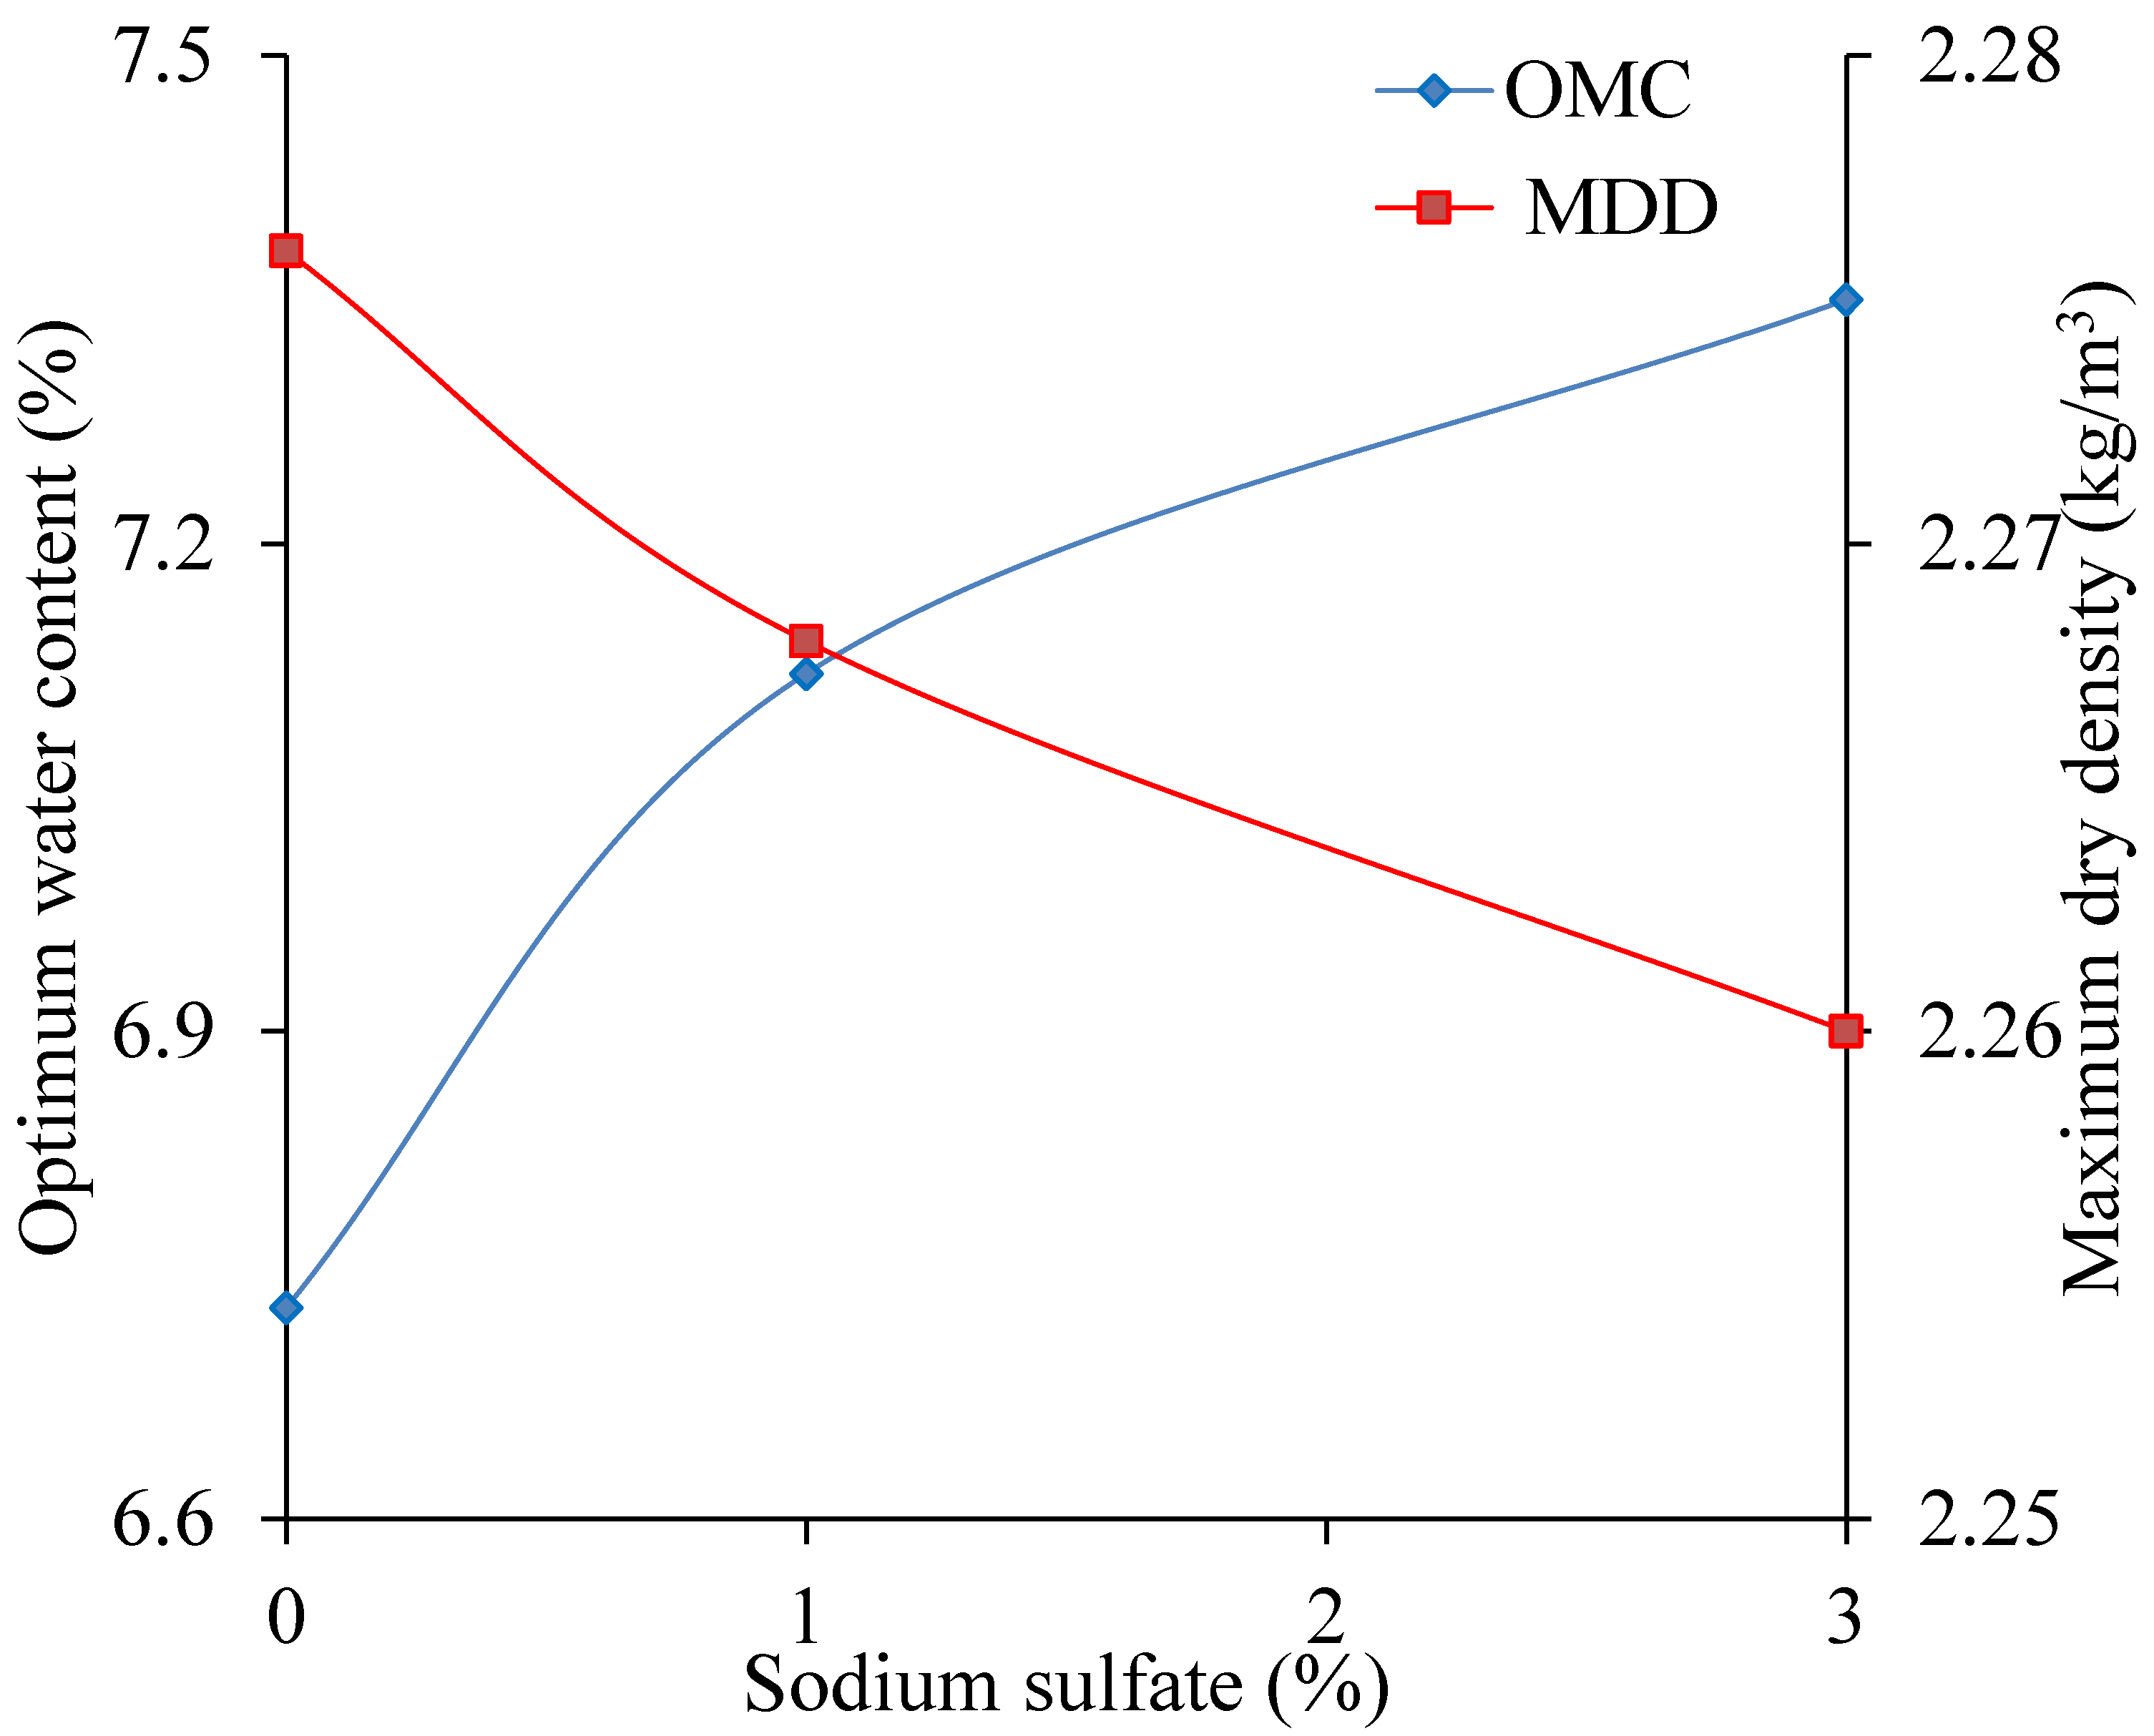
Figure 12.
The influence of the sodium sulfate content on the compaction results.
Figure 12.
The influence of the sodium sulfate content on the compaction results.
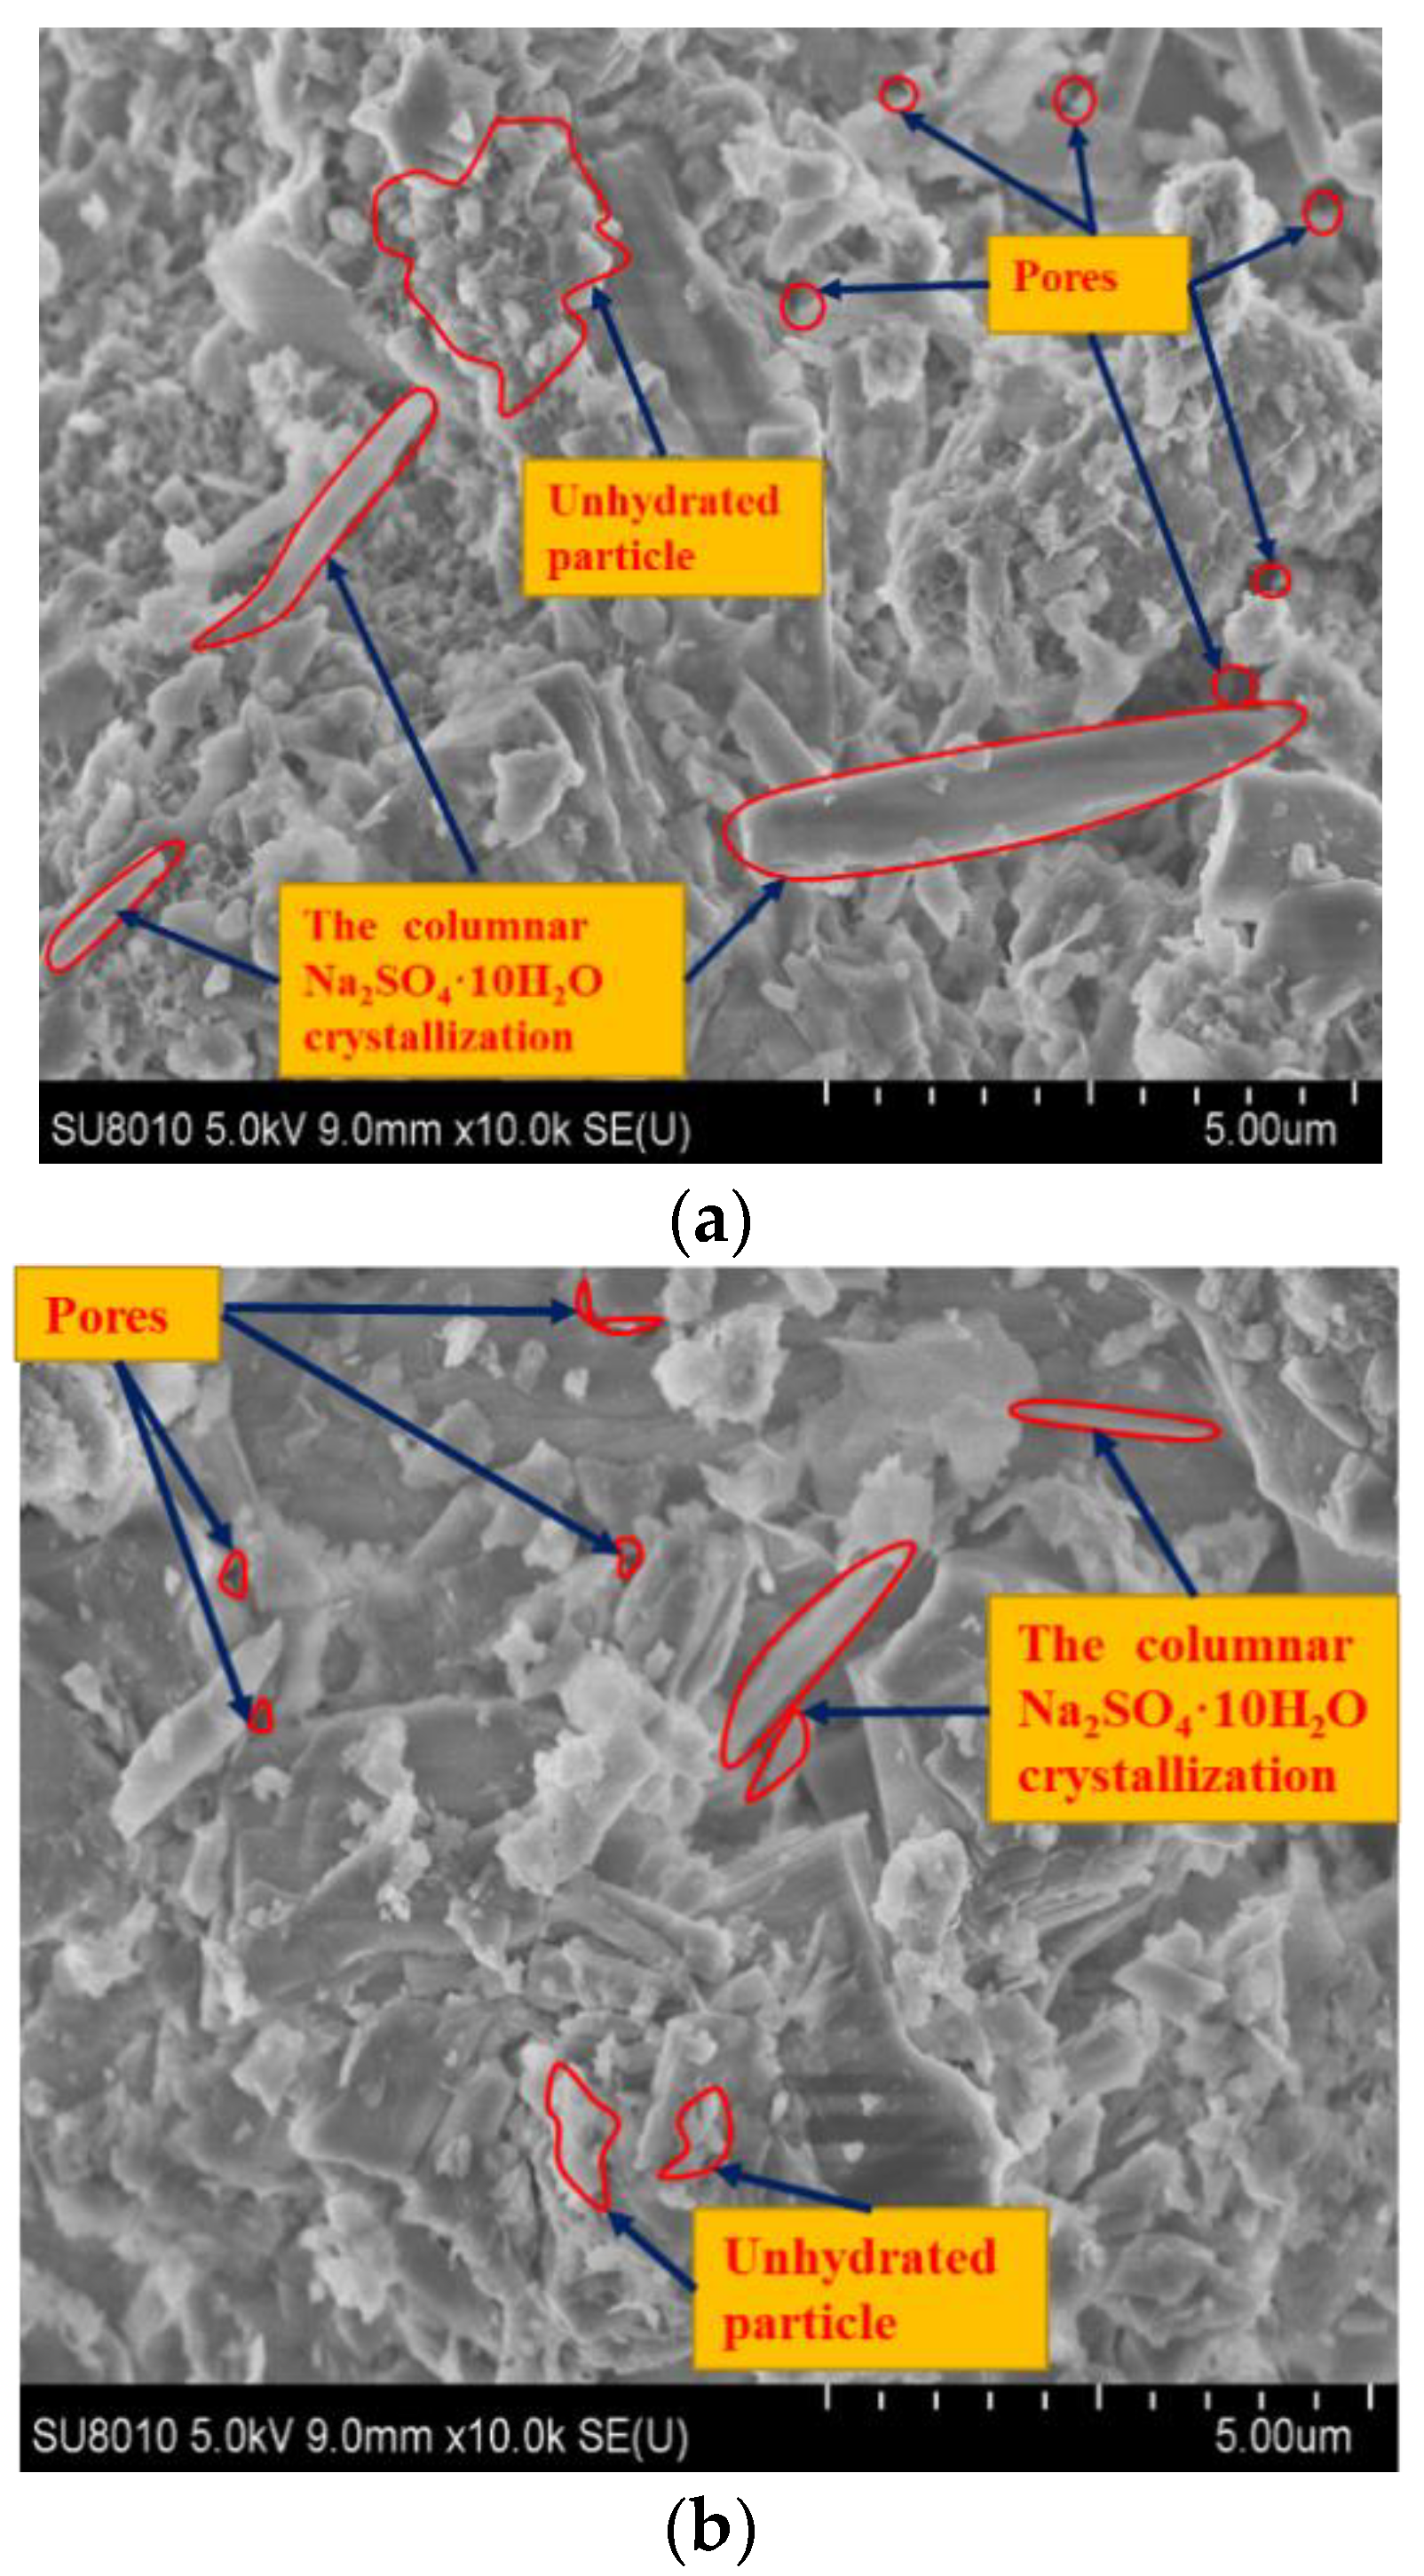
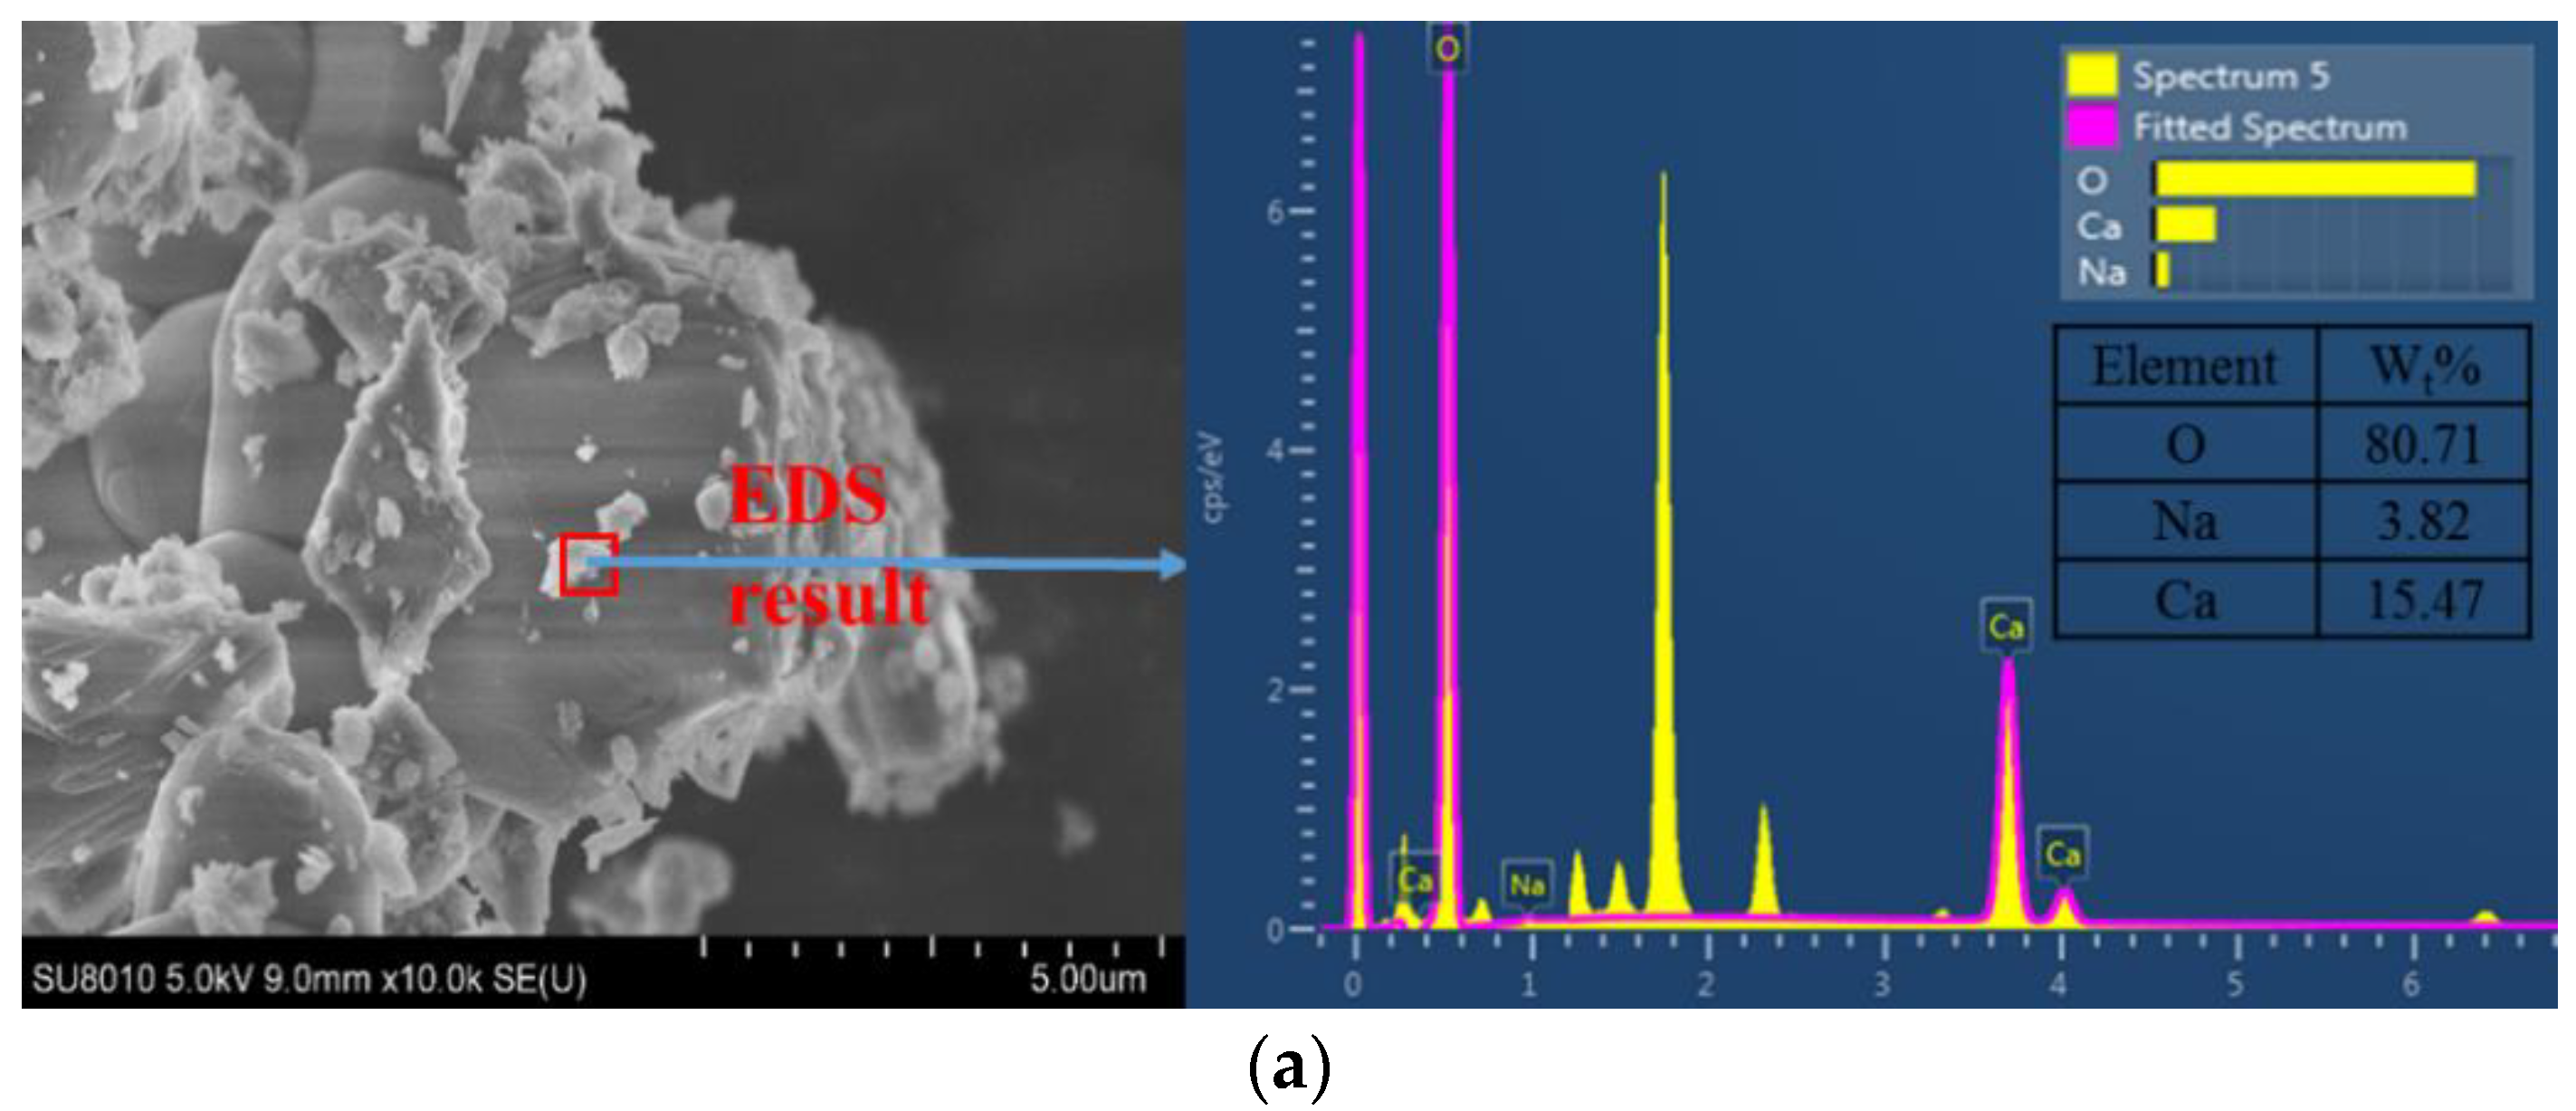
Figure 13.
SEM images and corresponding energy-dispersive spectroscopy (EDS) results of specimens with different Sodium sulfate content. (a) Cement: 3%, sodium sulfate: 0%, temperature: 10 °C. (b) Cement: 3%, sodium sulfate: 1%, temperature: 10 °C. (c) Cement: 3%, sodium sulfate: 3%, temperature: 10 °C.
Figure 14.
The relationship curves between water content and dry density.
Figure 14.
The relationship curves between water content and dry density.
Figure 15.
The influence of the cement content on the compaction results.
Figure 15.
The influence of the cement content on the compaction results.
Figure 16.
SEM images of specimens with different cement content. (a) Cement: 3%, sodium sulfate: 3%, temperature: 10 °C. (b) Cement: 4%, sodium sulfate: 3%, temperature: 10 °C. (c) Cement: 5%, sodium sulfate: 3%, temperature: 10 °C.
Figure 16.
SEM images of specimens with different cement content. (a) Cement: 3%, sodium sulfate: 3%, temperature: 10 °C. (b) Cement: 4%, sodium sulfate: 3%, temperature: 10 °C. (c) Cement: 5%, sodium sulfate: 3%, temperature: 10 °C.
Figure 17.
The influence of three factors on the compaction results.
Figure 17.
The influence of three factors on the compaction results.
Table 1.
The content of soluble salt, SO42− ion, and Cl− ion in subgrade filler.
Table 1.
The content of soluble salt, SO42− ion, and Cl− ion in subgrade filler.
| Number | Soluble Salt (g/kg) | Cl− (mmol/kg) | SO42− (mmol/kg) | C(Cl−)/2C(SO42−) |
|---|
| 1 | 3.090 | 12.901 | 66.708 | 0.097 |
| 2 | 7.850 | 5.775 | 16.667 | 0.173 |
| 3 | 11.600 | 8.225 | 135.000 | 0.030 |
| 4 | 10.110 | 6.620 | 109.792 | 0.030 |
| 5 | 8.750 | 8.507 | 55.042 | 0.077 |
Table 2.
The content of soluble salt, SO42− ion, and Cl− ion of cement-stabilized macadam base materials in filed.
Table 2.
The content of soluble salt, SO42− ion, and Cl− ion of cement-stabilized macadam base materials in filed.
| Number | Soluble Salt (g/kg) | Cl− (mmol/kg) | SO42− (mmol/kg) | C(Cl−)/2C(SO42−) |
|---|
| 1 | 1.280 | 2.535 | 21.667 | 0.058 |
| 2 | 2.720 | 11.549 | 25.833 | 0.223 |
| 3 | 1.240 | 1.690 | 6.250 | 0.135 |
| 4 | 1.990 | 2.817 | 39.167 | 0.032 |
Table 3.
The content of soluble salt, SO42− ion, and Cl− ion in Water.
Table 3.
The content of soluble salt, SO42− ion, and Cl− ion in Water.
| Number | Soluble Salt(g/L) | Cl− (g/L) | SO42− (g/L) | Type |
|---|
| 1 | 1.765 | 0.103 | 0.376 | Fresh Water |
| 2 | 3.787 | 0.238 | 0.525 | Brackish Water |
| 3 | 8.767 | 0.144 | 0.560 | Salt Water |
Table 4.
Percent passing of aggregates.
Table 4.
Percent passing of aggregates.
| Screen Size (mm) | Percent Passing (%) |
|---|
| 0.075 | 1.5 |
| 0.6 | 11.5 |
| 2.36 | 22 |
| 4.75 | 27 |
| 9.5 | 48 |
| 19 | 77 |
| 31.5 | 100 |
Table 5.
Tap water indexes.
Table 5.
Tap water indexes.
| Test Items | PH | Soluble (mg/L) | Cl– (mg/L) | SO42− (mg/L) |
|---|
| Standard | ≥4.5 | ≤10,000 | ≤3500 | ≤1500 |
| Results | 7.45 | 213.0 | 62.63 | 269.6 |
Table 6.
The specific scheme of the tests.
Table 6.
The specific scheme of the tests.
| Schemes | Temperature (°C ) | Sodium Sulfate Content (%) | Cement Content (%) | Water Content (%) |
|---|
| 1 | 10 | 3 | 3 | 5 | 6 | 7 | 8 | 9 |
| 25 |
| 35 |
| 2 | 10 | 0 | 3 | 5 | 6 | 7 | 8 | 9 |
| 1 |
| 3 |
| 3 | 10 | 3 | 3 | 5 | 6 | 7 | 8 | 9 |
| 4 |
| 5 |
Table 7.
Factor levels in orthogonal tests.
Table 7.
Factor levels in orthogonal tests.
| Level | Temperature A (°C) | Sodium Sulfate Content B (%) | Cement Content C (%) |
|---|
| 1 | 10 | 0 | 3 |
| 2 | 25 | 1 | 4 |
| 3 | 35 | 3 | 5 |
Table 8.
The mass of each material.
Table 8.
The mass of each material.
| Test Mixture | A (°C) | B (kg) | C (kg) | Aggregates (kg) |
|---|
| 1 | 35 | 0 | 0.27 | 5.4 |
| 2 | 35 | 0.162 | 0.216 | 5.4 |
| 3 | 35 | 0.054 | 0.16 | 5.4 |
| 4 | 25 | 0 | 0.216 | 5.4 |
| 5 | 25 | 0.054 | 0.27 | 5.4 |
| 6 | 25 | 0.162 | 0.16 | 5.4 |
| 7 | 10 | 0.054 | 0.216 | 5.4 |
| 8 | 10 | 0.162 | 0.27 | 5.4 |
| 9 | 10 | 0 | 0.16 | 5.4 |
Table 9.
The results for orthogonal test.
Table 9.
The results for orthogonal test.
| Test Mixture | Factors | Maximum Dry Density (kg/m3) | Optimum Water Content (%) |
|---|
| A (°C) | B (%) | C (%) |
|---|
| 1 | 10 °C | 0% | 3% | 2.276 | 6.73 |
| 2 | 10 °C | 1% | 4% | 2.271 | 7.16 |
| 3 | 10 °C | 3% | 5% | 2.265 | 7.49 |
| 4 | 25 °C | 0% | 4% | 2.301 | 7.05 |
| 5 | 25 °C | 1% | 5% | 2.318 | 6.93 |
| 6 | 25 °C | 3% | 3% | 2.280 | 7.15 |
| 7 | 35 °C | 0% | 5% | 2.322 | 7.09 |
| 8 | 35 °C | 1% | 3% | 2.335 | 6.86 |
| 9 | 35 °C | 3% | 4% | 2.329 | 7.13 |
Table 10.
The range analysis results.
Table 10.
The range analysis results.
| Index of Test | Type | A (°C) | B (kg) | C (kg) |
|---|
| MDD (kg/m3) | Li1 | 2.271 | 2.300 | 2.297 |
| Li2 | 2.300 | 2.308 | 2.300 |
| Li3 | 2.329 | 2.291 | 2.302 |
| Optimal level | A3 | B2 | C3 |
| Ri | 0.058 | 0.017 | 0.005 |
| The order | A > B > C |
| OWC (%) | Li1 | 7.13 | 6.95 | 6.91 |
| Li2 | 7.04 | 6.98 | 7.11 |
| Li3 | 7.02 | 7.25 | 7.17 |
| Optimal level | A1 | B3 | C3 |
| Ri | 0.10 | 0.30 | 0.26 |
| The order | B > C > A |


