Article

Assessment of CVD- and PVD-Coated Carbides and PVD-Coated Cermet Inserts in the Optimization of Surface Roughness in Turning of AISI 1045 Steel

1
Departamento de Engenharia Mecânica, Universidade de Caxias Sul, Campus Universitário da Região dos Vinhedos, Bento Gonçalves, Rio Grande do Sul 95705-266, Brazil
2
Departamento de Engenharia Mecânica, Universidade Federal do Rio Grande do Sul, Porto Alegre, Rio Grande do Sul 90050-170, Brazil
3
Programa de Pós-Graduação em Engenharia Mecânica, Universidade de Caxias Sul, Caxias do Sul, Rio Grande do Sul 95070-560, Brazil
4
Department of Production Engineering, UTP University of Science and Technology, 85-796 Bydgoszcz, Poland
5
Department of Mechanical Engineering, Imperial College London, South Kensington, London SW7 2AZ, UK
*
Author to whom correspondence should be addressed.
Materials 2020, 13(22), 5231; https://doi.org/10.3390/ma13225231
Submission received: 14 October 2020 / Revised: 11 November 2020 / Accepted: 12 November 2020 / Published: 19 November 2020
(This article belongs to the Section Manufacturing Processes and Systems)

Abstract

:
In this study, an experimental and statistic investigation approach based on analysis of variance (ANOVA) and response surface methodology (RSM) techniques was performed to find the significant main effects and two-factor interaction effects and to determine how the controllable factors such as cutting speed, feed rate, depth of cut (DOC), tool nose radius, substrate and coating method of cutting tools influence surface quality in turning of AISI 1045 steel. The first optimal or near-optimal conditions for the quality of the generated surface and the second ones, including maximum material removal rate, were established using the proposed regression equations. The group mean roughness of the turned workpieces was lower from using chemical vapor deposition (CVD)-coated carbide inserts than the group means of other types of inserts; however they could not achieve the specific lowest roughness. The physical vapor deposition (PVD)-coated carbide and cermet inserts achieved the best surface quality when the specific combinations within the range interval of controllable factors were used in the experiment, showing that they may be applied to finish turning processes or even to particular high material removal rate conditions associated with the lowest roughness.

1. Introduction

The presence of irregularities in the generated surface produced in turning processes has numerous influences on several engineering applications. The surface finish of the machined parts is known to have a significant influence on wear, production costs and fatigue strength [1,2]. Few studies have analyzed the influence of cutting insert substrates and coating methods along with geometry and cutting parameters on the productivity of machining processes regarding surface finish [3,4]. Aiming to minimize production costs, the process’s controllable factors must be defined in a way that minimizes the production time and meets the project’s specifications, such as those of surface roughness [5,6]. Although cutting parameters’ influence in turning processes are well understood, the development of new cutting tool geometry, tool substrates and coating methods requires a continuous reassessment of its role in the process performance [7,8].
A comparative study on the effect of cutting conditions on machinability of Inconel 718 during high-speed turning with coated and uncoated polycrystalline cubic boron nitride (PCBN) tools was carried out by Bushlya et al. [9], where it was observed that the coated tools generated higher values of surface roughness. This behavior was attributed to variations in the tools’ microgeometry, where 3D optical measurements verified that the coated tools presented a greater cutting edge radius, which, in association with the other selected cutting parameters, affected the chip formation mechanism and, consequently, the machined surface roughness. A more in-depth analysis of surface quality, including surface roughness, concomitant with a metallographic analysis of the surface layer and induced plastic deformation during the turning of Inconel 718 was proposed by Zhou et al. [10]. Higher values of surface roughness were obtained with a coated cubic boron nitride (CBN) cutting tool compared to an uncoated one, and the main reason for this was attributed to the largest cutting edge radius, 20 µm and 15 µm respectively, showing that greater amounts of built-up edge on the machined surface occurred when the coated CBN cutting tool was used, mainly with lower feed rates. In [11], the increased cutting edge radius due to the presence of several coating layers on a tool coated by using a multilayer chemical vapor deposition (CVD) method was also attributed to a higher roughness of the machined surface of Incoloy 825 compared to uncoated tools.
An influence study of uncoated, and physical vapor deposition (PVD)- and CVD-coated tools on surface roughness in machining of Incoloy 825 was presented in [12], which verified that the surface roughness was higher when machined with the CVD-coated tool and lowest for the PVD-coated tool. The CVD coating process results in a rougher tool surface and an increased cutting-edge radius, which contributed to the lower surface finishing of the machined part. The high surface roughness of the part was also attributed to the greater friction in the tool–part interface. A better surface finish was achieved by tools coated with the PVD method, which was attributed to thinner coating and superior tribological properties.
The experimental approach of investigating one variable at a time has been replaced by mathematical modeling techniques to assist in the determination of optimal or close-to-optimal cutting conditions regarding the most varied and desired criteria, such as surface roughness, cutting force, wear of tool and others. Techniques such as Factorial Design, ANOVA, RMS, Taguchi and Artificial Neural Network have been widely used to reduce the cost and time of experimental analyses [4,13,14,15]. Mathematical models for assessing surface roughness versus cutting parameters of inserts with the same substrate but different coating methods (CVC/PVD) in turning operations of AISI P20 steel were proposed by Cakir et al. [16], where, although experiments showed a positive effect on surface roughness for higher cutting speeds when using CVD coating, the best surface finish was achieved when using PVD coating. Khellaf et al. [17] presented a comparative analysis of uncoated and coated ceramic cutting tools in hard turning of AISI H11 steel in order to optimize machined surface quality. A proposal for optimizing surface finishing was obtained using RSM and ANOVA methods, showing that the uncoated ceramic tool performed better in the considered cutting conditions. The application of CBN-coated cutting tools, known commercially as CBN7020 grade, was analyzed in hard turning of AISI 52100-bearing steel by Bouacha et al. [18]. This study included an evaluation of the surface roughness and cutting force in relation to the cutting parameters using RMS and ANOVA techniques. The main and interaction effects of controllable factors (cutting speed, feed rate and depth of cut) on response variables were evaluated, showing that the surface roughness is highly affected by the feed rate, whereas the cutting speed has a negative effect and the depth of cut demonstrates a negligible influence. Toulfatzis et al. [19] designed experiments with the Taguchi method to reduce the number of experiments and subsequently applied ANOVA for optimizing the surface quality in turning lead-free brass alloys using an uncoated carbide tool. The work verified the significance of four controllable factors (cutting speed, depth of cut, feed rate and workpiece material), each at four levels. When classifying the obtained contributions, the sequence of the four factors that affected the surface roughness in decreasing order was as follows: feed rate, depth of cut, type of workpiece material and cutting speed. Effects of ceramic and CBN cutting tools and cutting parameters on surface roughness were investigated by [20] in 718 nickel superalloy by applying a two-level full factorial design of experiment with a subsequent analysis of factor effects using an algorithm based on extended design matrix. The results showed an advantage for the ceramic insert in the surface roughness when compared to the CBN ones for both high and low feed rates considered in the study.
Kuntoglu et al. [21], performed a multi-criteria optimization of surface roughness and vibration based on an RMS approach. The optimum process parameters were predicted and experimentally verified to obtain the lowest roughness. The axial vibration showed similar behavior to surface roughness. The feed rate demonstrated a dominant influence on both feed rate and axial vibration, validating a similar variation. Moreover, Kuntoglu et al. [22], presented a multi-optimization and analysis of surface roughness, flank wear and different data sensors to a lathe, including dynamometer, vibration, acoustic emission, temperature and motor current sensors. Based on an RMS optimization approach, the optimum cutting conditions were predicted and experimentally verified to obtain the best results for flank wear, surface roughness and the sensorial data, with an 82.5% success rate for total desirability.
An optimization design of cutting parameters when turning Inconel 718 with cermet inserts was performed in [23]. The analysis consisted of applying the RSM, which used the analysis of variance (ANOVA) method, to develop a mathematical model for surface roughness based on cutting parameters. It was found that the cutting speed presents the strongest effect on the surface roughness among the selected parameters and is inversely proportional to the response. A similar methodology was implemented in [24] where a proposal of multi-optimization of surface roughness and productivity in dry turning of AISI 52100 steel using uncoated and PVD-coated cermet tools was carried out. The results of the predicted responses indicate that the feed rate is the most significant parameter and that the PVD coating has a better performance than the uncoated tool.
A statistical method to estimate the influence of cutting parameters on surface roughness in turning operations of several alloys of the Fe-C class and non-ferrous metals was proposed in [25]. Analytical and empirical relations describing the dependence of surface roughness in relation to feed rate were achieved and showed that the already well-known analytical relations of cutting parameters in the literature cannot always adequately describe the experimental data.
Das et al. [26] performed an investigation of cutting parameter influence on the dry turning of AISI 4340 steel using a CVD tool coated with multilayer TiN/TiCN/Al2O3/TiN. Experiments were designed using a factorial design technique with a Taguchi L9 orthogonal array and later performing an ANOVA. A highlight of the results is that the surface roughness is statistically influenced not only by the feed rate but also by the cutting speed, and that the CVD tool used for dry hard turning is effective and presents the potential to replace cylindrical grinding operations. The same AISI 4340 steel was evaluated for machinability according to wear and surface roughness criteria obtained in hard turning by Sahoo and Sahoo [27]. Three carbide tools were evaluated under the same cutting parameters: uncoated and two multilayer-coated inserts such as MTCVD (medium-temperature chemical vapor deposition) TiN, and conventional CVD ZrCN. First-and second-order linear regressions were proposed for the evolution of flank wear and surface roughness. ANOVA was used to statistically test the significance of second-order models and showed that multilayer-coated tools are more economically viable and that MTCVD is the best solution in turning surface finishing of hardened steel.
As previously presented, the development of new substrates and coating methods has demanded a constant reassessment of their influence on the performance of the metal cutting processes, such as cermet cutting tools. Aiming to contribute to the field, the purpose of this article is the assessment and optimization of surface roughness in turning of AISI 1045 steel, which is widely industrially applicable by using CVD- and PVD-coated carbides and PVD-coated cermet inserts. A design of experiments (DOE) with full factorial design with mixed levels to consider both quantitative and qualitative controllable factors in turning operations was used. Initially, a five-way ANOVA was used to verify the statistical significance of the main effects and the two-factor interaction effects of the cutting tool materials and coatings, the conditions of cutting parameters, and the tool nose radius on the surface roughness parameters, the arithmetic average height (Ra) and the ten-point height Rz (ISO) using MATLAB commercial software. Subsequently, the regression equations based on the RSM analysis, with the aid of Design Expert 12 commercial software, were proposed to predict the surface roughness parameters for each cutting insert.

2. Materials and Methods

2.1. Selection of Process Parameters (Controllable Factors) and Their Ranges

The process parameters that may affect the surface quality in turning processes have been identified based on a literature review. The quantitative process parameters such as cutting speed (Vc), feed rate (f), depth of cut (DOC), tool nose radius (r) and the qualitative parameter of the insert substrate and coating method were selected as independent variables to analyze in this study, while the response variables were the surface roughness parameters. A computer numerical control (CNC) turning machine (ROMI CENTUR 30D, São Paulo, Brazil) which has variable spindle speed from 50 to 3500 rpm, a 9 kW motor drive and a Sinumerik 828D controller was used for dry machining of the workpieces, where the range of the controllable factors for turning experiments were selected based on technical recommendation and availability of cutting inserts from the tool manufacturer. The selection criterion for each number of categorical levels was defined according to the influence of its relationships already well established in the literature [28], according to which the feed rate and tool nose radius are usually the most significant parameters on machined surface roughness. To eliminate or minimize the effects of the fixation, each workpiece was fixed between a 3-jaw hydraulic chuck and tailstock of the CNC turning machine, and the run-out was verified, aiming to minimize it and assure similar turning conditions.

2.2. Material, Workpiece and Roughness Meter

Mild steel with designation AISI/SAE 1045 with a chemical composition in terms of mass of 0.43–0.5% C, 0.6–0.9% Mn, max. 0.040% P, max. 0.050% S and a hardness average of 178 HB was used for turning experiments. The workpieces used in the experiments had a cylindrical form, with 44 mm diameter and 165 mm length, as shown in Figure 1. Each 16 mm length of each workpiece was used for turning, with specific combinations of process parameters.
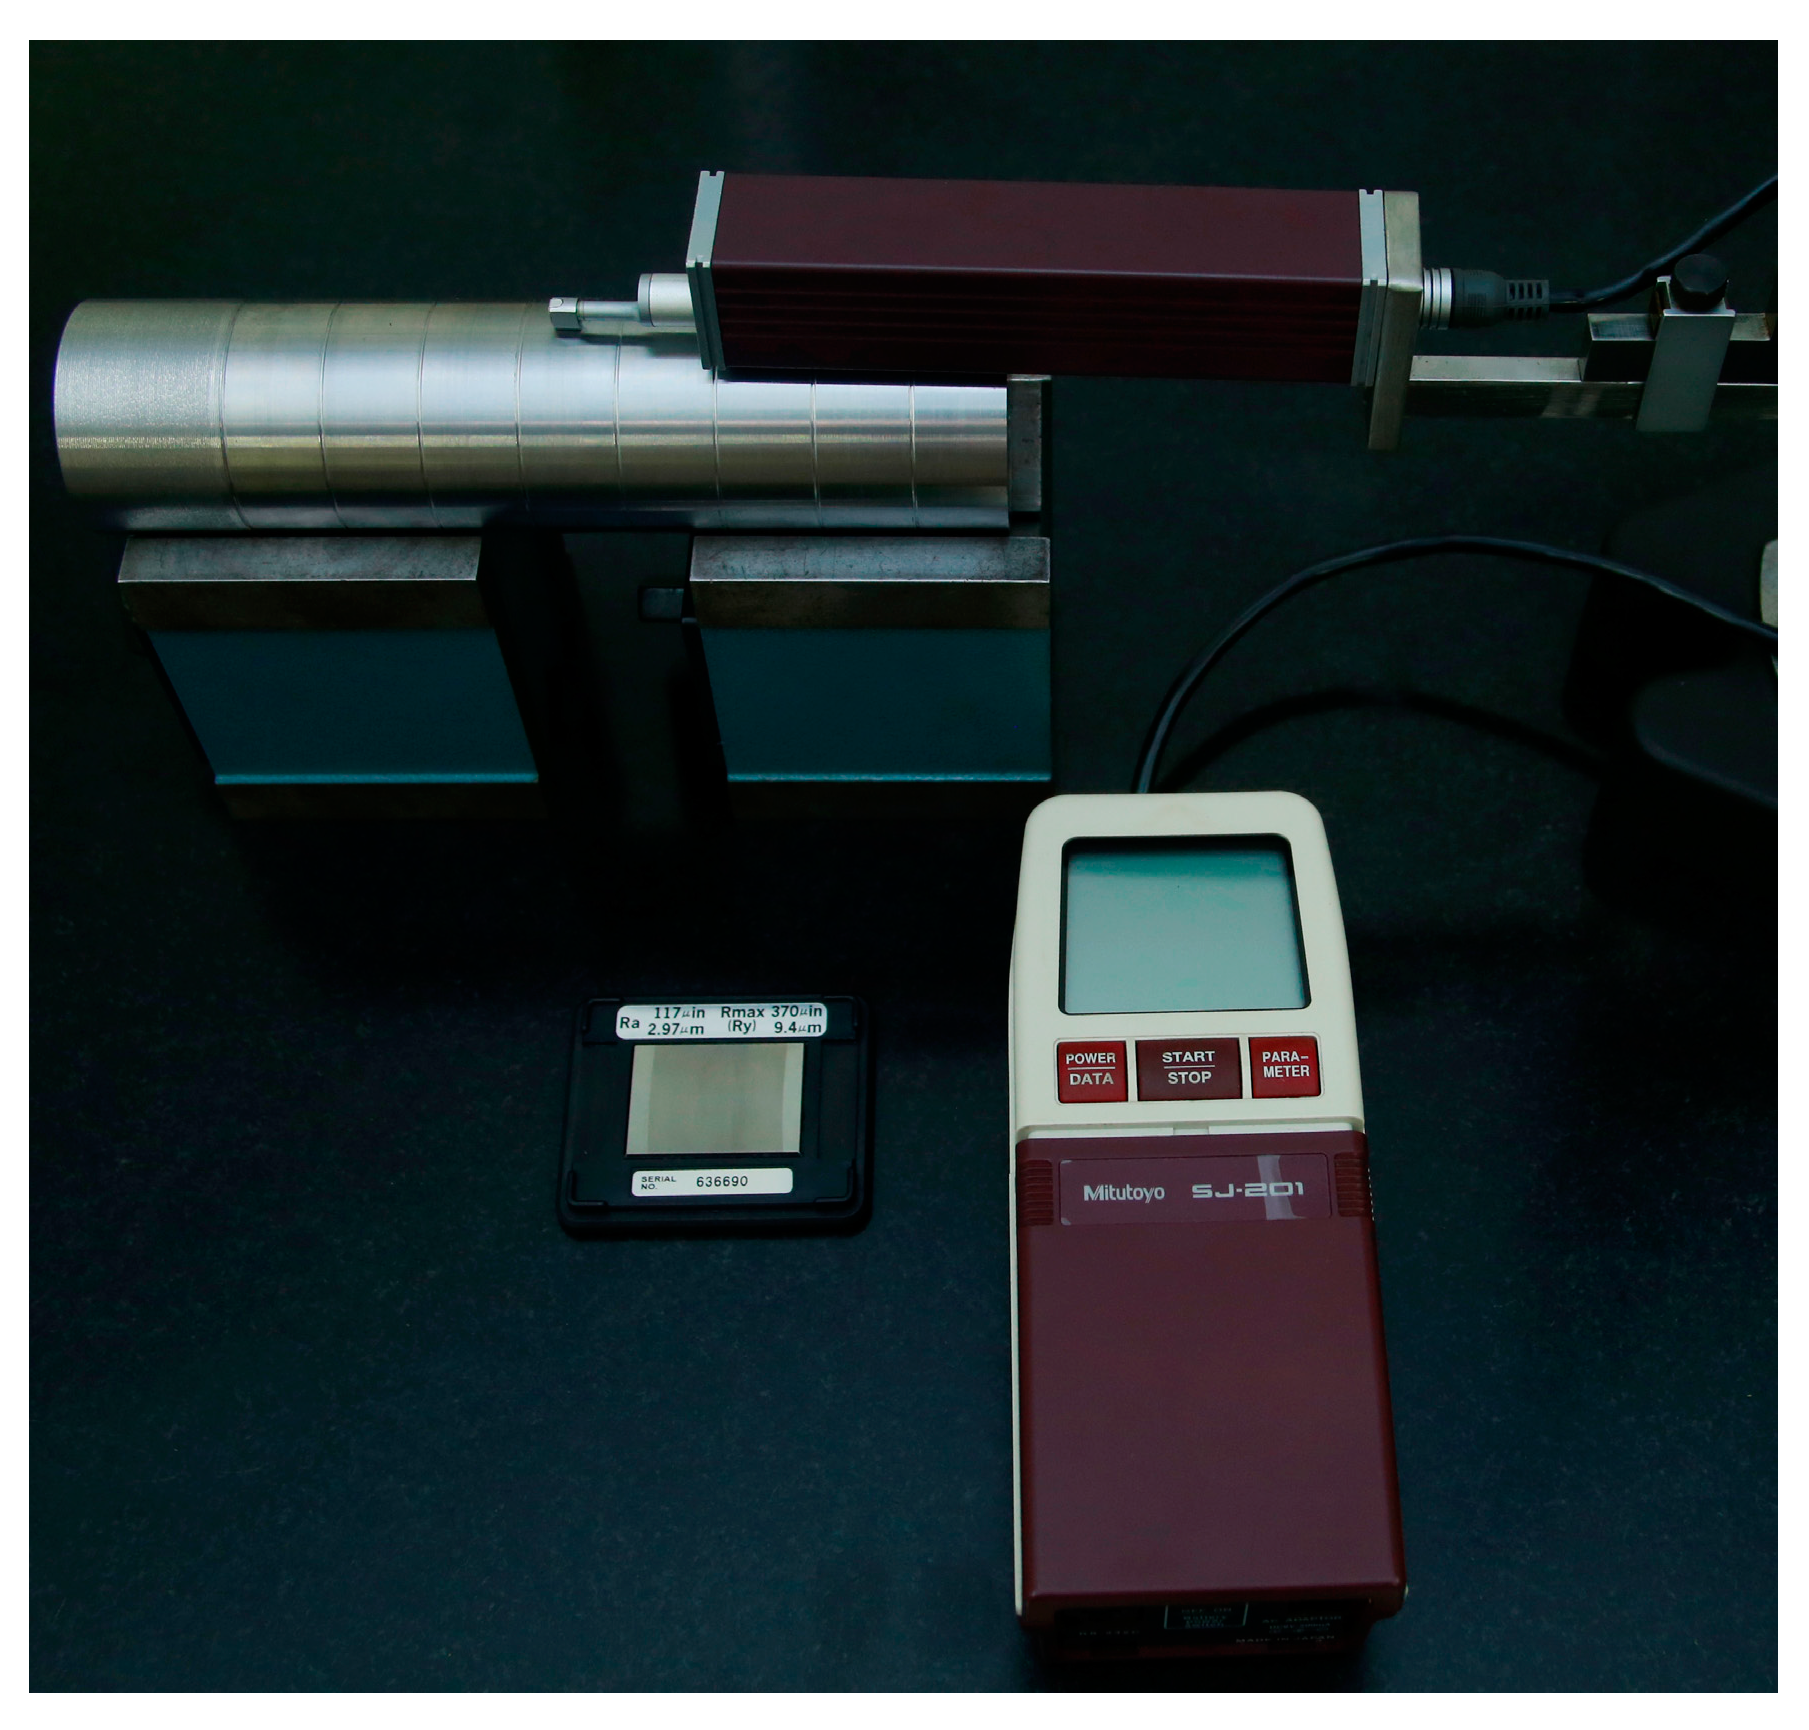
Measurement of the arithmetic average height Ra and the ten-point height Rz were carried out by a Mitutoyo roughness meter, model SJ-201, where the cutoff length and evaluation length are 0.8 mm and 4 mm, respectively. The instrument is initially calibrated using a standard calibration block with Ra roughness of 2.97 µm and the largest peak-to-valley height Ry of 9.4 µm. Two surface samples were turned for each combination of parameters, and the measurement of the workpiece surfaces (16 mm in length) was repeated three times in the axial lines direction equally positioned at 120 degrees around the cylindrical surface. Thus, all Ra and Rz average values were calculated by using six measurements from the roughness meter. Figure 2 illustrates the apparatus setup used to measure the workpieces surface roughness.
The inserts used in the experiments have ISO designations WNMG080404 and WNMG080408 (80° nose angle) with the same HQ chipbreaker specification. Three grades of cutting tools were used: Sintered tungsten carbide (WC) grade CA5525 (CVD coated TiCN + Al2O3 + TiN), and grade PR1125 (PVD coated TiAlN), and cermet grade PV710 (PVD coated TiCN). The inserts were clamped mechanically on a tool holder with ISO designation MTJNR2525M16. Figure 3 shows the substrates, coating methods, and geometries of the inserts used in the experiments.

2.3. Response Surface Methodology

The RSM technique is practical, economical, and relatively easy to use [29]. Generally, a low-order polynomial in some region of the independent variables space is appropriated, and if there is curvature in the response, then a higher-order polynomial must be used to propose a regression equation that can represent the relationship between the response and the independent variables in the space that includes the levels of controllable factors. The polynomial function that represents an approximation for the true response as a function of the input variables is shown in Equation (1), where y is the response variable, xi is the controllable factors, β0, βi, βii, βij are coefficients to be estimated and k is the number of controllable factors considered in the analysis [29]. After the mathematical modeling, the ANOVA is used in order to verify the equation terms’ significance.
y = β 0 + i = 1 k β i x i + i = 1 k β i i x i 2 + i < j β i j x i x j + ε
This technique has been used by researchers to assess surface roughness parameters or other response variables in machining processes. The last step of RSM is the optimization of the response variables, which aims to determine the optimal machining conditions for a desired value of the response variable or to determine a region of the factorial space where the technical requirements are met. The optimization of the machining conditions is unknown before the experiments are performed, making RSM an important technique capable of obtaining optimal values of the response variables, considering a constrained optimization problem—in other words, according to the restricted goals of the process parameters.

2.4. Design of Experiments Using Factorials with Mixed Levels

The statistical design of the experiments deals with the process of planning the experiment so that the appropriate data are collected and analyzed by statistical methods, resulting in effective and objective conclusions. The statistical approach to the design of the experiments is necessary to produce significant conclusions about the dataset, so there are two aspects to any experimental problem: the design of the experiment and the statistical analysis of the data set [29]. There is a close interaction between the design of the experiments and the analysis of the regression model.
The controllable factors involved in an experiment can be quantitative or qualitative. A quantitative factor is one whose levels can be associated with values on a numerical scale, while the qualitative factor levels cannot be organized in terms of order of magnitude. A full factorial design consists of carrying out all possible combinations of discrete factor levels. Examples of full factorials for analyzing surface roughness or other response variables can be found in [20,30,31]. When a large number of factors are studied, a fractional factorial design can be used to keep the experiment at a reasonable size [26,32,33]. There is special interest in the design of experiments in which the number of levels of controllable factors differs, that is, mixed levels. If these are full factorials, then the construction and analysis of these designs present no new difficulties [29]. In this study, each of the process parameters is defined in discrete quantitative and qualitative levels, as shown in Table 1; therefore the design consists of 96 runs (2*2*3*2*4) of experiments performed based on the combination of the process parameters (or controllable factors).

2.5. Analysis of Variance

ANOVA can be done using statistical software, and in this work, the analysis was performed by commercial software MATLAB® (version 2020, Mathworks, Natick, MA, USA) using the functions anovan, interactionplot, multivarichart, maineffectsplot, and multcompare to analyze the dominant significant effects, display two-factor interaction effects on the response variable to assess how the interactions affect the relationship between the factors and the response variable, graphically represent the relationships between factors and a response (especially useful in understanding interactions), test how response means are related to levels of one or more factors, and present which group means are significantly different, respectively. The significance level is usually based on a 95% confidence interval (p-value of F calculated < 5%). Analysis of variance is also used as one of the steps for applying RSM to verify parameters that need to be included in the mathematical model to predict the response variable. This is useful to test the significant controllable main factors and their interactions in the proposed regression equations for the response characteristics for each type of cutting tool employed in the experiments, so the insignificant coefficient terms (detected from ANOVA) can be omitted from the equations. A further process optimization step is proposed, based on goal criteria of surface roughness and productivity [34], which is carried out using the statistical commercial software Design Expert Version 12 (Stat-Ease, Minneapolis, MN, USA).

3. Results and Discussion

3.1. Experiment Results

The results of the full factorial plan developed for turning experiments are tabulated in Table 2, showing combinations of the controllable factors used for each run of experiment and the corresponding responses of Ra and Rz surface roughness parameters in terms of its average values. The type of substrate and coating method is a process parameter that has no value and therefore was considered a qualitative or categorical factor (see Table 1). The results of the experiment presented in Table 2 were used for the following analyses:
  • a five-way ANOVA using a two-factor interactions model;
  • regression model and statistical analysis;
  • response surface methodology;
  • optimization of parameters for lowest surface roughness.

3.2. Five-Way ANOVA

The analysis of variance was employed to detect significant controllable process factors in the multi-factor model presented in Table 1. The main effects on the means of the response variable (surface roughness parameters Ra and Rz presented in Table 2) for different levels of individual factors and their interactions are statistically tested for significant differences in group means. Table 3 and Table 4 show the significance results for a five-way ANOVA employing a two-factor interaction model, which can compute the p-values for null hypotheses on the main effects and the two-factor interaction effects or, in other words, compute whether the group means are significantly different considering the 95% confidence bounds. It can be noted that in Table 3, the main factor effects on the Ra surface roughness parameter in decreasing order of significance levels are the feed rate, tool nose radius, Substrate/Coating, DOC, and cutting speed. A similar analysis is shown in Table 4 where the decreasing order of significance levels for the Rz surface roughness parameter is feed rate, tool nose radius, DOC, Substrate/Coating, and cutting speed.
Figure S1 (Supplementary Material) shows the main effects plot for the five categorical factors according to Table 1. Differences are noted between mean levels for all factors. Further, the feed rate causes the strongest variation on the means of the Ra surface roughness parameter followed by tool nose radius, Substrate/Coating, DOC and small slope gradient for cutting speed effect. The parameter response Rz shows similar behavior, and the only difference in the order is that DOC is the third and the Substrate/Coating is the fourth. The response roughness parameters align with the theoretical geometric surface roughness as a function of the tool nose radius and the feed rate established by [28]. These plots also confirm the results shown in Table 3 and Table 4 evaluating the significant differences between group means for turning with different substrates and coating methods. In general, the sintered WC coated with the CVD method presents better performance, reaching high surface quality for the range of cutting parameters analyzed in this work, but the interaction effects must be evaluated.
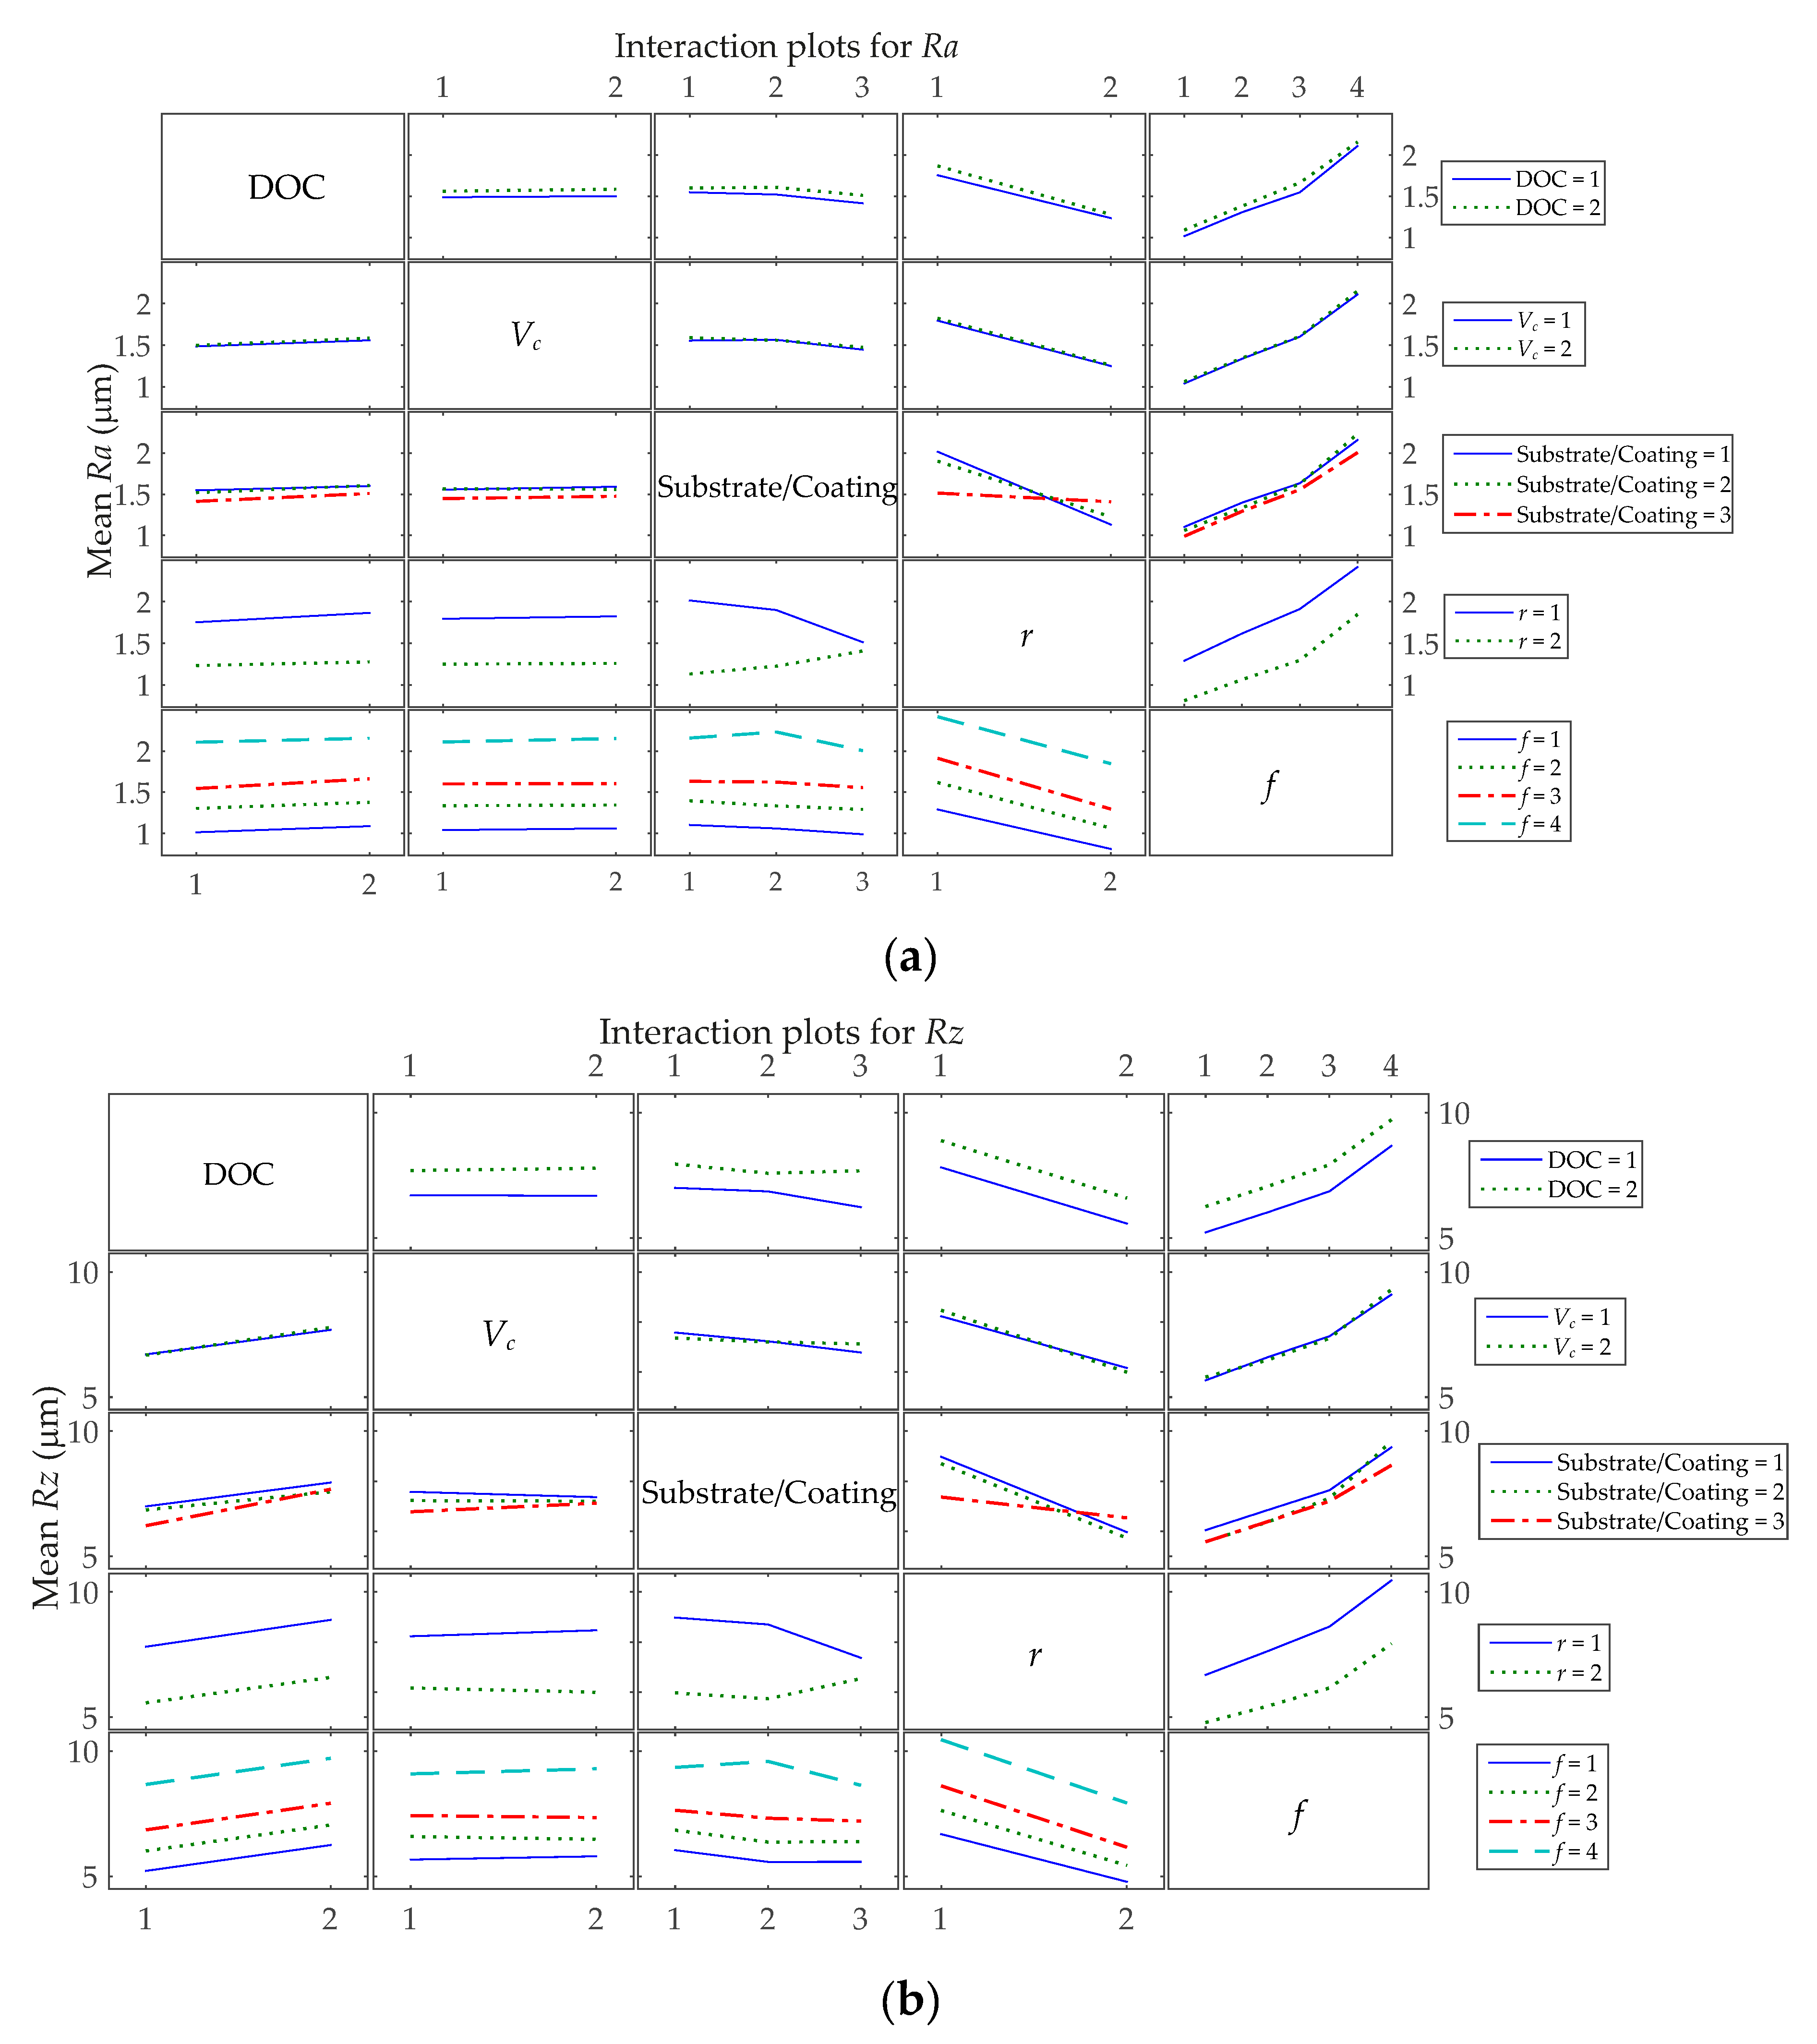
Figure 4 displays the two-factor interaction plot for the five main process factors, which evidence the interaction effects; in other words, the relationship between one categorical factor and the continuous surface roughness parameters depends on the second categorical factor. It can be noted from Table 3 and Table 4 that the most dominant two-factor interaction effects on both surface roughness parameters are Substrate/Coating*r. The interactions are considered significant based on a 95% confidence bound. Regarding the Ra surface roughness, it is shown in Figure 4a that most interactions show lines that are almost parallel, so small interaction effects occur, but there are different behaviors for Substrate/Coating*r and Substrate/Coating*f interactions. The first interaction effect shows that the relationship between the nose radius and the roughness parameter depends on the Substrate/Coating. For example, if categorical factor r = 1 is used, Substrate/Coating = 3 is associated with the lowest mean roughness. However, if r = 2 is used, Substrate/Coating = 1 is associated with the lowest mean roughness. The second interaction effect indicates that for f = 4, the lowest roughness is achieved for workpieces turned by Substrate/Coating = 3, and it increases when Substrate/Coating = 2 is used and decreases when Substrate/Coating = 1 is used. Nonetheless, for the Rz surface roughness, the analysis of Figure 4b shows that the main interaction effects take place between Substrate/Coating with r, f, Vc or DOC. The best combinations for the lowest mean of the Rz are as follows: r = 1 with Substrate/Coating = 3; r = 2 with Substrate/Coating = 2; f = 4 with Substrate/Coating = 3; f = 1 with Substrate/Coating = 2. The Substrate/Coating 1 and 2 have lower mean Rz values for Vc = 2. However, if Substrate/Coating = 3 is used, the Vc = 1 produces lower mean Rz values. These interaction effects also can be seen in Figure 5, Figure 6 and Figure 7 in more detail.
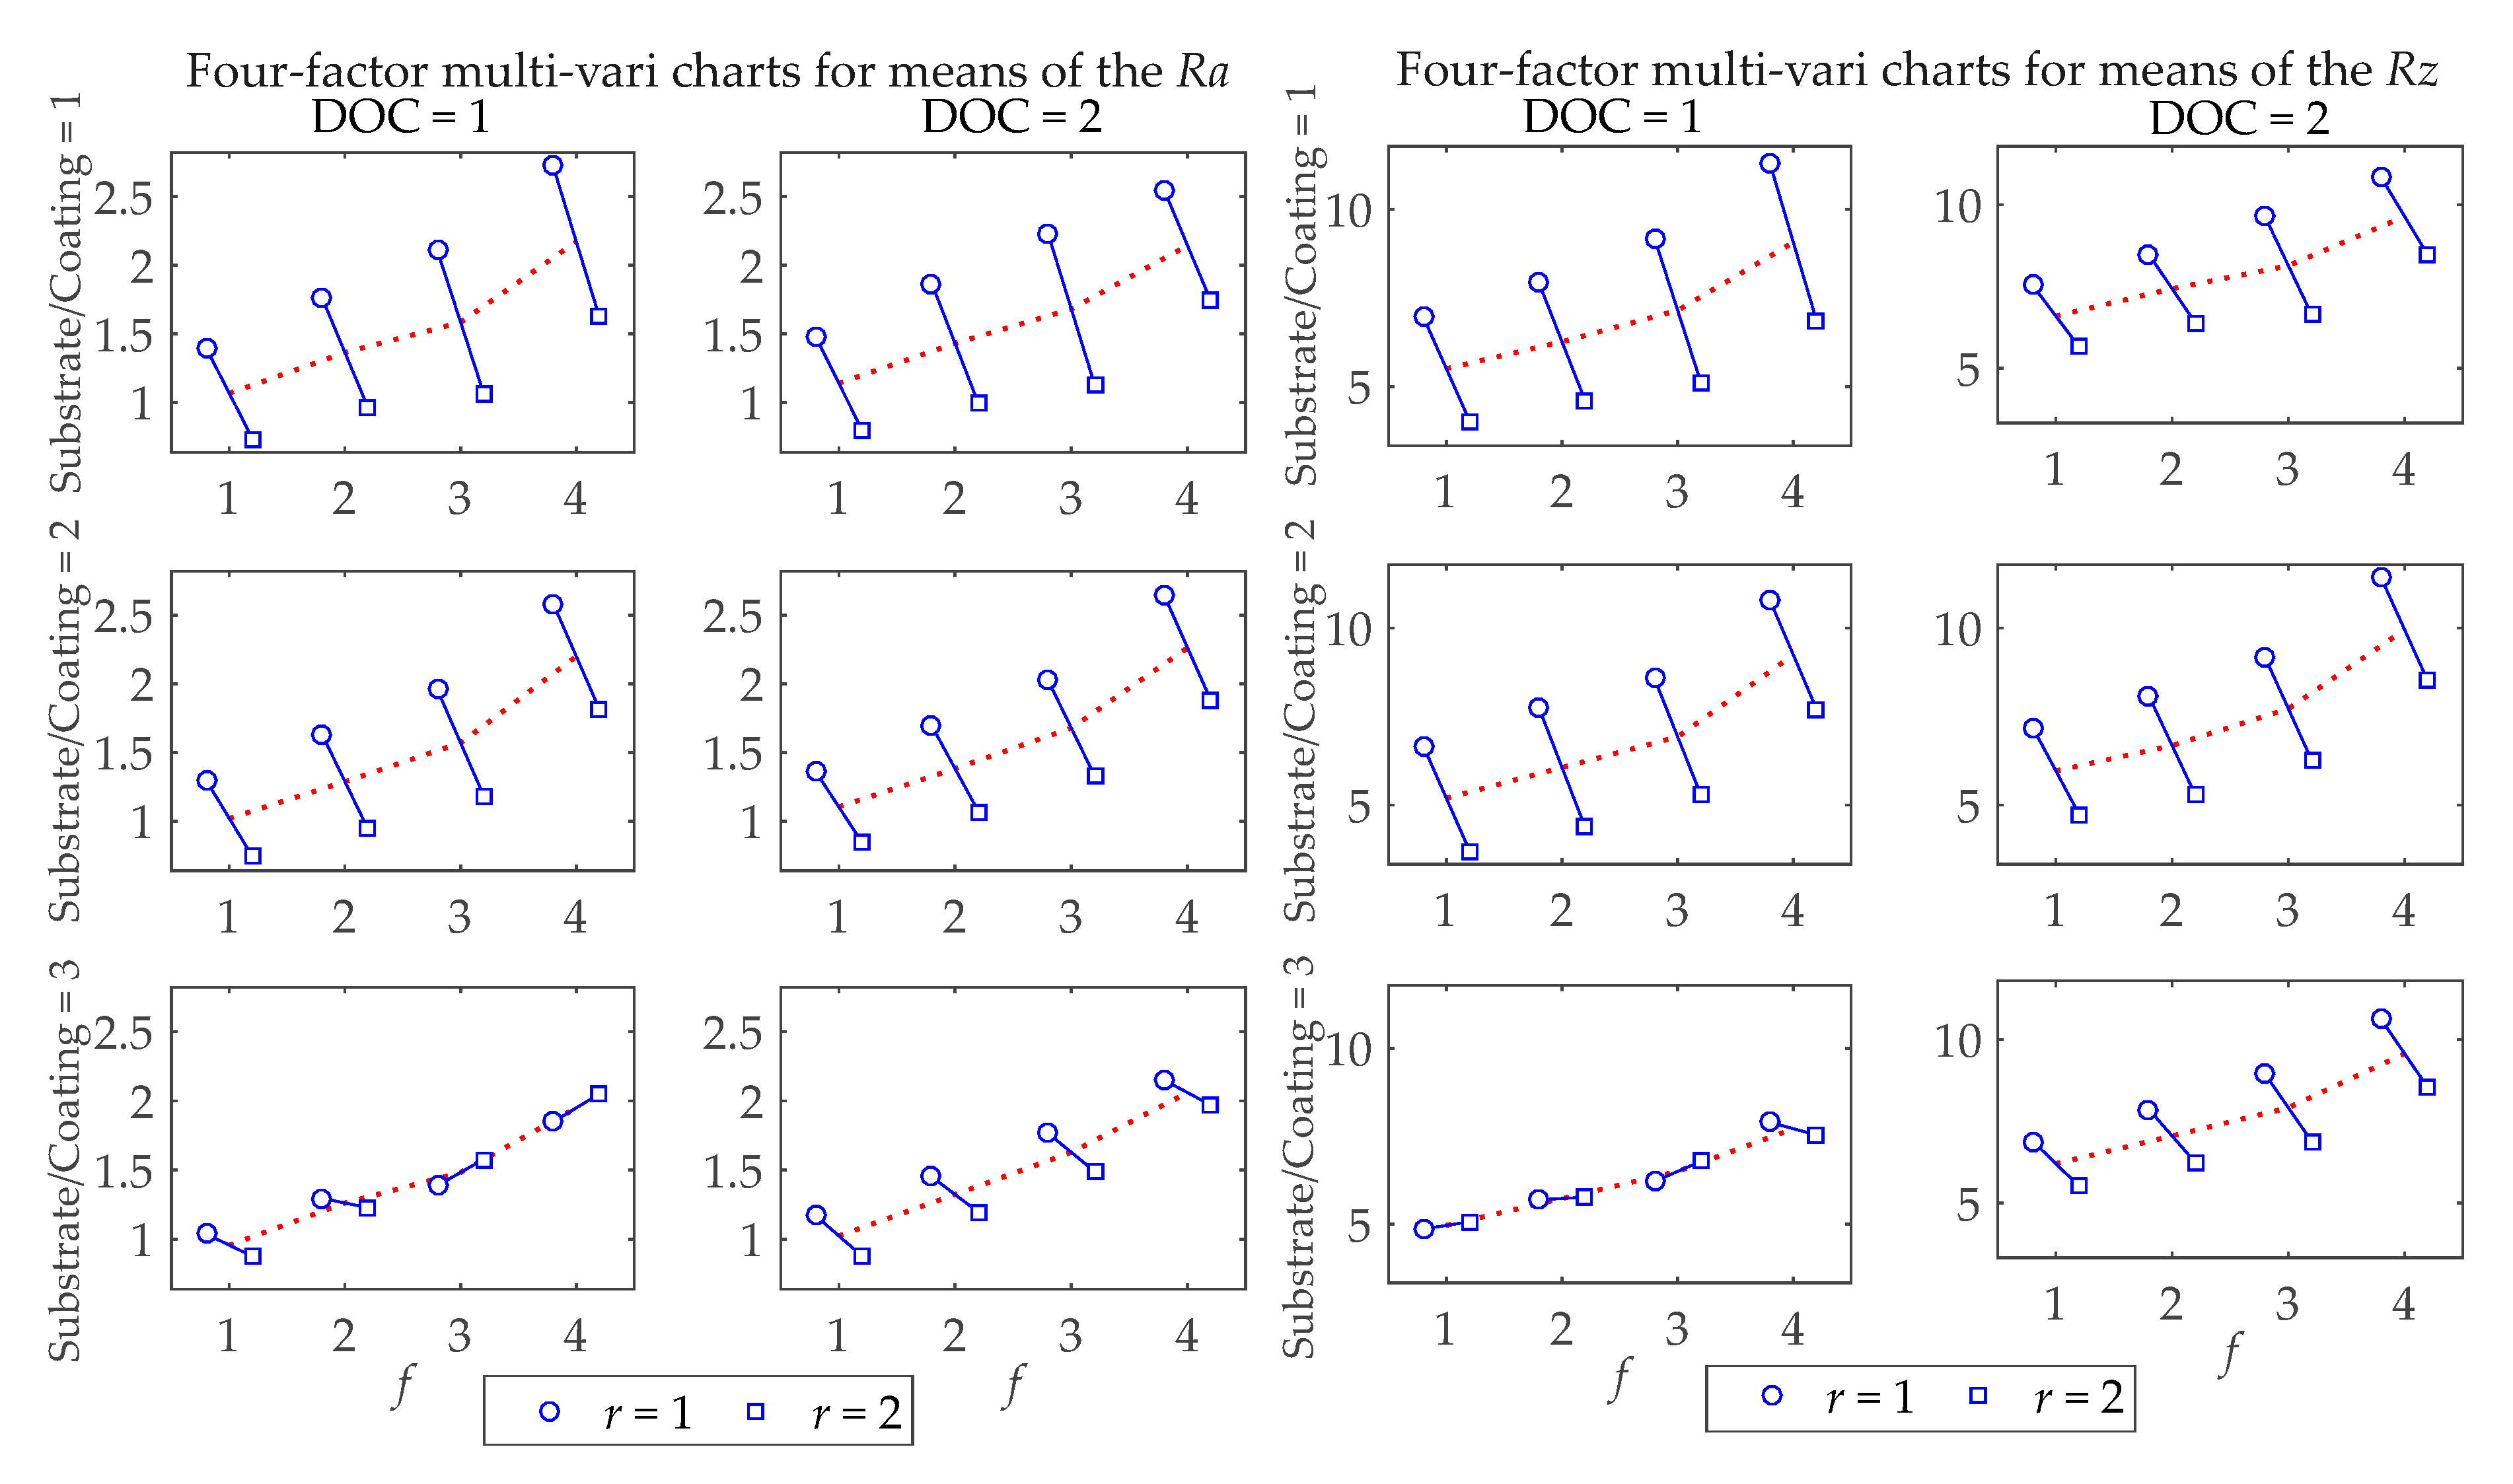
Figure 5 shows the multi-vari charts with the main significant factors for Ra and Rz surface roughness means. It can be observed in Figure 6 that for the most significant process factor (f), the higher the feed rates are, the higher Ra and Rz are. It can be noticed that the variation in Ra is lower when turning with Substrate/Coating = 3 than with other cutting tools. If r = 2 is used, Ra is lower when turning with Substrate/Coating = 1; however, if r = 1 is used, Ra tends to be lower with Substrate/Coating = 3. In addition, Figure 5 illustrates that Substrate/Coating = 3 has better performance (lower mean Rz values) except for the combinations DOC = 2, r = 2 and DOC = 1, r = 2, for which Substrate/Coating = 2 has better performance when it comes to workpieces’ surface roughness.
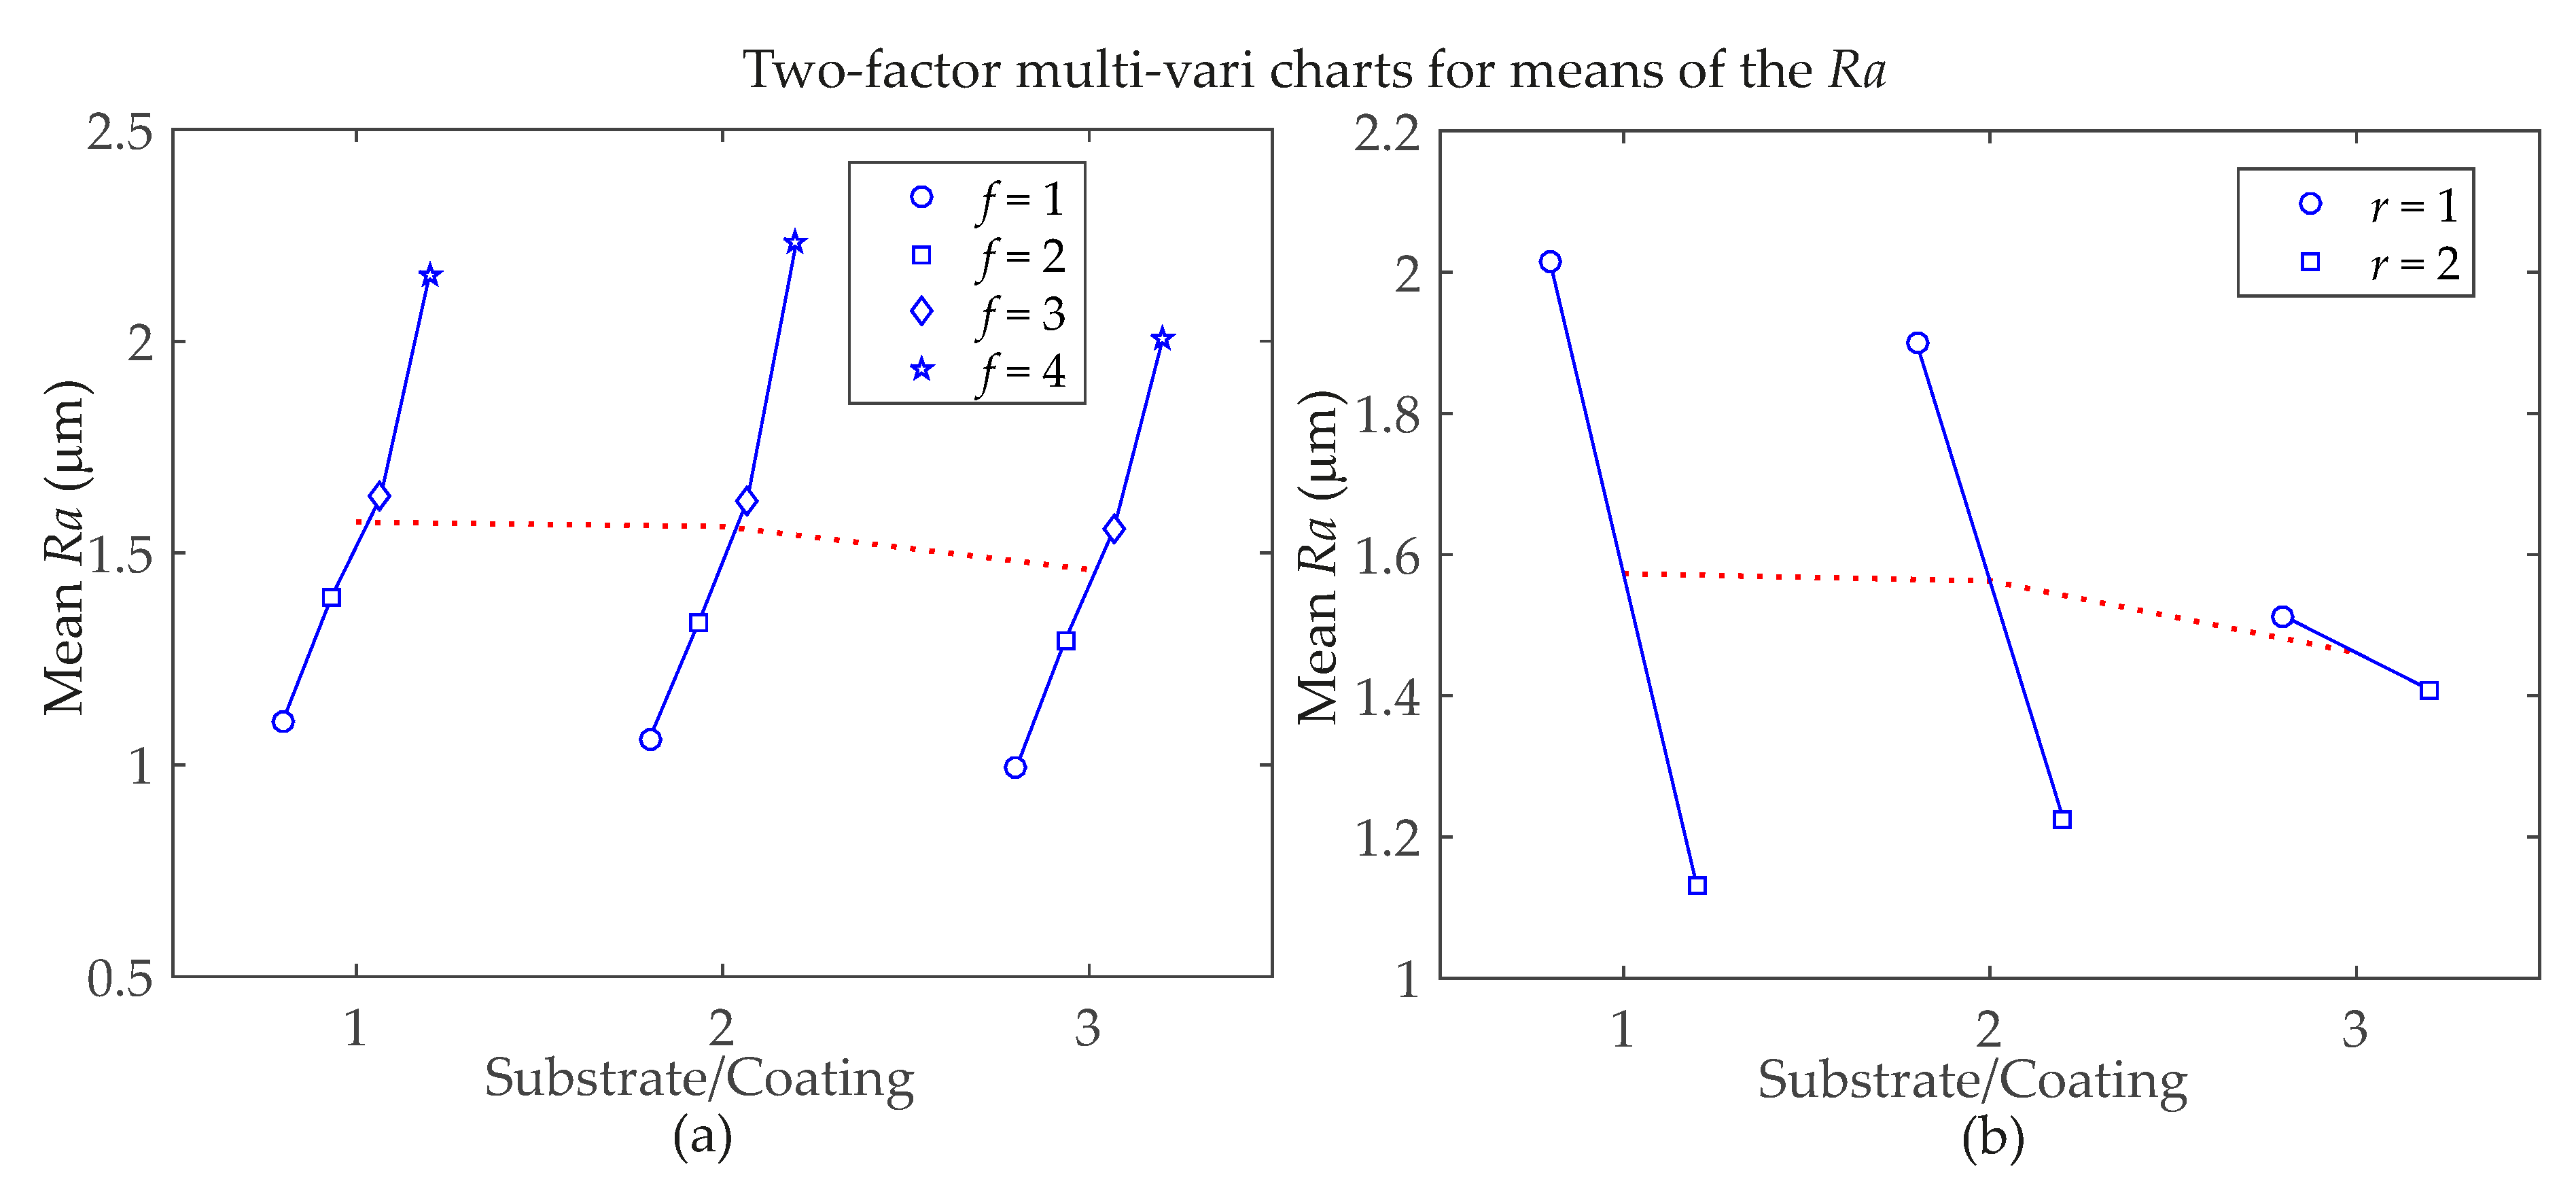
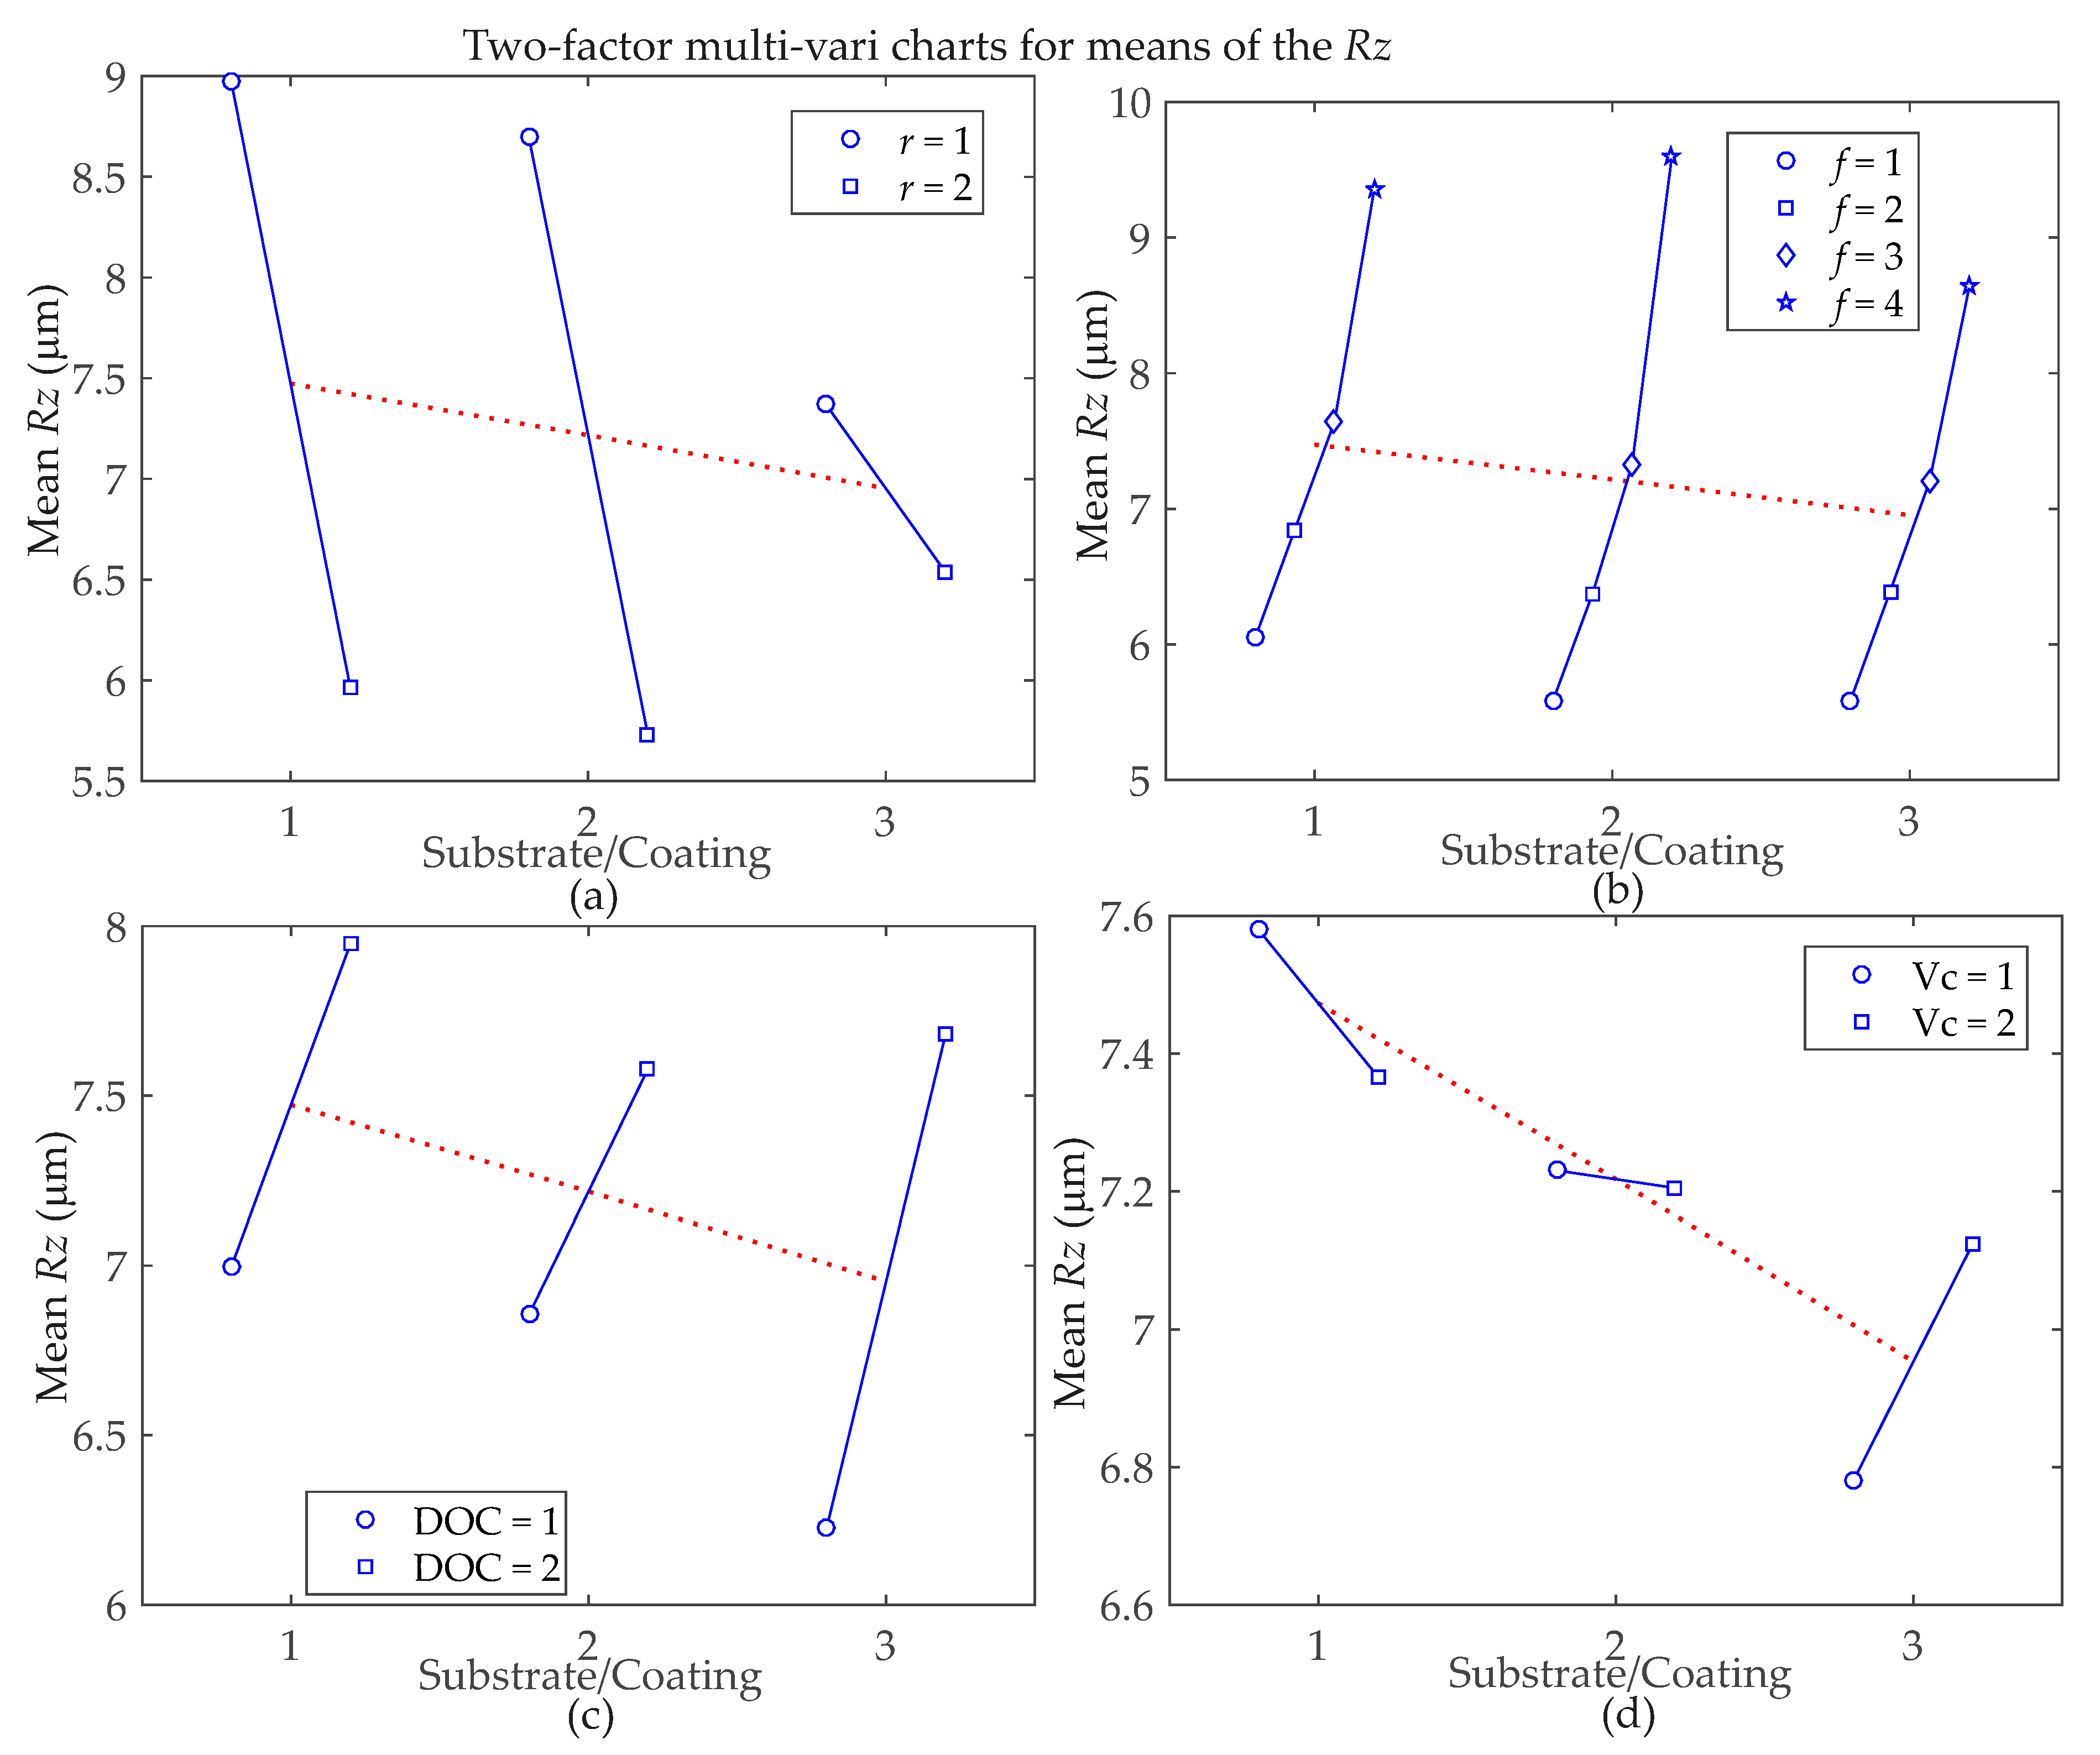
Figure 6 and Figure 7 show a graphical representation of the relationships between factors and Ra and Rz surface roughness responses, respectively, for a better understanding of two-factor interaction effects. There are four charts for Rz in Figure 7 because, according to Table 4, there are more significant interactions for this response parameter. Considering the Ra roughness parameter means in Figure 6, the Substrate/Coating*f interaction shows that the Substrate/Coating = 3 performs better regardless of the level of the feed rate (f). For Substrate/Coating*r interaction, the combinations with the lowest Ra means are achieved by using r = 2 with Substrate/Coating = 1, but when r = 1 is necessary, Substrate/Coating = 3. For Rz roughness parameter means, Figure 7 shows that for the Substrate/Coating*r interaction, the best results are obtained when r = 1 with Substrate/Coating = 3, but when r = 2 is necessary, Substrate/Coating = 2. Considering the Substrate/Coating*f interaction for the highest feed rate level, f = 4, the best mean results are achieved with Substrate/Coating = 3. However, for the smallest feed rate level, f = 1, Substrate/Coating = 2 performs better. In the Substrate/Coating*DOC interaction, when DOC = 1, the best option is Substrate/Coating = 3; Moreover, a narrow variation is observed in the Rz means when Substrate/Coating = 2 is used. For the Substrate/Coating*Vc interaction, when Substrate/Coating = 1 or Substrate/Coating = 2 is used, the best cutting speed is Vc = 2, but when using Substrate/Coating = 3, the best cutting speed is Vc = 1. In addition, for the latter, the smallest variation in the roughness means is achieved by using Substrate/Coating = 2.
Figure S2 (Supplementary Material) shows the multiple comparison of group means. Figure S2a,c illustrates the group means of the resulting workpieces surface roughness using different cutting inserts, demonstrating that WC/CVD has better performance for both response variables within the range interval of controllable factors shown in Table 1, and the Ra group means for workpieces turned by using cermet/PVD compared to WC/PVD have overlapping intervals, so they are not significantly different. Figure S2b,d (Supplementary Material) displays that the group means of the resulting workpieces surface roughness using different cutting speeds are significantly different for Ra because the intervals are disjointed but are not for Rz as the intervals overlap, considering 95% confidence bounds.

3.3. Regression Model and Statistical Analysis

Firstly, the RSM was used to perform a regression analysis to find an adequate fitting model that can assess the behavior of the Ra and Rz response variables as a function of the significant independent variables shown in Table 1, and the final objective was to optimize the responses. The polynomial models, such as the linear model, the two-factor interaction model (2FI) and the quadratic model, were statistically assessed. The results for both Ra and Rz responses are presented in Table 5 and Table 6, respectively. This step was used to select a correct model according to the following criterion: the highest polynomial order but not aliased. The quadratic model has the highest polynomial order, but it is aliased. This indicates that the model cannot be accurately fitted to the design of experiments and should not be selected for analysis. The focus is also to maximize the adjusted R² and the predicted R² for the selected model.
A 2FI model that includes linear and two-factor interaction terms was selected to describe an approximate polynomial relationship between the process parameters shown in Table 1 and the Ra and Rz roughness parameters. The initial analysis of the responses includes all process parameters and their two-factor interactions. The analysis of variance in this case is used to determine which process parameters and two-factor interactions significantly affect the responses. The smaller the p-values (Prob > F) are, the more significant the results are, indicating that the terms are significant and can improve the fitting of the response surfaces. Table 7 and Table 8 show these results of ANOVA for Ra and Rz, respectively. This analysis is performed by considering that p-values lower than 0.05 indicate that model terms are significant, and values greater than 0.10 indicate that model terms are not significant. For the Ra and Rz response variables, the main effects and interactions (A-DOC, C-r, D-f, E-Substrate/Coating, DOC*r, r*f, Substrate/Coating*r, Substrate/Coating*f) and (A-DOC, C-r, D-f, E-Substrate/Coating, DOC*Substrate/Coating, Vc*Substrate/Coating, r*f, Substrate/Coating*r, Substrate/Coating*f) are significant model terms, respectively. A model may be improved by reducing insignificant terms, excepting those required to support hierarchy. For the Rz response, if the interaction term Vc*Substrate/Coating is statistically significant, making the main effect B-Vc theoretically relevant even if not statistically significant, then factor B-Vc is considered in the regression equation.
The regression equations for the response variables (Ra and Rz) for each Substrate/coating as a function of the process parameters considered in these experiments are given in Equations (2)–(7). The insignificant coefficient terms established by ANOVA have been eliminated from the equations. These equations in terms of current controllable factors (Vc in mm/min, f in mm/rev., DOC in mm, r in mm) can be used to make predictions about the responses for given levels of each factor.
R a ( WC / PVD ) = 0.056286 + 0.469167 DOC 1.29966 r + 16.56429 f 0.477083 DOC r 4.1756 r f
R a ( WC / CVD ) = 1.06462 + 0.469167 DOC + 0.740967 r + 15.05 f 0.477083 DOC r 4.1756 r f
R a ( Cermet / PVD ) = 0.432357 + 0.469167 DOC 0.680908 r + 17.13214 f 0.477083 DOC r 4.1756 r f
R z ( WC / PVD ) = 2.14446 + 2.1675 DOC 0.00345 V c 4.12354 r + 59.16071 f 24.04167 r f
R z ( WC / CVD ) = 2.74771 + 2.8825 DOC + 0.003312 V c + 1.68271 r + 52.23929 f 24.04167 r f
R z ( Cermet / PVD ) = 0.538393 + 1.45 DOC 0.00025 V c 3.68917 r + 65.10714 f 24.04167 r f
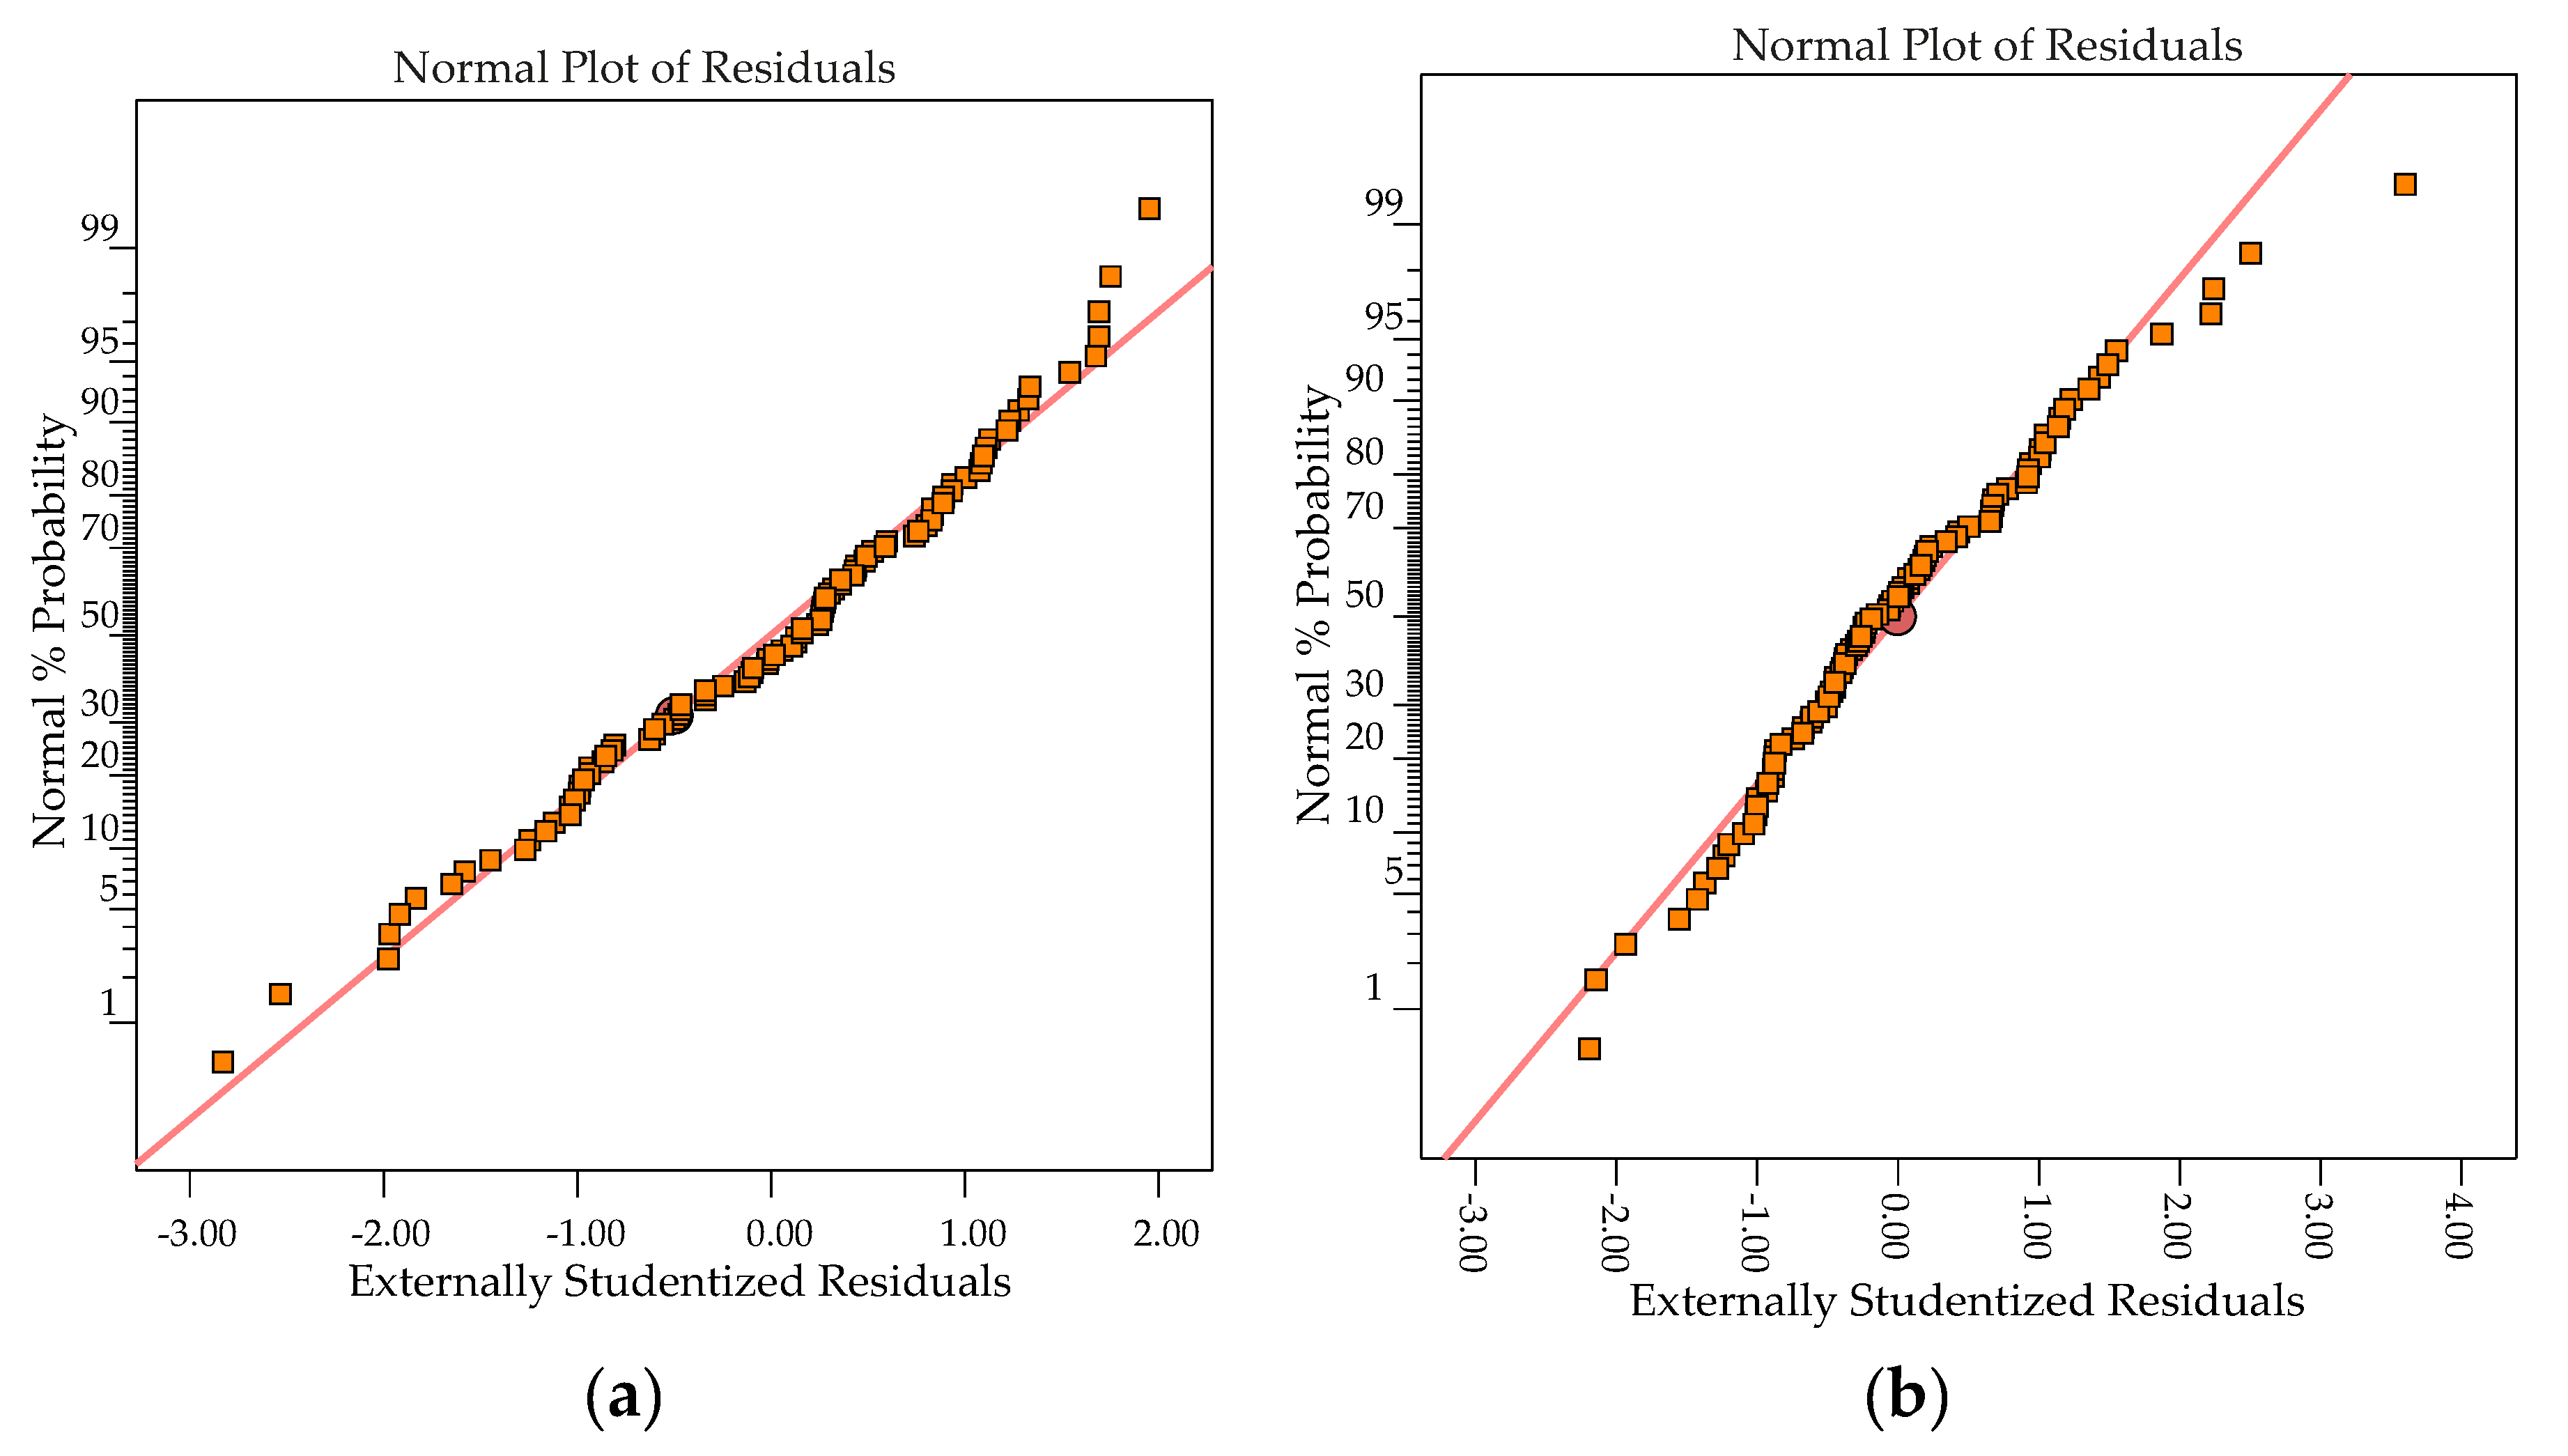
The regression equations were assessed to verify if the fit of the model is adequate. Residuals are the deviation between predicted and actual values, and they should follow a normal distribution if the experimental errors are random. Figure 8 shows the normal plot of residuals for Ra and Rz responses. It can be noted that for responses, the residuals are approximately along a straight line, and hence the studentized residuals follow a normal distribution. The predicted vs. actual graph helps to detect observations that are not well predicted by the regression equations (Figure 9). As the data points are evenly split by the 45-degree line, it implies that the regression model is adequate.

3.4. Response Surface Analysis

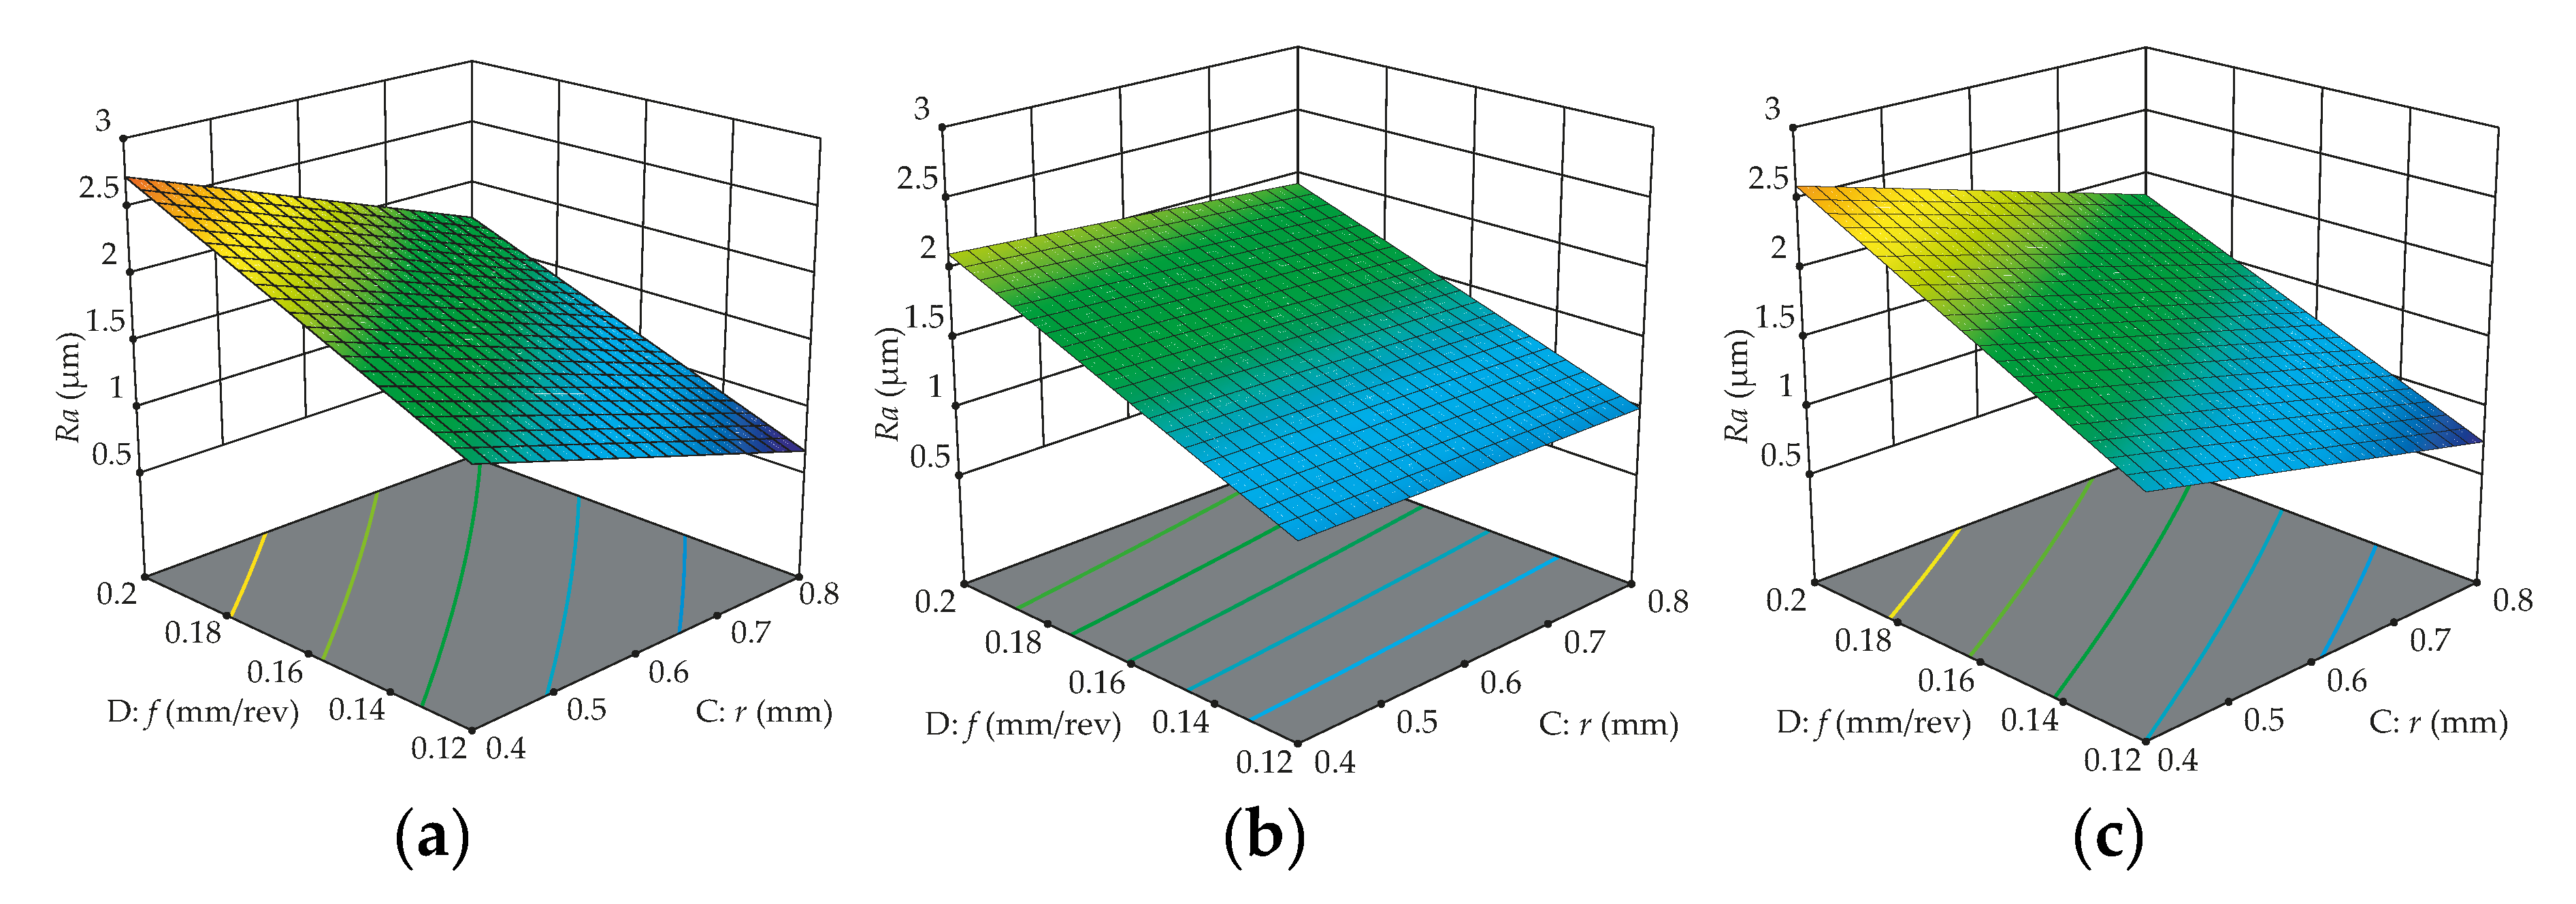
To verify the influences of controllable factors on the surface roughness parameters, response surfaces are shown in Figure 10, Figure 11 and Figure 12, describing the significant interaction effects of different variables on responses. All fixed parameters are set at the middle level or according to what is illustrated in the figures. As can be noticed in Figure 10, the Ra surface roughness is more stable when WC/CVD is used; in other words, there is lower variation on Ra when the workpiece is turned with this type of cutting tool. Figure 10 also shows that the feed rate has more statistical importance than the nose radius on surface roughness (Ra), regardless of the cutting tool type used, in concordance with the literature [28]; i.e., the best surface roughness is achieved for higher nose radii with lower feed rates.
Figure 11 also demonstrates that WC/CVD has lower variation on Ra surface roughness, and the depth of cut has a small significance of response, consequently showing a small slope gradient for all types of cutting tools. A different behavior can be noticed when the workpiece is turned with WC/CVD, where the nose radius also has a small slope gradient, showing that it also has low significance when this insert is used. In Figure 12, the predicted response surface of roughness Rz as a function of feed rate and nose radius is depicted. These surface plots confirm the significant influences of two controllable factors and show that the WC/CVD insert produces lower variations on Rz. The best Rz surface roughness also is achieved for higher nose radii with lower feed rates.

3.5. Optimization of Parameters for the Lowest Surface Roughness

After the important factors for the response variables were identified, the next objective was to find the optimal or near-optimal settings or levels of the important factors that result in desirable values of the responses. The first optimization was executed targeting the lowest surface roughness, and the second was performed to find the optimal controllable factors to turn the workpiece with lower roughness and the highest material removal rate. The goals with the parameter ranges defined for the first optimization process for Ra and Rz are summarized in Table 9. Table 10 and Table 11 present six predicted optimization results, considering a decreasing desirability for Ra and Rz, respectively.
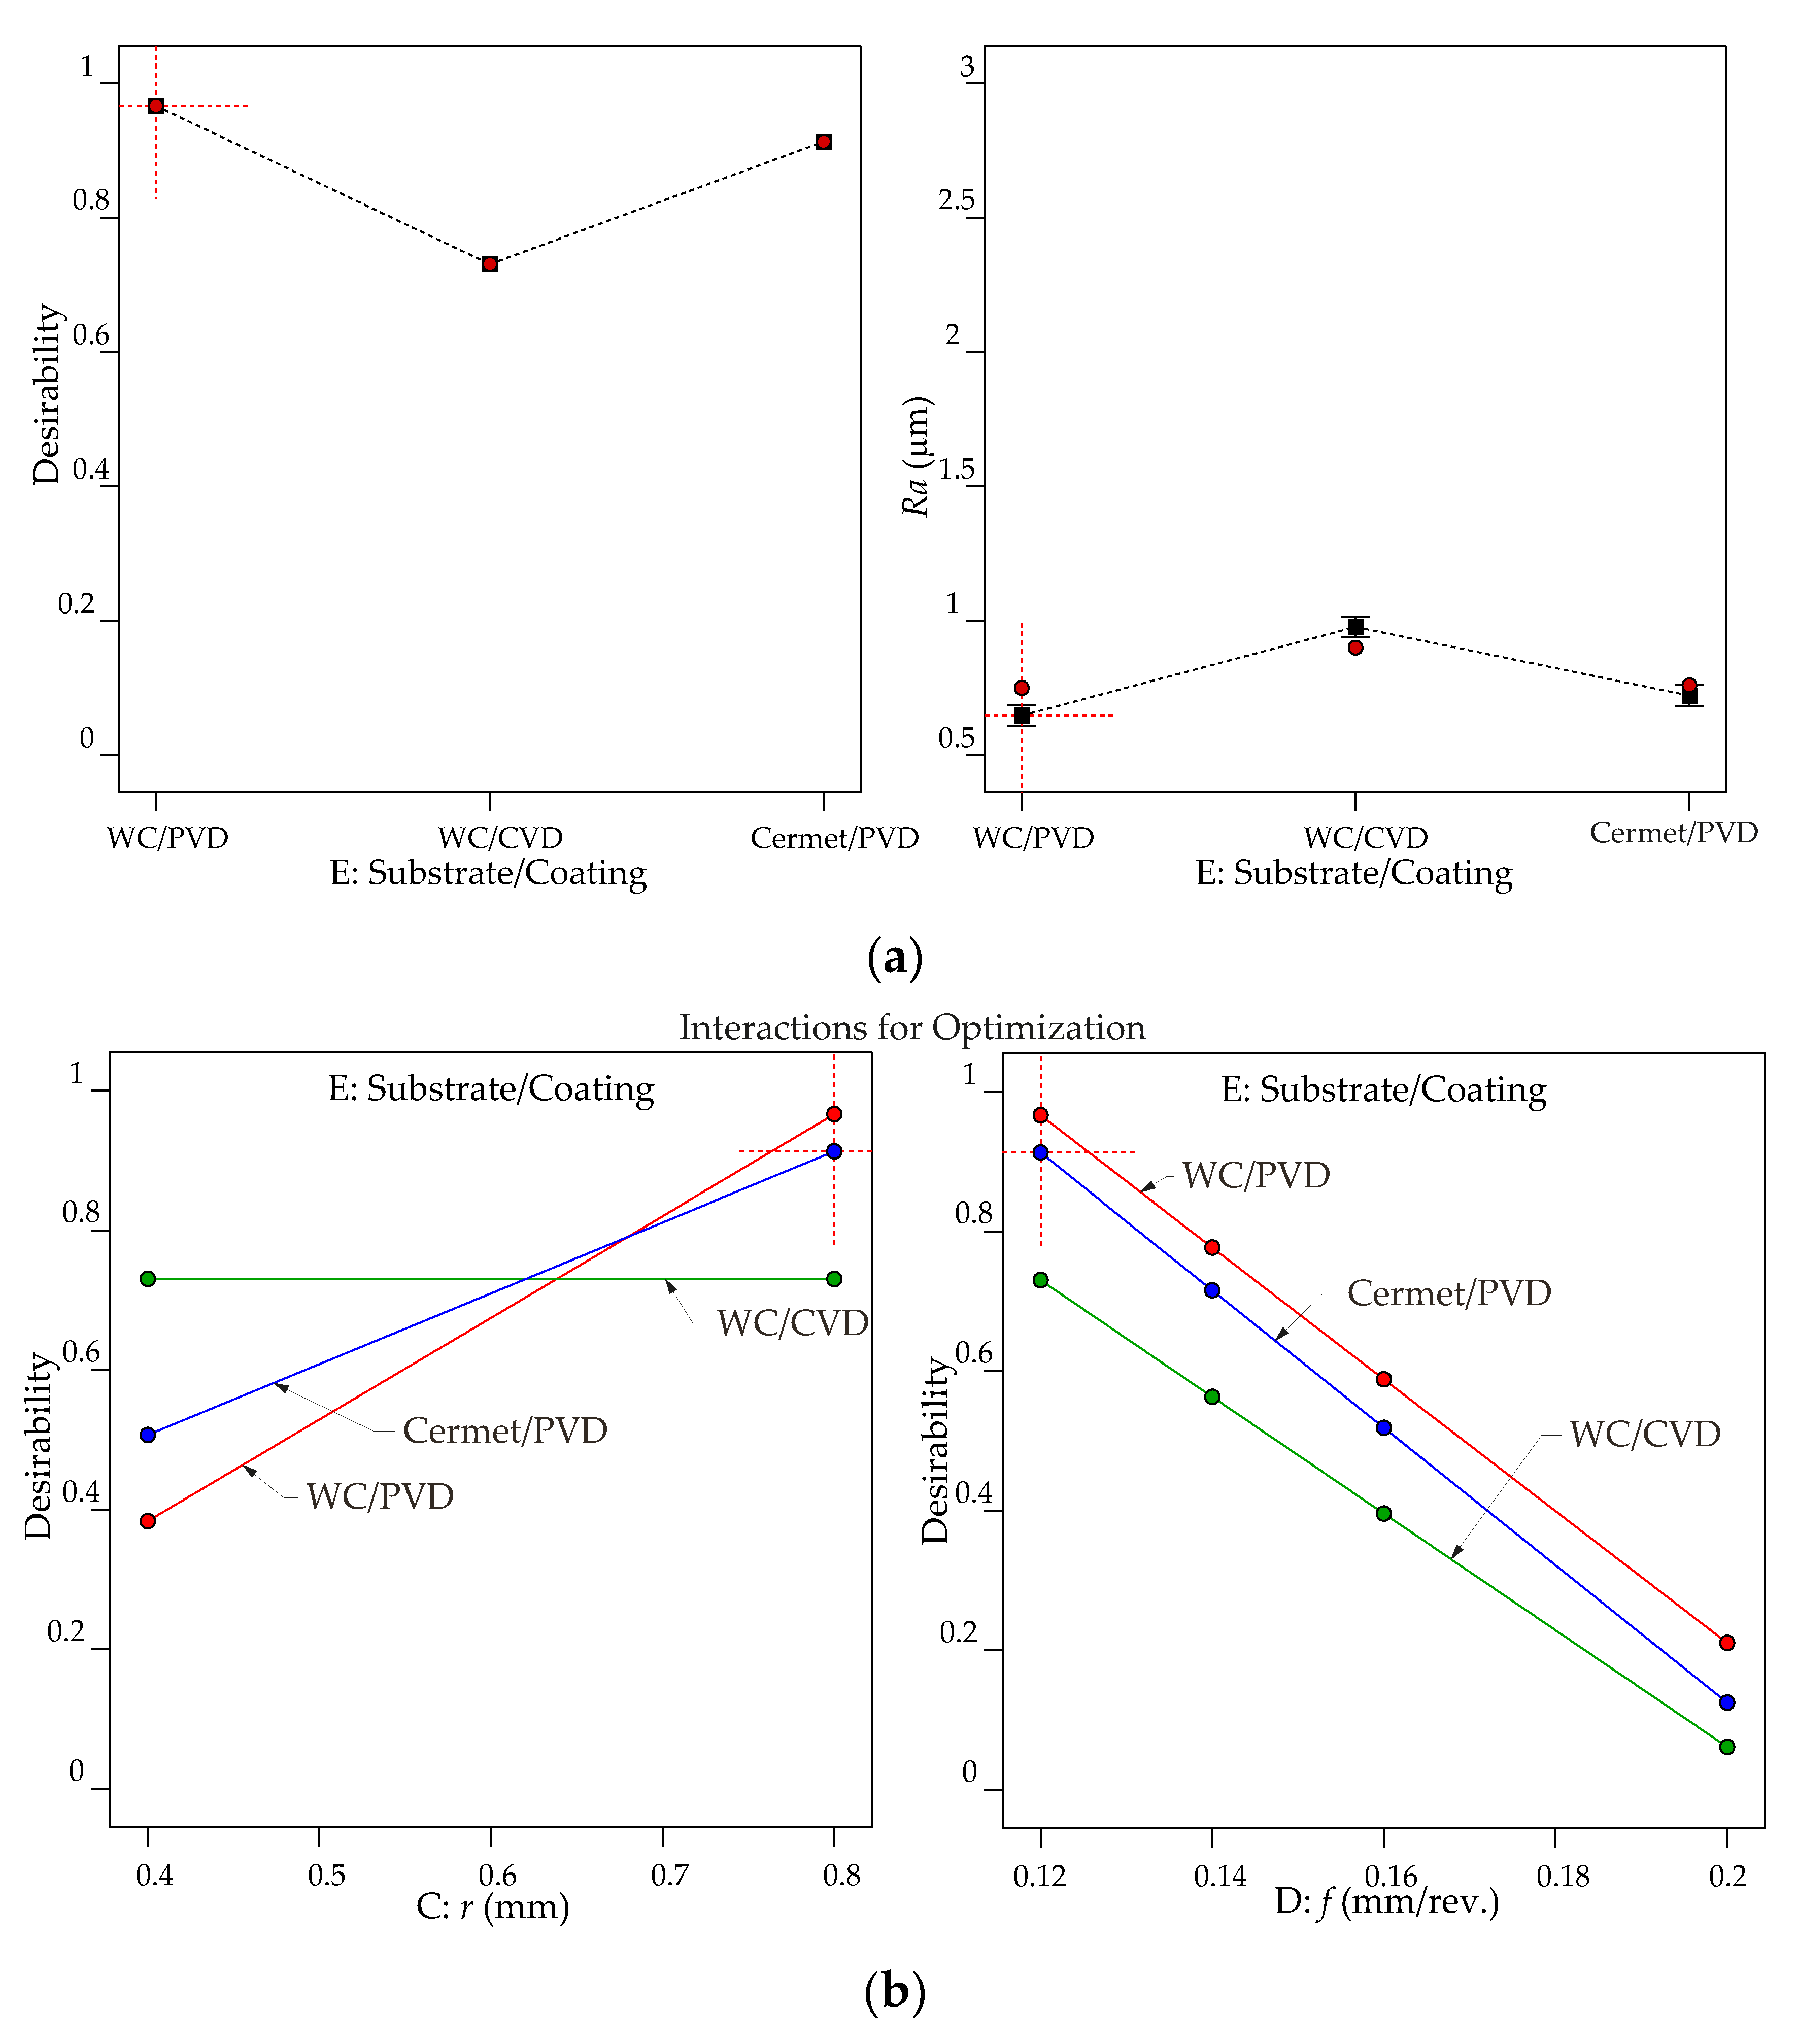
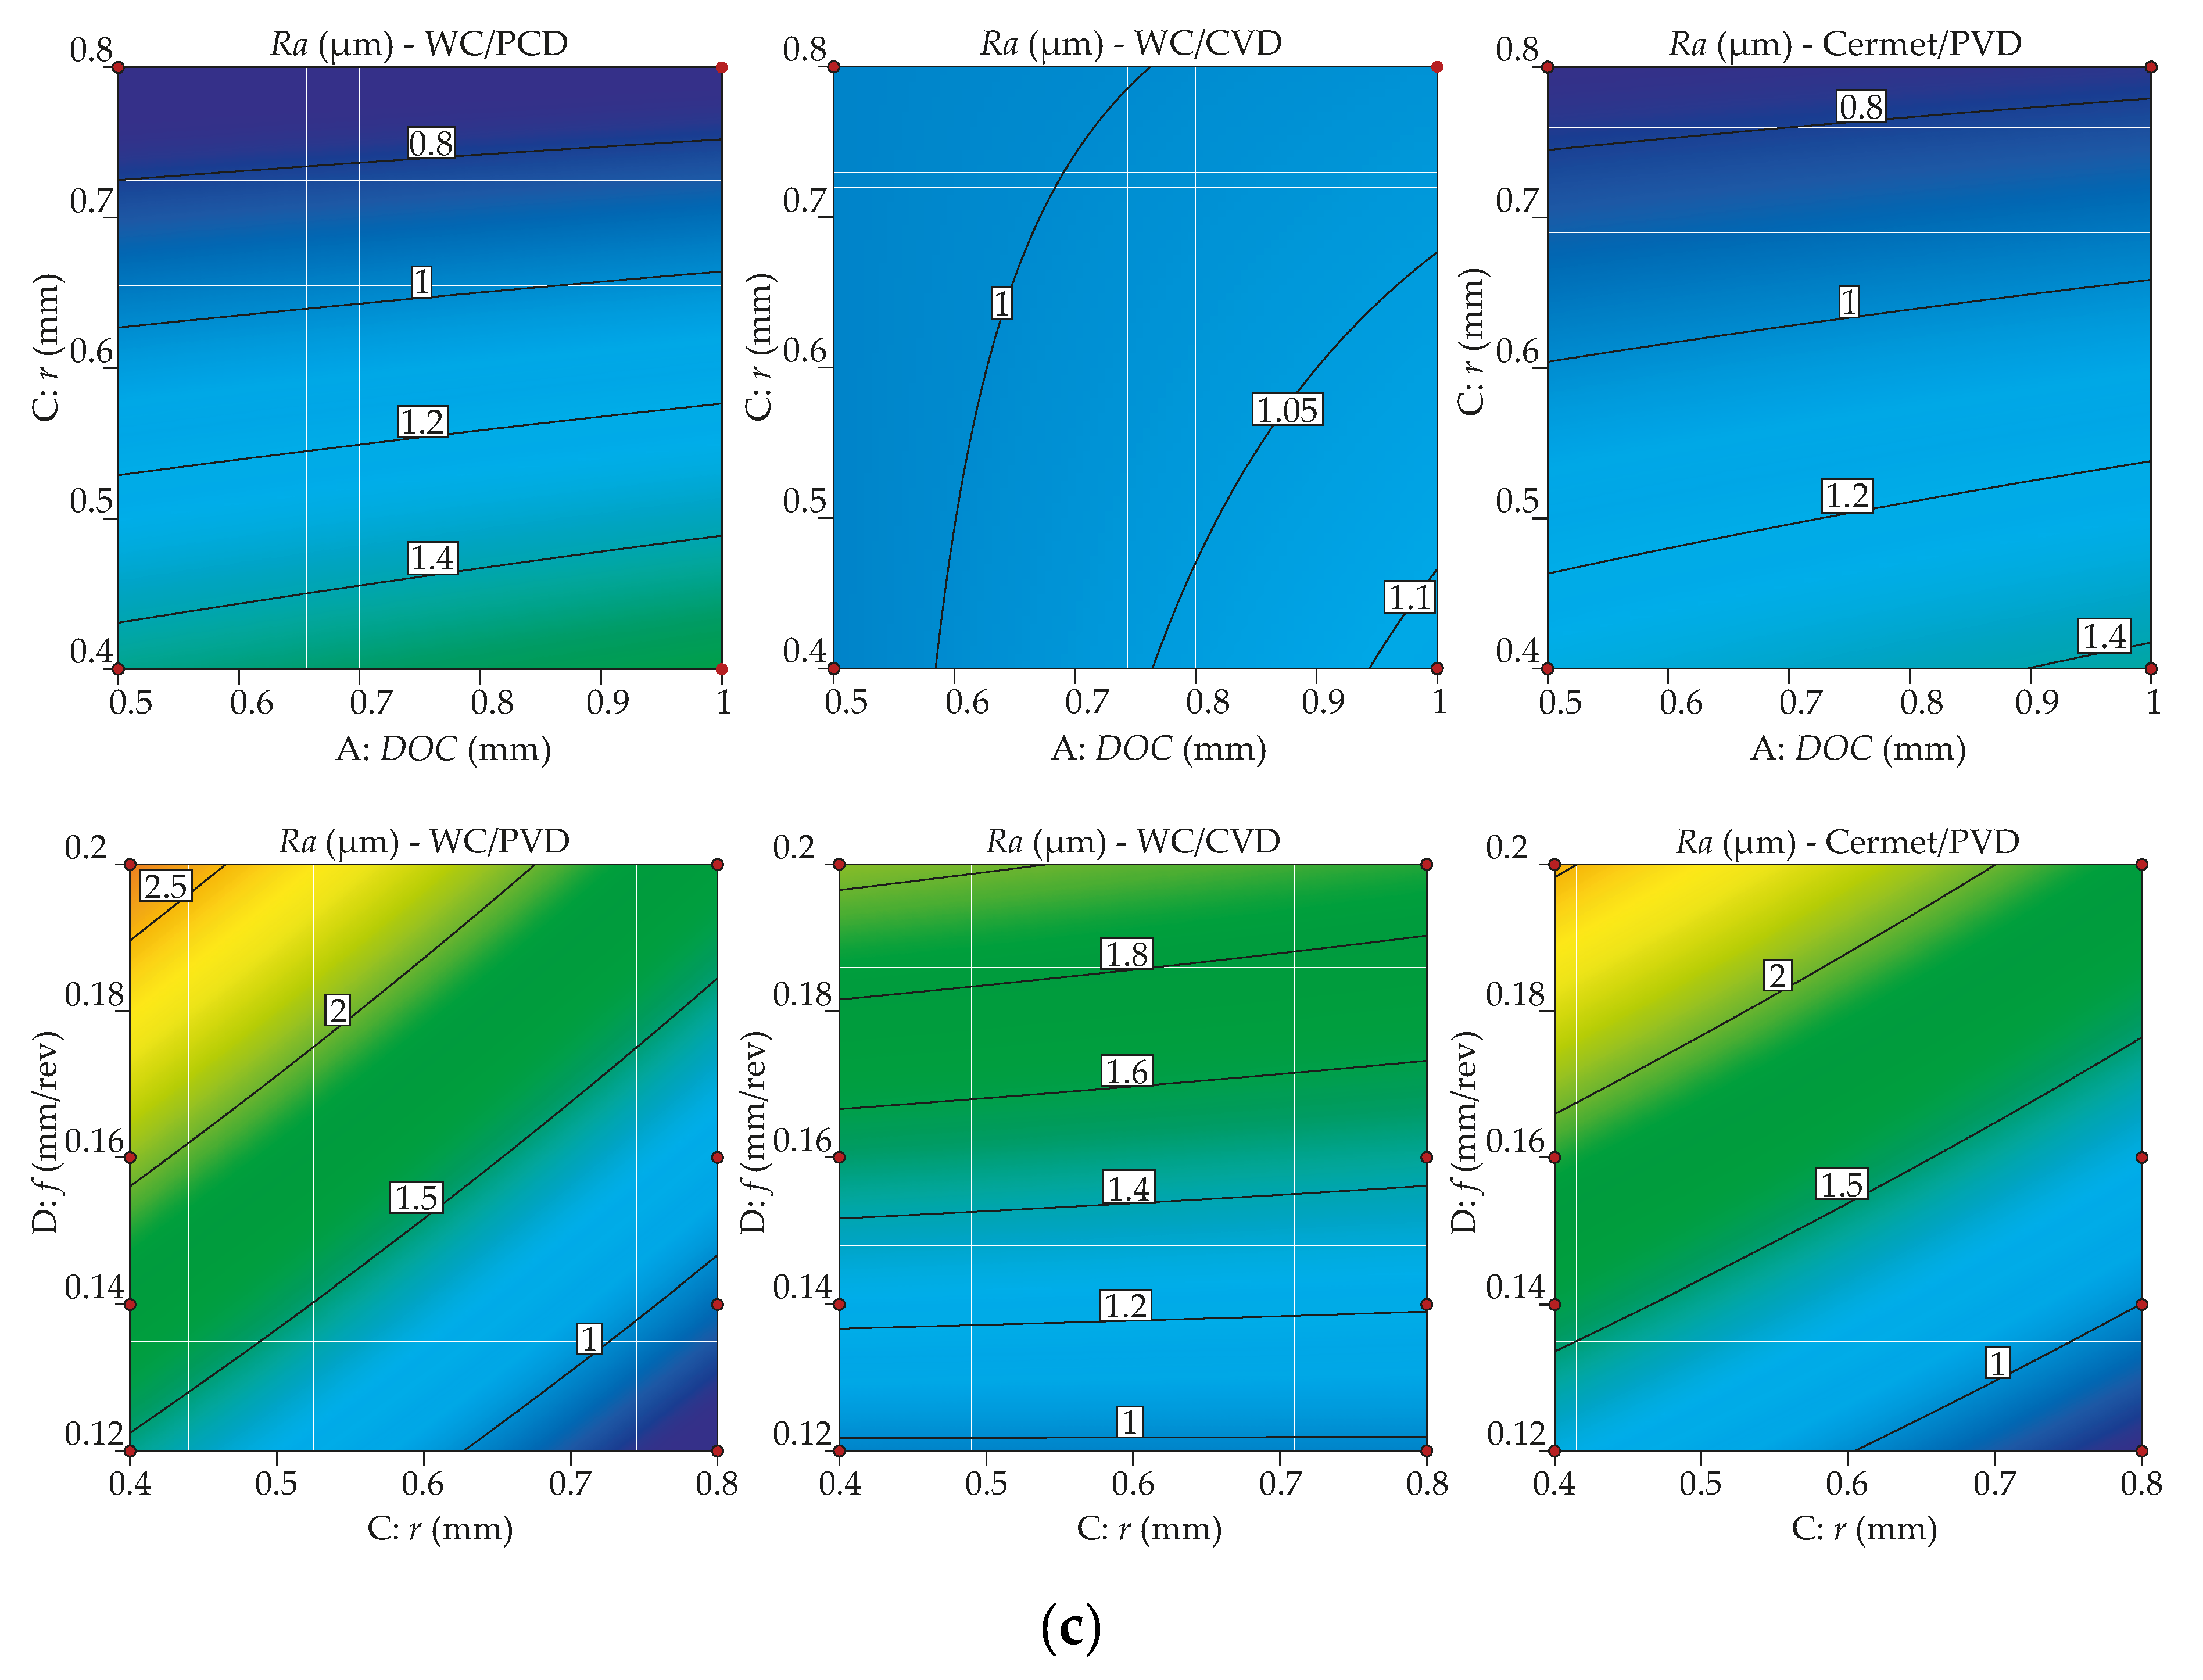
Figure 13 and Figure 14 illustrate graphs of optimization results for Ra and Rz, respectively. The controllable factors that are not shown in each graph are set according to the first optimized solution shown in Table 10 and Table 11, respectively. Figure 13a demonstrates that to achieve the lowest Ra and consequently the highest desirability, the WC/PVD insert must be used. Cermet/PVD insert is one of the optimized options in Table 10; however, its desirability is lower than that of WC/PVD. In addition, the WC/CVD insert cannot be used when the only target is to reach the best surface quality. In Figure 13b, the interaction effects r*f and Substrate/Coating*f show that all the optimized solutions use radii equal to 0.8 mm and 0.12 mm/rev. feed rate; therefore, only WC/PVD and cermet/PVD inserts can obtain a reasonable desirability. Figure 13c shows predicted Ra contour levels of interactions DOC*r and r*f, which also demonstrate that the best combination is the lowest DOC and feed rate with the highest nose radius.
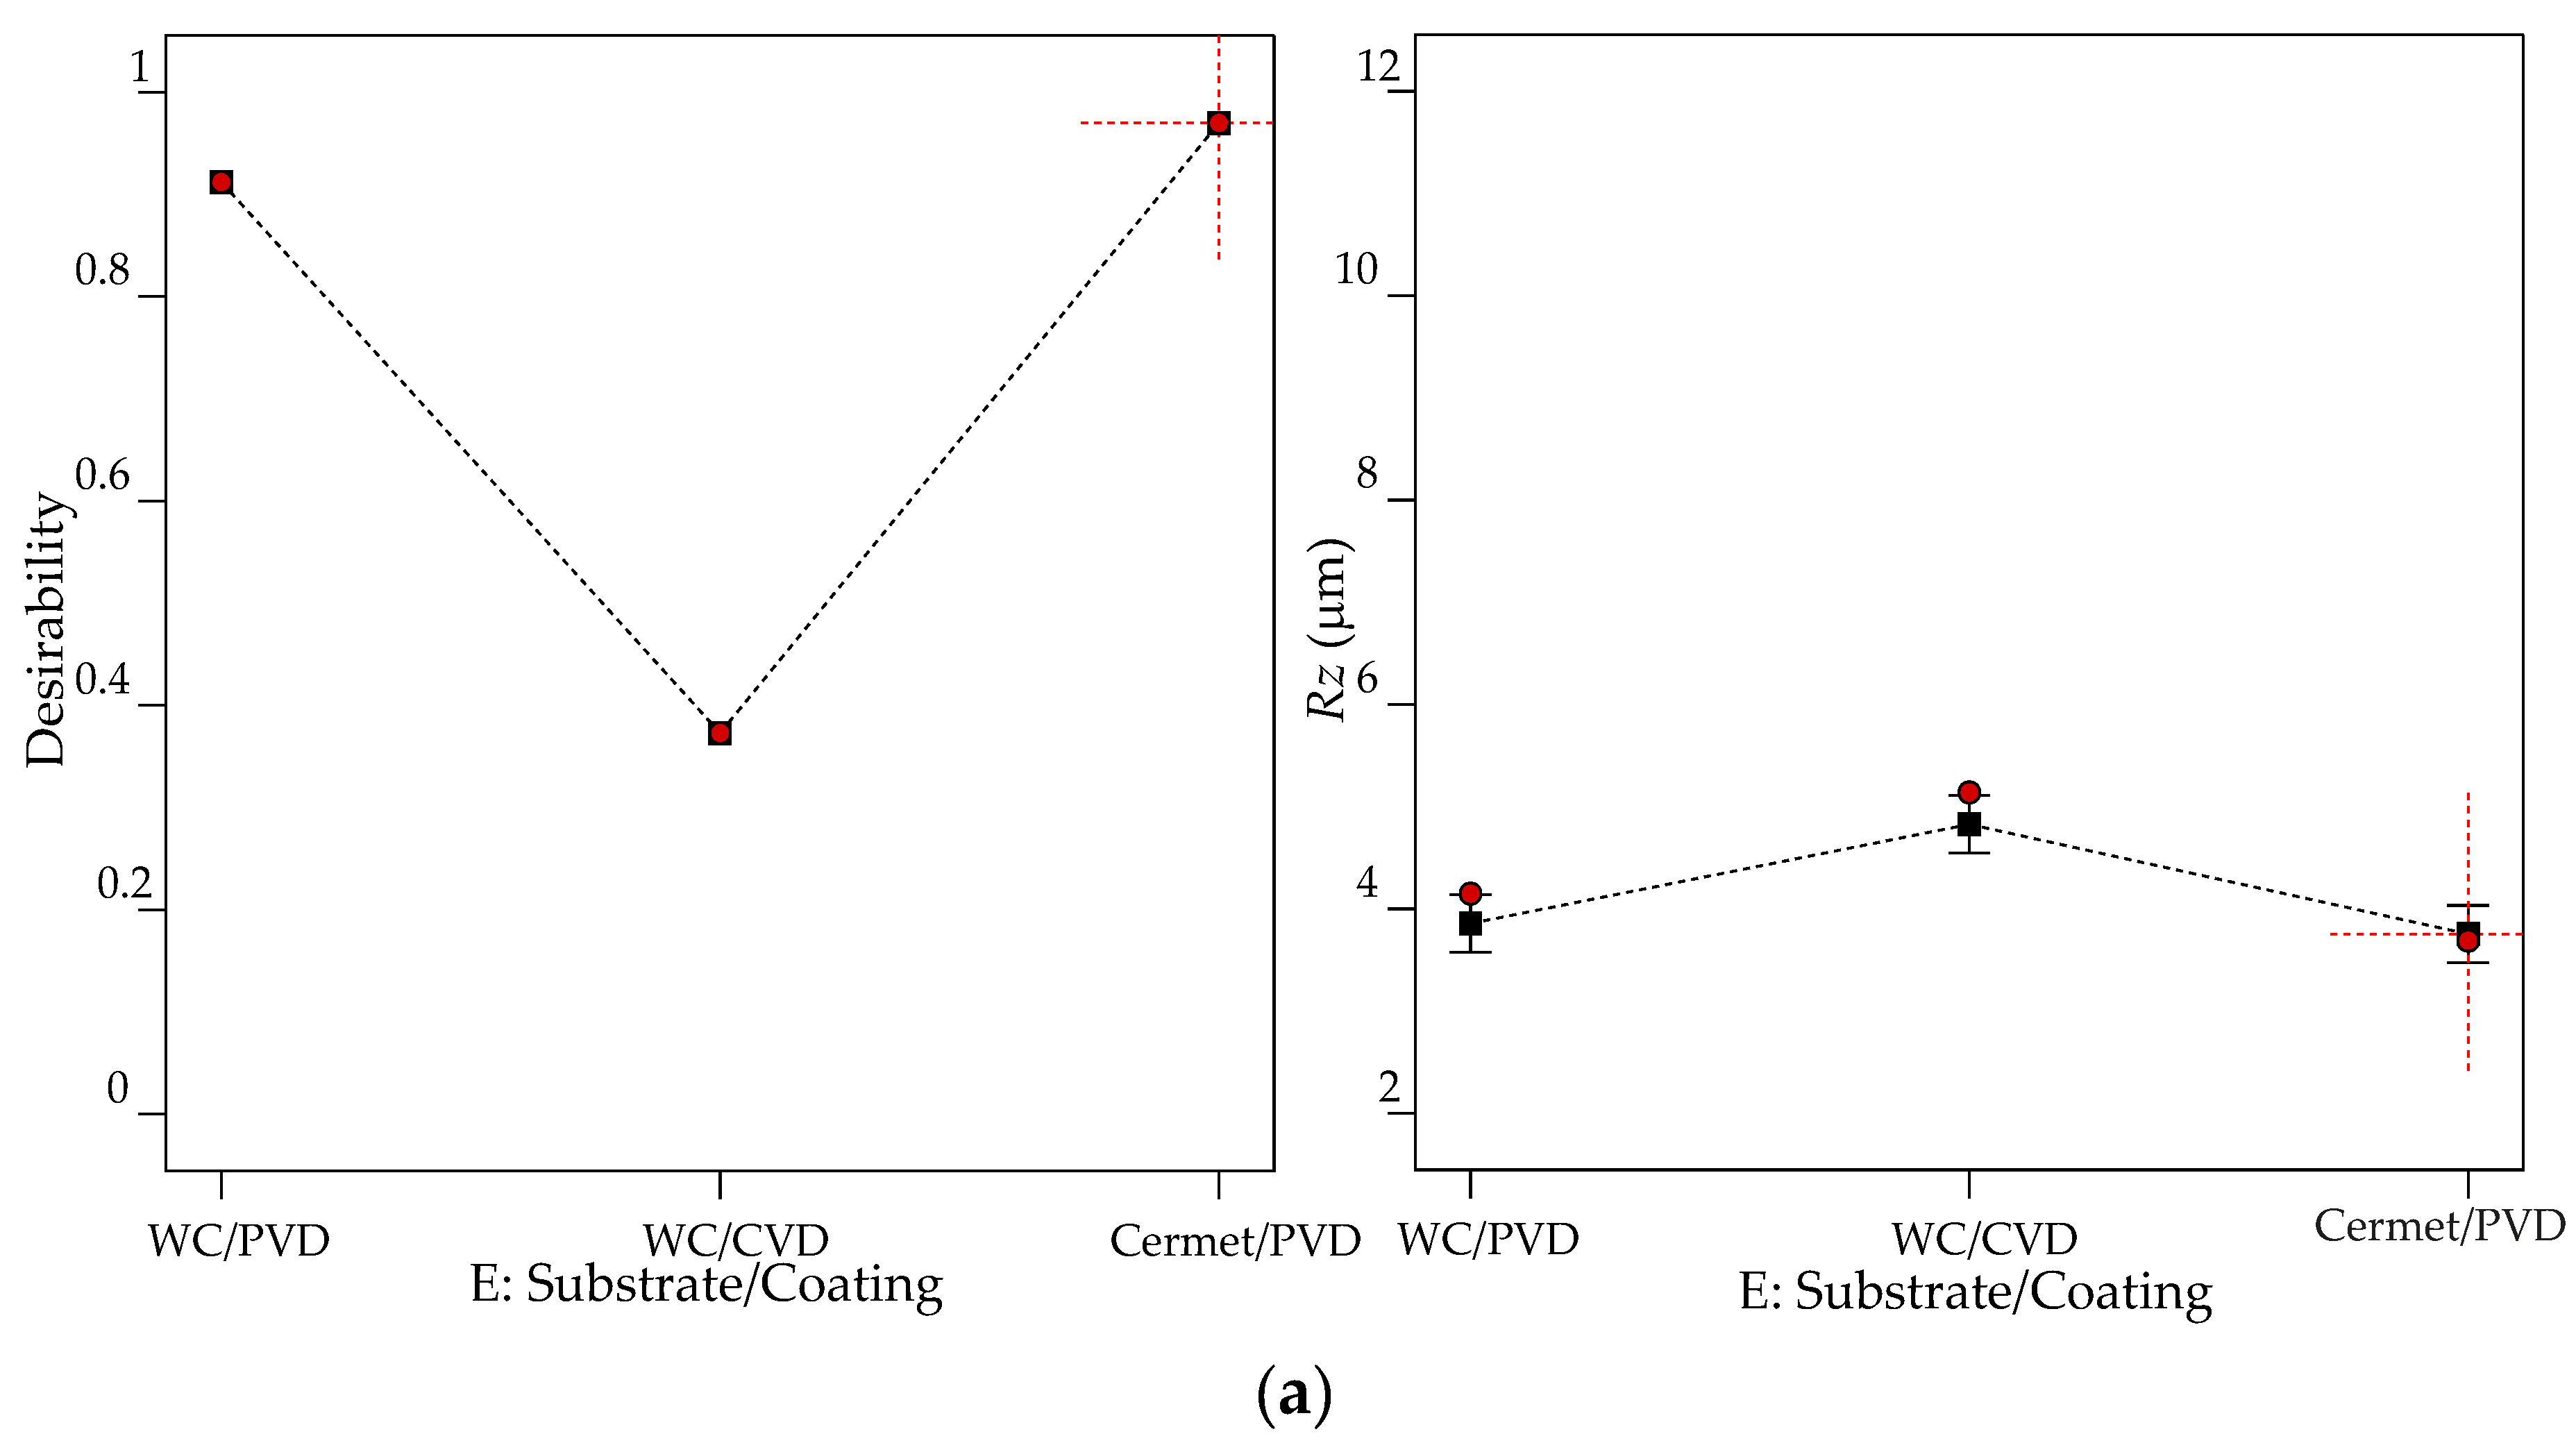
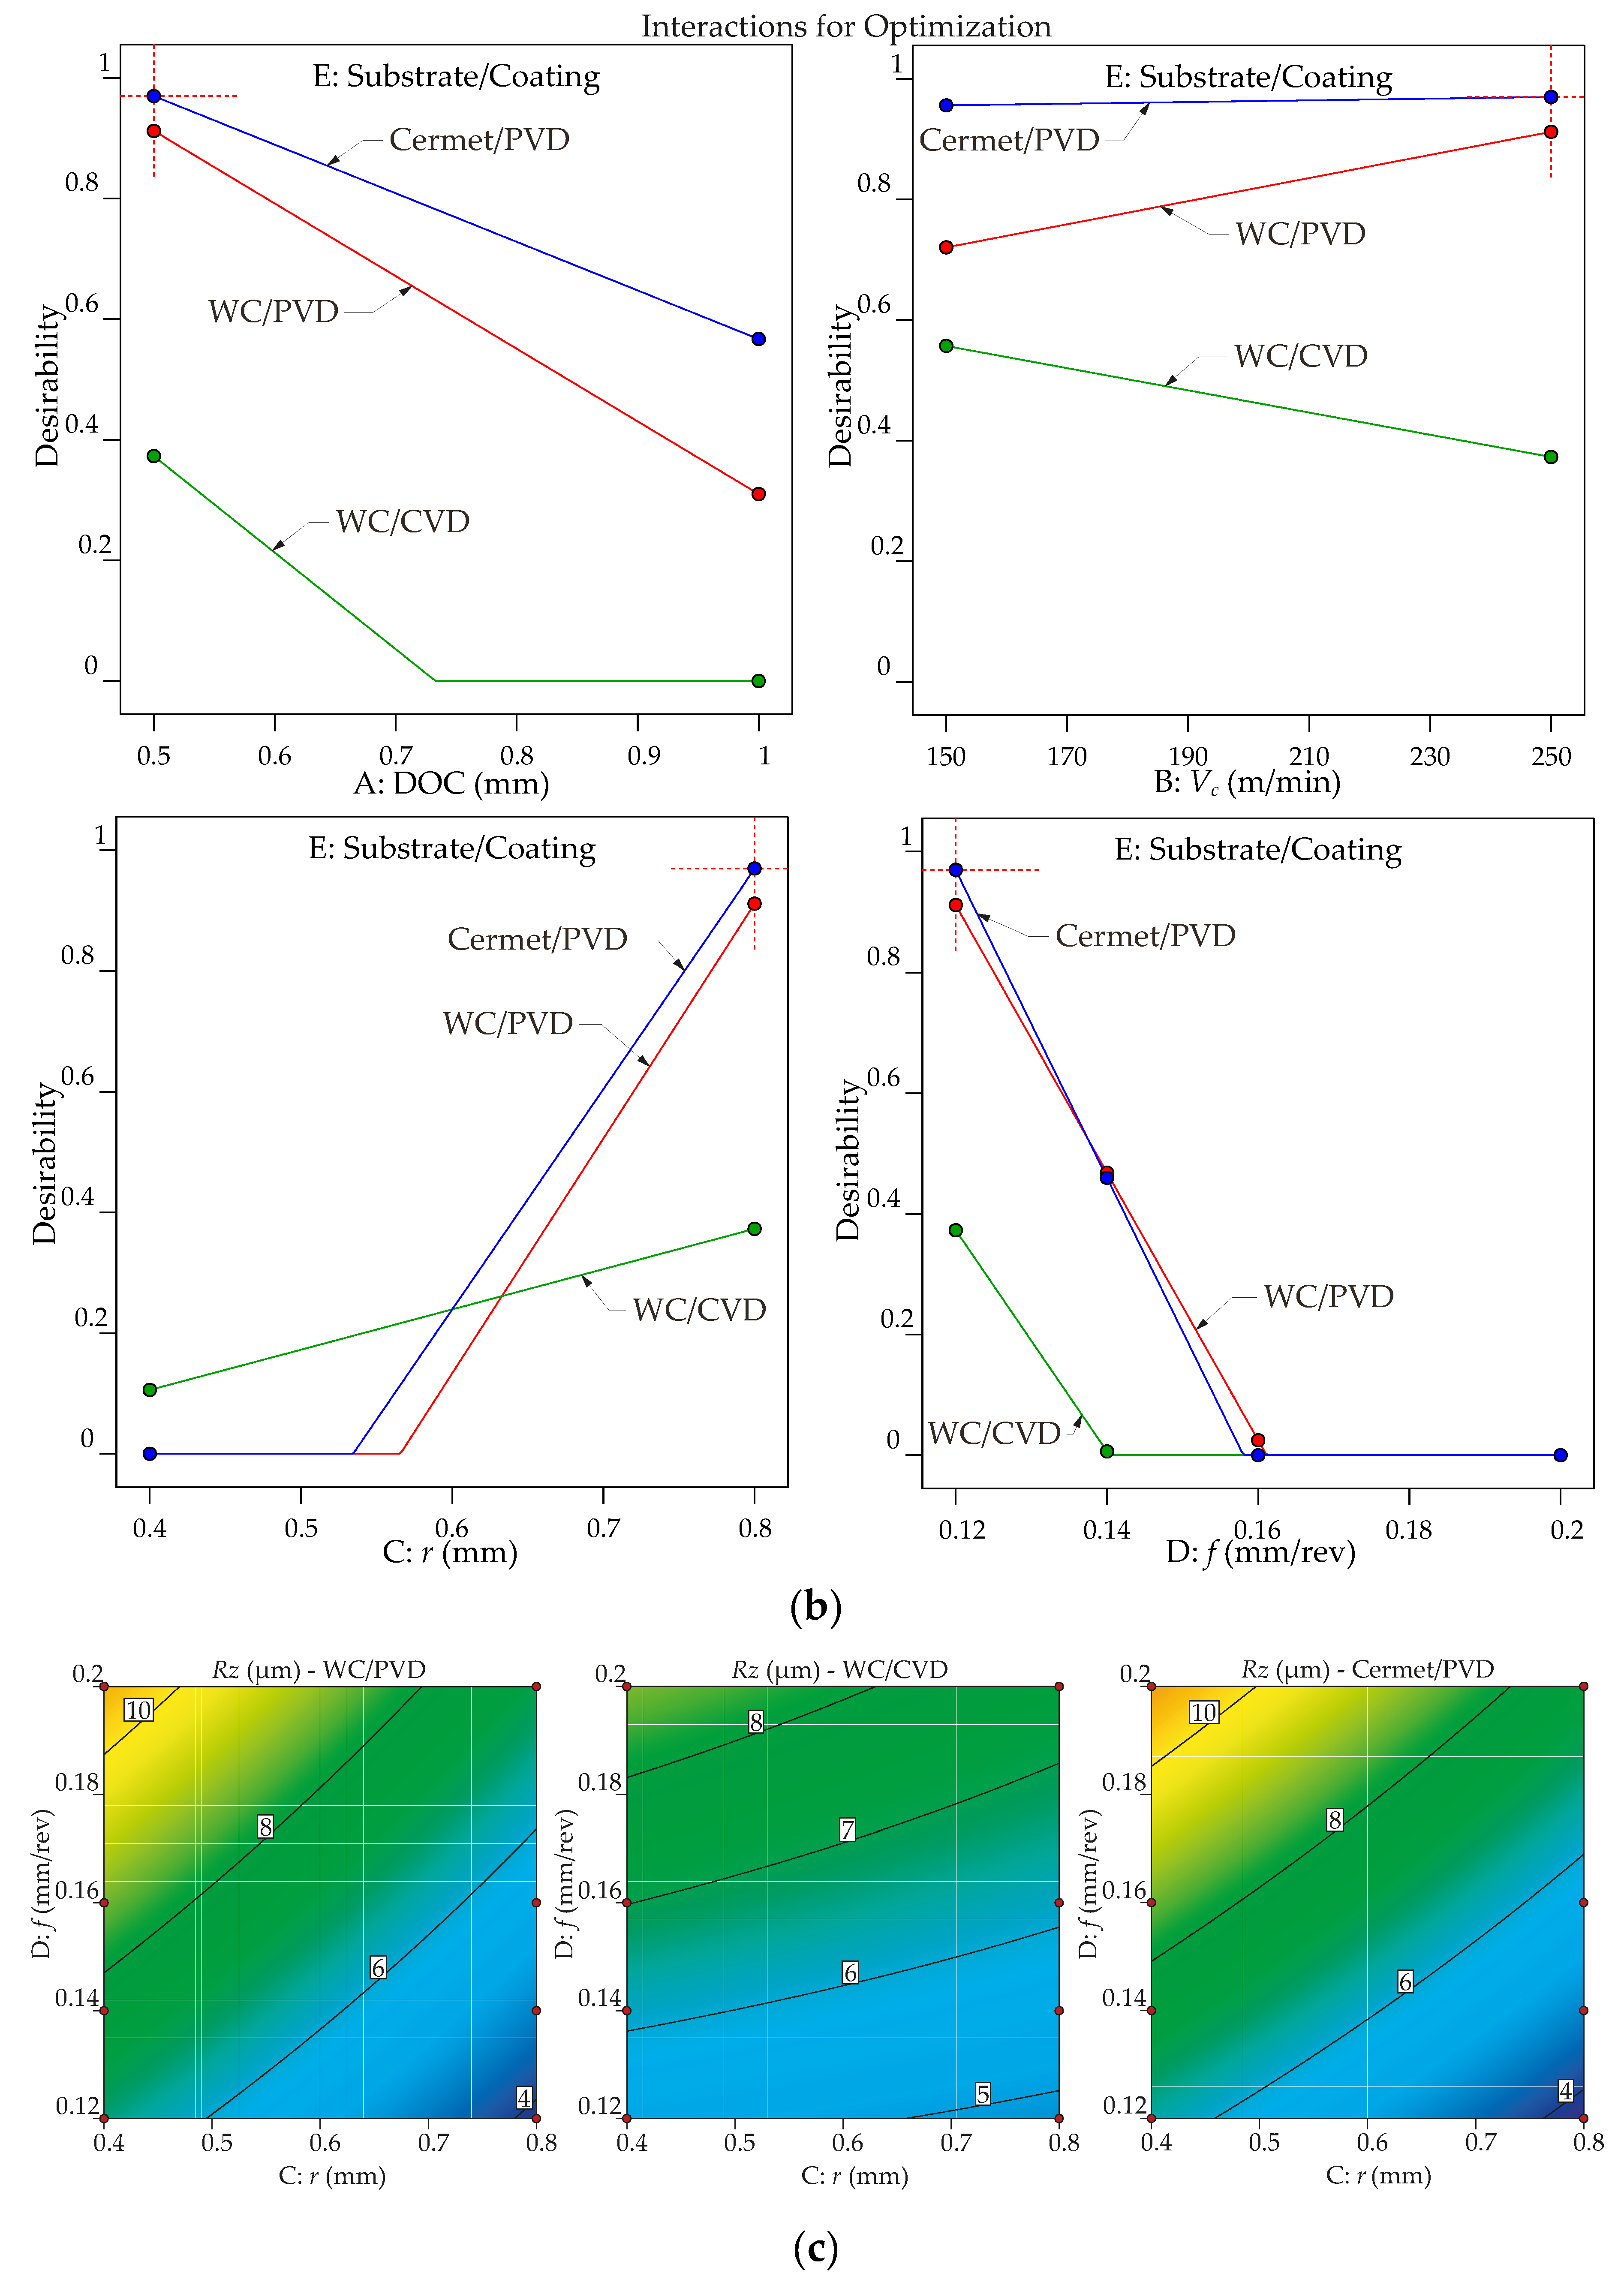
Figure 14a shows that cermet/PVD is the best cutting tool when the lowest Rz is the goal. Figure 14b illustrates the behavior of desirability resulting from the interactions of cutting tool types with the other controllable factors. Figure 14c shows predicted Rz contour levels as a function of the nose radius and feed rate and demonstrates that the best combination is the lowest feed rate and the highest nose radius.
The second optimization is performed with the target to indicate the combinations of the controllable factors generating the lowest roughness with the highest material removal rate. The goals with the parameter ranges defined for the optimization process for both removal rate and roughness parameters Ra and Rz are summarized in Table 12. Table 13 and Table 14 present six and three predicted optimization results considering a decreasing desirability for Ra and Rz, respectively. Figure 15 illustrates the results for the maximum removal rate minimizing the Ra and Rz.
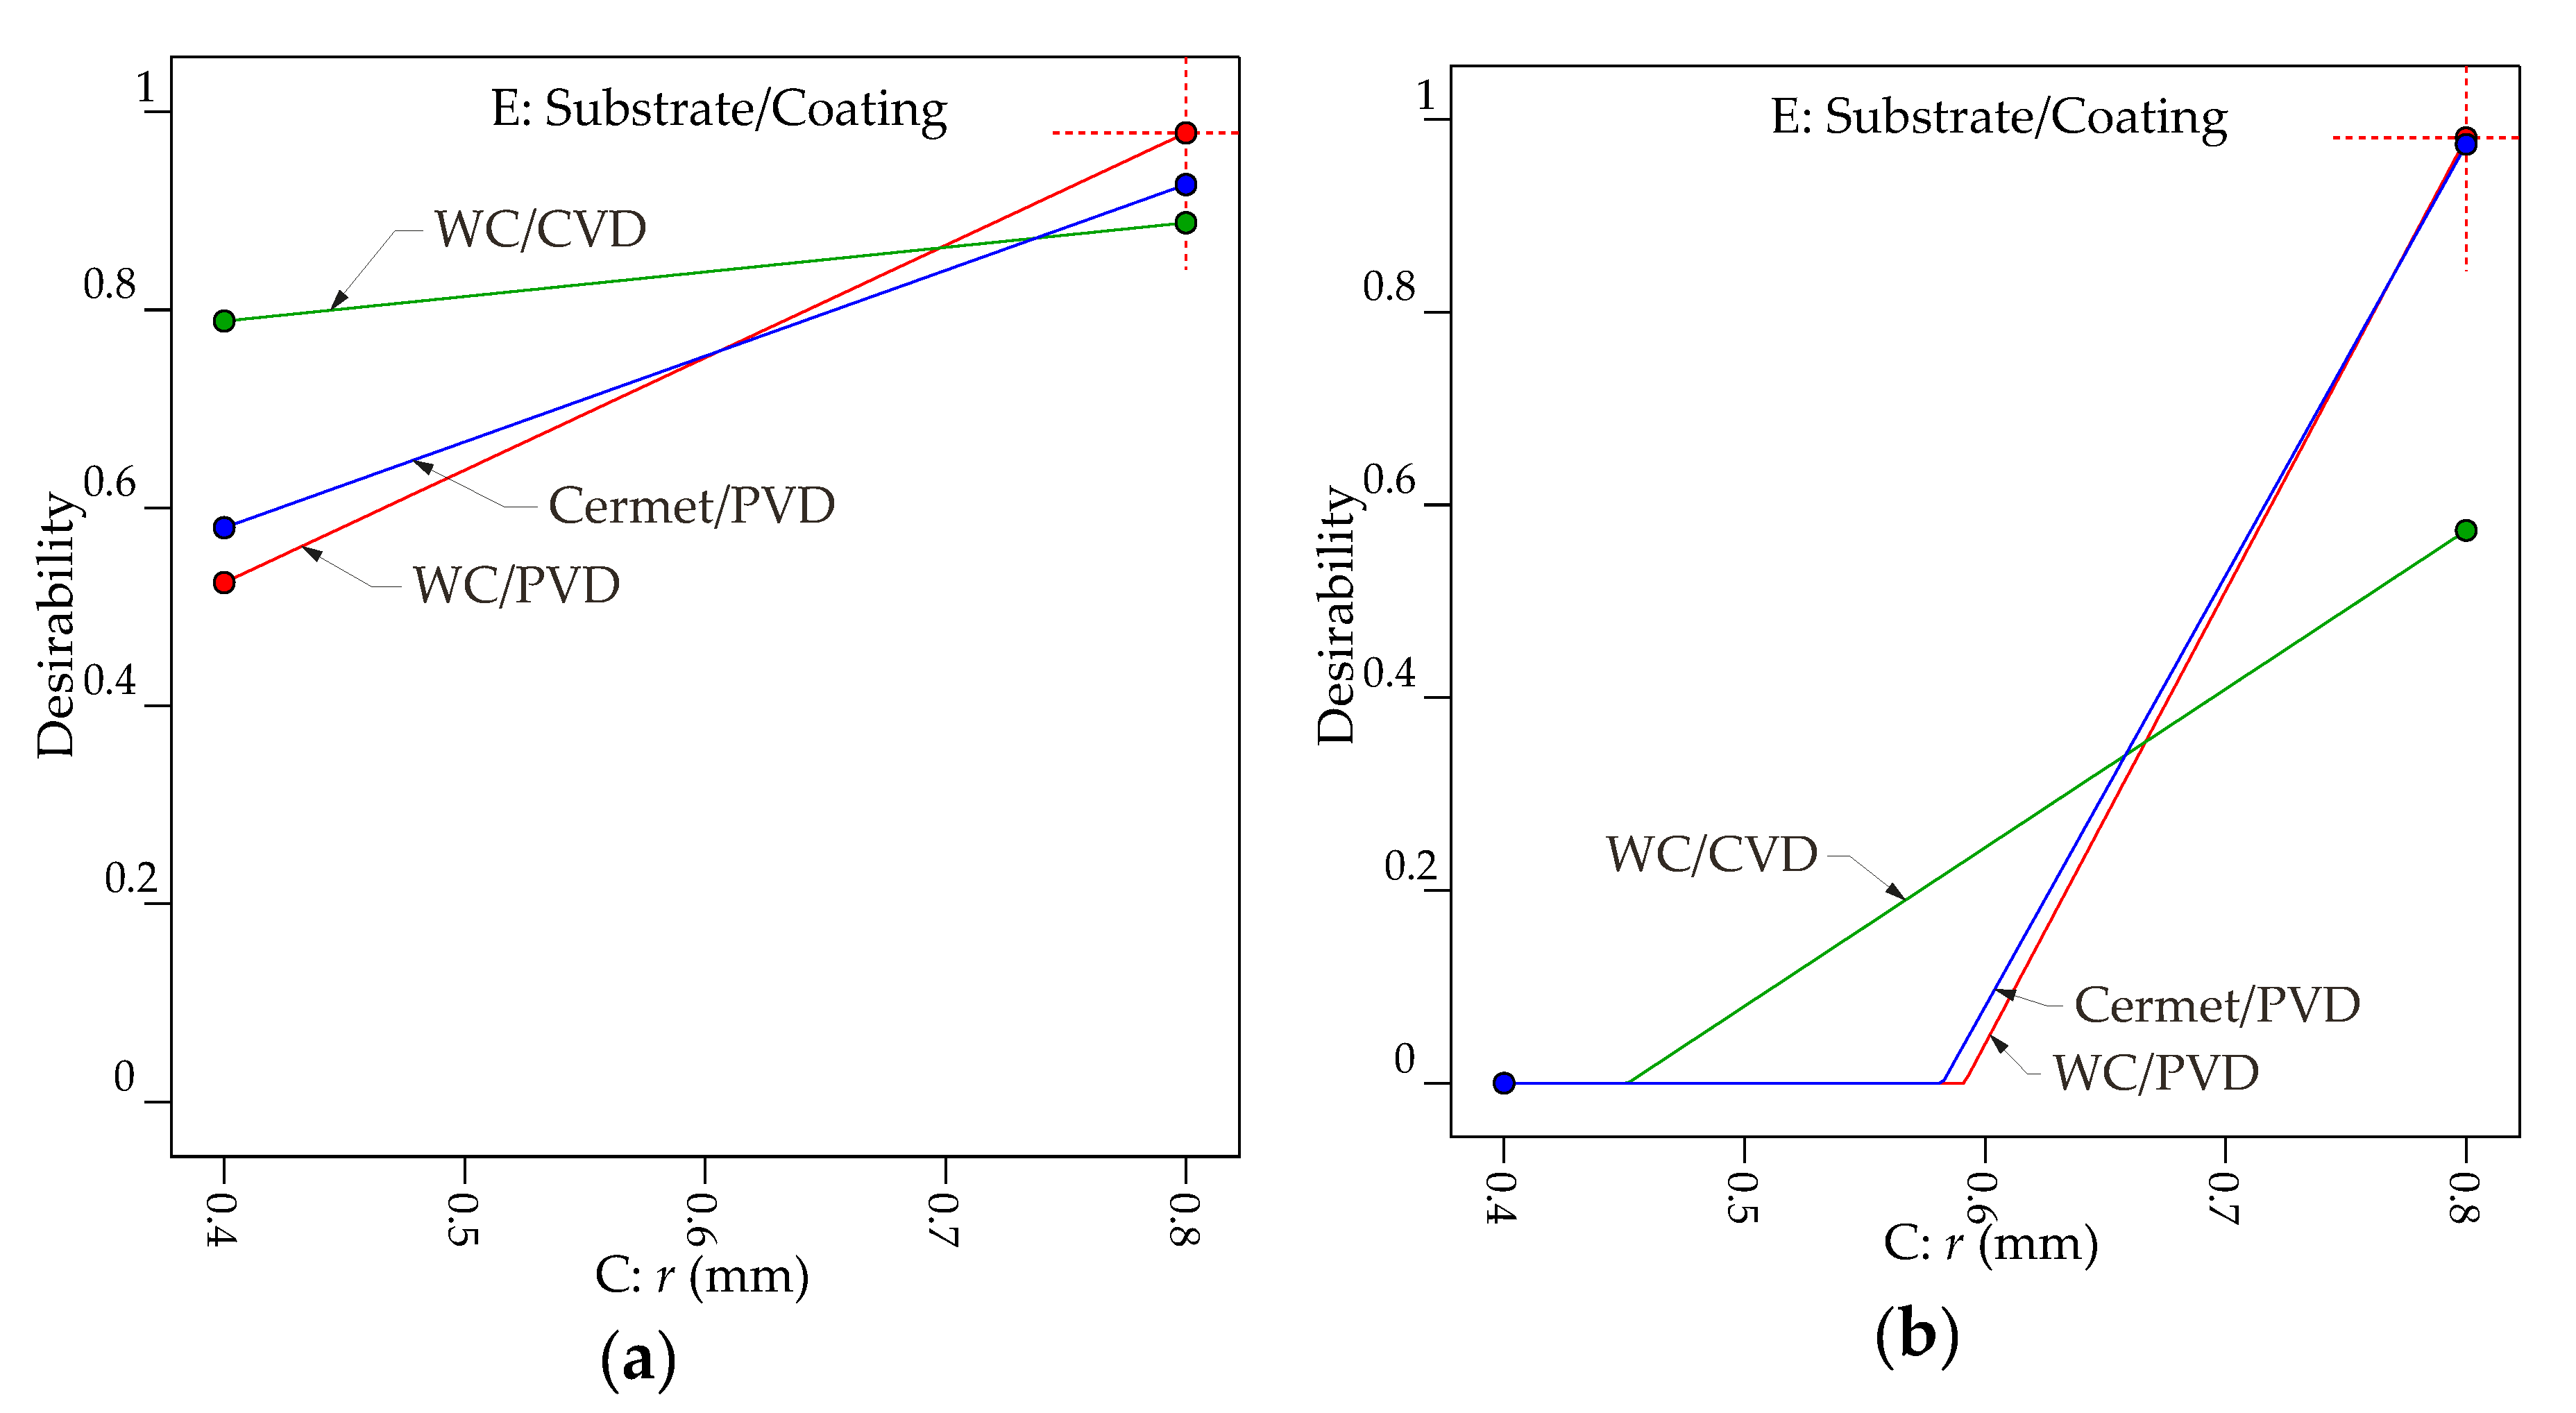
Figure 15a demonstrates that interaction effects between Substrate/Coating*r indicate that the best desirability of 0.979 is obtained when the nose radius is equal to 0.8 mm and the WC/PVD is used in the turning process. If a 0.4 mm nose radius is used, the WC/CVD has the highest desirability, 0.789. A similar conclusion can be seen in Table 13, which shows the possible solutions with decreasing desirability. Figure 15b shows that only the WC/PVD and cermet/PVD inserts can achieve reasonable desirability, 0.981 and 0.974 respectively, and only the application of a 0.8 mm nose radius indicates that it is possible to obtain the desired solutions. Therefore, the possibilities considering the highest removal rate combined with a surface quality criteria are more limited for Rz than for Ra.

4. Conclusions

In this study, the influence of machining parameters such as cutting speed, depth of cut, tool nose radius, feed rate and the substrate and coating method of cutting tools on surface roughness is investigated in turning of AISI 1045 steel, which is widely industrially applicable. Few studies have analyzed the effects of carbide and cermet cutting inserts or the two most common available coating processes on surface roughness. The analysis was preceded by a five-way ANOVA to determine the significant main effects and two-factor interaction effects on the Ra and Rz roughness parameters. In addition, the application of RSM was used to obtain mathematical models (2FI) for both Ra and Rz surface roughness parameters as a function of the significant turning parameters and their interactions for each cutting insert. Optimum values of turning parameters have been obtained considering either the highest surface quality or the lowest surface roughness combined with the highest material removal rate. The main conclusions drawn are as follows:
  • The specific lowest surface roughness for the Ra parameter is obtained by using WC/PVD inserts, but the group mean roughness of the turned workpieces obtained using WC/CVD inserts was lower than the group means of other types of inserts. In other words, this could be the most versatile insert when the manufacturing processes need to use any combination within the range interval of controllable factors.
  • There are some significant two-factor interaction effects that achieve the lowest Ra and Rz roughness parameters. Considering the Ra parameter, the interaction effects are between Substrate/Coating with r or f, and for Rz Substrate/Coating with r, f, DOC or Vc.
  • Both Ra and Rz roughness parameters always have higher values for turned workpieces using higher feed rates and lower nose radii, confirming that they follow the theoretical equations for the geometric surface roughness in turning processes.
  • The response optimization for the predicted lowest Ra surface roughness parameter of 0.647 µm and a desirability of 0.966 is obtained by using WC/PVD inserts with DOC = 0.5 mm, Vc = 250 m/min, r = 0.8 mm and f = 0.120 mm/rev. However, when considering the Rz surface roughness parameter, the response optimization infers that the cermet/PVD outperforms the other cutting inserts, with a predicted value of 3.754 µm and desirability of 0.970.
  • For the target of the best surface finish combined with a maximum material removal rate of 40 cm3/min, the response optimization shows that the most suitable inserts would be WC/PVD, followed very closely by Cermet/PVD, with the lowest predicted values for Ra = 1.749 µm and Rz = 8.136 µm and desirability of 0.979 and 0.981, respectively.
  • Finally, the response optimization shows that, within the range interval of controllable factors used in this analysis and the surface finish criteria, the fine adjustment of the turning process can improve productivity and also be an alternative to grinding operations, since the predicted surface finish values for Ra parameter are under 2 µm.

Supplementary Materials

The following are available online at https://www.mdpi.com/1996-1944/13/22/5231/s1, Figure S1: Main effects plot for surface roughness means: (a) Ra; (b) Rz; Figure S2: Graphs of the multiple comparison of the means, considering Substrate/Coating and cutting speed: (a) and (b), Ra; (c) and (d), Rz.

Author Contributions

Conceptualization, E.P. and M.G.; methodology, E.P.; software, E.P.; validation, E.P.; analysis, E.P. and M.G.; investigation, E.P., M.G., F.R.R., T.M. and M.M.; resources, E.P., M.G., F.R.R., T.M. and M.M.; data curation, E.P. and F.R.R.; writing—original draft preparation, E.P., M.G., F.R.R, T.M. and M.M.; writing—review and editing, E.P., M.G., F.R.R, T.M. and M.M; visualization, E.P., M.G. and T.M.; supervision, E.P., M.G., F.R.R, T.M. and M.M.; project administration, E.P.; funding acquisition, E.P., T.M. and M.M. All authors have read and agreed to the published version of the manuscript.

Funding

This research received no external funding.

Acknowledgments

The authors would like to thank to Paese Distribuidora for their support in this experimental study.

Conflicts of Interest

The authors declare no conflict of interest.

Nomenclature

AISIAmerican Iron and Steel Institute
Al2O3Aluminum oxide
ANOVAAnalysis of Variance
CBNCarbon Boron Nitride
CVDChemical Vapor Deposition
DOEDesign of Experiments
DOCDepth of cut (mm)
ffeed rate (mm/rev)
ISOInternational Organization for Standardization
MT-CVDModerate Temperature Chemical Vapor Deposition
PVDPhysical Vapor Deposition
rtool nose radius (mm)
RaArithmetic Mean Value of Profile (µm)
RzISO ten-point height (µm)
RSMResponse Surface Methodology
TiAlNTitanium Aluminum Nitride
TiNTitanium Nitride
TiCNTitanium Carbo-Nitride
Vccutting speed (m/min)
WCTungsten carbide

References

  1. Sahin, Y.; Motorcu, A.R. Surface roughness model for machining mild steel with coated carbide tool. Mater. Des. 2005, 26, 321–326. [Google Scholar] [CrossRef]
  2. Mikolajczyk, T. Modeling of minimal thickness cutting layer influence on surface roughness in turning. Appl. Mech. Mater. 2014, 656, 262–269. [Google Scholar] [CrossRef]
  3. Mikołajczyk, T.; Latos, H.; Pimenov, D.Y.; Paczkowski, T.; Gupta, M.K.; Krolczyk, G. Influence of the main cutting edge angle value on minimum uncut chip thickness during turning of C45 steel. J. Manuf. Process. 2020, 57, 354–362. [Google Scholar] [CrossRef]
  4. Noordin, M.; Venkatesh, V.; Sharif, S.; Elting, S.; Abdullah, A. Application of response surface methodology in describing the performance of coated carbide tools when turning AISI 1045 steel. J. Mater. Process. Technol. 2004, 145, 46–58. [Google Scholar] [CrossRef] [Green Version]
  5. Davim, J.P. A note on the determination of optimal cutting conditions for surface finish obtained in turning using design of experiments. J. Mater. Process. Technol. 2001, 116, 305–308. [Google Scholar] [CrossRef]
  6. Bouzid, W. Cutting parameter optimization to minimize production time in high speed turning. J. Mater. Process. Technol. 2005, 161, 388–395. [Google Scholar] [CrossRef]
  7. Geier, M.; Souza, A.J. Empirical Determination of Roughness Parameters Using Wiper Tool Inserts in Finish Turning of AISI 4140. Adv. Mater. Res. 2013, 845, 929–933. [Google Scholar] [CrossRef]
  8. Mikolajczyk, T.; Latos, H.; Paczkowski, T.; Pimenov, D.Y.; Szynka, T. Innovative tools for oblique cutting. Procedia Manuf. 2018, 22, 166–171. [Google Scholar] [CrossRef]
  9. Bushlya, V.; Zhou, J.; Ståhl, J.E. Effect of cutting conditions on machinability of superalloy inconel 718 during high speed turning with coated and uncoated PCBN tools. Procedia CIRP 2012, 3, 370–375. [Google Scholar] [CrossRef] [Green Version]
  10. Zhou, J.; Bushlya, V.; Avdovic, P.; Ståhl, J.E. Study of surface quality in high speed turning of Inconel 718 with uncoated and coated CBN tools. Int. J. Adv. Manuf. Technol. 2012, 58, 141–151. [Google Scholar] [CrossRef]
  11. Thakur, A.; Mohanty, A.; Gangopadhyay, S. Comparative study of surface integrity aspects of Incoloy 825 during machining with uncoated and CVD multilayer coated inserts. Appl. Surf. Sci. 2014, 320, 829–837. [Google Scholar] [CrossRef]
  12. Thakur, A.; Gangopadhyay, S. Influence of tribological properties on the performance of uncoated, CVD and PVD coated tools in machining of Incoloy 825. Tribol. Int. 2016, 102, 198–212. [Google Scholar] [CrossRef]
  13. Jakhar, V.; Nayak, M.; Sharma, N. A literature review on optimization of cutting parameters for surface roughness in turning process. Int. J. Eng. Res. Dev. 2017, 4, 2810–2815. [Google Scholar]
  14. Mikolajczyk, T.; Olaru, A. Some Methods of Research Results Approximation. Appl. Mech. Mater. 2015, 783, 95–103. [Google Scholar] [CrossRef]
  15. Abbas, A.T.; Pimenov, D.Y.; Erdakov, I.N.; Mikolajczyk, T.; El Danaf, E.A.; Taha, M.A. Minimization of turning time for high-strength steel with a given surface roughness using the Edgeworth–Pareto optimization method. Int. J. Adv. Manuf. Technol. 2017, 93, 2375–2392. [Google Scholar] [CrossRef]
  16. Cakir, M.C.; Ensarioglu, C.; Demirayak, I. Mathematical modeling of surface roughness for evaluating the effects of cutting parameters and coating material. J. Mater. Process. Technol. 2009, 209, 102–109. [Google Scholar] [CrossRef]
  17. Khellaf, A.; Aouici, H.; Smaiah, S.; Boutabba, S.; Yallese, M.A.; Elbah, M. Comparative assessment of two ceramic cutting tools on surface roughness in hard turning of AISI H11 steel: Including 2D and 3D surface topography. Int. J. Adv. Manuf. Technol. 2017, 89, 333–354. [Google Scholar] [CrossRef]
  18. Bouacha, K.; Yallese, M.A.; Mabrouki, T.; Rigal, J.F. Statistical analysis of surface roughness and cutting forces using response surface methodology in hard turning of AISI 52100 bearing steel with CBN tool. Int. J. Refract. Met. Hard Mater. 2010, 28, 349–361. [Google Scholar] [CrossRef]
  19. Toulfatzis, A.I.; Pantazopoulos, G.A.; David, C.N.; Sagris, D.S.; Paipetis, A.S. Machinability of eco-friendly lead-free brass alloys: Cutting-force and surface-roughness optimization. Metals 2018, 8, 250. [Google Scholar] [CrossRef] [Green Version]
  20. Darwish, S.M. Impact of the tool material and the cutting parameters on surface roughness of supermet 718 nickel superalloy. J. Mater. Process. Technol. 2000, 97, 10–18. [Google Scholar] [CrossRef]
  21. Kuntoğlu, M.; Aslan, A.; Pimenov, D.Y.; Giasin, K.; Mikolajczyk, T.; Sharma, S. Modeling of Cutting Parameters and Tool Geometry for Multi-Criteria Optimization of Surface Roughness and Vibration via Response Surface Methodology in Turning of AISI 5140 Steel. Materials 2020, 13, 4242. [Google Scholar] [CrossRef]
  22. Kuntoğlu, M.; Aslan, A.; Sağlam, H.; Pimenov, D.Y.; Giasin, K.; Mikolajczyk, T. Optimization and analysis of surface roughness, flank wear and 5 different sensorial data via tool condition monitoring system in turning of aisi 5140. Sensors 2020, 20, 4377. [Google Scholar] [CrossRef] [PubMed]
  23. Aruna, M.; Dhanalaksmi, V. Design Optimization of Cutting Parameters when Turning Inconel 718 with Cermet Inserts. World J. Eng. Technol. 2012, 6, 812–815. [Google Scholar]
  24. Keblouti, O.; Boulanouar, L.; Azizi, M.W.; Yallese, M.A. Modeling and multi-objective optimization of surface roughness and productivity in dry turning of AISI 52100 steel using (TiCN-TiN) coating cermet tools. Int. J. Ind. Eng. Comput. 2017, 8, 71–84. [Google Scholar] [CrossRef]
  25. Kryvyi, P.; Dzyura, V.; Tymoshenko, N.; Maruschak, P.; Nugaras, J.; Prentkovskis, O. Probability-statistical estimation method of feed influence on as-turned finish of steels and non-ferrous metals. Metals 2018, 8, 965. [Google Scholar] [CrossRef] [Green Version]
  26. Das, S.R.; Panda, A.; Dhupal, D. Experimental investigation of surface roughness, flank wear, chip morphology and cost estimation during machining of hardened AISI 4340 steel with coated carbide insert. Mech. Adv. Mater. Mod. Process. 2017, 3, 1–14. [Google Scholar] [CrossRef] [Green Version]
  27. Sahoo, A.K.; Sahoo, B. Experimental investigations on machinability aspects in finish hard turning of AISI 4340 steel using uncoated and multilayer coated carbide inserts. Measurement 2012, 45, 2153–2165. [Google Scholar] [CrossRef]
  28. Stephenson, D.A.; Agapiou, J.S. Metal Cutting Theory and Practice, 3rd Edit.; Taylor & Francis Group: Boca Raton, FL, USA, 2016; ISBN 9781466587540. [Google Scholar]
  29. Montgomery, D.C. Design and Analysis of Experiments, 9th ed.; Wiley: Hoboken, NJ, USA, 2017; ISBN 9781119113478. [Google Scholar]
  30. Bartarya, G.; Choudhury, S.K. Effect of Cutting Parameters on Cutting Force and Surface Roughness During Finish Hard Turning AISI52100 Grade Steel. Procedia CIRP 2012, 1, 651–656. [Google Scholar] [CrossRef] [Green Version]
  31. Lin, W.S.; Lee, B.Y.; Wu, C.L. Modeling the surface roughness and cutting force for turning. J. Mater. Process. Technol. 2001, 108, 286–293. [Google Scholar] [CrossRef]
  32. Bhushan, R.K. Optimization of cutting parameters for minimizing power consumption and maximizing tool life during machining of Al alloy SiC particle composites. J. Clean. Prod. 2013, 39, 242–254. [Google Scholar] [CrossRef]
  33. Puertas Arbizu, I.; Luis Pérez, C.J. Surface roughness prediction by factorial design of experiments in turning processes. J. Mater. Process. Technol. 2003, 143–144, 390–396. [Google Scholar] [CrossRef]
  34. Aouici, H.; Yallese, M.A.; Chaoui, K.; Mabrouki, T.; Rigal, J.-F. Analysis of surface roughness and cutting force components in hard turning with CBN tool: Prediction model and cutting conditions optimization. Measurement 2012, 45, 344–353. [Google Scholar] [CrossRef]
Figure 1. Profile and dimensions of the machined workpiece (units in mm).
Materials 13 05231 g001
Figure 2. Setup for surface roughness measurement.
Materials 13 05231 g002
Figure 3. Turning inserts used in the experiments.
Materials 13 05231 g003
Figure 4. Interaction plots for surface roughness means: (a) Ra; (b) Rz.
Materials 13 05231 g004
Figure 5. Four-factor multi-vari chart for Ra and Rz surface roughness means.
Materials 13 05231 g005
Figure 6. Two-factor multi-variable charts for Ra surface roughness parameter means, considering interactions between: (a) Substrate/Coating with feed rate; (b) Substrate/Coating with nose radius.
Materials 13 05231 g006
Figure 7. Two-factor multi-vari charts for Rz surface roughness parameter means, considering interactions between: (a) Substrate/Coating with nose radius; (b) Substrate/Coating with feed rate; (c) Substrate/Coating with depth of cut; (d) Substrate/Coating with cutting speed.
Materials 13 05231 g007
Figure 8. Normal plot of residuals: (a) Ra; (b) Rz.
Materials 13 05231 g008
Figure 9. Predicted versus actual response values: (a) Ra; (b) Rz.
Materials 13 05231 g009
Figure 10. Predicted effect of feed rate and nose radius on Ra surface roughness for cutting tools: (a) WC/PVD; (b) WC/CVD; (c) Cermet/PVD.
Materials 13 05231 g010
Figure 11. Predicted effect of nose radius and depth of cut on Ra surface roughness for cutting tools: (a) WC/PVD; (b) WC/CVD; (c) Cermet/PVD.
Materials 13 05231 g011
Figure 12. Predicted effect of feed rate and nose radius on Rz surface roughness for cutting tools: (a) WC/PVD; (b) WC/CVD; (c) Cermet/PVD.
Materials 13 05231 g012
Figure 13. Graphs of optimization results to minimize Ra as goal: (a) effect of cutting tool type; (b) interaction effects of Substrate/Coating*r and Substrate/Coating*f; (c) Ra contour levels of interactions DOC*r and r*f.
Materials 13 05231 g013aMaterials 13 05231 g013b
Figure 14. Graphs of optimization results to minimize Rz as a goal: (a) effect of cutting tool types; (b) interaction effects of DOC*Substrate/Coating, Vc*Substrate/Coating, Substrate/Coating*r and Substrate/Coating*f; (c) Rz contour levels versus nose radius and feed rate.
Materials 13 05231 g014aMaterials 13 05231 g014b
Figure 15. Graphs of optimization results to minimize roughness parameters with the maximum removal rate: interaction effects between Substrate/Coating*r for (a) Ra, (b) Rz.
Materials 13 05231 g015
Table 1. Quantitative and qualitative controllable factors and respective mixed levels used for a full factorial DOE.
ParametersSymbolUnitCategorical Levels
1234
Depth of cutDOCmm0.51.0--
Cutting speedVcm/min150250--
Substrate/Coating method--WC 1/PVDCermet/PVDWC/CVD-
Nose radiusrmm0.40.8--
Feed ratefmm/rev0.120.140.160.20
1 WC: Sintered Tungsten Carbide.
Table 2. Average values of experimental results for surface roughness parameters.
RunFactor 1Factor 2Factor 3Factor 4Factor 5Average Values for Surface Roughness Parameters
A:DOCB:VcC:rD:fE:Substrate/CoatingRaRz
mmm/minmmmm/revCategoricalµmµm
011.01500.80.20Cermet/PVD1.898.57
020.52500.80.12Cermet/PVD0.763.69
030.51500.40.20WC/PVD2.7411.40
041.02500.40.20WC/CVD2.1411.80
050.52500.80.20WC/CVD2.047.50
060.51500.80.12Cermet/PVD0.733.75
070.51500.40.14WC/CVD1.275.65
081.02500.40.12Cermet/PVD1.357.20
090.52500.40.12Cermet/PVD1.306.79
101.01500.80.20WC/CVD1.958.61
110.52500.80.20WC/PVD1.626.89
120.51500.40.12Cermet/PVD1.306.56
131.01500.40.12WC/CVD1.156.22
140.52500.40.12WC/CVD1.085.04
151.02500.40.20Cermet/PVD2.6411.42
160.51500.40.20Cermet/PVD2.6110.90
170.52500.40.20WC/CVD1.867.82
181.01500.40.20Cermet/PVD2.6411.38
190.52500.40.16Cermet/PVD1.938.50
200.51500.40.16WC/PVD2.139.29
211.01500.80.12WC/PVD0.815.91
220.51500.80.20WC/PVD1.636.85
231.01500.80.20WC/PVD1.819.14
240.51500.40.20WC/CVD1.847.96
250.52500.80.12WC/PVD0.754.15
261.01500.80.12Cermet/PVD0.834.59
270.52500.80.16WC/CVD1.586.76
281.01500.40.12WC/PVD1.487.55
290.52500.80.12WC/CVD0.905.14
301.02500.80.12Cermet/PVD0.864.88
311.02500.80.20Cermet/PVD1.878.43
321.02500.40.16WC/PVD2.249.42
331.02500.40.12WC/CVD1.207.56
340.51500.40.12WC/CVD1.004.68
351.01500.40.20WC/CVD2.169.40
360.51500.80.16Cermet/PVD1.195.39
370.52500.40.14WC/PVD1.757.88
381.02500.40.16WC/CVD1.799.44
390.52500.40.14WC/CVD1.335.74
400.52500.80.20Cermet/PVD1.877.91
410.51500.40.16WC/CVD1.366.28
421.01500.80.14Cermet/PVD1.075.25
431.01500.40.16WC/PVD2.229.84
441.02500.80.20WC/CVD1.998.44
451.01500.80.14WC/PVD1.037.18
461.02500.40.20WC/PVD2.8711.81
470.51500.80.12WC/CVD0.855.00
481.01500.40.14WC/PVD1.868.68
490.51500.80.16WC/CVD1.586.81
501.02500.80.14Cermet/PVD1.075.31
510.52500.80.16WC/PVD1.115.06
521.01500.40.14WC/CVD1.457.46
530.51500.80.14WC/CVD1.215.69
541.01500.80.12WC/CVD0.875.69
551.02500.80.16Cermet/PVD1.336.32
560.52500.80.16Cermet/PVD1.185.19
570.52500.40.20Cermet/PVD2.5610.62
581.02500.80.12WC/CVD0.885.33
591.01500.80.16Cermet/PVD1.336.22
600.52500.40.14Cermet/PVD1.627.51
610.52500.80.14WC/PVD1.014.74
621.02500.40.16Cermet/PVD2.019.20
630.52500.40.20WC/PVD2.7011.15
641.02500.80.16WC/CVD1.516.89
651.02500.80.14WC/CVD1.216.29
660.51500.80.20Cermet/PVD1.767.52
671.02500.80.12WC/PVD0.795.40
681.01500.80.16WC/CVD1.486.88
690.52500.40.12WC/PVD1.406.96
701.02500.40.14WC/PVD1.888.28
710.52500.40.16WC/CVD1.416.15
720.51500.40.14Cermet/PVD1.667.99
731.01500.80.14WC/CVD1.186.18
741.02500.40.14WC/CVD1.458.27
750.51500.40.12WC/PVD1.396.98
760.51500.80.12WC/PVD0.723.93
770.52500.80.14Cermet/PVD0.924.21
781.01500.40.16WC/CVD1.748.43
790.52500.80.14WC/CVD1.255.84
800.51500.80.20WC/CVD2.067.57
811.02500.40.12WC/PVD1.497.52
820.51500.80.14WC/PVD0.914.46
831.01500.40.12Cermet/PVD1.387.20
840.51500.80.16WC/PVD1.025.18
851.02500.40.14Cermet/PVD1.708.11
861.02500.80.20WC/PVD1.677.76
870.52500.40.16WC/PVD2.089.07
881.01500.80.16WC/PVD1.157.08
891.01500.40.20WC/PVD2.8511.95
900.51500.40.14WC/PVD1.787.98
911.01500.40.14Cermet/PVD1.698.06
920.51500.80.14Cermet/PVD0.964.53
931.02500.80.16WC/PVD1.126.20
941.01500.40.16Cermet/PVD2.049.15
951.02500.80.14WC/PVD0.965.59
960.51500.40.16Cermet/PVD1.988.63
Table 3. Standard five-way ANOVA table results for Ra applying two-factor interactions model.
Analysis of Variance
SourceSum Sq.1d.f.2Mean Sq.3F ValueProb > FPCR 4 (%)
DOC0.887510.8875100.70040.00000.58%
Vc0.051210.05125.80800.01630.03%
Substrate/Coating1.473120.736583.56940.00000.96%
r44.1837144.18375013.19650.000028.66%
f90.7238330.24133431.25120.000058.84%
DOC*Vc0.005010.00500.56260.45350.00%
DOC*Substrate/Coating0.051420.02572.91390.05510.03%
DOC*r0.167810.167819.03430.00000.11%
DOC*f0.087530.02923.30770.02000.06%
Vc*Substrate/Coating0.045320.02272.57100.07740.03%
Vc*r0.012910.01291.46810.22620.01%
Vc*f0.031730.01061.19910.30940.02%
Substrate/Coating*r15.559327.7797882.69910.000010.09%
Substrate/Coating*f0.558560.093110.56070.00000.36%
r*f0.350230.116713.24500.00000.23%
Error4.78575430.0088---
Total158.9745575----
1 Sum Sq.: Sum of squares, 2 d.f.: degrees of freedom, 3 Mean Sq.: Mean square, 4 PCR: Percentage contribution ratio (%).
Table 4. Standard five-way ANOVA table results for Rz applying two-factor interaction model.
Analysis of Variance
SourceSum Sq.d.f.Mean Sq.F valueProb > FPCR (%)
DOC156.74001156.7400557.90440.00007.54%
Vc0.176810.17680.62910.42800.01%
Substrate/Coating25.9244212.962246.13800.00001.25%
r741.22331741.22332638.32990.000035.66%
f950.03393316.67801127.19190.000045.70%
DOC*Vc0.589710.58972.09900.14800.03%
DOC*Substrate/Coating13.449926.725023.93700.00000.65%
DOC*r0.103210.10320.36730.54470.00%
DOC*f0.019530.00650.02320.99520.00%
Vc*Substrate/Coating7.699223.849613.70240.00000.37%
Vc*r6.020916.020921.43090.00000.29%
Vc*f2.599430.86653.08410.02700.13%
Substrate/Coating*r148.9803274.4901265.14210.00007.17%
Substrate/Coating*f16.684662.78089.89790.00000.80%
r*f8.625632.875210.23410.00000.41%
Error152.55275430.2809-
Total2231.4233575
Table 5. Statistics analysis to select the fitting model for Ra.
SourceStandard DeviationR²Adjusted R²Predicted R²PRESS 1Model
Linear0.20040.87090.86220.84934.17-
2FI0.08780.97910.97350.96430.9891Suggested
Quadratic0.08840.97910.97320.96321.02Aliased
1 PRESS: Predicted Residual Sum of Squares for the model.
Table 6. Statistics analysis to select the fitting model for Rz.
SourceStandard DeviationR²Adjusted R²Predicted R²PRESSModel
Linear0.77750.85880.84930.835462.72-
2FI0.49060.95260.94000.920830.17Suggested
Quadratic0.49050.95330.94000.919830.55Aliased
Table 7. ANOVA for reduced 2FI model of the Ra response.
SourceSum of Squaresd.f.Mean SquareF-Valuep-ValueSignificance
Model27.07112.46348.49<0.0001significant
A-DOC0.200810.200828.42<0.0001-
C-r7.7217.721093.54<0.0001-
D-f15.87115.872246.37<0.0001-
E-Substrate/Coating0.303720.151821.50<0.0001-
DOC*r0.054610.05467.730.0067-
r*f0.058610.05868.290.0050-
Substrate/Coating*r2.8021.40198.40<0.0001-
Substrate/Coating*f0.064920.03244.590.0128-
Residual0.5933840.0071---
Cor Total27.6795----
The Model F-value of 348. 49 implies the model is significant. There is only a 0.01% chance that an F-value this large could occur due to noise.
Table 8. ANOVA for reduced 2FI model of the Rz response.
SourceSum of Squaresd.f.Mean SquareF-Valuep-ValueSignificance
Model362.241524.15102.36<0.0001significant
A-DOC28.17128.17119.39<0.0001-
B-Vc0.004010.00400.01700.8967-
C-r127.841127.84541.88<0.0001-
D-f165.671165.67702.27<0.0001-
E-Substrate/Coating5.6322.8211.93<0.0001-
DOC*Substrate/Coating2.0521.034.350.0161-
Vc*Substrate/Coating1.8320.91553.880.0246-
r*f1.9411.948.230.0053-
Substrate/Coating*r26.78213.3956.75<0.0001-
Substrate/Coating*f2.3221.164.920.0096-
Residual18.87800.2359---
Cor Total381.1195----
The Model F-value of 102. 36 implies the model is significant. There is only a 0.01% chance that an F-value this large could occur due to noise.
Table 9. Goals and parameter ranges for optimization of Ra and Rz responses.
NameGoalLower LimitUpper Limit
A:DOCis in range0.51
B:Vcis in range150250
C:ris in range0.40.8
D:fis in range0.120.2
E:Substrate/Coatingis in rangeWC/PVDCermet/PVD
Raminimize0.62
Rzminimize3.75.5
Table 10. Solutions for the Ra response optimization.
DOCVcrfSubstrate/CoatingRaDesirability
0.500250.0000.8000.120WC/PVD0.6470.966
0.500229.3750.8000.120WC/PVD0.6470.966
0.980240.4390.8000.120WC/PVD0.6890.936
0.995242.3860.8000.120WC/PVD0.6900.935
0.500209.8190.8000.120Cermet/PVD0.7220.913
0.500207.1580.8000.120Cermet/PVD0.7220.913
Table 11. Solutions for the Rz response optimization.
DOCVcrfSubstrate/CoatingRzDesirability
0.500250.0000.8000.120Cermet/PVD3.7540.970
0.500248.3640.8000.120Cermet/PVD3.7550.970
0.500247.6390.8000.120Cermet/PVD3.7550.969
0.500245.6070.8000.120Cermet/PVD3.7560.969
0.500249.9990.8000.120WC/PVD3.8580.912
0.500247.5070.8000.120WC/PVD3.8670.907
Table 12. Goals and parameter ranges for optimization of Ra and Rz responses.
NameGoalLower LimitUpper Limit
A:DOCis equal to 1
B:Vcis equal to 250
C:ris in range0.40.8
D:fis equal to 0.2
E:Substrate/Coatingis in rangeWC/PVDCermet/PVD
Raminimize1.74
Rzminimize8.110
Table 13. Solutions of the Ra response optimization.
DOCVcrfSubstrate/CoatingRaDesirability
1.000250.0000.8000.200WC/PVD1.7490.979
1.000250.0000.8000.200Cermet/PVD1.8690.927
1.000250.0000.8000.200WC/CVD1.9580.888
1.000250.0000.4000.200WC/CVD2.1860.789
1.000250.0000.4000.200Cermet/PVD2.6660.580
1.000250.0000.4000.200WC/PVD2.7940.525
Table 14. Solutions of the Rz response optimization.
DOCVcrfSubstrate/CoatingRzDesirability
1.000250.0000.8000.200WC/PVD8.1360.981
1.000250.0000.8000.200Cermet/PVD8.1490.974
1.000250.0000.8000.200WC/CVD8.9100.574
Publisher’s Note: MDPI stays neutral with regard to jurisdictional claims in published maps and institutional affiliations.