Dental Diagnosis and Treatment Assessments: Between X-rays Radiography and Optical Coherence Tomography


 ,
,  ,
, 
 and
and 
Abstract
1. Introduction
2. Materials and Methods
2.1. Radiography
2.2. Optical Coherence Tomography (OCT)
2.3. Characterization of Samples
3. Results and Discussion
3.1. Radiography-Oriented Dental Investigations
3.2. OCT-Oriented Dental Investigations, Compared with Radiographs
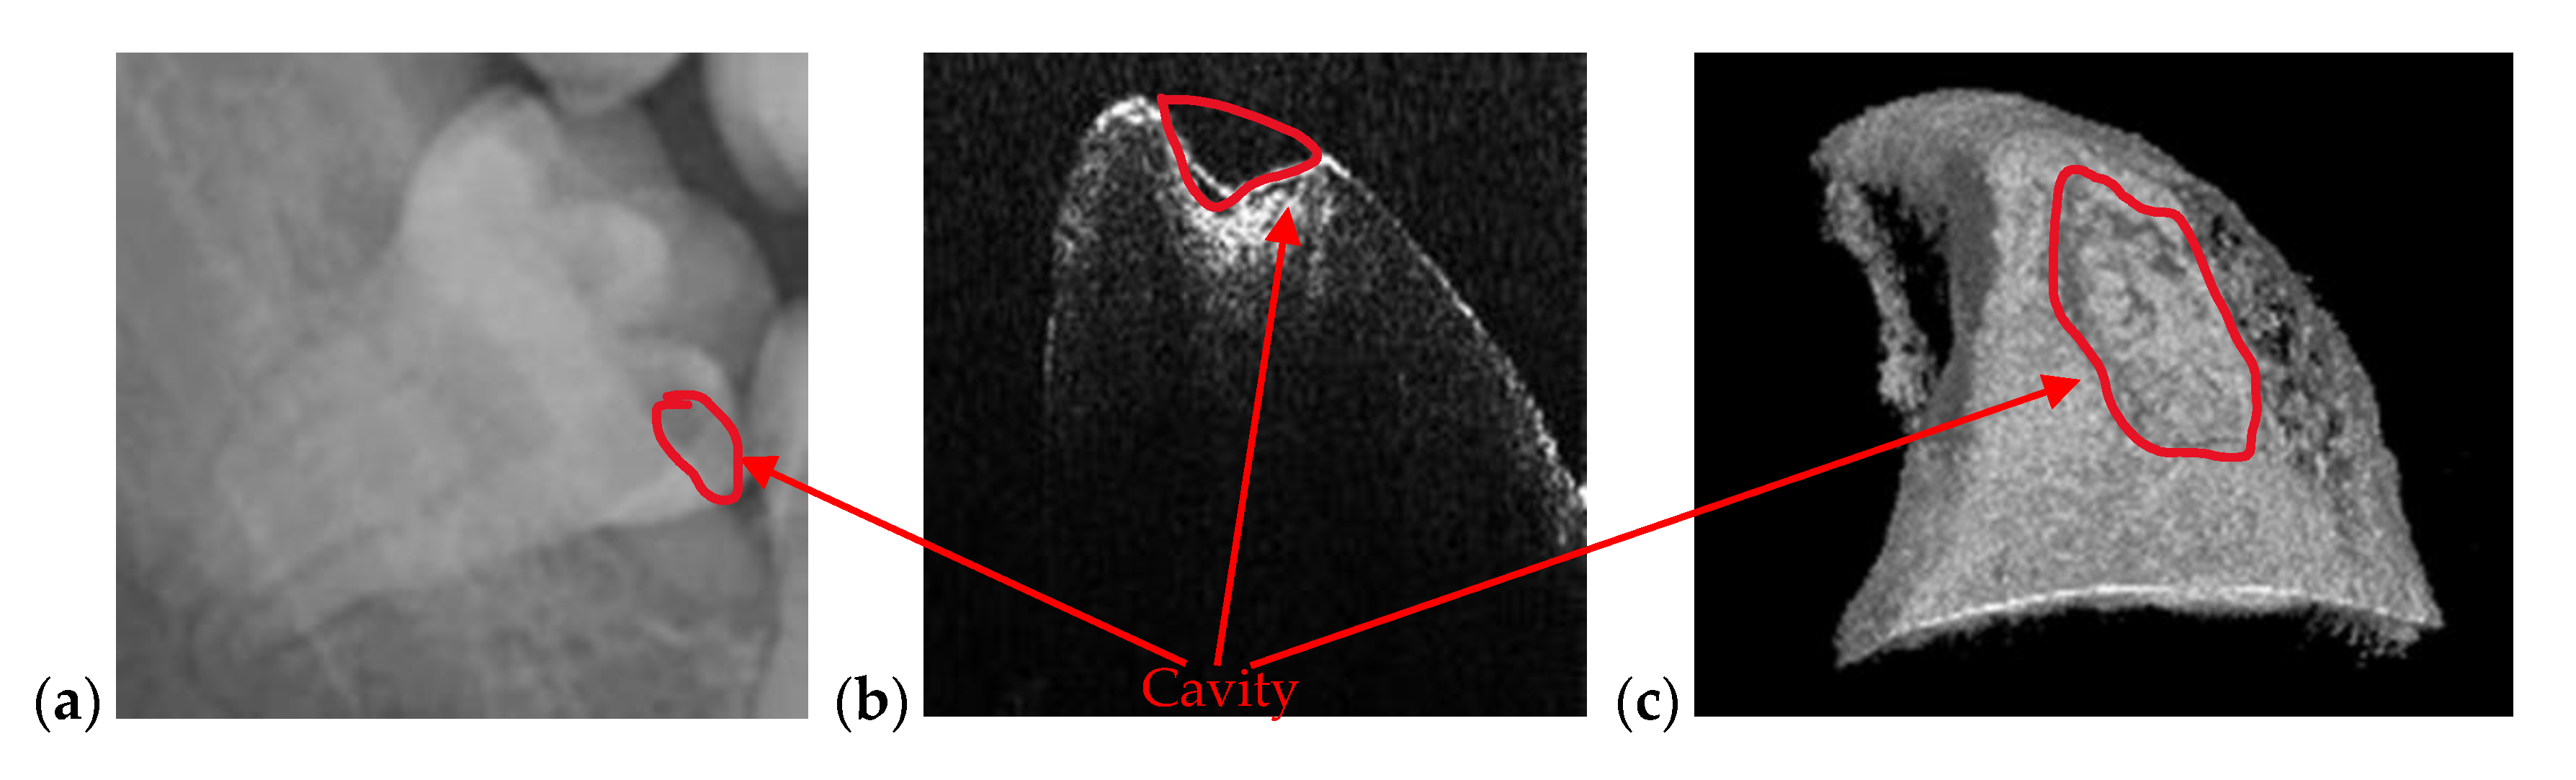
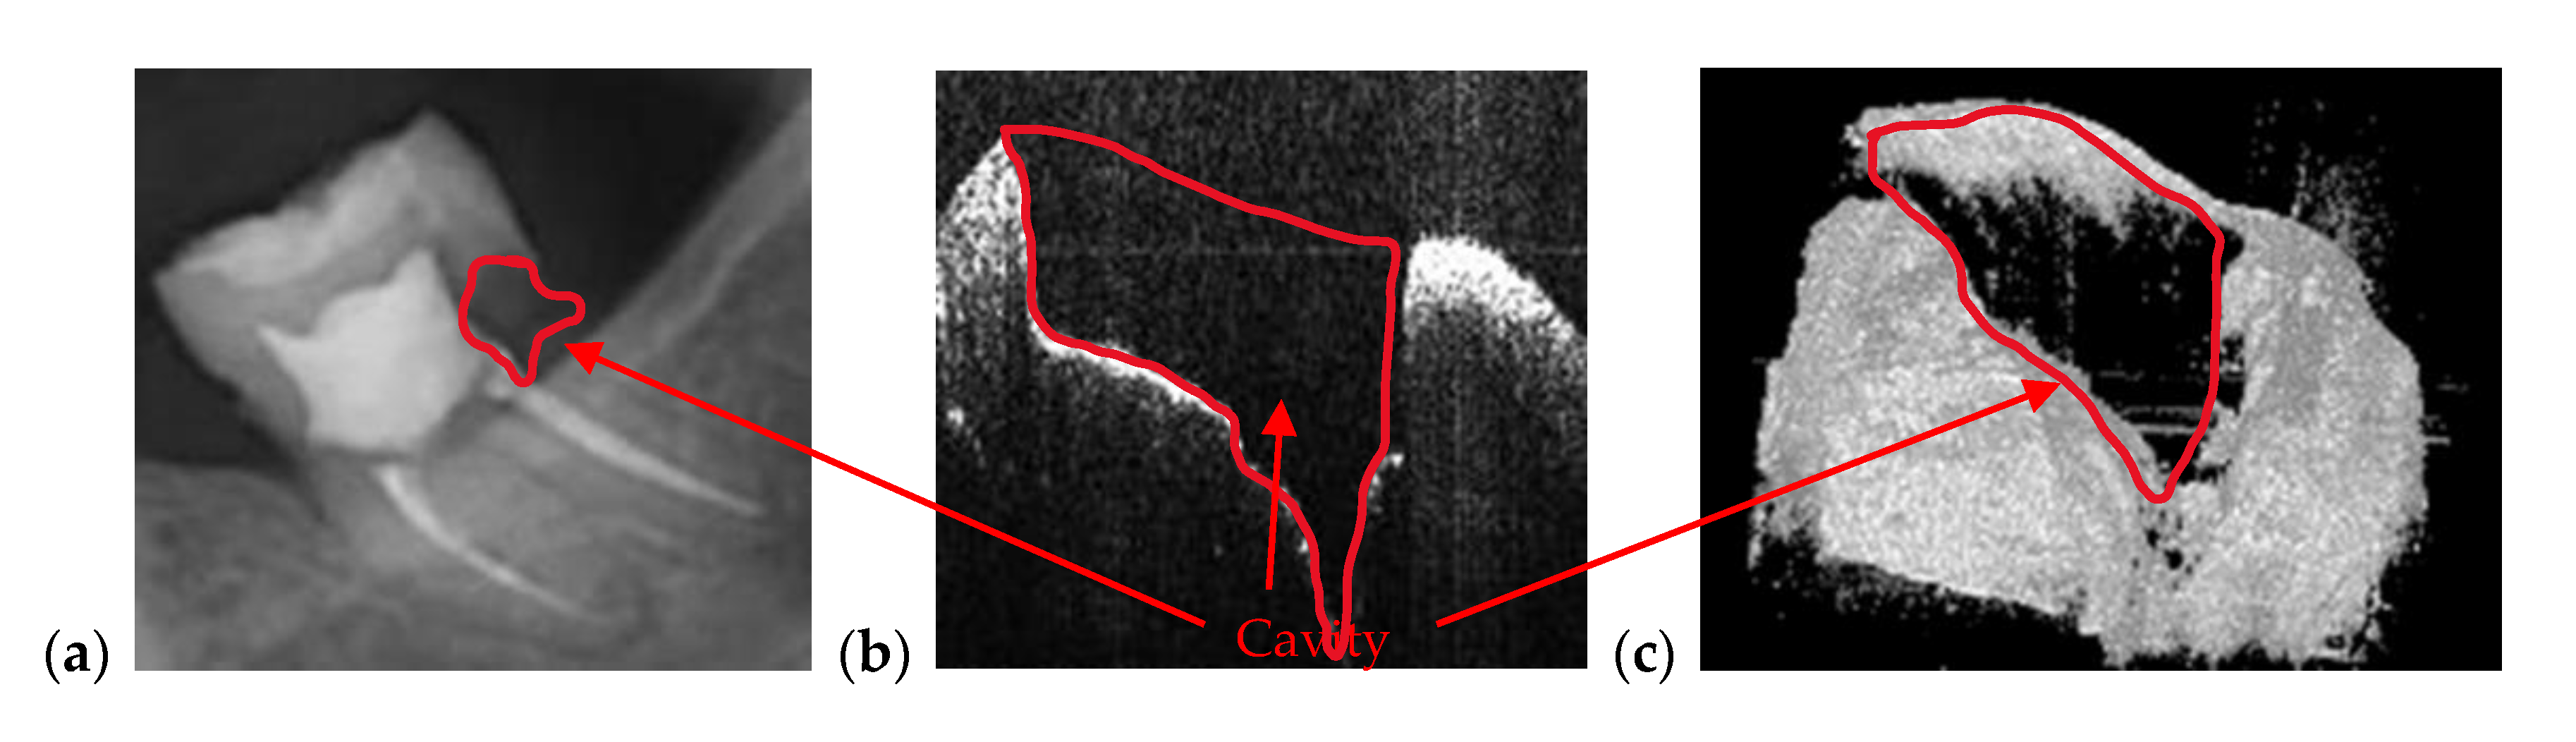
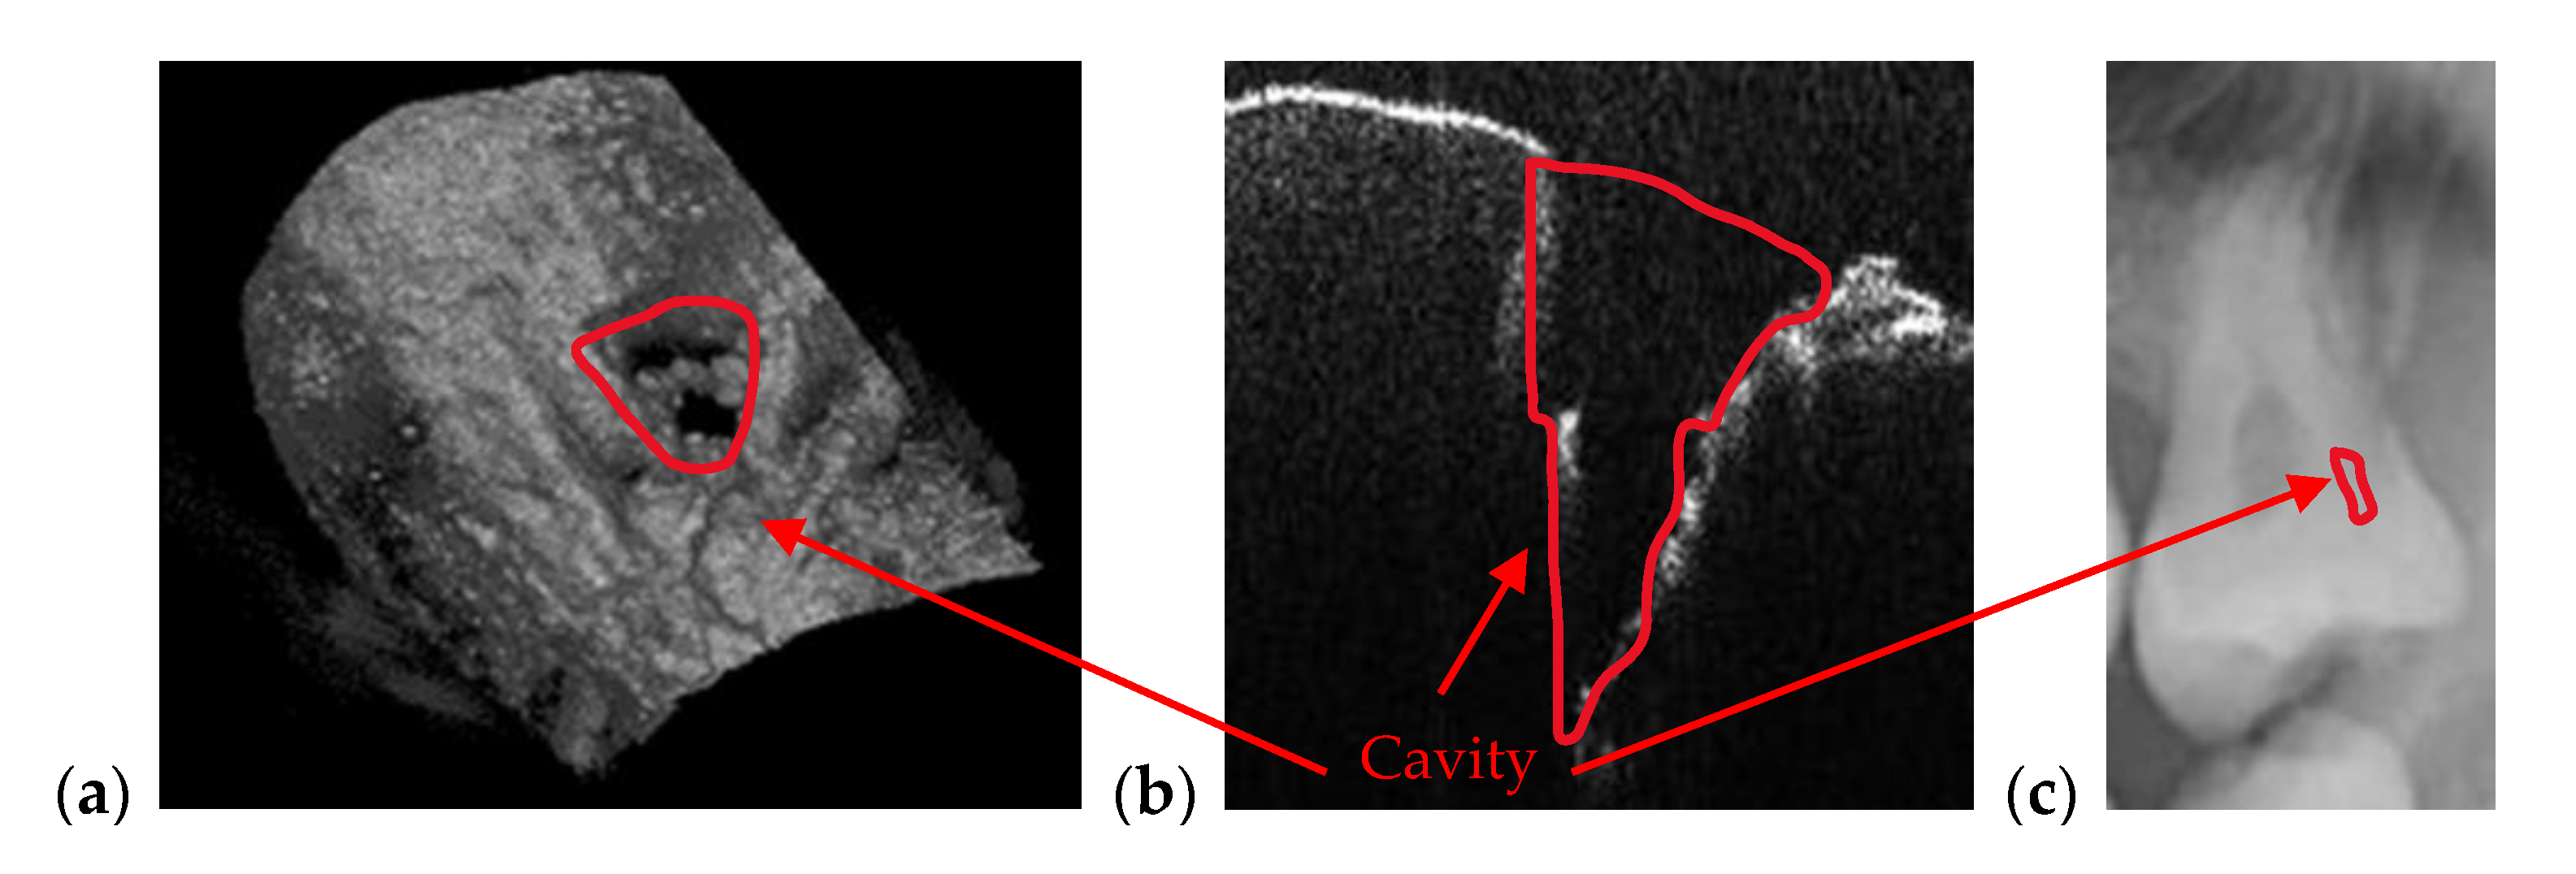
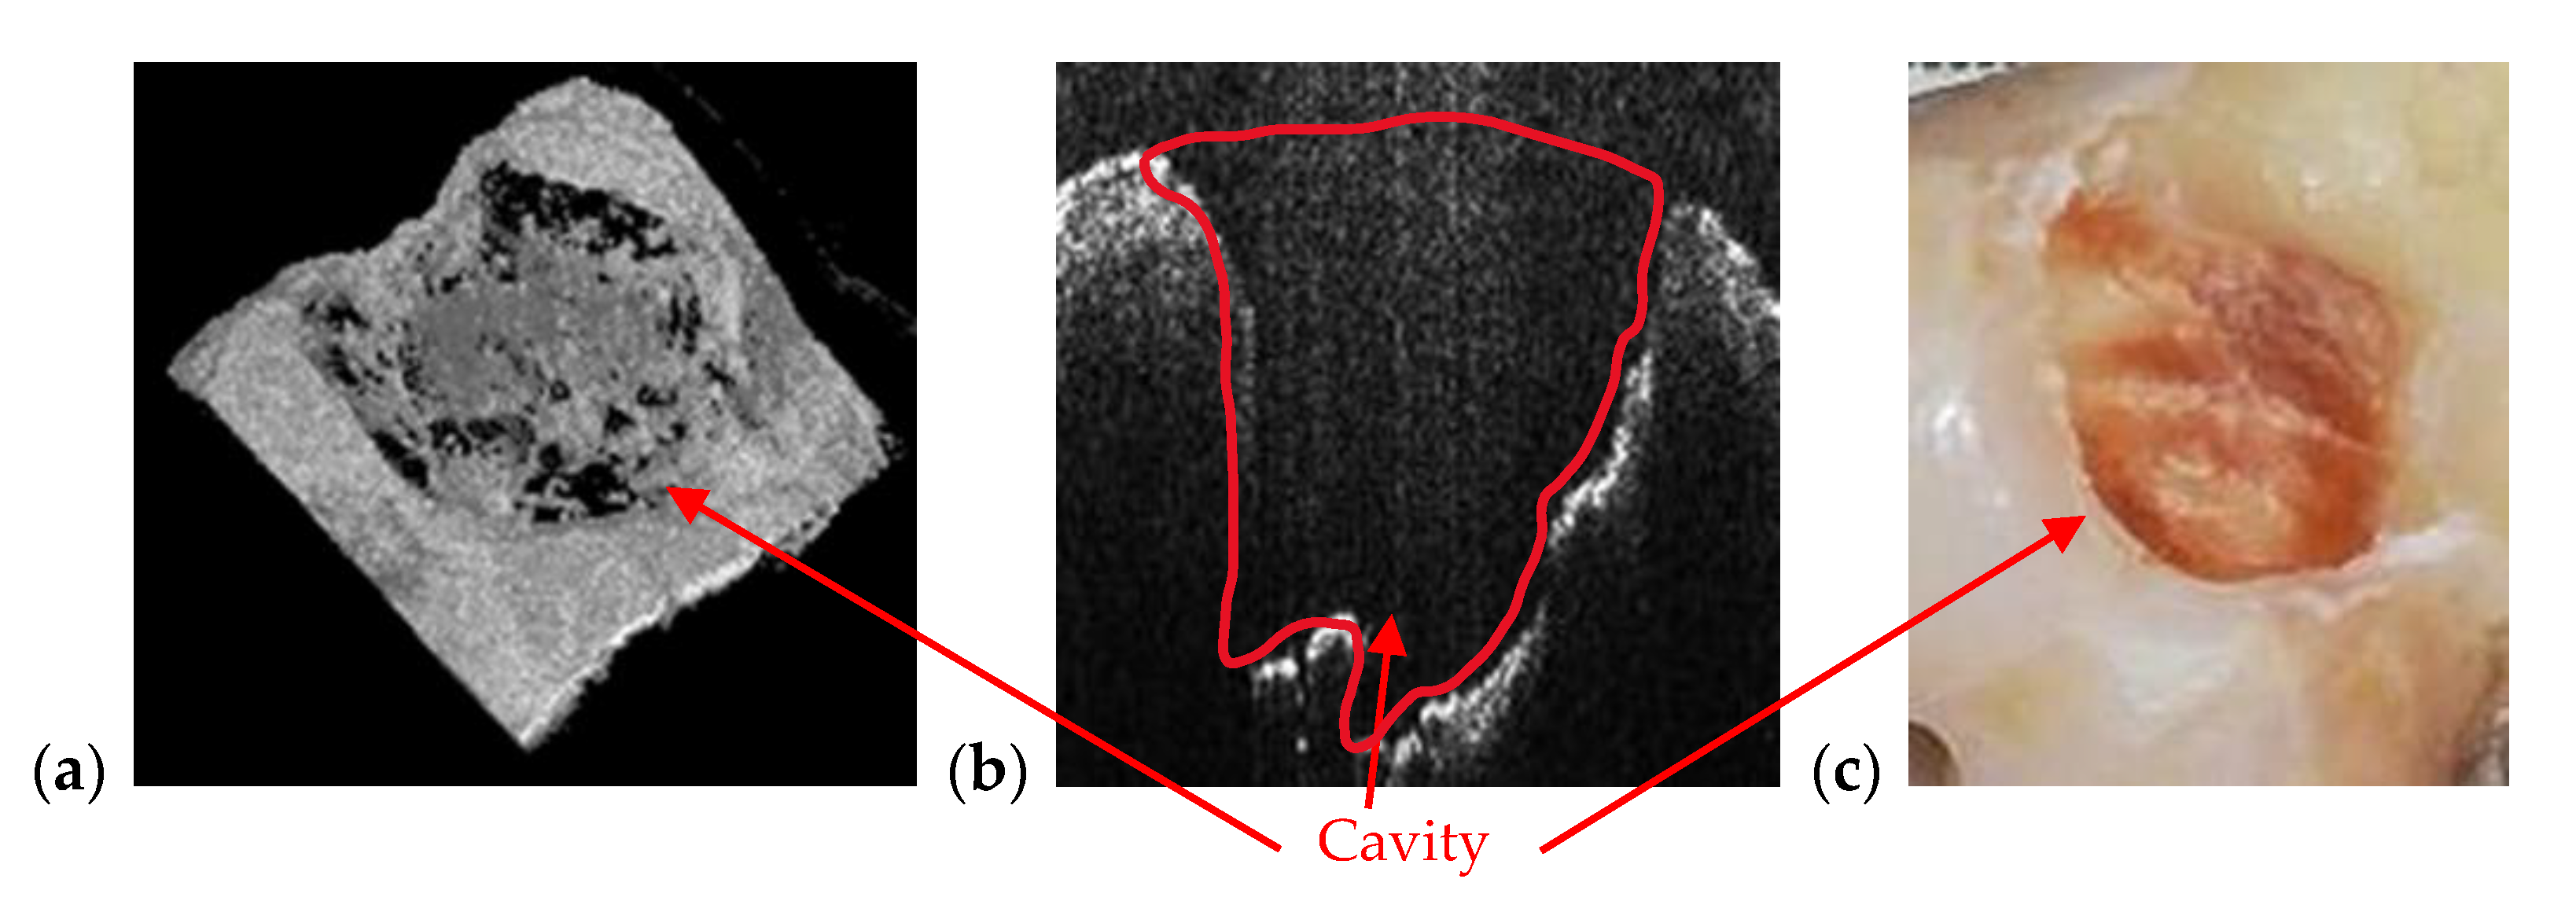
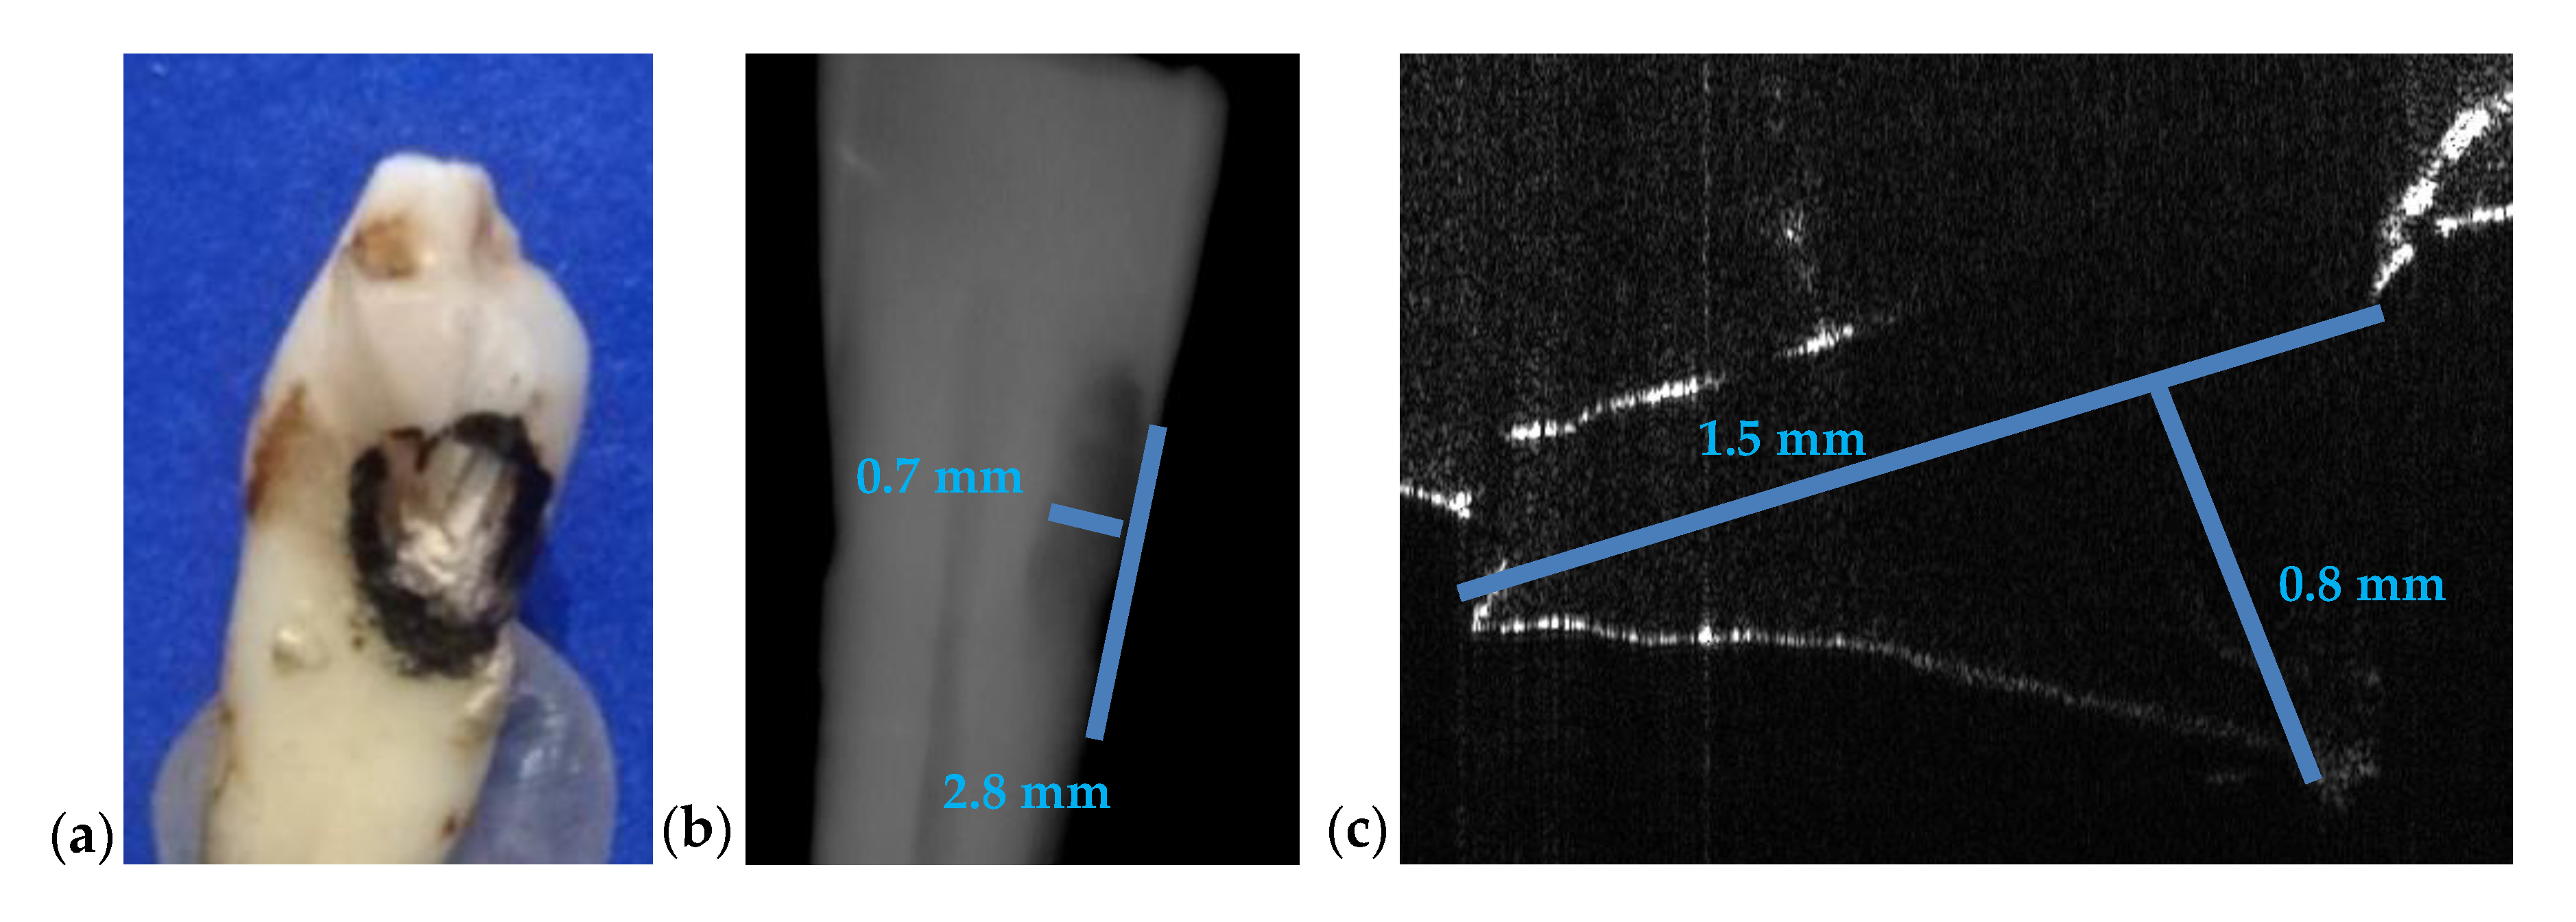
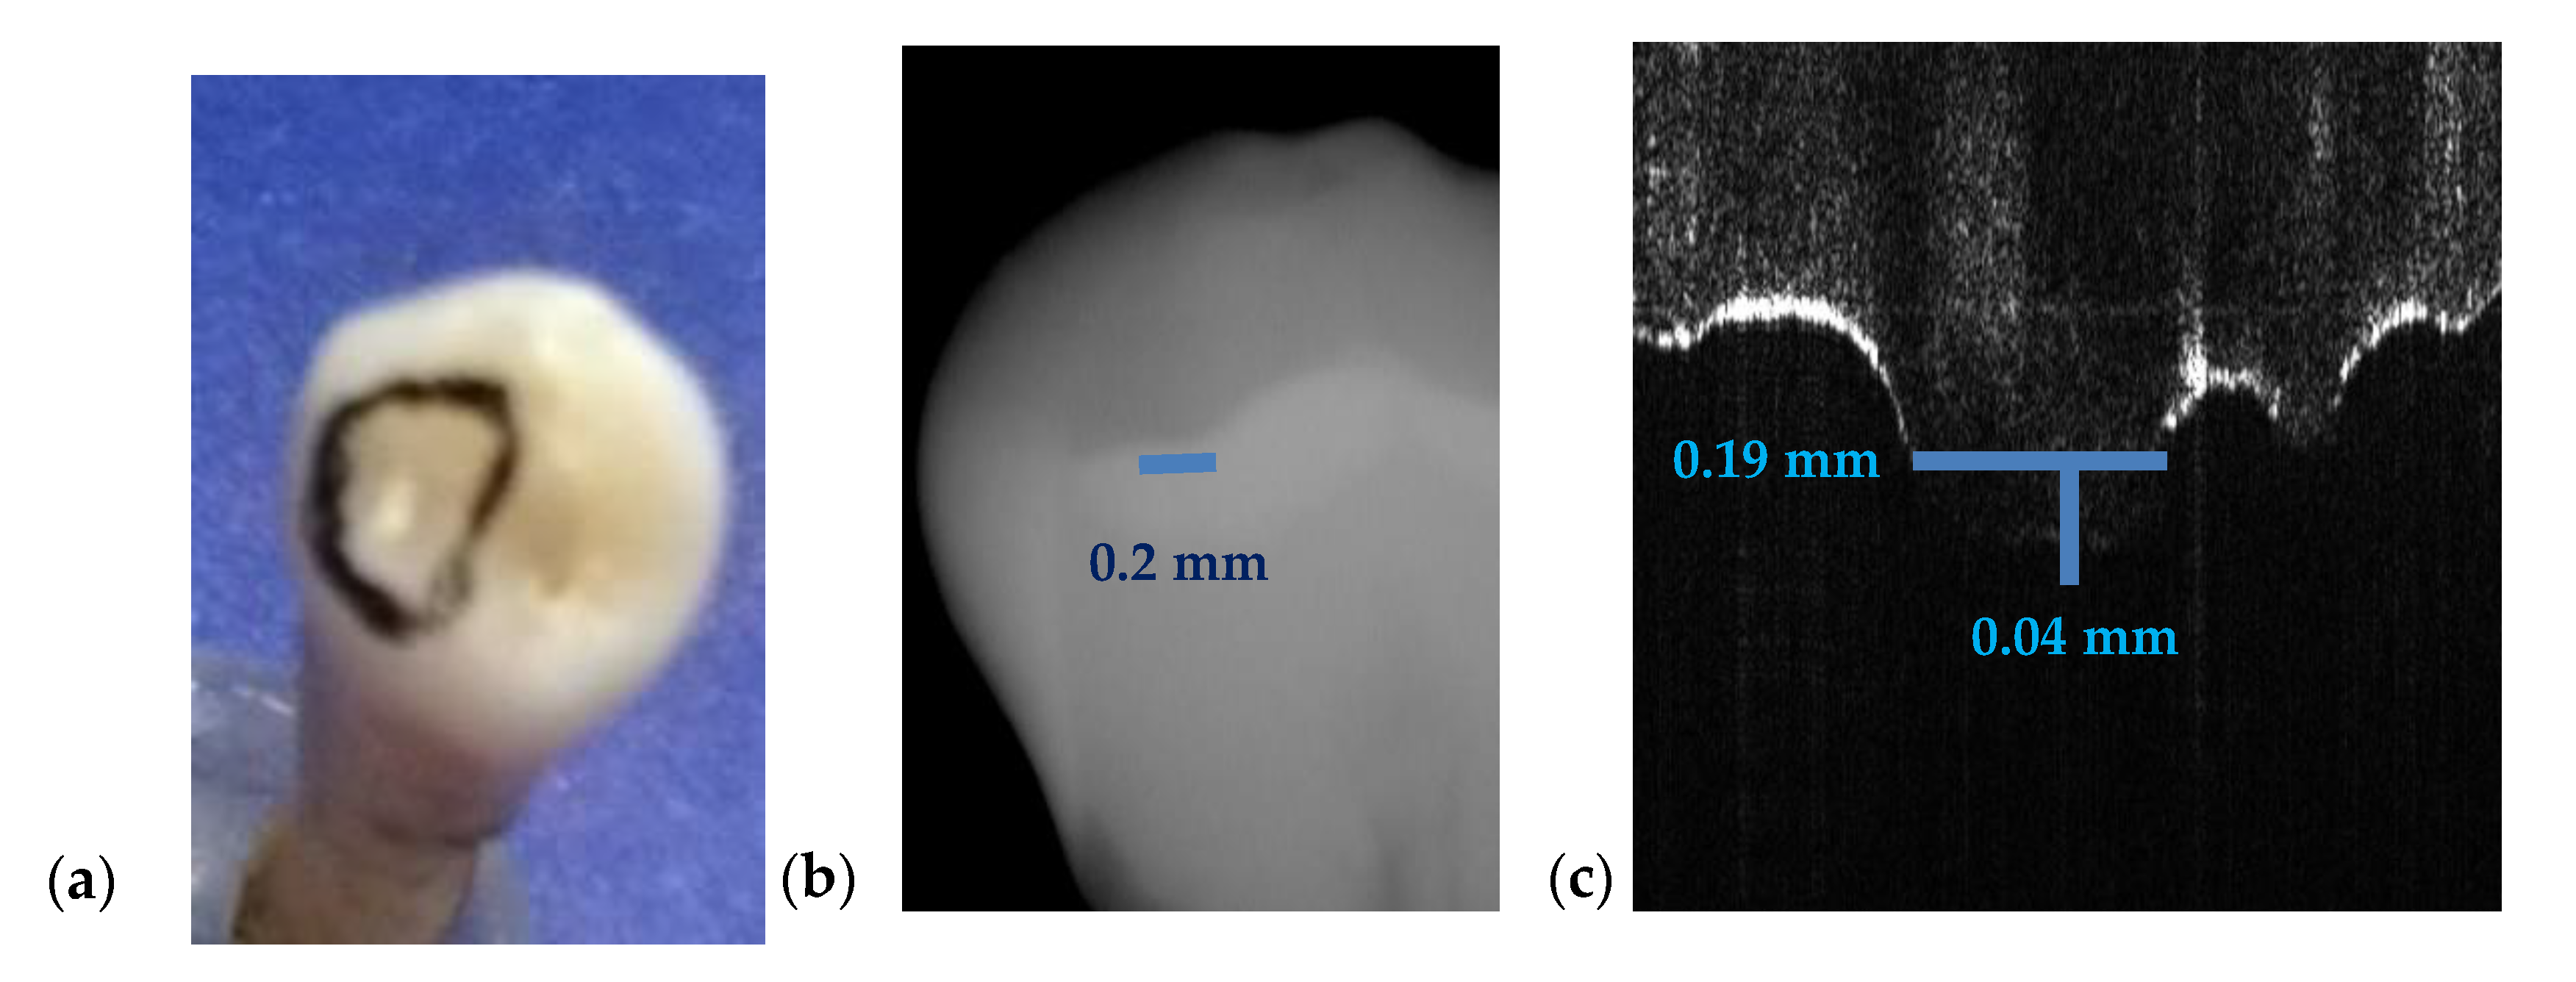
3.3. Measuring Dental Cavities on Both OCT Images and Radiographs

| Measurements on Tooth From | Radiography | OCT | Relative Error ε (%) | ||||
|---|---|---|---|---|---|---|---|
| Length (mm) | Depth (mm) | Length (mm) | Width (mm) | Depth (mm) | For Length | For Depth | |
| Figure 7 | 3.2 | 1.6 | 1.9 | 0.8 | 0.5 | 68 | 110 |
| Figure 8 | 2.4 | 2.2 | 3.0 | 2.7 | 3.3 | 20 | 33 |
| Figure 9 | 1.5 | 1.9 | 2.0 | 0.9 | 3.3 | 75 | 42 |
| Figure 10 | 2.7 | 3.0 | 3.5 | 3.9 | 3.8 | 34 | 21 |
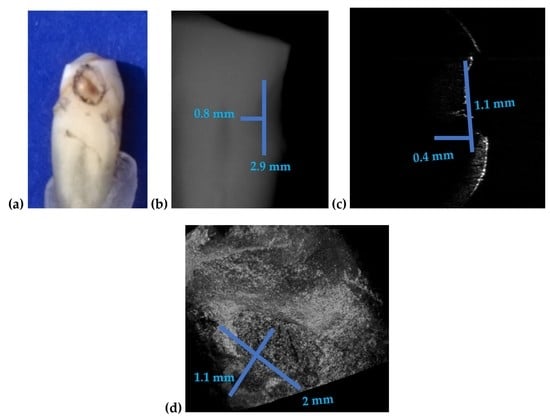
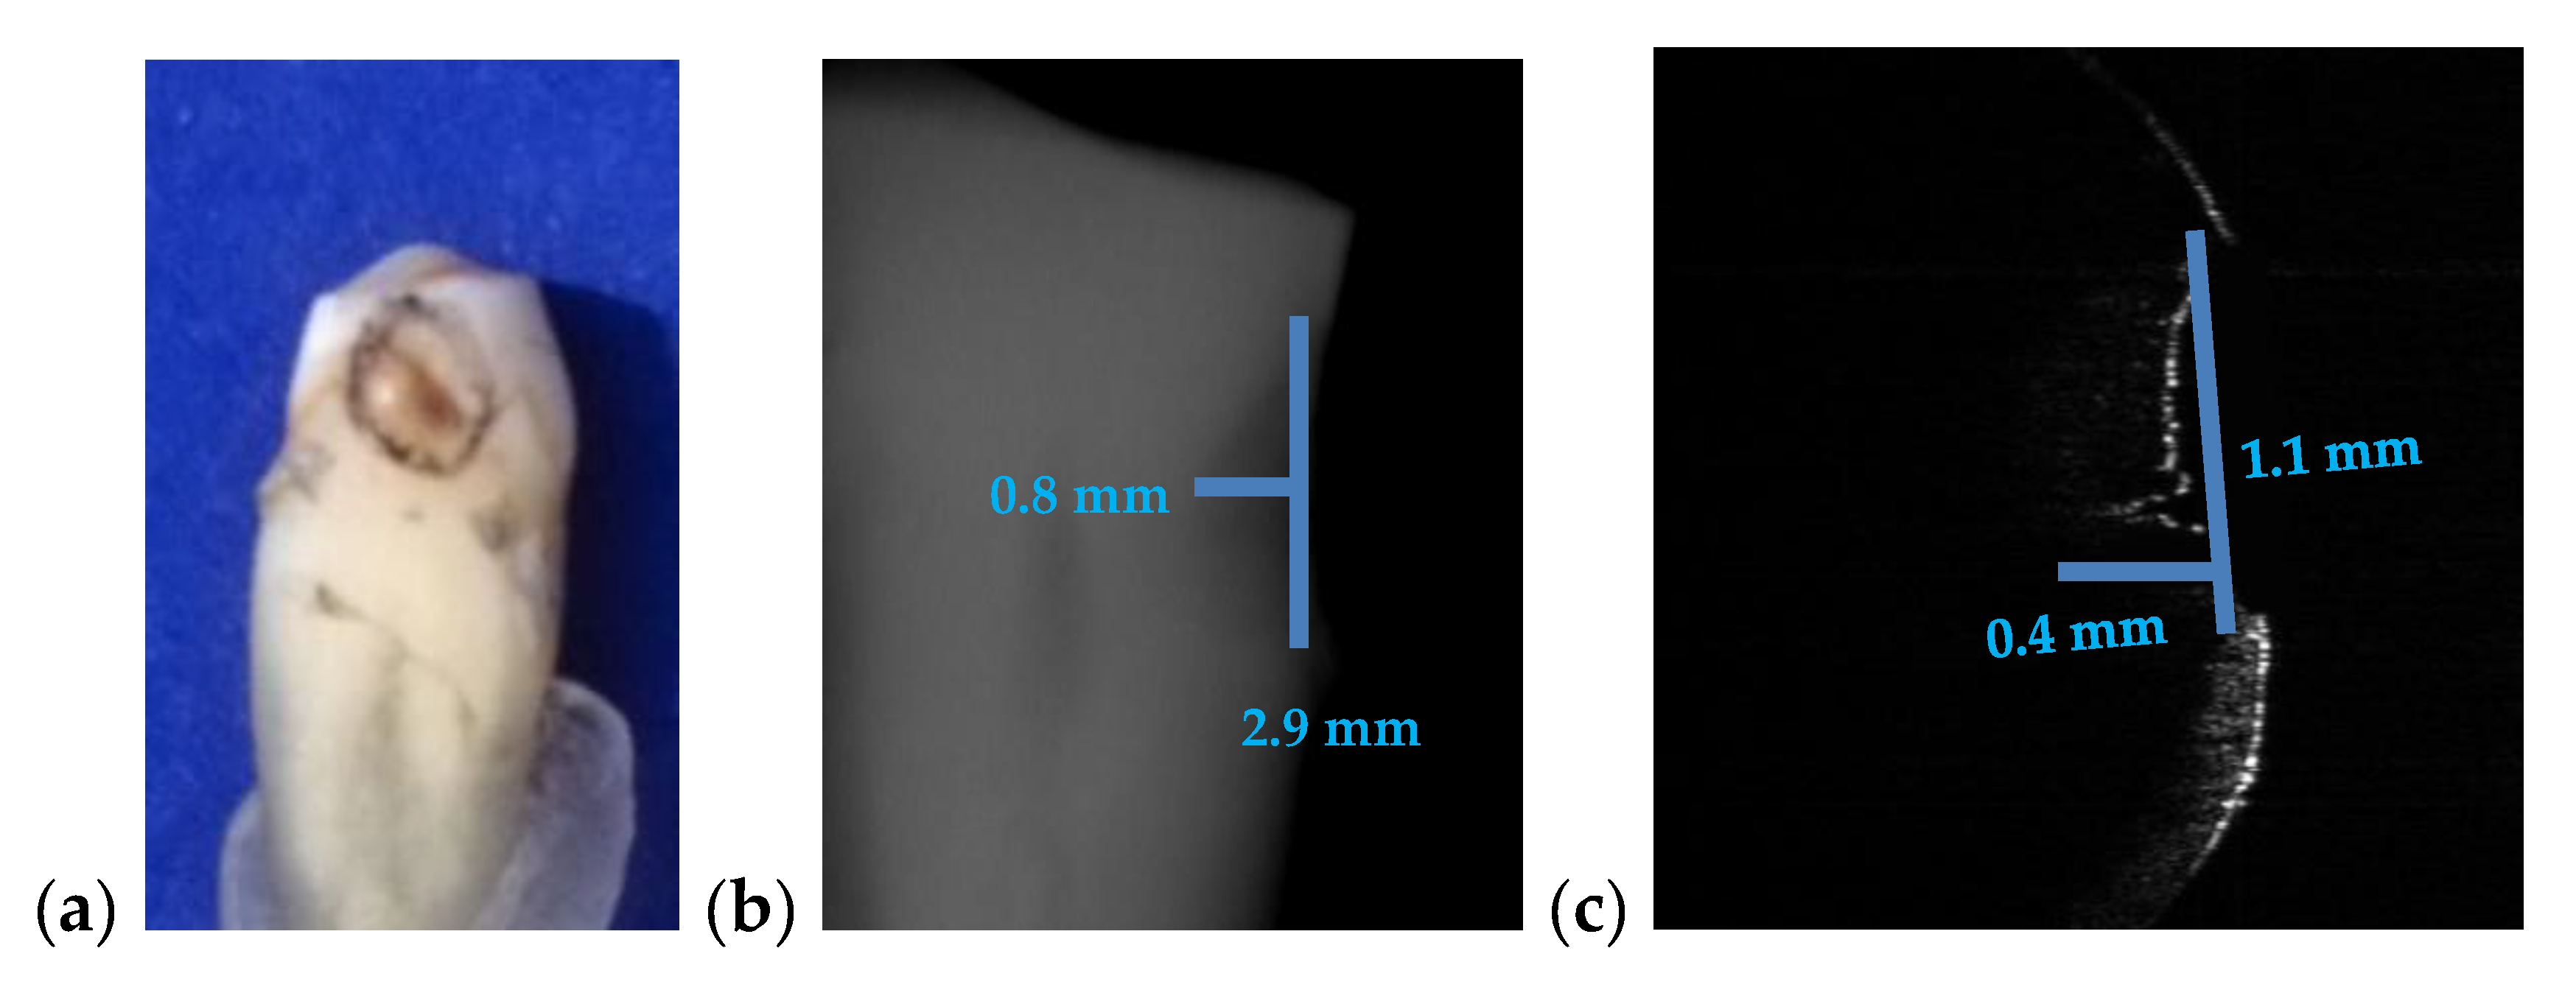
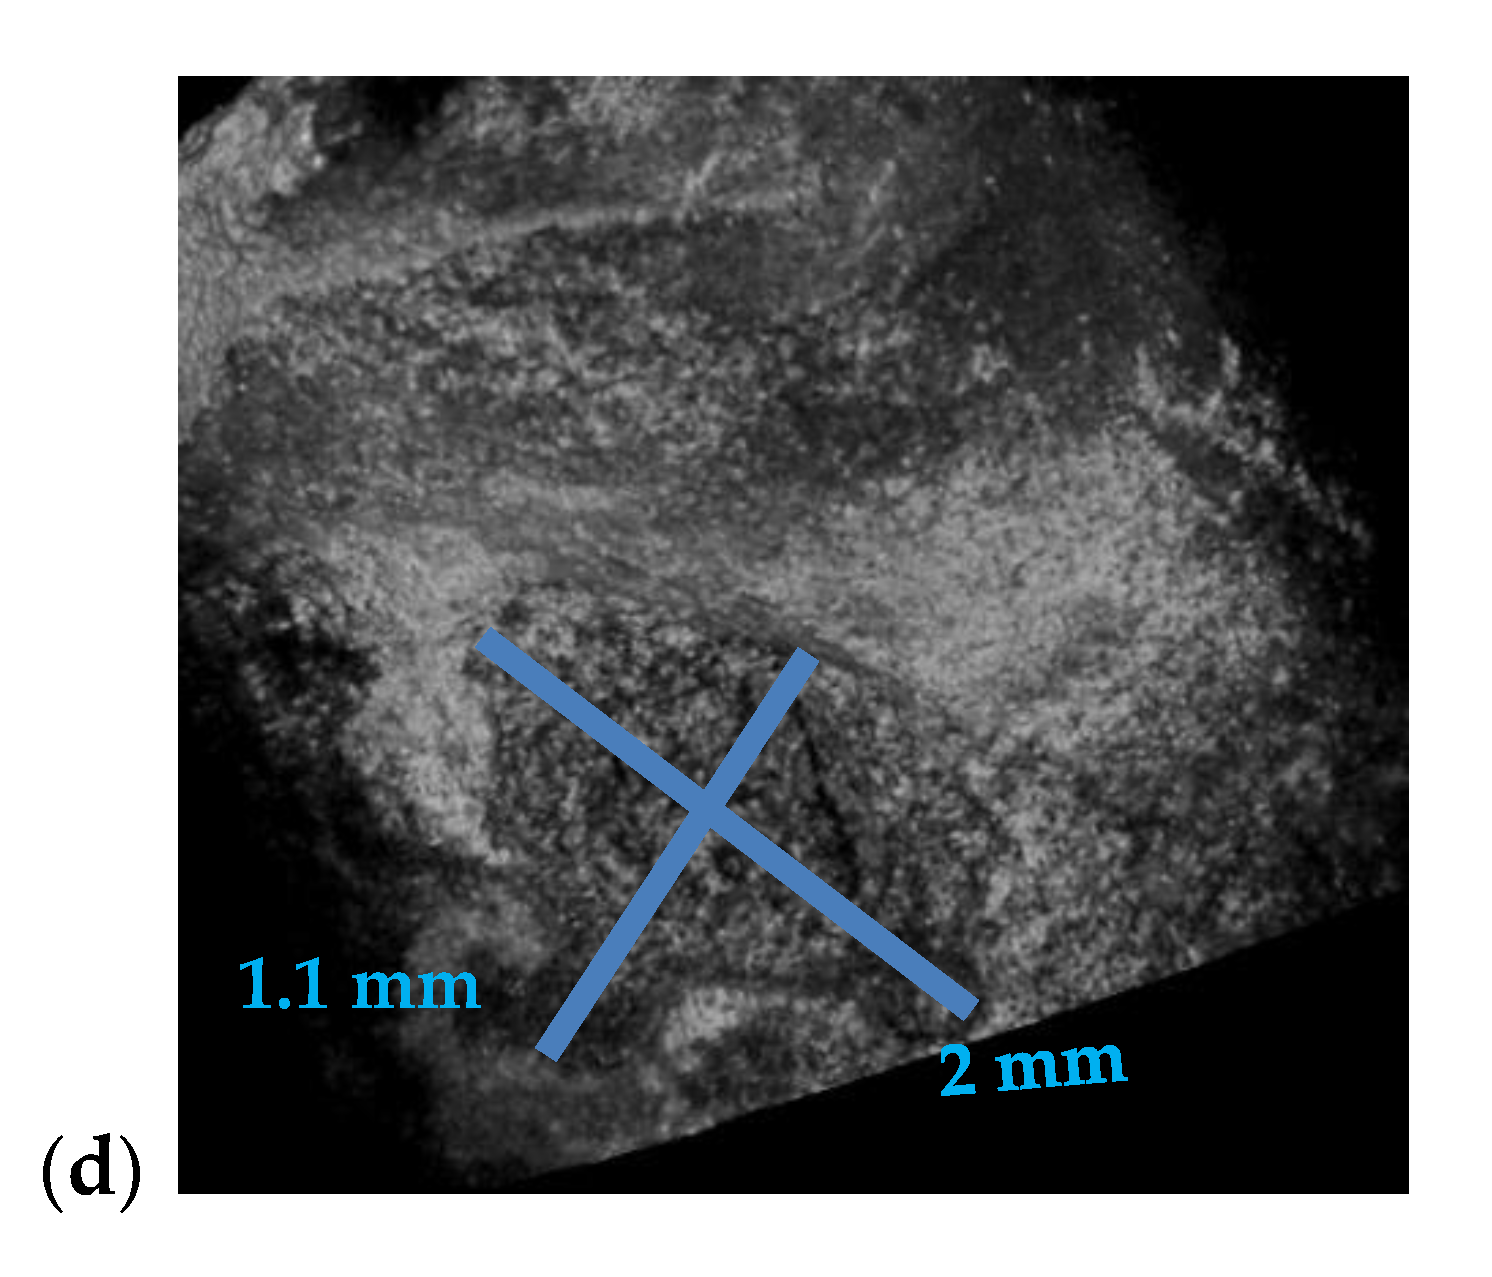
| Figure 15 | 2.9 | 0.8 | 2 | 1.1 | 0.4 | 45 | 100 |
| Figure 16 | 2.8 | 0.7 | 1.5 | - | 0.8 | 86 | 12 |
| Figure 17 | 0.2 | - | 0.19 | - | 0.04 | 5 | - |
| Mean Relative Error (%) | , | (2) | |||||
| where N = 13 is the number of relative errors for measurements performed with both methods. | |||||||
| Standard Deviation of Relative Errors σ (%) | (3) | ||||||
| Sample from Figure | Imaging Method | Maximum and Minimum Pixel Intensity I | (%) | C | (%) | CNR | (%) | |
|---|---|---|---|---|---|---|---|---|
| 7 | OCT | 255 | 1 | 71.7 | 0.992 | 98.4 | 3.54 | 4.1 |
| Panoramic | 192 | 64 | 37.57 | 0.5 | 3.4 | |||
| 8 | OCT | 255 | 1 | 92.25 | 0.992 | 41.7 | 2.73 | 13.8 |
| Panoramic | 208 | 31 | 55.7 | 0.74 | 3.17 | |||
| 9 | OCT | 255 | 1 | 53.82 | 0.992 | 86.8 | 4.71 | 54.9 |
| Panoramic | 193 | 59 | 44 | 0.531 | 3.04 | |||
| 10 | OCT | 255 | 2 | 55.15 | 0.984 | - | 4.58 | - |
| 11 | OCT | 255 | 5 | 45.42 | 0.961 | 45.1 | 5.5 | 27.6 |
| Panoramic | 123 | 25 | 22.7 | 0.662 | 4.31 | |||
| 12 | OCT | 255 | 0 | 45.25 | 1 | 51 | 5.63 | 30.6 |
| Panoramic | 123 | 25 | 22.7 | 0.662 | 4.31 | |||
| 13 | OCT | 255 | 9 | 94.76 | 0.931 | 37.7 | 2.59 | 33.7 |
| Panoramic | 238 | 46 | 49 | 0.676 | 3.91 | |||
| 14 | OCT | 255 | 4 | 89.8 | 0.969 | - | 2.79 | - |
| 15 | OCT | 188 | 0 | 26.7 | 1 | 16.8 | 7.04 | 55.1 |
| Panoramic | 232 | 18 | 47.11 | 0.856 | 4.54 | |||
| 16 | OCT | 255 | 0 | 44 | 1 | 16.8 | 5.79 | 27.5 |
| Panoramic | 232 | 18 | 47.11 | 0.856 | 4.54 | |||
| 17 | OCT | 255 | 2 | 70.3 | 0.984 | 14.9 | 3.59 | 20.9 |
| Panoramic | 232 | 18 | 47.11 | 0.856 | 4.54 | |||
| Mean Relative Error of C () | , | (6) | ||||||
| where N = 9 is the number of relative errors for measurements performed with both methods. | ||||||||
| Standard Deviation of the Relative Errors of C () | (7) | |||||||
| Mean relative Error of CNR () | , | (8) | ||||||
| where N = 9 is the number of relative errors for measurements performed with both methods. | ||||||||
| Standard Deviation of the Relative Errors of CNR () | (9) | |||||||
3.4. Treatment Assessments Using OCT
3.5. Sinergy between Radiography and OCT
4. Conclusions
Author Contributions
Funding
Acknowledgments
Conflicts of Interest
Ethical Approval
References
- Jung, R.E.; Schneider, D.; Ganeles, J.; Wismeijer, D.; Zwahlen, M.; Hammerle, C.H.; Tahmeseb, A. Computer technology applications in surgical implant dentistry: A systematic review. Int. J. Oral Maxillofac. Implant. 2009, 24, 92–109. [Google Scholar]
- Lin, L.; Fang, Y.; Liao, Y.; Chen, G.; Gao, C.; Zhu, O. 3D printing and digital processing techniques in dentistry: A review of literature. Adv. Eng. Mater. 2019, 21. [Google Scholar] [CrossRef]
- Javaid, M.; Haleem, A.; Kumar, L. Current status and applications of 3D scanning in dentistry. Clin. Epidemiol. Glob. Health 2019, 7, 228–233. [Google Scholar] [CrossRef]
- Huang, D.; Swanson, E.A.; Lin, C.P.; Schuman, J.S.; Stinson, W.G.; Chang, W.; Hee, M.R.; Flotte, T.; Gregory, K.; Puliafito, C.A.; et al. Optical coherence tomography. Science 1991, 254, 1178–1181. [Google Scholar] [CrossRef] [PubMed]
- Choma, M.A.; Sarunic, M.V.; Yang, C.; Izatt, J.A. Sensitivity advantage of swept-source and Fourier-domain optical coherence tomography. Opt. Express 2003, 11, 2183–2189. [Google Scholar] [CrossRef] [PubMed]
- Drexler, W.; Liu, M.; Kumar, A.; Kamali, T.; Unterhuber, A.; Leitgeb, R.A. Optical coherence tomography today: Speed, contrast, and multimodality. J. Biomed. Opt. 2014, 19, 071412. [Google Scholar] [CrossRef] [PubMed]
- Podoleanu, A.; Bradu, A. Master-slave interferometry for parallel spectral domain interferometry sensing and versatile 3D optical coherence tomography. Opt. Express 2013, 21, 19324–19338. [Google Scholar] [CrossRef]
- Poppe, B.; Looe, H.K.; Pfaffenberger, A.; Chofor, N.; Eenboom, F.; Sering, M.; Rühmann, A.; Poplawski, A.; Willborn, K. Dose-area product measurements in panoramic dental radiology. Radiat. Prot. Dosim. 2007, 123, 131–134. [Google Scholar] [CrossRef]
- Erdelyi, R.A.; Duma, V.-F. Optimization of radiation doses and patients’ risk in dental radiography. AIP Proc. 2019, 2071, 040013. [Google Scholar]
- Feldchtein, F.; Gelikonov, V.; Iksanov, R.; Gelikonov, G.; Kuranov, R.; Sergeev, A.; Gladkova, N.; Ourutina, M.; Reitze, D.; Warren, J. In vivo OCT imaging of hard and soft tissue of the oral cavity. Opt. Express 1998, 3, 239–250. [Google Scholar] [CrossRef]
- Otis, L.; Everett, M.J.; Sathyam, U.S.; Colston, B.W., Jr. Optical coherence tomography: A new imaging: Technology for dentistry. J. Am. Dent. Assoc. 2000, 131, 511–514. [Google Scholar] [CrossRef] [PubMed]
- Monteiro, G.Q.M.; Montes, M.A.J.R.; Gomes, A.S.L.; Mota, C.C.B.O.; Campello, S.L.; Freitas, A.Z. Marginal analysis of resin composite restorative systems using optical coherence tomography. Dent. Mater. 2011, 27, 213–223. [Google Scholar] [CrossRef]
- Nakagawa, H.; Sadr, A.; Shimada, Y.; Tagami, J.; Sumi, Y. Validation of swept source optical coherence tomography (SS-OCT) for the diagnosis of smooth surface caries in vitro. J. Dent. 2013, 41, 80–89. [Google Scholar] [CrossRef] [PubMed]
- Hsieh, Y.-S.; Ho, Y.-C.; Lee, S.-Y.; Chuang, C.-C.; Tsai, J.; Lin, K.-F.; Sun, C.-W. Dental optical coherence tomography. Sensors 2013, 13, 8928–8949. [Google Scholar] [CrossRef] [PubMed]
- Schneider, H.; Park, K.-J.; Häfer, M.; Rüger, C.; Schmalz, G.; Krause, F.; Schmidt, J.; Ziebolz, D.; Haak, R. Dental applications of optical coherence tomography (OCT) in cariology. Appl. Sci. 2017, 7, 472. [Google Scholar] [CrossRef]
- Yang, V.; Curtis, D.A.; Fried, D. Use of optical clearing agents for imaging root surfaces with optical coherence tomography. IEEE J. Sel. Top. Quantum Electron. 2019, 25, 1–7. [Google Scholar] [CrossRef]
- Erdelyi, R.A.; Duma, V.-F.; Dobre, G.; Bradu, A.; Podoleanu, A. A Combination of Imaging Techniques for Dental Medicine: From x-Rays Radiography and 3D CBCT to OCT. In Proceedings of the SPIE Photonics Europe [Online], Strassbourg, France, 6–10 April 2020; Volume 11359, p. 113591E. [Google Scholar]
- Drexler, W.; Fujimoto, J.G. Optical Coherence Tomography: Technology and Applications; Springer International Publishing: Cham, Switzerland, 2015. [Google Scholar]
- Lee, K.-S.; Zhao, H.; Ibrahim, S.F.; Meemon, N.; Khoudeir, L.; Rolland, J.P. Three-dimensional imaging of normal skin and nonmelanoma skin cancer with cellular resolution using Gabor domain optical coherence microscopy. J. Biomed. Opt. 2012, 17, 126006. [Google Scholar] [CrossRef]
- Adler, D.C.; Chen, Y.; Huber, R.; Schmitt, J.; Connolly, J.; Fujimoto, J.G. Three-dimensional endomicroscopy using optical coherence tomography. Nat. Photonics 2007, 1, 709–716. [Google Scholar] [CrossRef]
- Choi, W.J.; Wang, R.K. In vivo imaging of functional microvasculature within tissue beds of oral and nasal cavities by swept-source optical coherence tomography with a forward/side-viewing probe. Biomed. Opt. Express 2014, 5, 2620–2634. [Google Scholar] [CrossRef]
- Canavesi, C.; Rolland, J.P. Ten years of gabor-domain optical coherence microscopy. Appl. Sci. 2019, 9, 2565. [Google Scholar] [CrossRef]
- Povazay, B.; Bizheva, K.; Unterhuber, A.; Hermann, B.; Sattmann, H.; Fercher, A.F.; Drexler, W.; Apolonski, A.; Wadsworth, W.J.; Knight, J.C.; et al. Submicrometer axial resolution optical coherence tomography. Opt. Lett. 2002, 27, 1800–1802. [Google Scholar] [CrossRef]
- Lehmann, T.M.; Troeltsch, E.; Spitzer, K. Image processing and enhancement provided by commercial dental software programs. Dentomaxillofac. Radiol. 2002, 31, 264–272. [Google Scholar] [CrossRef] [PubMed]
- Imaging Manual, “en 3D s/Classic with ProTouch”. Available online: https://materialbank.planmeca.com/ (accessed on 20 September 2019).
- Yeung, A.W.K.; Jacobs, R.; Bornstein, M.M. Novel low-dose protocols using cone beam computed tomography in dental medicine: A review focusing on indications, limitations, and future possibilities. Clin. Oral Investig. 2019, 23, 2573–2581. [Google Scholar] [CrossRef]
- Versteeg, C.H.; Sanderink, G.C.H.; van der Stelt, P.F. Efficacy of digital intra-oral radiography in clinical dentistry. J. Dent. 1997, 25, 215–224. [Google Scholar] [CrossRef]
- Erdelyi, R.A.; Duma, V.-F.; Dobre, G.; Bradu, A.; Podoleanu, A. Investigations of Dental Cavities: Between X-Ray Radiography and OCT. In Proceedings of the Optics and Measurement 2019 International Conference, Liberec, Czech Republic, 8–10 October 2019; Volume 11385, p. 1138504. [Google Scholar]
- Duma, V.-F. Laser scanners with oscillatory elements: Design and optimization of 1D and 2D scanning functions. Appl. Math. Model. 2019, 67, 456–476. [Google Scholar] [CrossRef]
- Duma, V.-F.; Dobre, G.; Demian, D.; Cernat, R.; Sinescu, C.; Topala, F.I.; Negrutiu, M.L.; Hutiu, G.; Bradu, A.; Podoleanu, A.G. Handheld scanning probes for optical coherence tomography. Rom. Rep. Phys. 2015, 67, 1346–1358. [Google Scholar]
- Oancea, R.; Bradu, A.; Sinescu, C.; Negru, R.M.; Negrutiu, M.L.; Antoniac, I.; Duma, V.-F.; Podoleanu, A.G. Assessment of the sealant/tooth interface using optical coherence tomography. J. Adhes. Sci. Technol. 2015, 29, 49–58. [Google Scholar] [CrossRef]
- Romexis. Viewer User’s Manual. Available online: http://www.planmecausasupport.com (accessed on 25 September 2019).
- Carranza, F.A. Carranza’s Clinical Periodontology, 10th ed.; Cochrane, D.L., Giannobile, W.V., Kenney, E.B., Novak, M.J., Eds.; Elsevier: Saint Louis, MO, USA, 2007. [Google Scholar]
- Gomes-Filho, I.S.; Sarmento, V.A.; De Castro, M.S. Radiographic features of periodontal bone defects: Evaluation of digitized images. Dentomaxillofac. Radiol. 2007, 36, 256. [Google Scholar] [CrossRef]
- Misch, K.A.; Yi, E.S.; Sarment, D.P. Accuracy of cone beam computed tomography for periodontal defect measurements. J. Periodontol. 2006, 77, 1261. [Google Scholar] [CrossRef]
- Velea, O.A.; Sinescu, C.; Zeicu, C.; Freiman, P.C.; Velea, P.I.; Onisei, D.; Duma, V.-F. Evaluation of periodontal pockets using different biomaterials. Rev. Chim. 2014, 65, 1063–1075. [Google Scholar]
- Sinescu, C.; Negrutiu, M.L.; Manole, M.; de Sabata, A.; Rusu, L.-C.; Stratul, S.; Dudea, D.; Dughir, C.; Duma, V.-F. Retractions of the Gingival Margins Evaluated by Holographic Methods. In Proceedings of the SPIE Optics + Optoelectronics, Prague, Czech Republic, 13–16 April 2015; Volume 9508, p. 95080V. [Google Scholar]
- Bellucci, D.; Cannillo, V.; Sola, A. Shell Scaffolds: A new approach towards high strength bioceramic scaffolds for bone regeneration. Mater. Lett. 2010, 64, 203–206. [Google Scholar] [CrossRef]
- Deb, P.; Deoghare, A.B.; Borah, A.; Barua, E.; Das Lala, S. Scaffold development using biomaterials: A review. Mater. Today Proc. 2018, 5, 12909–12919. [Google Scholar] [CrossRef]
- Shahgholia, M.; Olivierod, S.; Bainob, F.; Vitale-Brovaroneb, C.; Gastaldia, D.; Venaa, P. Mechanical characterization of glass-ceramic scaffolds at multiple characteristic lengths through nanoindentation. J. Eur. Ceram. Soc. 2016, 36, 2403–2409. [Google Scholar] [CrossRef]
- Luca, R.; Todea, C.D.; Duma, V.-F.; Bradu, A.; Podoleanu, A. Quantitative assessment of rat bone regeneration using complex master–slave optical coherence tomography. Quant. Imaging Med. Surg. 2019, 9, 782–798. [Google Scholar] [CrossRef]
- Luca, R.E.; Giuliani, A.; Mănescu, A.; Heredea, R.; Hoinoiu, B.; Constantin, G.D.; Duma, V.-F.; Todea, C.D. Osteogenic potential of bovine bone graft in combination with laser photobiomodulation: An ex vivo demonstrative study in wistar rats by cross-linked studies based on synchrotron microtomography and histology. Int. J. Mol. Sci. 2020, 21, 778. [Google Scholar] [CrossRef]
- Duma, V.-F.; Tankam, P.; Huang, J.; Won, J.J.; Rolland, J.P. Optimization of galvanometer scanning for Optical Coherence Tomography. Appl. Opt. 2015, 54, 5495–5507. [Google Scholar] [CrossRef]
- Alshahni, R.Z.; Shimada, Y.; Zhou, Y.; Yoshiyama, M.; Sadr, A.; Sumi, Y.; Tagami, J. Cavity adaptation of composite restorations prepared at crown and root: Optical assessment using SS-OCT. Dent. Mater. 2019, 38, 779–789. [Google Scholar] [CrossRef]
- Ko, A.C.-T.; Choo-Smith, L.-P.; Hewko, M.D.; Leonardi, L.; Sowa, M.G.; Dong, C.C.C.S.; Williams, P.; Cleghorn, B. Ex vivo detection and characterization of early dental caries by optical coherence tomography and Raman spectroscopy. J. Biomed. Opt. 2005, 10, 031118. [Google Scholar] [CrossRef]
- Amaechi, B.T.; Higham, S.M.; Podoleanu, A.G.; Rogers, J.A.; Jackson, D.A. Use of optical coherence tomography for assessment of dental caries: Quantitative procedure. J. Oral Rehabil. 2001, 28, 1092–1093. [Google Scholar] [CrossRef]
- Canjau, S.; Todea, C.; Negrutiu, M.L.; Sinescu, C.; Topala, F.I.; Marcauteanu, C.; Manescu, A.; Duma, V.-F.; Bradu, A.; Podoleanu, A. Optical coherence tomography for non-invasive ex vivo investigations in dental medicine—A joint group experience (review). Mod. Technol. Med. 2015, 7, 97–115. [Google Scholar] [CrossRef]
- De Boer, J.F.; Hitzenberger, C.K.; Yasuno, Y. Polarization sensitive optical coherence tomography—A review [Invited]. Biomed. Opt. Express 2017, 8, 1838–1873. [Google Scholar] [CrossRef]
- Demian, D.; Duma, V.-F.; Sinescu, C.; Negrutiu, M.L.; Cernat, R.; Topala, F.I.; Hutiu, G.; Bradu, A.; Podoleanu, A.G. Design and testing of prototype handheld scanning probes for optical coherence tomography. J. Eng. Med. 2014, 228, 743–753. [Google Scholar] [CrossRef] [PubMed]
- Jung, W.; Kim, J.; Jeon, M.; Chaney, E.J.; Stewart, C.N.; Boppart, S.A. Handheld optical coherence tomography scanner for primary care diagnostics. IEEE Trans. Biomed. Eng. 2011, 58, 741–744. [Google Scholar] [CrossRef] [PubMed]
- Monroy, G.L.; Won, J.; Spillman, D.R.; Dsouza, R.; Boppart, S.A. Clinical translation of handheld optical coherence tomography: Practical considerations and recent advancements. J. Biomed. Opt. 2017, 22, 121715. [Google Scholar] [CrossRef] [PubMed]
- Lu, C.D.; Kraus, M.F.; Potsaid, B.; Liu, J.J.; Choi, W.; Jayaraman, V.; Cable, A.E.; Hornegger, J.; Duke, J.S.; Fujimoto, J.G. Handheld ultrahigh speed swept source optical coherence tomography instrument using a MEMS scanning mirror. Biomed. Opt. Express 2014, 5, 293–311. [Google Scholar] [CrossRef]
- Cogliati, A.; Canavesi, C.; Hayes, A.; Tankam, P.; Duma, V.-F.; Santhanam, A.; Thompson, K.P.; Rolland, J.P. MEMS-based handheld scanning probe for distortion-free images in gabor-domain optical coherence microscopy. Opt. Express 2016, 24, 13365–13374. [Google Scholar] [CrossRef]
- Sinescu, C.; Bradu, A.; Duma, V.-F.; Topala, F.; Negrutiu, M.L.; Podoleanu, A. Effects of the temperature variations in the technology of metal ceramic dental prostheses: Non-destructive detection using optical coherence tomography. Appl. Sci. 2017, 7, 552. [Google Scholar] [CrossRef]
- Duma, V.-F.; Sinescu, C.; Bradu, A.; Podoleanu, A. Optical coherence tomography investigations and modeling of the sintering of ceramic crowns. Materials 2019, 12, 947. [Google Scholar] [CrossRef]
- Sinescu, C.; Negrutiu, M.L.; Bradu, A.; Duma, V.-F.; Podoleanu, A.G. Noninvasive quantitative evaluation of the dentin layer during dental procedures using optical coherence tomography. Comput. Math. Methods Med. 2015, 2015, 1–7. [Google Scholar] [CrossRef]
- Zaharia, C.; Duma, V.-F.; Sinescu, C.; Socoliuc, V.; Craciunescu, I.; Turcu, R.P.; Marin, C.N.; Tudor, A.; Rominu, M.; Negrutiu, M.-L. Dental adhesive interfaces reinforced with magnetic nanoparticles: Evaluation and modeling with micro-CT versus optical microscopy. Materials 2020, 13, 3908. [Google Scholar] [CrossRef]


| Dental Issue | Radiography | OCT |
|---|---|---|
| Cavities | Cavities smaller than 0.5 × 0.5 mm are barely visible on any type of radiography | Correct quantitative assessment of small cavities (Figure 7, Figure 8, Figure 9, Figure 10, Figure 15, Figure 16, Figure 17) |
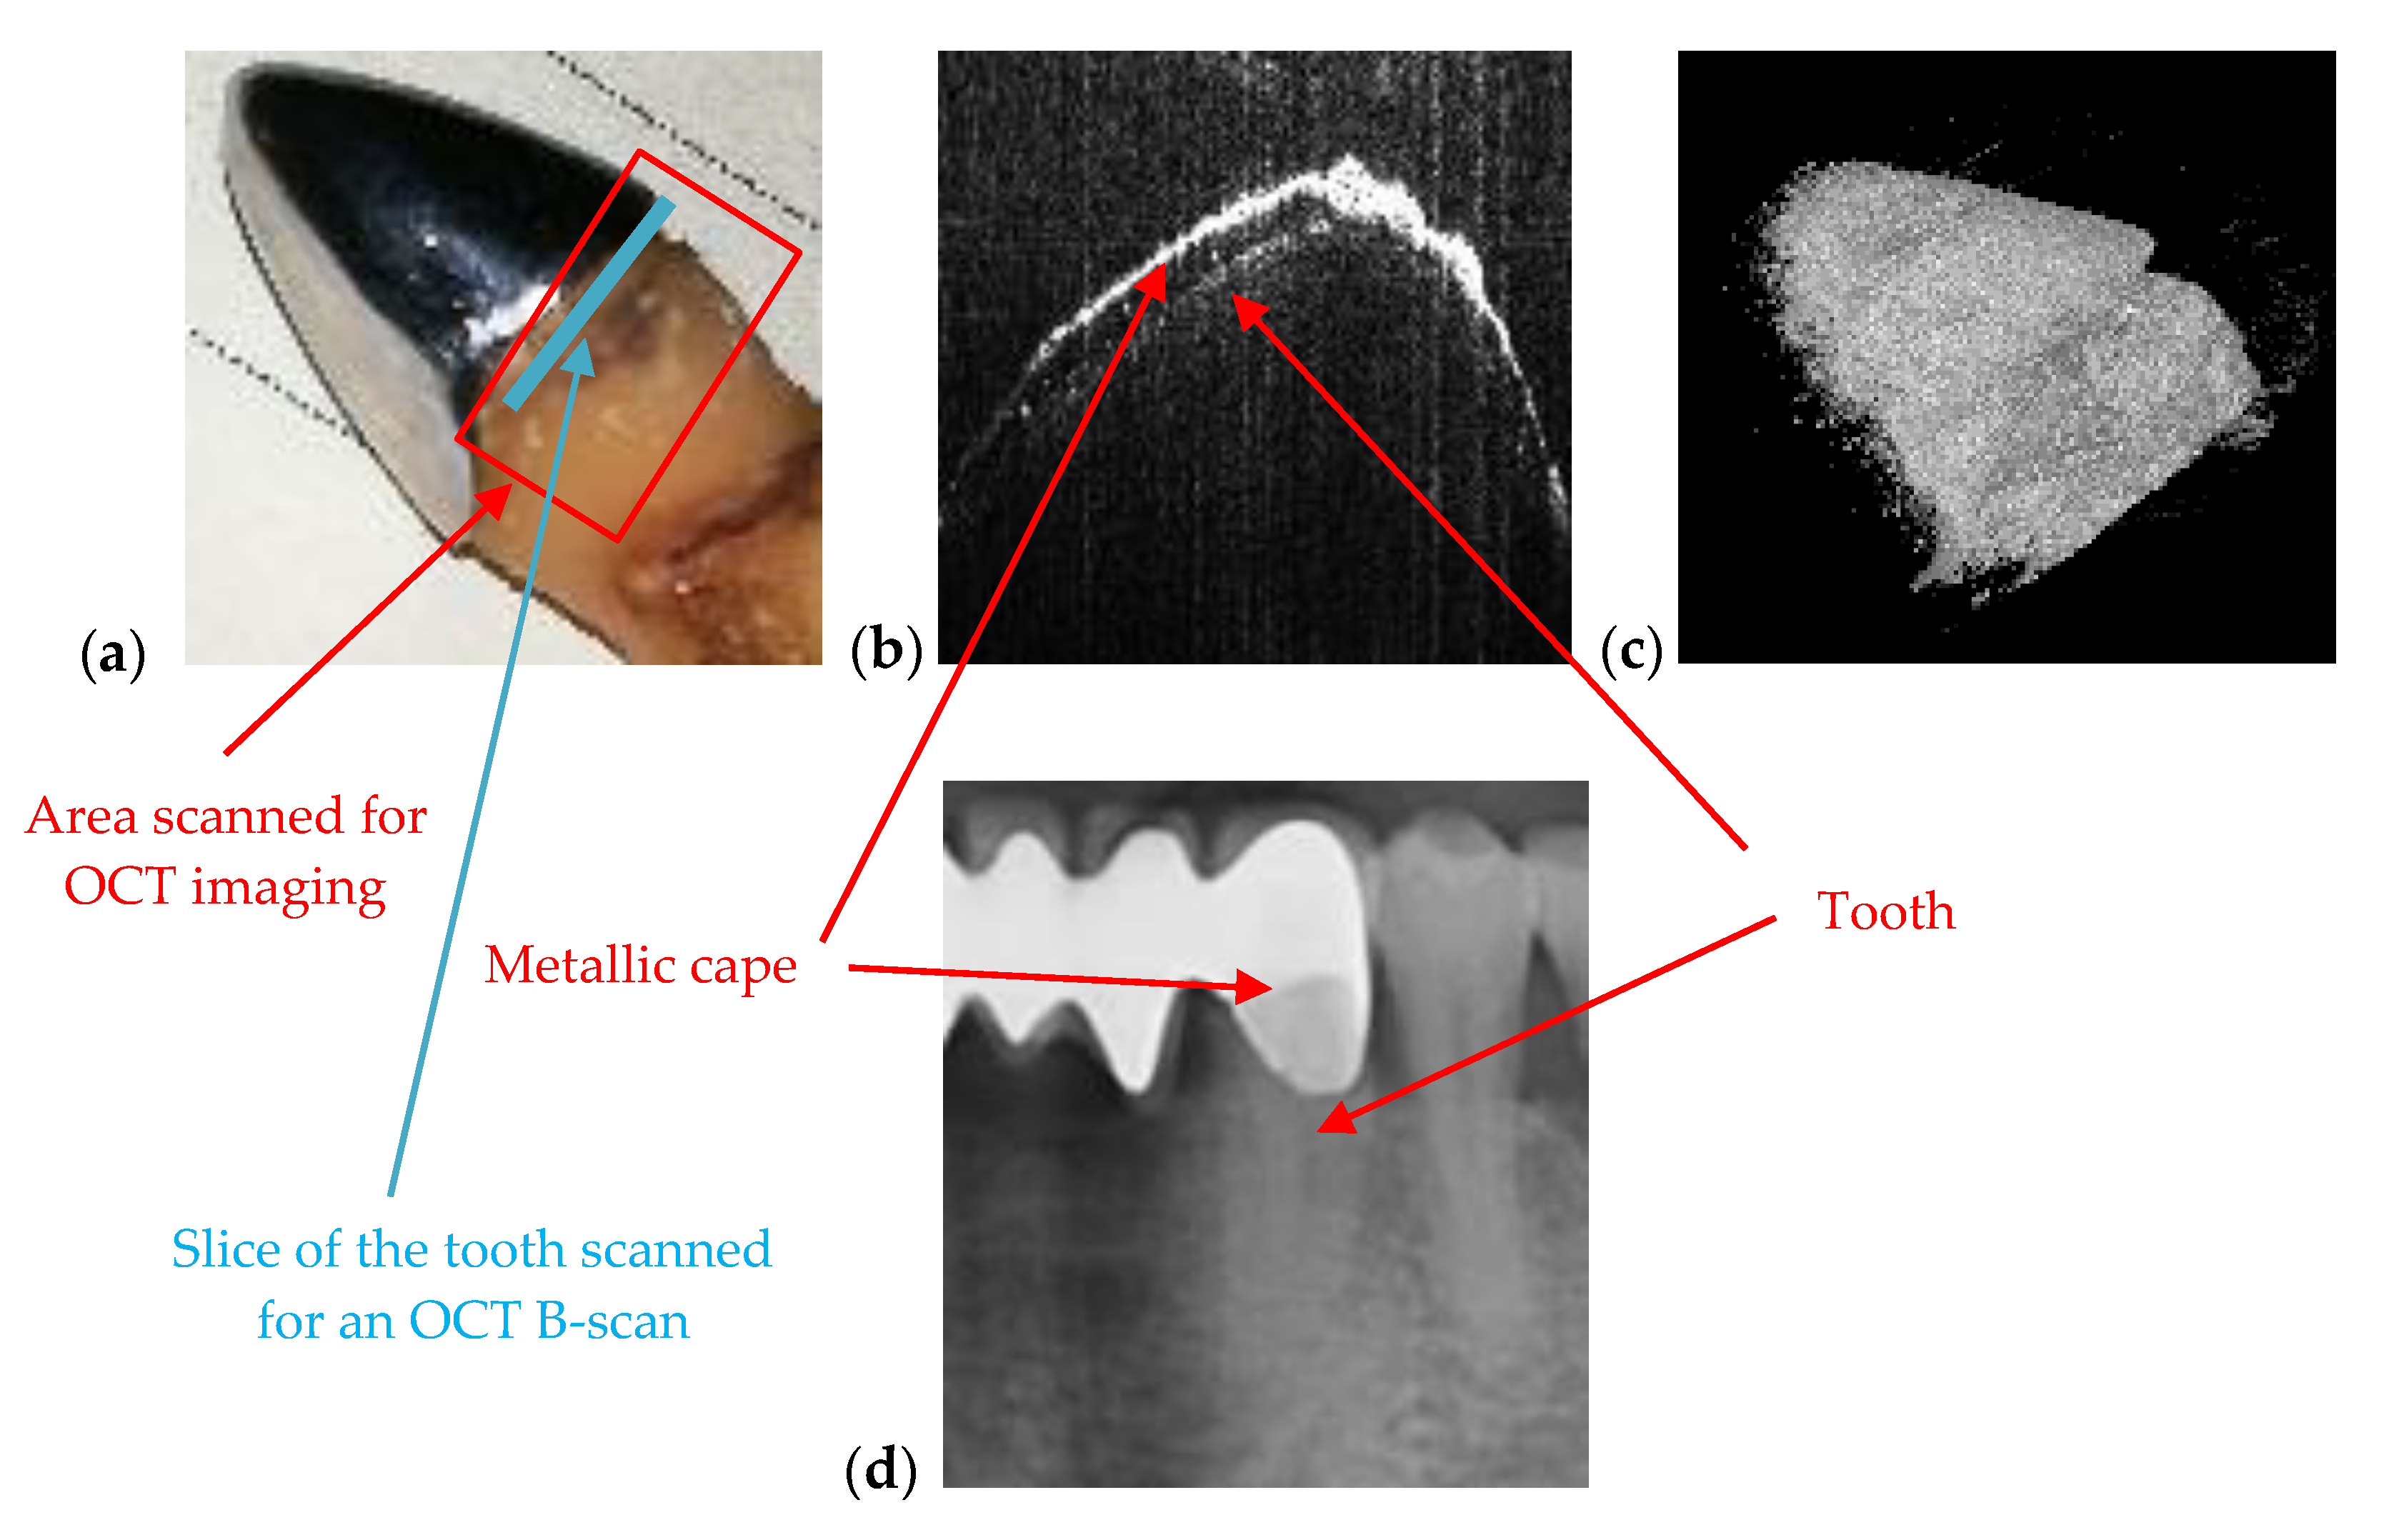
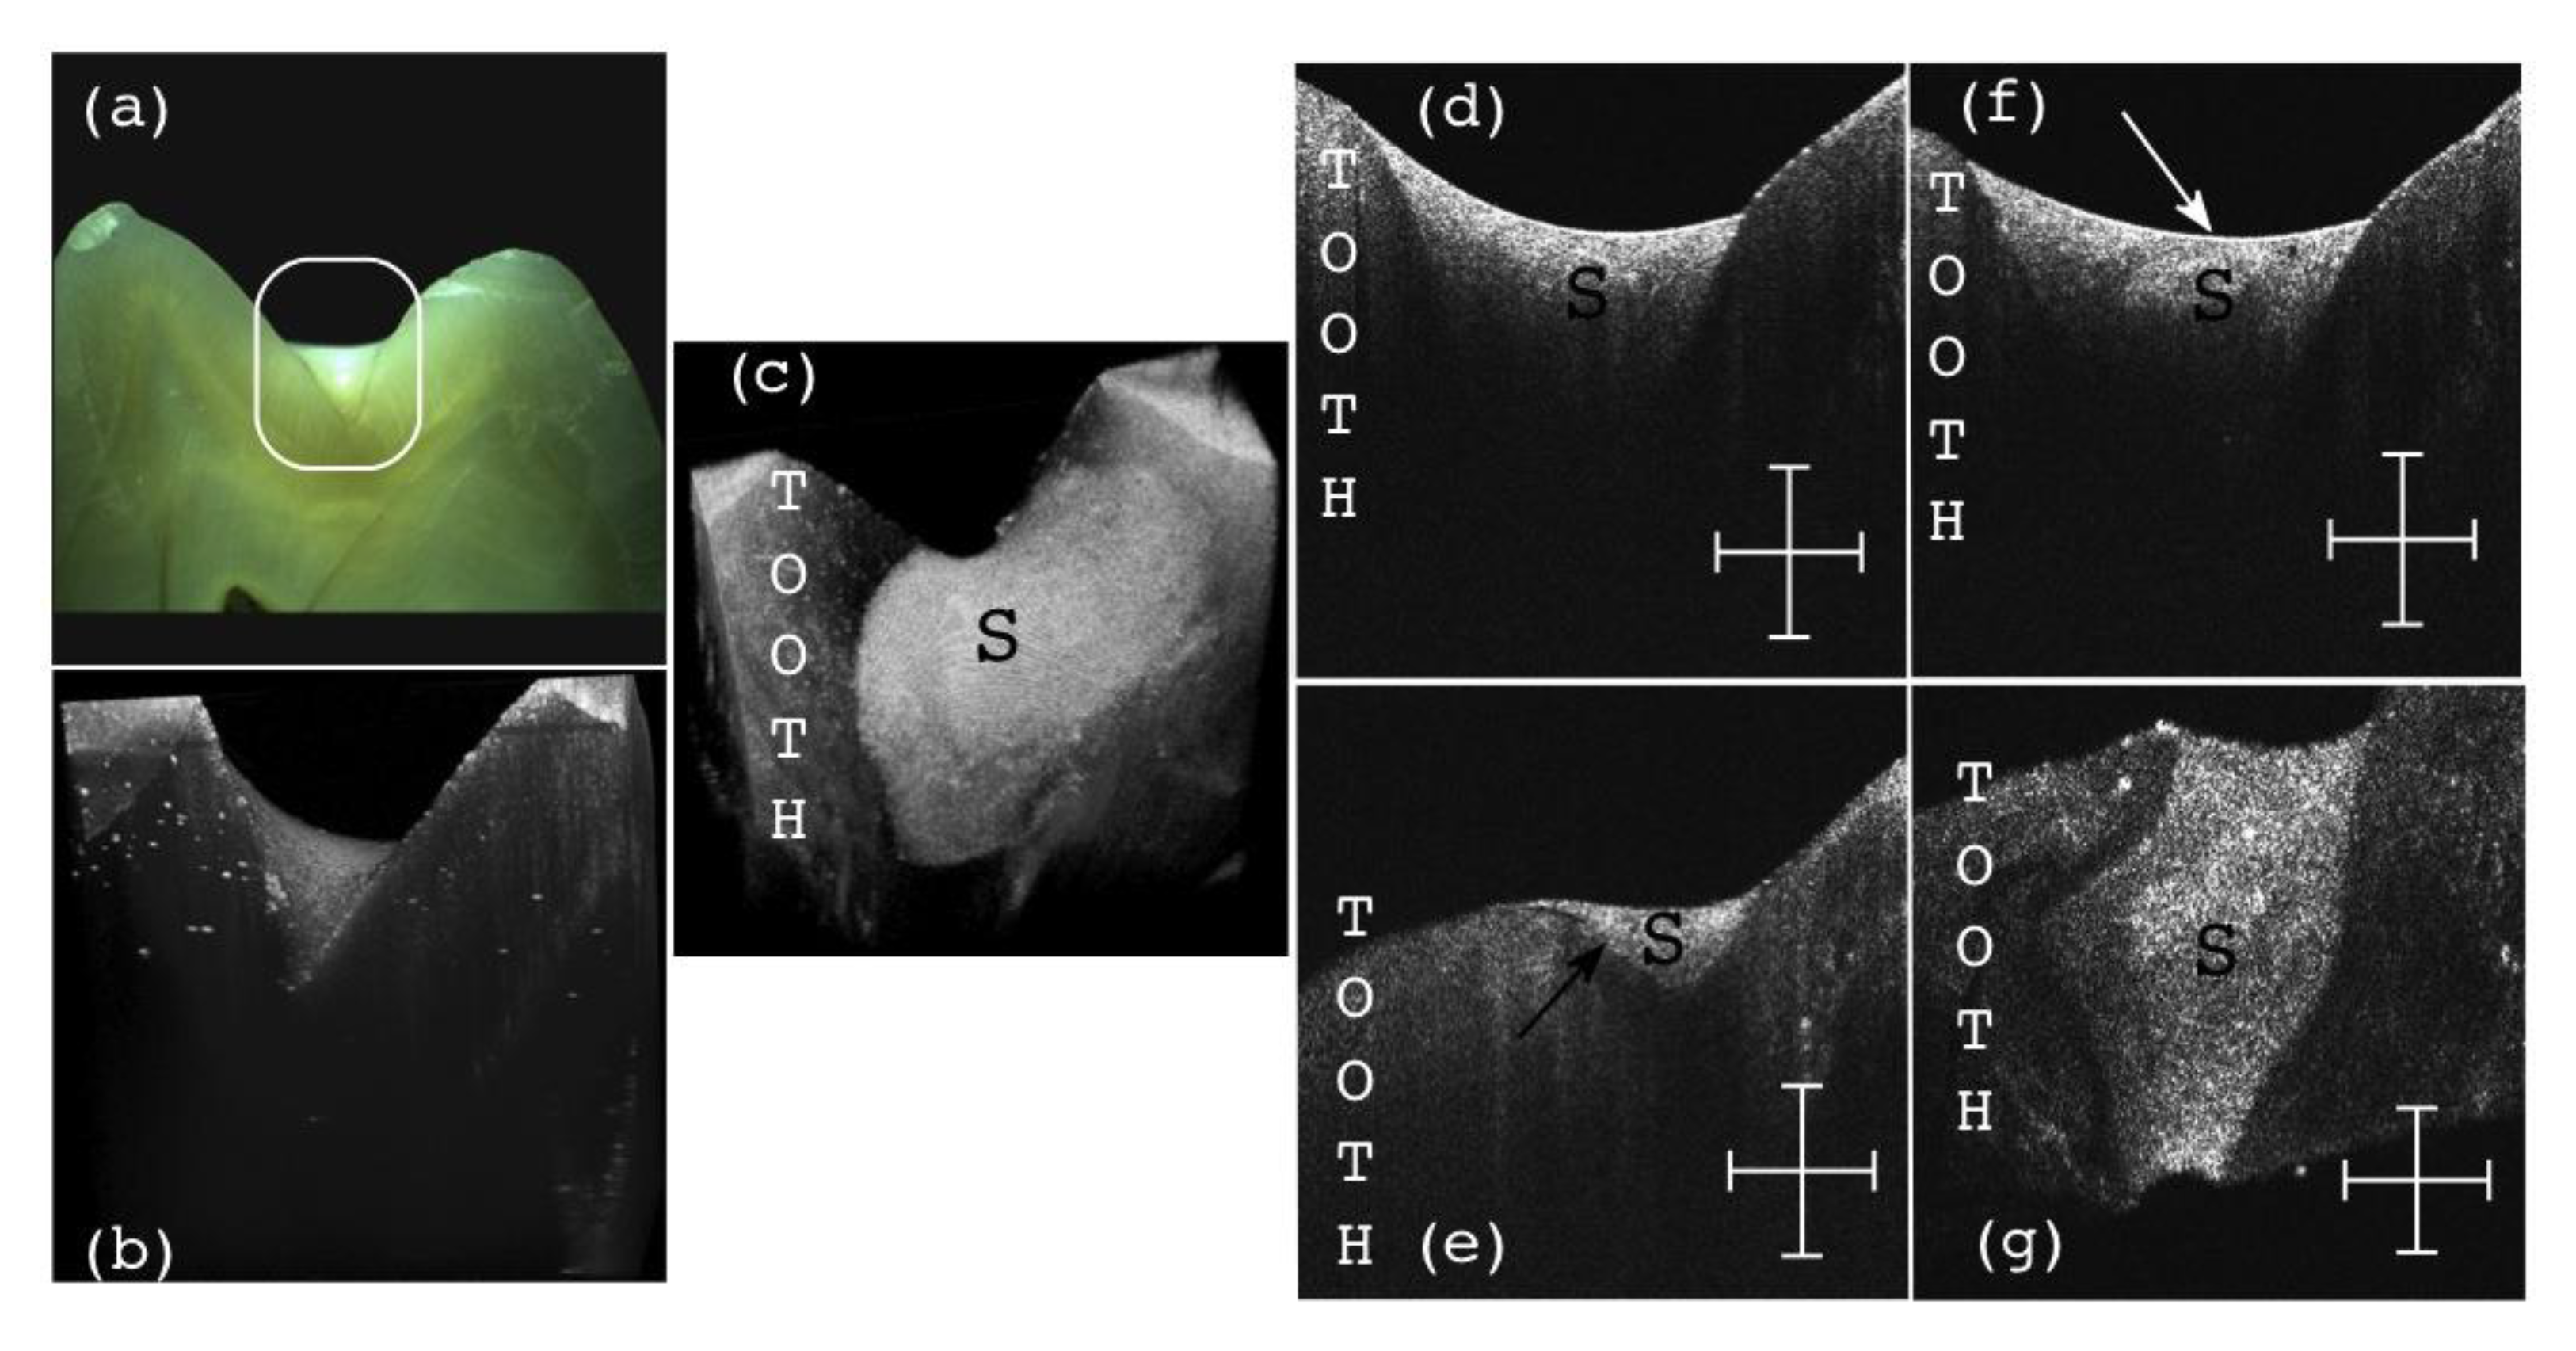
| Dental crowns (metal ceramic or all ceramic) | Artefacts may appear therefore the obtained images cannot be utilized | Accurate surface images for metallic parts; high-resolution images beneath the sample surface for non-metallic (ceramic or polymer) crowns |
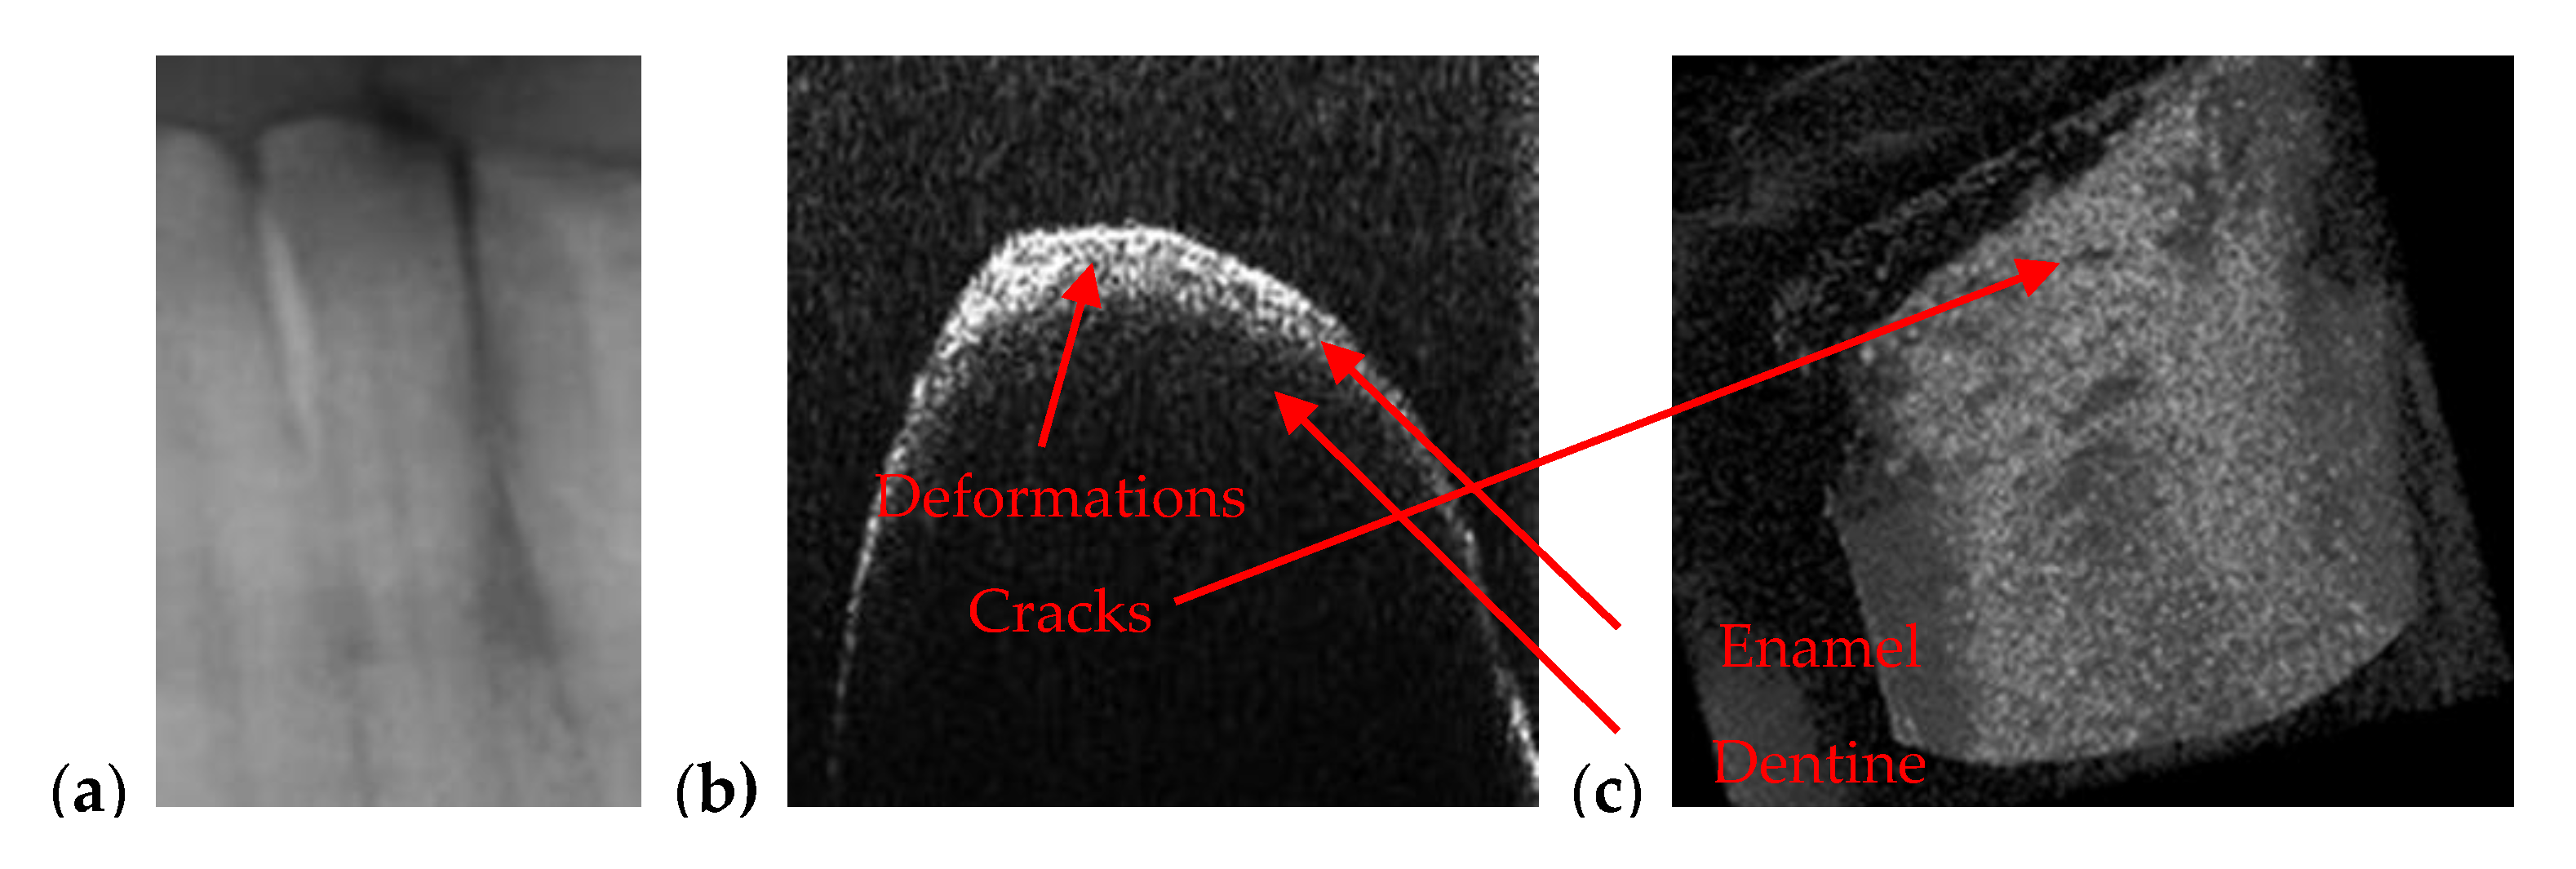
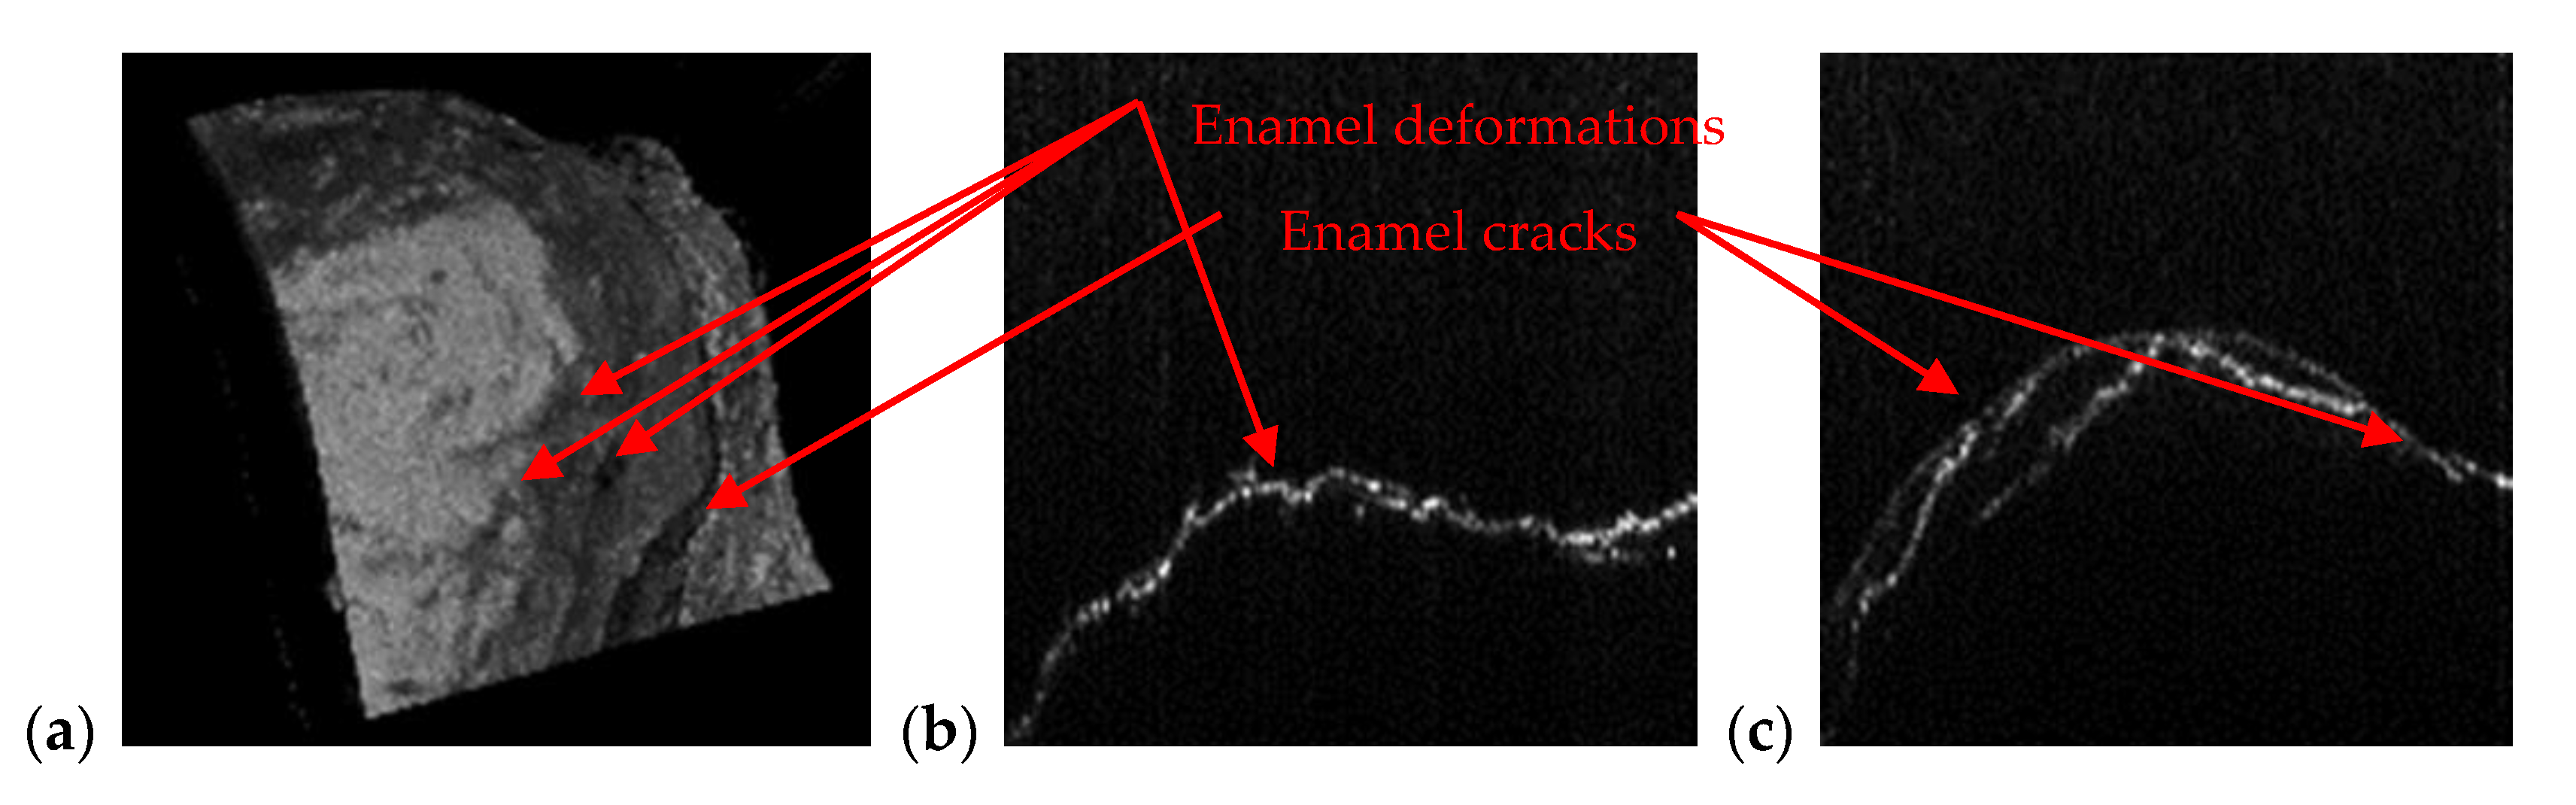
| Orthodontics | Appropriate to measure/observe teeth movement | Accurate for tooth analysis (i.e., for enamel and dentine–Figure 11, Figure 12 and Figure 14) |
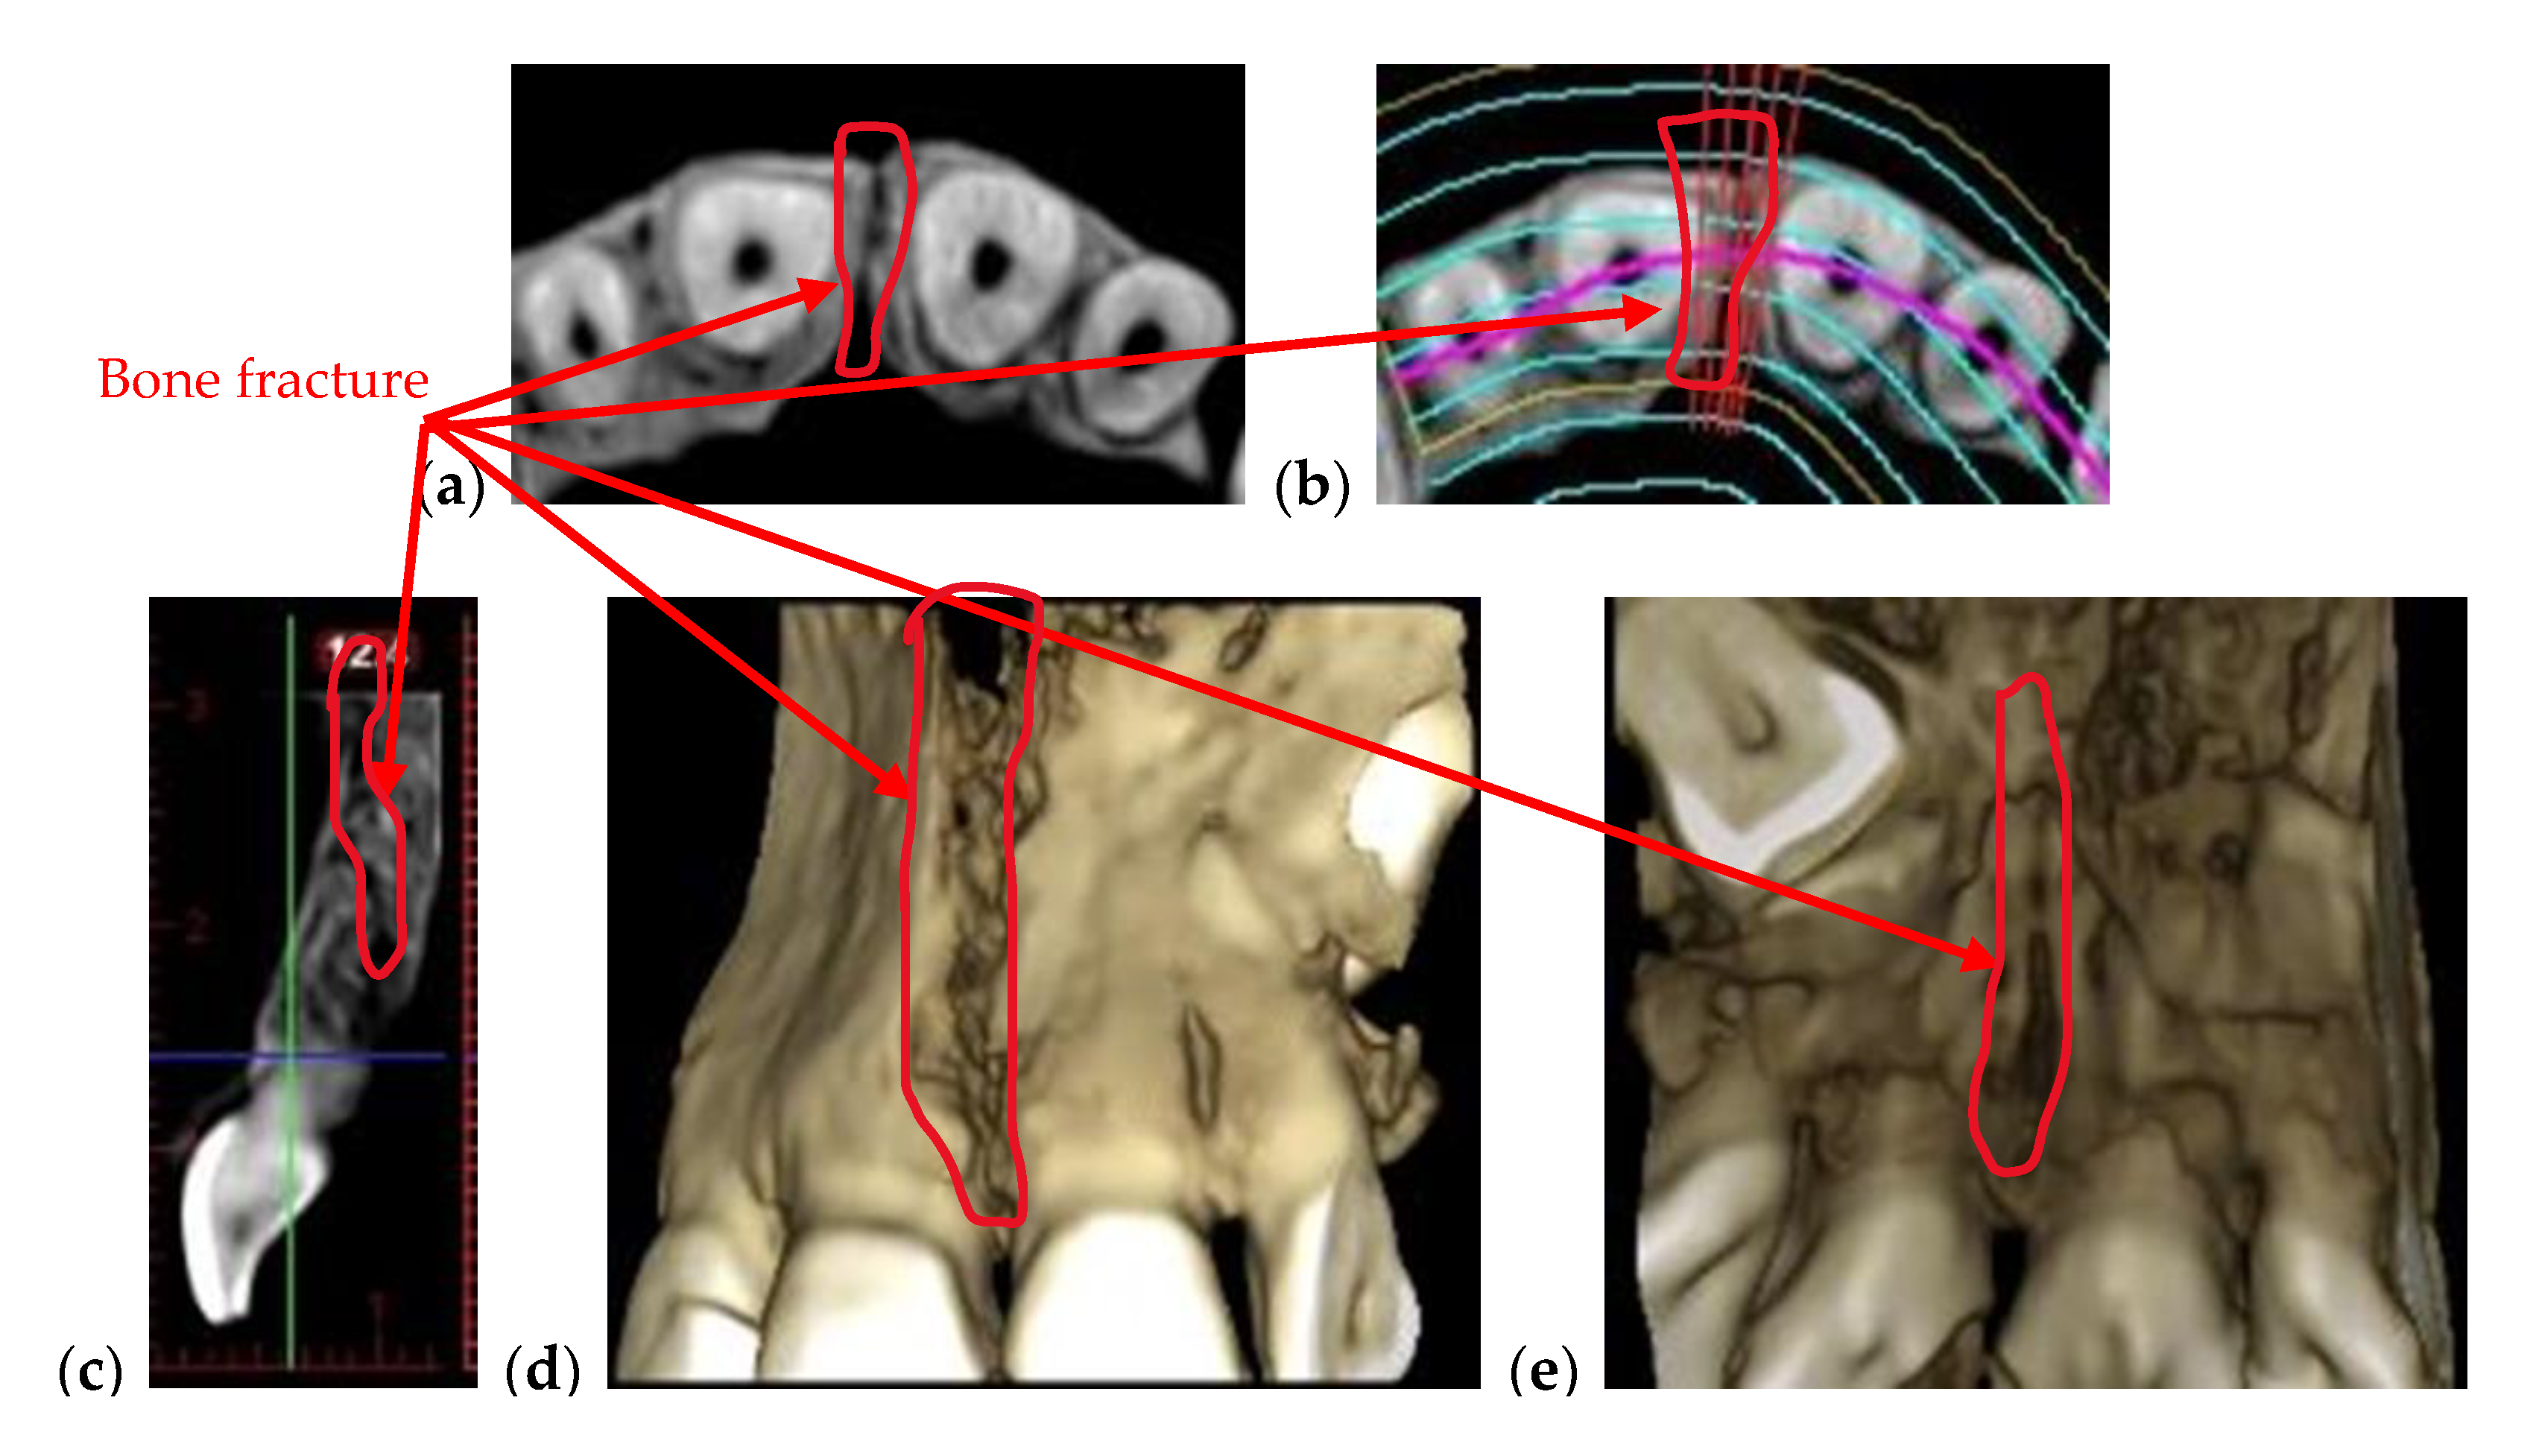
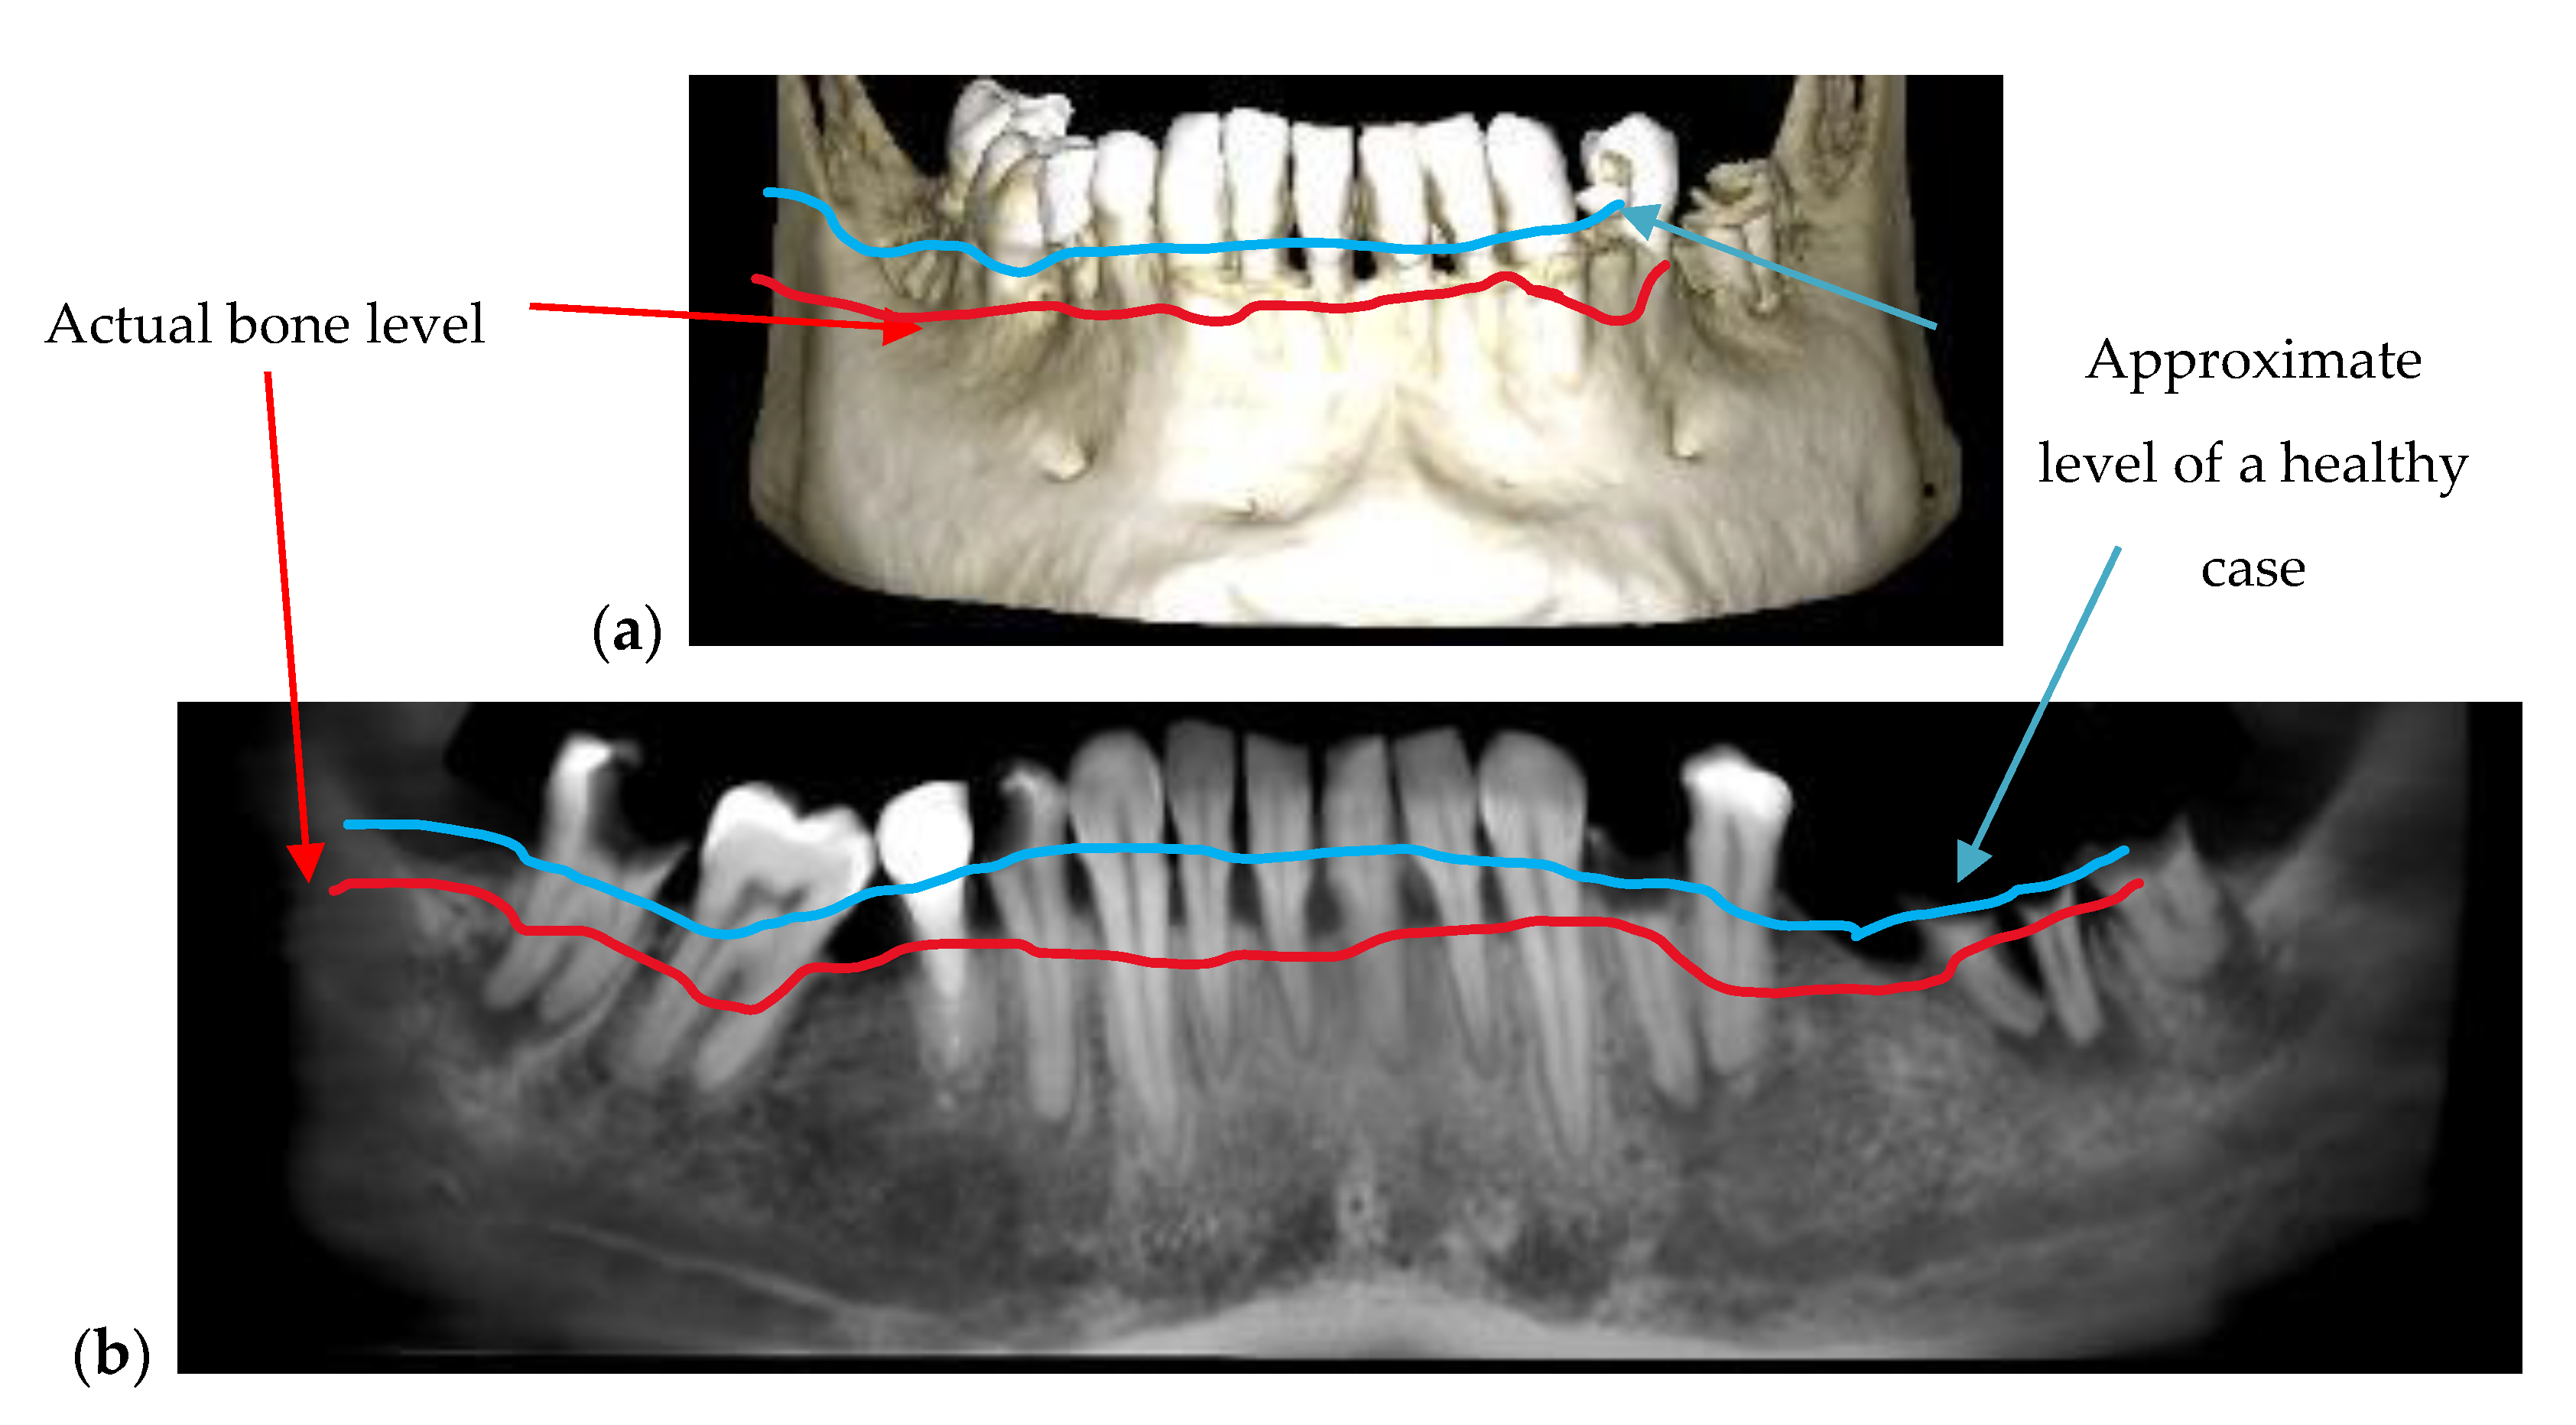
| Bone issues assessment | Accurate investigations of bone density and quantity assessment on 3D CBCT images (see the example in Figure 3) | Cannot penetrate through the bone more than 1 to 2 mm |
| Periodontitis | The disease can be monitored during the treatment (example, Figure 5) | Exact measurements of bone loss/gain are possible |
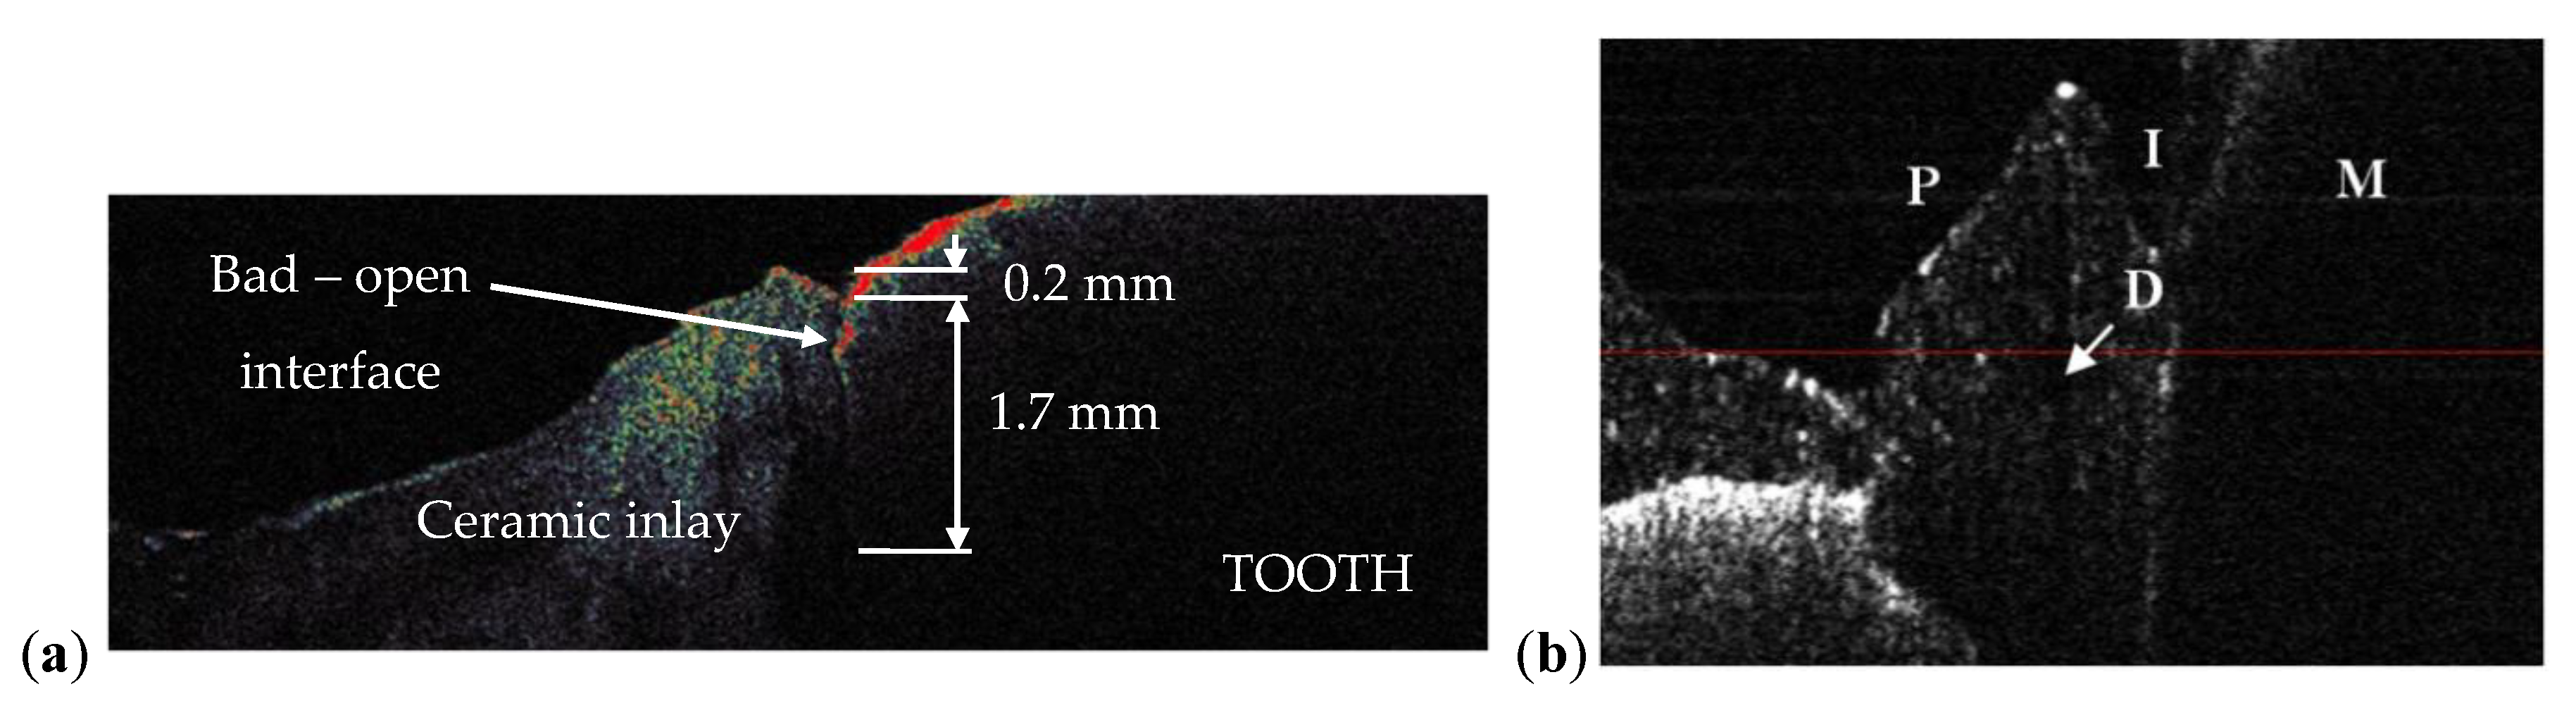
| Crown/filling adaptation | High-quality images for materials that do not absorb X-ray radiation in excess | High quality images for most types of materials used in dentistry (Figure 13) |
| Enamel/dentine issues | Not visible on any type of radiography | Qualitative images, but also quantitative evaluations can be obtained-even beneath the teeth surface |
| Soft tissue | Not visible using any type of radiography | Qualitative images can be obtained. Depth limitation of up to 2 mm. |
| Dental Issue | Diagnose/Treatment Monitoring | Measuring Capability of Their Spatial Extension |
|---|---|---|
| Cavities | X-ray and OCT | OCT |
| Metal crowns | OCT | OCT |
| Orthodontics | X-ray and OCT | OCT |
| Bone assessment | X-ray | X-ray |
| Periodontitis | X-ray and OCT | X-ray and OCT |
| Crown/filling adaptation | X-ray and OCT | OCT |
| Enamel/dentine issues | OCT | OCT |
| Soft tissue | OCT | OCT |
Publisher’s Note: MDPI stays neutral with regard to jurisdictional claims in published maps and institutional affiliations. |
© 2020 by the authors. Licensee MDPI, Basel, Switzerland. This article is an open access article distributed under the terms and conditions of the Creative Commons Attribution (CC BY) license (http://creativecommons.org/licenses/by/4.0/).
Share and Cite
Erdelyi, R.-A.; Duma, V.-F.; Sinescu, C.; Dobre, G.M.; Bradu, A.; Podoleanu, A. Dental Diagnosis and Treatment Assessments: Between X-rays Radiography and Optical Coherence Tomography. Materials 2020, 13, 4825. https://doi.org/10.3390/ma13214825
Erdelyi R-A, Duma V-F, Sinescu C, Dobre GM, Bradu A, Podoleanu A. Dental Diagnosis and Treatment Assessments: Between X-rays Radiography and Optical Coherence Tomography. Materials. 2020; 13(21):4825. https://doi.org/10.3390/ma13214825
Chicago/Turabian StyleErdelyi, Ralph-Alexandru, Virgil-Florin Duma, Cosmin Sinescu, George Mihai Dobre, Adrian Bradu, and Adrian Podoleanu. 2020. "Dental Diagnosis and Treatment Assessments: Between X-rays Radiography and Optical Coherence Tomography" Materials 13, no. 21: 4825. https://doi.org/10.3390/ma13214825
APA StyleErdelyi, R.-A., Duma, V.-F., Sinescu, C., Dobre, G. M., Bradu, A., & Podoleanu, A. (2020). Dental Diagnosis and Treatment Assessments: Between X-rays Radiography and Optical Coherence Tomography. Materials, 13(21), 4825. https://doi.org/10.3390/ma13214825