Using Graphene Sulfonate Nanosheets to Improve the Properties of Siliceous Sacrificial Materials: An Experimental and Molecular Dynamics Study

 ,
, 
 ,
,
Abstract
1. Introduction
2. Experiment
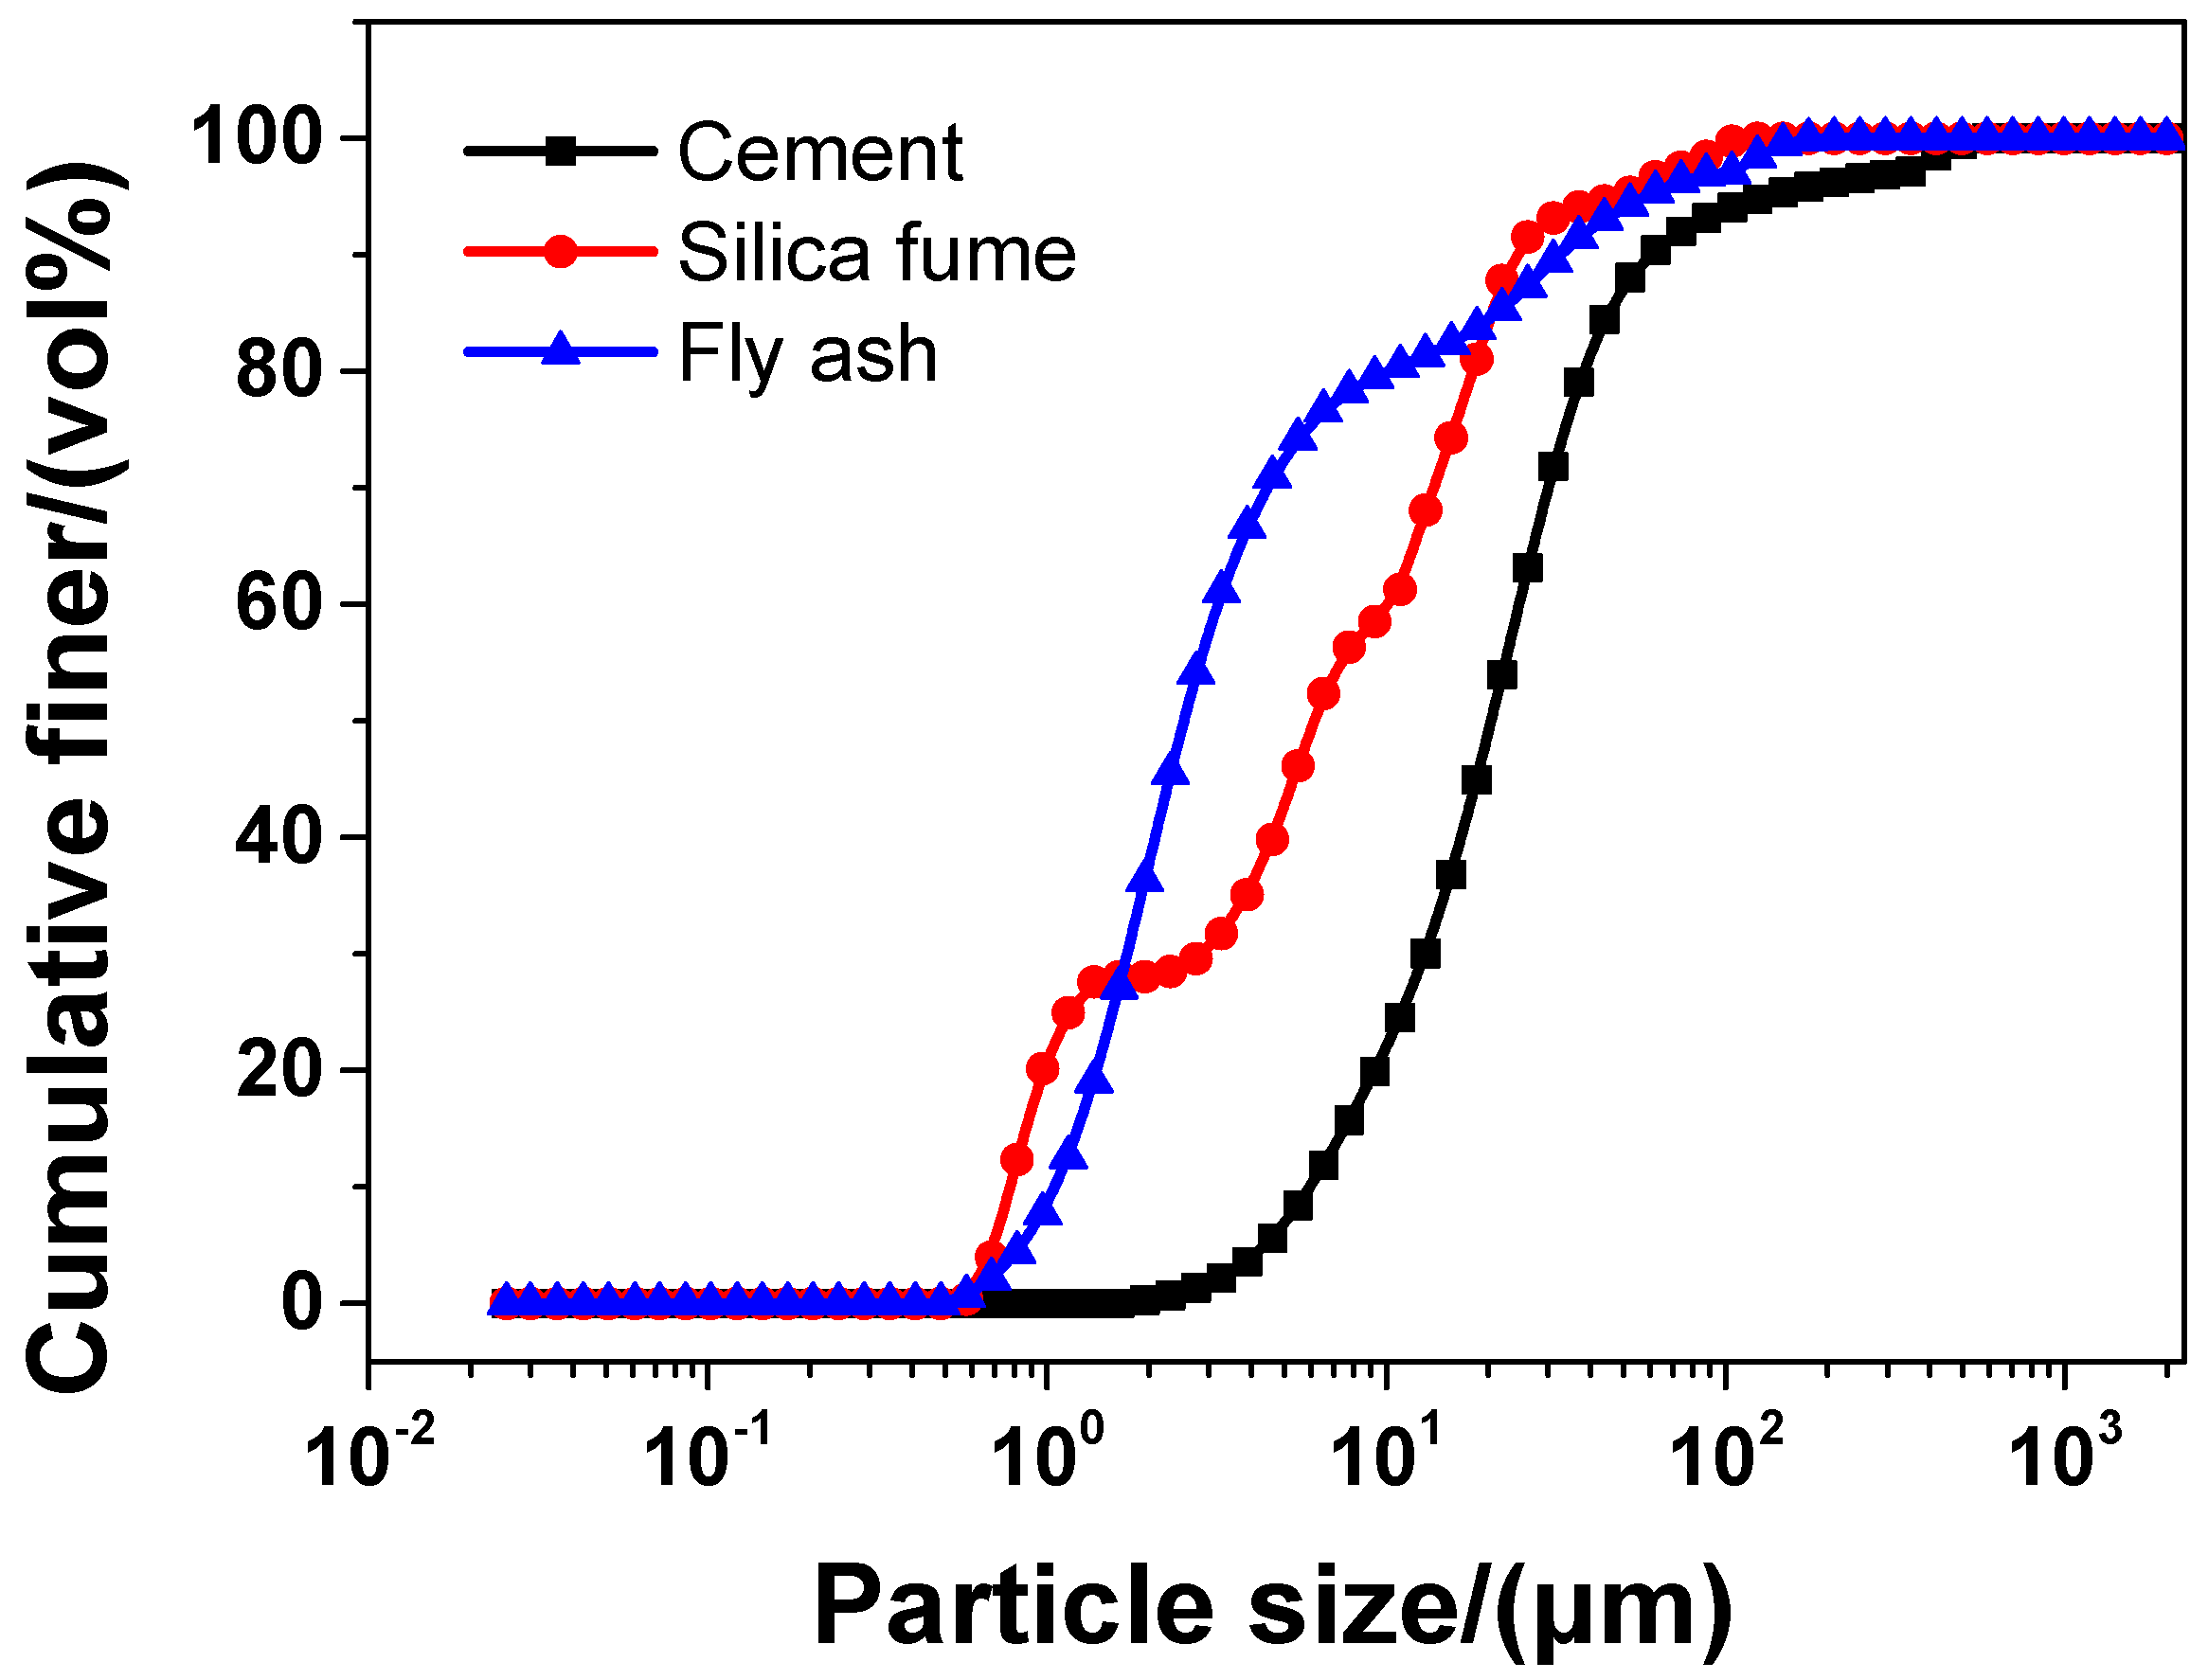
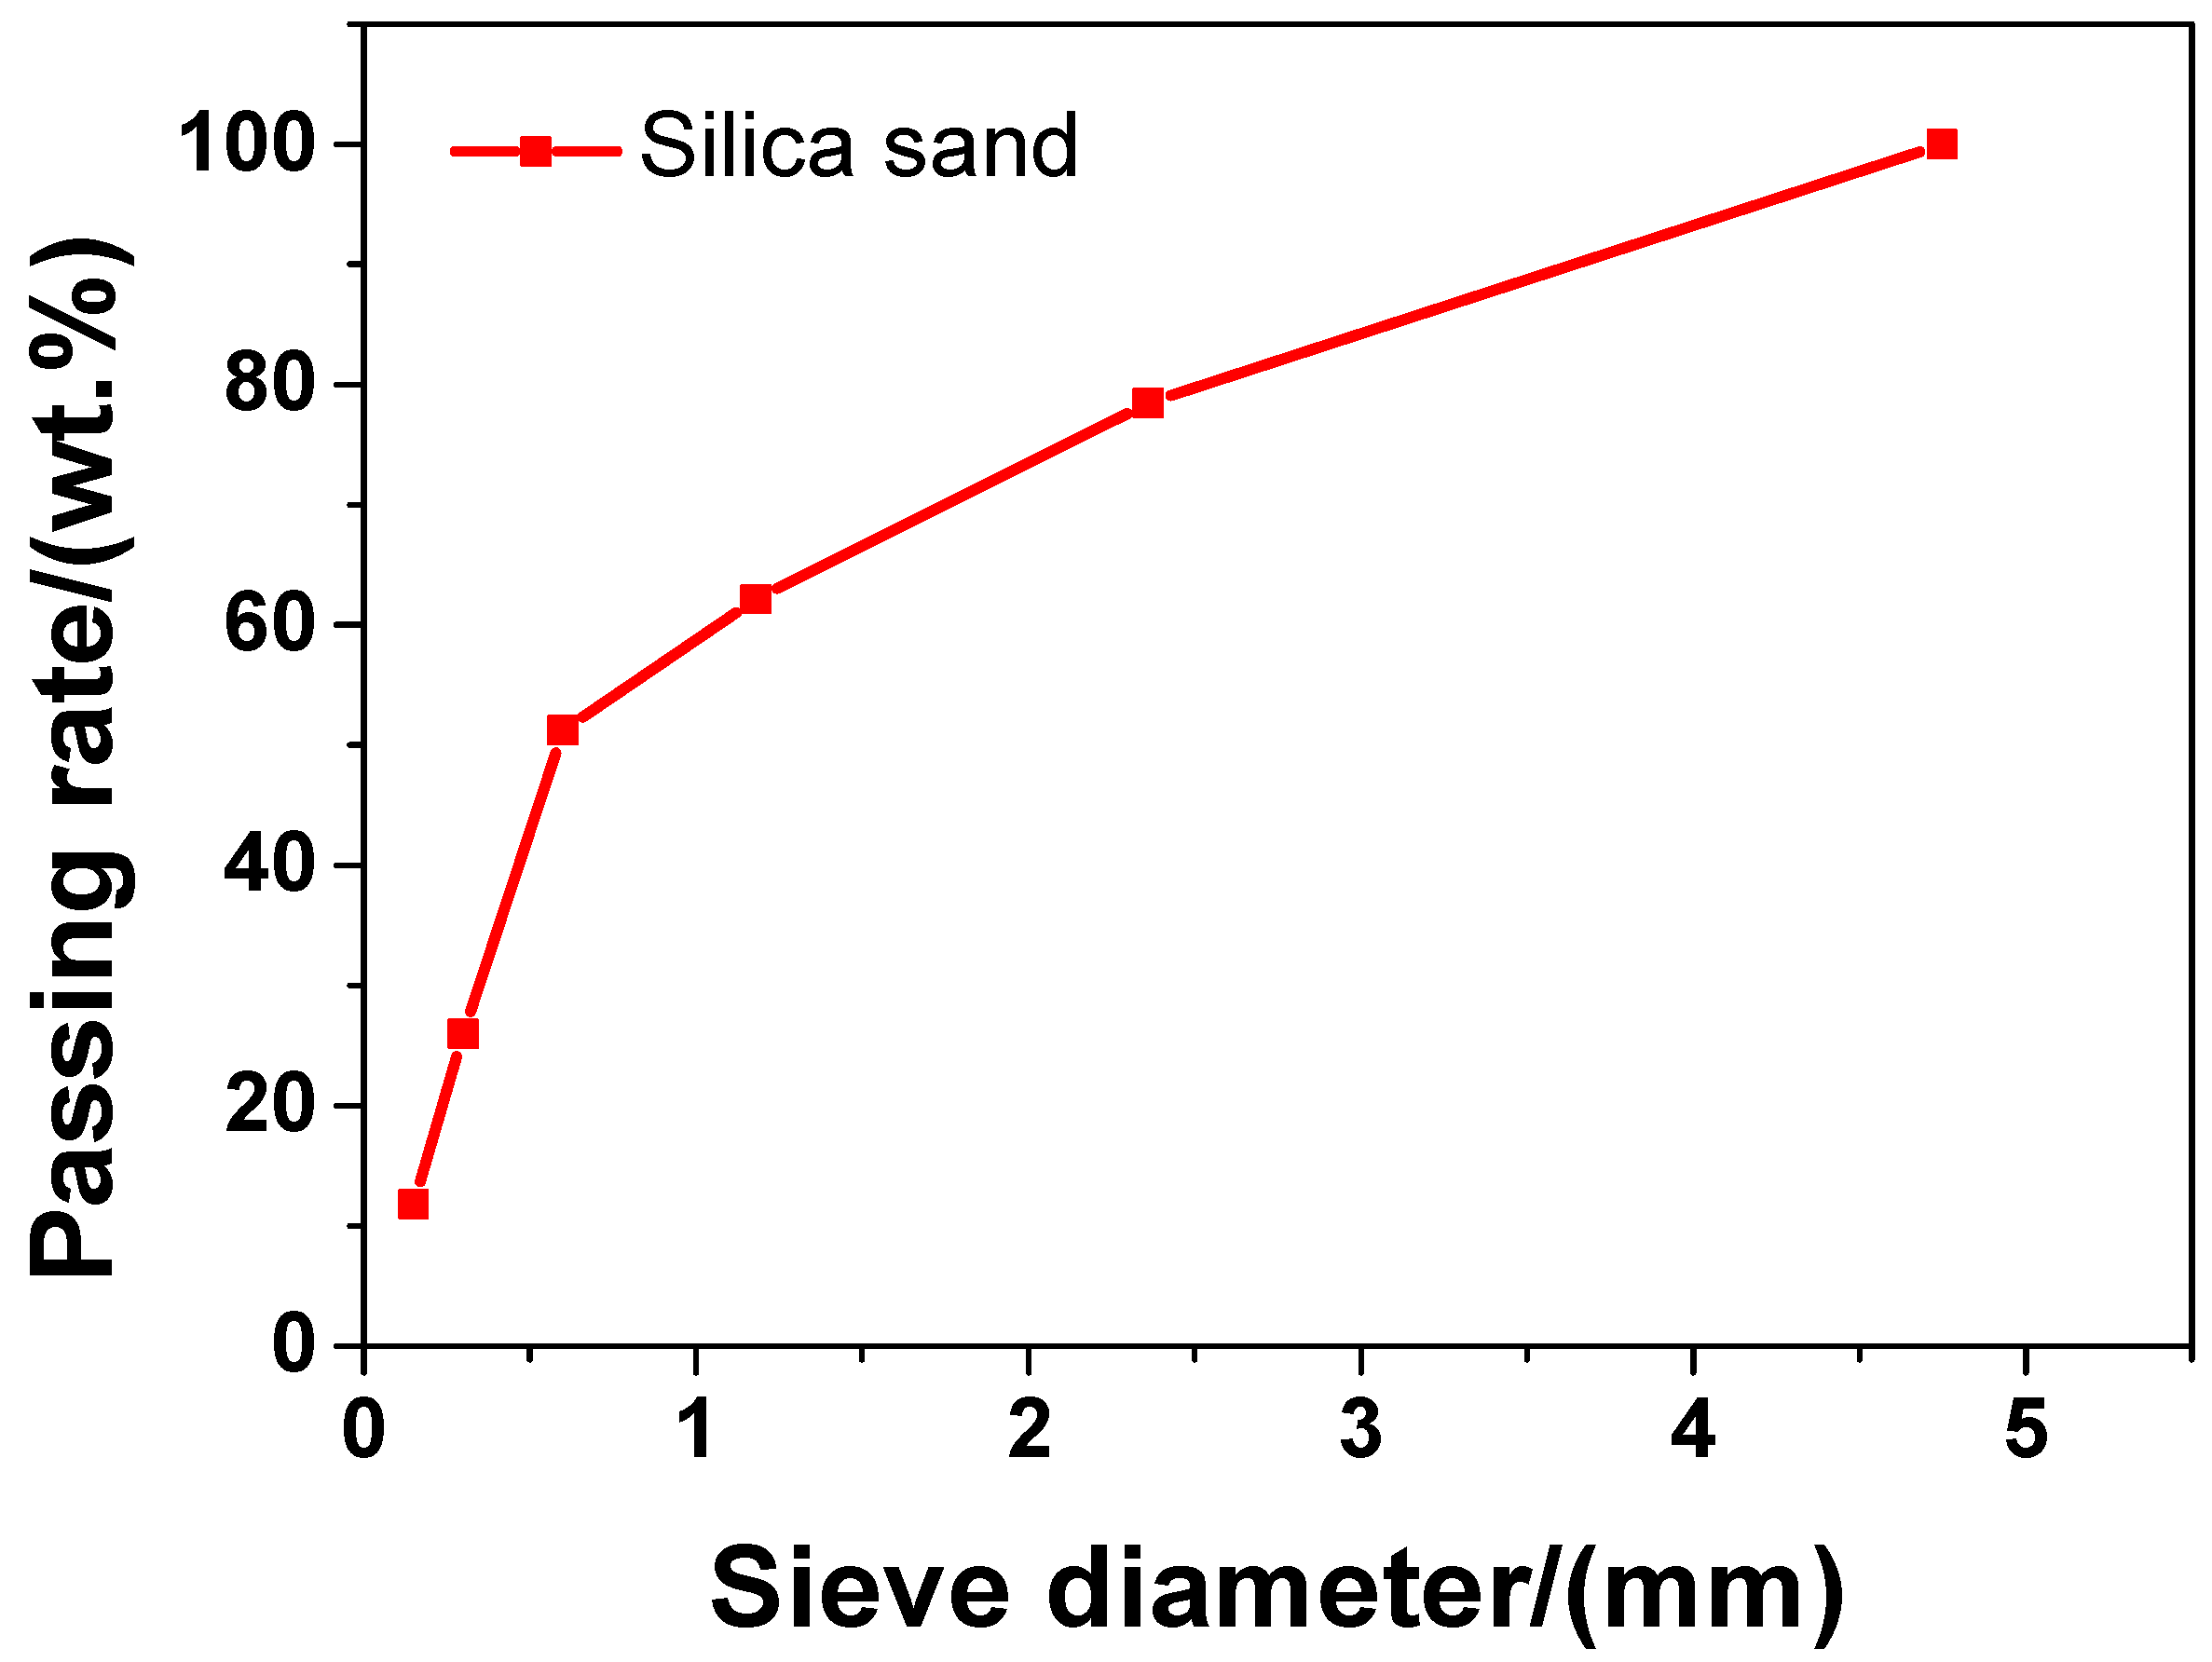
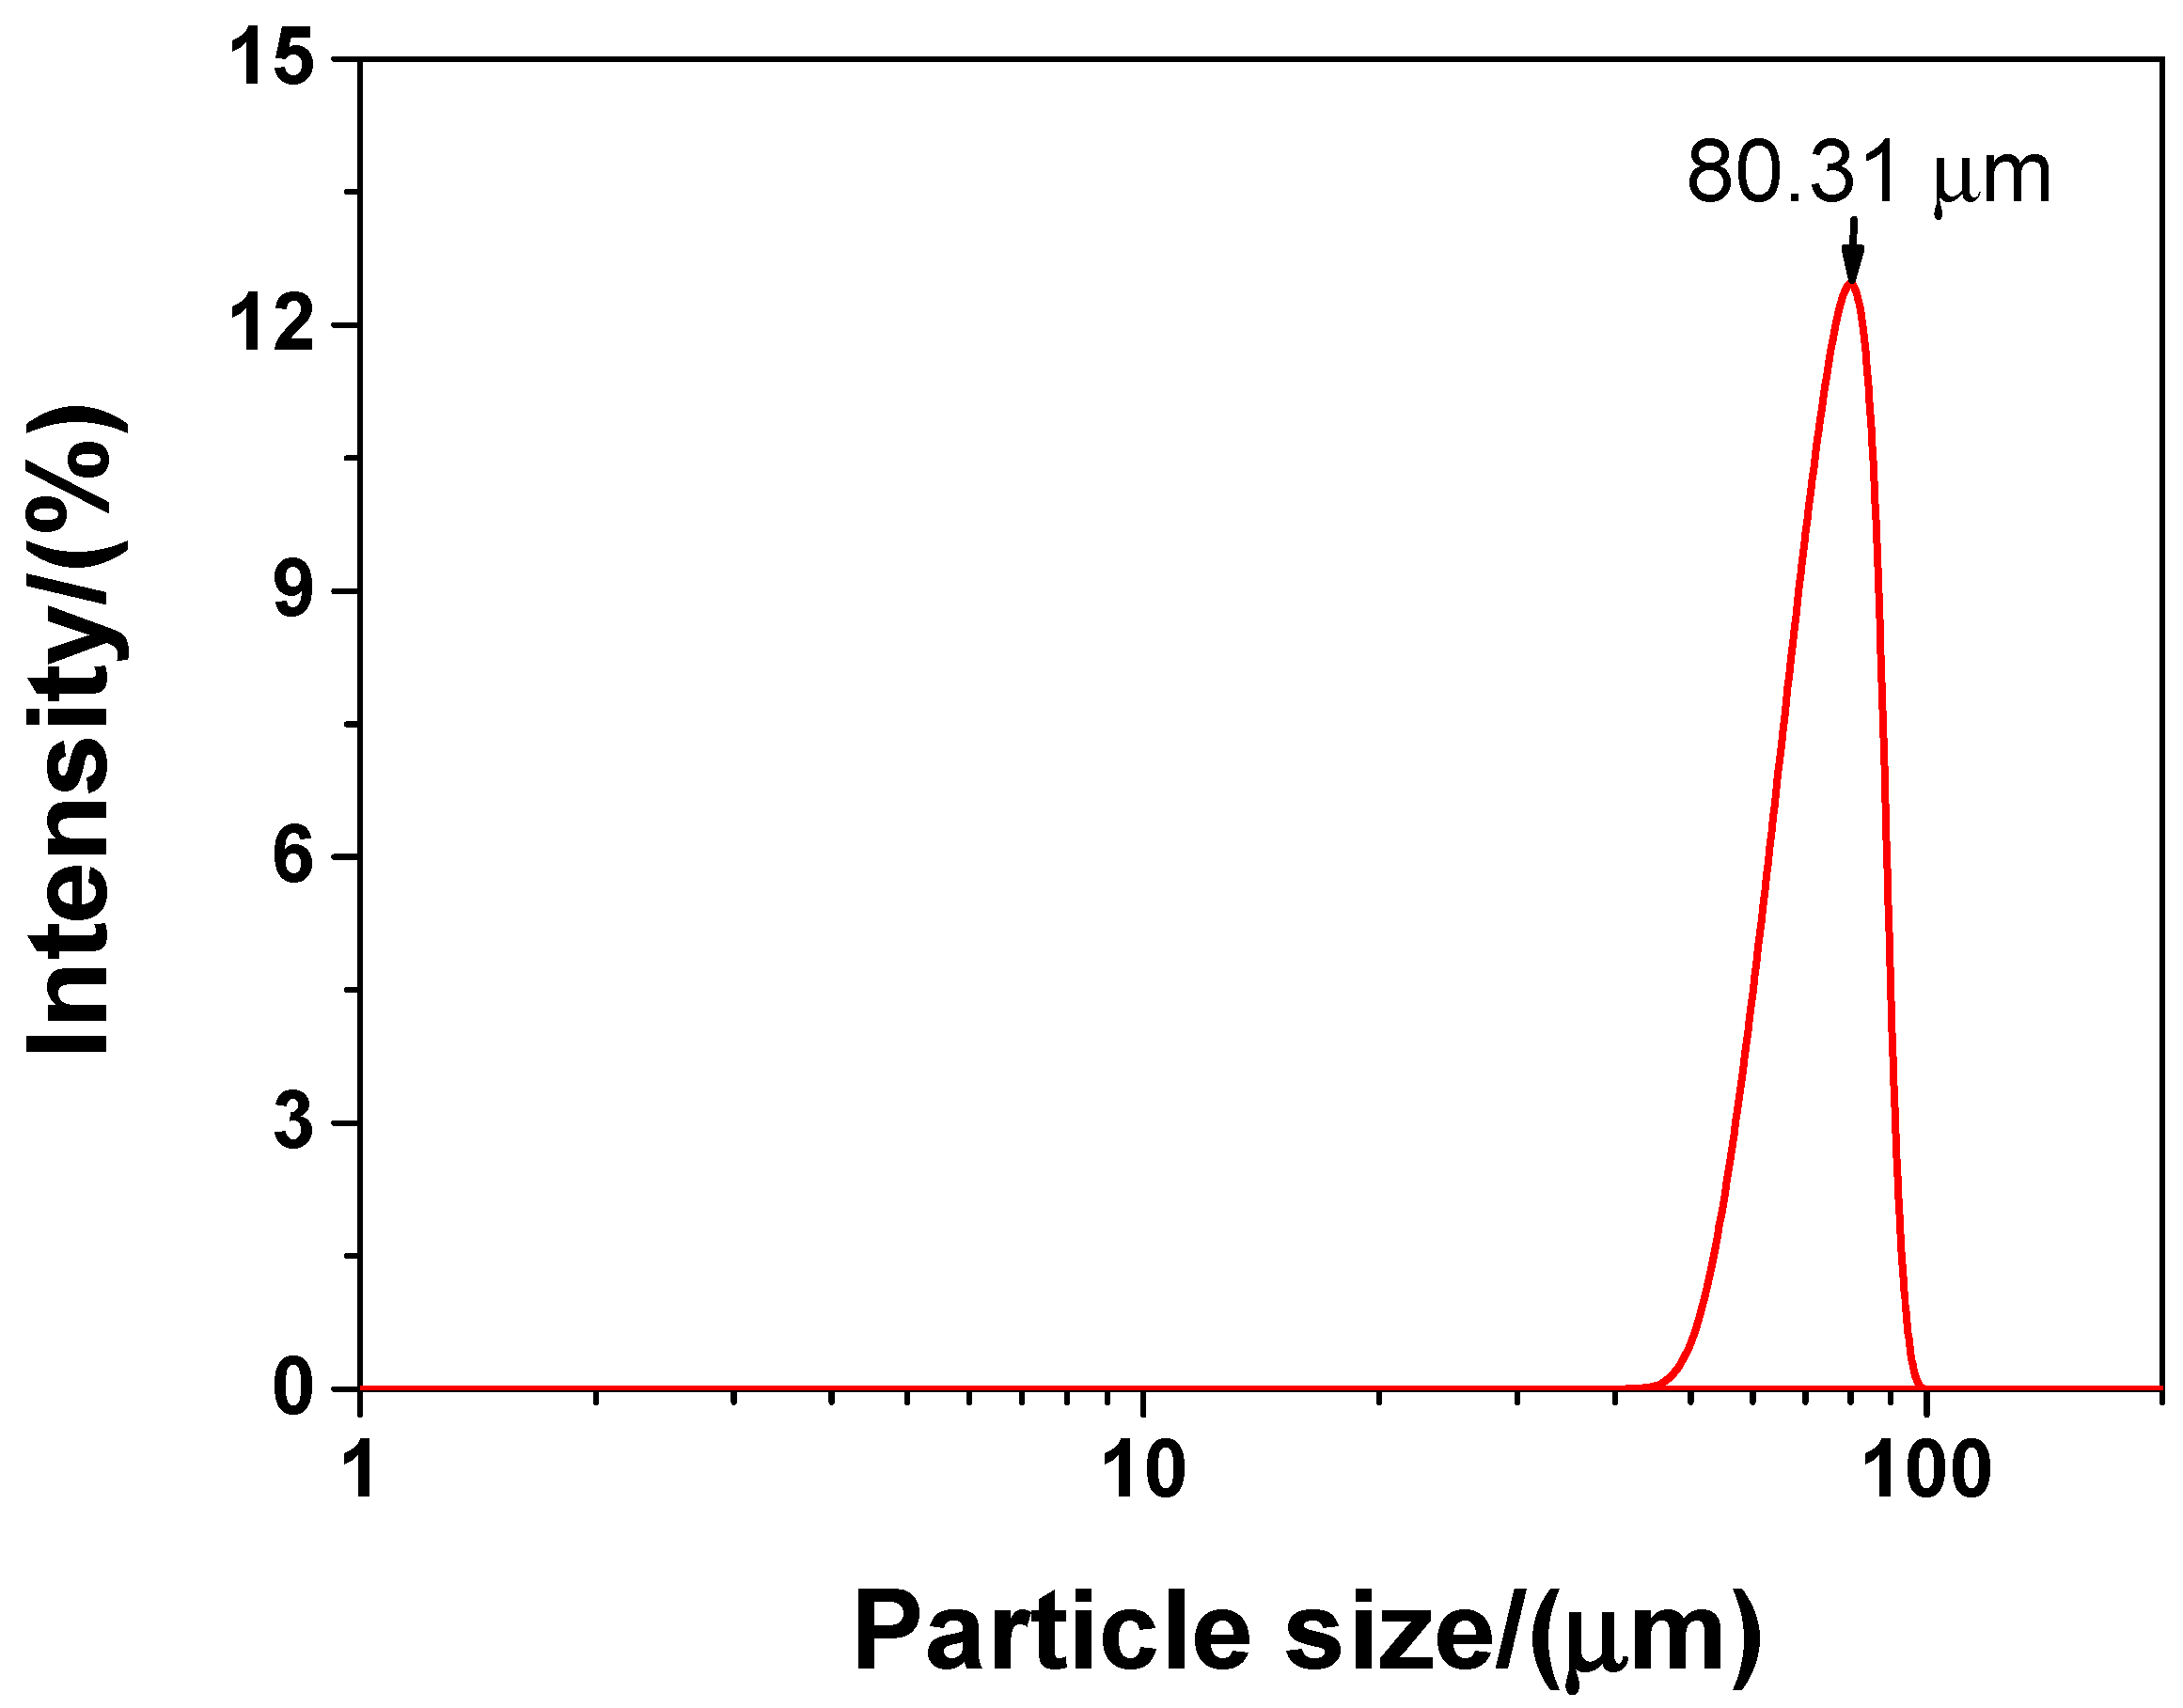
2.1. Materials
2.2. Specimen Preparation
2.3. Testing Methods
2.4. Molecular Dynamics Simulation
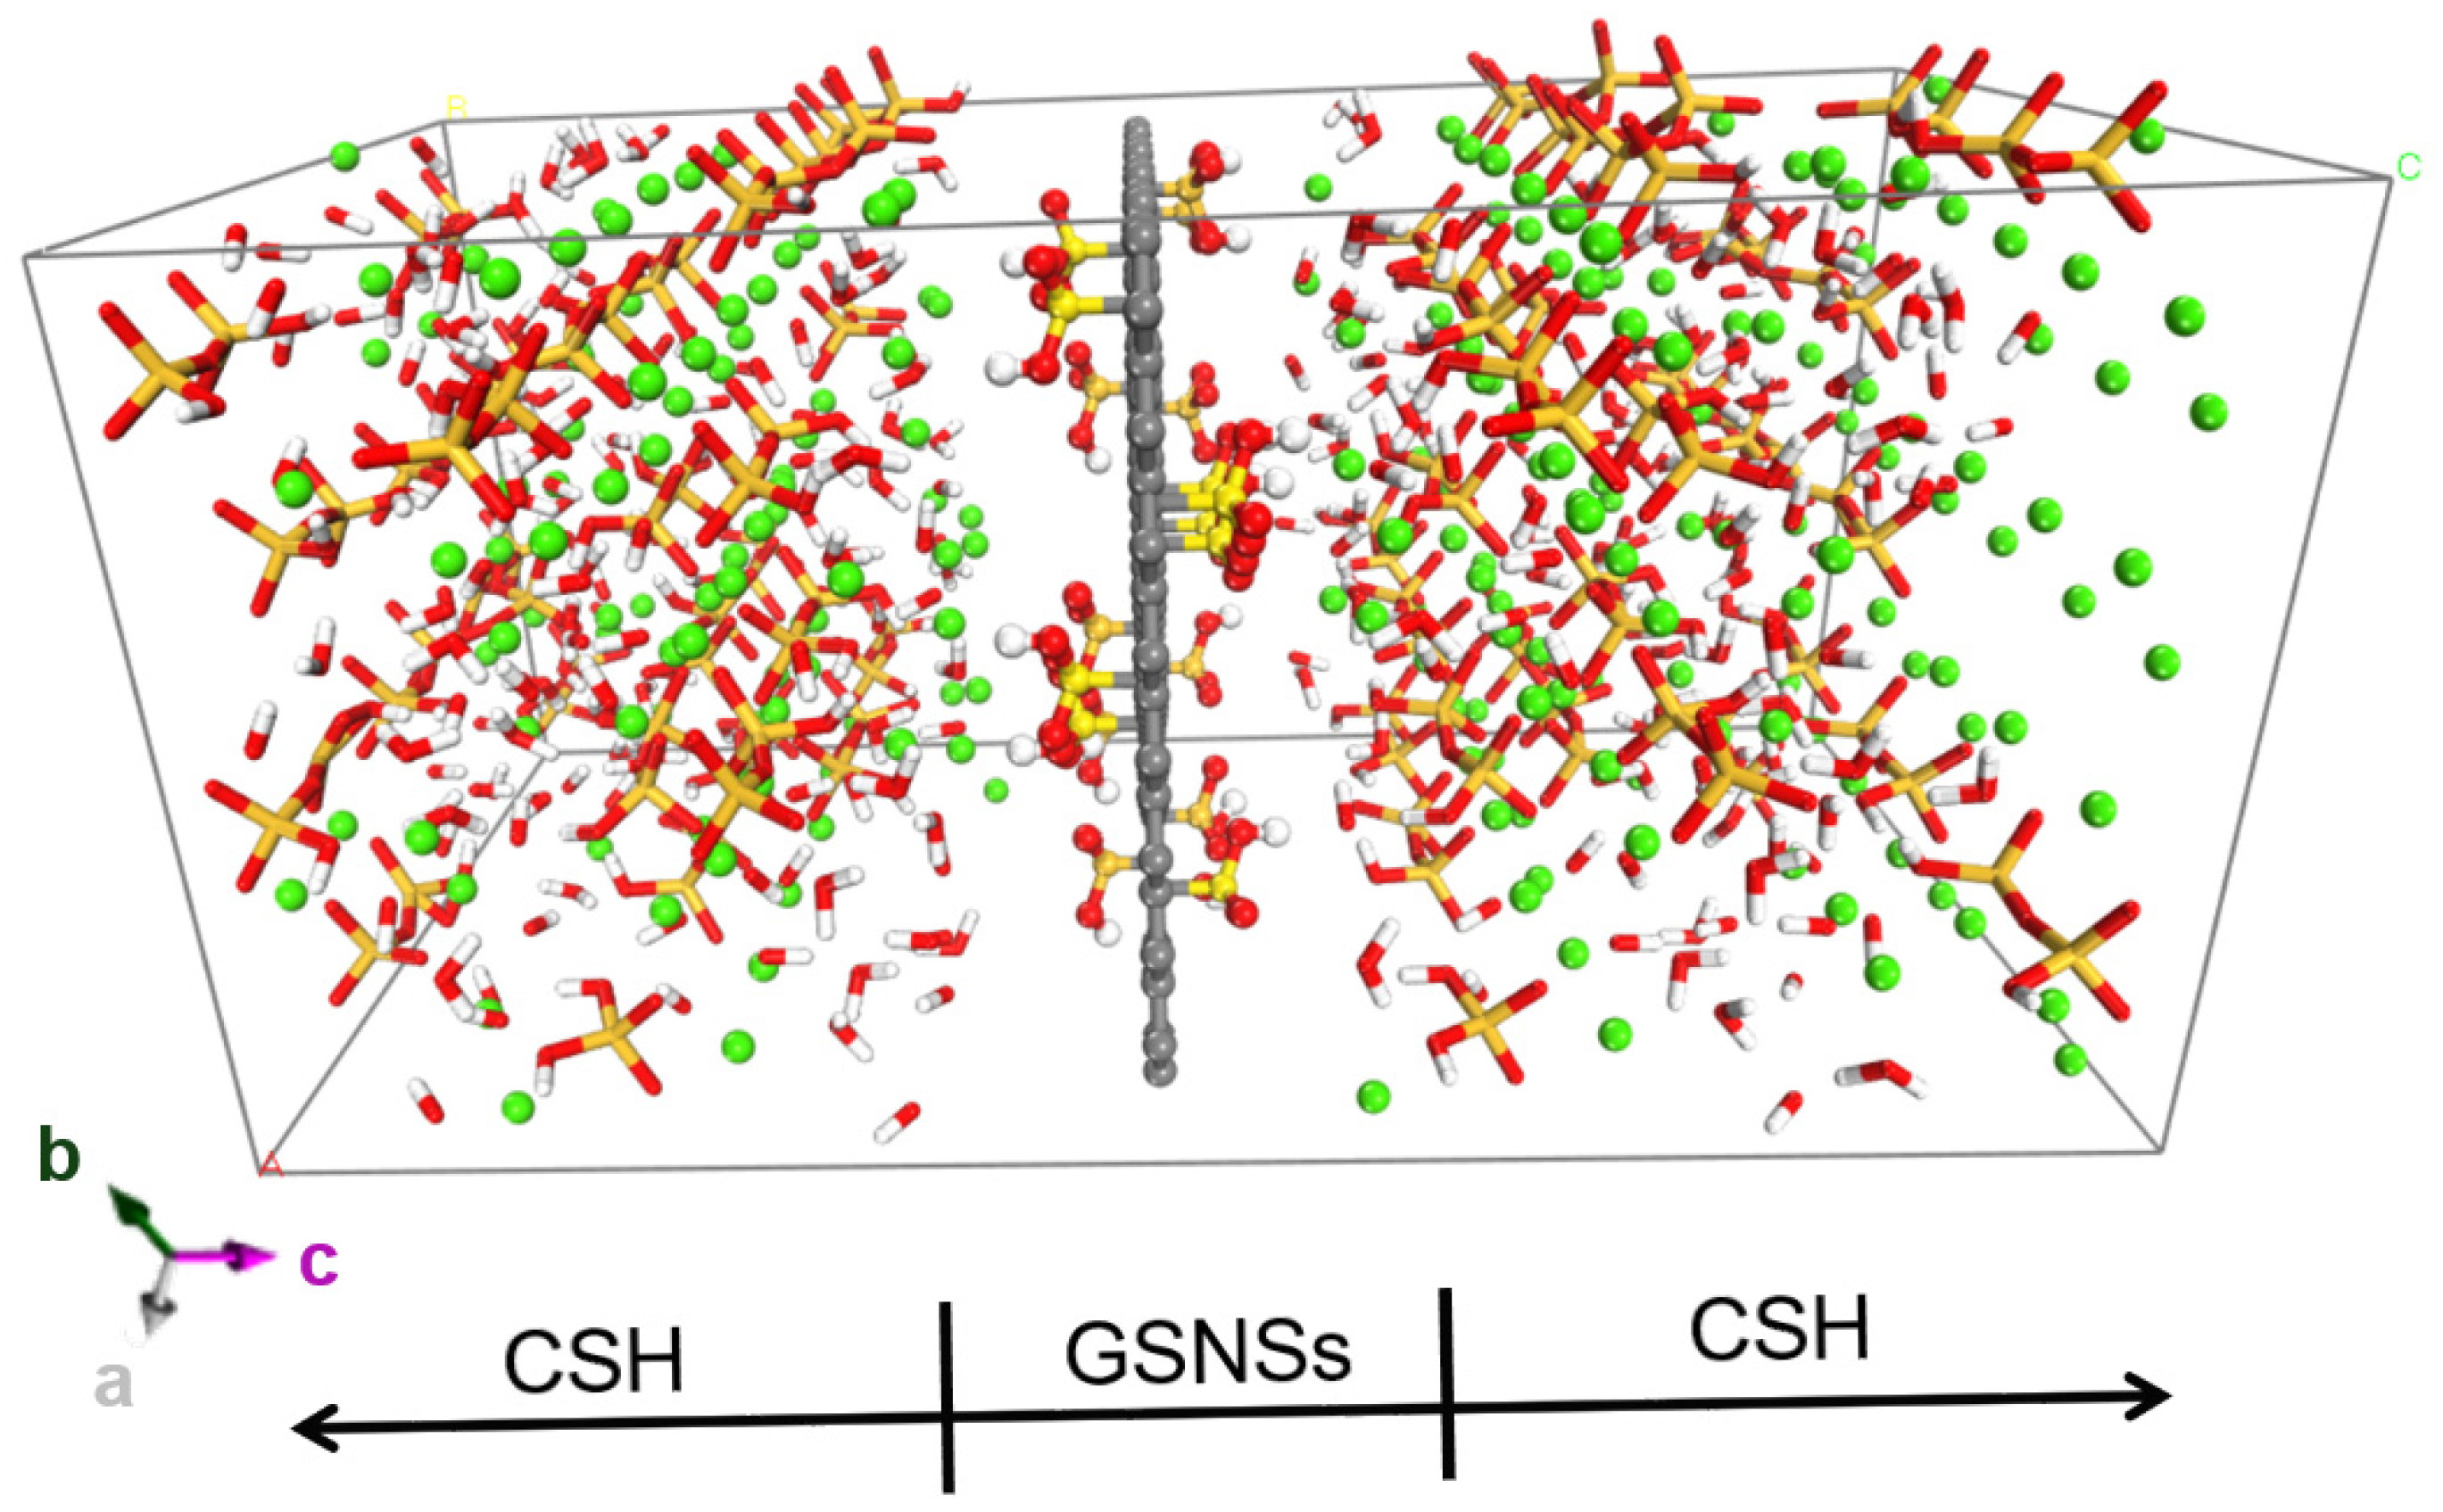
2.4.1. Construction of the Model
2.4.2. Computation Procedure
3. Results and Discussion
3.1. Mechanical Strength
3.1.1. Flexural Strength
3.1.2. Compressive Strength
3.2. Pore Structure
3.2.1. Porosity
3.2.2. Pore Size Distribution
3.3. Thermal Analysis
3.3.1. Thermo Gravimetric Analysis (TGA)
3.3.2. Differential Scanning Calorimetry (DSC)
3.4. Ablation Behaviour
3.5. Molecular Dynamics Investigation
4. Conclusions
- (1)
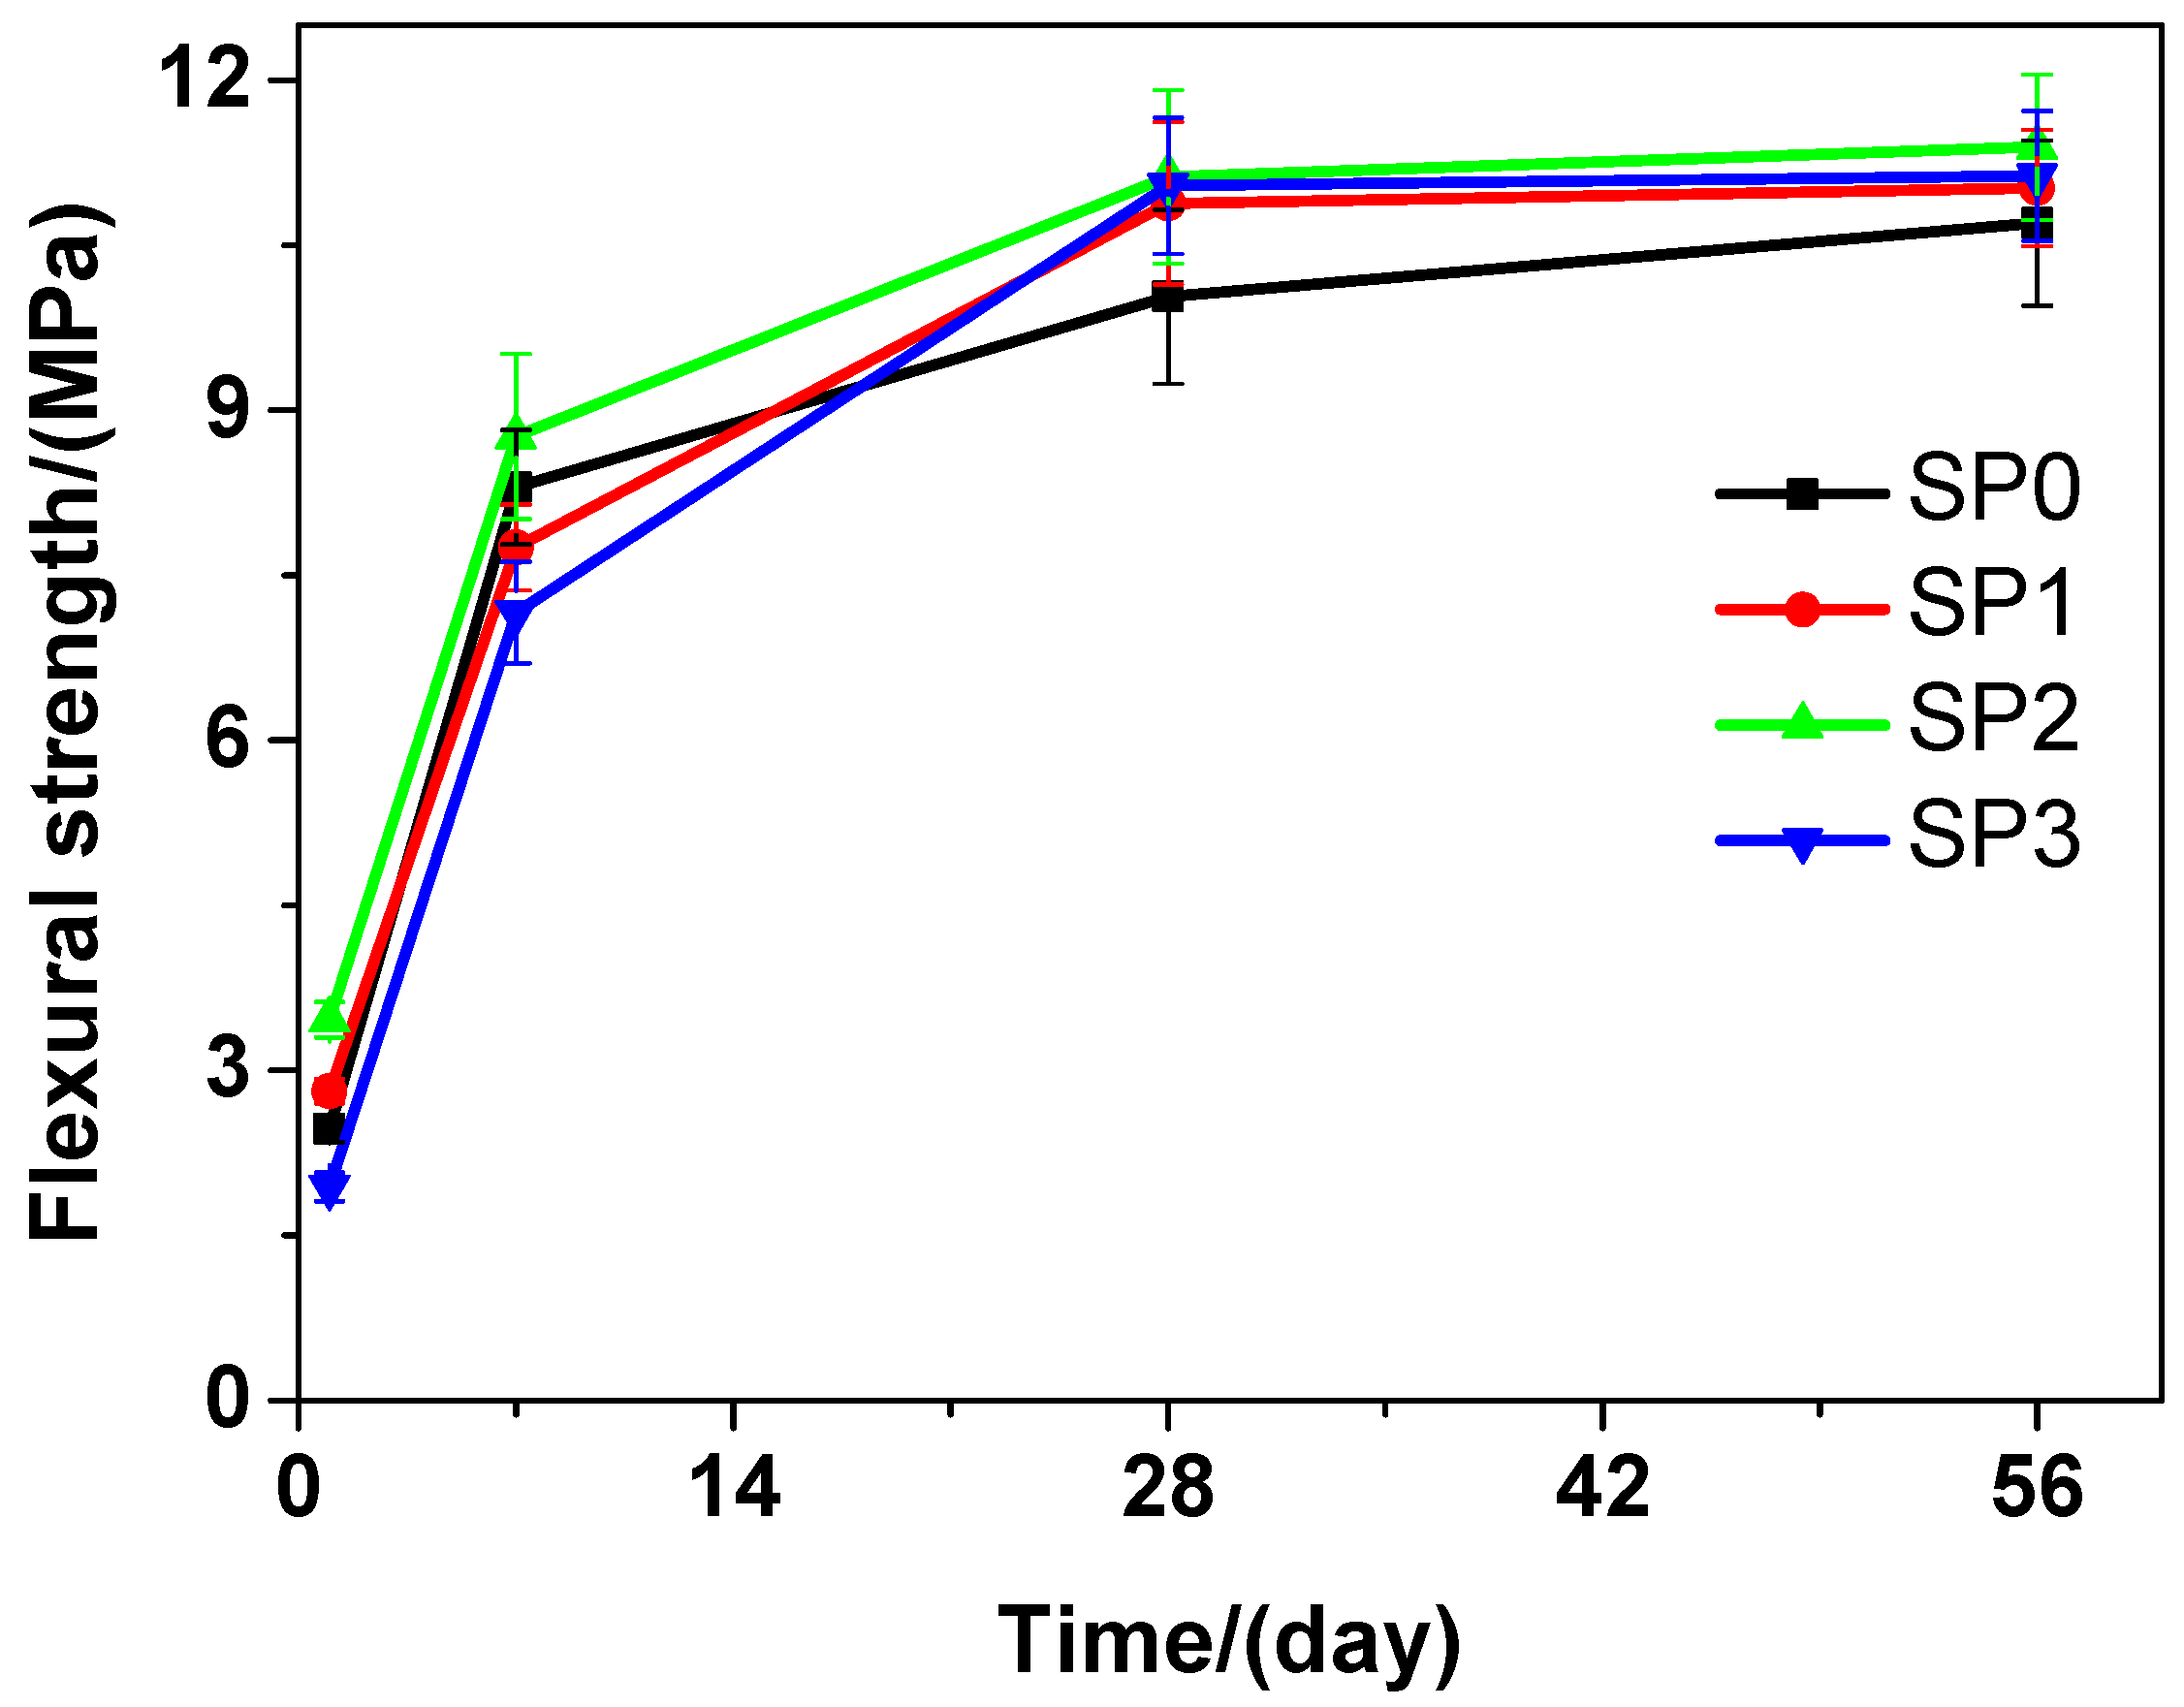
- The flexural strengths of SP0, SP1, SP2, and SP3 at the 28-day curing time are 10.03, 10.88, 11.12, and 11.04 MPa, respectively, suggesting an increase of 8.47%, 10.87%, and 10.07% in the flexural strength of the tested cement paste, when the contents of GSNSs are 0.03 wt.%, 0.1 wt.% and 0.3 wt.%, respectively.
- (2)
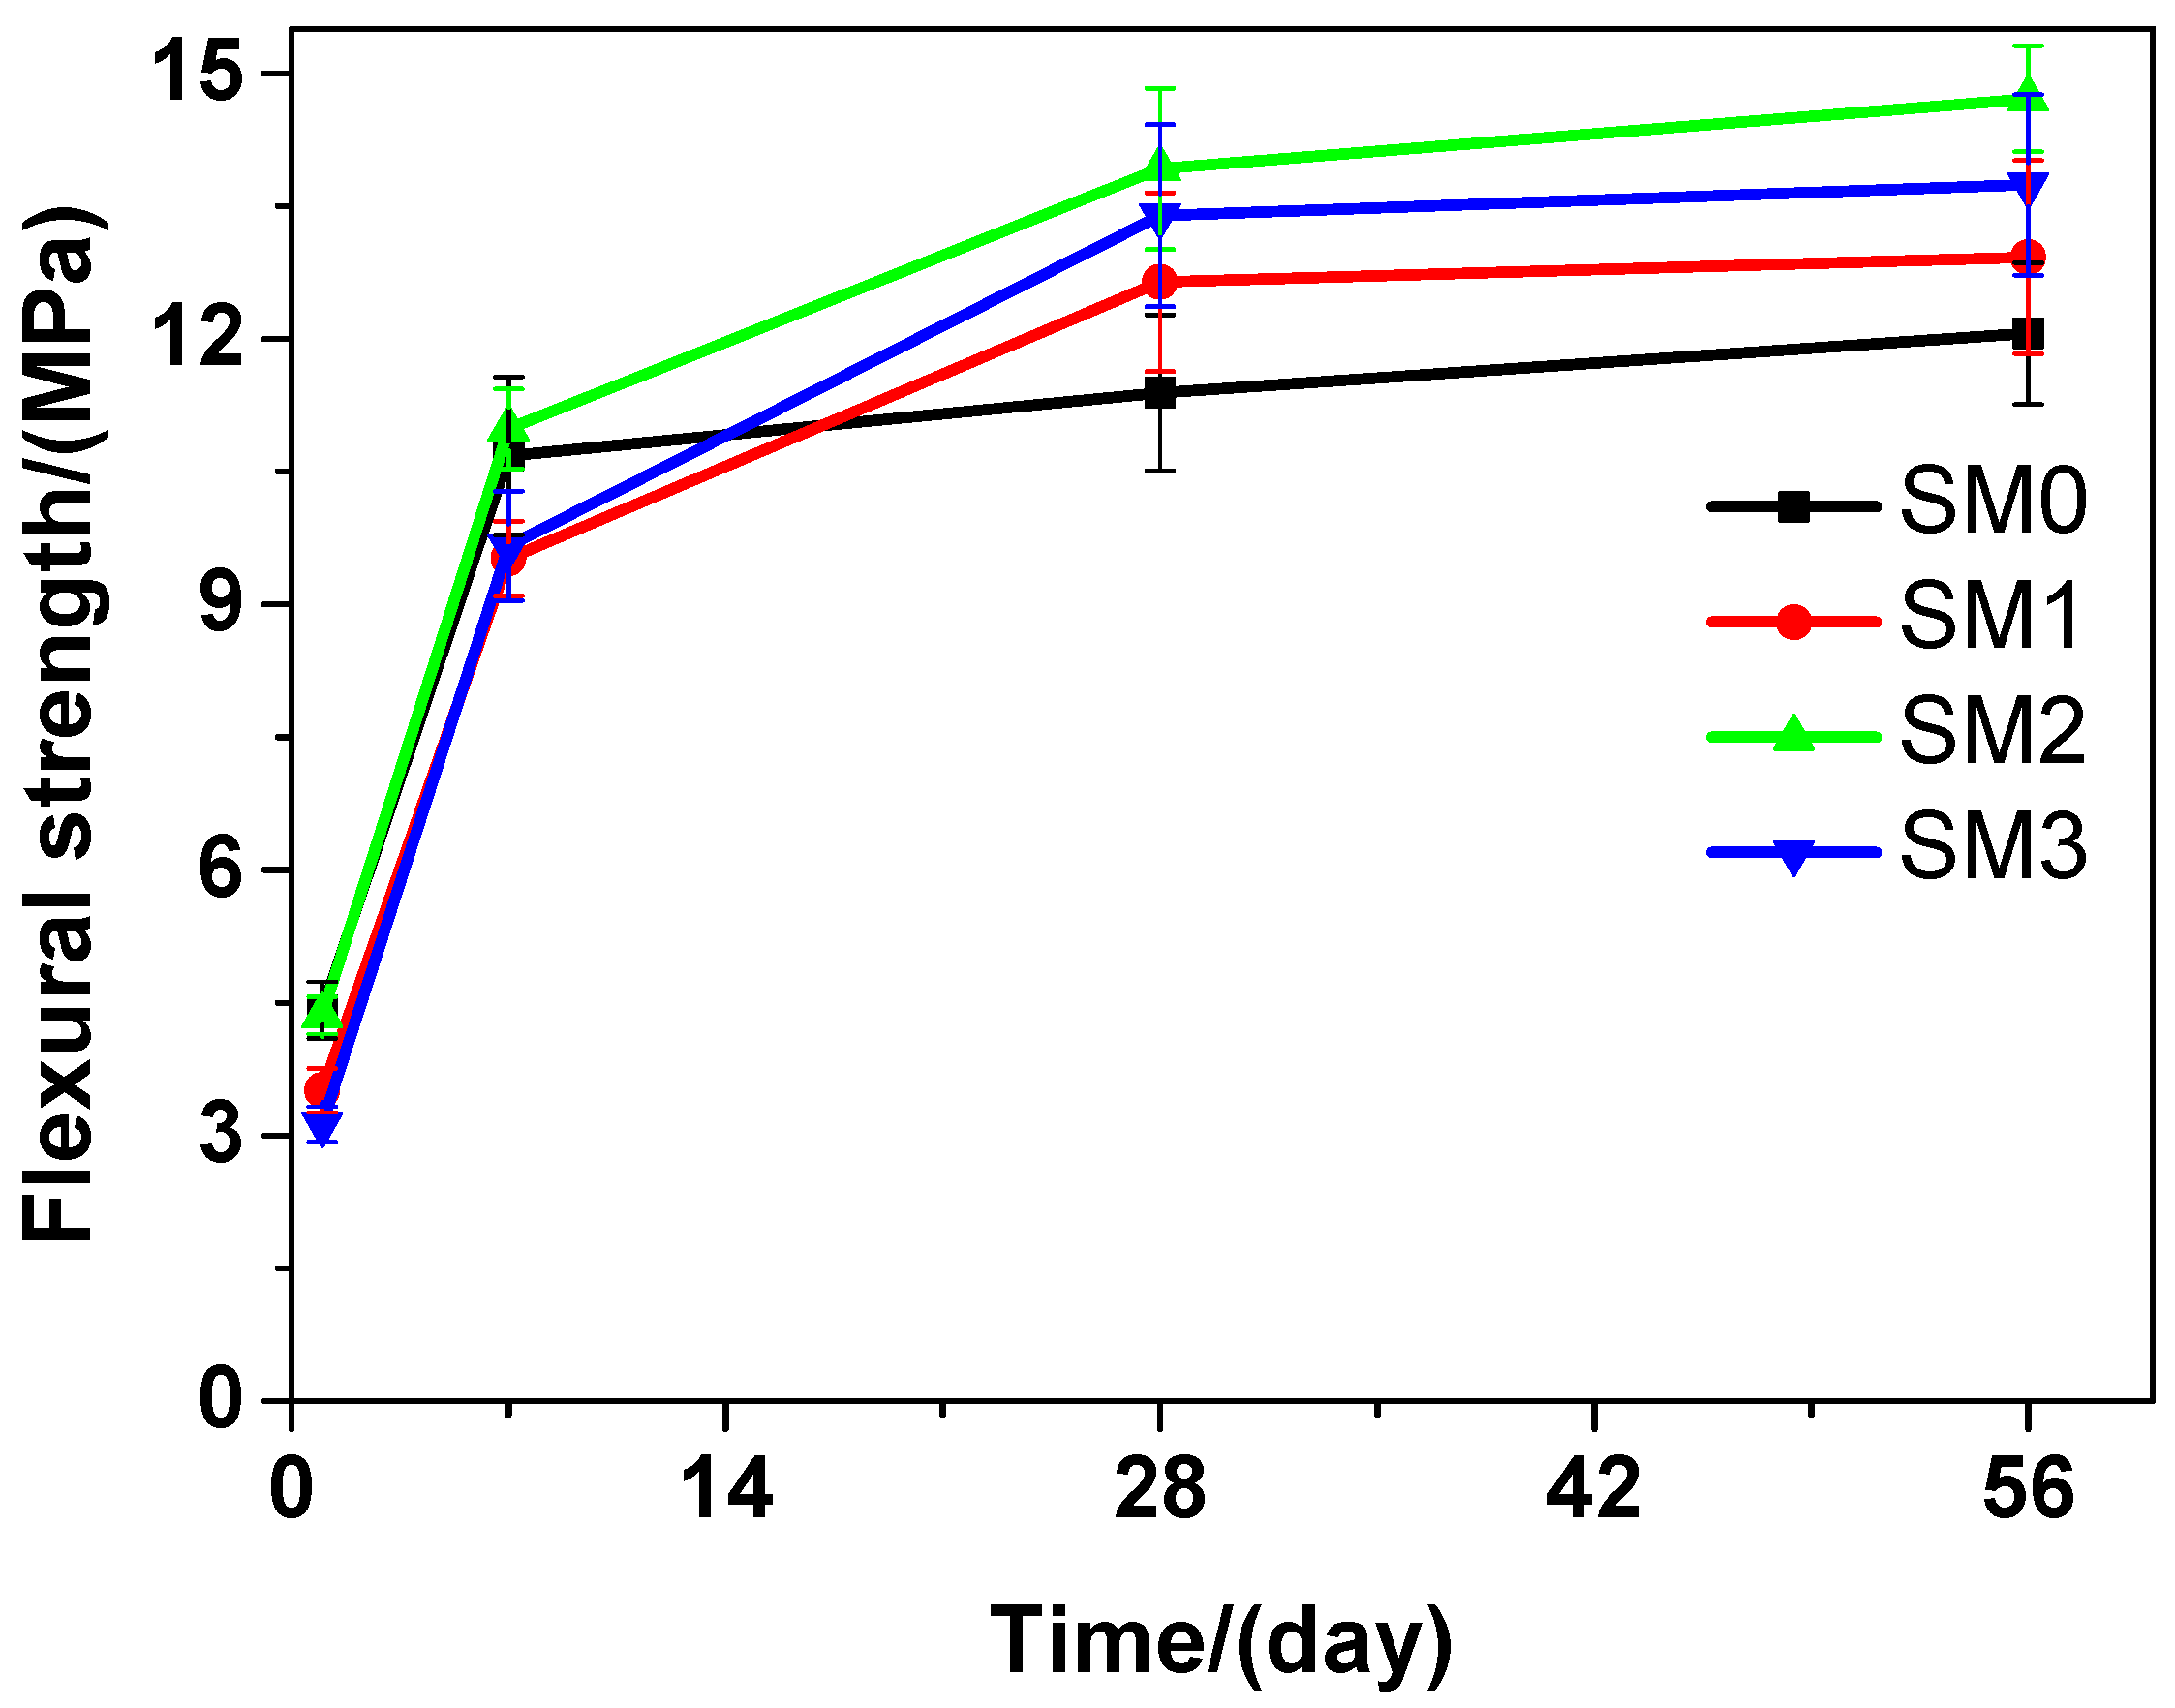
- At the 28-day curing time, the flexural strengths of SM0, SM1, SM2, and SM3 are 11.39, 12.64, 13.92, and 13.39 MPa, respectively, indicating an increase of 10.97%, 22.21%, and 17.56% in the flexural strength of the tested mortar, when the contents of GSNSs are 0.03 wt.%, 0.1 wt.% and 0.3 wt.%, respectively.
- (3)
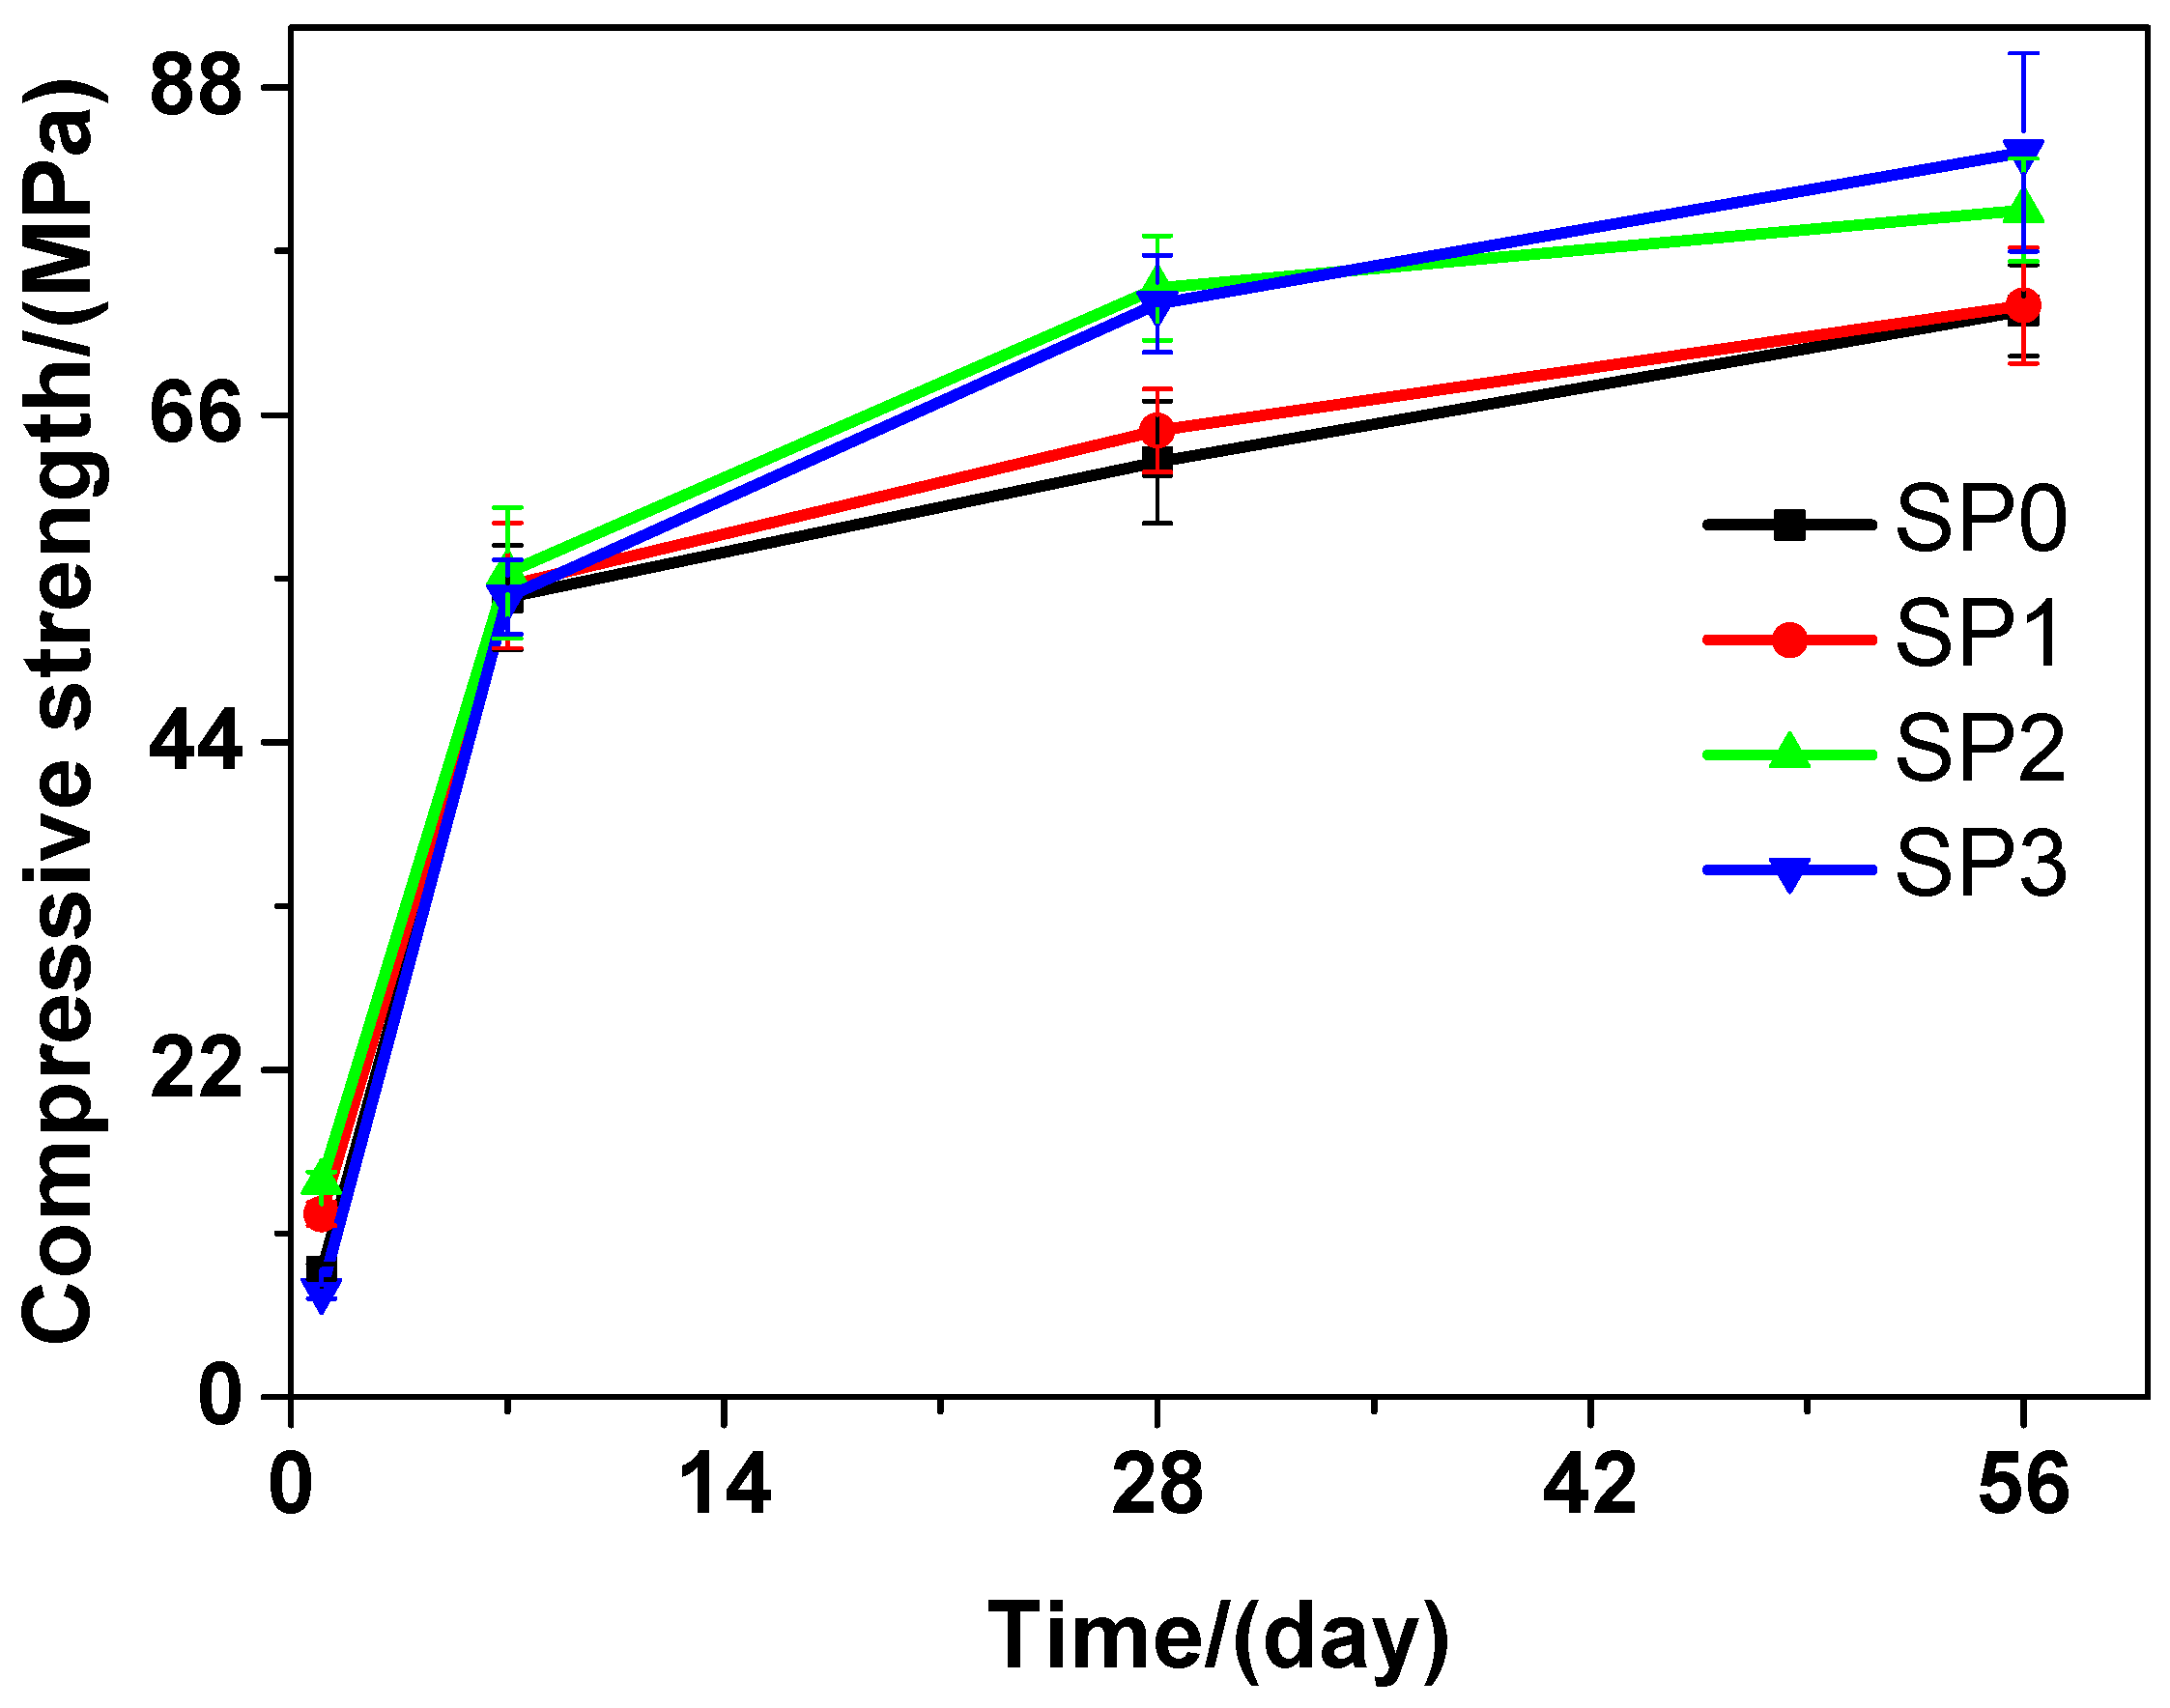
- The compressive strengths of SP0, SP1, SP2, and SP3 at the 28-day curing time are 62.81, 64.93, 74.52, and 73.46 MPa, respectively, suggesting an increase of 3.38%, 18.64%, and 16.96% in the compressive strength of the tested cement paste, when the contents of GSNSs are 0.03 wt.%, 0.1 wt.% and 0.3 wt.%, respectively.
- (4)
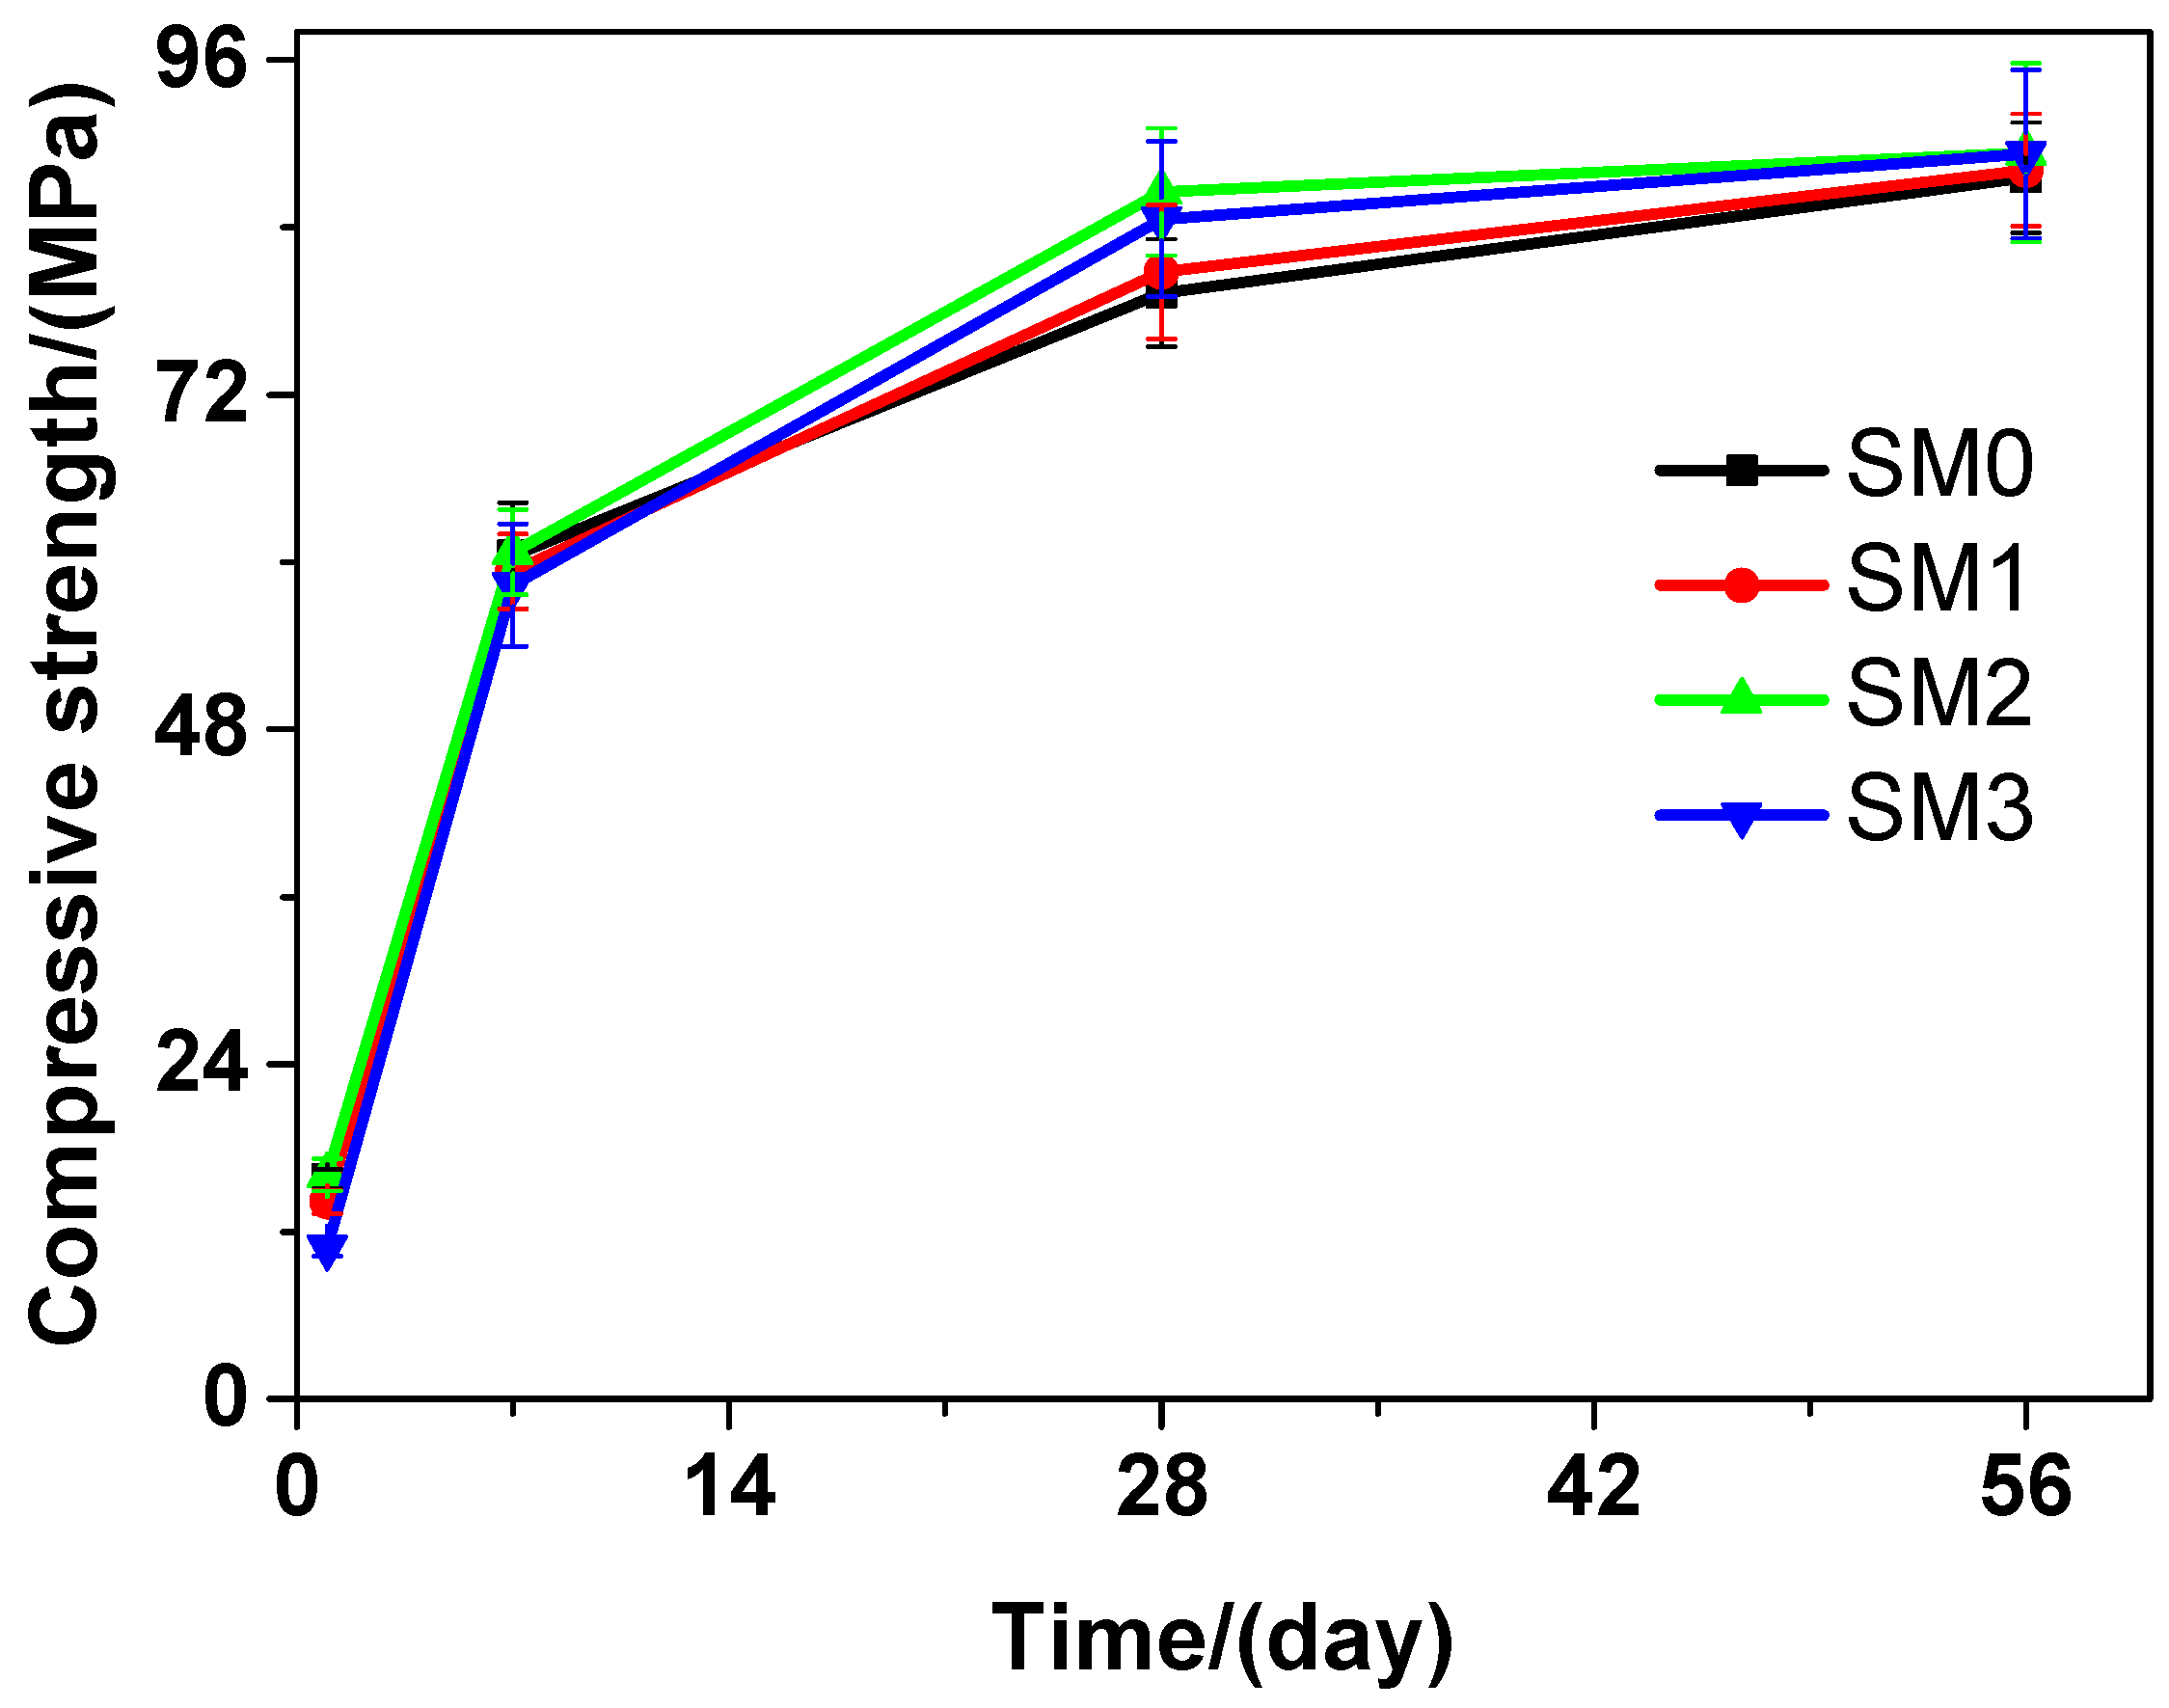
- The compressive strengths of SM0, SM1, SM2, and SM3 at the 28-day curing time are 79.28, 80.80, 86.54, and 84.59 MPa, respectively, suggesting an increase of 1.92%, 9.16%, and 6.70% in the compressive strength of the tested mortar, when the contents of GSNSs are 0.03 wt.%, 0.1 wt.% and 0.3 wt.%, respectively.
- (5)
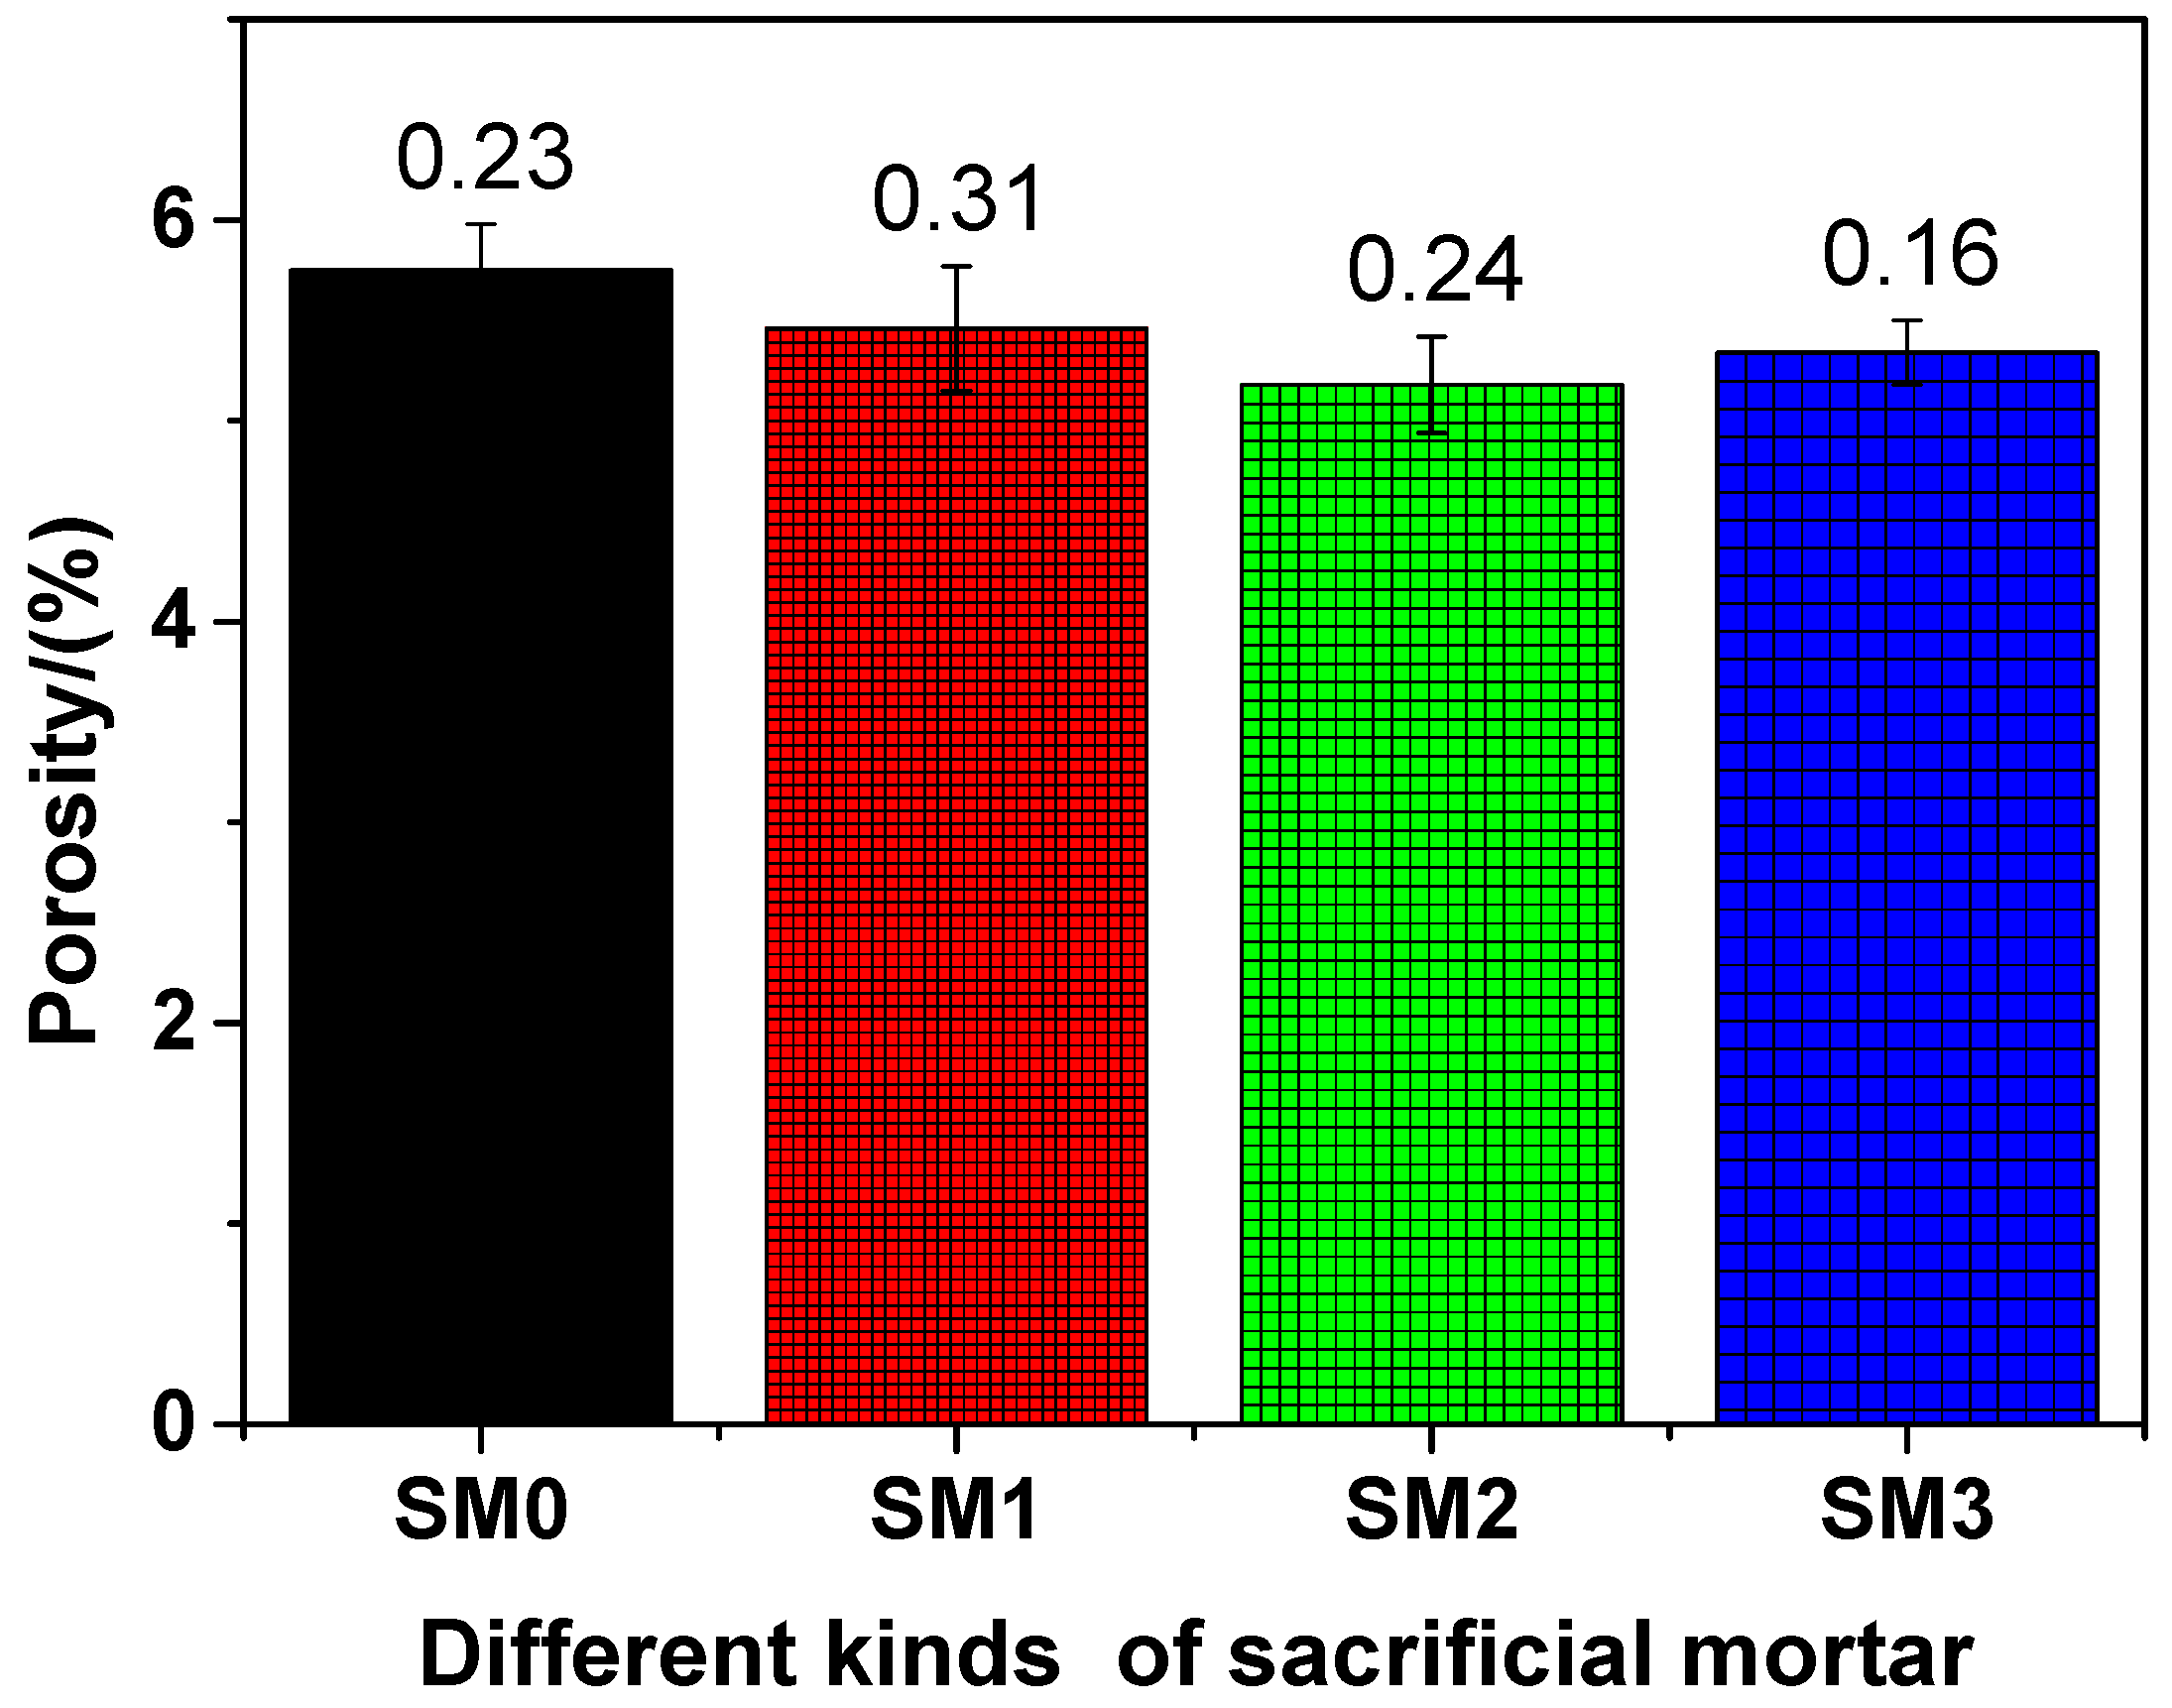
- The porosities of SM0, SM1, SM2, and SM3 at the 28-days curing time are 5.75%, 5.46%, 5.18%, and 5.34, respectively, suggesting a decline of 5.04%, 9.91%, and 7.13% in the porosities of siliceous sacrificial mortar, when the contents of GSNSs are 0.03 wt.%, 0.1 wt.% and 0.3 wt.%, respectively.
- (6)
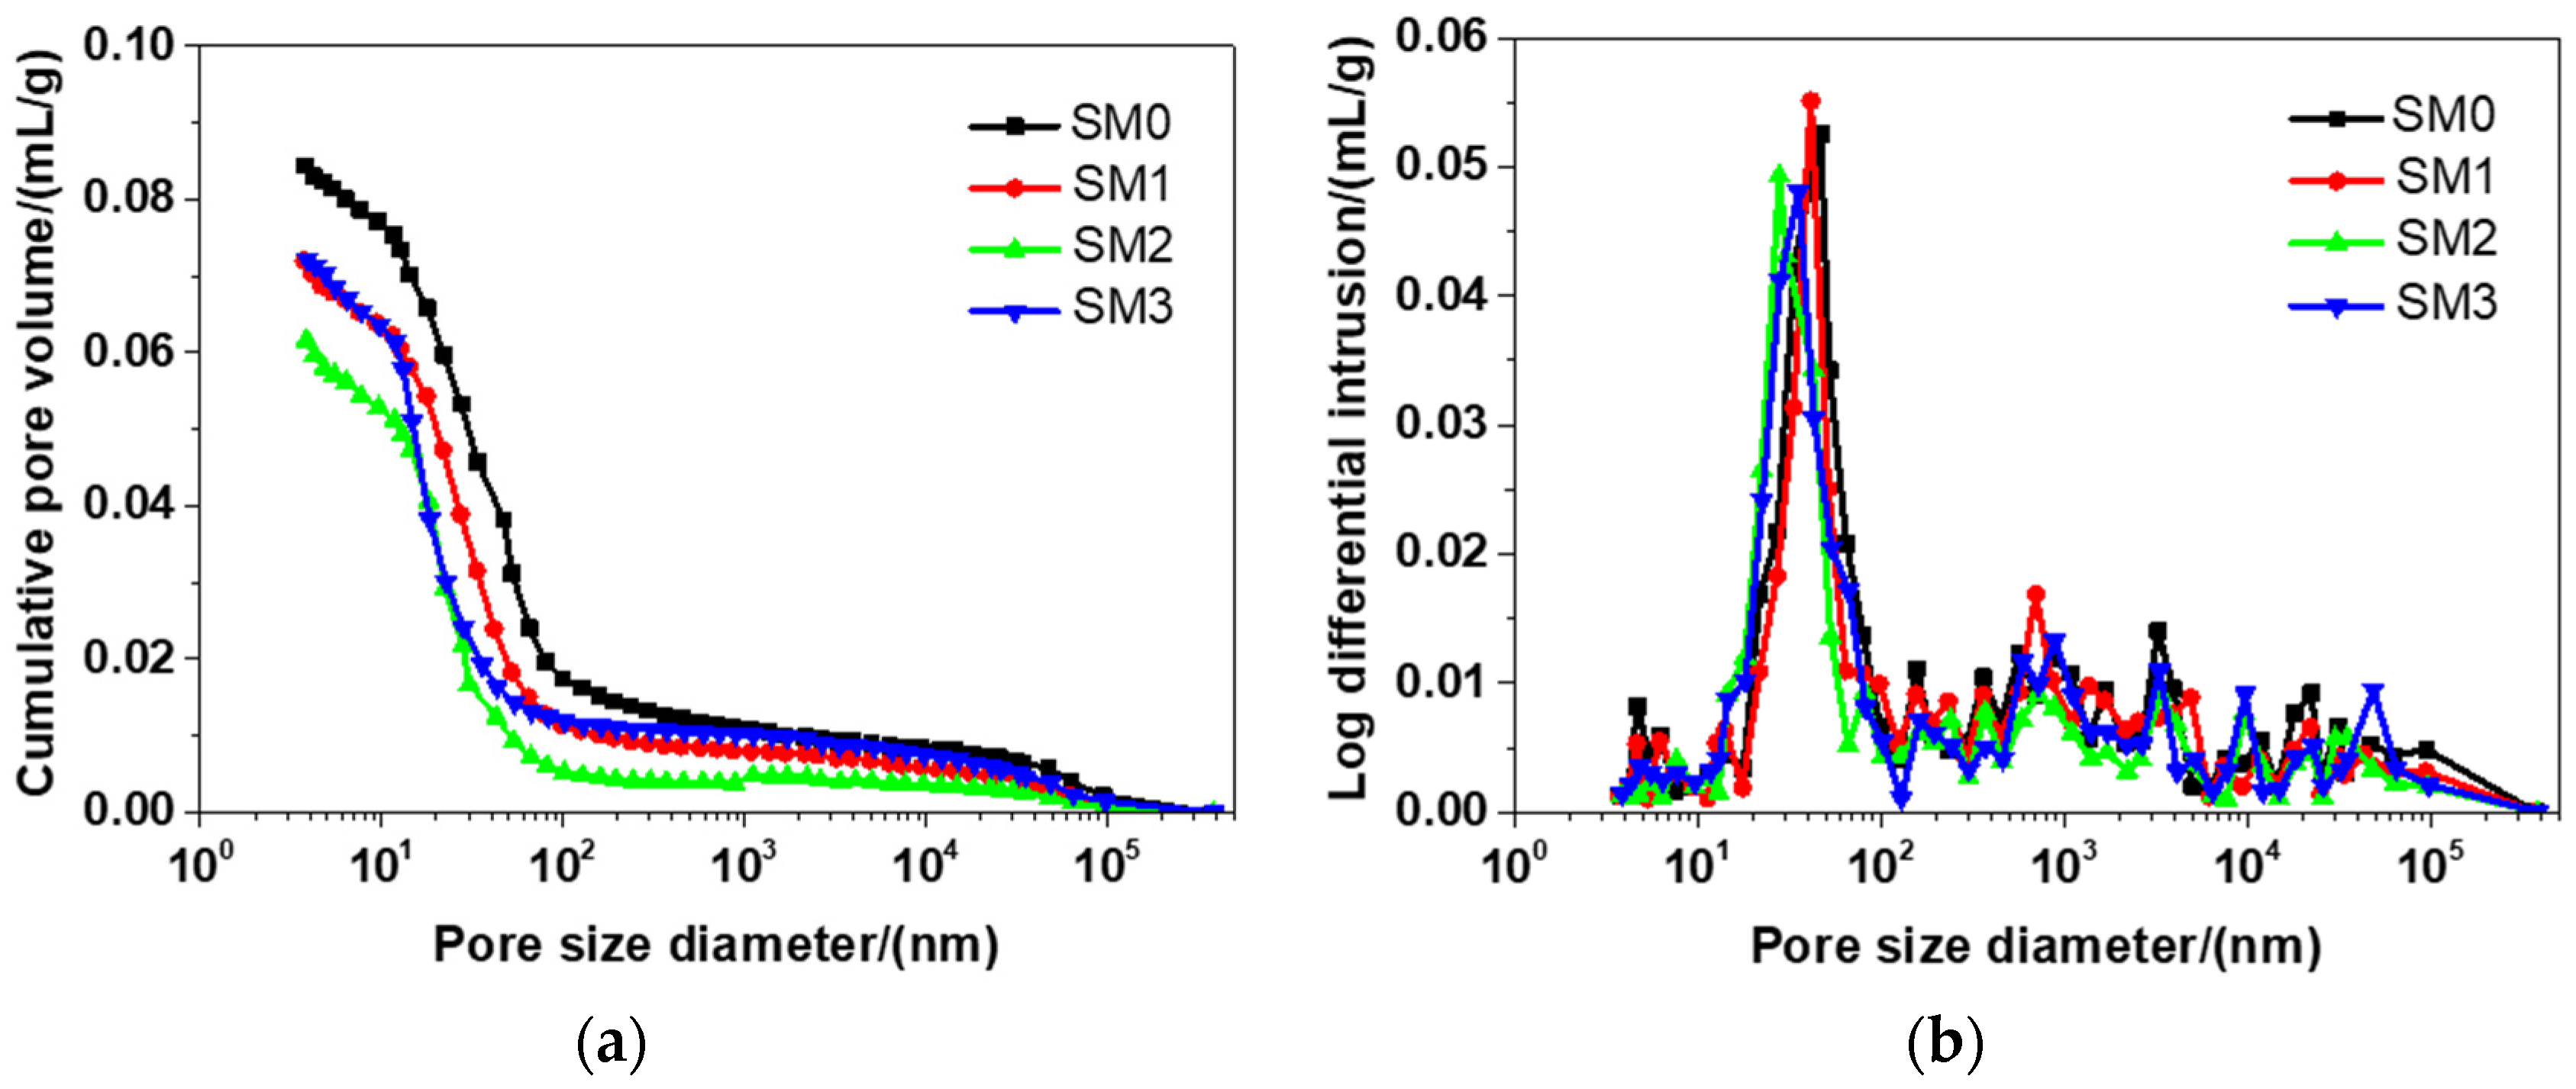
- The threshold pore diameters of SM0, SM1, SM2, SM3 are 46.91, 41.49, 30.31, and 35.64 nm, respectively, suggesting a decline of 13.06%, 35.39%, and 24.02% in the threshold pore diameters of siliceous sacrificial mortar, when the contents of GSNSs are 0.03 wt.%, 0.1 wt.% and 0.3 wt.%, respectively.
- (7)
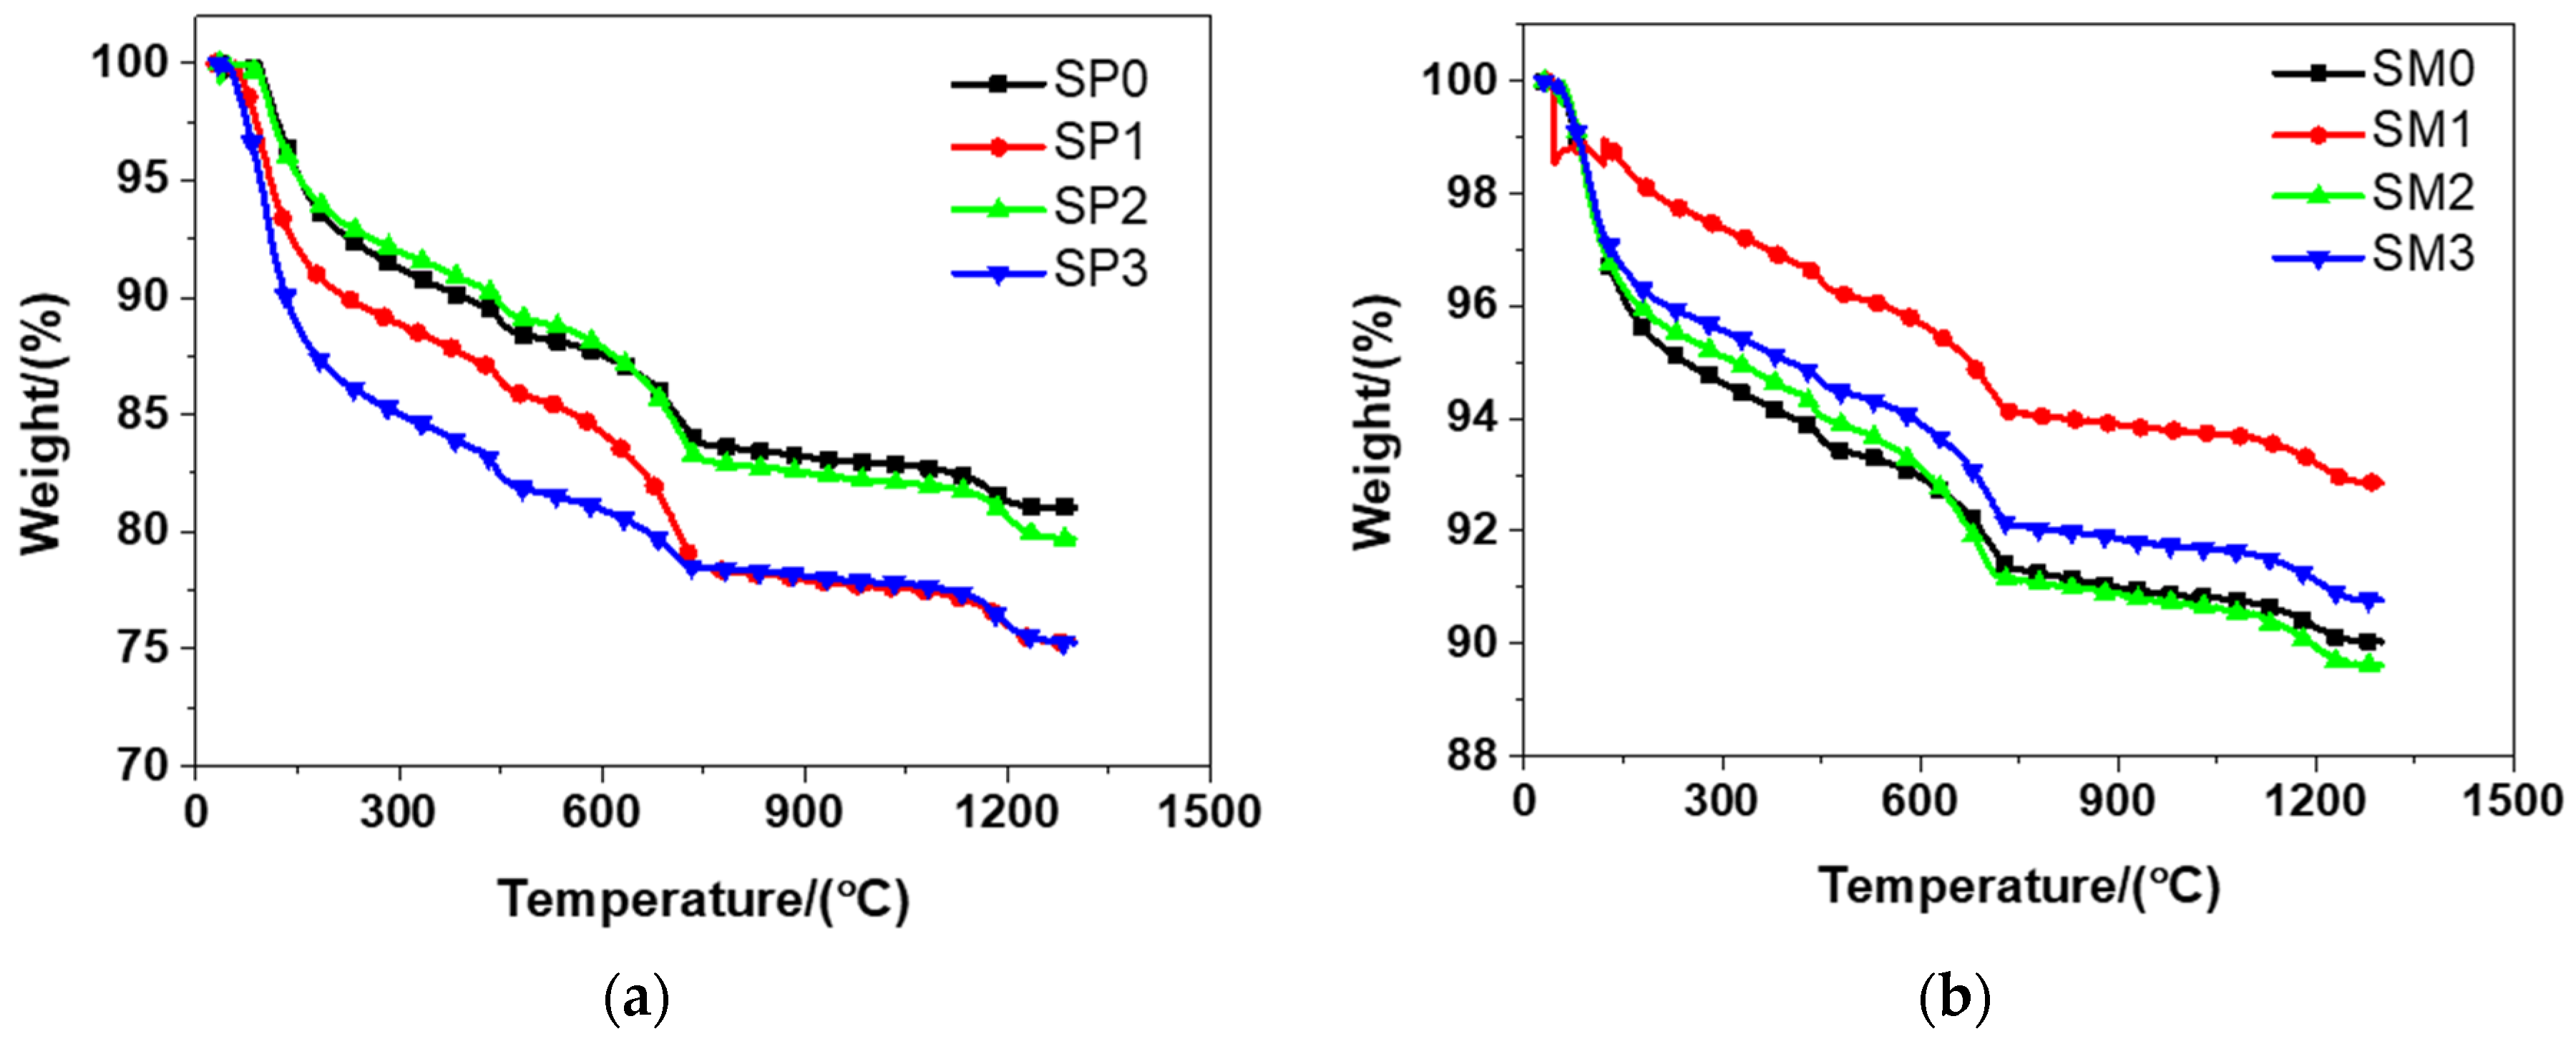
- When the temperature runs up to 1300 °C, the total weight loss of SP0, SP1, SP2, SP3 was 18.97%, 24.72%, 20.31%, and 24.73%, respectively. At the same time, the total weight loss of SM0, SM1, SM2, SM3 was 9.98%, 7.15%, 10.38%, and 9.23%, respectively. Accordingly, compared to the tested mortar, the weight loss of the tested cement paste is higher.
- (8)
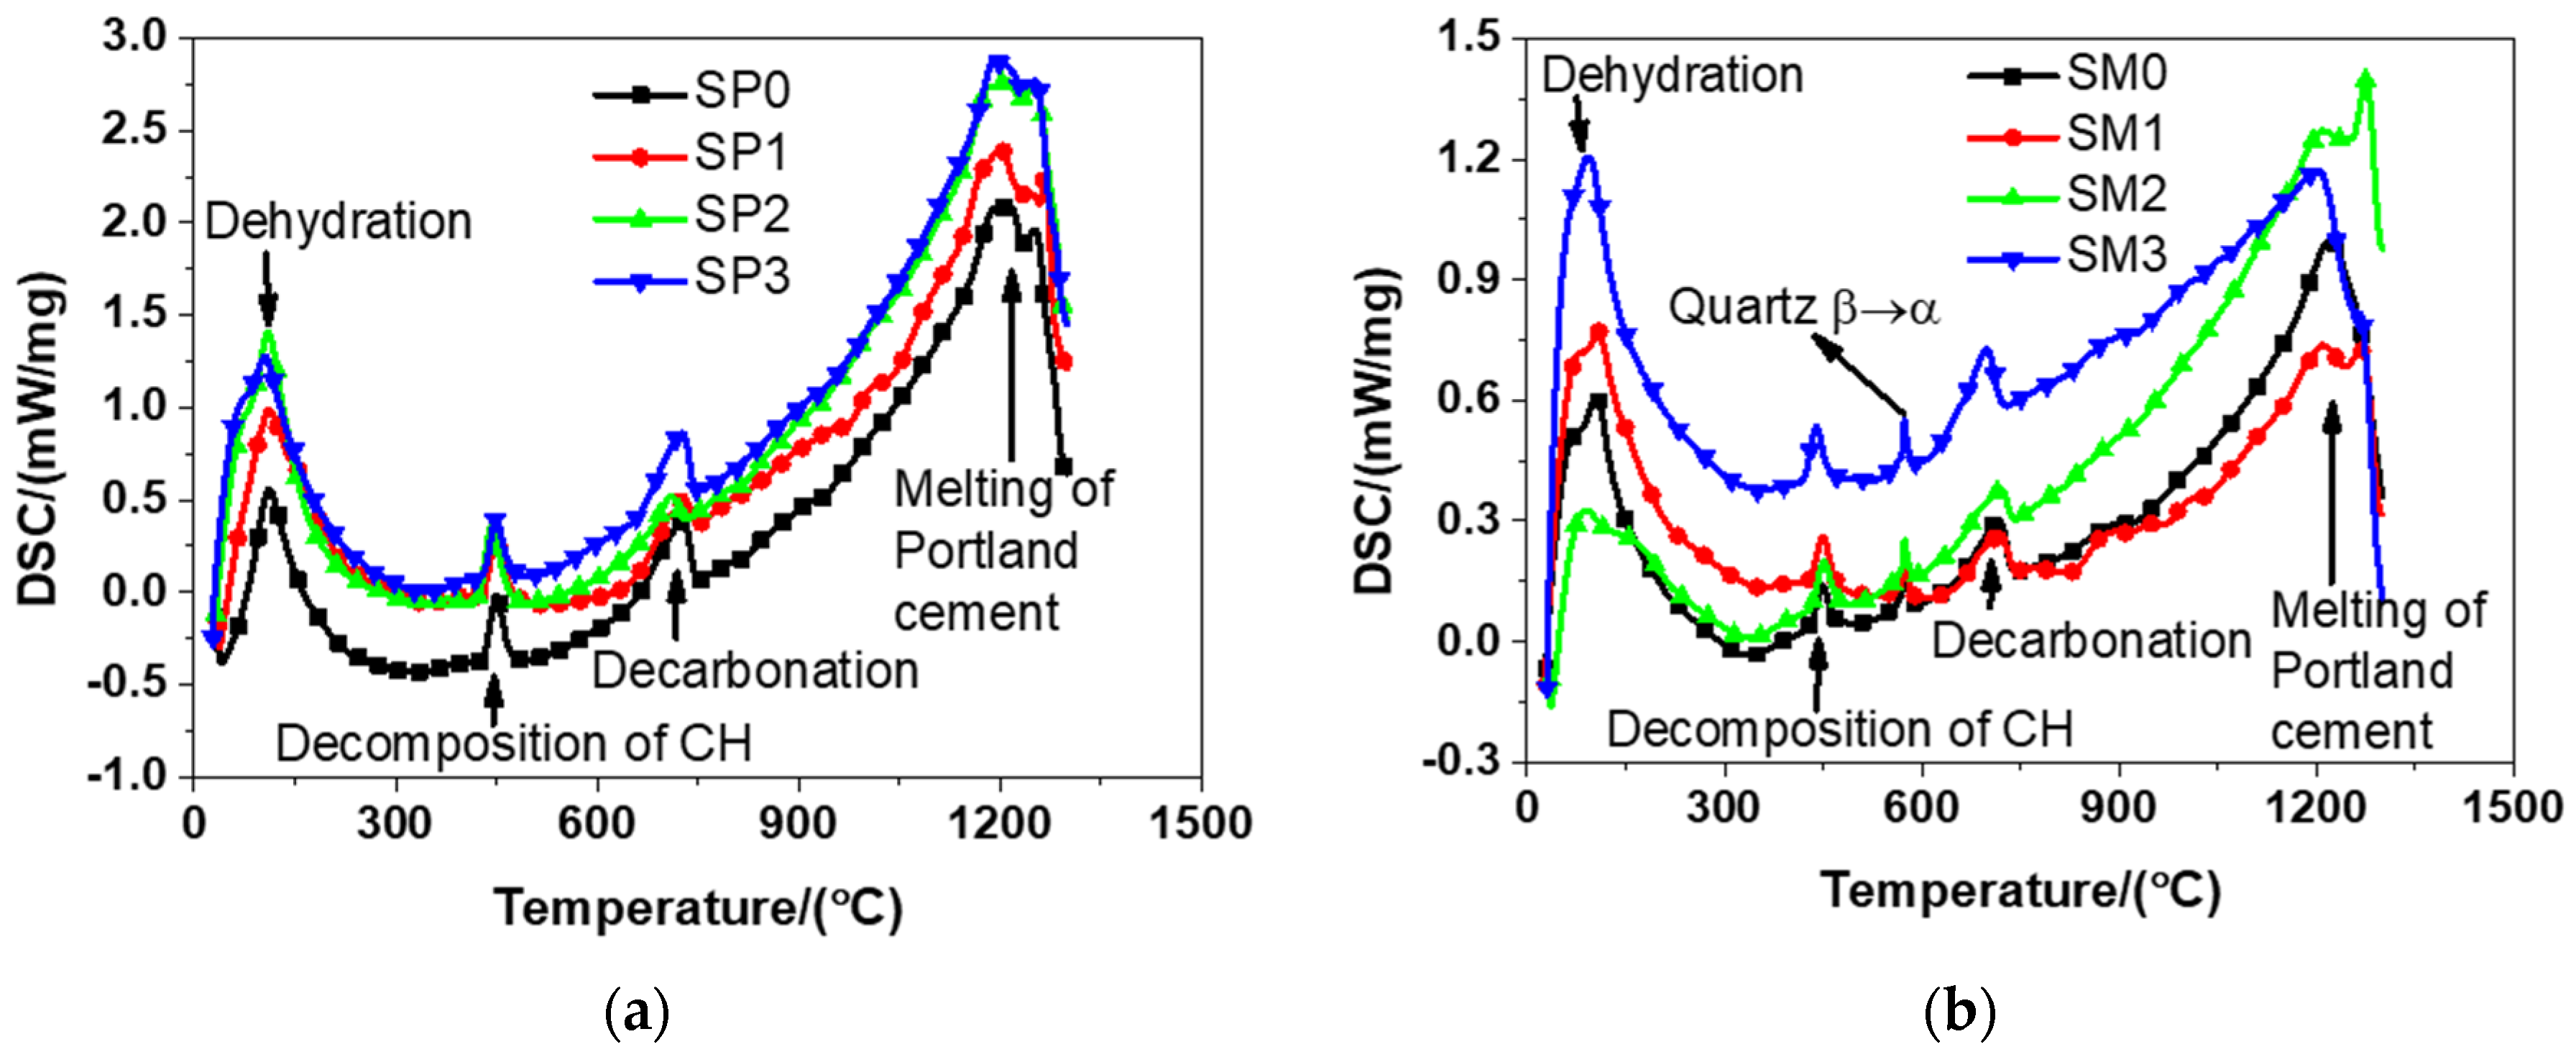
- The tested materials have a similar trend in terms of the DSC patterns, because the cement hydration products of them are essentially the same. In general, there is a continual process for the dehydration of cement hydration products in the range of 100–850 °C.
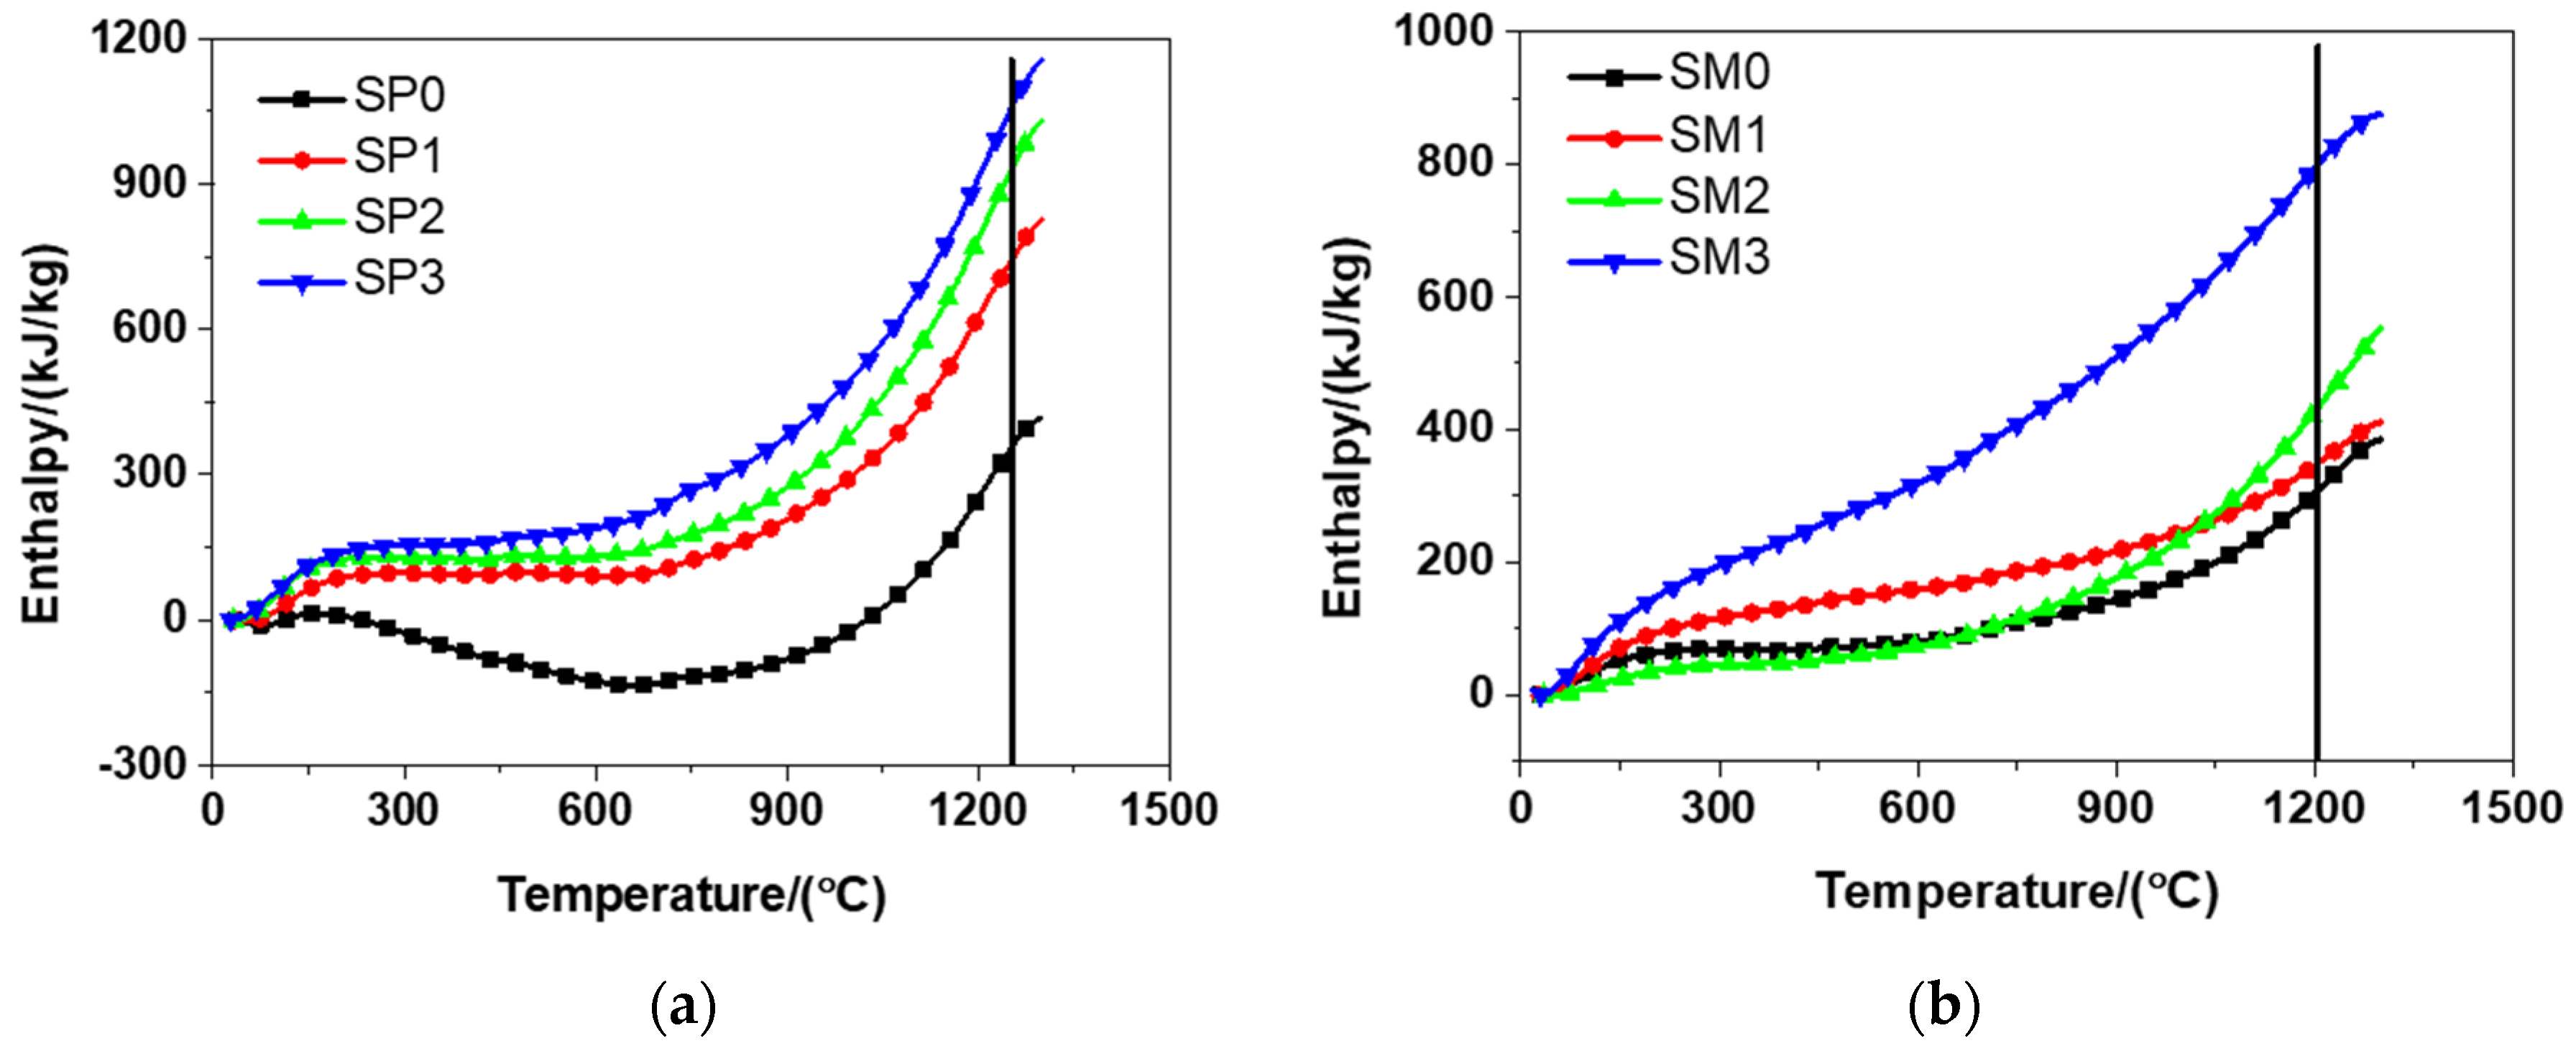
- (9)
- Due to the inclusion of more GSNSs, the decomposition enthalpy of the tested materials is improved. The decomposition enthalpy of SP0, SP1, SP2, SP3 is 352.37, 737.56, 924.30, and 1052.30 kJ/kg, respectively, suggesting an increase of 109.31%, 162.31%, and 198.63% respectively in the decomposition enthalpy of the tested cement paste. The decomposition enthalpy of SM0, SM1, SM2, SM3 is 314.53, 354.03, 439.91, and 806.64kJ/kg, respectively, indicating an increase of 12.56%, 39.86%, and 156.46% respectively in the decomposition enthalpy of the tested mortar.
- (10)
- Due to the inclusion of more GSNSs, the ablation velocity of the tested materials is reduced. The addition of 0.03 wt.%, 0.1 wt.%, and 0.3 wt.% GSNSs results in a decline of 52.22%, 61.88%, and 66.51% respectively in the ablation velocity of the tested cement paste, and a decline of 11.16%, 28.50%, and 61.01%, respectively, in the ablation velocity of siliceous sacrificial mortar.
- (11)
- The optimal amount of GSNSs is 0.1 wt.%, considering the mechanical properties, pore structure, and ablation behaviour of the tested materials.
- (12)
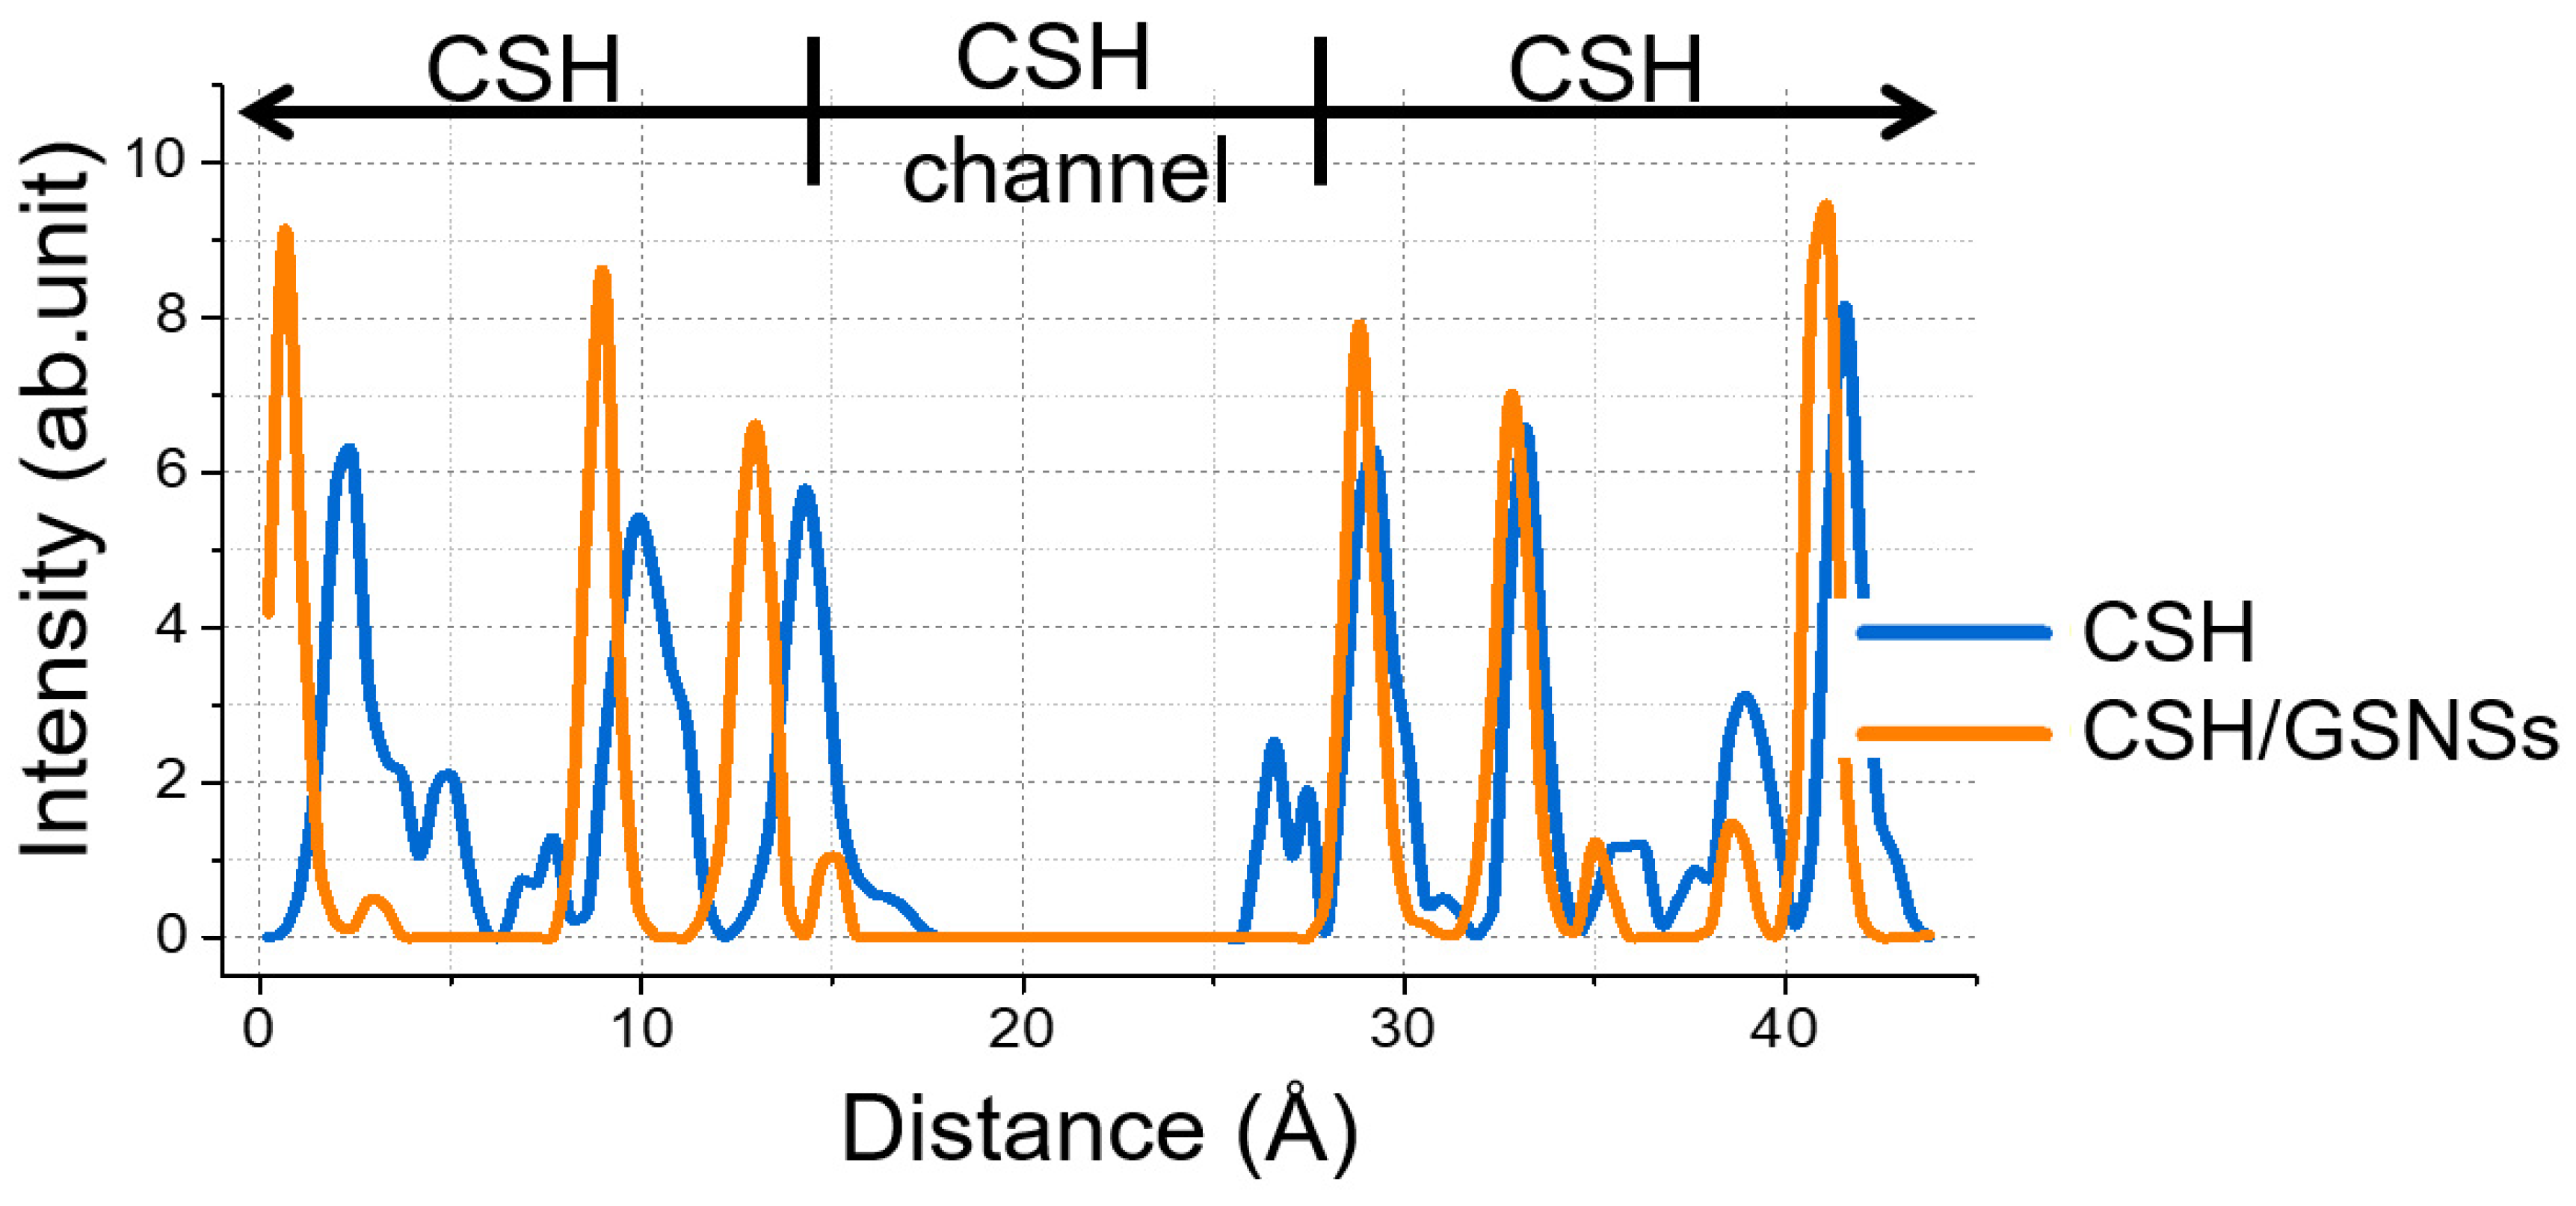
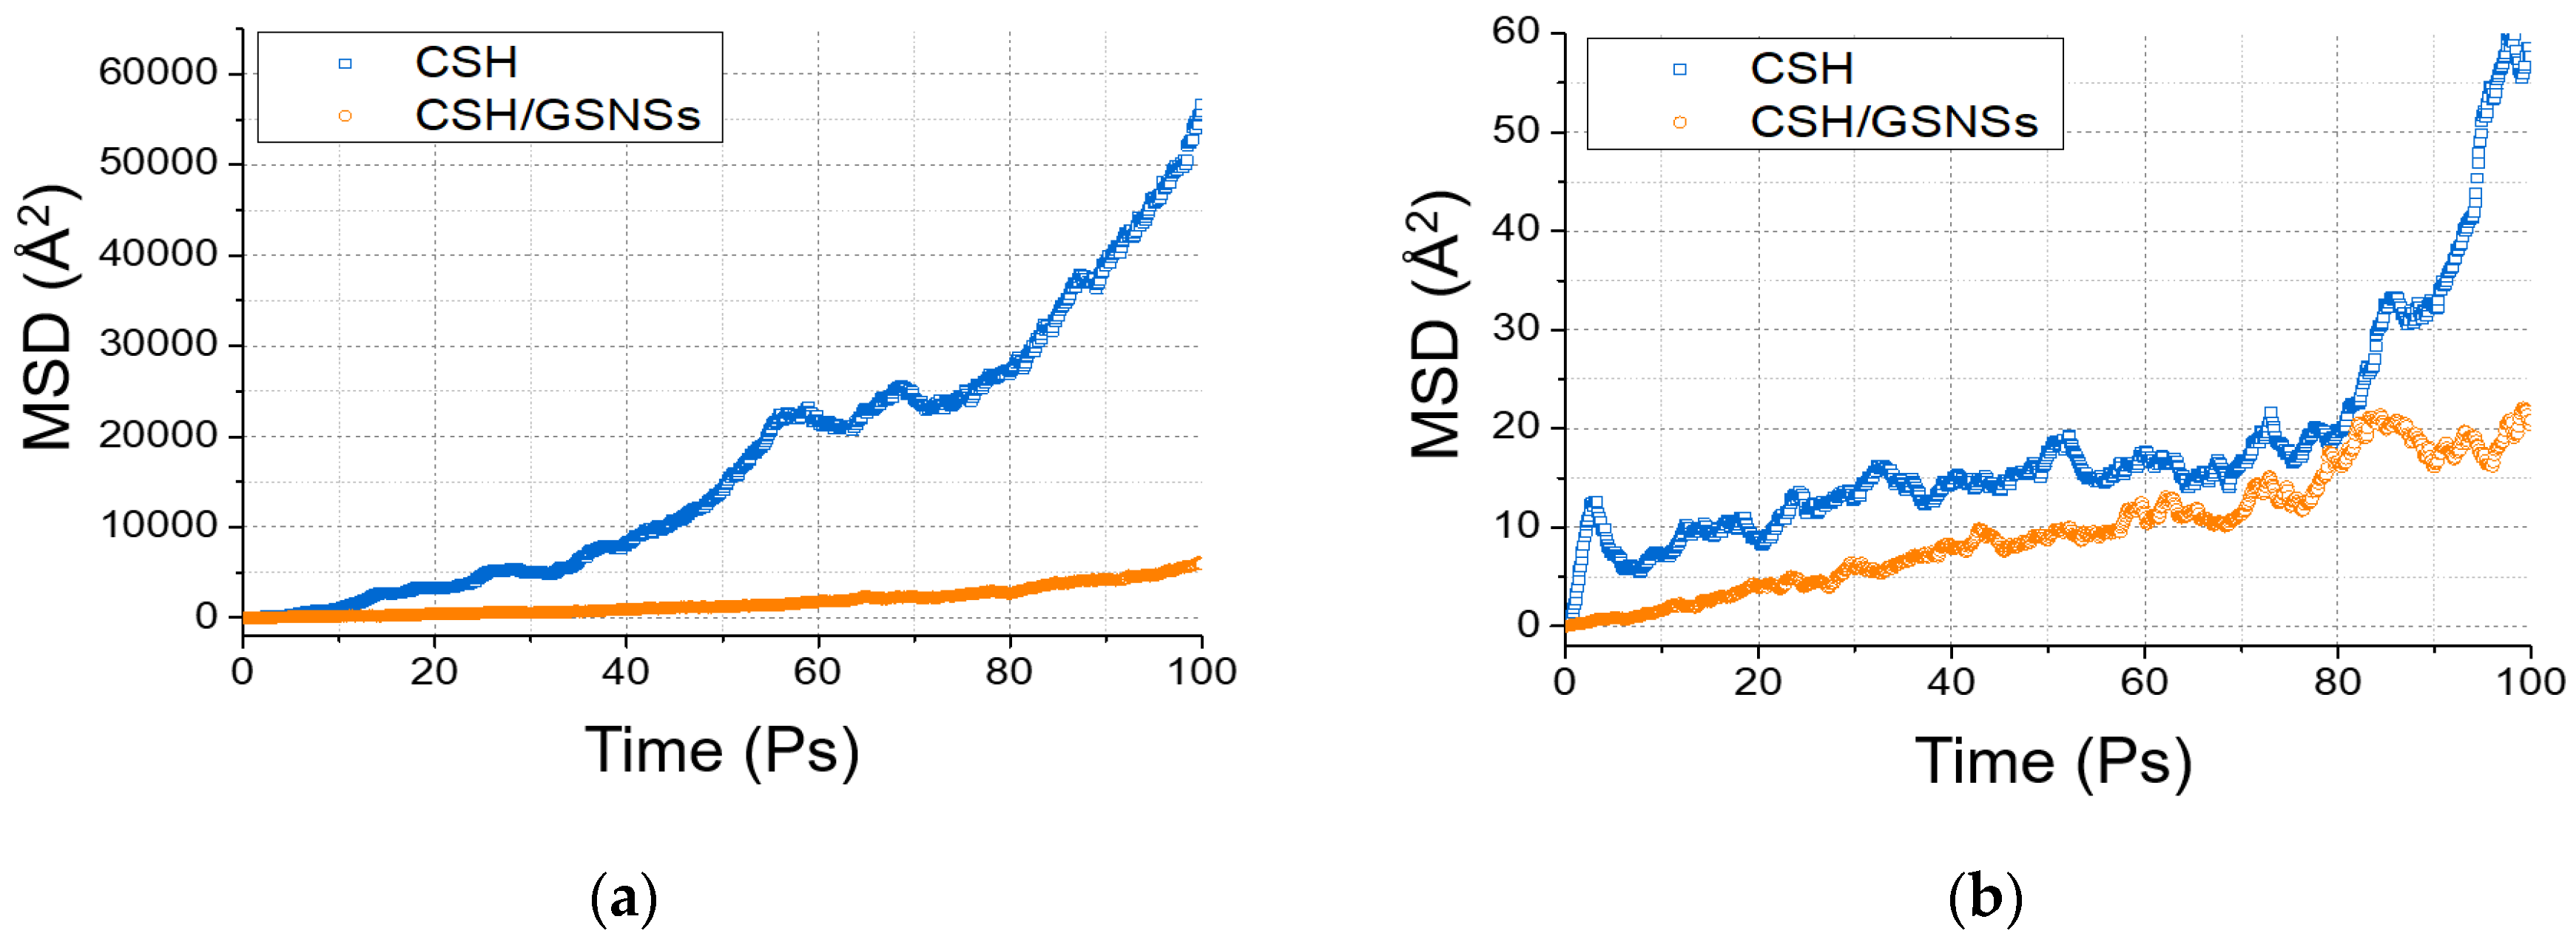
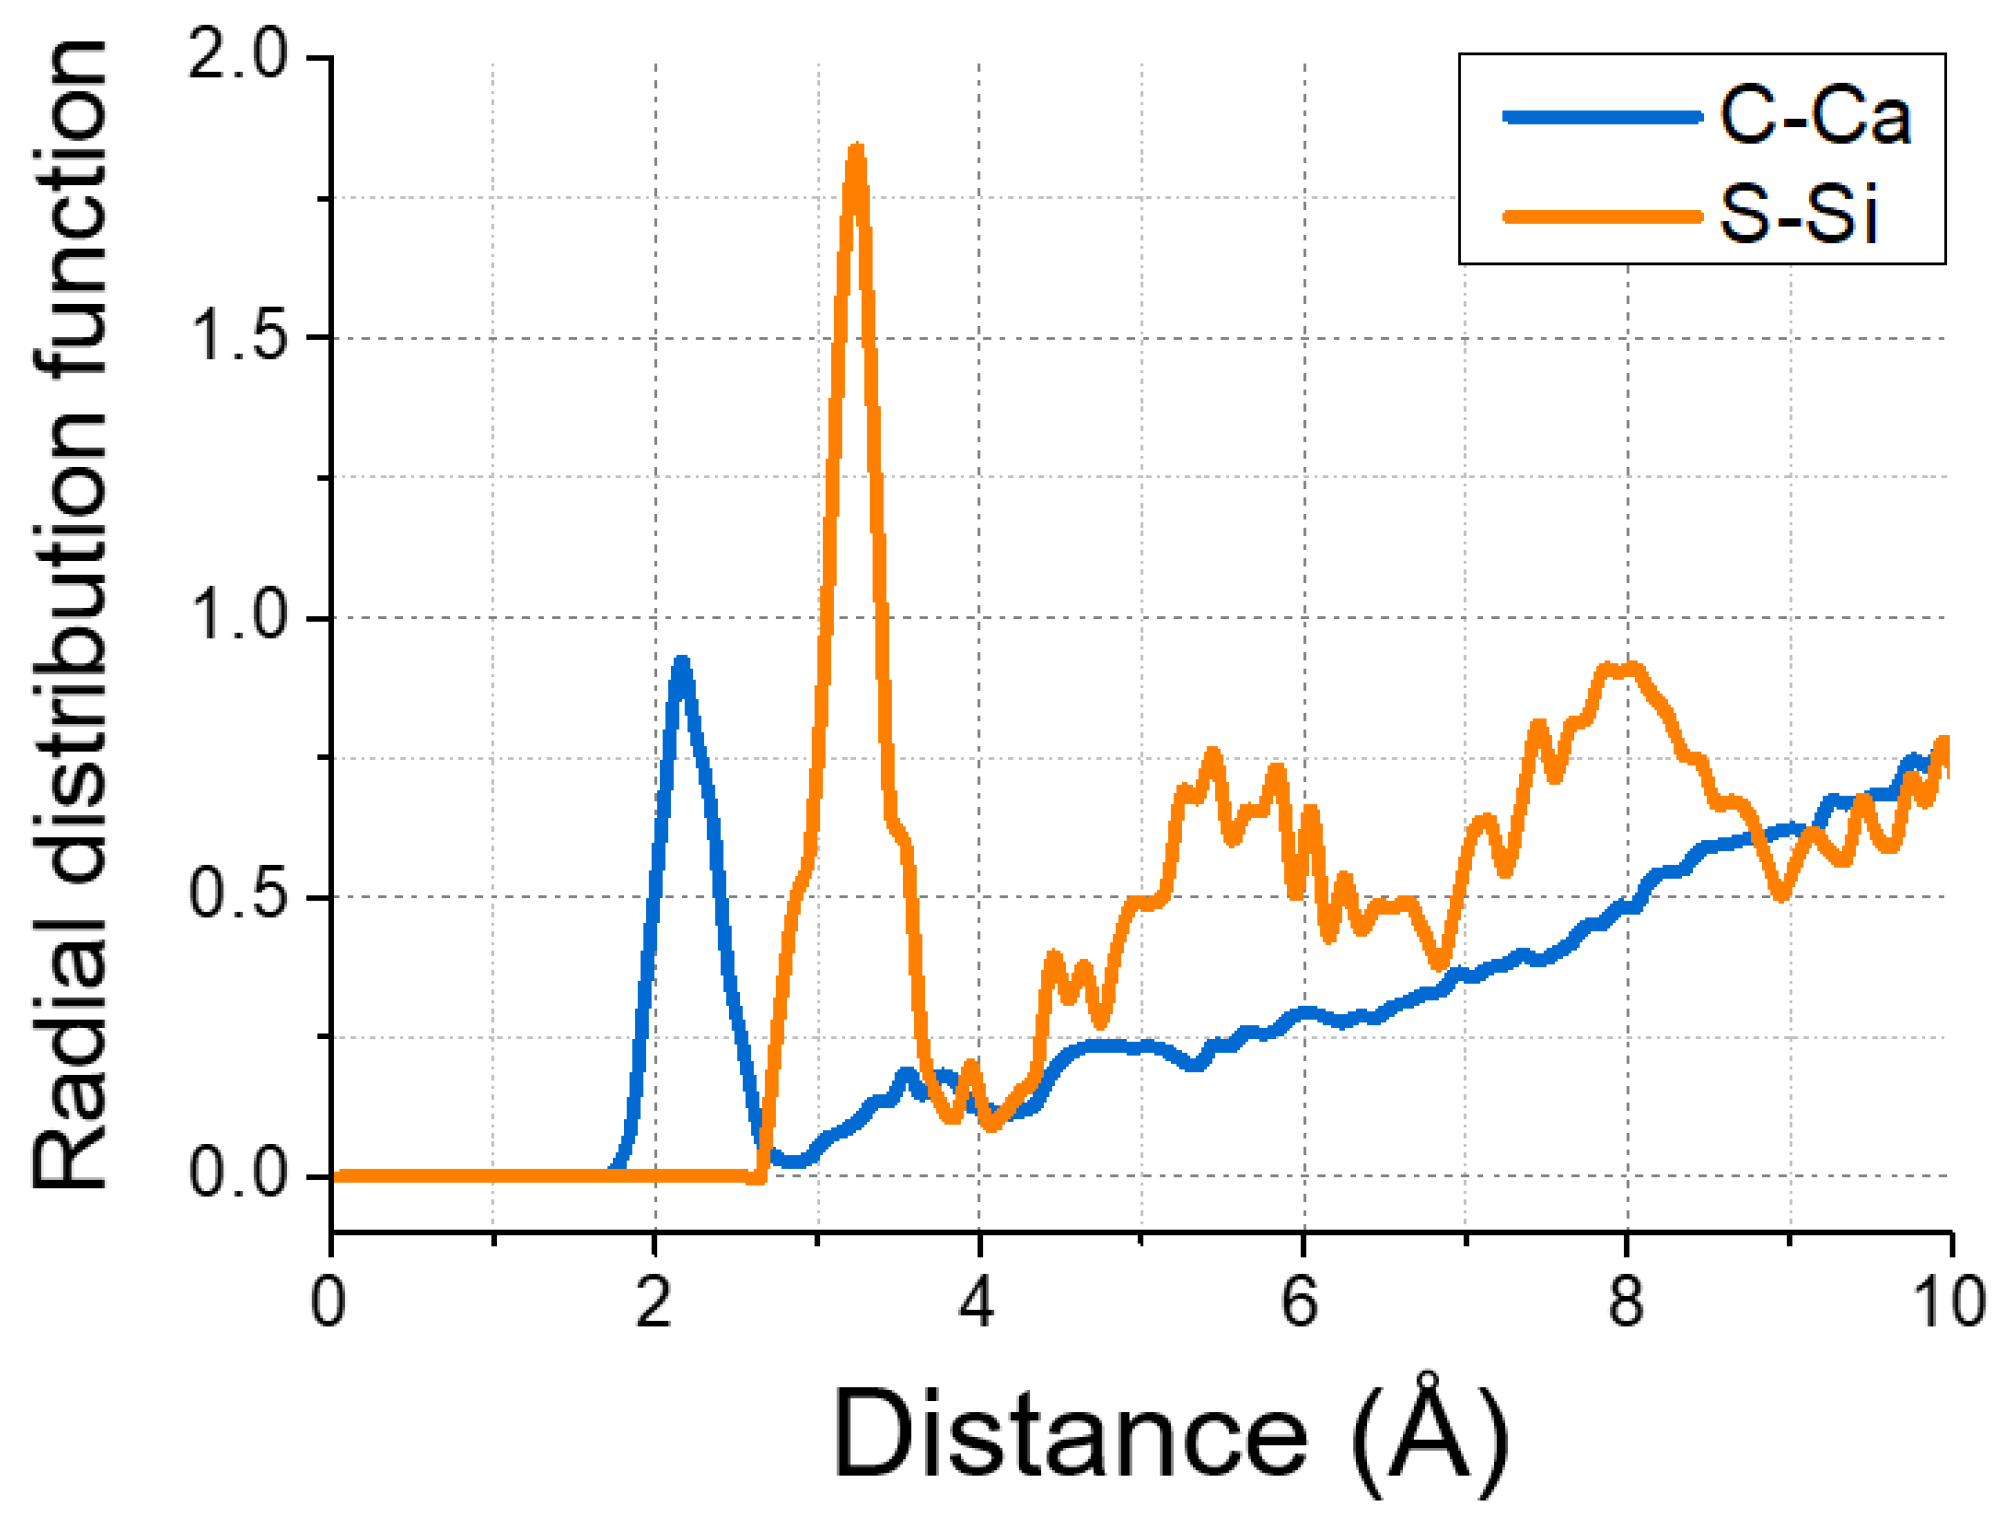
- The GSNSs contribute to the reinforced effect of GSNSs on CSH gel through the grab of dissociated calcium and water molecules, and the chemical reaction with silicate tetrahedron to produce S–O–Si bonds.
Author Contributions
Funding
Conflicts of Interest
References
- Konings, R.J.M.; Allen, T.R.; Stoller, R.E.; Yamanaka, S. Comprehensive Nuclear Materials; Elsevier: Amsterdam, The Netherlands, 2012. [Google Scholar]
- Nunes, C.; Slížková, Z.; Stefanidou, M.; Němeček, J. Microstructure of lime and lime-pozzolana pastes with nanosilica. Cem. Concr. Res. 2016, 83, 152–163. [Google Scholar]
- Nili, M.; Ehsani, A. Investigating the effect of the cement paste and transition zone on strength development of concrete containing nanosilica and silica fume. Mater. Des. 2015, 75, 174–183. [Google Scholar] [CrossRef]
- Li, W.; Huang, Z.; Cao, F.; Sun, Z.; Shah, S.P. Effects of nano-silica and nano-limestone on flowability and mechanical properties of ultra-high-performance concrete matrix. Constr. Build. Mater. 2015, 95, 366–374. [Google Scholar] [CrossRef]
- Ghafari, E.; Costa, H.; Júlio, E.; Portugal, A.; Durães, L. The effect of nanosilica addition on flowability, strength and transport properties of ultra high performance concrete. Mater. Des. 2014, 59, 1–9. [Google Scholar]
- Meng, T.; Yu, Y.; Qian, X.; Zhan, S.; Qian, K. Effect of nano-TiO2 on the mechanical properties of cement mortar. Constr. Build. Mater. 2012, 29, 241–245. [Google Scholar] [CrossRef]
- D’Alessandro, A.; Rallini, M.; Ubertini, F.; Materazzi, A.L.; Kenny, J.M. Investigations on scalable fabrication procedures for self-sensing carbon nanotube cement-matrix composites for SHM applications. Cem. Concr. Compos. 2016, 65, 200–213. [Google Scholar] [CrossRef]
- Parveen, S.; Rana, S.; Fangueiro, R.; Paiva, M.C. Microstructure and mechanical properties of carbon nanotube reinforced cementitious composites developed using a novel dispersion technique. Cem. Concr. Res. 2015, 73, 215–227. [Google Scholar]
- Stynoski, P.; Mondal, P.; Marsh, C. Effects of silica additives on fracture properties of carbon nanotube and carbon fiber reinforced Portland cement mortar. Cem. Concr. Compos. 2015, 55, 232–240. [Google Scholar] [CrossRef]
- Xu, S.; Liu, J.; Li, Q. Mechanical properties and microstructure of multi-walled carbon nanotube-reinforced cement paste. Constr. Build. Mater. 2015, 76, 16–23. [Google Scholar] [CrossRef]
- Peyvandi, A.; Soroushian, P.; Abdol, N.; Balachandra, A.M. Surface-modified graphite nanomaterials for improved reinforcement efficiency in cementitious paste. Carbon 2013, 63, 175–186. [Google Scholar] [CrossRef]
- Novoselov, K.S.; Geim, A.K.; Morozov, S.V.; Jiang, D.; Katsnelson, M.I.; Grigorieva, I.V.; Dubonos, S.V.; Firsov, A.A. Two-dimensional gas of massless Dirac fermions in graphene. Nat. Cell Biol. 2005, 438, 197–200. [Google Scholar] [CrossRef]
- Lv, W.; Li, Z.; Deng, Y.; Yang, Q.-H.; Kang, F. Graphene-based materials for electrochemical energy storage devices: Opportunities and challenges. Energy Storage Mater. 2016, 2, 107–138. [Google Scholar] [CrossRef]
- Geim, A.K.; Novoselov, K.S. The rise of graphene. Nat. Mater. 2007, 6, 183–191. [Google Scholar] [CrossRef]
- Long, W.; Wei, J.J.; Xing, F.; Khayat, K.H. Enhanced dynamic mechanical properties of cement paste modified with graphene oxide nanosheets and its reinforcing mechanism. Cem. Concr. Compos. 2018, 93, 127–139. [Google Scholar] [CrossRef]
- Chu, H.Y.; Zhang, Y.; Wang, F.; Feng, T.; Wang, L.; Wang, D. Effect of Graphene Oxide on Mechanical Properties and Durability of Ultra-High-Performance Concrete Prepared from Recycled Sand. Nanomaterials 2020, 10, 1718. [Google Scholar] [CrossRef] [PubMed]
- Pan, Z.; He, L.; Qiu, L.; Korayem, A.H.; Li, G.; Zhu, J.W.; Collins, F.; Li, D.; Duan, W.H.; Wang, M.C. Mechanical properties and microstructure of a graphene oxide–cement composite. Cem. Concr. Compos. 2015, 58, 140–147. [Google Scholar] [CrossRef]
- Chabot, V.; Higgins, D.; Yu, A.; Xiao, X.; Chen, Z.; Zhang, J. A review of graphene and graphene oxide sponge: Material synthesis and applications to energy and the environment. Energy Environ. Sci. 2014, 7, 1564–1596. [Google Scholar] [CrossRef]
- Le, J.L.; Du, H.; Pang, S.D. Use of 2D Graphene Nanoplatelets (GNP) in cement composites for structural health evaluation. Compos. Part B 2014, 67, 555–563. [Google Scholar] [CrossRef]
- Wang, B.; Pang, B. Mechanical property and toughening mechanism of water reducing agents modified graphene nanoplatelets reinforced cement composites. Constr. Build. Mater. 2019, 226, 699–711. [Google Scholar] [CrossRef]
- Lu, L.; Ouyang, D. Properties of Cement Mortar and Ultra-High Strength Concrete Incorporating Graphene Oxide Nanosheets. Nanomaterials 2017, 7, 187. [Google Scholar] [CrossRef]
- Kim, J.; Cote, L.J.; Kim, F.; Yuan, W.; Shull, K.R.; Huang, J. Graphene oxide sheets at inerfaces. J. Am. Chem. Soc. 2010, 132, 8180–8186. [Google Scholar] [CrossRef] [PubMed]
- Hou, D.; Lu, Z.; Li, X.; Ma, H.; Li, Z. Reactive molecular dynamics and experimental study of graphene-cement composites: Structure, dynamics and reinforcement mechanisms. Carbon 2017, 115, 188–208. [Google Scholar] [CrossRef]
- Ranjbar, N.; Mehrali, M.; Mehrali, M.; Alengaram, U.J.; Jumaat, M.Z. Graphene nanoplatelet-fly ash based geopolymer composites. Cem. Concr. Res. 2015, 76, 222–231. [Google Scholar] [CrossRef]
- Lv, S.; Ma, Y.; Qiu, C.; Sun, T.; Liu, J.; Zhou, Q. Effect of graphene oxide nanosheets of microstructure and mechanical properties of cement composites. Constr. Build. Mater. 2013, 49, 121–127. [Google Scholar]
- Lv, S.; Deng, L.; Yang, W.; Zhou, Q.; Cui, Y. Fabrication of polycarboxylate/graphene oxide nanosheet composites by copolymerization for reinforcing and toughening cement composites. Cem. Concr. Compos. 2016, 66, 1–9. [Google Scholar] [CrossRef]
- Chu, H.; Chen, J.K. The experimental study on the correlation of resistivity and damage for conductive concrete. Cem. Concr. Compos. 2016, 67, 12–19. [Google Scholar] [CrossRef]
- Long, W.; Wei, J.; Ma, H.; Xing, F. Dynamic mechanical properties and microstructure of graphene oxide nanosheets reinforced cement commposites. Nanomaterials 2017, 7, 407. [Google Scholar]
- Chu, H.Y.; Jiang, J.Y.; Sun, W.; Zhang, M. Mechanical and thermal properties of graphene sulfonate nanosheet reinforced sacrificial concrete at elevated temperatures. Constr. Build. Mater. 2017, 153, 682–694. [Google Scholar] [CrossRef]
- Tang, J.; Yang, T.; Yu, C.; Hou, D.; Liu, J. Precipitated calcium hydroxide morphology in nanoparticle suspensions: An experimental and molecular dynamics study. Cem. Concr. Compos. 2018, 94, 201–214. [Google Scholar] [CrossRef]
- Tang, J.; Yu, C.; Wang, R.; Liu, J. Sulfonation of graphene and its effects on tricalcium silicate hydration. Constr. Build. Mater. 2019, 206, 600–608. [Google Scholar] [CrossRef]
- GB 175-2007, Common Portland Cement; Standards Press of China: Beijing, China, 2008. (In Chinese)
- GB/T 1596-2005, Fly Ash Used for Cement and Concrete; China Architecture and Building Press: Beijing, China, 2005. (In Chinese)
- Chu, H.; Jiang, J.; Sun, W.; Zhang, M. Thermal behaviour of siliceous and ferro-siliceous sacrificial concrete subjected to elevated temperatures. Mater. Des. 2016, 95, 470–480. [Google Scholar]
- Chu, H.Y.; Jiang, J.; Sun, W.; Zhang, M. Mechanical and physicochemical properties of ferro-siliceous concrete subjected to elevated temperatures. Constr. Build. Mater. 2016, 122, 743–752. [Google Scholar]
- GB/T 50081-2002, Standard for Test Method of Mechanical Properties on Ordinary Concrete; China Architecture and Building Press: Beijing, China, 2002. (In Chinese)
- GB/T 17671-1999, Method of Testing Cements-Determination of Strength; China Architecture and Building Press: Beijing, China, 1999. (In Chinese)
- Chase, M.W., Jr. NIST-JANAF Thermochemical Tables; American Institute of Physics: College Park, ME, USA, 1998. [Google Scholar]
- Lu, L.; Zhang, Y.; Yin, B. Structure evolution of the interface between graphene oxide-reinforced calcium silicate hydrate gel particles exposed to high temperature. Comput. Mater. Sci. 2020, 173, 109440. [Google Scholar]
- Allen, A.J.; Thomas, J.J.; Jennings, H.M. Composition and density of nanoscale calcium–silicate–hydrate in cement. Nat. Mater. 2007, 6, 311–316. [Google Scholar] [PubMed]
- Pellenq, R.J.M.; Kushima, A.; Shahsavari, R.; van Vliet, K.J.; Buehler, M.J.; Yip, S.; Ulm, F.J. A realistic molecular model of cement hydrates. Proc. Natl. Acad. Sci. USA 2009, 106, 16102–16107. [Google Scholar] [PubMed]
- Cong, X.; Kirkpatrick, R.J. 17O MAS NMR Investigation of the Structure of Calcium Silicate Hydrate Gel. J. Am. Ceram. Soc. 1996, 79, 1585–1592. [Google Scholar]
- Chen, J.J.; Thomas, J.J.; Taylor, H.F.; Jennings, H.M. Solubility and structure of calcium silicate hydrate. Cem. Concr. Res. 2004, 34, 1499–1519. [Google Scholar]
- Viallis, H.; Faucon, P.; Petit, J.C.; Nonat, A. Interaction between Salts (NaCl, CsCl) and Calcium Silicate Hydrates (C-S-H). J. Phys. Chem. B 1999, 103, 5212–5219. [Google Scholar]
- Hou, D.; Zhang, W.; Sun, M.; Wang, P.; Wang, M.; Zhang, J.; Li, Z. Modified Lucas-Washburn function of capillary transport in the calcium silicate hydrate gel pore: A coarse-grained molecular dynamics study. Cem. Concr. Res. 2020, 136, 106166. [Google Scholar]
- Hou, D.; Zhao, T.; Ma, H.; Li, Z. Reactive Molecular Simulation on Water Confined in the Nanopores of the Calcium Silicate Hydrate Gel: Structure, Reactivity, and Mechanical Properties. J. Phys. Chem. C 2015, 119, 1346–1358. [Google Scholar]
- Hou, D.; Yang, T.; Tang, J.; Li, S. Reactive force-field molecular dynamics study on graphene oxide reinforced cement composite: Functional group de-protonation, interfacial bonding and strengthening mechanism. Phys. Chem. Chem. Phys. 2018, 20, 8773–8789. [Google Scholar] [CrossRef]
- Zhang, Y.; Zhang, Q.; Hou, D.; Zhang, J. Tuning interfacial structure and mechanical properties of graphene oxide sheets/polymer nanocomposites by controlling functional groups of polymer. Appl. Surf. Sci. 2020, 504, 144152. [Google Scholar] [CrossRef]
- Jiang, J.; Ge, X.; Jiang, J.Y.; Tang, J.; Zhang, Z. Mechanical properties and ablation behaviour of nuclear sacrificial materials containing graphene sulfonate nanosheets. Constr. Build. Mater. 2018, 191, 69–79. [Google Scholar]
- Meng, W.; Khayat, K.H. Improving flexural performance of ultra-high-performance concrete by rheology control of suspending mortar. Compos. Part B 2017, 117, 26–34. [Google Scholar] [CrossRef]
- Chu, H.Y.; Jiang, J.Y.; Sun, W.; Zhang, M. Effects of graphene sulfonate nanosheets on mechanical and thermal properties of sacrificial concrete during high temperature exposure. Cem. Concr. Compos. 2017, 82, 252–264. [Google Scholar] [CrossRef]
- Chu, H.Y.; Wang, F.; Wang, L.; Feng, T.; Wang, D. Mechanical Properties and Environmental Evaluation of Ultra-High-Performance Concrete with Aeolian Sand. Materials 2020, 13, 3148. [Google Scholar] [CrossRef]
- Ye, G.; Liu, X.; de Schutter, G.; Taerwe, L.; Vandevelde, P. Phase distribution and microstructural changes of self-compacting cement paste at elevated temperature. Cem. Concr. Res. 2007, 37, 978–987. [Google Scholar] [CrossRef]
- Bazant, Z.P.; Kaplan, M.F. Concrete at High Temperatures: Materials Properties and Mathematical Models; Longman: London, UK, 1996. [Google Scholar]


| Materials | Cement | Silica Fume | Fly Ash |
|---|---|---|---|
| Chemical composition | (wt.%) | ||
| CaO | 64.46 | 0.81 | 8.75 |
| SiO2 | 20.19 | 94.46 | 48.04 |
| Al2O3 | 5.41 | 0.89 | 30.17 |
| Fe2O3 | 3.11 | 0.83 | 4.44 |
| MgO | 0.93 | 0.76 | 2.60 |
| SO3 | 1.95 | 0.25 | 1.23 |
| K2O | 0.74 | 1.59 | |
| Na2O | 1.24 | ||
| Loss on ignition | 3.21 | 2.0 | 1.94 |
| Physical properties | |||
| Specific gravity | 3.15 | 2.34 | 2.21 |
| Specific surface (m2/kg) | 359.48 | 2.57 × 10⁴ | |
| 28 days Compressive strength (MPa) | 61.30 | ||
| Mixture | Cement | Fly Ash | Silica Fume | Silica Sand | Water | Superplasticizer | GSNSs |
|---|---|---|---|---|---|---|---|
| SP0 | 331 | 182 | 20 | 0 | 150 | 3.5 | 0 |
| SP1 | 331 | 182 | 20 | 0 | 150 | 3.7 | 0.160 |
| SP2 | 331 | 182 | 20 | 0 | 150 | 4.1 | 0.533 |
| SP3 | 331 | 182 | 20 | 0 | 150 | 4.6 | 1.599 |
| SM0 | 331 | 182 | 20 | 1122 | 150 | 7.8 | 0 |
| SM1 | 331 | 182 | 20 | 1122 | 150 | 8.0 | 0.160 |
| SM2 | 331 | 182 | 20 | 1122 | 150 | 8.4 | 0.533 |
| SM3 | 331 | 182 | 20 | 1122 | 150 | 8.7 | 1.599 |
Publisher’s Note: MDPI stays neutral with regard to jurisdictional claims in published maps and institutional affiliations. |
© 2020 by the authors. Licensee MDPI, Basel, Switzerland. This article is an open access article distributed under the terms and conditions of the Creative Commons Attribution (CC BY) license (http://creativecommons.org/licenses/by/4.0/).
Share and Cite
Chu, H.; Wang, Z.; Zhang, Y.; Wang, F.; Ju, S.; Wang, L.; Wang, D. Using Graphene Sulfonate Nanosheets to Improve the Properties of Siliceous Sacrificial Materials: An Experimental and Molecular Dynamics Study. Materials 2020, 13, 4824. https://doi.org/10.3390/ma13214824
Chu H, Wang Z, Zhang Y, Wang F, Ju S, Wang L, Wang D. Using Graphene Sulfonate Nanosheets to Improve the Properties of Siliceous Sacrificial Materials: An Experimental and Molecular Dynamics Study. Materials. 2020; 13(21):4824. https://doi.org/10.3390/ma13214824
Chicago/Turabian StyleChu, Hongyan, Zifei Wang, Yu Zhang, Fengjuan Wang, Siyi Ju, Lanxin Wang, and Danqian Wang. 2020. "Using Graphene Sulfonate Nanosheets to Improve the Properties of Siliceous Sacrificial Materials: An Experimental and Molecular Dynamics Study" Materials 13, no. 21: 4824. https://doi.org/10.3390/ma13214824
APA StyleChu, H., Wang, Z., Zhang, Y., Wang, F., Ju, S., Wang, L., & Wang, D. (2020). Using Graphene Sulfonate Nanosheets to Improve the Properties of Siliceous Sacrificial Materials: An Experimental and Molecular Dynamics Study. Materials, 13(21), 4824. https://doi.org/10.3390/ma13214824