Relationship between Viscosity, Microstructure and Electrical Conductivity in Copolyamide Hot Melt Adhesives Containing Carbon Nanotubes
Abstract
1. Introduction
2. Materials and Methods
3. Results and Discussion
4. Conclusions
Author Contributions
Funding
Acknowledgments
Conflicts of Interest
References
- Nele, L.; Palmieri, B. Electromagnetic heating for adhesive melting in CFRTP joining: Study, analysis, and testing. Int. J. Adv. Manuf. Technol. 2020, 106, 5317–5331. [Google Scholar] [CrossRef]
- Peng, X.; Liu, S.; Huang, Y.; Sang, L. Investigation of joining of continuous glass fibre reinforced polypropylene laminates via fusion bonding and hotmelt adhesive film. Int. J. Adhes. Adhes. 2020, 100, 102615. [Google Scholar] [CrossRef]
- Ciardiello, R.; Belingardi, G.; Martorana, B.; Brunella, V. Physical and mechanical properties of a reversible adhesive for automotive applications. Int. J. Adhes. Adhes. 2019, 89, 117–128. [Google Scholar] [CrossRef]
- Ganesh, M.G.; Lavenya, K.; Kirubashini, K.A.; Ajeesh, G.; Bhowmik, S.; Epaarachchi, J.A.; Yuan, X. Electrically conductive nano adhesive bonding: Futuristic approach for satellites and electromagnetic interference shielding. Adv. Aircr. Spacecr. Sci. 2017, 4, 729–744. [Google Scholar] [CrossRef]
- Geipel, T.; Meinert, M.; Kraft, A.; Eitner, U. Optimization of electrically conductive adhesive bonds in photovoltaic modules. IEEE J. Photovolt. 2018, 8, 1074–1081. [Google Scholar] [CrossRef]
- Lopes, P.E.; Moura, D.; Freitas, D.; Proença, M.F.; Figueiredo, H.; Alves, R.; Paiva, M.C. Advanced electrically conductive adhesives for high complexity PCB assembly. AIP Conf. Proc. 2019, 2055. [Google Scholar] [CrossRef]
- Yim, M.J.; Li, Y.; Moon, K.S.; Paik, K.W.; Wong, C.P. Review of recent advances in electrically conductive adhesive materials and technologies in electronic packaging. J. Adhes. Sci. Technol. 2008, 22, 1593–1630. [Google Scholar] [CrossRef]
- Dong, H.; Li, X.; Dong, Y.; Guo, S.; Zhao, L. A novel preparation method of electrically conductive adhesives by powder spraying process. Materials 2019, 12, 2793. [Google Scholar] [CrossRef]
- Hao, J.; Wang, D.; Li, S.; He, X.; Zhou, J.; Xue, F. The effect of conductive filler on the properties of Electrically Conductive Adhesives (ECAs). In Proceedings of the 18th International Conference on Electronic Packaging Technology, Harbin, China, 16–19 August 2017; pp. 803–808. [Google Scholar] [CrossRef]
- Lu, J.; Liu, D.; Dai, J. Preparation of highly conductive silver nanowires for electrically conductive adhesives. J. Mater. Sci. Mater. Electron. 2019, 30, 15786–15794. [Google Scholar] [CrossRef]
- Ma, H.; Li, Z.; Tian, X.; Yan, S.; Li, Z.; Guo, X.; Ma, Y.; Ma, L. Silver flakes and silver dendrites for hybrid electrically conductive adhesives with enhanced conductivity. J. Electron. Mater. 2018, 47, 2929–2939. [Google Scholar] [CrossRef]
- Jing, L.; Lumpp, J.K. Electrical and mechanical characterization of carbon nanotube filled conductive adhesive. In Proceedings of the 2006 IEEE Aerospace Conference, Big Sky, MT, USA, 4–11 March 2006; p. 6. [Google Scholar]
- Pu, N.W.; Peng, Y.Y.; Wang, P.C.; Chen, C.Y.; Shi, J.N.; Liu, Y.M.; Ger, M.D.; Chang, C.L. Application of nitrogen-doped graphene nanosheets in electrically conductive adhesives. Carbon 2014, 67, 449–456. [Google Scholar] [CrossRef]
- Logakis, E.; Pandis, C.; Peoglos, V.; Pissis, P.; Pionteck, J.; Pötschke, P.; Mičušík, M.; Omastová, M. Electrical/dielectric properties and conduction mechanism in melt processed polyamide/multi-walled carbon nanotubes composites. Polymer 2009, 50, 5103–5111. [Google Scholar] [CrossRef]
- Strozzi, M.; Pellicano, F. Linear vibrations of triple-walled carbon nanotubes. Math. Mech. Solids 2018, 23, 1456–1481. [Google Scholar] [CrossRef]
- Dai, H.; Wong, E.W.; Liebert, C.M.; Lieber, C.M. Probing electrical transport in nanomaterials: Conductivity of individual carbon nanotubes. Science 1996, 272, 523–526. [Google Scholar] [CrossRef]
- Li, J.; Lumpp, J.K.; Andrews, R.; Jacques, D. Aspect ratio and loading effects of multiwall carbon nanotubes in epoxy for electrically conductive adhesives. J. Adhes. Sci. Technol. 2008, 22, 1659–1671. [Google Scholar] [CrossRef]
- Aradhana, R.; Mohanty, S.; Nayak, S.K. High performance electrically conductive epoxy/reduced graphene oxide adhesives for electronics packaging applications. J. Mater. Sci. Mater. Electron. 2019, 30, 4296–4309. [Google Scholar] [CrossRef]
- Meng, Q.; Han, S.; Araby, S.; Zhao, Y.; Liu, Z.; Lu, S. Mechanically robust, electrically and thermally conductive graphene-based epoxy adhesives. J. Adhes. Sci. Technol. 2019, 33, 1337–1356. [Google Scholar] [CrossRef]
- McClory, C.; McNally, T.; Baxendale, M.; Pötschke, P.; Blau, W.; Ruether, M. Electrical and rheological percolation of PMMA/MWCNT nanocomposites as a function of CNT geometry and functionality. Eur. Polym. J. 2010, 135, 854–868. [Google Scholar] [CrossRef]
- Socher, R.; Krause, B.; Müller, M.T.; Boldt, R.; Pötschke, P. The influence of matrix viscosity on MWCNT dispersion and electrical properties in different thermoplastic nanocomposites. Polymer 2012, 53, 495–504. [Google Scholar] [CrossRef]
- Sumita, M.; Abe, H.; Kayaki, H.; Miyasaka, K. Effect of melt viscosity and surface tension of polymers on the percolation threshold of conductive-particle-filled polymeric composites. J. Macromol. Sci. 1986, 25, 171–184. [Google Scholar] [CrossRef]
- Zhang, Y.; Zhang, F.; Xie, Q.; Wu, G. Research on electrically conductive acrylate resin filled with silver nanoparticles plating multiwalled carbon nanotubes. J. Reinf. Plast. Compos. 2015, 34, 1193–1201. [Google Scholar] [CrossRef]
- Dang, Z.-M.; Shehzad, K.; Zha, J.-W.; Mujahid, A.; Hussain, T.; Nie, J.; Shi, C.-Y. Complementary percolation characteristics of carbon fillers based electrically percolative thermoplastic elastomer composites. Compos. Sci. Technol. 2011, 72, 28–35. [Google Scholar] [CrossRef]
- Marcq, F.; Demont, P.; Monfraix, P.; Peigney, A.; Laurent, C.; Falat, T.; Courtade, F.; Jamin, T. Carbon nanotubes and silver flakes filled epoxy resin for new hybrid conductive adhesives. Microelectron. Reliab. 2011, 51, 1230–1234. [Google Scholar] [CrossRef]
- Cui, H.W.; Li, D.S.; Fan, Q. Using a functional epoxy, micron silver flakes, nano silver spheres, and treated single-wall carbon nanotubes to prepare high performance electrically conductive adhesives. Electron. Mater. Lett. 2013, 9, 299–307. [Google Scholar] [CrossRef]
- Ma, H.; Qiu, H.; Qi, S. Electrically conductive adhesives based on acrylate resin filled with silver-plated graphite nanosheets and carbon nanotubes. J. Adhes. Sci. Technol. 2015, 29, 2233–2244. [Google Scholar] [CrossRef]
- Troughton, M. Adhesive bonding. In Handbook of Plastics Joining; William Andrew Inc.: Norwich, NY, USA, 2008; pp. 145–173. [Google Scholar]
- Nobile, M.R. Rheology of polymer–carbon nanotube composites melts. In Polymer–Carbon Nanotube Composites Preparation, Properties and Applications; Woodhead Publishing Limited: Sawston, UK, 2011; pp. 428–481. ISBN 978-1-84569-761-7. [Google Scholar]
- Brewis, D. Hot melt adhesives. In Handbook of Adhesion; Wiley: Hoboken, NJ, USA, 2005; pp. 711–757. ISBN 9780470014226. [Google Scholar]
- Ebnesajjad, S. Characteristics of adhesive materials. In Handbook of Adhesives and Surface Preparation; Ebnesajjad, S., Ed.; Elsevier Inc.: Amsterdam, The Netherlands, 2011; pp. 137–183. ISBN 9781437744613. [Google Scholar]
- Latko-Durałek, P.; McNally, T.; Macutkevic, J.; Kay, C.; Boczkowska, A. Hot-melt adhesives based on co-polyamide and multiwalled carbon nanotubes. J. Appl. Polym. Sci. 2017, 1, 1–15. [Google Scholar] [CrossRef]
- Paul, C.W. Hot Melt Adhesives for Dermal Application. U.S. Patent 6,448,303, 10 September 2002. [Google Scholar]
- Kalish, J.P.; Ramalingam, S.; Bao, H.; Hall, D.; Wamuo, O.; Ling, S.; Paul, C.W.; Eodice, A. An analysis of the role of wax in hot melt adhesives. Int. J. Adhes. Adhes. 2015, 60, 63–68. [Google Scholar] [CrossRef]
- Fernández, M.; Landa, M.; Muñoz, M.E.; Santamaría, A. Tackiness of an electrically conducting polyurethanenanotube nanocomposite. Int. J. Adhes. Adhes. 2010, 30, 609–614. [Google Scholar] [CrossRef]
- Fernández, M.; Landa, M.; Muñoz, M.E.; Santamaría, A. Thermal and viscoelastic features of new nanocomposites based on a hot-melt adhesive polyurethane and multi-walled carbon nanotubes. Macromol. Mater. Eng. 2010, 295, 1031–1041. [Google Scholar] [CrossRef]
- Landa, M.; Canales, J.; Fernández, M.; Muñoz, M.E.; Santamaría, A. Effect of MWCNTs and graphene on the crystallization of polyurethane based nanocomposites, analyzed via calorimetry, rheology and AFM microscopy. Polym. Test. 2014, 35, 101–108. [Google Scholar] [CrossRef]
- Landa, M.; Fernández, M.; Muñoz, M.E.; Santamaría, A. The effect of flow on the physical properties of polyurethane/carbon nanotubes nanocomposites:repercussion on their use as electrically conductive hot-melt adhesives. Polym. Compos. 2015, 704–712. [Google Scholar] [CrossRef]
- Canales, J.; Muñoz, M.E.; Fernández, M.; Santamaría, A. Rheology, electrical conductivity and crystallinity of a polyurethane/graphene composite: Implications for its use as a hot-melt adhesive. Compos. Part. A Appl. Sci. Manuf. 2016, 84, 9–16. [Google Scholar] [CrossRef]
- Wehnert, F.; Pötschke, P.; Jansen, I. Hotmelts with improved properties by integration of carbon nanotubes. Int. J. Adhes. Adhes. 2015, 62, 63–68. [Google Scholar] [CrossRef]
- Cecen, V.; Boudenne, A.; Ibos, L.; Novák, I.; Nógellová, Z.; Prokeš, J.; Krupa, I. Electrical, mechanical and adhesive properties of ethylene-vinylacetate copolymer (EVA) filled with wollastonite fibers coated by silver. Eur. Polym. J. 2008, 44, 3827–3834. [Google Scholar] [CrossRef]
- Pomposo, J.A.; Rodríguez, J.; Grande, H. Polypyrrole-based conducting hot melt adhesives for EMI shielding applications. Synth. Met. 1999, 104, 107–111. [Google Scholar] [CrossRef]
- Vlachopoulos, J.; Strutt, D. The role of rheology in polymer extrusion. New Technol. Extrus. 2003, 1–26. [Google Scholar] [CrossRef]
- Vlachopoulos, J.; Strutt, D. Rheology of molten polymers. In Multilayer Flexible Packaging; Elsevier Inc.: Amsterdam, The Netherlands, 2010; pp. 57–72. ISBN 9780815520214. [Google Scholar]
- Zabegaeva, O.N.; Sapozhnikov, D.A.; Buzin, M.I.; Krestinin, A.V.; Kotelnikov, V.A.; Baiminov, B.A.; Afanasyev, E.S.; Pashunin, Y.M.; Vygodskii, Y.S. Nylon-6 and single-walled carbon nanotubes polyamide composites. High Perform. Polym. 2017, 29, 411–421. [Google Scholar] [CrossRef]
- Ha, H.; Kim, S.C.; Ha, K. Morphology and properties of polyamide/multi-walled carbon nanotube composites. Macromol. Res. 2010, 18, 660–667. [Google Scholar] [CrossRef]
- Li, Y.; Shimizu, H. High-shear melt processing of polymer–carbon nanotube composites. Polym. Nanotub. Compos. Prep. Prop. Appl. 2011, 133–154. [Google Scholar] [CrossRef]
- Kasaliwal, G.R.; Göldel, A.; Pötschke, P.; Heinrich, G. Influences of polymer matrix melt viscosity and molecular weight on MWCNT agglomerate dispersion. Polymer 2011, 52, 1027–1036. [Google Scholar] [CrossRef]
- Kim, S.; Drzal, L.T. Comparison of exfoliated graphite nanoplatelets (xGnP) and CNTs for reinforcement of EVA nanocomposites fabricated by solution compounding method and three screw rotating systems. J. Adhes. Sci. Technol. 2009, 23, 1623–1638. [Google Scholar] [CrossRef]
- Beaume, F.; Lauprêtre, F.; Monnerie, L.; Maxwell, A.; Davies, G.R. Secondary transitions of aryl-aliphatic polyamides. I. Broadband dielectric investigation. Polymer 2000, 41, 2677–2690. [Google Scholar] [CrossRef]
- Curtis, A.J. Dielectric Properties of Polyamides: Polyhexamethylene Adiparnide and Polyhexarnethylene Sebacarnide. J. Res. Nat. Bur. Stand. Sect. A Phys. Chem. 1961, 65, 185. [Google Scholar] [CrossRef] [PubMed]
- Bertasius, P.; Meisak, D.; Macutkevic, J.; Kuzhir, P.; Selskis, A.; Volnyanko, E.; Banys, J. Fine tuning of electrical transport and dielectric properties of epoxy/carbon nanotubes composites via magnesium oxide additives. Polymers 2019, 11, 2044. [Google Scholar] [CrossRef]
- Yadav, P.; Srivastava, A.K.; Yadav, M.K.; Kripal, R.; Singh, V.; Lee, D.B.; Lee, J.H. Synthesis and dielectric characterization of polycarbonate/multi-wall carbon nanotubes nanocomposite. Arab. J. Chem. 2015, 12, 440–446. [Google Scholar] [CrossRef]
- Vilčáková, J.; Moučka, R.; Svoboda, P.; Ilčíková, M.; Kazantseva, N.; Hřibová, M.; Mičušík, M.; Omastová, M. Effect of surfactants and manufacturing methods on the electrical and thermal conductivity of carbon nanotube/silicone composites. Molecules 2012, 17, 13157–13174. [Google Scholar] [CrossRef]
- Meier, J.G.; Crespo, C.; Pelegay, J.L.; Castell, P.; Sainz, R.; Maser, W.K.; Benito, A.M. Processing dependency of percolation threshold of MWCNTs in a thermoplastic elastomeric block copolymer. Polymer 2011, 52, 1788–1796. [Google Scholar] [CrossRef]
- Liu, T.X.; Huang, S. 15-Morphology and thermal behavior of polymer/carbon nanotube composites. Woodhead Publ. Ser. Compos. Sci. Eng. 2010, 529–562. [Google Scholar] [CrossRef]
- Jang, B.N.; Wilkie, C.A. The effect of clay on the thermal degradation of polyamide 6 in polyamide 6/clay nanocomposites. Polymer 2005, 46, 3264–3274. [Google Scholar] [CrossRef]
- Mahmood, N.; Islam, M.; Hameed, A.; Saeed, S. Polyamide 6/multiwalled carbon nanotubes nanocomposites with modified morphology and thermal properties. Polymers 2013, 5, 1380–1391. [Google Scholar] [CrossRef]
- Greco, R.; Nicolais, L. Glass transition temperature in nylons. Polymer 1976, 17, 1049–1053. [Google Scholar] [CrossRef]
- Xie, X.L.; Mai, Y.W.; Zhou, X.P. Dispersion and alignment of carbon nanotubes in polymer matrix: A review. Mater. Sci. Eng. R Rep. 2005, 49, 89–112. [Google Scholar] [CrossRef]
- Brosse, A.-C.; Tencé-Girault, S.; Piccione, P.M.; Leibler, L. Effect of multi-walled carbon nanotubes on the lamellae morphology of polyamide-6. Polymer 2008, 49, 4680–4686. [Google Scholar] [CrossRef]
- Fernandes, E.G.; Lombardi, A.; Solaro, R.; Chiellini, E. Thermal characterization of three-component blends for hot-melt adhesives. J. Appl. Polym. Sci. 2001, 80, 2889–2901. [Google Scholar] [CrossRef]
- Yang, H.; Peng, P.; Sun, Q.; Zhang, Q.; Ren, N.; Han, F.; She, D. Developed carbon nanotubes/gutta percha nanocomposite films with high stretchability and photo-thermal conversion efficiency. J. Mater. Res. Technol. 2020, 9, 8884–8895. [Google Scholar] [CrossRef]
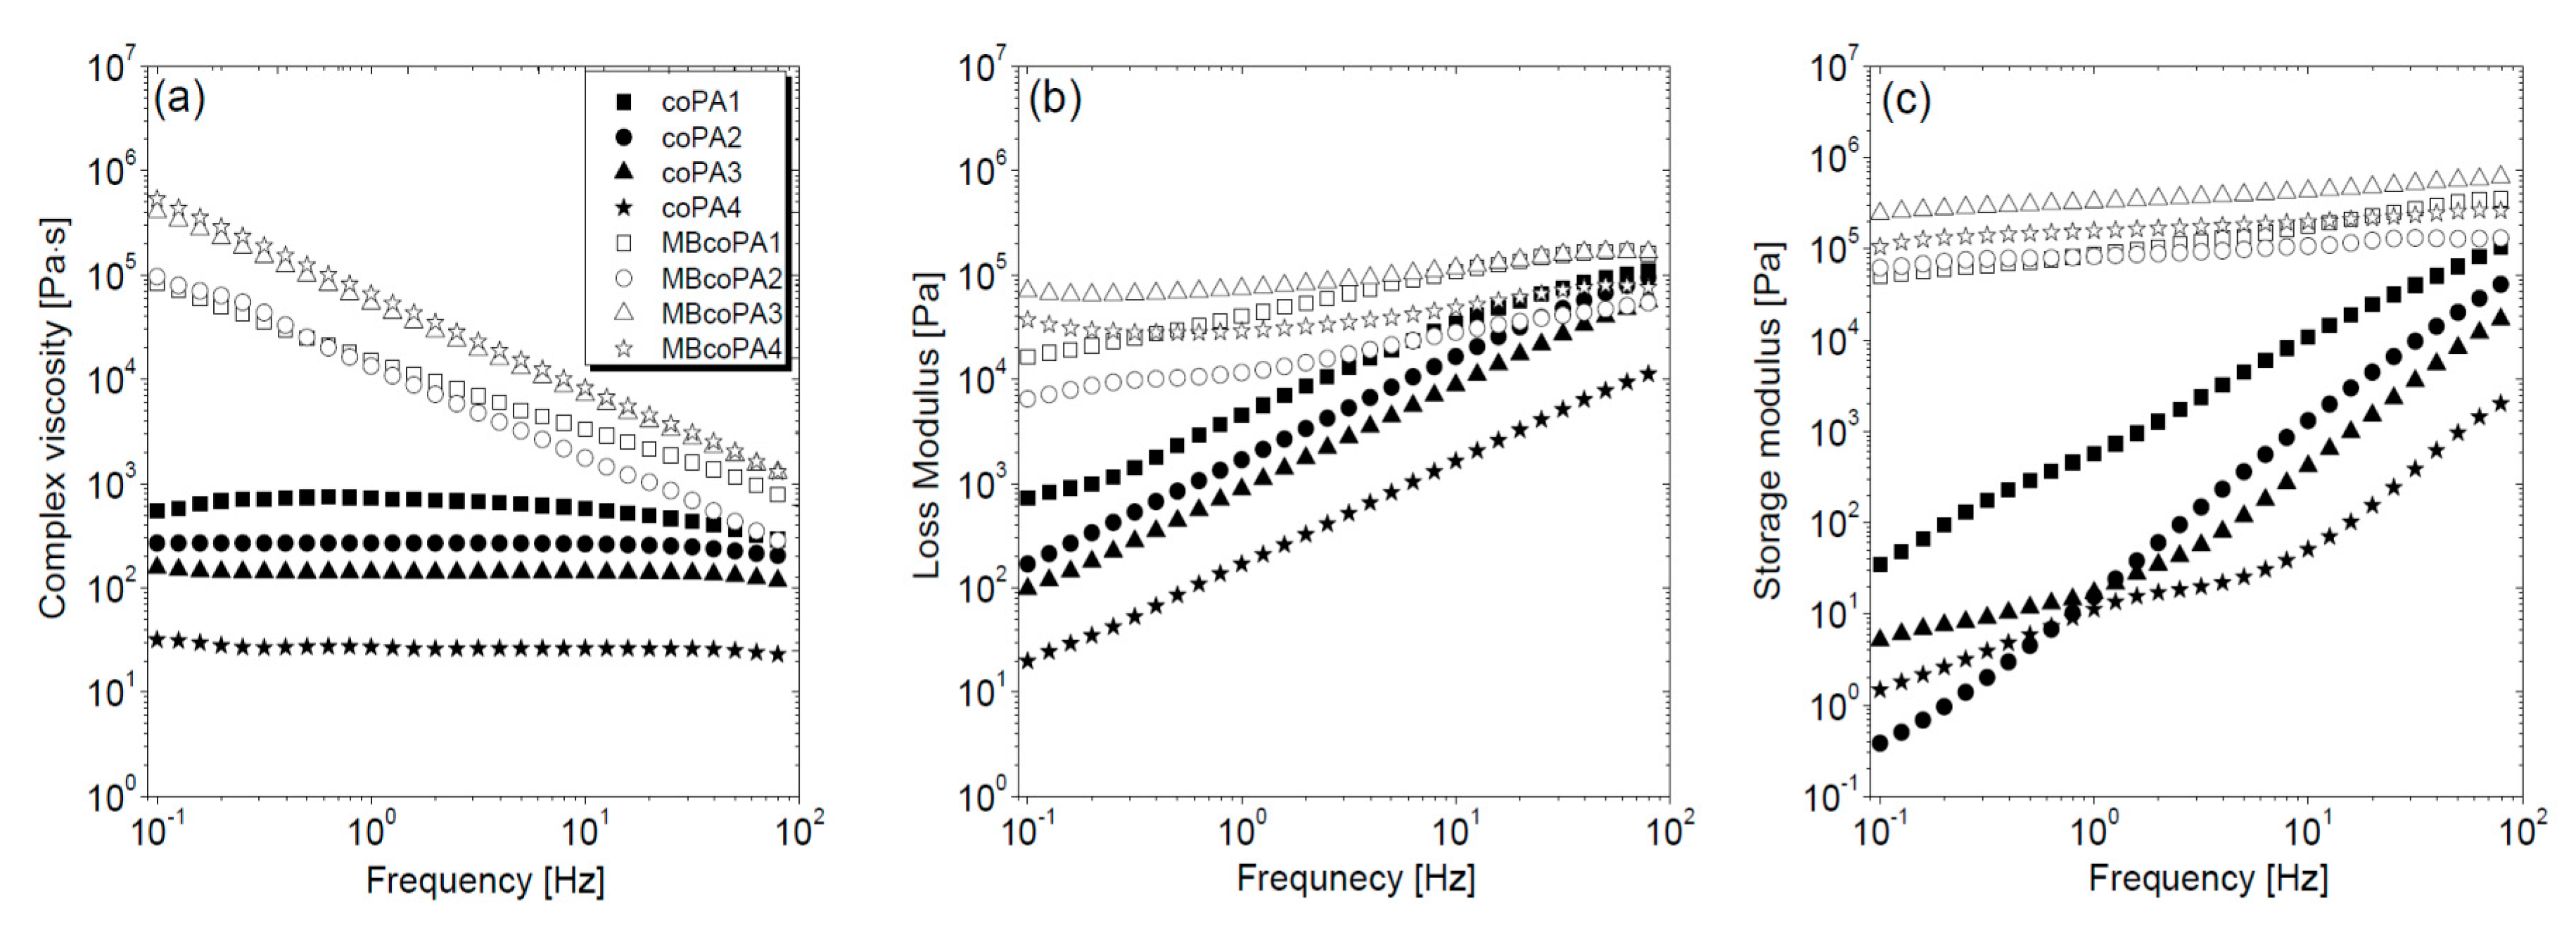
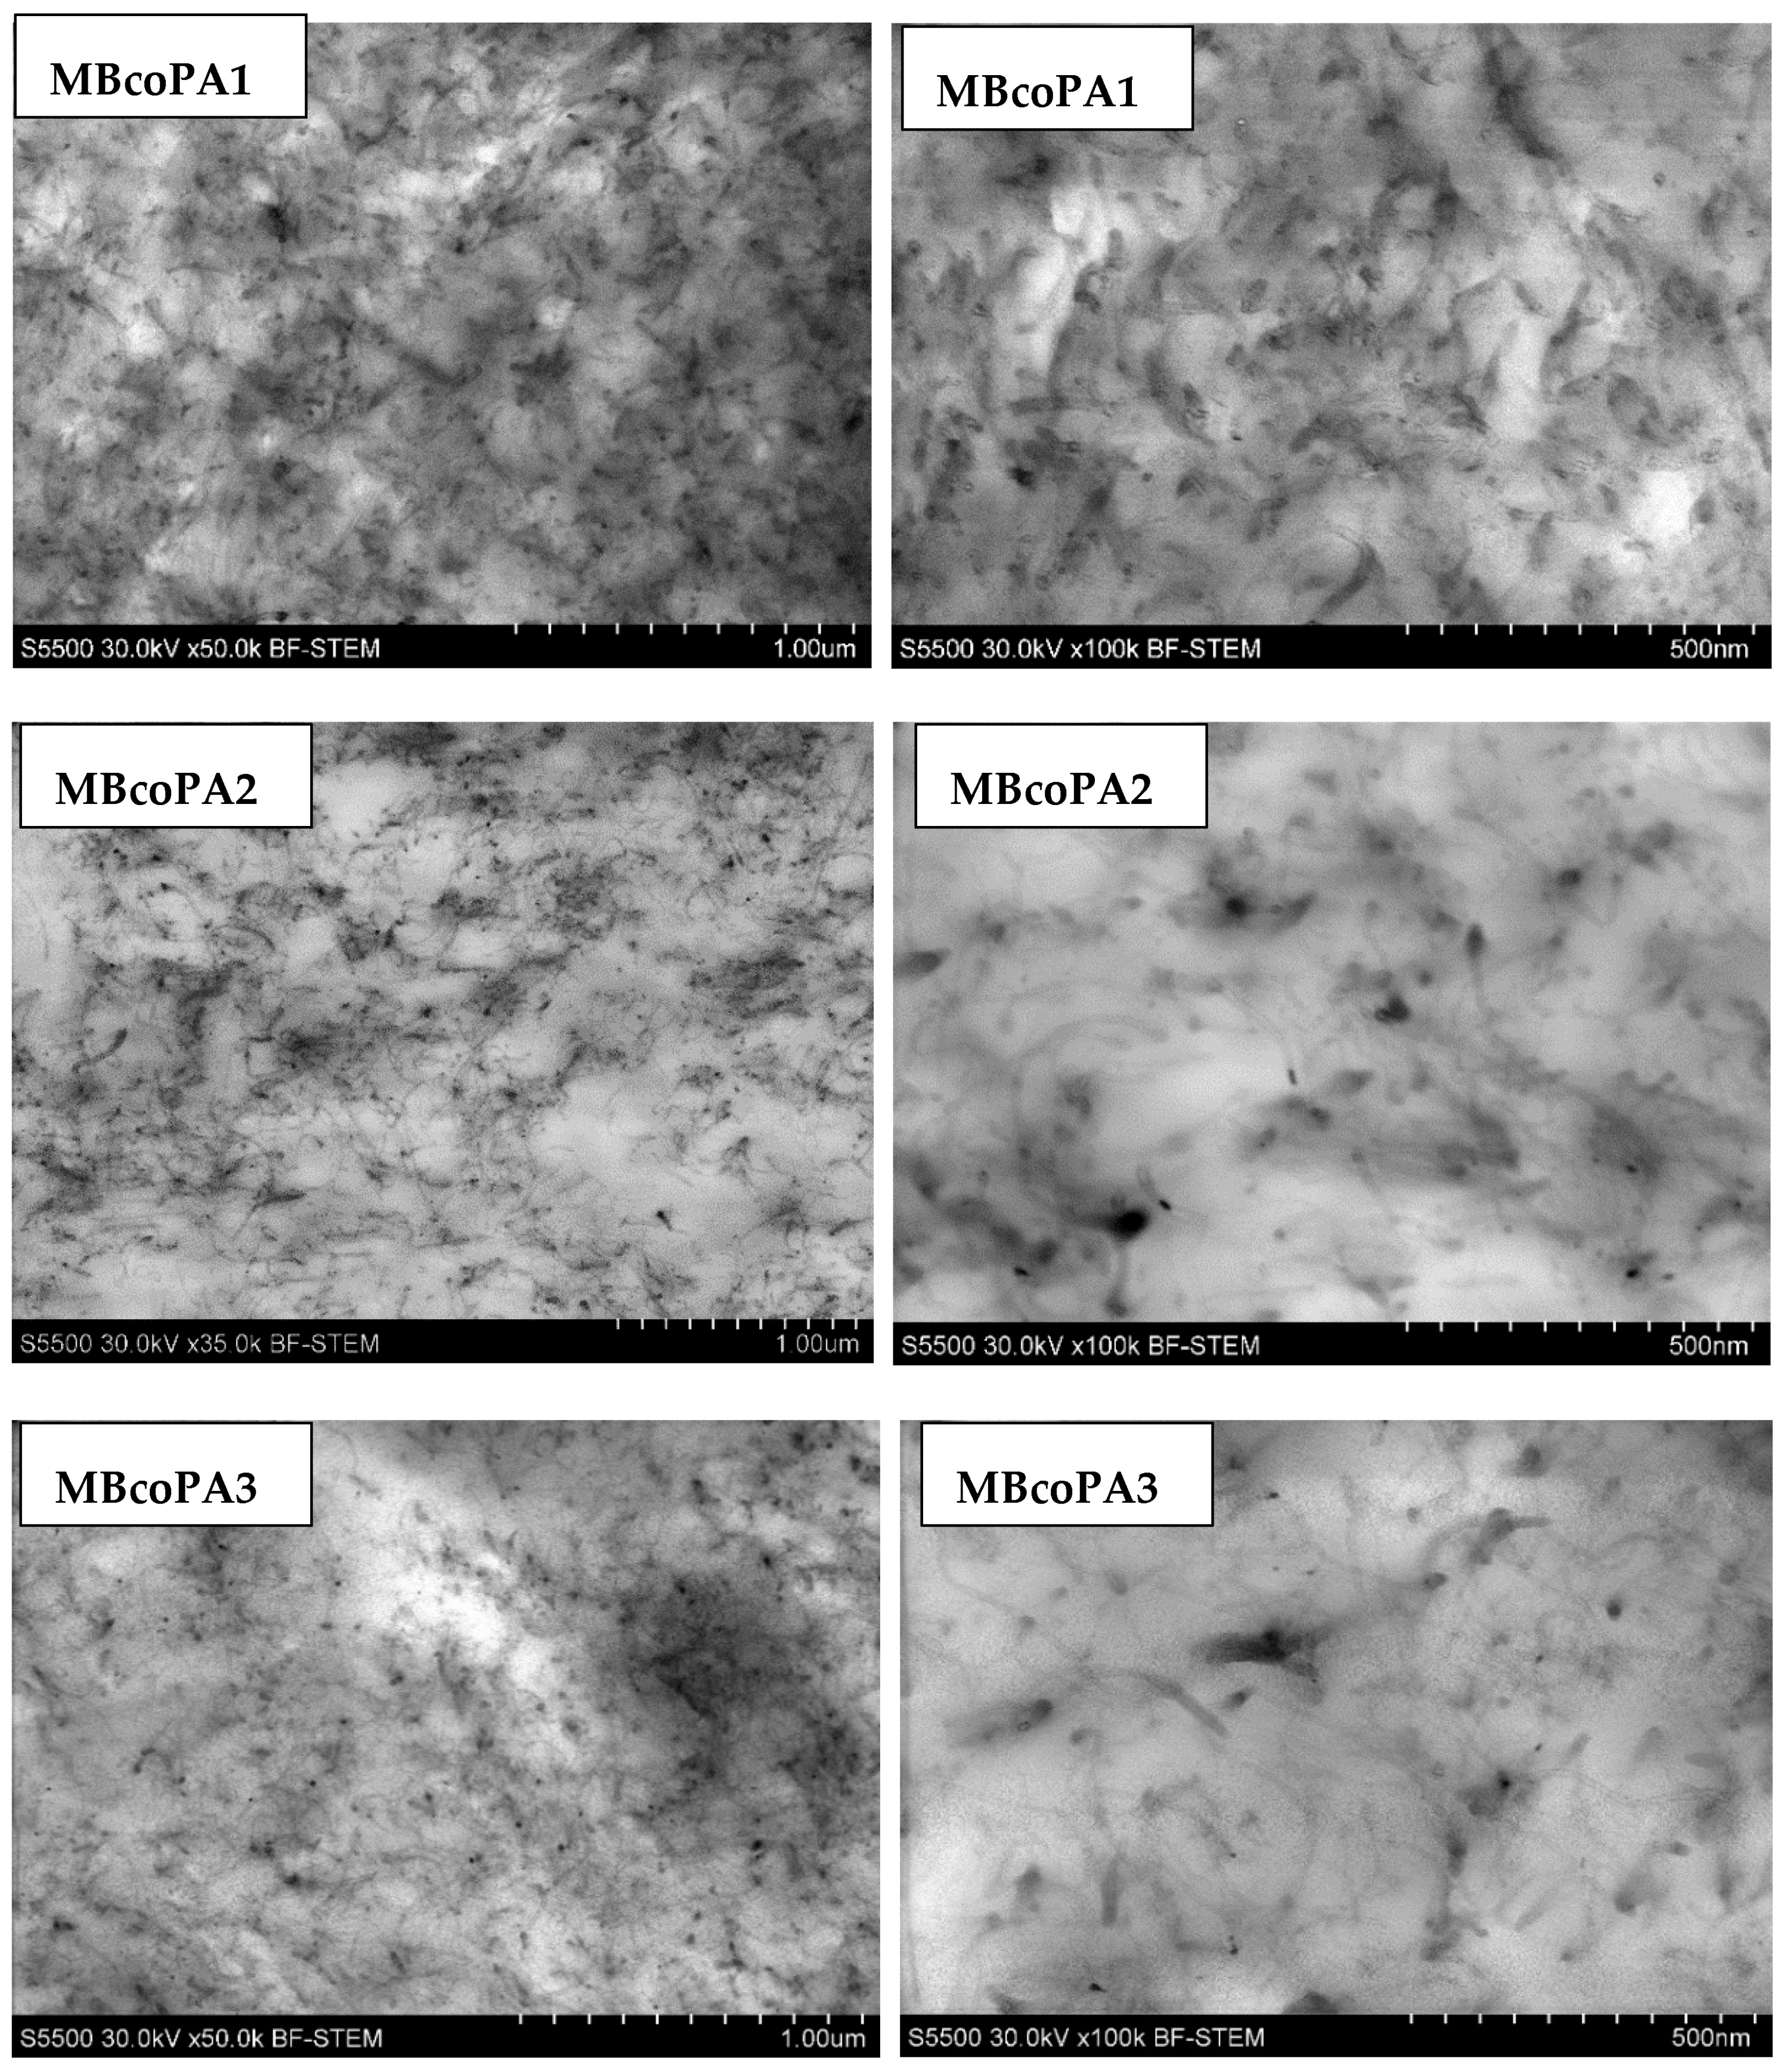

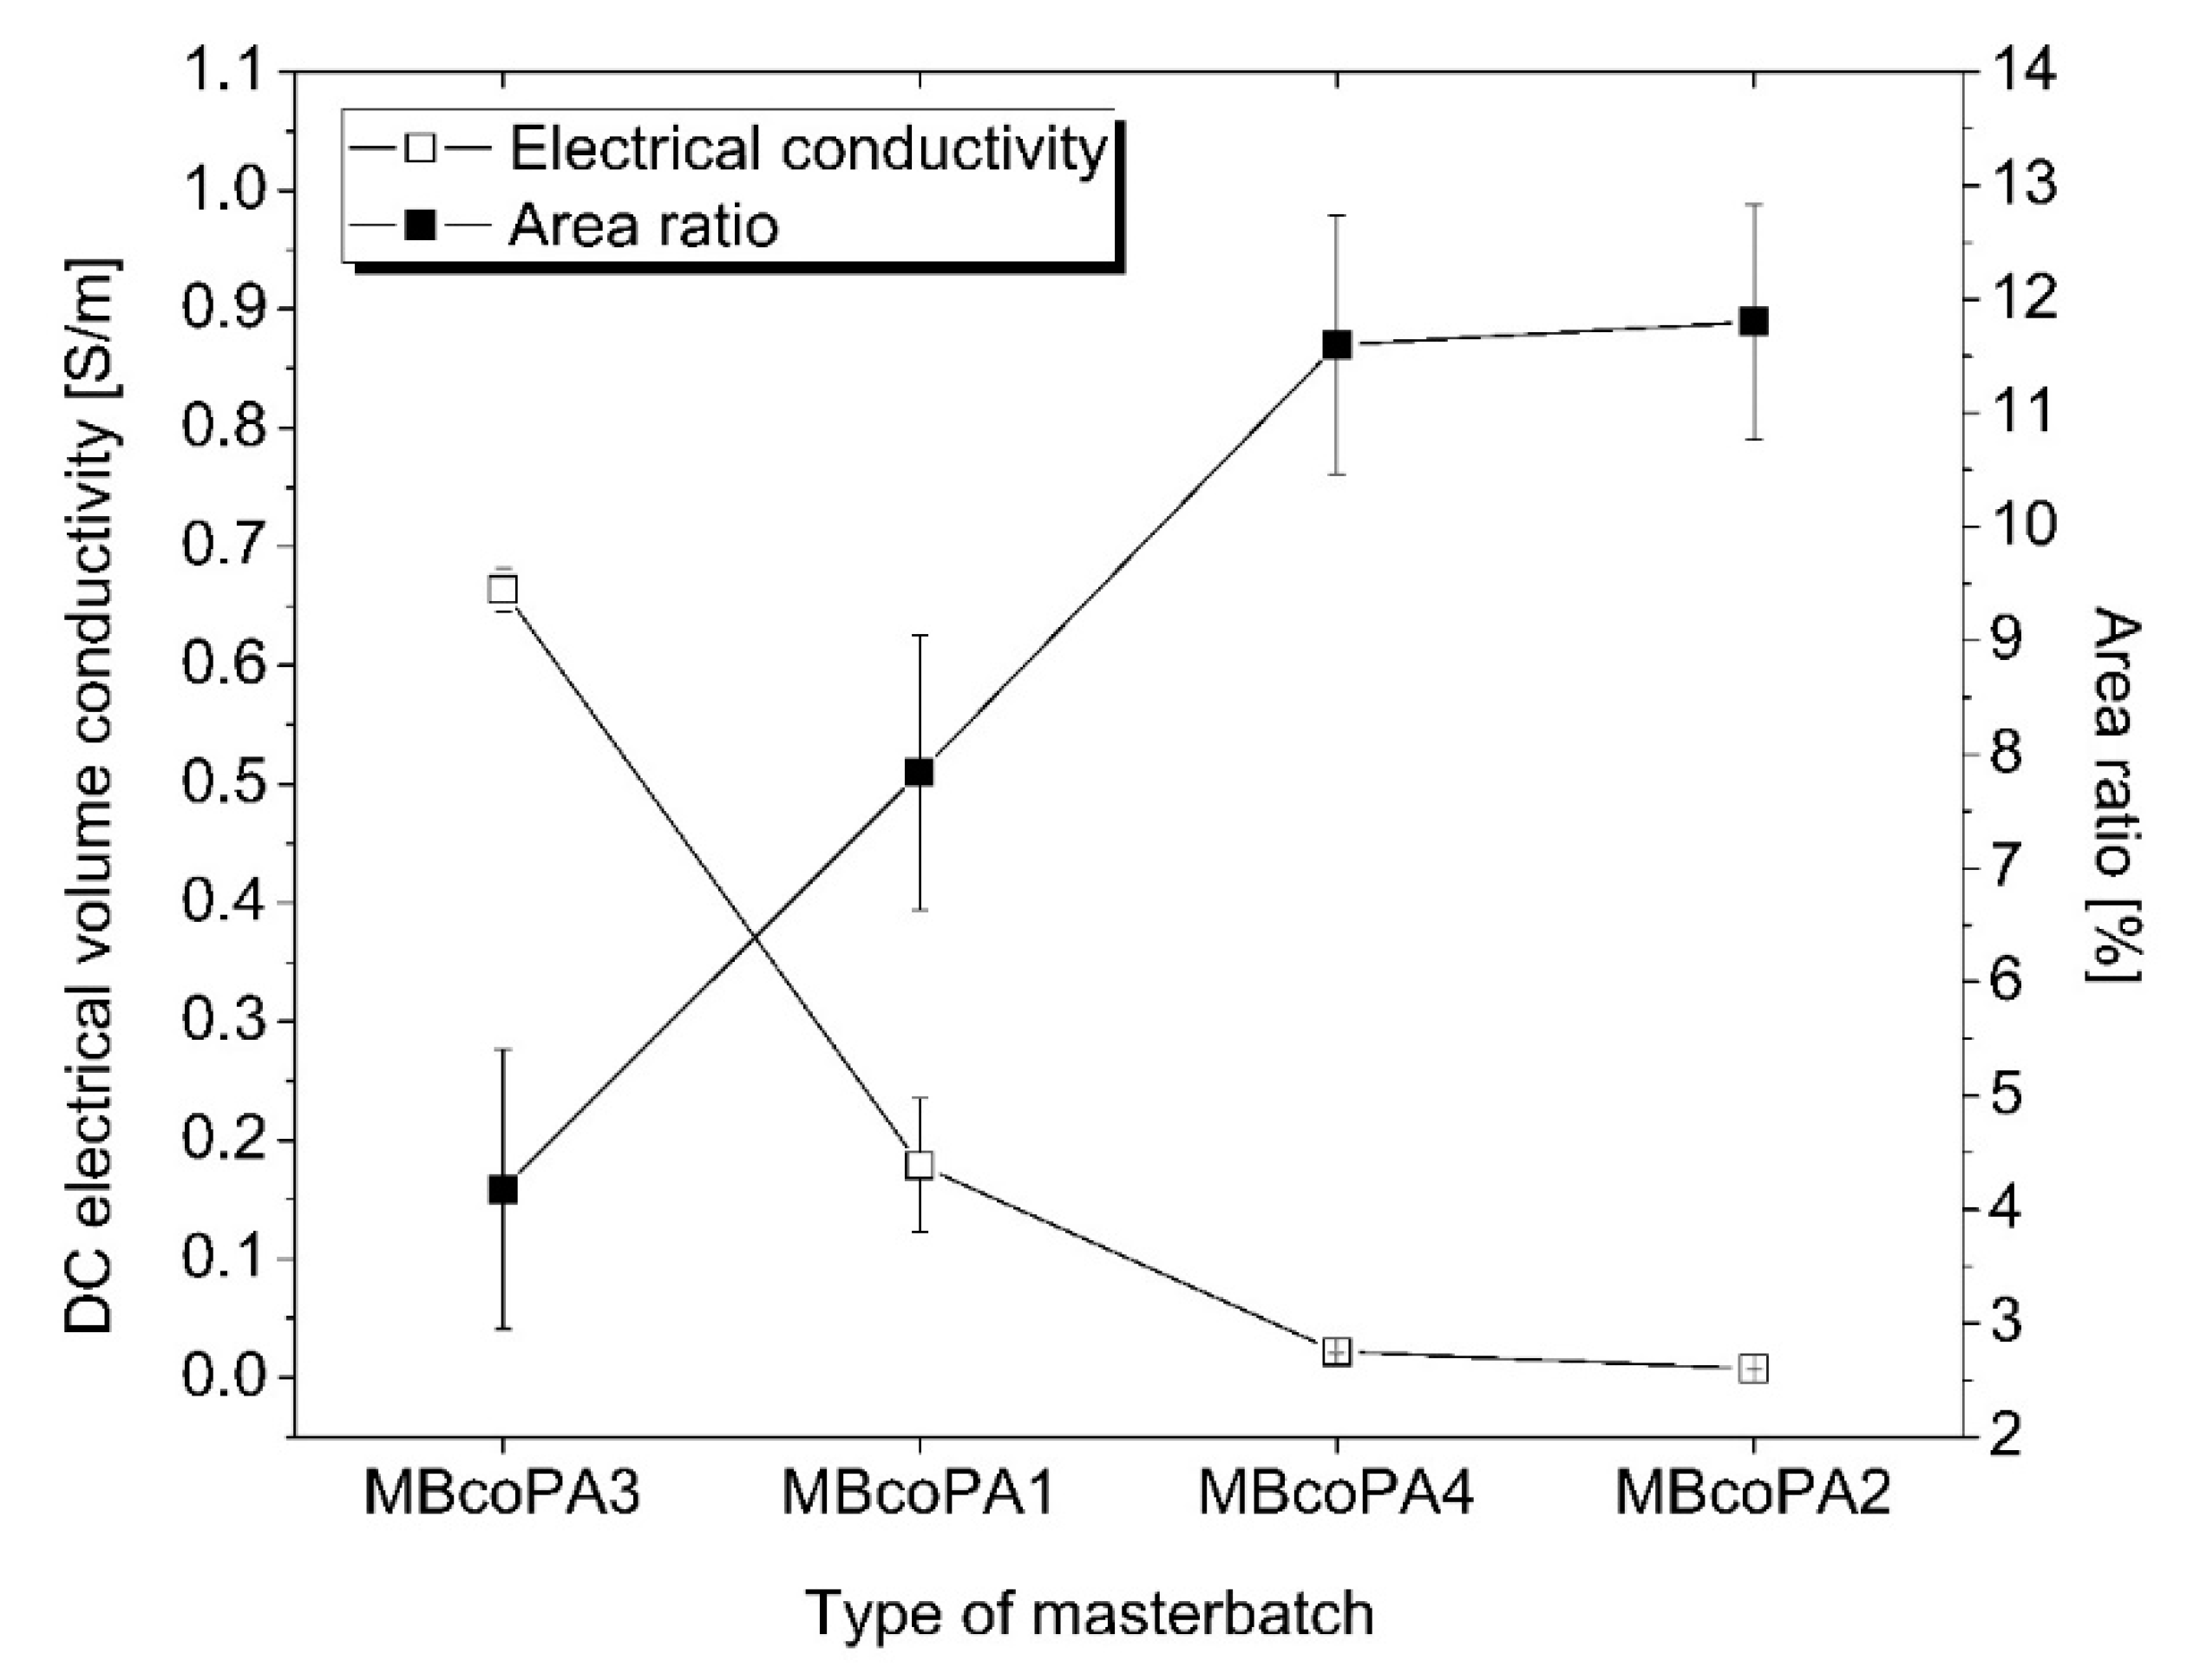
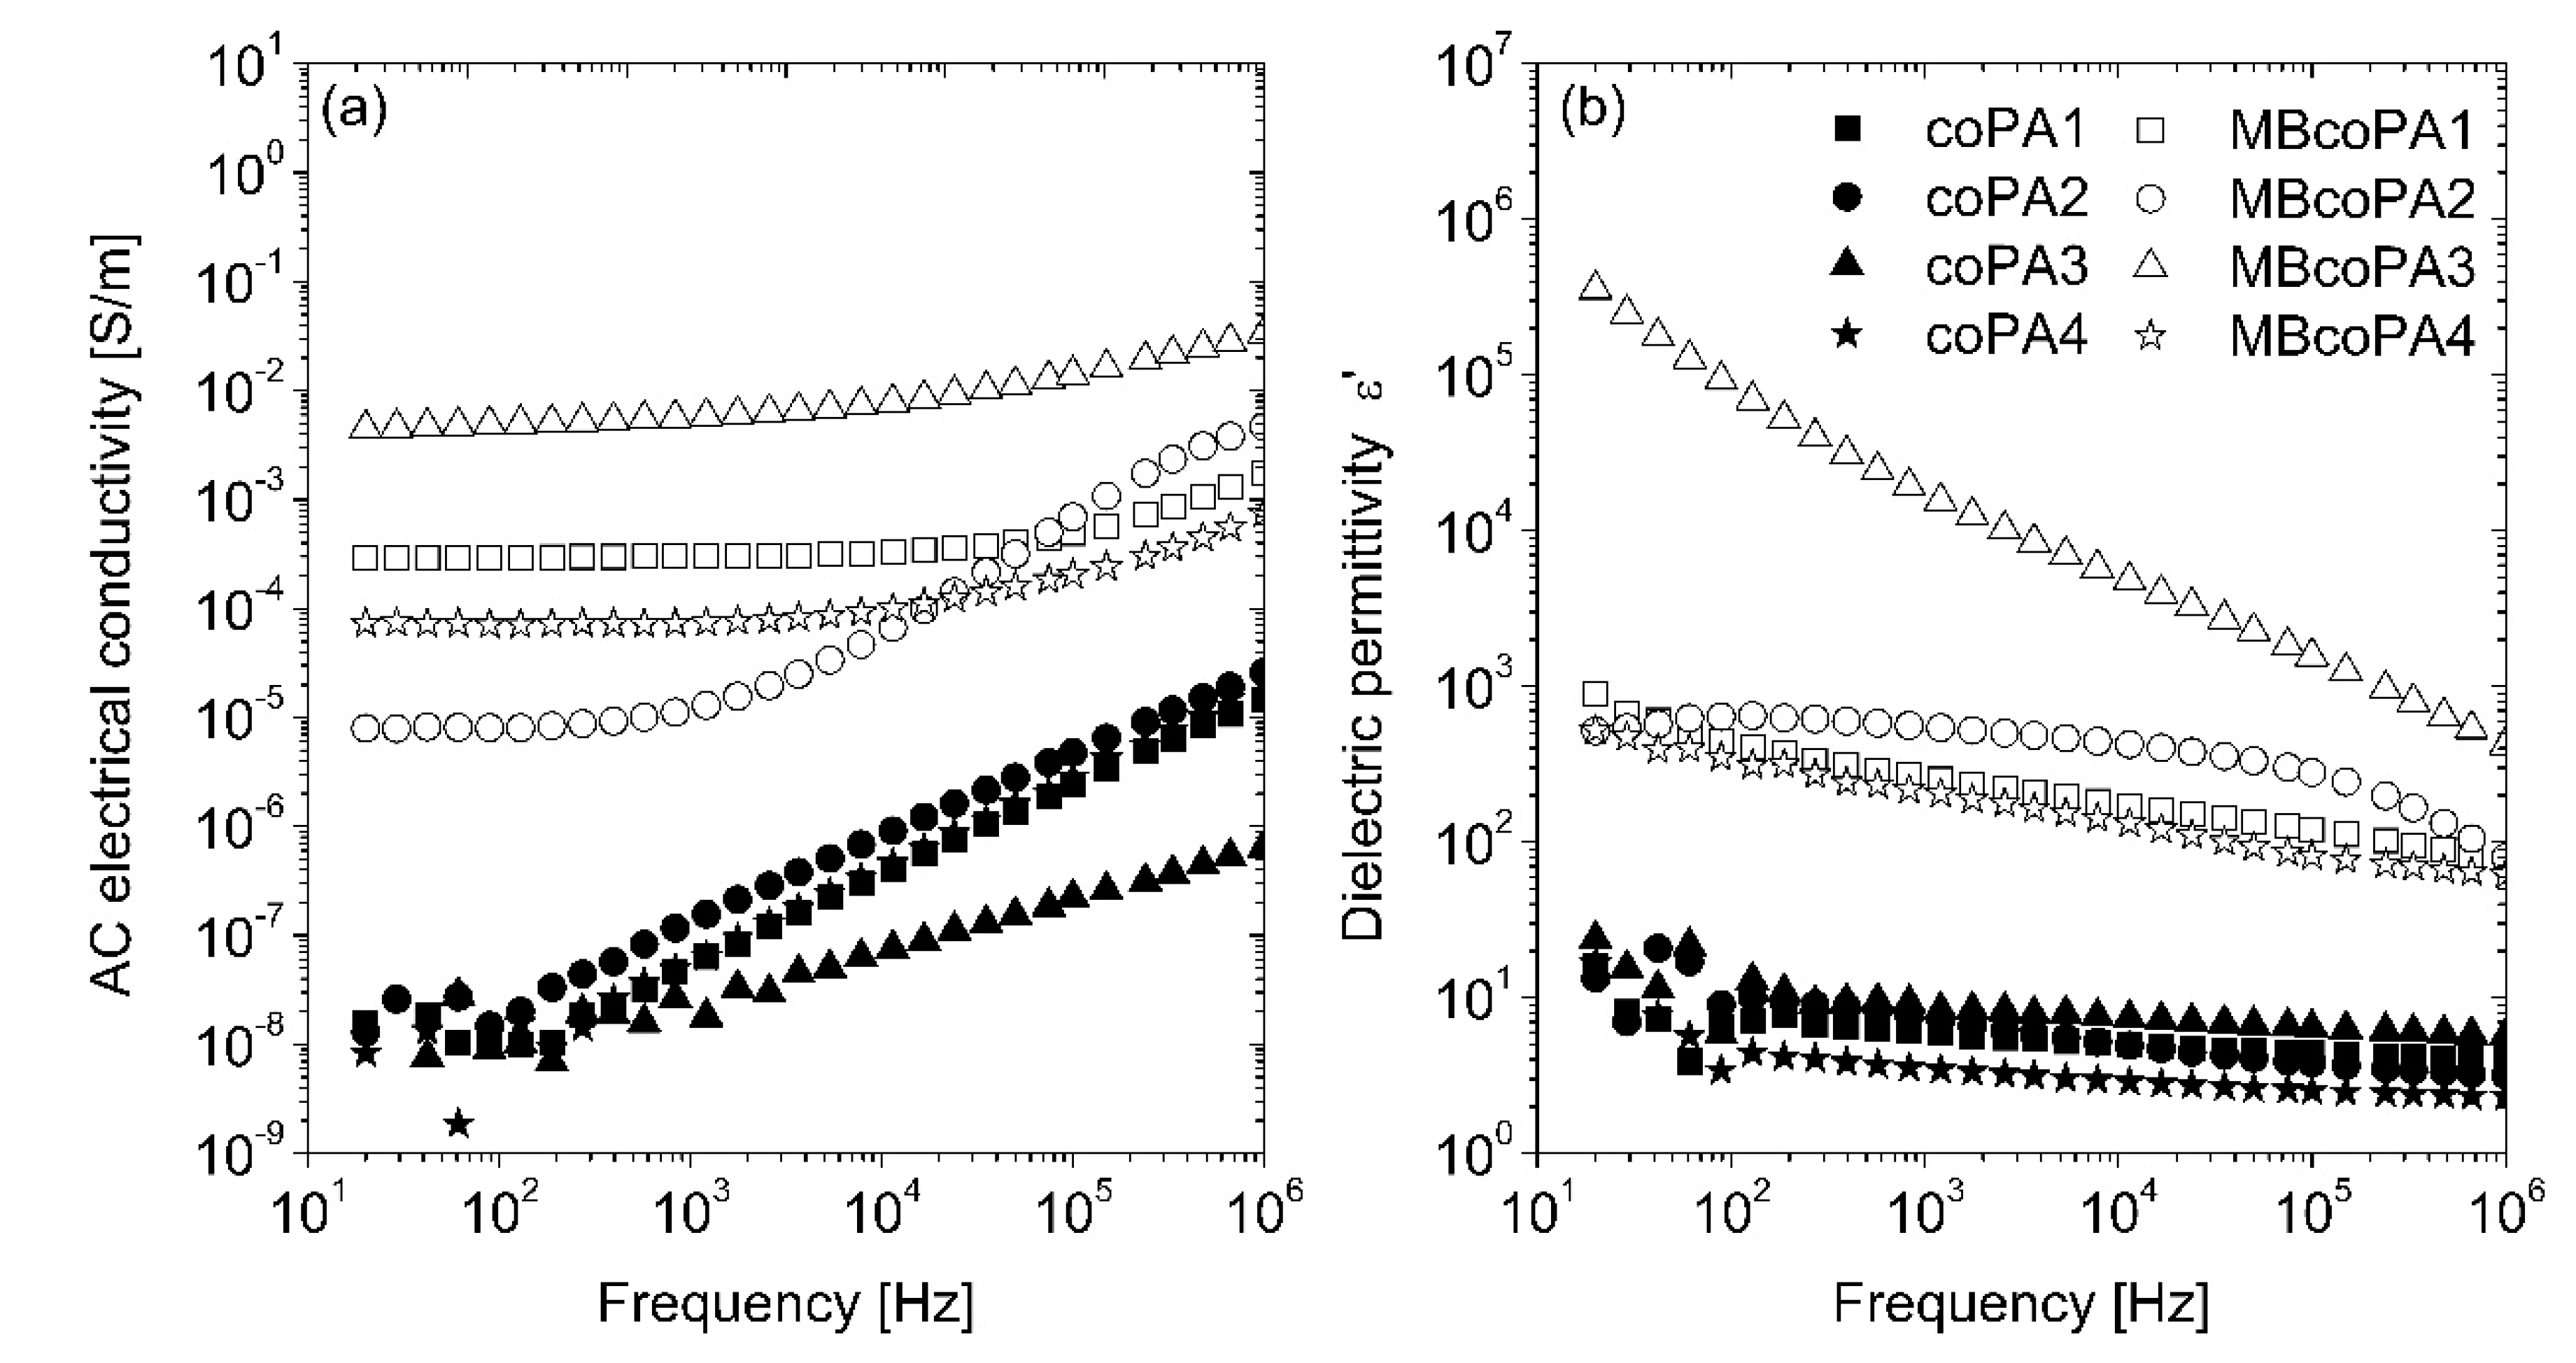
| Designation | Trade Name | Melt Viscosity 160 °C/2.16 kg (Pa·s) | Melt Volume Rate 160 °C/2.16 kg | Melting Point (°C) |
|---|---|---|---|---|
| coPA1 | Griltex® 1330 | 1200 | 9 | 125–135 |
| coPA2 | Griltex® 2A | 600 | 18 | 120–130 |
| coPA3 | Griltex® 1858 | 350 | 30 | 110–120 |
| coPA4 | Griltex® 1566 | 150 | 70 | 115–125 |
| Masterbatch Type | Optical Image | Histogram | Area Ratio (%) |
|---|---|---|---|
| MBcoPA1 MV = 1200 |  | 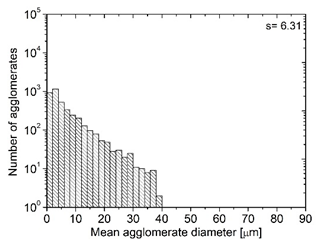 | 7.84 ± 1.21 |
| MBcoPA2 MV = 600 | 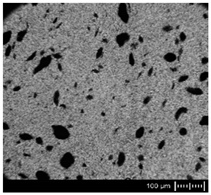 | 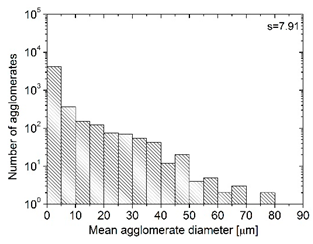 | 11.8 ± 1.03 |
| MBcoPA3 MV = 350 | 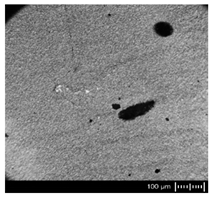 | 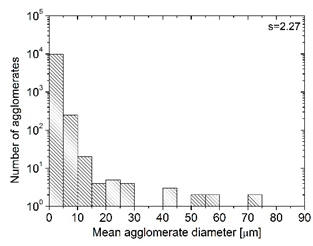 | 4.18 ± 1.23 |
| MBcoPA4 MV = 150 |  |  | 11.6 ± 1.14 |
| Adhesive Matrix | Filler Type | Filler Content (wt %) | Electrical Conductivity (S/m) | Ref. |
|---|---|---|---|---|
| epoxy | silver flakes | 70 | 102 | [11] |
| epoxy | reduced graphene oxide | 50 | 10−8 | [18] |
| epoxy | MWCNT | 12 | 10−1 | [17] |
| ethylene-vinyl acetate | graphite nanoplatelets | 30 | 10−5 | [50] |
| polyurethane HMA | graphene | 6 | 10−2 | [39] |
| polyolefin HMA | MWCNT | 5 | 10−2 | [40] |
| coPA3 HMA | MWCNT | 7 | 0.67 | this work |
| Material | TGA | DSC | |||||||
|---|---|---|---|---|---|---|---|---|---|
| First Heating | Second Heating | Cooling Tc (°C) | |||||||
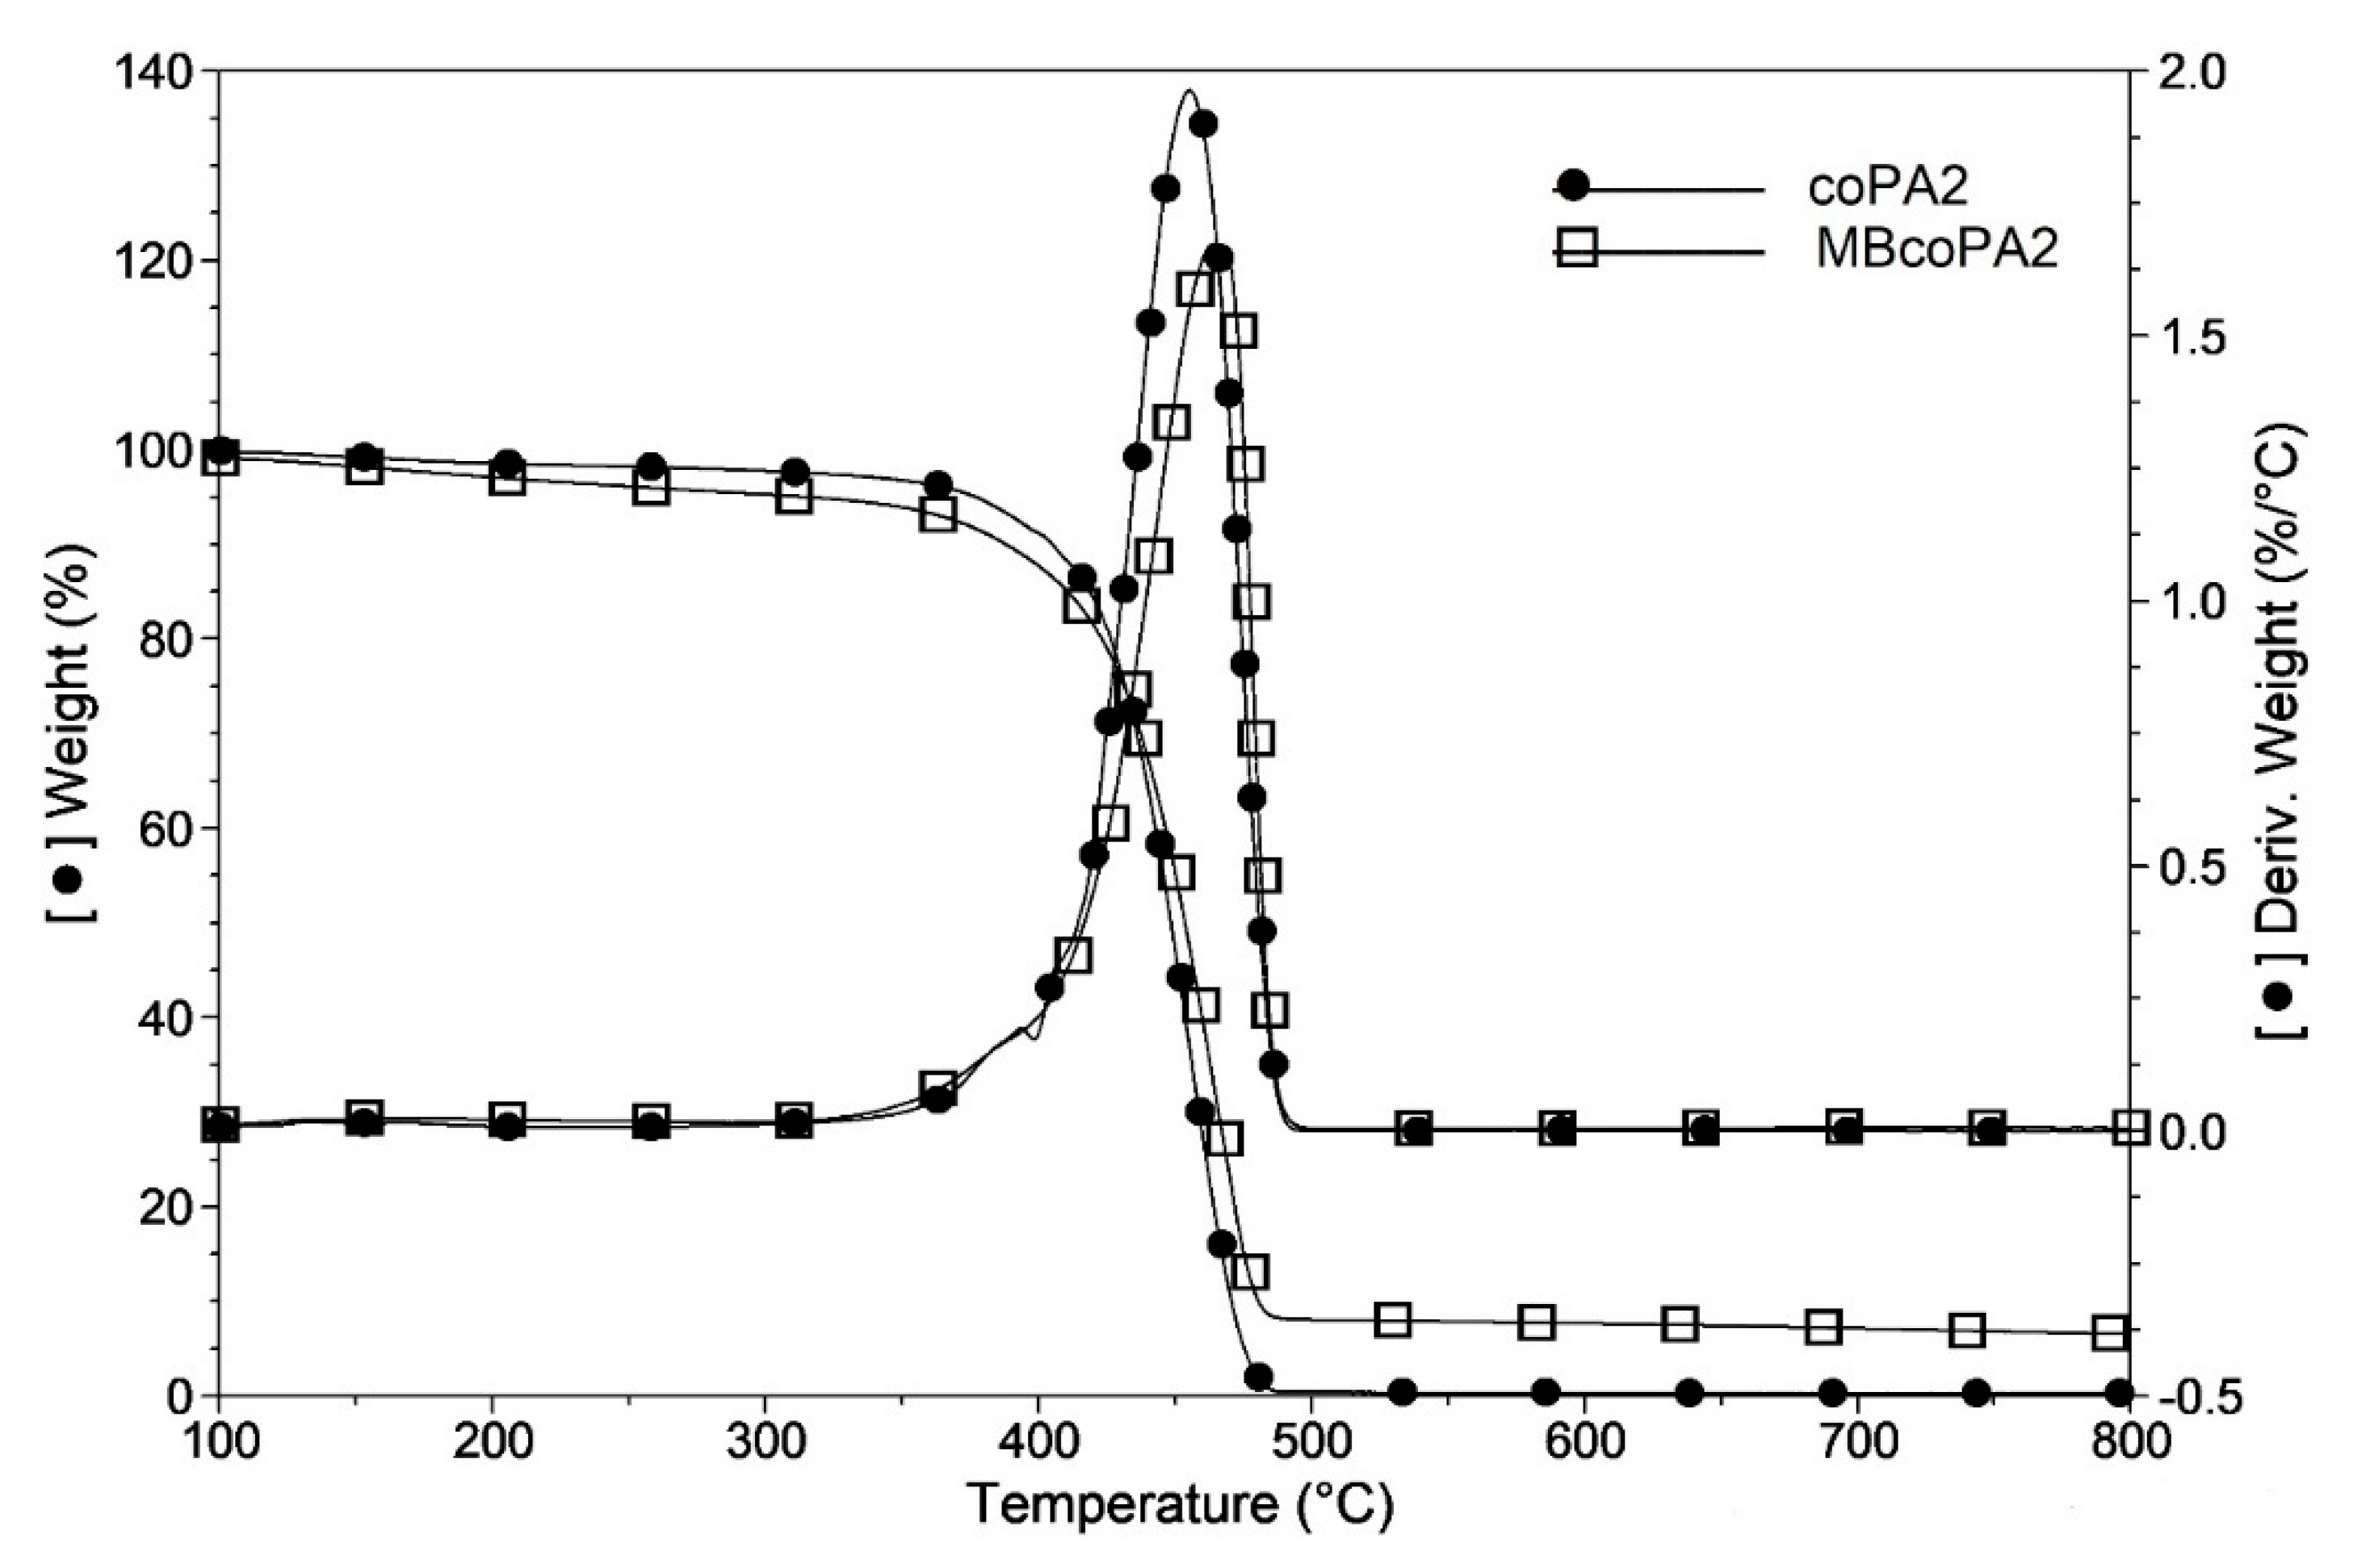
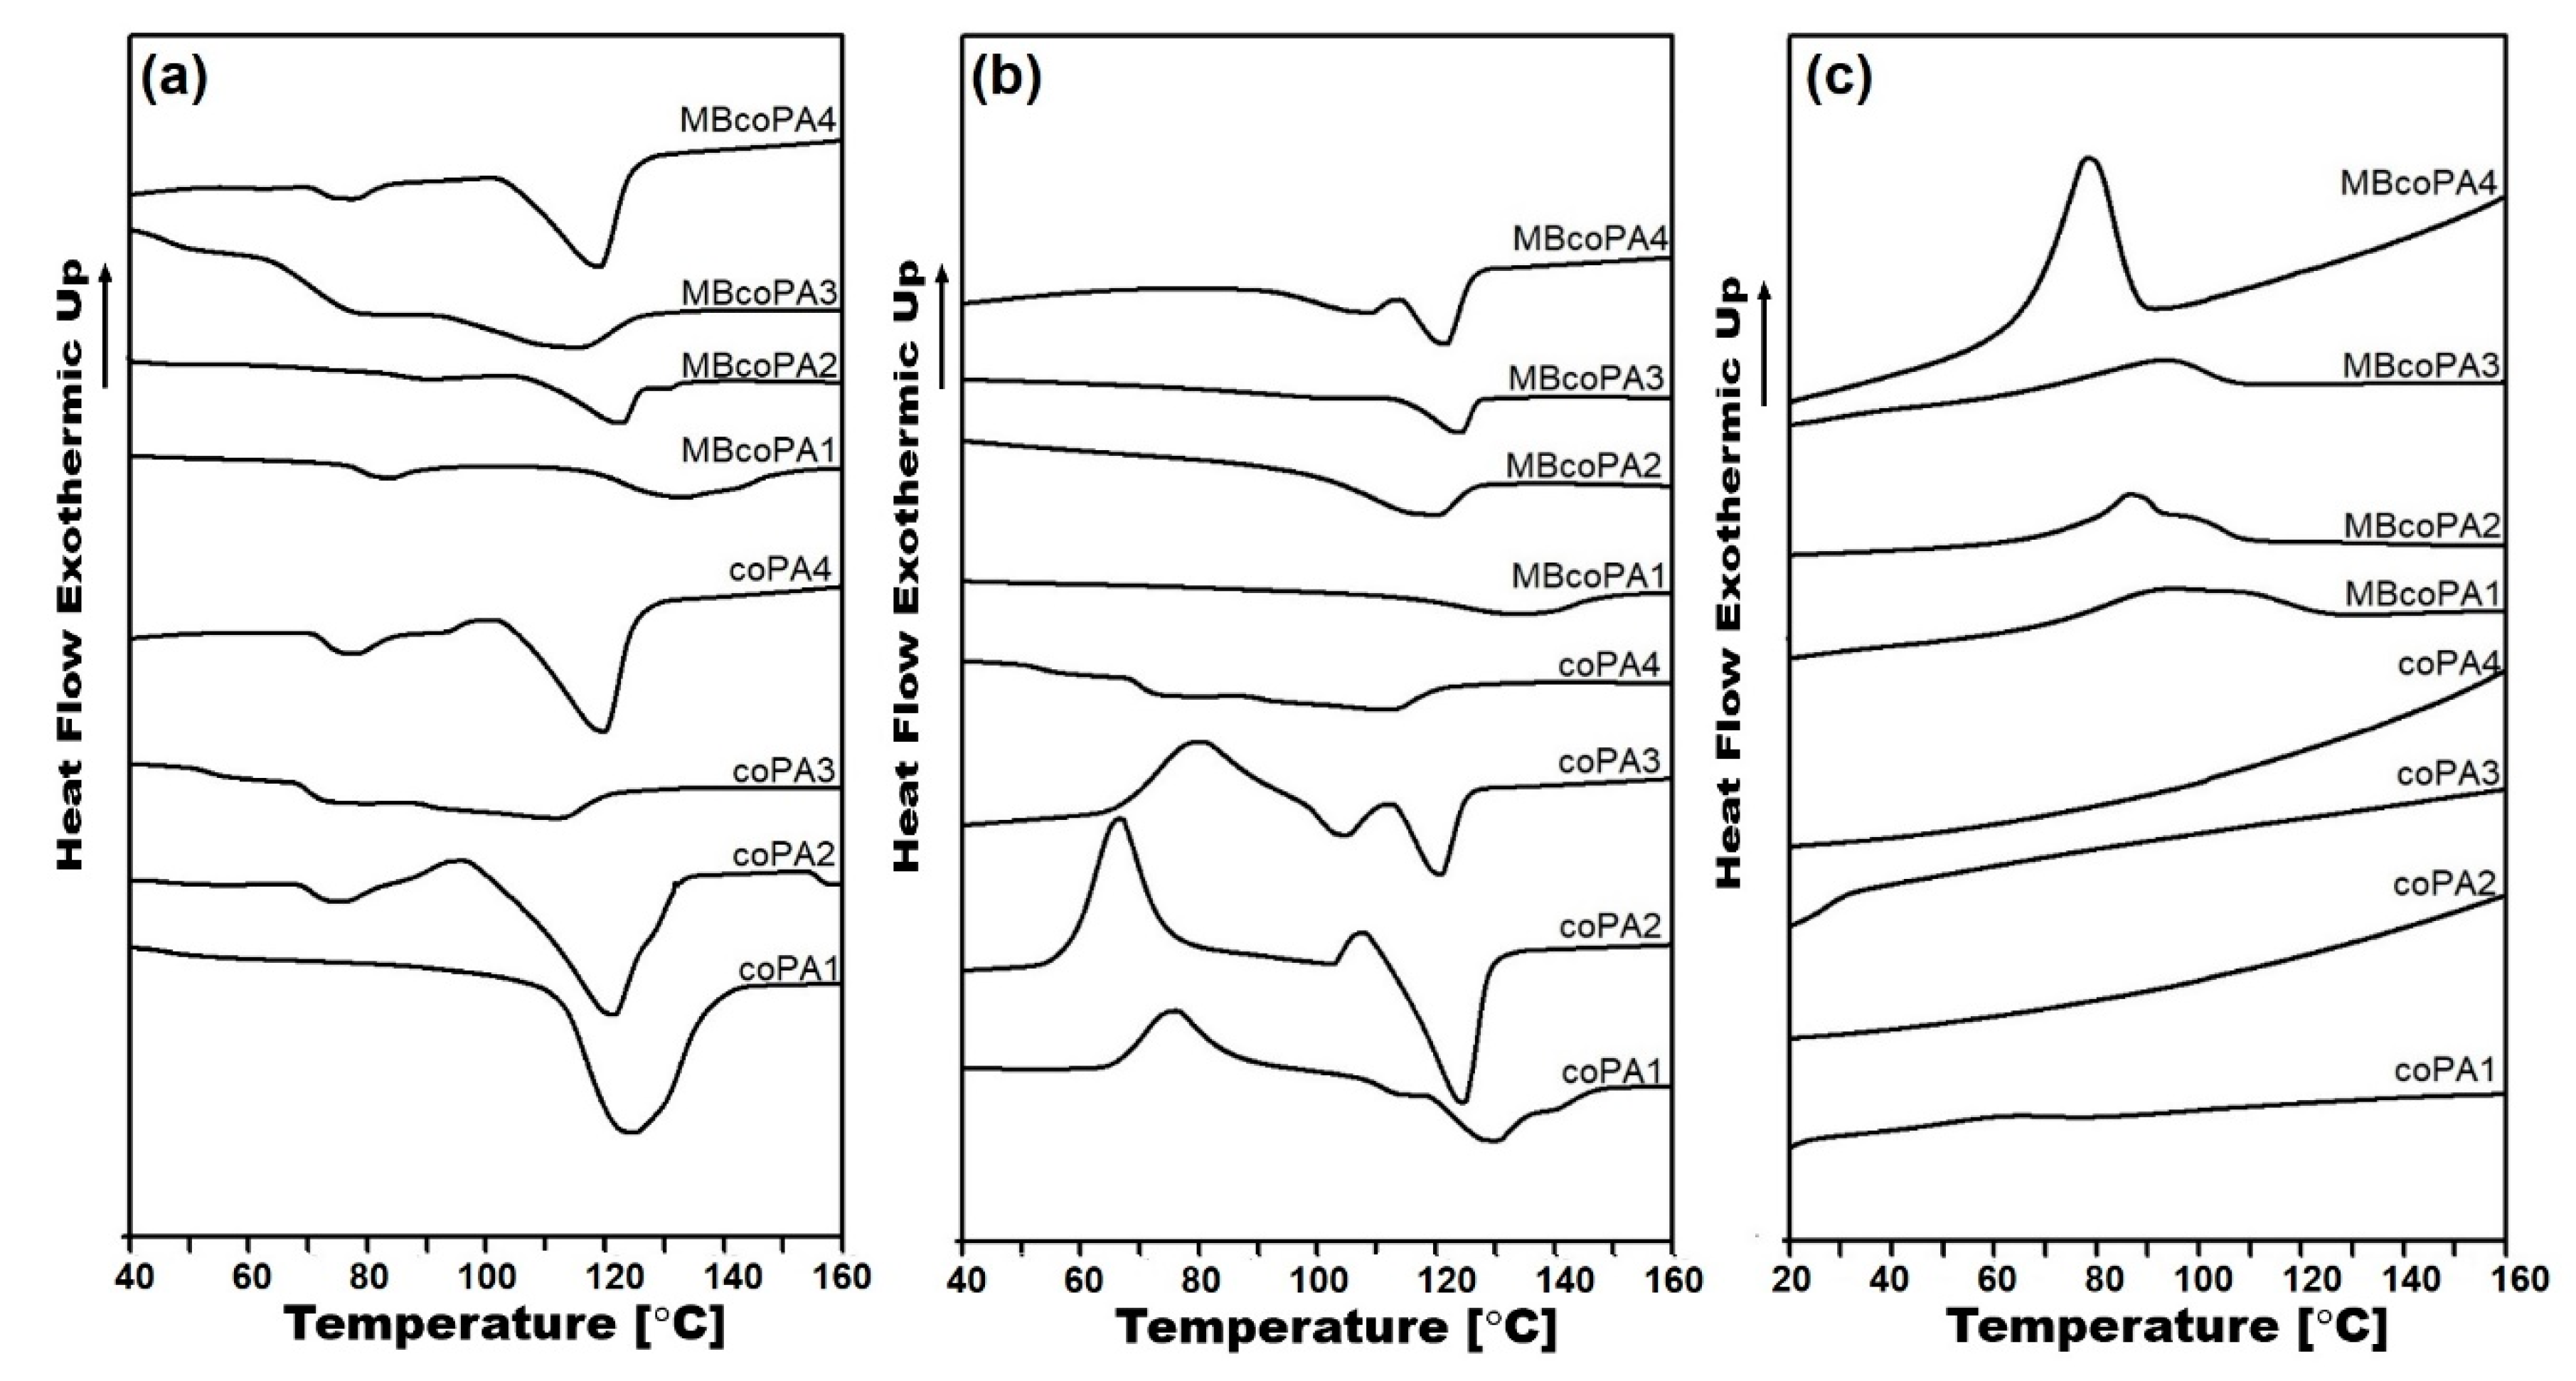
| T2% (°C) | T5% (°C) | Td (°C) | Tg (°C) | Tm (°C) | ΔHm (J/g) | Tm (°C) | ΔHm (J/g) | ||
| coPA1 | 188 | 339 | 455 | 46.1 | 130 | 64.1 | 128 | 31.8 | --- |
| MBcoPA1 | 291 | 379 | 461 | 50.1 | 133 | 32.3 | 133 | 29.0 | 92.7 |
| coPA2 | 184 | 337 | 455 | 70.6 | 121 | 51.9 | 124 | 40.4 | --- |
| MBcoPA2 | 272 | 376 | 464 | 85.5 | 124 | 37.2 | 126 | 19.0 | 86.4 |
| coPA3 | 171 | 271 | 443 | 52.8 | 111 | 25.1 | 110 | 16.8 | --- |
| MBcoPA3 | 178 | 294 | 457 | 70.5 | 116 | 14.7 | 116 | 15.3 | 84.8 |
| coPA4 | 196 | 346 | 447 | 72.5 | 120 | 31.4 | 121 | 25.9 | --- |
| MBcoPA4 | 201 | 361 | 464 | 72.7 | 122 | 23.4 | 122 | 25.8 | 87.1 |
| Material | Average Contact Angle (°) | Average Surface Energy (mN/m) |
|---|---|---|
| coPA1 | 85 ± 1.5 | 34.02 ± 0.005 |
| MBcoPA1 | 78 ± 0.6 | 36.61 ± 0.004 |
| coPA2 | 83 ± 5.0 | 33.44 ± 0.002 |
| MBcoPA2 | 52 ± 3.0 | 52.81 ± 0.004 |
| coPA3 | 99 ± 4.2 | 23.72 ± 0.005 |
| MBcoPA3 | 80 ± 3.5 | 35.45 ± 0.006 |
| coPA4 | 88 ± 3.1 | 30.43 ± 0.003 |
| MBcoPA4 | 96 ± 0.6 | 25.92 ± 0.004 |
© 2020 by the authors. Licensee MDPI, Basel, Switzerland. This article is an open access article distributed under the terms and conditions of the Creative Commons Attribution (CC BY) license (http://creativecommons.org/licenses/by/4.0/).
Share and Cite
Latko-Durałek, P.; Kozera, R.; Macutkevič, J.; Dydek, K.; Boczkowska, A. Relationship between Viscosity, Microstructure and Electrical Conductivity in Copolyamide Hot Melt Adhesives Containing Carbon Nanotubes. Materials 2020, 13, 4469. https://doi.org/10.3390/ma13204469
Latko-Durałek P, Kozera R, Macutkevič J, Dydek K, Boczkowska A. Relationship between Viscosity, Microstructure and Electrical Conductivity in Copolyamide Hot Melt Adhesives Containing Carbon Nanotubes. Materials. 2020; 13(20):4469. https://doi.org/10.3390/ma13204469
Chicago/Turabian StyleLatko-Durałek, Paulina, Rafał Kozera, Jan Macutkevič, Kamil Dydek, and Anna Boczkowska. 2020. "Relationship between Viscosity, Microstructure and Electrical Conductivity in Copolyamide Hot Melt Adhesives Containing Carbon Nanotubes" Materials 13, no. 20: 4469. https://doi.org/10.3390/ma13204469
APA StyleLatko-Durałek, P., Kozera, R., Macutkevič, J., Dydek, K., & Boczkowska, A. (2020). Relationship between Viscosity, Microstructure and Electrical Conductivity in Copolyamide Hot Melt Adhesives Containing Carbon Nanotubes. Materials, 13(20), 4469. https://doi.org/10.3390/ma13204469


