Article

Strontium Phosphate Composite Designed to Red-Emission at Different Temperatures

Institute of Low Temperature and Structure Research, Polish Academy of Sciences, Okolna 2, 50-422 Wroclaw, Poland
*
Authors to whom correspondence should be addressed.
Materials 2020, 13(20), 4468; https://doi.org/10.3390/ma13204468
Submission received: 8 September 2020 / Revised: 29 September 2020 / Accepted: 6 October 2020 / Published: 9 October 2020
(This article belongs to the Special Issue Structural and Optical Studies of Eu3+ Doped Materials)

Abstract

:
Eu3+-doped Sr10(PO4)6(OH)2–Sr3(PO4)2 (SrHAp-TSP) composites were obtained via the microwave-stimulated hydrothermal method and post-heat-treated from 750 to 950 °C. Concentration of the Eu3+ ions was set to be 0.5, 1, 2, 3, 5 mol% in a ratio of the strontium ions molar content. The structural and morphological properties were investigated by X-ray powder diffraction (XRPD), scanning electron microscopy (SEM) and fourier transform infrared spectroscopy (FT-IR) techniques. The average particle size of the studied materials annealed at 750, 850 and 950 °C were counted about 100, 131 and 173 nm, respectively. The luminescence properties depending on the dopant ion concentration, heat-treatment temperature, excitation wavelength and temperature were investigated. In the emission spectra, a broad peak corresponding to the 4f65d1 → 4f7 (8S7/2) emission of Eu2+ ions as well as narrow 4f-4f transitions typical for Eu3+ ions can be observed. The luminescence intensity of the 1 mol% Eu3+:Sr10(PO4)6(OH)2–Sr3(PO4)2 was measured depending on the ambient temperature in the range of 80–550 K. The CIE 1931 (International Commission on Illumination) chromaticity diagram was determined from emission spectra measured in 80, 300 and 550 K. The reduction mechanism of the Eu3+ to the Eu2+ was explained by the charge compensation mechanism based on the Kröger–Vink-notation. The decay times were measured and the Judd–Ofelt (J–O) theory was applied to analyze the observed structural and spectroscopic features.

Graphical Abstract

1. Introduction

Apatite (Ap) is a large family of compounds commonly occurring in nature. Calcium hydroxyapatite (Ca10(PO4)6(OH)2 – CaHAp) is ideal representative of this family of minerals, which can be easily doped with different kinds of ions [1,2]. Apatite is applied in plenty industrial fields as catalysts, laser hosts, luminescent materials, gas sensors, ionic conductors and adsorbents [3,4]. Moreover, calcium phosphates are also used in implantology due to high similarity to the inorganic part of hard tissues in bones, high biocompatibility, osteoconductivity, nontoxicity, non-immunogenicity and bioactivity [5,6,7] Apatite doped with lanthanide ions are extensively investigated as bio-labels that can be used in in vitro and in vivo imaging [8,9,10].
Strontium is a trace element present in human bones and tooth impacting on the strength, healing, microarchitecture, and bone formation. Besides, strontium (II) ions were employed in osteoporosis therapy in the form of orally administrated strontium ranelate salt [11]. Moreover, strontium apatites seem to be good candidates as host lattices for luminescent dopants due to their excellent thermal and chemical stability as well as excellent luminescence properties. As an example, the Sr5(PO4)3Cl: Eu2+ material was used as the blue component in fluorescent lamp [12].
Designing of phosphor materials activated by lanthanide ions has enabled their applications in such technologies as solid-state lighting, flat panel displays, light-emitting diodes (LEDs), biological diagnostic, and biomedical areas due to their excellent properties [13]. Eu3+ ions are the most frequently used activator applied as red-emitting phosphor e.g., in commercially available phosphors Y2O2S: Eu3+ and Y2O3: Eu3+ [14,15]. Moreover, europium can occur in Eu2+ (f7) and Eu3+ (f6) oxidation states of suitable stability. Both show many different features as emitting centers. The Eu2+ ion is sensitive to oxidation under some conditions; however, it possesses good stability in the solid-state materials. It is of particular interest because it exhibits strong and tunable emission from blue to red [16]. The emission spectrum consists of the broad band related to the allowed 4f65d1 → 4f7 (8S7/2) transition. Its luminescence properties strongly depend on its environment in the host lattice. The Eu3+ ion is also characterized by unique optical properties with a relatively strong red-orange emission. Its luminescence results from forbidden, intra-configurational f-f transitions roughly independent on crystal field influence. However, the intensity of particular transitions are highly sensitive to Eu3+ ions surrounding, so additionally, Eu3+ ions are very useful as a luminescence probe [17,18,19].
Luminescence materials co-doped with Eu3+ and Eu2+ is tough to obtain because the reduction of oxidation state in solid states requires a thermal treatment in reducing atmosphere (H2, H2/N2, CO). However, it is interesting that Eu2+-doped materials can be obtained in a nonreducing atmosphere at elevated temperatures in certain compounds due to reduction of Eu3+ ions to Eu2+ ions by the crystallographic site [20]. This abnormal reduction phenomenon was observed in crystal structures with BO4, SiO4, AlO4, or PO4 tetrahedral groups.
In the present work, for the first time to the best of our knowledge [7,8,21,22,23,24], synthesis of strontium phosphate composite (Sr10(PO4)6(OH)2–Sr3(PO4)2) co-doped with Eu3+ and Eu2+ ions prepared in the air at high temperature and the structural, morphological as well as spectroscopic properties have been studied.

2. Materials and Methods

2.1. Synthesis of Composite

Strontium phosphate (Sr10(PO4)6(OH)2–Sr3(PO4)2) composite doped with Eu3+ ions was synthesised by microwave stimulated hydrothermal method and then post-treated at elevated temperature [7,8]. The Sr(NO3)2 (99.0% min Alfa Aesar, Karlsruhe, Germany), (NH4)2HPO4 (≥ 99.0% Fluka, Bucharest, Romania), Eu2O3 (99.99% Alfa Aesar, Karlsruhe, Germany) and NH3∙H2O (99% Avantor, Gliwice, Poland) for pH modification were used as substrates. The Eu3+ ions concentration was set on 0.5, 1, 2, 3 and 5 mol% in proportion of strontium ions molar content. Firstly, the stoichiometric Eu2O3 mass was digested in the HNO3 (ultrapure Avantor, Gliwice, Poland) to receive Eu(NO3)3·xH2O. Europium nitrate hydrate was re-crystallized three times in order to eliminate the HNO3 excess. Then, the stoichiometric Sr(NO3)2 mass was dissolved in water and the Eu(NO3)3·xH2O also was added in. Thereafter, 0.5353 g (4.05 mmol) of (NH4)2HPO4 was put to the previous mixture and the pH value was modified to 10 by means of ammonia. The suspension was transferred into Teflon vessel (Ertec, Wroclaw, Poland) and placed in the microwave hydrothermal reactor (MV 02-02, Ertec, Wroclaw, Poland). The mixture was heat treated at 280 °C for 90 min under 60 atm autogenous pressure. The obtained product was rinsed with de-ionized water (Hydrolab, Straszyn, Poland) several times and dried at 70 °C for 24 h. The thermal treatment from 750 to 950 °C for 3 h was the last step during materials preparation.

2.2. Characterisation

Powder diffraction patterns were received by using an X’Pert Pro diffractometer (PANalytical, Almelo, The Netherlands) equipped with Ni-filtered Cu Kα radiation (λ = 0.154 nm, V = 40 kV, I = 30 mA). The structural refinement was done by using a Maud program version 2.93 (University of Trento – Italy, Department of Industrial Engineering, Trento, Italy) [25,26] based on the apatite hexagonal and trigonal tristrontium diphosphate crystal structures with better approximation and indexing of the Crystallographic Information File (CIF). The quality of structural refinement was supervised by R-values (Rw, Rwnb, Rall, Rnb, and σ), which were followed to get a structural refinement with better quality and reliability.
A FEI Nova NanoSEM 230 scanning electron microscope (Hillsboro, OR, USA) equipped with energy dispersive spectrometer spectrometer (EDS; EDAX Genesis XM4; Hillsboro, OR, USA) and operating at an acceleration voltage in the range 3.0–15.0 kV and spot 4.0–4.5 was used to determine the surface morphology and the elements mapping. The EDS analysis was done to confirm the contents of elements in the obtained materials.
A Nicolet iS50 FT-IR (Thermo Scientific, Waltham, MA, USA) spectrometer equipped with an Automated Beamsplitter exchange system (iS50 ABX containing DLaTGS KBr detector) (Thermo Scientific, Waltham, MA, USA) and HeNe laser as an IR radiation source were used to measure IR spectra. Polycrystalline mid-IR spectra were collected in the 4000–400 cm−1 range in KBr pellets at the temperature of 295 K and spectral resolution of 4 cm−1.
The excitation spectra were recorded using an FLS980 Fluorescence Spectrometer (Edinburgh Instruments, Kirkton Campus, UK) equipped with 450 W Xenon lamp. The excitation of 300 mm focal length monochromator was in Czerny–Turner configuration. The excitation arm was supplied with holographic grating of 1800 lines/mm grating blazed at 250 nm. The excitation spectra were corrected to the excitation source intensity. The emission spectra were measured with a PMA-12 photonic multichannel analyser (Hamamatsu, Hamamatsu City, Japan) equipped with back-thinned charge-coupled device (BT-CCD) line (Hamamatsu, Hamamatsu City, Japan). As an excitation source a pulsed 266 nm line of Nd: YAG laser (3rd harmonic) and a pulsed 395 nm line from Ti: Sapphire tunable laser pumped by 532 nm line from Nd:YAG laser were used (LOTIS TII, Minsk, Belarus). The detection setup is calibrated and has flat response in whole working range (350–1100 nm). The measurements were carried out in 300 K and 80 K as well as in the temperature range 80–550 K using Linkam THMS600 cooling/heating stage (Linkam, Epsom, UK).
The luminescence kinetics were measured by using Jobin-Yvon THR1000 monochromator (HORIBA Jobin-Yvon, Palaiseu, France) equipped with Hamamatsu R928 photomultiplier (Hamamatsu, Hamamatsu City, Japan) and 1200 lines/mm grating blazed at 500 nm. As an excitation source a pulsed 395 nm line from Ti: Sapphire tunable laser (LOTIS TII, Minsk, Belarus) pumped by 532 nm line from Nd: YAG laser was used. The decay profiles were collected using a LeCroy WaveSurfer 400 MHz oscilloscope (Teledyne LeCroy, Chestnut Ridge, NY, USA). The luminescence kinetics were monitored at 612 nm line which is the maximum of the most intense electric dipole transition (5D07F2) and the effective emission lifetimes were calculated by the following equation:
τ m 0 tI t dt 0 I t dt 0 t max tI t dt 0 t max I t dt
where I(t) is the luminescence intensity at time t corrected for the background, and the integrals are calculated over the range of 0 < t < tmax, where tmax >> τm.
A blue luminescence decay curve was excited by a femtosecond laser system Libra Series (Coherent, Wilsonville, USA; 1 mJ, 89 fs, 800 nm) coupled to a Light Conversion OPerA-Solo Optical Parametric Amplifier (Coherent, Wilsonville, USA) and a C5680 streak camera (Hamamatsu, Hamamatsu City, Japan) was used as a detector. The decay curve fitting was performed via Origin 2019 software (OriginLab, Northampton, MA, USA) by using following single exponential decay formula:
I(t) = I0 + A exp(−t/τ)
where I(t) and I0 are the luminescence intensity at time t and t >> τ, A is a constant, and τ is the decay time for an exponential component.

3. Results and Discussion

3.1. Structural and Morphological Analysis

The formation of the strontium phosphate composite (Sr10(PO4)6(OH)2–Sr3(PO4)2) doped with x mol% Eu3+ ions crystalline powders (where x – 0.5, 1, 2, 3, 5 mol%) was followed by the powder XRD measurements both as a function of annealing temperature and of concentration of dopant ions (see Figure 1). The crystallinity was detected for all prepared materials sintered at different temperatures (750–950 °C per 3 h). The presence of both phases in the final product was confirmed by the correlation of the diffraction patterns with the reference standard of the hexagonal strontium hydroxyapatite ascribed to the P63/m space group form Inorganic Crystal Structure Database (ICSD-2866) [27] and the trigonal tristrontium diphosphate ascribed to the R3−m space group (ICSD-150869) [28]. All the materials heat-treated at 750–950 °C have shown detectable crystallinity in the form of sharp, narrow diffraction peaks. All registered diffraction peaks were assigned to the hydroxyapatite and tristrontium diphosphate. No extra diffraction peaks were observed. The ratio of strontium phases is different and are depended on the heat-treating temperature as well as on europium(III) ions concentration (see Table 1). With an increase of annealing temperature, the content of the Sr3(PO4)2 crystal phase in composite increases due to the dehydration process of hydroxyapatite occurring at elevated temperature. It is not possible to detect any trend according to content of particular crystal phases when the concentration of the Eu3+ in composites increases. The Sr3(PO4)2 crystal phase amount in composite increases form 37% for 750 °C temperature to 52% for 950 °C in thermally treated materials. This phenomenon is related to dehydration process occurring in hydroxyapatite matrix under elevated temperature.
The structural refinement has been performed to get the unit cell parameters and percentage composition of the composite. The hexagonal and trigonal phases formation as well as the effective incorporation of Eu3+ ions have been confirmed. A good agreement between the recorded XRD pattern and the theoretical fit has been found. It indicates the success of the Rietveld refinement method. More details regarding Rietveld refinement are displayed in Table 1. As can be seen, it is possible to observe a shrinkage of both cells volume and a parameters of the SrHAp as well as the TSP materials with an increase of the Eu3+ ions concentration, which is caused by smaller ionic radii of dopant (Sr2+ (CN9)—1.31 Å, Eu3+ (CN9)—1.12 Å and Sr2+ (CN7)—1.21 Å, Eu3+ (CN7)—1.01 Å) as well as tristrontium diphosphate (Sr2+ (CN6)—1.18 Å, Eu3+ (CN6)—0.947 Å and Sr2+ (CN10)—1.36 Å, Eu3+ (CN9)—1.12 Å) [29]. Moreover, the a and V cells parameters of both composite materials marginally decreased after thermal treatment, which is an expected and well-known consequence caused by increase of particle size. An increase of annealing temperature caused an increase of Sr3(PO4)2 crystal phase content in composite.
The visualization of the ideal hexagonal strontium apatite unit cell and trigonal tristrontium diphosphate unit cells as well as the coordination polyhedrals of Sr2+ cations is presented in Figure 2. Two different types of crystallographic sites of Sr2+ ions in hydroxyapatite lattice are current: four at the Sr(1) site with C3 point symmetry situated on the ternary axes and six at the Sr(2) site with CS symmetry [30,31]. Moreover, in apatite structure, cis and trans symmetry of CS crystallographic site correlated with arrangements of Eu3+ ions along the channel is well-known [8]. In the Sr3(PO4)2 matrix, there are two nonequivalent crystallographic sites of Sr2+ ions: three at the Sr(1) site and six at the Sr(2) site. The atoms at the Sr(1) crystallographic site are placed on the threefold axis coordinated by 6 oxygen atoms belonging to the PO43− group and site symmetry C3v. The ions at the Sr(2) site are coordinated by ten oxygen atoms having CS symmetry [32]. Nevertheless, a charge and an ionic radii incompatibility between Sr2+ and Eu3+ ions are present, leading to some structural defects correlated with the charge balance necessity.
The morphology of the Sr10(PO4)6(OH)2–Sr3(PO4)2 composite doped with 3 mol% Eu3+ ions annealed at 750, 850 and 950 °C was studied using a Scanning Electron Microscope. The particles are aggregated, their shape is asymmetrical and elongated in one direction (see Figure 3). The morphology of particles was not changed with an increase of the annealing temperature. However, the particle size was changed with an increase of the annealing temperature. The particles size distributions were counted and displayed as histograms. The size distributions are relatively wide, which is caused by different grain growth speed of each phase. The average size of the Sr10(PO4)6(OH)2–Sr3(PO4)2 composite doped with 3 mol% Eu3+ annealed at 750, 850 and 950 °C are about 100 (± 3.4), 131 (± 2.6) and 173 nm(± 4.6 nm), respectively. The energy-dispersive X-ray spectroscopy was used to confirm the content of elements in obtained materials.
The element maps were recorded by the SEM-EDS technique to analyze the elements distribution in the obtained material (Figure 4). The results confirmed the stated stoichiometry of dopants and regular distribution of elements.
The FT-IR spectra were measured to identify the existence of orthophosphate and hydroxyl groups in obtained materials (Figure 5). The infrared spectra consist of ordinary PO43- vibration bands: the v2 bending at 448 cm−1; 564 cm−1, the v4 vibration at 596 cm−1; the v1 symmetric stretching at 950 cm−1; the v3 antisymmetric stretching at 1033 cm−1 and 1081 cm−1. Moreover, the vibrational transitions observed at 1632 cm−1 3432 cm−1 (v OH) confirm the presence of a hydroxyl group in the obtained materials [33,34,35].

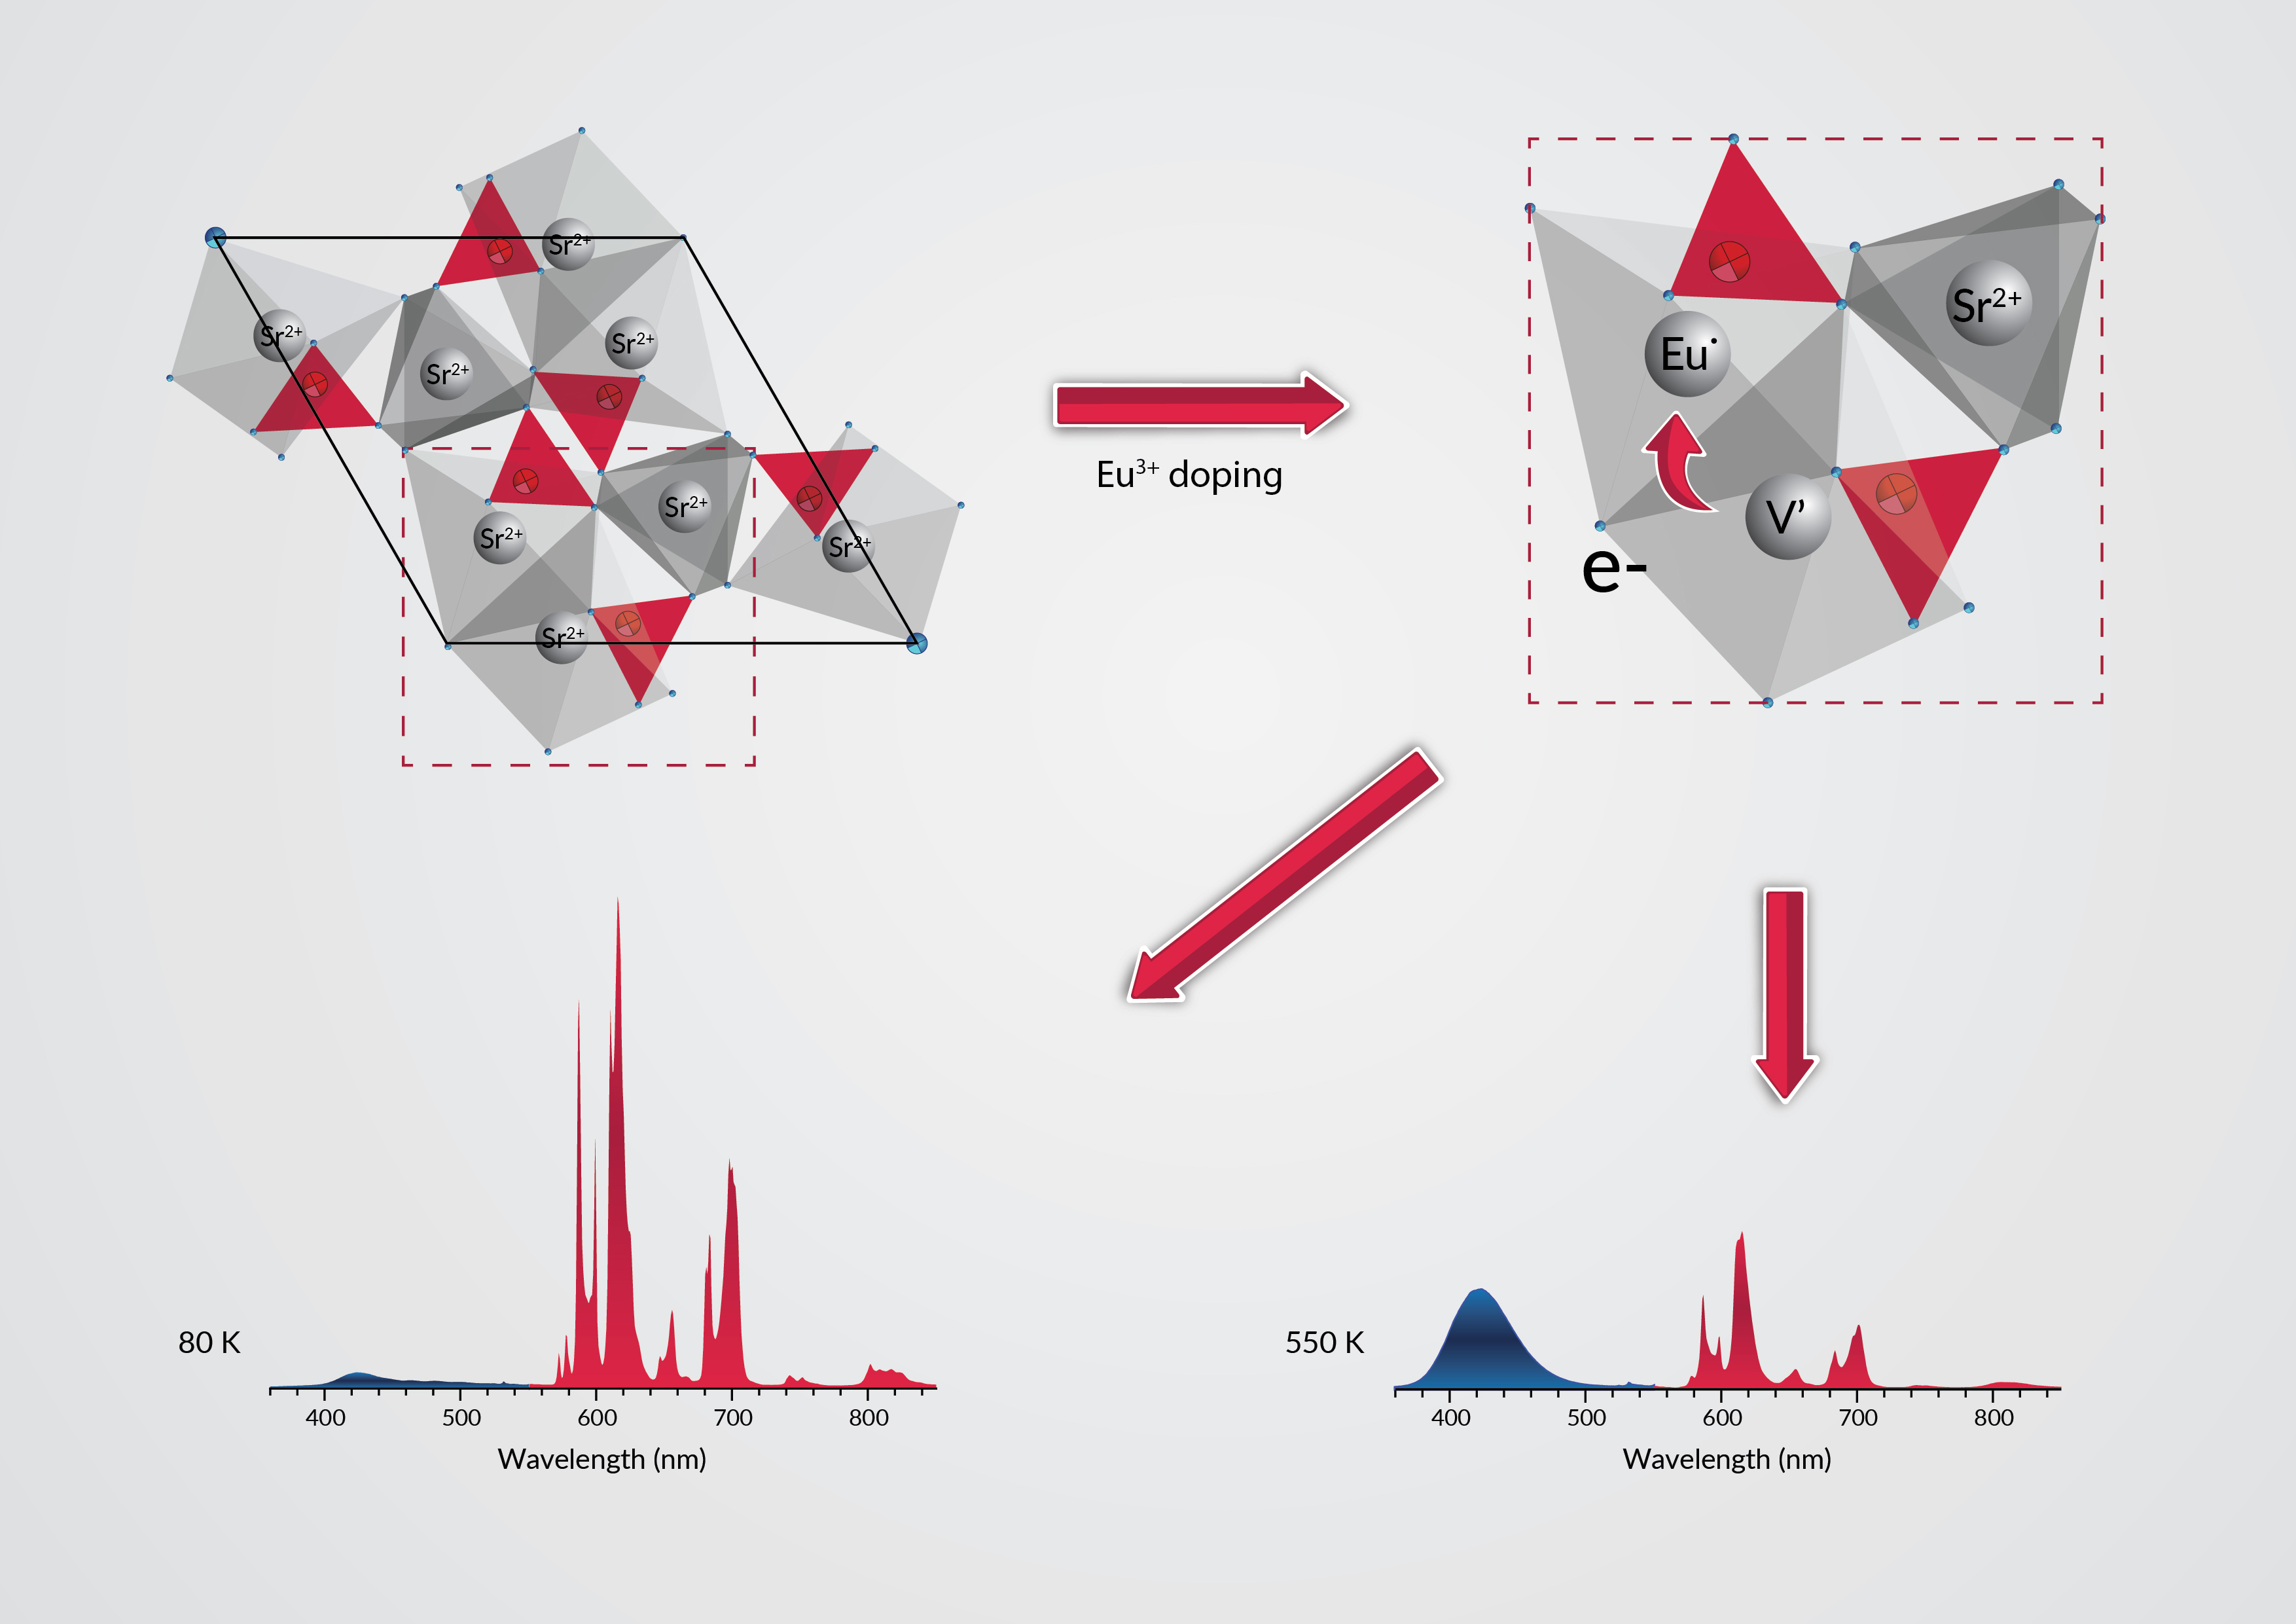
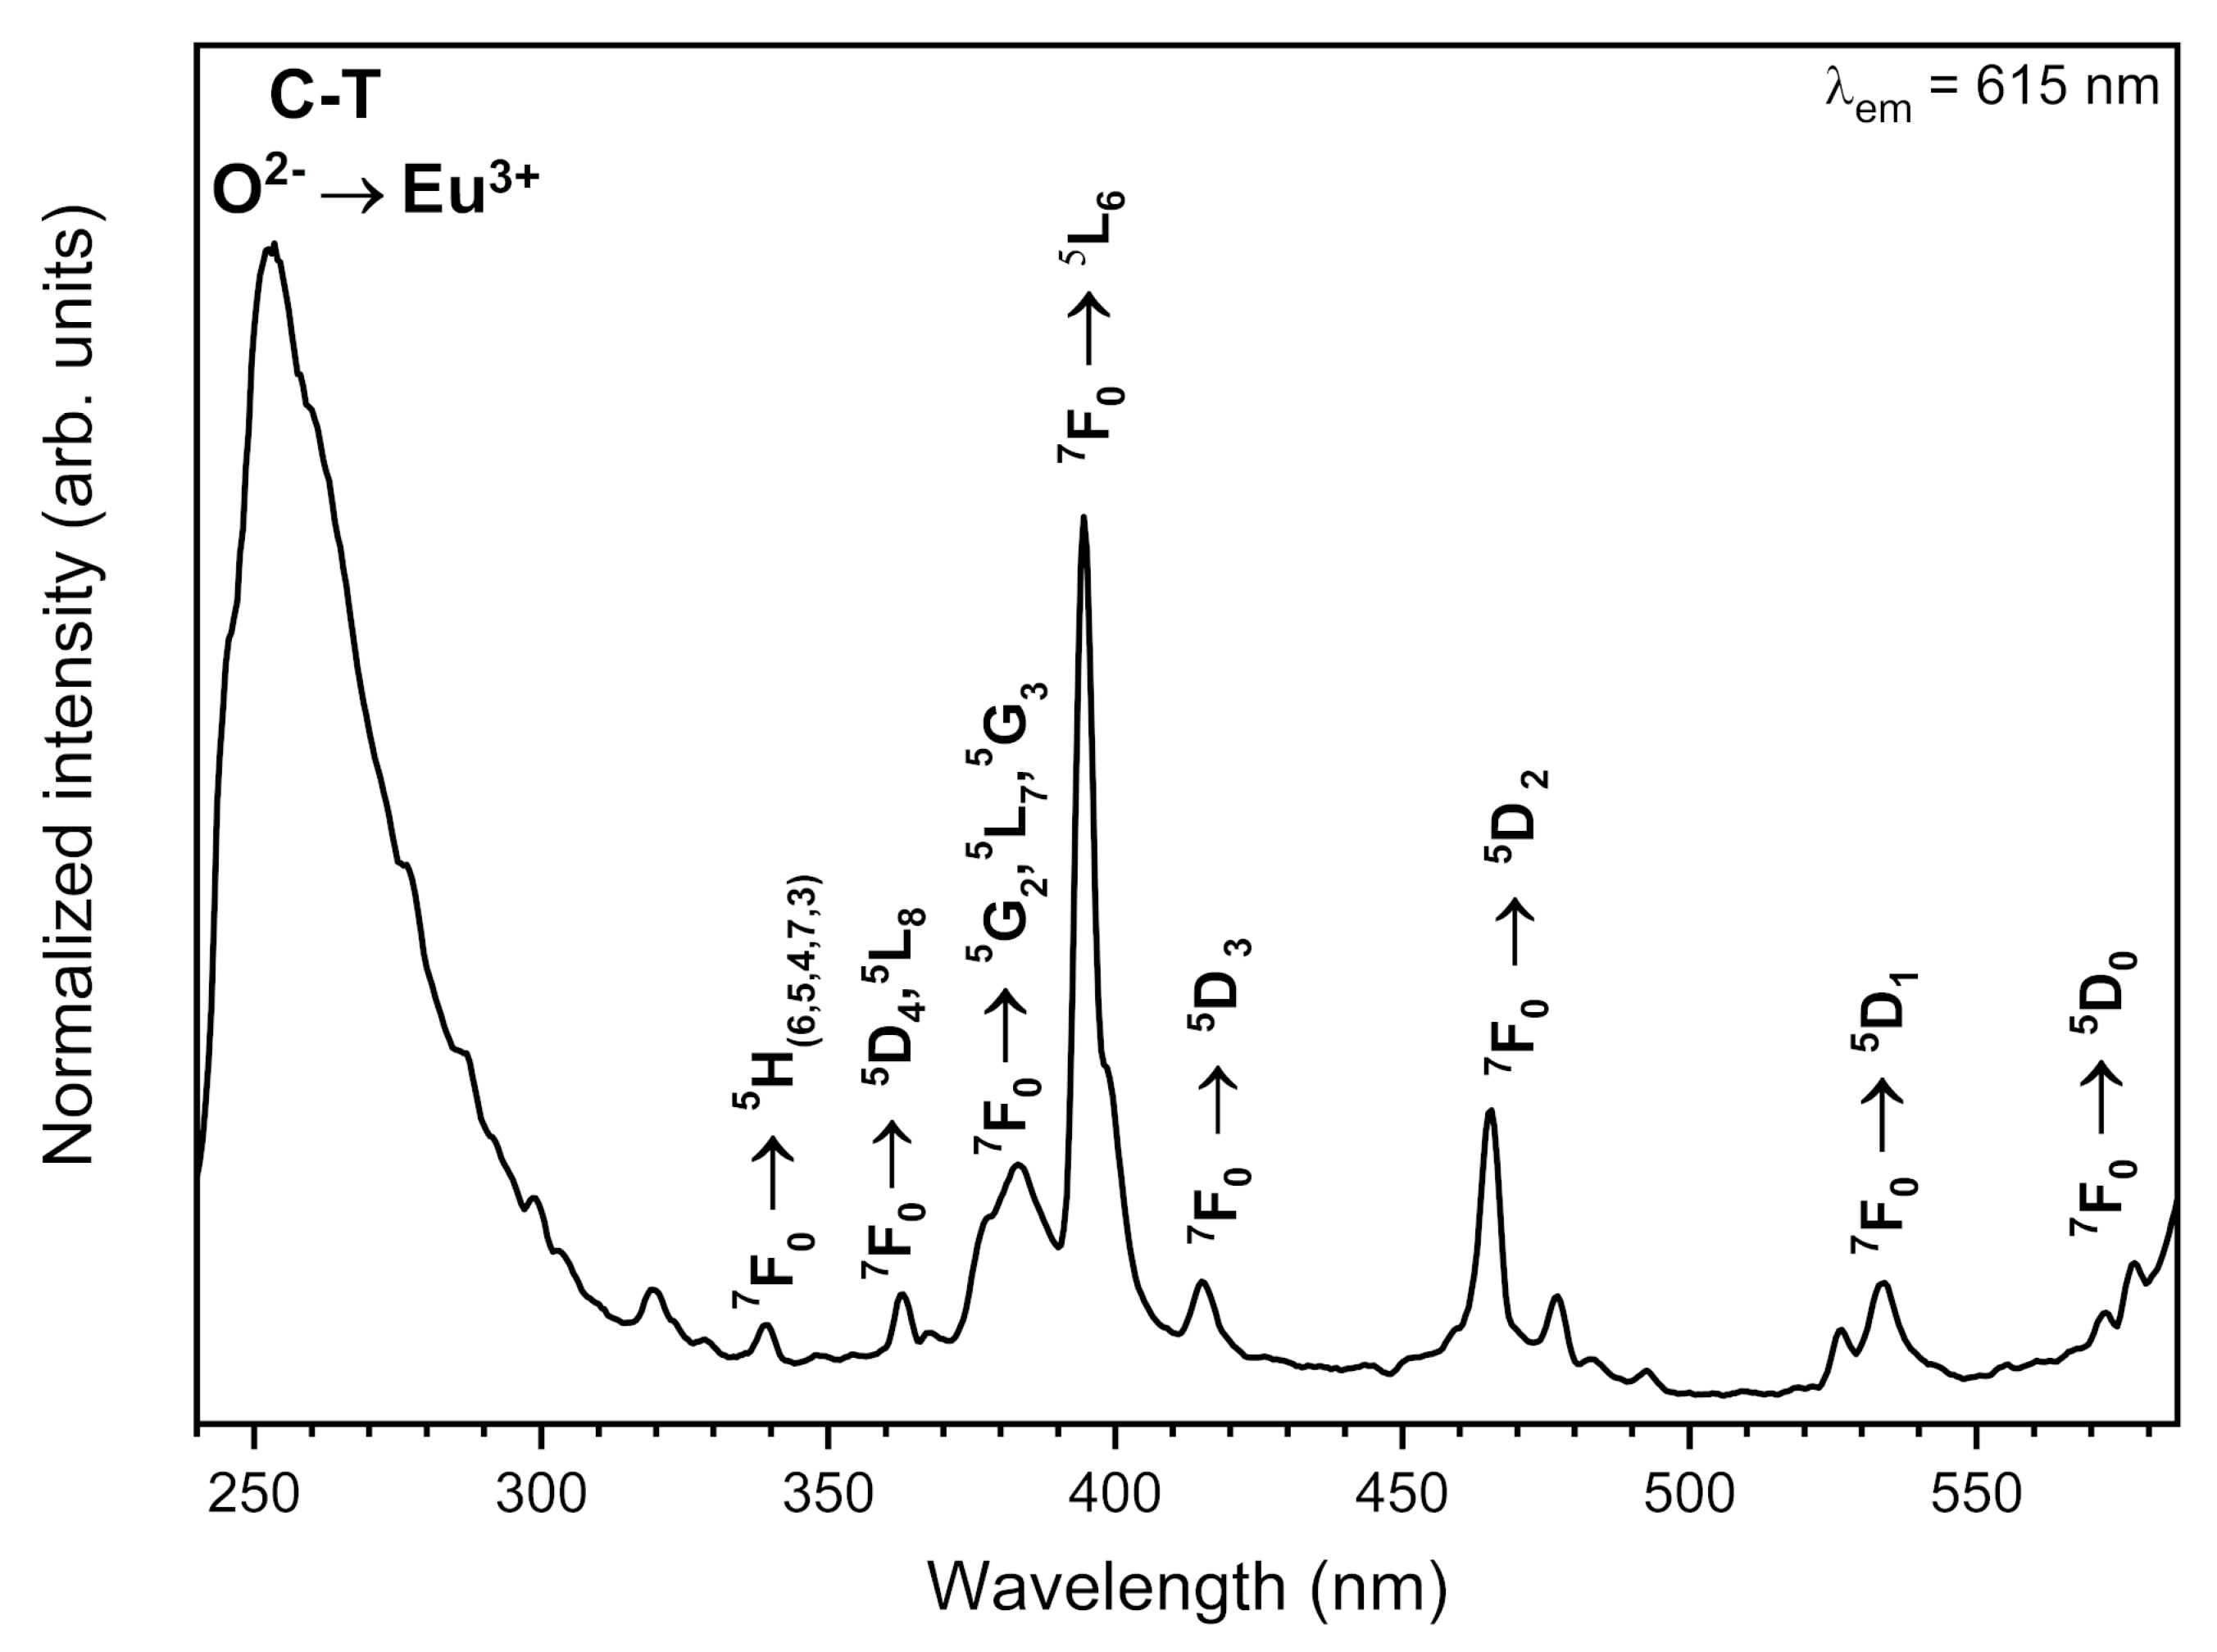
3.2. Emission and Excitation Spectra

The synthesised materials’ excitation-emission spectra were measured at room temperature and observed at 615 nm emission wavelength of the maximum of the most intense 5D07F2 electric dipole transition. All recorded spectra were alike to each other, thus only the representative excitation spectra of 1 mol% Eu3+: Sr10(PO4)6(OH)2–Sr3(PO4)2 annealed at 750 °C was presented in Figure 6. The weak intraconfigurational 4f-4f transitions with sharp lines are characteristic for the Eu3+ ions as well as the intense ligand-to-metal charge transfer (CT) O2− → Eu3+ with broad band in the UV range are typical for the Eu3+ ions incorporated into oxide matrix. The narrow lines observed at 339.5 nm (29,445 cm−1) were attributed to the 7F05H(6,5,4,7,3) transitions, at 363 nm (27,548 cm−1) to the 7F05D4, 5L8, the maximum at 383.5 nm (26,076 cm−1) to the 5L8, 7F0 → G2, 5L7, 5G3, at 394.3 nm (25,361 cm−1) to the 7F05L6, at 415.8 nm (24,050 cm−1) to the 7F05D3, at 465.3 nm (21,492 cm−1) to the 7F05D2, at 533.3 nm (18,751 cm−1) to the 7F05D1 and at 572 nm (17,483 cm−1) to the 7F05D0 transition. It is well known that the 4f-sub-shells of lanthanide ions (RE3+) are well protected by the 5s and 5p sub-shells and the energy levels of the 4f-electrons are weakly influenced by the RE3+ ion vicinity. These transitions are forbidden by Laporte parity rule that is why the f-f transition intensities are weak. However, quite the opposite, the charge-transfer (CT) transition is allowed and strongly affected by electron-lattice coupling. Moreover, its energy level is depended on an ion local symmetry [36,37,38]. The CT maximum is located at 253 nm (39,526 cm−1).
The emission spectra of xEu3+: Sr10(PO4)6(OH)2–Sr3(PO4)2 (where x – 0.5–5 mol%) materials annealed at the temperature 750, 850 and 950 °C were recorded upon pulsed 266 nm and 395 nm excitation at 300 K as well as at 80 K (Figure 7) and as a function of Eu3+ ions concentration excited by 266 nm at 300 K and 80 K (Figure 8). The spectra excited by 395 nm line were normalized to the 5D07F1 transition, which can be treated as an internal reference. In the emission spectra measured upon excitation by 266 nm, a broad peak at about 421 nm was observed, which corresponds to the 4f65d1 → 4f7 (8S7/2) emission of Eu2+ ions as well as narrow 4f-4f transitions were present, which are typical for Eu3+ ions. As can be seen, an increase of the annealing temperature results in an increase of the Eu2+ ions emission intensity and a decrease of Eu3+ emission intensity (see Figure 7 upside). The Eu2+ emission measured at 80 K is less intense compared to the Eu2+ emission measured at 300 K. A change in the annealing temperature and measurement temperature results in changes of the Eu2+ to Eu3+ relative intensity ratio. Moreover, the intensity of the Eu2+ ions emission depends on the measurement temperature and it is more intense in higher temperatures (see Figure 7). This was caused by an increase of Eu2+ fraction in the composite. The detailed description of reduction mechanism is provided in Section 3.3 and Section 3.4.
The Eu3+ emission spectra consist of characteristic electron transitions occurring in the 4f shells appearing in the red region of the electromagnetic radiation. The 5D07F0 transition is located at 576.9 nm (17,334 cm−1), the 5D07F1 transition at 585.9 nm (17,068 cm−1), the 5D07F2 transition at 616.5 nm (16,221 cm−1), the 5D07F3 transition at 655.2 nm (15,262 cm−1), the 5D07F4 transition at 700.5 nm (14,275 cm−1), the 5D07F5 transition at 742.7 nm (13,464 cm−1) and the 5D07F6 transition at 805.3 nm (12,418 cm−1). The 5D07F0 transition is split into three components located at 571.6 nm (17,495 cm−1), 576.9 nm (17,334 cm−1) and 579.9 nm (17,244 cm−1), indicating that Eu3+ ions are located at least into three different crystallographic sites in this composite [39,40,41,42]. A difference between the intensity ratio of components is visible.
The hypersensitive 5D07F2 emission transition is the most intense in all cases. The intensity of this transition is very sensitive to variations in the local environment of Eu3+ ions in the host. On the other hand, the intensity of the 5D07F1 magnetic dipole transition remains almost independent on the crystal field. When Eu3+ ions occupy a centrosymmetric site, the only permissive transition is magnetic one. In the opposite, the electric dipole transition is cardinal. The asymmetry ratio of the relevant emission intensities (R) is defined followingly [43]:
R =     5 D 0 7 F 2   5 D 0 7 F 1
The integrated intensities ratio of these transitions is used to evaluate the asymmetry of the Eu3+ ions coordination polyhedron. The higher the relationship between these transitions is the less centrosymmetric the local environment of Eu3+ ions becomes. The annealing temperatures and Eu3+ ions concentration impacts on the R value is gathered in Table 2. Any relationship between an increase of annealing temperature and dopant concentration is not observed. The crystallography sites in phosphate lattice are randomly occupied by Eu3+ ions what is related to the Eu3+ ion concentration and annealing temperature. Moreover, the observed emission is related to different crystallographic sites. That is why the R value behaves incalculably in such cases.
The Stark’s components are better visible in the case of emission spectra measured at 80 K (see Figure 7). The emission spectra upon excitation by 395 nm line were also measured to be compared. As can be seen, some differences between these two-excitation lines are well visible as different shapes, ratios, and intensity of transitions. The 3 mol% Eu3+: Sr10(PO4)6(OH)2–Sr3(PO4)2 material stands out by the abnormal high intensity of the 5D07F0 transition upon excitation by the 395 nm line.
The emission spectra of the Eu3+-doped Sr10(PO4)6(OH)2–Sr3(PO4)2 composite depend on the Eu3+ ions concentration measured upon 266 nm excitation at 300 and 80 K is presented in the Figure 8 As can be observed, an increase of the europium ions concentration in material led in a decrease of the photoluminescence (PL) intensity of Eu2+ ions. This insight can be caused by the Eu2+ → Eu3+ energy transfer, which prompts in the quenching of the Eu2+ emission. In materials doped with low Eu3+ ions concentration, the Eu2+ ions are weakly quenched due to the statistically enormous distance between these two ions. An increase of dopant concentration caused an increase of the Eu2+ → Eu3+ energy transfer efficiency as a result of a bigger concentration of ions in the host [7,44]. This could also be caused by the different emission intensity in two compounds due to the change of Sr10(PO4)6(OH)2 to Sr3(PO4)2 proportion with an increase of Eu ions doping.
On the other hand, the decrease of Eu2+ PL intensity may be clarified by the fact that the amount of V″Sr vacancies also increase with an increase of the Eu3+ concentration and an excess of the Eu3+ ions would occupy the V″Sr position. Consequently, the double negative vacancy (V″Sr) would be converted into a positive charge hereupon, it cannot move negative charge to Eu3+ and the reduction was inhibited. To have electroneutrality, the composite may absorb oxygen from air.
The Ω2 and Ω4 intensity parameters was calculated based on the Judd–Ofelt theory and the results are listed in Table 2. The Ω2 parameter value changes lightly with an increase of Eu3+ ion concentration and with an increase of annealing temperature, but without any well visible tendency. It indicates the changes in the europium coordination polyhedra and could be related to changes of the Eu3+–O2− bond covalency. The Ω4 value brings information about the electron density variations around Eu3+ cations. However, the Eu3+ ions symmetry changes cannot be directly interpreted by the Ω4 value but can add some information about the electron density deviations in the O2− anions surrounding, what influences on the CT band position.

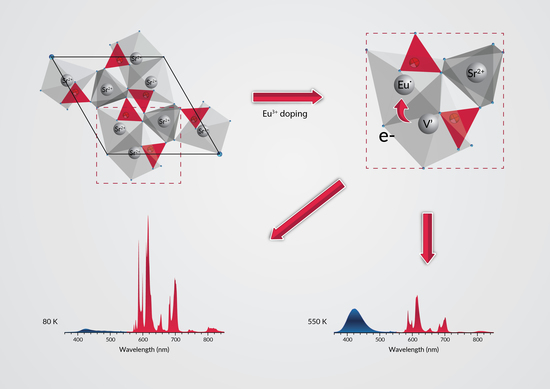
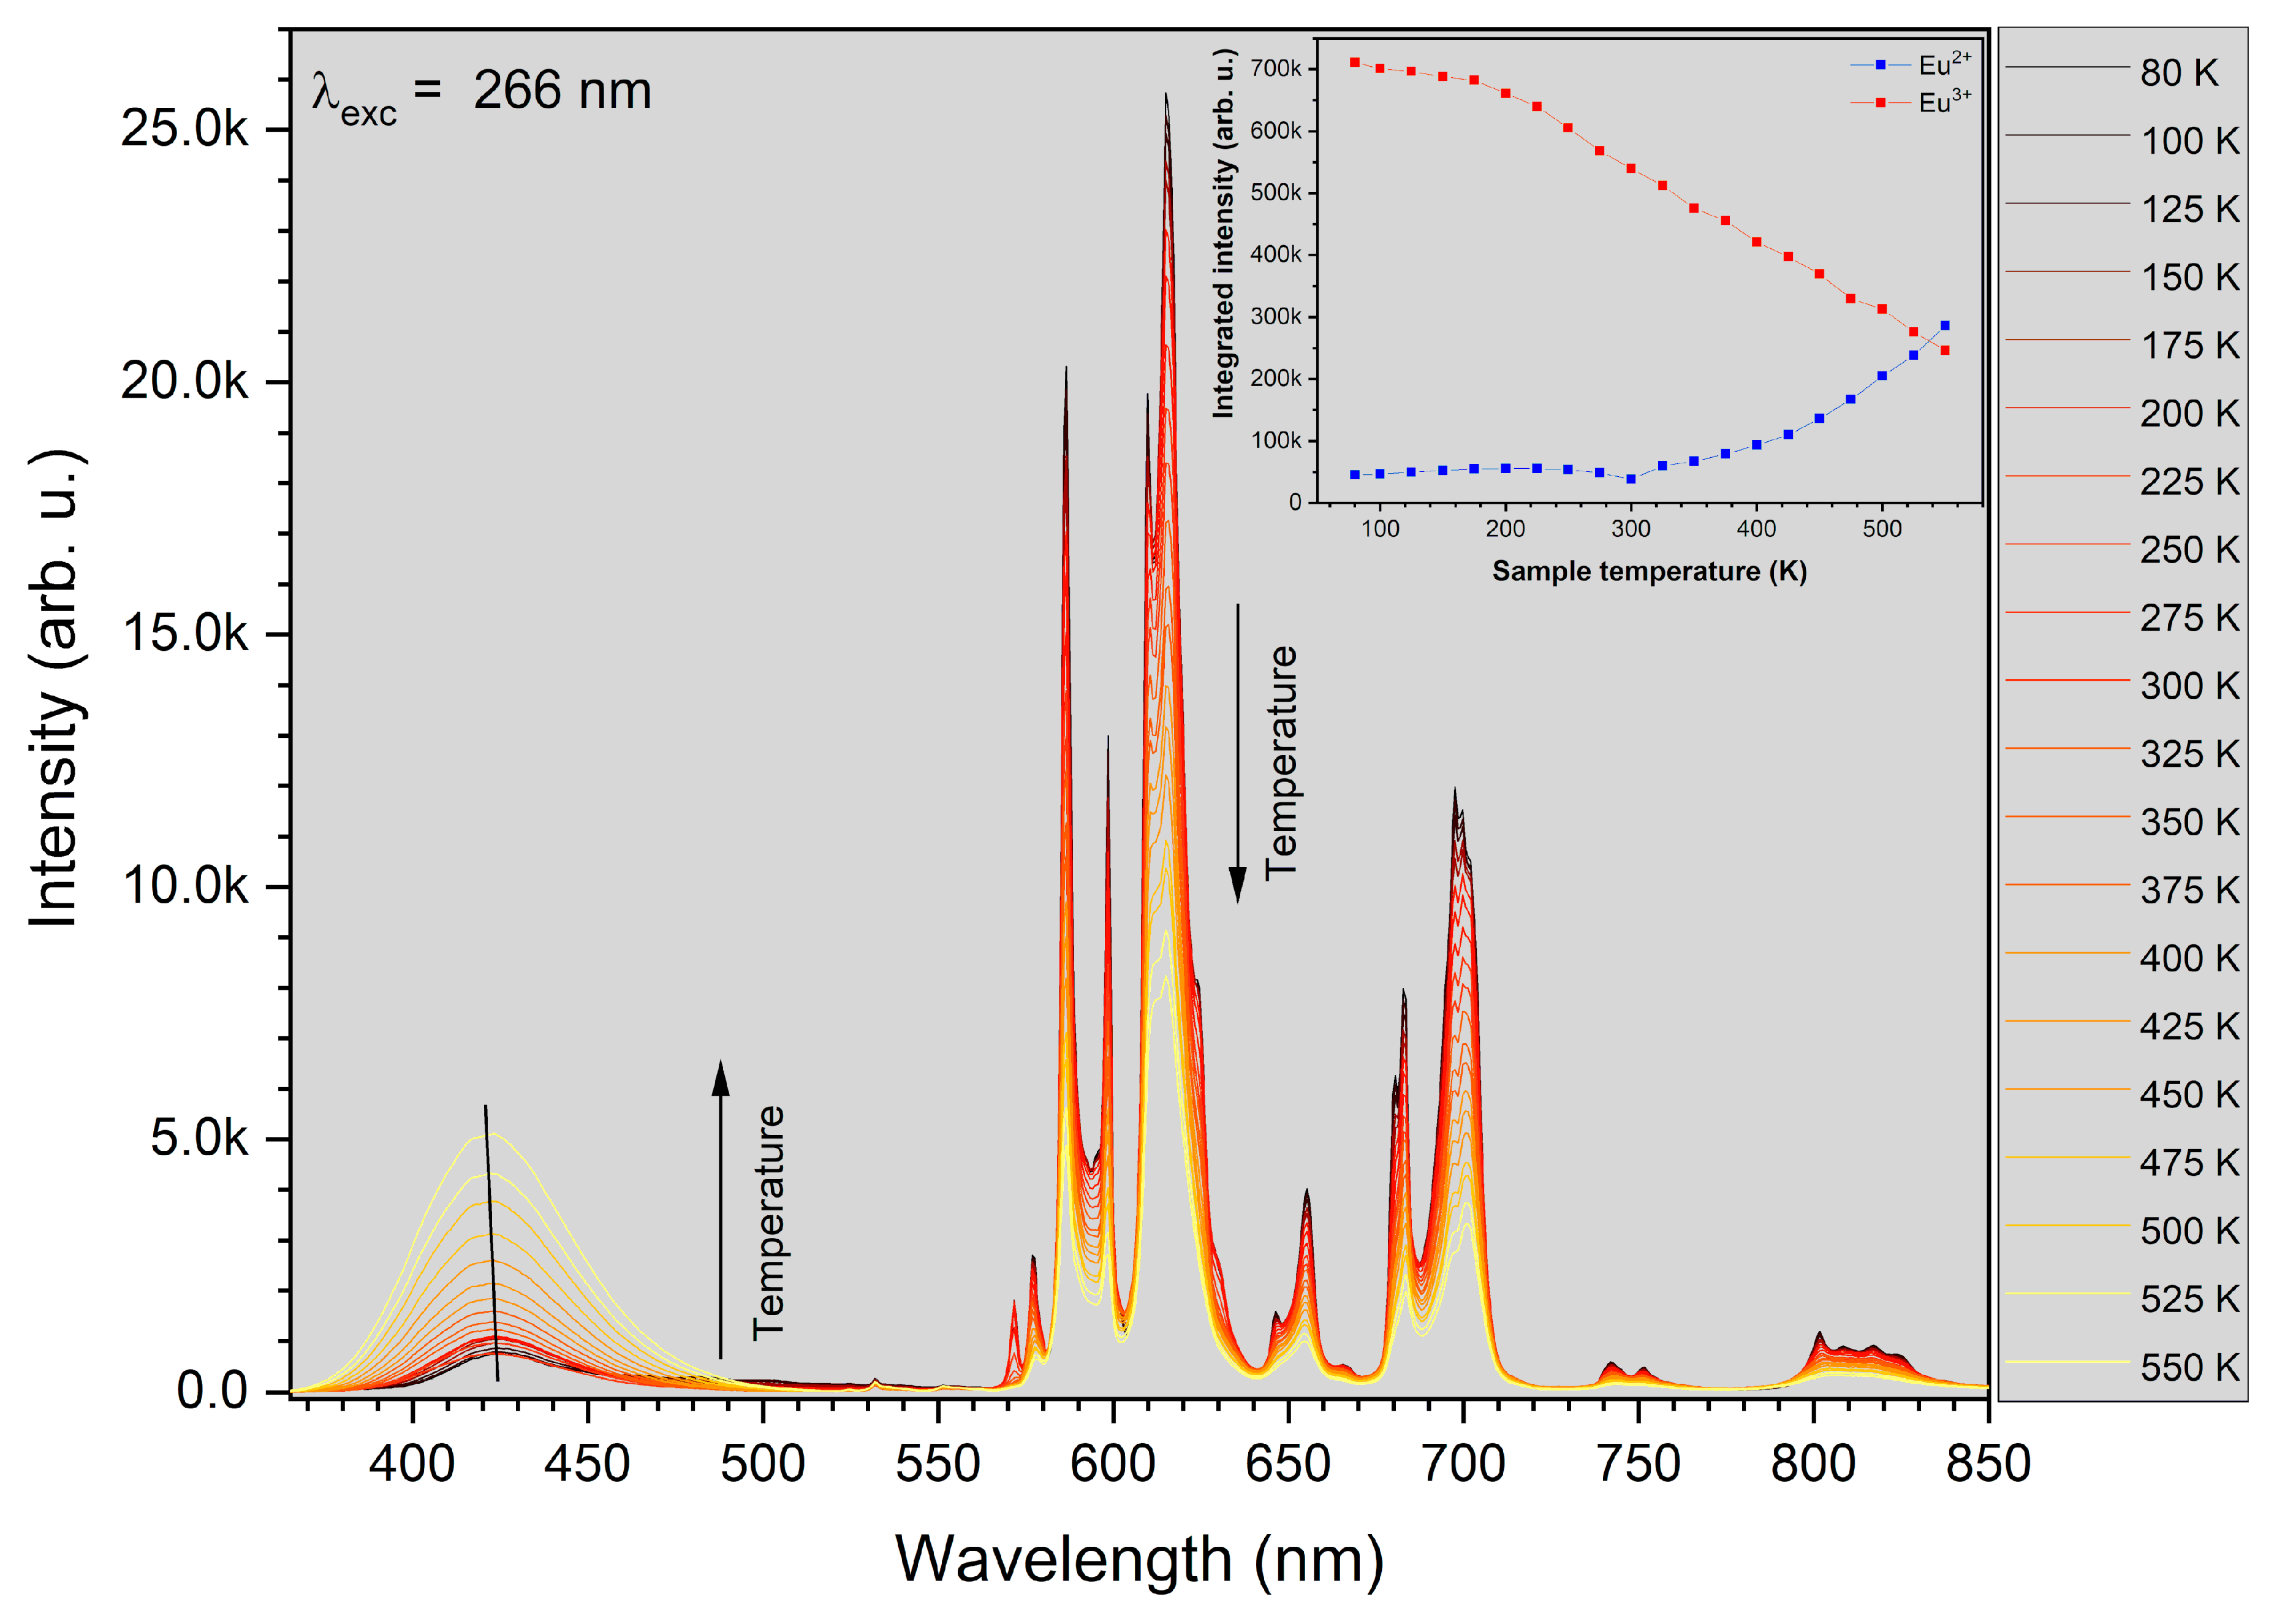
3.3. Abnormal Reduction Mechanism of Eu3+ → Eu2+

The abnormal reduction of the Eu3+ to the Eu2+ ion is known in the literature for solid-state materials made at elevated temperature in air [45,46,47]. Su et al. introduced four demands for these abnormal reductions of the Eu3+ ions to the Eu2+ ions in a solid-state host:
(1)
no oxidizing ions are present in compounds,
(2)
the Eu3+ ions substitute the cations with lower valences in compounds,
(3)
similar radii of the substituted cation and Eu2+ ion, and
(4)
the tetrahedral anion groups (BO4, PO4, AlO4, SiO4) are present in compound [47].
In the Sr10(PO4)6(OH)2–Sr3(PO4)2 composite, the Sr2+ and P5+ are not oxidizing ions, which satisfied condition (1). The Eu3+ ions substituted Sr2+ sites in this composite, which means that Eu3+ ions substituted cations with lower valences. Moreover, the Sr2+ ion has similar radii to Eu2+ (in hydroxyapatite: Sr2+ (CN9)—1.31 Å, Eu2+ (CN9)—1.30 Å and Sr2+ (CN7)—1.21 Å, Eu2+ (CN7)—1.20 Å), in tristrontium diphosphate: Sr2+ (CN6)—1.18 Å, Eu2+ (CN6)—1.17 Å and Sr2+ (CN10)—1.36 Å, Eu3+ (CN9)—1.35 Å [29]) and meet conditions (2) and (3). Furthermore, the condition (4) is also achieved, because this composite is built by PO43- anions groups. Based on this conditions and emission spectra, it is expected that the Eu3+ to Eu2+ reduction occur in these composites. The Eu3+ ions were partially reduced to the Eu2+ and this reduction in composites obtained in air atmosphere at elevated temperature can be clarified by the charge compensation mechanism based on the Kröger–Vink-notation (* sign means charge neutrality, means positive charge and negative charge in particular crystallographic site. The vacancy is marked by V and interstitial atom by i). When the trivalent Eu3+ ions substituted the Sr2+ ions, two Eu3+ ions would substitute for three Sr2+ ions to preserve charge electroneutrality and a double negative vacancy in the Sr crystallographic site (V″Sr) is created. Consequently, two EuSr positive defects and one V″Sr negative vacancy would be designed by each substitution for every two Eu3+ ions:
Eu2O3 + 3Sr*Sr → 2(Eu3+)Sr + V″Sr + 3CaO;
Two relative negative charges are composed on the hydroxyl sides:
Eu2O3 + 2Ca*Ca + 2OH*OH → 2(Eu3+)Ca + 2OOH + 2CaO + H2O;
In addition, charge balance can also be reached by the creation of interstitial oxygen O″i with double relative negative charge:
Eu2O3 + 2Ca*Ca → 2(Eu3+)Ca + O″i + 2CaO;
The vacancy V″Sr could behave as a donor of electrons pending the two EuSr defects turn into acceptors of electrons. Via thermal stimulation, the negative charges of the V″Sr vacancy defects would be thereafter moved to the Eu3+ positions and reduce them to their Eu2+ form followingly:
2(Eu3+)Sr + V″Sr → 2(Eu2+)*Sr + V*Sr;
The higher annealing temperature, the mechanism of the Eu3+ to Eu2+ reduction is more probable, which is well visible on the emission spectra.

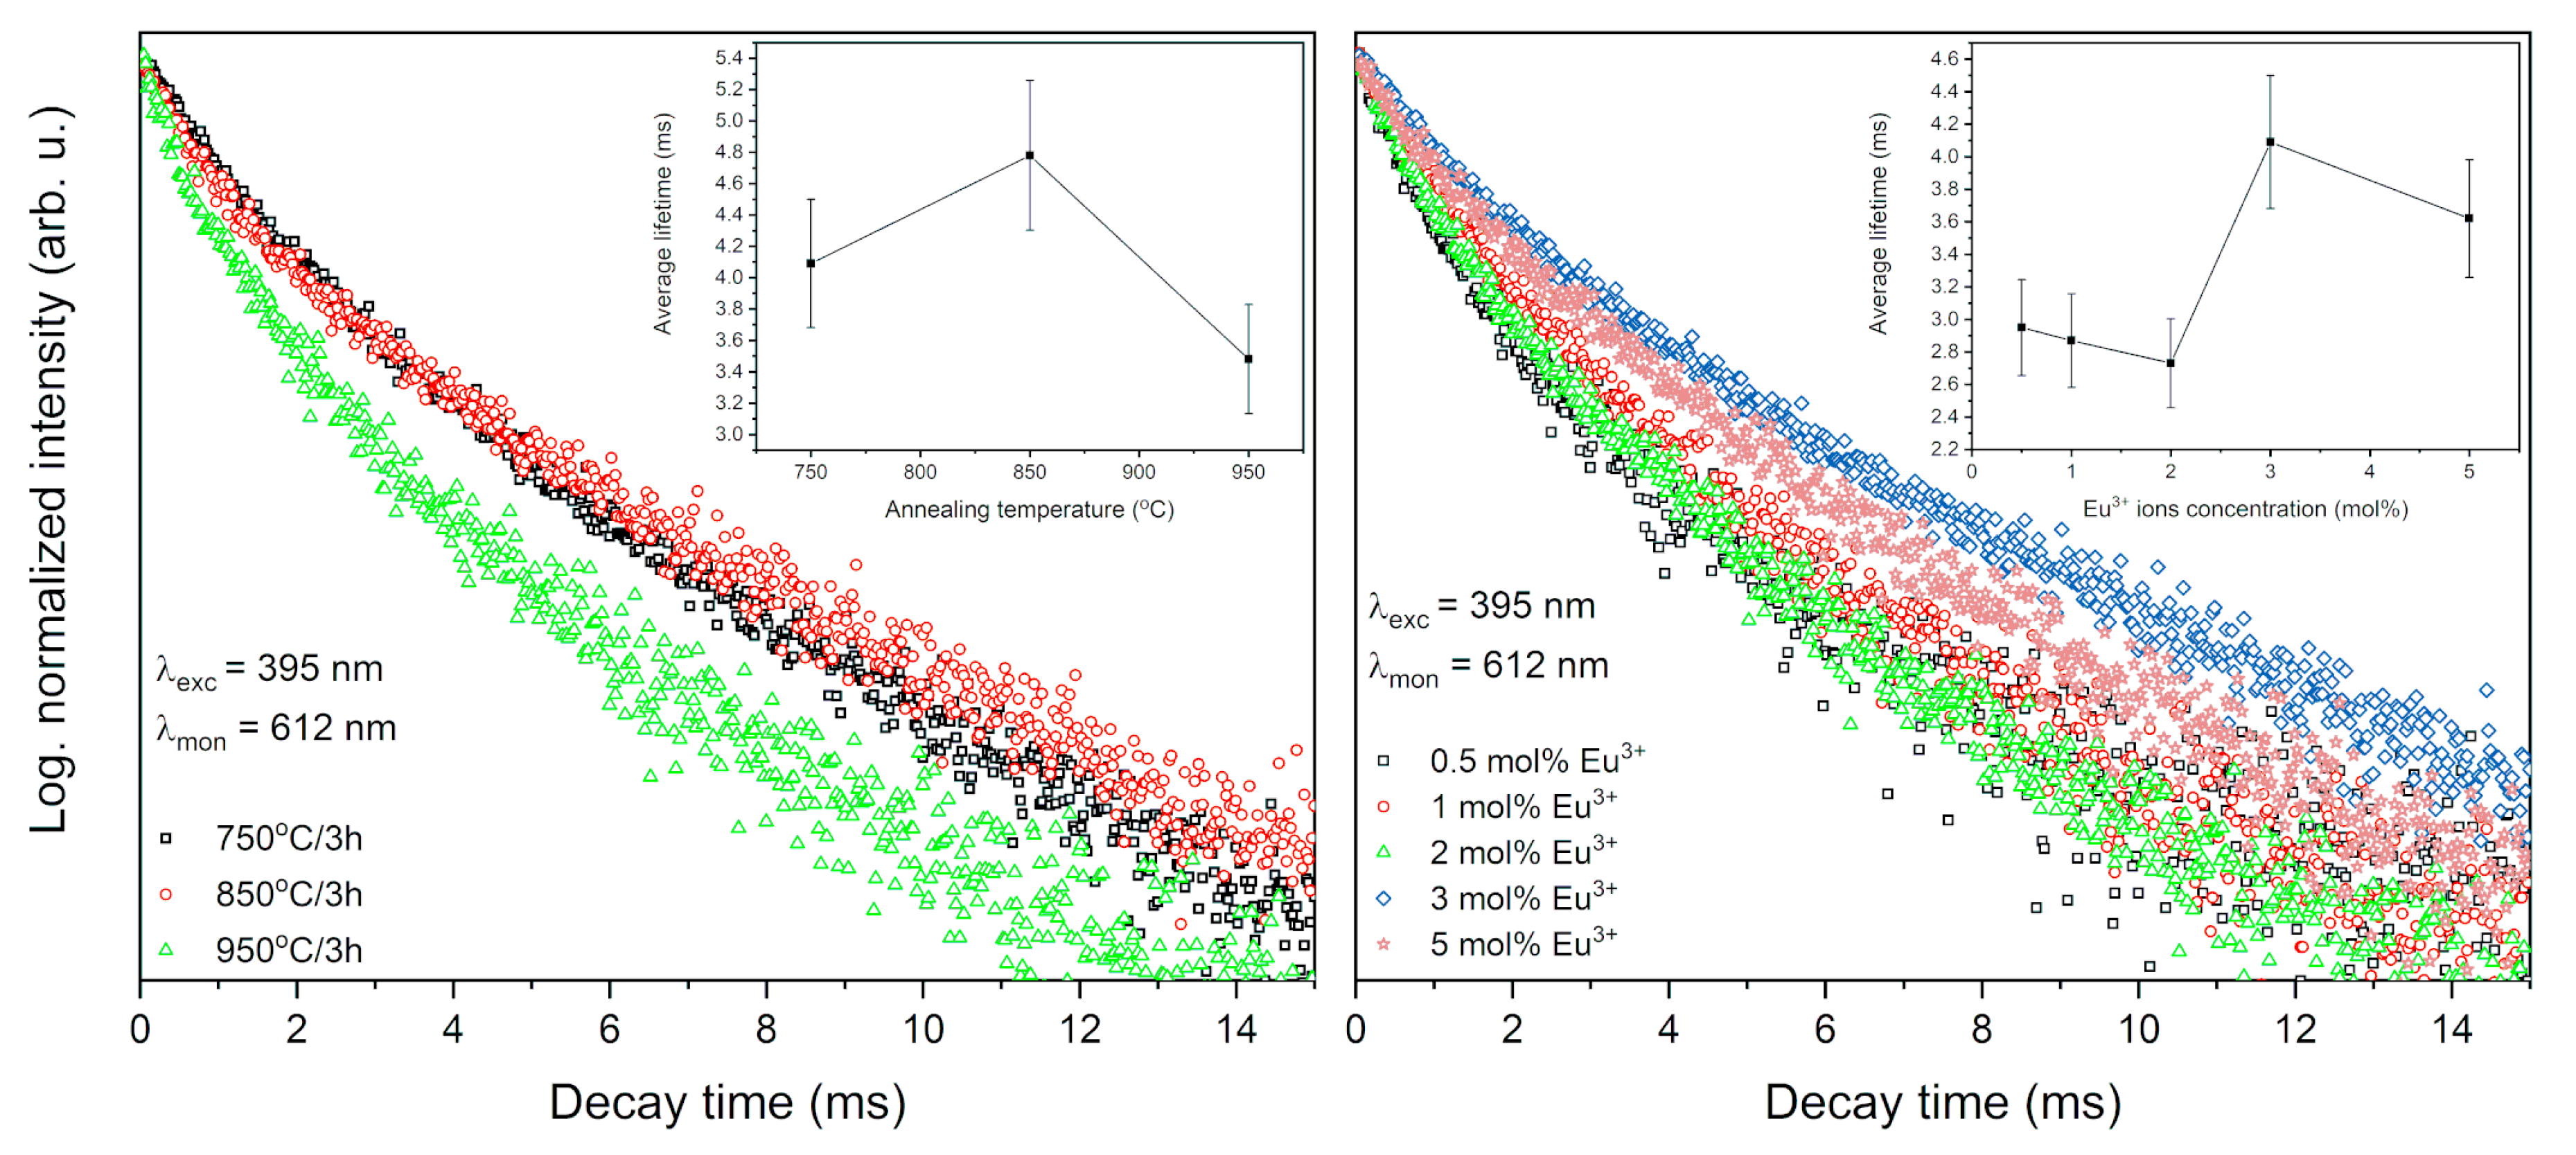
3.4. Thermal Stability

The luminescence intensity of the 1 mol% Eu3+: Sr10(PO4)6(OH)2–Sr3(PO4)2 was measured depending on the measurement temperature in the range of 80–550 K (see Figure 9). It was observed that the PL intensity of Eu3+ ion decreases with an increase of the measurement temperature but on the other hand the PL intensity of Eu2+ ion increases. Mechanism of this behavior has been described as abnormal intense Eu2+ emission in high temperature [16,48]. It could be related to the presence of two possible defect traps of [2(Eu3+)Sr − Oi″] or [2(Eu3+)Sr − VSr″] in this material. The Eu3+ ions could recombined with the electrons released from defects Oi″ or VSr″; nevertheless, the electrons do not get into the Eu2+ ion but loosely couple with Eu3+ in the near environment (Eu3+ + e) manifesting emission of Eu2+. All the defects can be inert at low temperature what yield low luminescence of Eu2+ ion when the temperature decrease. The CIE 1931 chromaticity diagram is presented in the Figure 10 determined from emission spectra measured in 80, 300 and 550 K of temperature.

3.5. Fluorescence Dynamics

The luminescence kinetics were analyzed for all synthesized materials to determine the comprehensive characteristics of the luminescence properties. The decay times at room temperature (RT) corresponding to the 5D07F2 transition were excited by pulse radiation of 395 nm and monitored at 615 nm (Figure 11). The decay curves are not single-exponential, what is compatible with the presence of nonequivalent crystallographic sites of Eu3+ ions accordingly, the lifetimes values were calculated as the effective emission decay time by using Equation (1). The decay profiles and the lifetime values are alike to each other and only minor differences were observed. The decay times of Eu3+ ions in Sr10(PO4)6(OH)2–Sr3(PO4)2 are typical for this kind of ion and are longer than for strontium apatite [7,8], which is caused by the presence of Sr3(PO4)2 phase.
The decay curve (blue component) of the 1 mol% Eu3+: Sr10(PO4)6(OH)2–Sr3(PO4)2 composite annealed at 750 °C was measured under excitation at 266 nm and monitored at 430 nm (Figure 12). The single exponential shape of the decay curve indicates to the Eu2+ ion emission from one crystallographic site. The lifetime value was calculated based on Equation (2) and was determined to be 0.674 µs. The emission spectra of blue emission from the streak camera is presented in Figure 13.

4. Conclusions

A microwave-assisted hydrothermal method was used with success to produce Eu3+-doped Sr10(PO4)6(OH)2–Sr3(PO4)2 composites. The structural and luminescence properties were investigated in a function of dopant ions concentration and annealing temperature. The formation of the strontium phosphate composite was confirmed by the XRPD analysis. The unit cell parameters as well as the percentage content of crystal phases, were calculated by Rietveld refinement method. The obtained materials have had a tendency to agglomerate to minimize their excess surface energy and their shapes were irregular and elongated. There were no observed changes in morphology with an increase of the annealing temperature. There were observed the narrow 4f-4f transitions typical for Eu3+ ions and a broadband at 421 nm related to the 4f65d1→ 4f7(8S7/2) transition from Eu2+ ions. Moreover, it has been described as an abnormal intense emission of Eu2+ ion due to recombination of the excited state of Eu3+ ion with the electrons released from defects (Oi″ or VSr″).
The decay curves of Eu3+ ions are not single-exponential as a result of the nonequivalent crystallographic sites of Eu3+ ions in the matrix. However, the lifetime value of Eu2+ ions is single-exponential and was determined to be 0.674 µs.

Author Contributions

Conceptualization, K.S. and R.J.W.; methodology, K.S. and A.W.; investigation, K.S. and A.W.; writing—original draft preparation, K.S.; writing—review and editing, K.S., A.W. and R.J.W.; supervision, R.J.W.; All authors have read and agreed to the published version of the manuscript.

Funding

This research received no external funding.

Acknowledgments

The authors would like to thank E. Bukowska for performing XRD measurements, D. Szymanski for SEM measurements and R.M. Kowalski for femtosecond laser measurements.

Conflicts of Interest

The authors declare no conflict of interest.

References

  1. Zhang, X.; Xing, Q.; Liao, L.; Han, Y. Effect of the Fluorine Substitution for –OH Group on the Luminescence Property of Eu3+ Doped Hydroxyapatite. Crystals 2020, 10, 191. [Google Scholar] [CrossRef] [Green Version]
  2. Hidouri, M.; Dorozhkin, S.V. Structure and thermal stability of sodium and carbonate-co-substituted strontium hydroxyfluorapatites. New J. Chem. 2018, 42, 8469–8477. [Google Scholar] [CrossRef]
  3. Roh, H.S.; Lee, S.; Caliskan, S.; Yoon, C.; Lee, J.K. Luminescence and electric dipole in Eu3+ doped strontium phosphate: Effect of SiO4. J. Alloys Compd. 2019, 772, 573–578. [Google Scholar] [CrossRef]
  4. Pogosova, M.A.; González, L.V. Influence of anion substitution on the crystal structure and color properties of copper-doped strontium hydroxyapatite. Ceram. Int. 2018, 44, 20140–20147. [Google Scholar] [CrossRef]
  5. Yilmaz, B.; Alshemary, A.Z.; Evis, Z. Co-doped hydroxyapatites as potential materials for biomedical applications. Microchem. J. 2019, 144, 443–453. [Google Scholar] [CrossRef]
  6. Priyadarshini, B.; Vijayalakshmi, U. Development of cerium and silicon co-doped hydroxyapatite nanopowder and its in vitro biological studies for bone regeneration applications. Adv. Powder Technol. 2018, 29, 2792–2803. [Google Scholar] [CrossRef]
  7. Zawisza, K.; Wiglusz, R.J. Preferential site occupancy of Eu3+ ions in strontium hydroxyapatite nanocrystalline – Sr10(PO4)6(OH)2 – structural and spectroscopic characterisation. Dalt. Trans. 2017, 46, 3265–3275. [Google Scholar] [CrossRef]
  8. Zawisza, K.; Strzep, A.; Wiglusz, R.J. Influence of annealing temperature on the spectroscopic properties of hydroxyapatite analogues doped with Eu3+. New J. Chem. 2017, 41, 9990–9999. [Google Scholar] [CrossRef]
  9. Gómez-Morales, J.; Verdugo-Escamilla, C.; Fernández-Penas, R.; Parra-Milla, C.M.; Drouet, C.; Maube-Bosc, F.; Oltolina, F.; Prat, M.; Fernández-Sánchez, J.F. Luminescent biomimetic citrate-coated europium-doped carbonated apatite nanoparticles for use in bioimaging: Physico-chemistry and cytocompatibility. RSC Adv. 2018, 8, 2385–2397. [Google Scholar] [CrossRef] [Green Version]
  10. He, W.; Xie, Y.; Xing, Q.; Ni, P.; Han, Y.; Dai, H. Sol-gel synthesis of biocompatible Eu3+/Gd3+ co-doped calcium phosphate nanocrystals for cell bioimaging. J. Lumin. 2017, 192, 902–909. [Google Scholar] [CrossRef]
  11. Szyszka, K.; Rewak-Soroczynska, J.; Dorotkiewicz-Jach, A.; Ledwa, K.A.; Piecuch, A.; Giersig, M.; Drulis-Kawa, Z.; Wiglusz, R.J. Structural modification of nanohydroxyapatite Ca10(PO4)6(OH)2 related to Eu3+ and Sr2+ ions doping and its spectroscopic and antimicrobial properties. J. Inorg. Biochem. 2020, 203, 110884. [Google Scholar] [CrossRef] [PubMed]
  12. Zou, H.; Yan, M.; Wang, G.; Yuan, B.; Huang, J.; Gao, F.; Sheng, Y.; Zheng, K.; Song, Y. Sr5(PO4)3Cl: Eu2+with multiform morphologies and sizes: Hydrothermal synthesis and luminescent properties. Powder Technol. 2014, 254, 579–582. [Google Scholar] [CrossRef]
  13. Li, G.; Zhao, Y.; Wei, Y.; Tian, Y.; Quan, Z.; Lin, J. Novel yellowish-green light-emitting Ca10(PO4)6O:Ce3+ phosphor: Structural refinement, preferential site occupancy and color tuning. Chem. Commun. 2016, 52, 3376–3379. [Google Scholar] [CrossRef]
  14. Xie, Z.; Zhao, W.; Zhou, W.W.; Yang, F.G. Synthesis and luminescence properties of new red phosphor YBiW2O9:Eu3+. Funct. Mater. Lett. 2017, 10, 1750066. [Google Scholar] [CrossRef]
  15. Zhang, N.; Guo, C.; Zheng, J.; Su, X.; Zhao, J. Synthesis, electronic structures and luminescent properties of Eu3+ doped KGdTiO4. J. Mater. Chem. C 2014, 2, 3988–3994. [Google Scholar] [CrossRef]
  16. Pan, Y.; Wang, W.; Zhu, Y.; Xu, H.; Noh, H.M.; Jeong, J.H.; Liu, X.; Li, L. Eu3+→Eu2+ unusual reduction and bond energy in MAlSi2O6:Eu (M = Li, Na, K, Rb, Cs). Ceram. Int. 2018, 44, 8484–8491. [Google Scholar] [CrossRef]
  17. Heyward, C.C.; Kimani, M.M.; Moore, C.A.; McMillen, C.D.; Kolis, J.W. Europium valence control in the hydrothermal synthesis of apatites and borosilicates. J. Alloys Compd. 2016, 656, 206–212. [Google Scholar] [CrossRef]
  18. Baran, A.; Mahlik, S.; Grinberg, M.; Cai, P.; Kim, S.I.; Seo, H.J. Luminescence properties of different Eu sites in LiMgPO4:Eu2+, Eu3+. J. Phys. Condens. Matter 2014, 26, 385401. [Google Scholar] [CrossRef]
  19. Grandhe, B.K.; Bandi, V.R.; Jang, K.; Kim, S.S.; Shin, D.S.; Lee, Y.I.; Lim, J.M.; Song, T. Reduction of Eu3+ to Eu2+ in NaCaPO4:Eu phosphors prepared in a non-reducing atmosphere. J. Alloys Compd. 2011, 509, 7937–7942. [Google Scholar] [CrossRef]
  20. Pei, Z.; Zeng, Q.; Su, Q. A Study on the Mechanism of the Abnormal Reduction of Eu3+→Eu2+ in Sr2B5O9Cl Prepared in Air at High Temperature. J. Solid State Chem. 1999, 145, 212–215. [Google Scholar] [CrossRef]
  21. Cheng, L.; Zhang, W.; Li, Y.; Dai, S.; Chen, X.; Qiu, K. Synthesis and photoluminescence properties of Sr3(PO4)2:Re3+, Li+ (Re = Eu, Sm) red phosphors for white light-emitting diodes. Ceram. Int. 2017, 43, 11244–11249. [Google Scholar] [CrossRef]
  22. Ha, L.T.; Tu, N.; Quang, N.V.; Thang, C.X.; Vuong, P.H.; Viet, D.X.; Hung, N.D.; Kien, N.D.T.; Duong, T.-T.; Lien, N.T.K.; et al. Effect of doping concentration and sintering temperature on structure and photoluminescence properties of blue/red emitting bi-phase Eu3+/Eu2+-doped Sr5 (PO4)3Cl/Sr3(PO4)2 phosphors. Mater. Res. Express 2018, 5, 076516. [Google Scholar] [CrossRef]
  23. Huang, Y.; Gan, J.; Seo, H.J. Luminescence Investigation of Eu-Activated Sr5(PO4)2SiO4 Phosphor by Combustion Synthesis. J. Am. Ceram. Soc. 2011, 94, 1143–1148. [Google Scholar] [CrossRef]
  24. El Ouenzerfi, R.; Kbir-Ariguib, N.; Trabelsi-Ayedi, M.; Piriou, B. Spectroscopic study of Eu3+ in strontium hydroxyapatite Sr10(PO4)6(OH)2. J. Lumin. 1999, 85, 71–77. [Google Scholar] [CrossRef]
  25. Rietveld, H.M.; Nederland, R.C. A profile refinement method for nuclear and magnetic structures. J. Appl. Crystallogr. 1969, 2, 65–71. [Google Scholar] [CrossRef]
  26. Lutterotti, L.; Matthies, S.; Wenk, H.R. MAUD: A friendly Java program for Material Analysis Using Diffraction. IUCr Newsl. CPD 1999, 21, 14–15. [Google Scholar] [CrossRef] [Green Version]
  27. Sudarsanan, K.; Young, R.A. Structure of strontium hydroxide phosphate, Sr5(PO4)3OH. Acta Crystallogr. Sect. B 1972, 28, 3668–3670. [Google Scholar] [CrossRef]
  28. Manoun, B.; Popović, L.; De Waal, D.; Verryn, S.M.C. Rietveld refinements of a new solid solution Ba(3 − x) Srx (PO4) 2 (0 ≤ x ≤ 3). Powder Diffr. 2003, 18, 122–127. [Google Scholar] [CrossRef]
  29. Shannon, R.D. Revised effective ionic radii and systematic studies of interatomic distances in halides and chalcogenides. Acta Crystallogr. Sect. A 1976, 32, 751–767. [Google Scholar] [CrossRef]
  30. Badraoui, B.; Bigi, A.; Debbabi, M.; Gazzano, M.; Roveri, N.; Thouvenot, R. Physicochemical Properties and Structural Refinement of Strontium-Lead Hydroxyapatites. Eur. J. Inorg. Chem. 2002, 2002, 1864–1870. [Google Scholar] [CrossRef]
  31. Han, Y.; Wang, X.; Dai, H.; Li, S. Synthesis and luminescence of Eu3+ doped hydroxyapatite nanocrystallines: Effects of calcinations and Eu3+ content. J. Lumin. 2013, 135, 281–287. [Google Scholar] [CrossRef]
  32. Chen, F.; Yuan, X.; Zhang, F.; Wang, S. Photoluminescence properties of Sr3(PO4)2:Eu2+, Dy3+ double-emitting blue phosphor for white LEDs. Opt. Mater. 2014, 37, 65–69. [Google Scholar] [CrossRef]
  33. Banerjee, S.S.; Tarafder, S.; Davies, N.M.; Bandyopadhyay, A.; Bose, S. Understanding the influence of MgO and SrO binary doping on the mechanical and biological properties of b-TCP ceramics. Acta Biomater. 2010, 6, 4167–4174. [Google Scholar] [CrossRef] [PubMed]
  34. Li, K.; Shang, M.; Geng, D.; Lian, H.; Zhang, Y.; Fan, J.; Lin, J. Synthesis, Luminescence, and Energy-Transfer Properties of β-Na2Ca4(PO4)2(SiO4):A (A = Eu2+, Dy3+, Ce3+/Tb3+) Phosphors. Inorg. Chem. 2014, 53, 6743–6751. [Google Scholar] [CrossRef]
  35. Gopi, D.; Sathishkumar, S.; Karthika, A.; Kavitha, L. Development of Ce3+/Eu3+ dual-substituted hydroxyapatite coating on surgical grade stainless steel for improved antimicrobial and bioactive properties. Ind. Eng. Chem. Res. 2014, 53, 20145–20153. [Google Scholar] [CrossRef]
  36. Tanner, P.A. Lanthanide Luminescence in Solids. In Lanthanide Luminescence: Photophysical, Analytical and Biological Aspects; Hanninen, P., Harma, H., Eds.; Springer-Verlag: Berlin/Heidelberg, Germany, 2010; pp. 183–233. [Google Scholar]
  37. Blasse, G. On the Eu 3+ Fluorescence of Mixed Metal Oxides. IV. The Photoluminescent Efficiency of Eu3+-Activated Oxides. J. Chem. Phys. 1966, 45, 2356–2360. [Google Scholar] [CrossRef]
  38. Dorenbos, P. The Eu3+ charge transfer energy and the relation with the band gap of compounds. J. Lumin. 2005, 111, 89–104. [Google Scholar] [CrossRef]
  39. Ternane, R.; Ferid, M.; Panczer, G.; Trabelsi-Ayadi, M.; Boulon, G. Site-selective spectroscopy of Eu3+-doped orthorhombic lanthanum and monoclinic yttrium polyphosphates. Opt. Mater. 2005, 27, 1832–1838. [Google Scholar] [CrossRef]
  40. Silva, D.; Abreu, A.; Davolos, M.R.R.; Rosaly, M. Determination of the local site occupancy of Eu3+ ions in ZnAl2O4 nanocrystalline powders. Opt. Mater. 2011, 33, 1226–1233. [Google Scholar] [CrossRef]
  41. Seo, H.J.; Du, F.; Nakai, Y.; Tsuboi, T.; Huang, Y.; Seo, H.J.; Du, F.; Nakai, Y.; Tsuboi, T.; Huang, Y.; et al. Luminescence properties and site occupations of Eu3+ ions doped in double phosphates Ca9R(PO4)7 (R = Al, Lu). J. Mater. Chem. 2011, 21, 4669. [Google Scholar] [CrossRef]
  42. Watras, A.; Boutinaud, P.; Pazik, R.; Dereń, P.J.J.; Pązik, R.; Dereń, P.J.J. Luminescence-Structure relationships in MYP2O7:Eu3+(M = K, Rb, Cs). J. Lumin. 2016, 175, 249–254. [Google Scholar] [CrossRef]
  43. Kolesnikov, I.E.; Povolotskiy, A.V.; Mamonova, D.V.; Kolesnikov, E.Y.; Kurochkin, A.V.; Lähderanta, E.; Mikhailov, M.D. Asymmetry ratio as a parameter of Eu3+ local environment in phosphors. J. Rare Earths 2018, 36, 474–481. [Google Scholar] [CrossRef]
  44. Targonska, S.; Szyszka, K.; Rewak-Soroczynska, J.; Wiglusz, R.J. A new approach to spectroscopic and structural studies of the nano-sized silicate-substituted hydroxyapatite doped with Eu3+ ions. Dalt. Trans. 2019, 48, 8303–8316. [Google Scholar] [CrossRef] [PubMed]
  45. Liu, J.; Liang, K.; Wu, Z.C.; Mei, Y.M.; Kuang, S.P.; Li, D.X. The reduction of Eu3+ to Eu2+ in a new orange-red emission Sr3P4O13: Eu phosphor prepared in air and its photoluminescence properties. Ceram. Int. 2014, 40, 8827–8831. [Google Scholar] [CrossRef]
  46. Peng, M.; Pei, Z.; Hong, G.; Su, Q. The reduction of Eu3+ to Eu2+ in BaMgSiO4: Eu prepared in air and the luminescence of BaMgSiO4: Eu2+ phosphor. J. Mater. Chem. 2003, 13, 1202–1205. [Google Scholar] [CrossRef]
  47. Pei, Z.; Su, Q.; Zhang, J. The valence change from RE3+ to RE2+ (RE = Eu, Sm, Yb) in SrB4O7: RE prepared in air and the spectral properties of RE2+. J. Alloys Compd. 1993, 198, 51–53. [Google Scholar] [CrossRef]
  48. Xie, H.; Lu, J.; Guan, Y.; Huang, Y.; Wei, D.; Seo, H.J. Abnormal Reduction, Eu3+→Eu2+, and Defect Centers in Eu3+-Doped Pollucite, CsAlSi2O6, Prepared in an Oxidizing Atmosphere. Inorg. Chem. 2014, 53, 827–834. [Google Scholar] [CrossRef] [PubMed]
Figure 1. X-ray powder diffraction patterns of the Sr10(PO4)6(OH)2–Sr3(PO4)2 composite doped with 3 mol% Eu3+ ions as a function of annealing temperature (up) and annealed at 750 °C composites as a function of dopant ions concentration (bottom).
Materials 13 04468 g001
Figure 2. Visualization of the hexagonal strontium apatite and trigonal tristrontium diphosphate unit cells with the coordination polyhedra of the cations.
Materials 13 04468 g002
Figure 3. The particle size distribution (left) based on SEM images (middle) as well as EDS spectra (right) of the Sr10(PO4)6(OH)2–Sr3(PO4)2 composite doped with 3 mol% Eu3+ ions annealed at 750 (a), 850 (b) and 950 °C (c).
Materials 13 04468 g003
Figure 4. SEM image and EDS elemental maps of the 3 mol% Eu3+:Sr10(PO4)6(OH)2–Sr3(PO4)2 composite annealed at 750 °C.
Materials 13 04468 g004
Figure 5. FT-IR spectra of the annealed 3 mol% Eu3+: Sr10(PO4)6(OH)2–Sr3(PO4)2 composite annealed at different temperatures.
Materials 13 04468 g005
Figure 6. Representative excitation-emission spectra of the Sr10(PO4)6(OH)2–Sr3(PO4)2 composite doped with 1 mol% Eu3+ ions annealed at 750 °C.
Materials 13 04468 g006
Figure 7. Emission spectra of the Sr10(PO4)6(OH)2–Sr3(PO4)2 composite doped with 3 mol% Eu3+ ions as a function of post-heat treatment temperature excited by 266 nm (above) and by 395 nm line (below) measured at 300 K (left) and 80 K (right).
Materials 13 04468 g007
Figure 8. Emission spectra of the Sr10(PO4)6(OH)2–Sr3(PO4)2 composite doped with Eu3+ ions as a function of the Eu3+ ions concentration annealed at 750 °C, excited by 266 nm line, measured at 300 K (left) and 80 K (right).
Materials 13 04468 g008
Figure 9. The luminescence intensity dependence on the measurement temperature of 1 mol% Eu3+: Sr10(PO4)6(OH)2–Sr3(PO4)2 in the temperature range of 80–550 K. Inset: dependence of integrated intensity of the Eu2+ and Eu3+ emission on the measurement temperature.
Materials 13 04468 g009
Figure 10. CIE chromaticity coordinates values of the 1 mol% Eu3+: Sr10(PO4)6(OH)2–Sr3(PO4)2 excited by 266 nm and measured in 80, 300 and 550 K of temperature.
Materials 13 04468 g010
Figure 11. Luminescence kinetics of the Sr10(PO4)6(OH)2–Sr3(PO4)2 composite doped with 3 mol% Eu3+ ions as a function of heat-treatment temperature (left) and annealed composite at 750 °C as a function of europium ions concentration (right).
Materials 13 04468 g011
Figure 12. Luminescence kinetics of the blue component of the 1 mol% Eu3+: Sr10(PO4)6(OH)2–Sr3(PO4)2 composite annealed at 750 °C. Excited by 266 nm and observed at 430 nm.
Materials 13 04468 g012
Figure 13. The emission spectrum image form streak camera of the 1 mol% Eu3+: Sr10(PO4)6(OH)2–Sr3(PO4)2 composite annealed at 750 °C.
Materials 13 04468 g013
Table 1. Unit cell parameters (a and c), crystal cell volume (V), the percentage of particular phases calculated based on the Rietveld methods, and refined factors (Rw) presented for the Sr10(PO4)6(OH)2–Sr3(PO4)2 powder composites as a function of dopant concentration and sintering temperature.
SampleCell ParametersPhase
Belovite
Sr5(PO4)3OH
Tristrontium Bis(Phosphate(V))
Sr3(PO4)2
SrHAp (%)TSP (%)Rw
a (Å)c (Å)V (Å3)a (Å)c (Å)V (Å3)
s. c.9.745 (1)7.265 (1)597.49 (15)5.3975 (2)19.818 (3)500.01 (8)
0.5% mol Eu3+; 750 °C9.769 (1)7.282 (1)601.84 (07)5.3912 (5)19.794 (9)498.23 (6)78.1621.841.38
1% mol Eu3+; 750 °C9.767 (3)7.282 (1)601.59 (43)5.3913 (1)19.798 (1)498.35 (5)82.7917.211.30
2% mol Eu3+; 750 °C9.769 (2)7.278 (5)601.51 (01)5.3921 (2)19.802 (6)498.60 (4)80.3619.641.20
3% mol Eu3+; 750 °C9.758 (9)7.270 (1)599.49 (65)5.3892 (6)19.795 (8)497.89 (1)62.6537.351.28
5% mol Eu3+; 750 °C9.760 (5)7.270 (1)599.74 (22)5.3886 (5)19.796 (7)497.80 (6)80.5519.451.55
3% mol Eu3+; 850 °C9.748 (5)7.262 (7)597.61 (01)5.3904 (1)19.798 (7)498.18 (9)50.8149.192.12
3% mol Eu3+; 950 °C9.735 (1)7.251 (1)595.11 (44)5.3904 (5)19.796 (4)498.13 (8)47.6952.311.46
Table 2. Decay rates of radiative (Arad), nonradiative (Anrad) and total (Atot) processes of the 5D07FJ transitions, luminescence lifetimes (T), intensity parameters (Ω2, Ω4), quantum efficiency (η) and asymmetry ratio (R) of the Sr10(PO4)6(OH)2–Sr3(PO4)2 composites.
3 mol% Eu3+: Sr10(PO4)6(OH)2–Sr3(PO4)2
SampleArad
(s−1)
Anrad
(s−1)
Atot
(s−1)
T (ms)Ω2
(1020cm2)
Ω4
(1020cm2)
η (%)R
750 °C167.5686.11253.673.943.27043.275766.052.321
850 °C154.1373.81227.944.392.94012.930167.622.087
950 °C164.66150.97315.633.173.32322.941452.172.359
x mol% Eu3+:Sr10(PO4)6(OH)2–Sr3(PO4)2 750 °C
0.5 mol% Eu3+182.37259.13441.502.273.48353.973341.312.473
1 mol% Eu3+199.03190.38389.412.574.05044.073151.112.875
2 mol% Eu3+187.74218.58406.322.463.74313.844746.212.657
3 mol% Eu3167.5686.11253.673.943.27043.275766.052.321
5 mol% Eu3+185.04130.41315.453.173.72573.672858.662.645

