Article

Repeated Thermal Shock Behavior of ZrB2–SiC–Graphite Composite under Pre-Stress in Air and Ar Atmospheres

1
College of Aerospace Engineering, Chongqing University, Chongqing 400044, China
2
State Key Laboratory of Coal Mining Disaster Dynamics and Control, Chongqing University, Chongqing 400044, China
3
Department of Mechanical Engineering, Tokyo Institute of Technology, Tokyo 152-8552, Japan
4
Advanced Manufacturing Engineering, Chongqing University of Posts and Telecommunications, Chongqing 400065, China
*
Authors to whom correspondence should be addressed.
Materials 2020, 13(2), 370; https://doi.org/10.3390/ma13020370
Submission received: 17 December 2019 / Revised: 6 January 2020 / Accepted: 9 January 2020 / Published: 13 January 2020
(This article belongs to the Special Issue High Temperature Ceramic Materials)

Abstract

:
The thermo–chemo–mechanical coupling on the thermal shock resistance of 20 vol%-ZrB2–15 vol%-SiC–graphite composite is investigated with the use of a self-developed material testing system. In each test, a specimen under prescribed constant tensile pre-stress (σ0 = 0, 10, 20 and 30 MPa) was subjected to 60 cycles of thermal shock. In each cycle, the specimen was heated from room temperature to 2000 °C within 5 s in an air atmosphere or an Ar atmosphere. The residual flexural strength of each specimen was tested, and the fracture morphology was characterized by using scanning electron microscopy (SEM). There were three different regions in the fracture surface of a specimen tested in the air, while no such difference could be observed in the fracture surfaces of the specimens that were tested in Ar. The residual flexural strength of the composite that was tested in Ar generally decreases with the increase of σ0. However, in the range of 0 ≤ σ0 ≤ 10 MPa, the residual flexural strength of the composite that was tested in the air ascended with the increase of σ0 due to the healing effect of oxidation, but it descended thereafter with a further increase of σ0, as the effect pre-stress that became prominent.

1. Introduction

Zirconium diboride (ZrB2) is an important member of ultrahigh-temperature ceramics (UHTCs) [1] that has been extensively used as wing leading edges, nose-caps and propulsion system components in space vehicles due to its excellent thermal, mechanical, and chemical properties, such as its high melting point (>3000 °C), high electrical and thermal conductivity, high corrosion resistance, and chemical stability [2,3,4,5,6,7,8,9,10]. Among these properties, thermal shock resistance (TSR) is of vital importance, as most nose-cap, leading edge and aero-engine applications re inevitably subjected to thermal shock, such as the sudden temperature change by high-speed friction with air. Additionally, an appropriate strength, thermal expansion coefficient, density and machinability are equally important for the application of UHTCs [11,12,13].
At present, most of the methods that are used for testing the TSR of UHTCs are based on quenching thermal shock and the temperature difference at which the strength of a material after quenching decreases to 70% of its initial strength is defined as the critical temperature difference (ΔTc) of quenching thermal shock. Because of its low cost, easy operation, simplicity and maturity, this method has been widely used to investigate the TSR of UHTCs [14,15,16,17,18,19]. Jin investigated the effects of porosity and pore size on the mechanical properties and thermal shock fracture resistance of a sintered ZrB2–SiC composite with a single cycle of room-temperature water quenching and found that porous ZrB2–SiC samples possessed higher thermal shock residual strength than dense ZrB2–SiC samples [16,20]. Hu performed the water quenching thermal shock of a ZrB2–SiC–graphite composite heated in a vacuum and an air atmosphere and showed that the residual strength of the samples heated in air had a lift when the temperature change (ΔT) was higher than 1200 °C, while the residual strength of the samples heated in a vacuum decreased with the increase of ΔT [21,22,23]. Chen [17,24] investigated the effect of the gradient of surface heat transfer coefficient on the strength of a ZrB2–SiC–graphite composite that was subjected to thermal shock that was induced by quenching in different mediums—aqueous silicone oil, water, and boiling water. Zhang et al. systematically investigated the thermal shock behavior of diboride-based UHTCs with additions such as carbon black, an SiC whisker, and disilicide (TaSi2) [25,26,27,28]. Furthermore, the TSR of composites with additions of graphite, SiC fibers, SiC nanoparticles, carbon nanotubes, and carbon fiber were also extensively investigated [7,29,30,31,32,33,34,35].
It is hard for people to perform repeated thermal shock with water quenching experiments at a large ΔT (>2000 °C) by heating specimens with a Murphy furnace. On the one hand, heating a specimen to a very high temperature usually takes a long time, and most furnaces can hardly work at such a high temperature. On the other hand, the cooling rate generated by quenching is usually extremely large and even beyond the range of actual applications. There is a problem when using thermal shock induced by quenching to simulate that induced by fast-heating, because their thermal–mechanical processes, the surrounding environments, the changes in material property, and the modes of deformation and failure might be completely different. Fortunately, there is another means to more realistically achieve the actual thermal shock condition. In fact, for UHTCs with a satisfactory conductivity, such as ZrB2, it is more convenient to use the resistance heating method to simulate thermal shock that is related to fast-heating, where the interactions between components and the varying atmospheres around flight and re-entry conditions can be more realistically considered [36,37]. For example, Meng et al. systematically performed the repeated thermal shock of ZrB2–SiC and ZrB2–SiC–ZrC composites with resistance heating, and they showed that the residual strength did not decline monotonically with the increase of thermal shock cycles that reuslted from the formation of the pores in the oxide layer during thermal shocks [38,39,40,41]. In their work, the effect of pre-stress and environmental atmospheres, which is usually encountered in the actual application of UHTCs, was not involved. Jin et al. investigated the effect of heating rate on the residual strength of a ZrB2–SiC–graphite (ZSG) composite in atmospheres of low oxygen partial pressure (200 Pa) and in pure oxygen [42,43], and they revealed that the TSR is sensitive to the heating rate; the residual strength decreased with the increase of ΔT as 1800 °C < ΔT < 2200 °C. Meanwhile, the residual strength decreased with the increase of heating rate for the same ΔT. They also showed that the size effect on the TSR with resistance heating was different from that with quenching; the specimens of larger size exhibited a lower residual strength. However, the effect of pre-stress on the residual strength of materials that are subjected to thermal shock, as well as the effect of oxidation, is still unclear. Though some progress has been made in the thermal fatigue life of ZSG composites under pre-stress [44,45], the effect and the mechanism of pre-stress on the accumulated damage of the composites that are subjected to thermal shock in different atmospheres need more detailed investigation, considering that residual flexural strength is usually affected by complex effects of coupled thermal shock and oxidation and keeping in mind that pre-stress exists in most actual engineering structures.
In this article, we intend to separately investigate the effects of pre-stress and oxidation on the mechanical properties of a 20 vol%-ZrB2–15 vol%-SiC–graphite composite that is subjected to repeated thermal shock. In Section 2, the experimental procedure is briefly introduced, and the residual flexural strengths of the specimens are tested. In Section 3, the microstructures of the tested specimens are analyzed with a scanning electron microscope (SEM), and the accumulated damage (microcracks) that are caused by repeated thermal shock under various pre-stresses in air and in Ar environments is analyzed. Some conclusions are drawn and given in Section 4.

2. Experimental Procedure

The schematic diagram of the self-developed, coupled thermal–mechanical material testing system used for our tests is shown in Figure 1. Its physical diagram and details were also introduced elsewhere [44,45,46]. A lambda sensor (7OVX, City Technology, Ltd., Hampshire, UK) was equipped in the chamber to measure the oxygen content during the tests.

2.1. Specimen Preparation

The 20 vol%-ZrB2–15 vol%-SiC–graphite composite (ZSG) that was used in this experiment was provided by Beijing Zhongxin Technology Co., in which the powders of ZrB2 (Beijing Zhongxin Technology Co., Ltd., Beijing, China), SiC (Weifang Kaihua Micropowder Co., Ltd., Weifang, China) and graphite flake (Qingdao Tiansheng Graphite Co., Ltd., Qingdao, China) had purities of over 99.0%, and the mean diameters of ZrB2 and SiC were 2 and 0.5 µm, respectively. The mean diameter and the thickness of the graphite flake were 15 and 1.5 µm, respectively. The volume fractions of the three kinds of powders in the composite were 0.65, 0.20 and 0.15, respectively. The powder mixtures were ball-milled at a speed of 220 rpm for 12 h, with ZrO2 balls and ethanol as the grinding media. After mixing, the slurry was dried in a rotary evaporator and screened. Then, the mixtures were at 1900 °C in a furnace (FVPHP-R-5, Fuji Dempa Kogyo Co., Ltd., Tokyo, Japan) in a vacuum for 60 min under a uniaxial compressive stress of 30 MPa while using a boron nitride coated graphite die. The relative density of the bulk material was 96.3%. The specimens were strips of 2 × 3 × 36 mm (width × height × length), with their length parallel to the direction of the compressive stress applied during sintering.

2.2. Repeated Thermal Shock Tests

During the repeated thermal shock experiments, the specimens were subjected to constant tensile stresses of σ0 = 0, 10, 20 and 30 MPa, which were provided by standard weights. Two different gaseous atmospheres were used for the tests: air and Ar atmospheres. For the latter, the chamber was sealed with a cover, and the gas inside was pumped out with a vacuum pump (Trivac D8C, Oerlikon Leybold Vacuum Co. Ltd., Tianjing, China) until the vacuity in the vacuum chamber was lower than 10 Pa. Then, the Ar gas (with a purity of over 99.999%) was fed until it fully filled the chamber. Such extraction and feeding of Ar gas was repeated three times before thermal shock testing started. The oxygen content in the sealed chamber measured with a lambda sensor (7OVX, City Technology, Ltd., Hampshire, UK) is shown in Figure 2, which indicates that the final oxygen content in the vacuum chamber was less than 1500 ppm. In each test, a specimen was heated from room temperature (25 °C) to 2000 °C by applying a electrical current of 350 A, which was then automatically switched off when the temperature at the center of the specimen surface reached 2000 °C. The variations of real-time temperature and electric current against the testing time between two cycles of thermal shock is displayed elsewhere [44]. In each cycle, the time for applying the current was about 5 s, and then the specimen was cooled down naturally for 25 s, which was found to be sufficient for the temperature in the specimen to fall back to room temperature (25 °C) from 2000 °C. The average heating rate was about 500 °C/s from 1000 to 2000 °C, and the average cooling rate was about 300 °C/s from 2000 to 1000 °C. In order to show the accumulated effects of the adopted experimental conditions and to prevent the specimen from failure during the repeated thermal shock test, in each test, the number of thermal shock cycles was limited to 60. The experimental conditions are listed in Table 1, and for each condition, at least three specimens were tested.

2.3. Flexural Tests

The residual flexural strength of each specimen after 60 cycles of thermal shock was tested by an instrument (EZ-LX, Shimadzu, Inc. Japan) with a crosshead speed of 0.1 mm/min. The following equation was used for calculating the residual flexural strength:
σ f = 3 F L 2 b h 2
in which L, b, h and F are the fixture span, width, height, and the failure load of specimen, respectively. Considering the capacity of testing equipment, L = 25 mm, b = 3 mm and h = 2 mm were chosen. The results of the tests are shown and discussed in Section 3.2.

3. Results and Discussion

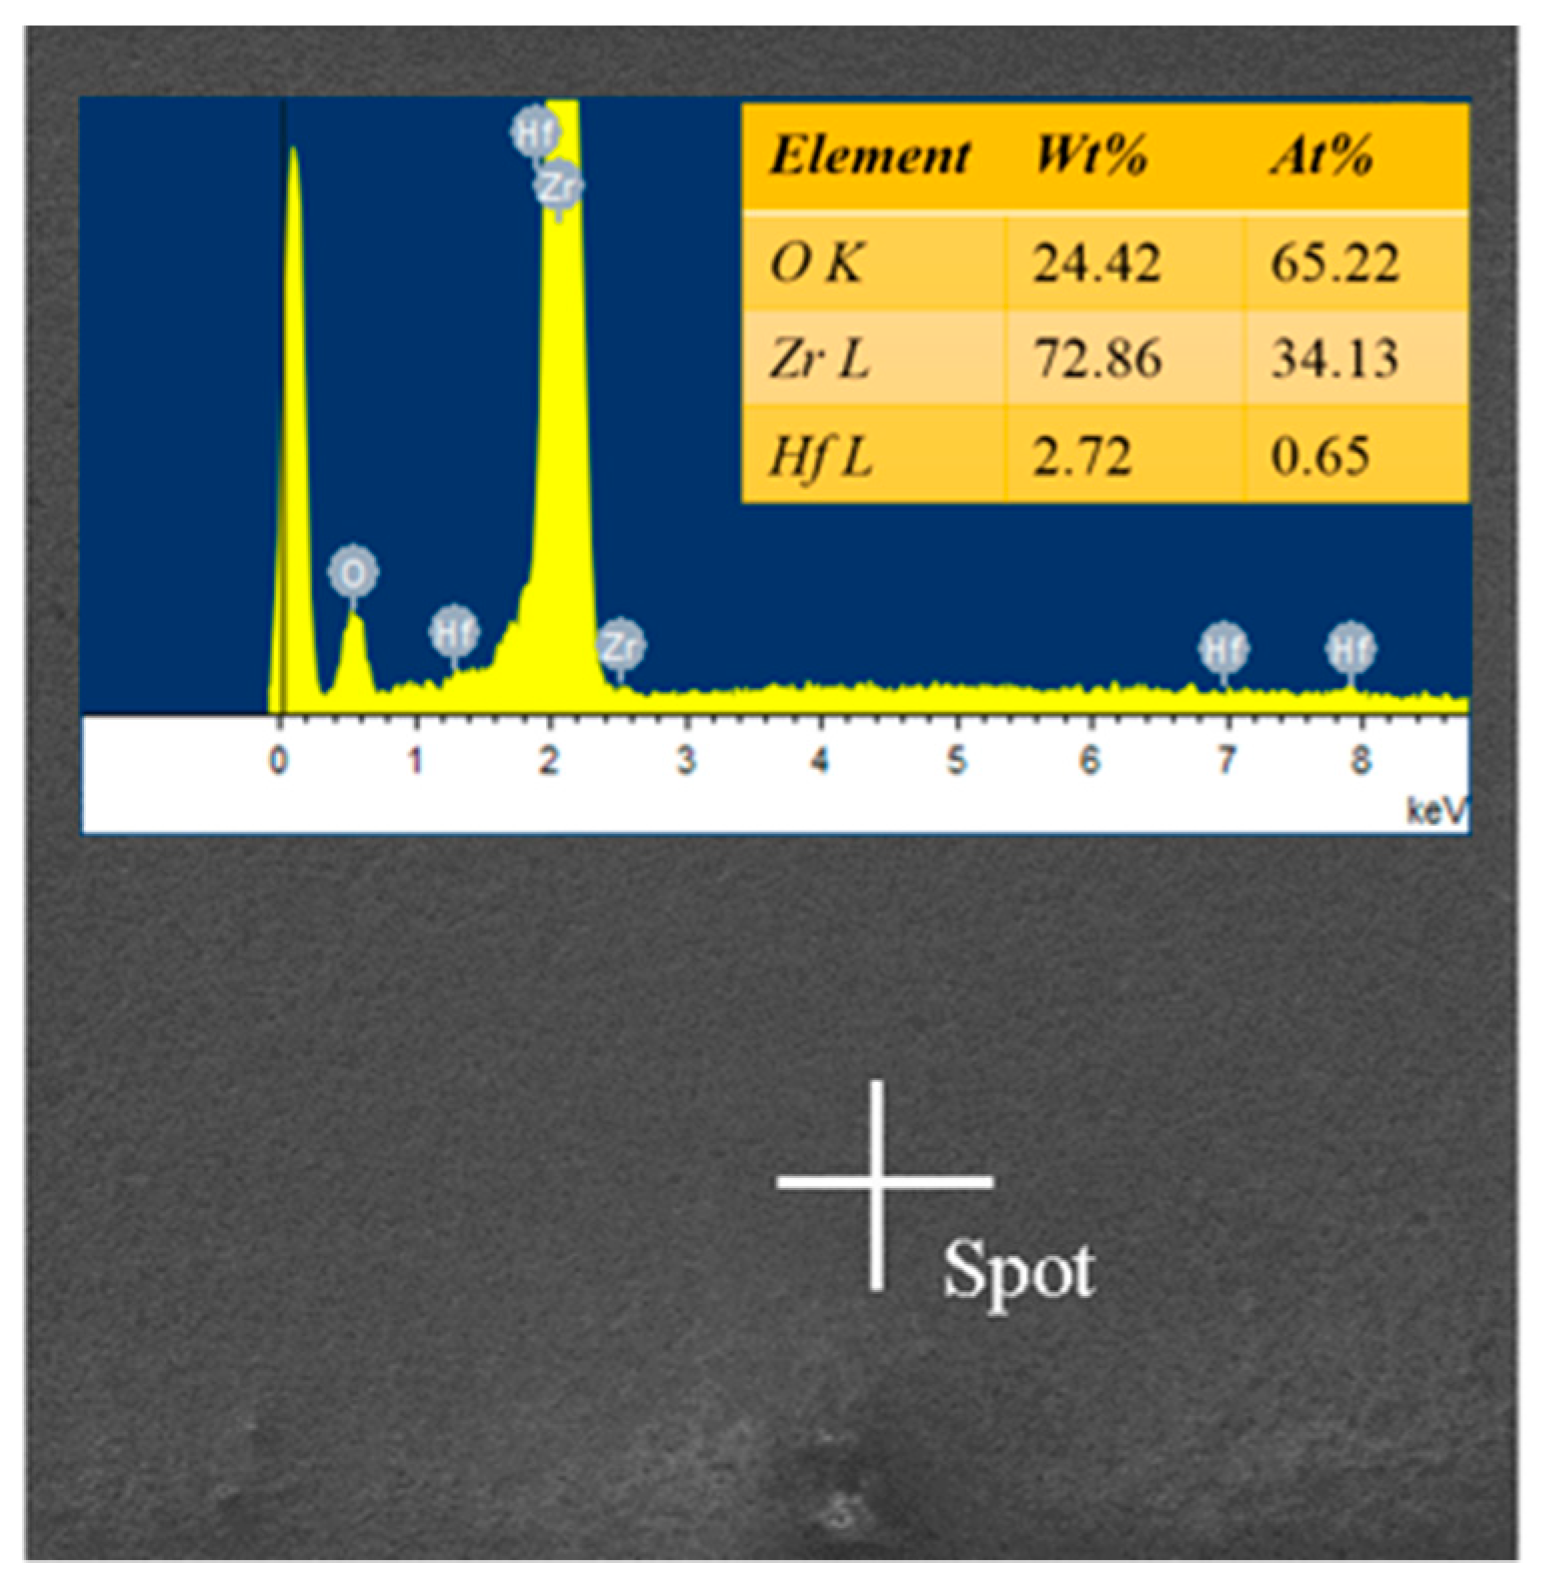
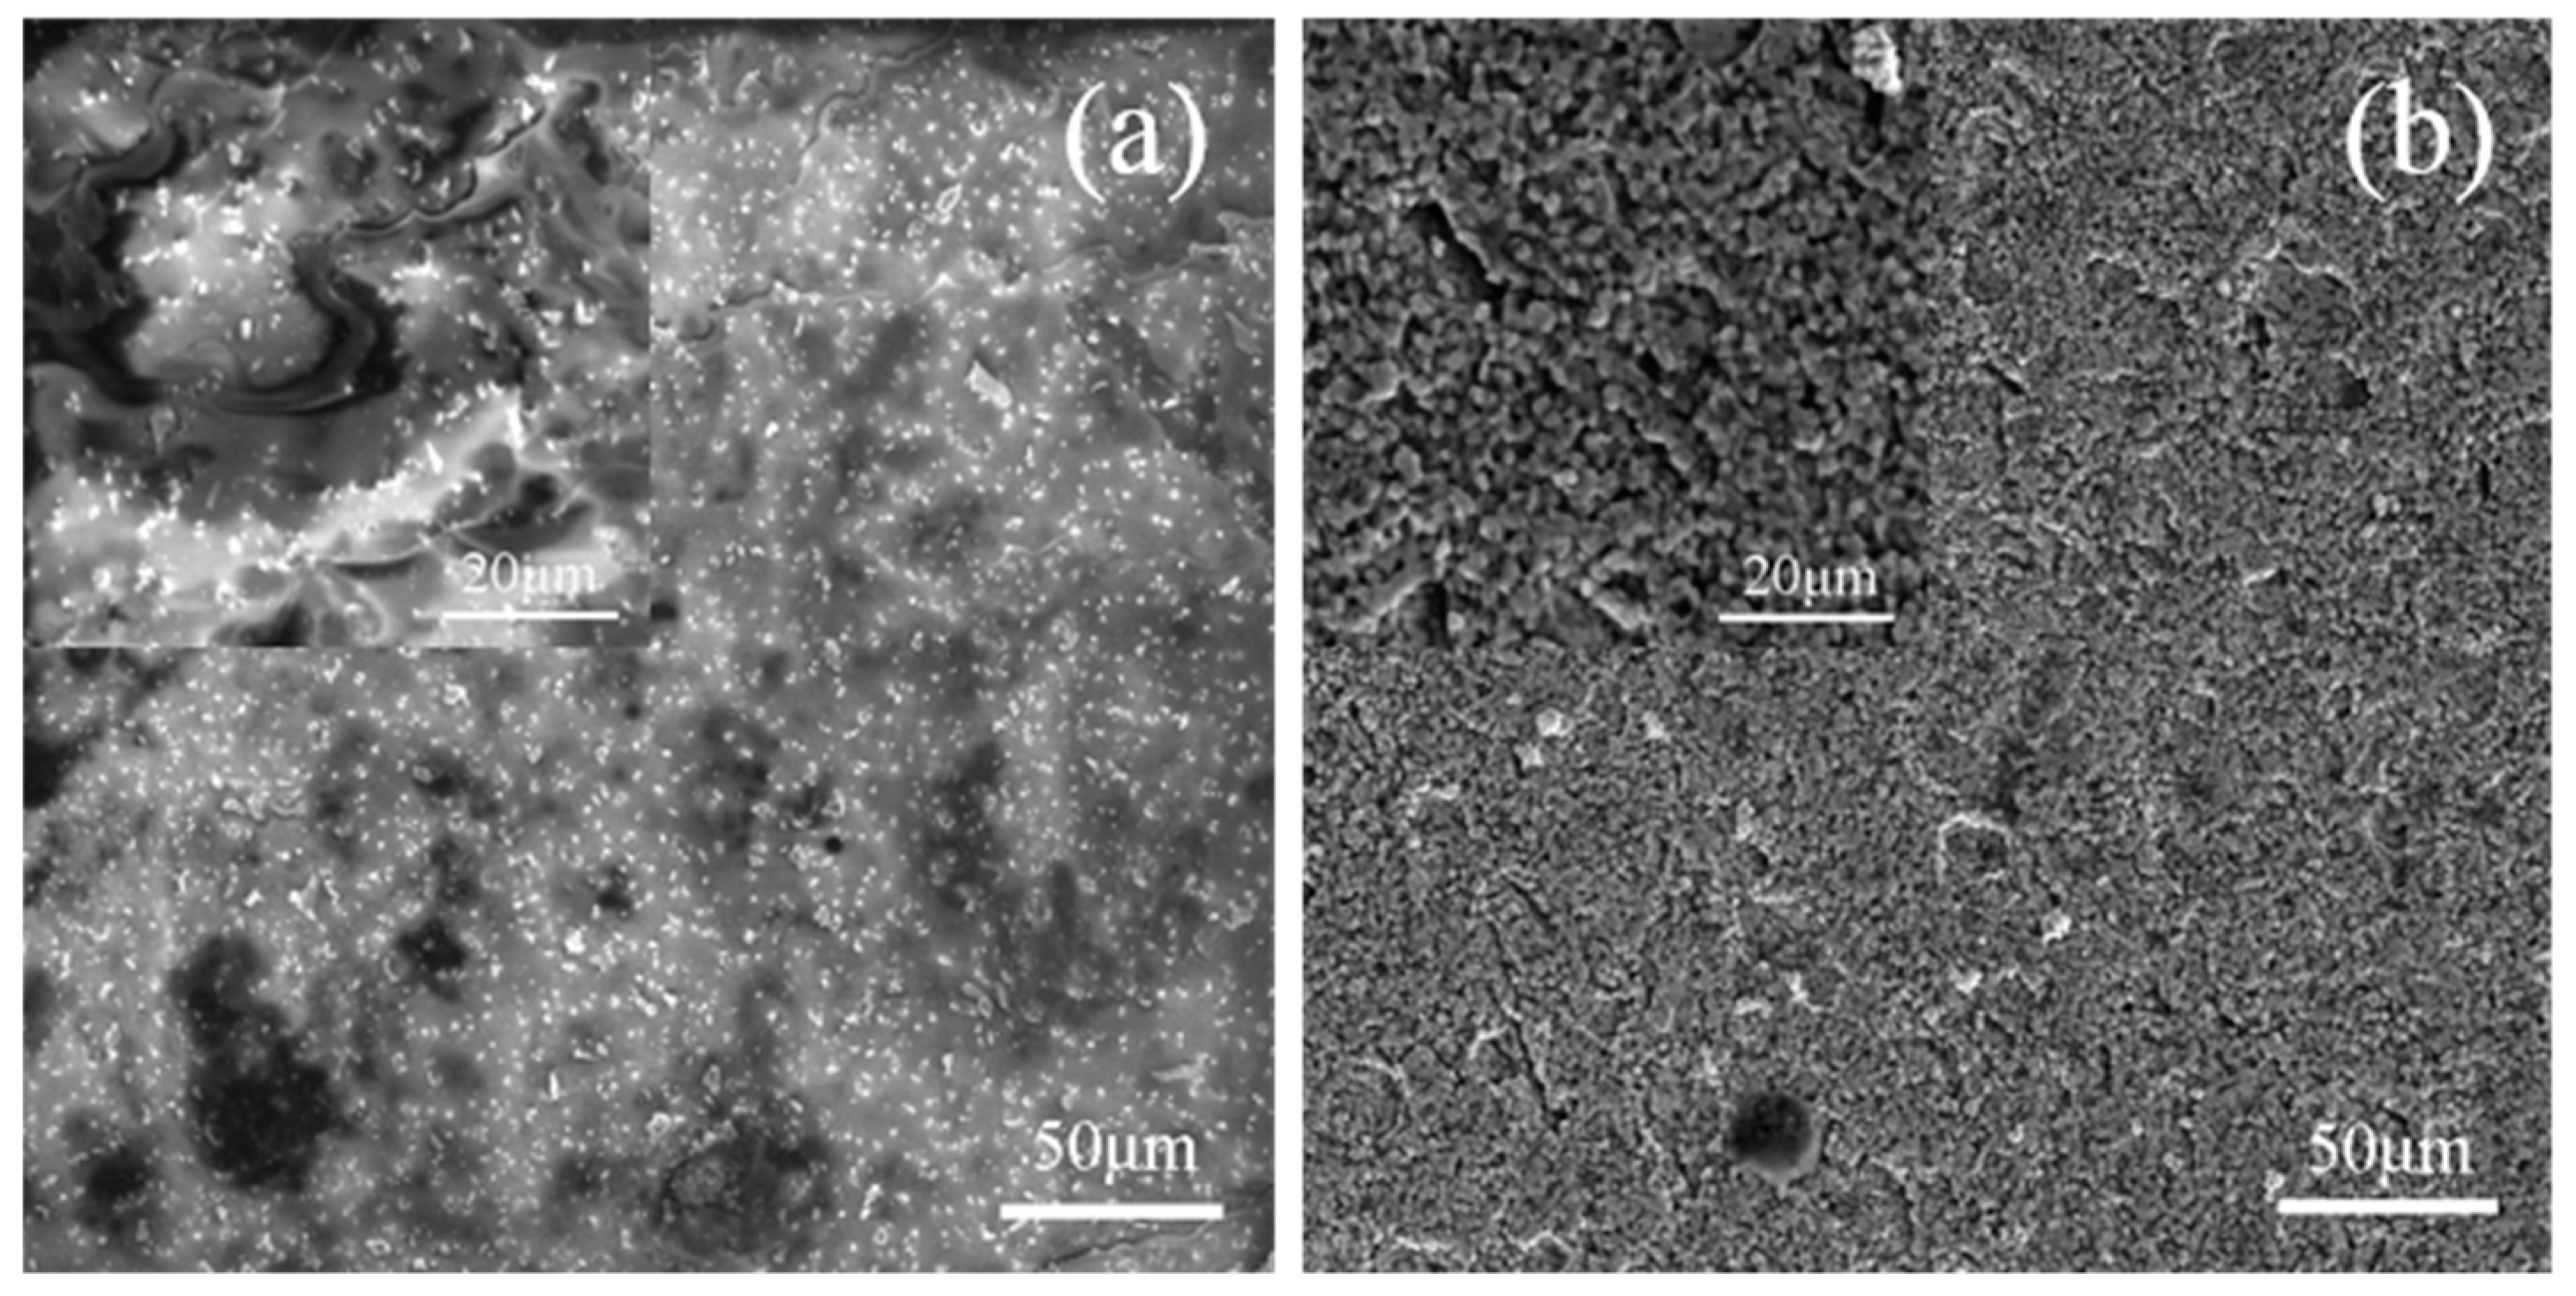
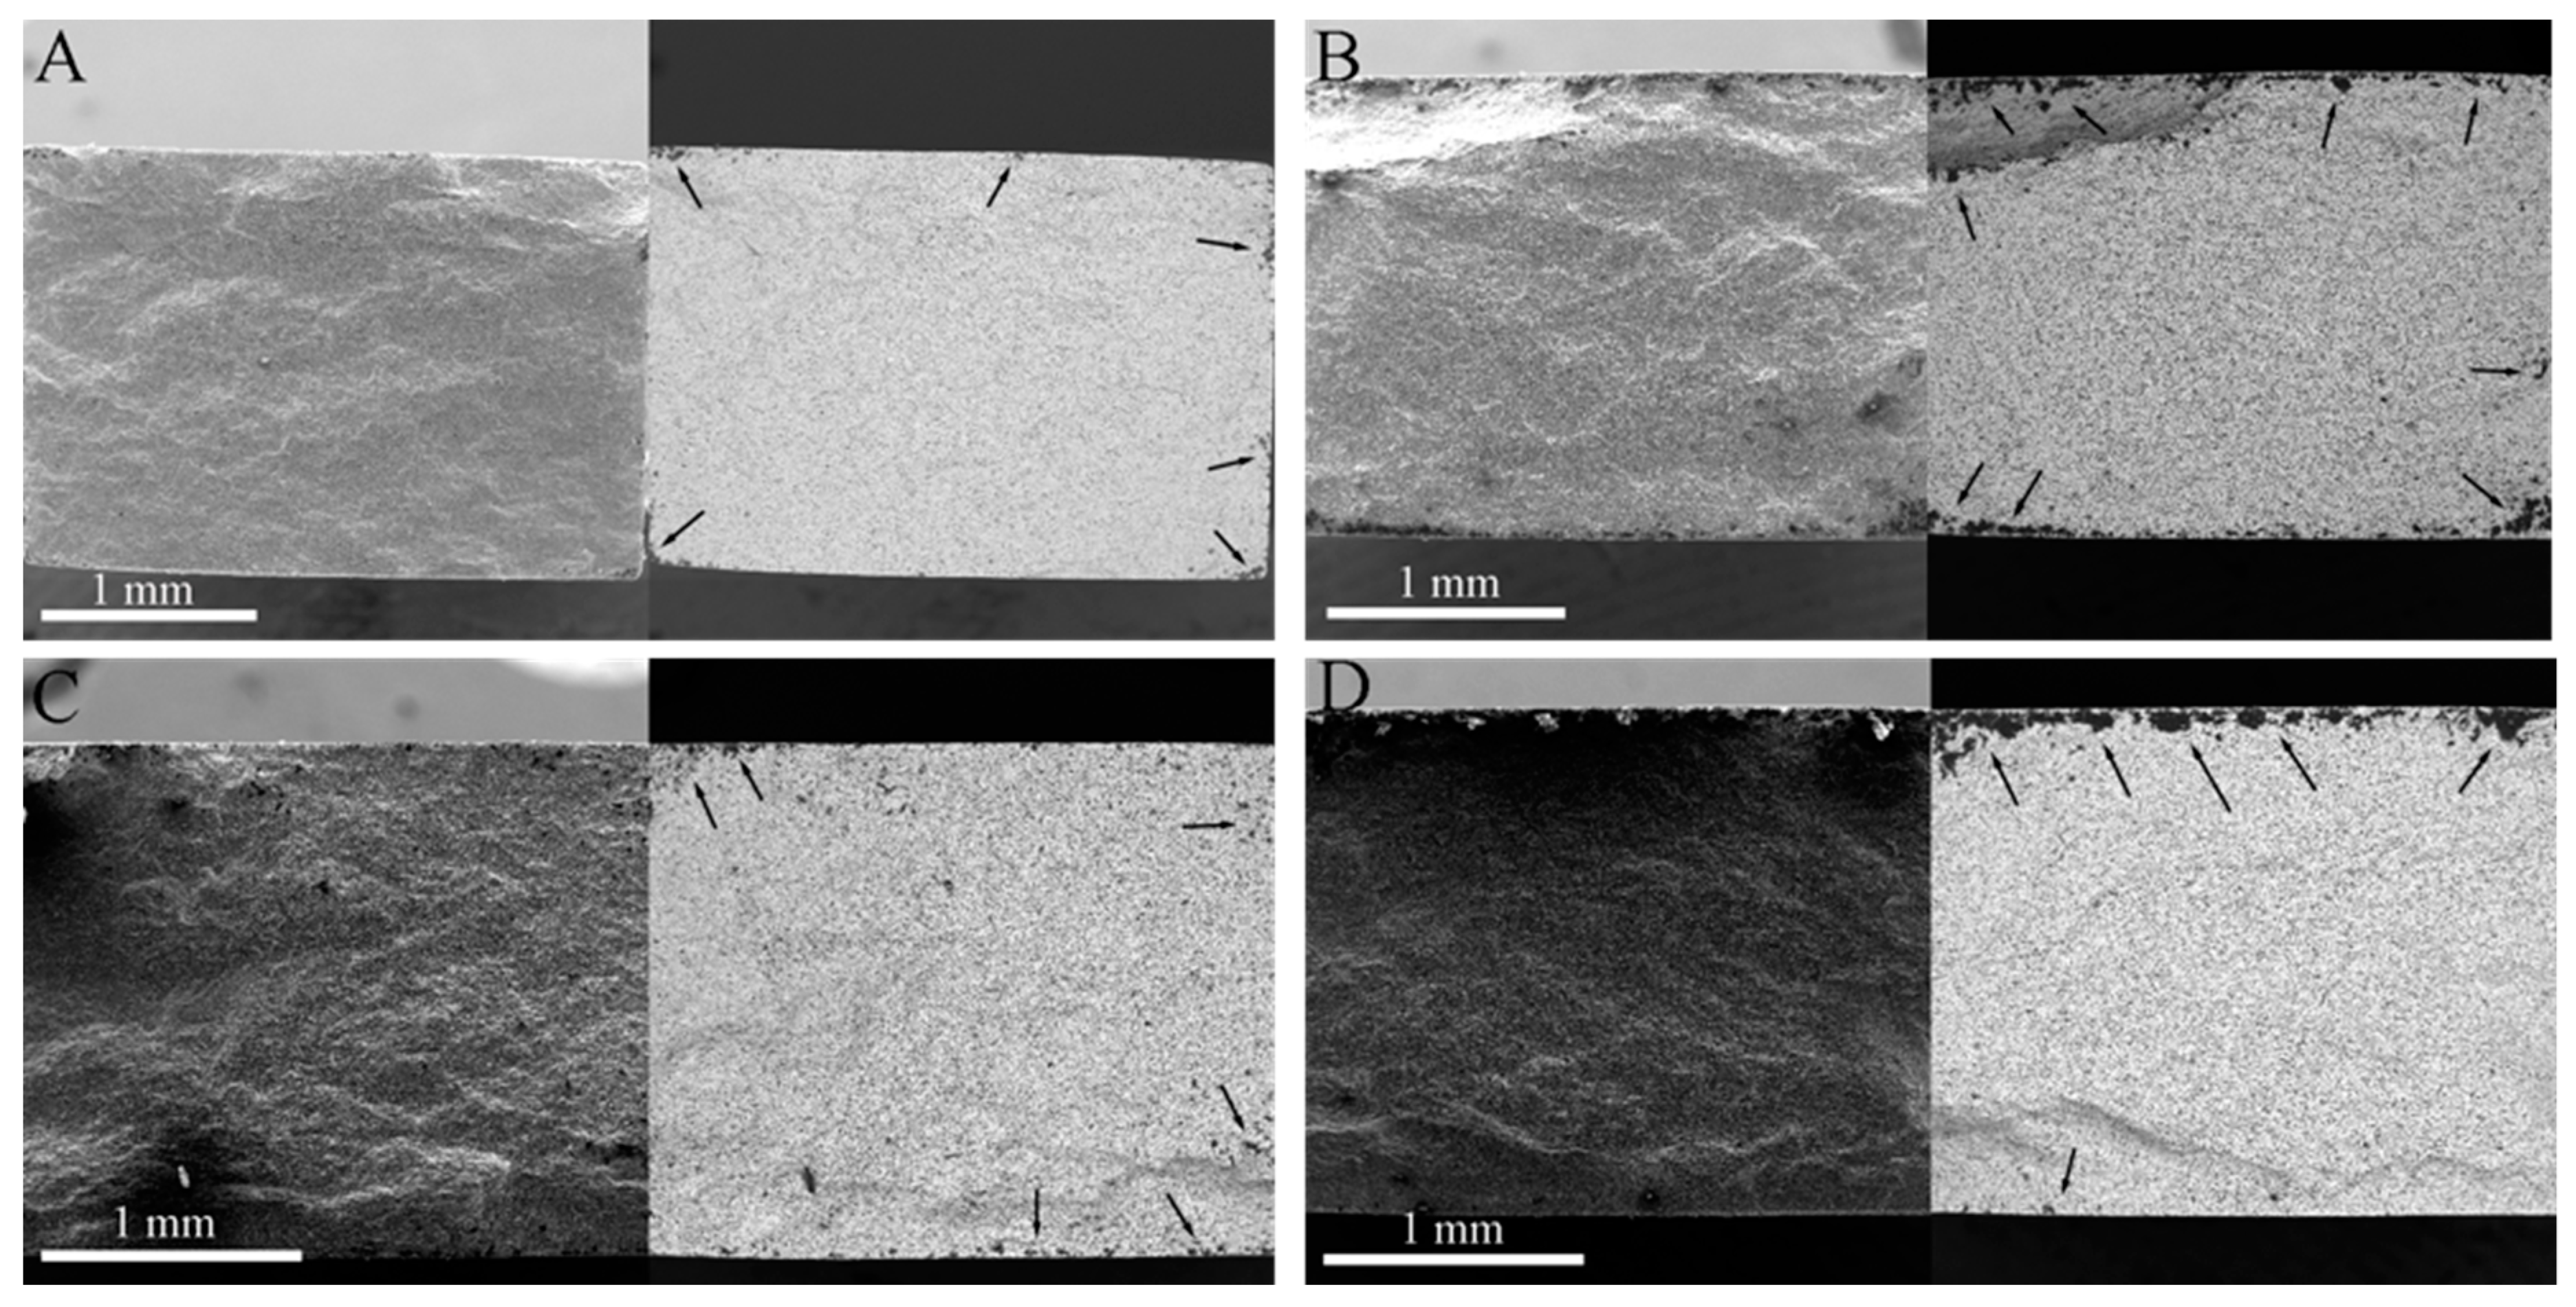
3.1. Surface Analysis

The surfaces of the specimens that were tested with different pre-stresses in the air or Ar atmospheres are shown in Figure 3. It can be seen that there was a significant difference between the surfaces of the specimens that were tested in two different kinds of gaseous atmospheres. Due to oxidation, the central parts of the surfaces of the specimens that were tested in air became white, while the parts near the two ends looked dark. On the contrary, the central parts of the surfaces of the specimens that were tested in the Ar atmosphere were gray, and both sides near the central parts looked white. The constituent on the surface of specimens that were tested in air was mainly borosilicate glass and ZrO2 [47], while that of specimens that were tested in the Ar atmosphere was mainly ZrO2 (as shown in Figure 4) which can be attributed to the very low oxygen content (<1500 ppm); this information was obtained by using energy dispersive spectroscopy (EDS) analyses. Additionally, the occurrence of a minor amount of hafnium could be ascribed to the imported contamination during material preparation. For the specimens that were tested under σ0 = 20 MPa in the air and in Ar atmospheres, the surface images at 2000 °C that were taken by the camera are shown in Figure 5, where bubbles can be seen on the specimen that was tested in air due to the escape of the gaseous oxidation products beneath the surface glassy layer, such as CO, SiO and B2O3. However, on the surface of the specimen that was tested in the Ar atmosphere, there were only a few, almost invisible tiny bubbles. The surfaces of the specimens that were tested in air were rough due to the appearance of bubbles, while the surface of the specimen that was tested in the Ar atmosphere looked much smoother. Figure 6a shows the SEM photographs of the surface of the specimen that was subjected to 60 cycles of thermal shock in air under σ0 = 20 MPa, and it can be seen that the growth of the oxide products (ZrO2) exhibited a ridge-valley-like feature, where liquid oxide products (SiO2 and a small amount of dissolved B2O3) flowed along the valleys, as shown in Figure 6a and its inset. The ripple on the surface provides distinct evidence of an oxidation reaction and the existence of borosilicate glass layer. For the specimen that was tested in the Ar atmosphere, as shown in Figure 6b, there was no such outermost borosilicate glass layer. The outermost layer was mainly composed of ZrO2 particles.
Figure 7 and Figure 8 show the SEM photographs of the fracture surfaces of the specimens that were tested in different atmospheres after 60 cycles of thermal shock under σ0 = 0, 10, 20 and 30 MPa, followed by bending fracture tests. Figure 7 shows the fracture surfaces of the specimens that were tested in air; in each of these, there are three parts: the glassy layer, the oxide layer and the substrate. The boundaries between these parts were distinct, as indicated by the dashed lines. However, in the specimens that were tested in the Ar atmosphere, as shown in Figure 8, there was no distinct glassy layer or oxide layer; there was mainly a substrate that was covered by a thin surface layer, and the boundary between them could be found. This indicates that for the specimens that were tested in the Ar atmosphere, a chemical reaction played an insignificant role, i.e., the oxidation and tis corresponding effect on the material property could be ignored.
It can be seen in Figure 7 that the thicknesses of the outermost glassy layers of the specimens for ZSG0, ZSG10, ZSG20, and ZSG30 were 4.98, 4.04, 5.64, and 4.80 µm, respectively, of which the average thickness was approximately 4.87 µm. These glassy layers were mainly composed of solidified SiO2 with a small amount of dissolved B2O3, both which are the oxides of SiC and ZrB2. Each cycle of thermal shock could be divided into two processes: When heating up, the gaseous oxide of B2O3, CO and SiO would have been transmitted to the specimen surface, where a large amount of liquid SiO2 would have been formed. Because the heating time would have been very short, most gaseous oxides would have diffused into air, and a little B2O3 would have dissolved in the liquid SiO2 and remained on the specimen surface. During cooling, this mixture would have solidified to form an amorphous glassy layer on the specimen surface that would have reduced the diffusion of oxygen into the specimen and would have provided effective protection against oxidation until it reached a temperature of 1800 °C. However, with the further increase of thermal shock cycles, the oxidation time would have increased, and the amorphous glassy layer would have tended to completely evaporate, resulting in a porous ZrO2 surface layer [47,48].
The oxidation product, ZrO2, would have formed the skeleton in the oxide layer. The grains in this layer were different from those in the substrate. The grains in the substrate were of similar equiaxial shape, while the grains in the oxide layer were columnar. It is known that ZrO2 can be dissolved in the liquid mixture of liquid borosilicate, and, with the evaporation of gaseous oxide, ZrO2 precipitates and forms columnar grains. On the other hand, the interstices between columnar grains also serve as the pathways for oxygen to diffuse inwards and for gaseous oxide to diffuse outwards, which could promote the oxidation in the composite. As a consequence, a solidified mixture would have dispersed between the columnar ZrO2 grain boundaries. The thicknesses of the oxide layers corresponding to σ0 = 0, 10, 20 and 30 MPa were 23.61, 24.82, 23.98 and 23.42 µm, respectively, as shown in Figure 7. This shows that, in our previous thermal shock experiments with UHTCs [44,46], with sufficient oxidation time, the grains in this layer could have had a columnar shape and the thickness of this layer could have been large; this would have been less dependent on the applied pre-stress under the adopted experimental conditions.
The thicknesses of the mixed layers, including the oxide and outermost glassy layers of ZSG0, ZSG10, ZSG20, and ZSG30 were 28.59, 28.86, 29.62 and 28.22 µm, respectively, with an average thickness of 28.82 µm, which was much thicker than that of the surface layers of the specimens that were tested in the Ar atmosphere. Instead of the outmost glassy layer, the surface layer of the specimen tested in the Ar atmosphere was slightly oxidized and was composed of a minor amount of ZrO2 particles. Compared with the composite that was tested in air, there was no borosilicate and dissolved SiO2 in the oxide layer, as shown in Figure 4, due to the very limited content of oxygen. In Figure 8, the grains in the surface layer can be seen to be almost equiaxial, similar to the grains in the substrate and the intergranular pores that can be observed from each fracture surface. The pull-out of graphite flakes can also be observed, as marked by the red ellipses in Figure 8, which indicates the weak bond between the graphite flake and substrate. On the contrary, few graphite flakes could be found in the mixed layers of the specimens that were tested in air, as shown in Figure 7. These differences could be ascribed to the different atmospheres and the severe oxidation of graphite flakes that was experienced in air at a temperature over 500 °C [8]. The pores vanished due to the growth of ZrO2 grains and the solidified borosilicate being dispersed between these grains.
The fractographs and corresponding backscattered electron images of the ZSG composite specimens that were tested in the air and Ar atmospheres under σ0 = 0, 10, 20 and 30 MPa are shown in Figure 9 and Figure 10, respectively. The sites that are indicated by black arrows are identified as the aggregate of SiO2 particles, which also refer to the pits on the fracture surface. As revealed in our previous investigation [45], under a small σ0, a fracture may take place due to the coalescence of a great number of microcracks that usually initiate from the area where SiC particles aggregate. While under a large σ0, the composite is inclined to form large microcracks, so a fracture might occur due to the continuous propagation of these large microcracks [45]. It can be seen in Figure 9 that the density of pits in the fractographs of ZSG20 and ZSG30 (Figure 9C,D) was larger than that of ZSG0 and ZSG10 (Figure 9A,B). Figure 10 shows more pits in the fractographs of the specimens that were tested in the Ar atmosphere compared to that of the specimens that were tested in air. This difference could be ascribed to the absence of a glassy layer, as, without this protective layer, oxygen could diffuse into the interior of the specimen more easily—although the oxygen content was very limited in the Ar atmosphere. In both testing environments, the density of the pits increased with the increase of σ0. A larger σ0, as well as a large number of pits, was more conducive to the formation of microcracks in the specimen. Moreover, the larger σ0 values were also beneficial for the propagation of the microcracks. We also observed that the pits were almost located at the boundaries of the specimens, which implies that microcracks were more easily initiated within the layer near the surface and then propagated to the inside of the specimen.
The typical microcracks in the fracture surfaces of the specimens that were tested in the air and Ar atmospheres under σ0 = 0, 10, 20 and 30 MPa are shown in Figure 11 and Figure 12, respectively. They show that the length of the microcracks, in general, increased with the increase of σ0. On the other hand, under the same σ0, the average length of the microcracks in the fracture surface of the specimen that was tested in air was larger than that of the specimen tested in the Ar atmosphere. Additionally, the maximum length of the microcracks in the fracture surface of the specimen that was tested in air was measured as 1048.9 µm (Figure 11D), while that of the specimen that was tested in the Ar atmosphere was about 561 µm (Figure 12C). It is known that the stress in the central parts of a specimen that is tested in air comes from three forces: thermal mismatch, oxidation and applied pre-stress, among which the first and the second parts are negative and positive, respectively. Therefore, the central part of the specimen might have been subjected to a relatively larger tensile stress, accounting for the relatively longer microcracks. On the other hand, for the specimen tested in the Ar atmosphere, the second part vanished due to a lack of oxidation, thus making the tensile stress relatively smaller and accounting for the relatively shorter microcracks. Additionally, the sites where graphite flakes were pulled out may have acted as the sources and propagation paths of microcracks, as shown in Figure 12A. Combined with the analysis for pits, there was a larger possibility for microcracks to initiate in the specimens that were tested in Ar, while there was a higher possibility for microcracks to propagate in the specimens that were tested in air due to a relatively larger tensile stress.

3.2. Residual Flexural Properties

The residual flexural strengths (σf) of ZSG0–Ar, ZSG10–Ar, ZSG20–Ar, and ZSG30–Ar were 401.5, 374.9, 393.1, and 369.8 MPa, respectively, all of which were significantly lower than the flexural strength of the specimen that was created with the fabricated composite, 489.4 MPa, as shown in Figure 13. In the tests in the Ar atmosphere, the oxidation of the specimen was insignificant and could be ignored. It could be seen that, in general, σf decreased with the increase of σ0. As can be seen, the microcracks in the specimens were much smaller without applying σ0, with the longest microcrack being 132.3 µm (Figure 12A). With the increase of σ0, the accumulated damage (in the form of the length of microcracks) increased, which, in turn, decreased the σf of the specimens. The graphite flakes only existed in this environment, and the pull-out sites could also have been the origin of the microcracks’ initiation, as mentioned in Section 3.1.
The σf values of ZSG0 and ZSG10 were 428.4 and 456.3 MPa, respectively, both of which were a little higher than those of the specimens that were tested in the Ar atmosphere due to oxidation, i.e., the healing effect of the low viscosity borosilicate glass layer that formed on the surface of the specimen [49], and the compressive stress in the oxide layer that resulted from volume expansion [38,39,50]. In this range of applied σ0, the healing effect played a dominant role, while the effect of σ0 was not obvious. Though ZSG10 had the largest σf among all the specimens that were tested, it was still lower than that of the specimen that did not suffer any thermal shock. The number and length of the microcracks that were generated under this condition were kept at a low level (Figure 11B), which proves that, at a low σ0, the healing effects created due to the oxidation reaction of ZrB2 and SiC could bring in effective protection and improve thermal shock resistance. With the increase of σ0, the effect of pre-stress became apparent, as σf decreased quickly. The σf of ZSG20 was very close to that of ZSG20–Ar, and the length of the microcracks on the fracture surface of the specimens that were tested in these two environmental conditions were also very similar, as shown in Figure 11C and Figure 12C. The σf of ZSG30 decreased to 362.4 MPa, which was even lower than that of ZSG30–Ar; this was consistent with the occurrence of the largest cracks (Figure 11D). Under this condition, oxidation could no longer yield a healing effect, accounting for the reduction of σf. The accumulated damage in each cycle of thermal shock should have been the result of coupled oxidation and thermal shock, which should have been larger than the accumulated damage that was caused by pure thermal shock. Under a larger σ0, the healing effects due to the compressive stress was overwhelmed by the large tensile stress, so new defects were consequently be generated, either in the oxide region or at the interface between the oxide layer and the substrate [51], as shown in the red ellipses in Figure 7c,d. With the chemical effect, it was be easier for the microcracks to propagate, grow, and coalescence under a larger σ0, as shown in Figure 11.
The variations of σf against σ0 of the specimens that were tested in the two atmospheres can be fitted with the following simple linear relationship:
y = a x + b
in which x is the applied pre-stress and a and b are the fitting parameters. a = −2.61 and b = 449.29 MPa for the red fitting line in Figure 13, corresponding to the specimens that were tested in air; a = −0.77 and b = 396.33 MPa for the black fitting line in Figure 13, corresponding to the specimens that were tested in Ar. In the range of the σ0 used, the black fitting line shows that σf decreased with the increase of σ0, which was also demonstrated by the length of microcracks under different σ0 values. It was also considered that the accumulated damage (microcracks) in each cycle increased with the increase of σ0. The fitting line corresponding to the tests in air lies above that corresponding to the tests in Ar, and the slope of the fitting line that approximates the tests in air is greater than the slope corresponding to the specimens that were tested in Ar. This indicates that in the range of the testing conditions, the healing effect that was induced by oxidation may have helped to improve thermal shock resistance, but such an improvement would have been reduced with the increase of the applied pre-stress. This effect can be attributed to the larger damage that was developed in each cycle of thermal shock under a larger σ0. The two fitting lines intersect at σ0 30 MPa, indicating that the σf of the specimens that were tested in air became inferior to that tested in Ar as σ0 ≥ 30 MPa.
The variations of σf against σ0 that was subjected to different thermal shock cycles are shown in Figure 14, including the result of the present work and our previous work [44]. This shows that the σf of all the tested specimens was lower than the σf of the specimen that did not undergo a thermal shock test. This is a different result from the previous work by Meng et al. [38,39], which might be ascribed to the different constituents of the used composite and the higher target temperature (2000 °C) in present study. The σf of the specimen that was subjected to repeated thermal shocks without pre-stress did not show a distinct tendency, as it was mainly affected by oxidation time or the thickness of oxide layer, and it also did not show distinct differences between the present and previous tests. However, once σ0 is applied, σf should, in general, decrease with the increase of σ0, i.e., the larger the σ0, the lower the σf.

4. Conclusions

We have presented a comprehensive investigation of the effects of pre-stress (σ0) and testing environment (in air and Ar atmospheres) on the residual flexural strength (σf) of a ZrB2–SiC–graphite composite that was subjected to repeated thermal shock.
The fractographs and backscattered electron images show that there were more pits in the specimens that were tested in Ar than that in the specimens that were tested in air, which could be ascribed to the protective glassy layer on the surfaces of the specimens that were tested in air. The average length of microcracks in the specimens that were tested in air were longer than those that were tested in Ar, which could be ascribed to the coupled effect of oxidation and thermal shock.
The fitting lines of the variations of σf against σ0 of the specimens that were tested in air and those that were tested in Ar had similar descending trends, but the former was above the latter and the descent slope of the former was larger than that of the latter. This can be attributed to the healing effect of the oxidation layer, but such effect would have been degraded with the increase of σ0, when damage accumulated in each cycle that was caused by coupled oxidation and thermal shock became larger than that caused by pure thermal shock.
The variations of σf against thermal shock cycles did not show a distinct tendency in the case of σ0 = 0 MPa, but they did show decent trends once σ0 was applied. In general, σf decreased with the increase of σ0, i.e., the larger the σ0, the lower the σf. The σf of all the specimens that were subjected to repeated thermal shock testing was smaller than that of the specimens that were made of the as fabricated composite (489.4 MPa).

Author Contributions

Conceptualization, X.Y. and X.C. (Xiaosheng Chen); formal analysis, X.Y.; funding acquisition, X.P. and T.F.; investigation, X.Y. and T.F.; methodology, Z.W. and X.C. (Xiaosheng Chen); resources, X.Y.; validation, X.C. (Xiang Chen); visualization, Z.W. and X.Y.; writing—original draft, X.Y.; writing—review and editing, X.P. and T.F. All authors have read and agreed to the published version of the manuscript.

Funding

This research was funded by the National Natural Science Foundation of China (grant nos. 11932004, 11802045 and 11802047), the Natural Science Foundation of Chongqing (cstc2019jcyj-bshX0029), the Postdoctoral Program for Innovative Talents of Chongqing (grant no. CQBX201804), and the China Postdoctoral Science Foundation funded project (grant nos. 2018M631058 and 2019T120814).

Conflicts of Interest

The authors declare no conflict of interest.

References

  1. Opeka, M.M.; Talmy, I.G.; Wuchina, E.J.; Zaykoski, J.A.; Causey, S.J. Mechanical, Thermal, and Oxidation Properties of Refractory Hafnium and Zirconium Compounds. J. Eur. Ceram. Soc. 1999, 19, 2405–2414. [Google Scholar] [CrossRef] [Green Version]
  2. Fahrenholtz, W.G.; Hilmas, G.E.; Talmy, I.G.; Zaykoski, J.A. Refractory Diborides of Zirconium and Hafnium. J. Am. Ceram. Soc. 2007, 90, 1347–1364. [Google Scholar] [CrossRef]
  3. Monteverde, F.; Cecere, A.; Savino, R. Thermo-Chemical Surface Instabilities of SiC-ZrB2 Ceramics in High Enthalpy Dissociated Supersonic Airflows. J. Eur. Ceram. Soc. 2017, 37, 2325–2341. [Google Scholar] [CrossRef]
  4. Guérineau, V.; Julian-Jankowiak, A. Oxidation Mechanisms under Water Vapour Conditions of ZrB2-SiC and HfB2-SiC Based Materials up to 2400 °C. J. Eur. Ceram. Soc. 2018, 38, 421–432. [Google Scholar] [CrossRef]
  5. Wang, H.; Chen, J.; Yu, P.; Shen, S. Temperature-Dependent Fracture Strength and the Effect of Oxidation for ZrB2-SiC Ceramics. J. Eur. Ceram. Soc. 2018, 38, 1112–1117. [Google Scholar] [CrossRef]
  6. He, J.; Wang, Y.; Luo, L.; An, L. Oxidation Behaviour of ZrB2–SiC (Al/Y) Ceramics at 1700 °C. J. Eur. Ceram. Soc. 2016, 36, 3769–3774. [Google Scholar] [CrossRef]
  7. Cheng, Y.; Hu, Y.; Han, W.; Zhang, X.; Zhang, Y.; Zhang, H. Microstructure, Mechanical Behavior and Oxidation Resistance of Disorderly Assembled ZrB2-Based Short Fibrous Monolithic Ceramics. J. Eur. Ceram. Soc. 2019, 39, 2794–2804. [Google Scholar] [CrossRef]
  8. Zhang, Z.; Nan, C.; Xu, J.; Gao, Z.; Li, M.; Wang, J. Oxidation Behaviors of C–ZrB2–SiC Composite at 2100 °C in Air and O2. J. Mater. Sci. Technol. 2014, 30, 1223–1229. [Google Scholar] [CrossRef]
  9. Zou, J.; Zhang, G.-J.; Vleugels, J.; Van der Biest, O. High Temperature Strength of Hot Pressed ZrB2–20 vol% SiC Ceramics Based on ZrB2 Starting Powders Prepared by Different Carbo/Boro-Thermal Reduction Routes. J. Eur. Ceram. Soc. 2013, 33, 1609–1614. [Google Scholar] [CrossRef]
  10. Zou, J.; Rubio, V.; Binner, J. Thermoablative Resistance of ZrB2-SiC-WC Ceramics at 2400 °C. Acta Mater. 2017, 133, 293–302. [Google Scholar] [CrossRef] [Green Version]
  11. Wuchina, E.; Opila, E.; Opeka, M.; Fahrenholtz, W.G.; Talmy, I.G. UHTCs Ultra-High Temperature Ceramic Materials for Extreme Environment Applications. Electrochem. Soc. Interface 2007, 16, 30–36. [Google Scholar]
  12. Fahrenholtz, W.G.; Hilmas, G.E. Ultra-High Temperature Ceramics: Materials for Extreme Environments. Scr. Mater. 2017, 129, 94–99. [Google Scholar] [CrossRef] [Green Version]
  13. Savino, R.; Criscuolo, L.; Di Martino, G.D.; Mungiguerra, S. Aero-Thermo-Chemical Characterization of Ultra-High-Temperature Ceramics for Aerospace Applications. J. Eur. Ceram. Soc. 2018, 38, 2937–2953. [Google Scholar] [CrossRef] [Green Version]
  14. Meng, S.; Liu, G.; Sun, S. Prediction of Crack Depth during Quenching Test for an Ultra High Temperature Ceramic. Mater. Des. 2010, 31, 556–559. [Google Scholar] [CrossRef]
  15. Shao, Y.; Song, F.; Liu, B.; Li, W.; Li, L.; Jiang, C. Observation of Ceramic Cracking during Quenching. J. Am. Ceram. Soc. 2017, 100, 520–523. [Google Scholar] [CrossRef] [Green Version]
  16. Jin, X.; Dong, L.; Xu, H.; Liu, L.; Li, N.; Zhang, X.; Han, J. Effects of Porosity and Pore Size on Mechanical and Thermal Properties as Well as Thermal Shock Fracture Resistance of Porous ZrB2–SiC Ceramics. Ceram. Int. 2016, 42, 9051–9057. [Google Scholar] [CrossRef]
  17. Chen, L.; Wang, A.; Suo, X.; Hu, P.; Zhang, X.; Zhang, Z. Effect of Surface Heat Transfer Coefficient Gradient on Thermal Shock Failure of Ceramic Materials under Rapid Cooling Condition. Ceram. Int. 2018, 44, 8992–8999. [Google Scholar] [CrossRef]
  18. Jin, X.; Li, P.; Hou, C.; Wang, X.; Fan, X.; Lu, C.; Xiao, G.; Shu, X. Oxidation Behaviors of ZrB2 Based Ultra-High Temperature Ceramics under Compressive Stress. Ceram. Int. 2019, 45, 7278–7285. [Google Scholar] [CrossRef]
  19. Wu, X.; Jiang, C.; Song, F.; Li, J.; Shao, Y.; Xu, X.; Yan, P. Size Effect of Thermal Shock Crack Patterns in Ceramics and Numerical Predictions. J. Eur. Ceram. Soc. 2015, 35, 1263–1271. [Google Scholar] [CrossRef]
  20. Jin, X.; Zhang, X.; Han, J.; Hu, P.; He, R. Thermal Shock Behavior of Porous ZrB2–SiC Ceramics. Mater. Sci. Eng. A 2013, 588, 175–180. [Google Scholar] [CrossRef]
  21. Hu, P.; Wang, Z.; Sun, X. Effect of Surface Oxidation on Thermal Shock Resistance of ZrB2–SiC–G Composite. Int. J. Refract. Met. Hard Mater. 2010, 28, 280–285. [Google Scholar] [CrossRef]
  22. Wang, A.; Hu, P.; Zhang, X.; Zhang, D.; Fang, C. Thermal Shock Behavior of ZrB2-based Sharp Leading Edges Evaluated by a Novel Water Spraying Method. Ceram. Int. 2018, 44, 2376–2382. [Google Scholar] [CrossRef]
  23. Wang, A.; Hu, P.; Fang, C.; Zhang, D.; Zhang, X. Evaluations of Cooling Rate and Initial Temperature on Thermal Shock Behavior of ZrB2-SiC Ceramic. J. Alloy. Compd. 2018, 741, 509–513. [Google Scholar] [CrossRef]
  24. Chen, L.; Zhu, F.; Zhang, Z.; Hu, P.; Wang, A.; Ling, Y.; Liang, W.; Suo, X.; Zhang, X. An Aqueous Polymer Quenching Medium for Instantaneous Thermal Shock Cooling Rate Study of Ceramic Materials. J. Alloys Compd. 2017, 724, 234–239. [Google Scholar] [CrossRef]
  25. Zhou, S.; Wang, Z.; Sun, X.; Han, J. Microstructure, Mechanical Properties and Thermal Shock Resistance of Zirconium Diboride Containing Silicon Carbide Ceramic Toughened by Carbon Black. Mater. Chem. Phys. 2010, 122, 470–473. [Google Scholar] [CrossRef]
  26. Zhang, X.H.; Wang, Z.; Hu, P.; Han, W.B.; Hong, C.Q. Mechanical Properties and Thermal Shock Resistance of ZrB2–SiC Ceramic Toughened with Graphite Flake and SiC Whiskers. Scr. Mater. 2009, 61, 809–812. [Google Scholar] [CrossRef]
  27. Wang, S.; Xu, C.; Ding, Y.; Zhang, X. Thermal Shock Behavior of ZrB2–SiC Composite Ceramics with Added TaSi2. Int. J. Refract. Met. Hard Mater. 2013, 41, 507–516. [Google Scholar] [CrossRef]
  28. Zhang, X.; Wang, Z.; Sun, X.; Han, W.; Hong, C. Effect of Graphite Flake on the Mechanical Properties of Hot Pressed ZrB2–SiC Ceramics. Mater. Lett. 2008, 62, 4360–4362. [Google Scholar] [CrossRef]
  29. Guo, S.; Naito, K.; Kagawa, Y. Mechanical and Physical Behaviors of Short Pitch-Based Carbon Fiber-Reinforced HfB2–SiC Matrix Composites. Ceram. Int. 2013, 39, 1567–1574. [Google Scholar] [CrossRef]
  30. Wenbo, H.; Shanbao, Z.; Jihong, Z. Single-Cycle Thermal Shock Resistance of ZrB2–SiCnp Ceramic Composites. Ceram. Int. 2014, 40, 16665–16669. [Google Scholar] [CrossRef]
  31. Gui, K.; Hu, P.; Hong, W.; Zhang, X.; Dong, S. Microstructure, Mechanical Properties and Thermal Shock Resistance of ZrB2-SiC-Cf Composite with Inhibited Degradation of Carbon Fibers. J. Alloys Compd. 2017, 706, 16–23. [Google Scholar] [CrossRef]
  32. Silvestroni, L.; Sciti, D.; Hilmas, G.E.; Fahrenholtz, W.G.; Watts, J. Effect of a Weak Fiber Interface Coating in ZrB2 Reinforced with Long SiC Fibers. Mater. Des. 2015, 88, 610–618. [Google Scholar] [CrossRef] [Green Version]
  33. Asl, M.S.; Nayebi, B.; Ahmadi, Z.; Zamharir, M.J.; Shokouhimehr, M. Effects of carbon additives on the properties of ZrB2–based composites: A review. Ceram. Int. 2018, 44, 7334–7348. [Google Scholar] [CrossRef]
  34. Weng, S.; Fu, T.; Peng, X.; Chen, X. Anisotropic Phase Transformation in B2 Crystalline CuZr Alloy. Nanoscale Res. Lett. 2019, 14, 283. [Google Scholar] [CrossRef] [PubMed]
  35. Weng, S.; Chen, X.; Yue, X.; Fu, T.; Peng, X. Inapparent Strengthening Effect of Twin Interface in Cu/Pd Multilayered Films with a Large Lattice Mismatch. Nanomaterials 2019, 9, 1778. [Google Scholar] [CrossRef] [PubMed] [Green Version]
  36. Squire, T.H.; Marschall, J. Material property requirements for analysis and design of UHTC components in hypersonic applications. J. Eur. Ceram. Soc. 2010, 30, 2239–2251. [Google Scholar] [CrossRef]
  37. Gangireddy, S.; Halloran, J.W.; Wing, Z.N. Non-contact mechanical property measurements at ultrahigh temperatures. J. Eur. Ceram. Soc. 2010, 30, 2183–2189. [Google Scholar] [CrossRef]
  38. Meng, S.; Qi, F.; Chen, H.; Wang, Z.; Bai, G. The repeated thermal shock behaviors of a ZrB2–SiC composite heated by electric resistance method. Int. J. Refract. Met. Hard Mater. 2011, 29, 44–48. [Google Scholar] [CrossRef]
  39. Qi, F.; Meng, S.; Guo, H. Repeated thermal shock behavior of the ZrB2–SiC–ZrC ultrahigh-temperature ceramic. Mater. Des. 2012, 35, 133–137. [Google Scholar] [CrossRef]
  40. Niu, J.; Meng, S.; Jin, H.; Li, J.; Yi, F.; Zhou, Y. Thermal stability and nanostructure evolution of amorphous SiCN ceramics during laser ablation in an argon atmosphere. J. Eur. Ceram. Soc. 2019, 39, 4535–4544. [Google Scholar] [CrossRef]
  41. Gangireddy, S.; Halloran, J.W.; Wing, Z.N. Flexural creep of zirconium diboride–Silicon carbide up to 2200 °C in minutes with non-Contact electromagnetic testing. J. Eur. Ceram. Soc. 2013, 33, 2901–2908. [Google Scholar] [CrossRef]
  42. Jin, H.; Meng, S.; Yang, Q.; Zhu, Y. Thermal shock resistance of a ZrB2–SiC–graphite composite in low oxygen partial pressure environment. Ceram. Int. 2013, 39, 5591–5596. [Google Scholar] [CrossRef]
  43. Jin, H.; Meng, S.; Zhu, Y.; Zhou, Y. Effect of environment atmosphere on thermal shock resistance of the ZrB2–SiC–graphite composite. Mater. Des. 2013, 50, 509–514. [Google Scholar] [CrossRef]
  44. Chen, X.; Peng, X.; Wei, Z.; Yue, X.; Fu, T. Repeated thermal shock behavior of ZrB2-SiC-graphite composite under prestress. Ceram. Int. 2016, 42, 18012–18018. [Google Scholar] [CrossRef]
  45. Chen, X.; Peng, X.; Wei, Z.; Yue, X.; Fu, T. Effect of tensile stress on thermal fatigue life of ZrB2-SiC-graphite composite. Mater. Des. 2017, 126, 91–97. [Google Scholar] [CrossRef]
  46. Yue, X.; Peng, X.; Wei, Z.; Chen, X.; Fu, T. Effect of heating rate on the strength of ZrB2–SiC composite subjected to cyclic thermal shock. Ceram. Int. 2019, 45, 15400–15405. [Google Scholar] [CrossRef]
  47. Fahrenholtz, W.G. Thermodynamic Analysis of ZrB2-SiC Oxidation: Formation of a SiC-Depleted Region. J. Am. Ceram. Soc. 2007, 90, 143–148. [Google Scholar] [CrossRef]
  48. Zhou, Z.; Peng, X.; Wei, Z.; Zangvil, A. A Thermo-Chemo-Mechanical Model for the Oxidation of Zirconium Diboride. J. Am. Ceram. Soc. 2015, 98, 629–636. [Google Scholar] [CrossRef]
  49. Haibo, O.; Cuiyan, L.; Jianfeng, H.; Liyun, C.; Jie, F.; Jing, L.; Zhanwei, X. Self-healing ZrB2 –SiO2 oxidation resistance coating for SiC coated carbon/carbon composites. Corros. Sci. 2016, 110, 265–272. [Google Scholar] [CrossRef]
  50. Rezaie, A.; Fahrenholtz, W.G.; Hilmas, G.E. Evolution of structure during the oxidation of zirconium diboride–silicon carbide in air up to 1500 °C. J. Eur. Ceram. Soc. 2007, 27, 2495–2501. [Google Scholar] [CrossRef]
  51. Guo, W.; Zhang, G. Oxidation resistance and strength retention of ZrB2–SiC ceramics. J. Eur. Ceram. Soc. 2010, 30, 2387–2395. [Google Scholar] [CrossRef]
Figure 1. Schematic of the coupled thermal–mechanical material testing system.
Materials 13 00370 g001
Figure 2. Oxygen content in sealed chamber during testing in Ar.
Materials 13 00370 g002
Figure 3. Surface macrographs of specimens that were subjected to thermal shock 60 times under different σ0 values (a) in air and (b) Ar.
Materials 13 00370 g003
Figure 4. Energy dispersive spectroscopy (EDS) result of the constituents on the surface of the specimens that were tested in the Ar atmosphere.
Materials 13 00370 g004
Figure 5. Surface images of specimens that were subjected to σ0 = 20 MPa at 2000 °C (a) in air and (b) Ar.
Materials 13 00370 g005
Figure 6. SEM photographs of specimens that were subjected to 60 cycles of thermal shock under σ0 = 20 MPa (a) in air and (b) Ar.
Materials 13 00370 g006
Figure 7. Fractured surface of the specimen that was subjected to 60 cycles of thermal shock in air (a) σ0 = 0 MPa, (b) σ0 = 10 MPa, (c) σ0 = 20 MPa, and (d) σ0 = 30 MPa.
Materials 13 00370 g007
Figure 8. Fractured surface of the specimen that was subjected to 60 cycles of thermal shock in Ar (a) σ0 = 0 MPa, (b) σ0 = 10 MPa, (c) σ0 = 20 MPa, and (d) σ0 = 30 MPa.
Materials 13 00370 g008
Figure 9. Fractographs and corresponding backscattered electron images of the ZrB2–SiC–graphite specimen tested. (A) ZSG0, (B) ZSG10, (C) ZSG20, and (D) ZSG30.
Materials 13 00370 g009
Figure 10. Fractographs and corresponding backscattered electron images of the ZrB2–SiC–graphite specimens that were tested. (A) ZSG0–Ar, (B) ZSG10–Ar, (C) ZSG20–Ar, and (D) ZSG30–Ar.
Materials 13 00370 g010
Figure 11. Microcracks in the fracture surface of the ZrB2–SiC–graphite specimens that were tested in air. (A) ZSG0, (B) ZSG10, (C) ZSG20, and (D) ZSG30.
Materials 13 00370 g011
Figure 12. Microcracks in the fracture surface of the ZrB2–SiC–graphite specimen that was tested in Ar. (A) ZSG0–Ar, (B) ZSG10–Ar, (C) ZSG20–Ar, and (D) ZSG30–Ar.
Materials 13 00370 g012
Figure 13. Residual flexural strengths of the specimens that were subjected to 60 cycles of thermal shock under different pre-stresses that were tested in the air and Ar atmospheres.
Materials 13 00370 g013
Figure 14. Residual flexural strengths of the specimens that were subjected to 0, 10, 30 and 60 cycles of thermal shock in air under different pre-stresses.
Materials 13 00370 g014
Table 1. Conditions for repeated thermal shock tests.
Specimen and Test NamePre-Loaded Stress σ0 (MPa)Gaseous EnvironmentCycles
ZSG00Air60
ZSG1010
ZSG2020
ZSG3030
ZSG0-Ar0Ar
ZSG10-Ar10
ZSG20-Ar20
ZSG30-Ar30

