Behavior of Grouted Sleeve Splice for Steel Profile under Tensile Loadings


Abstract
1. Introduction
2. Experimental Program
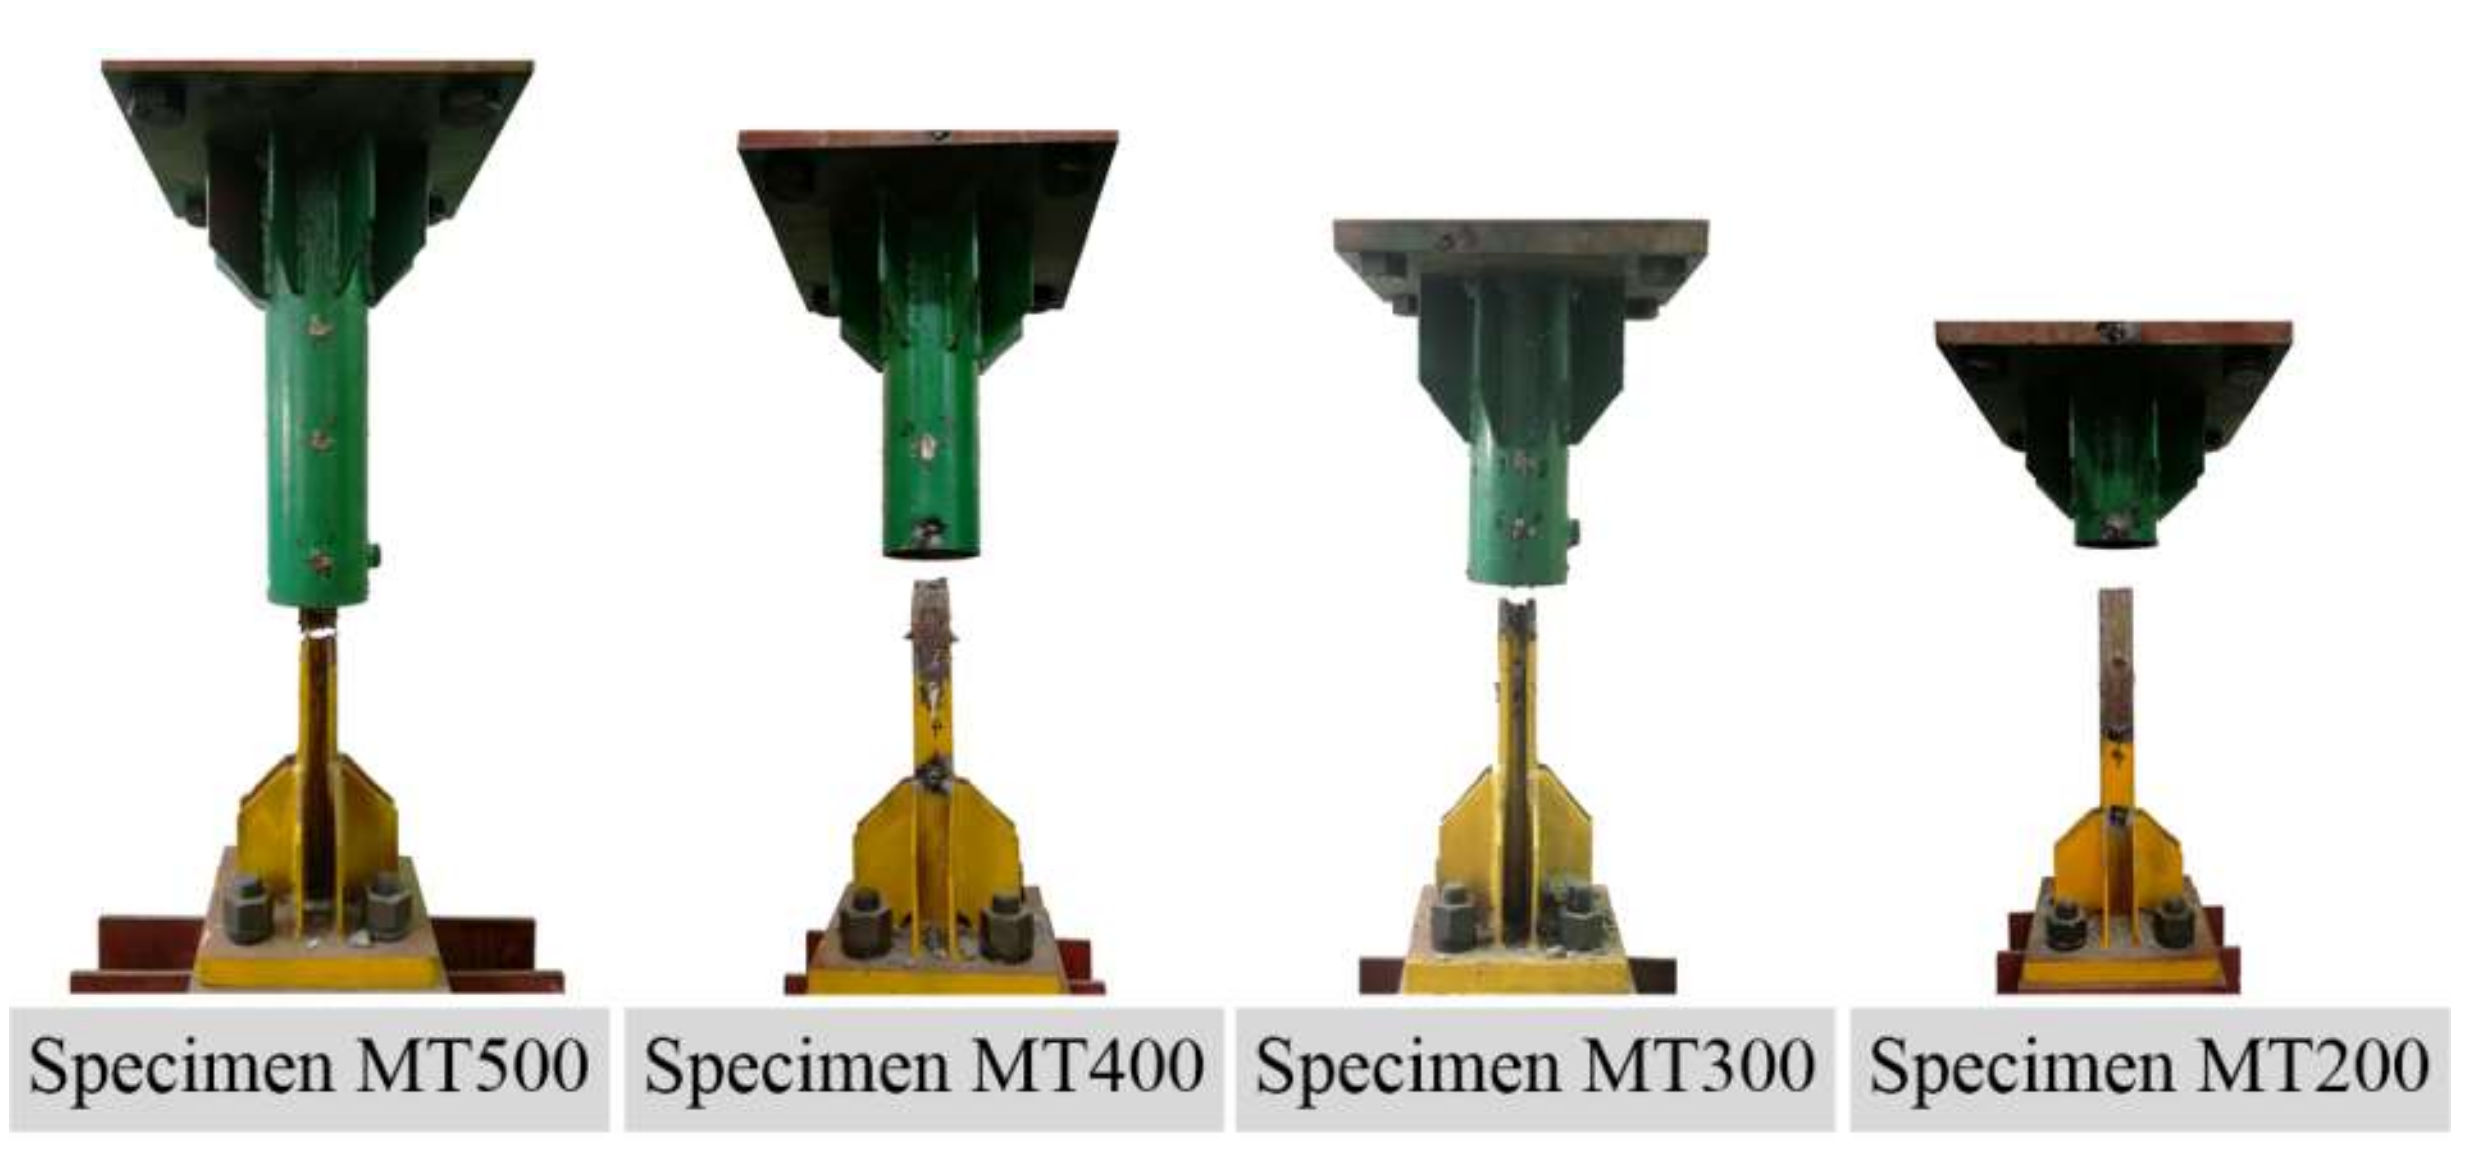
2.1. Specimens
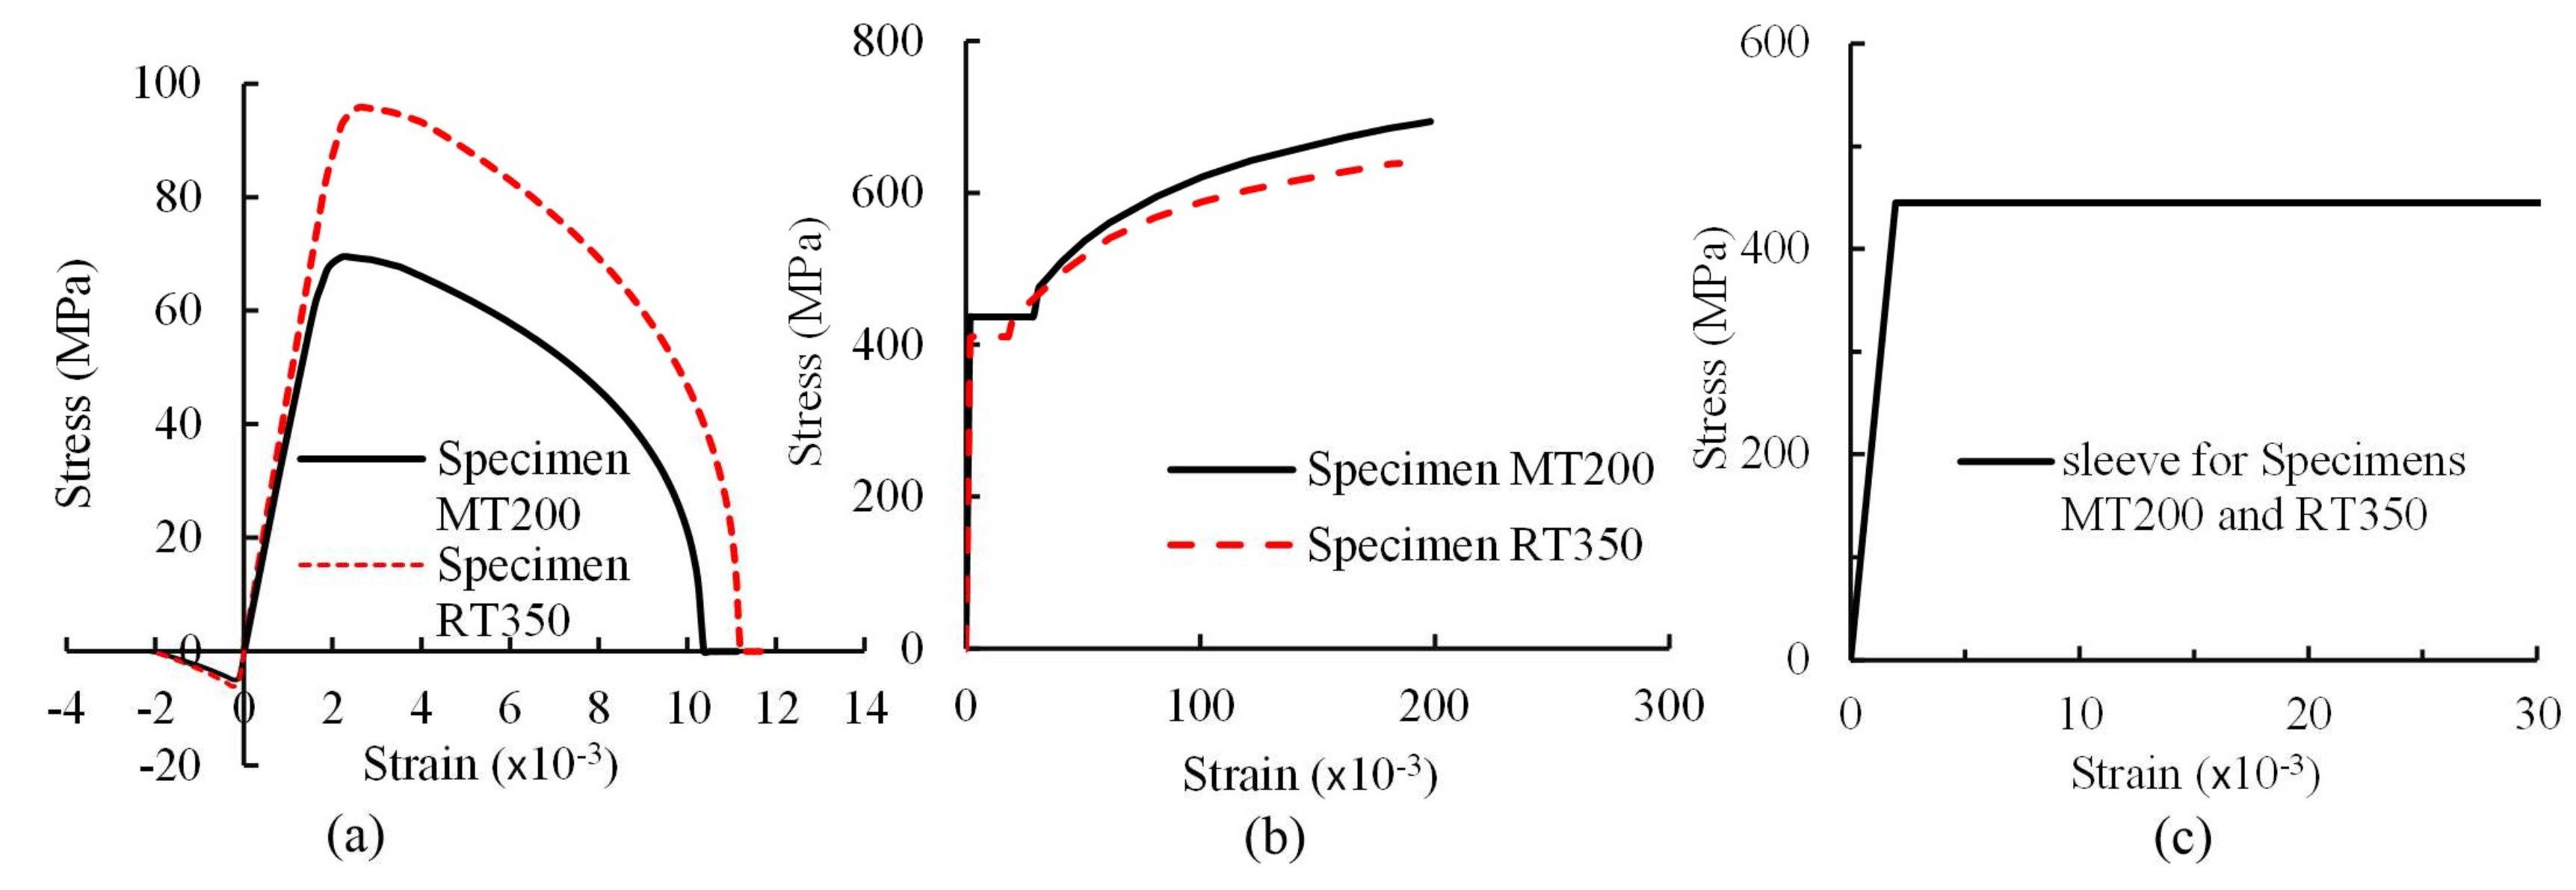
2.2. Materials
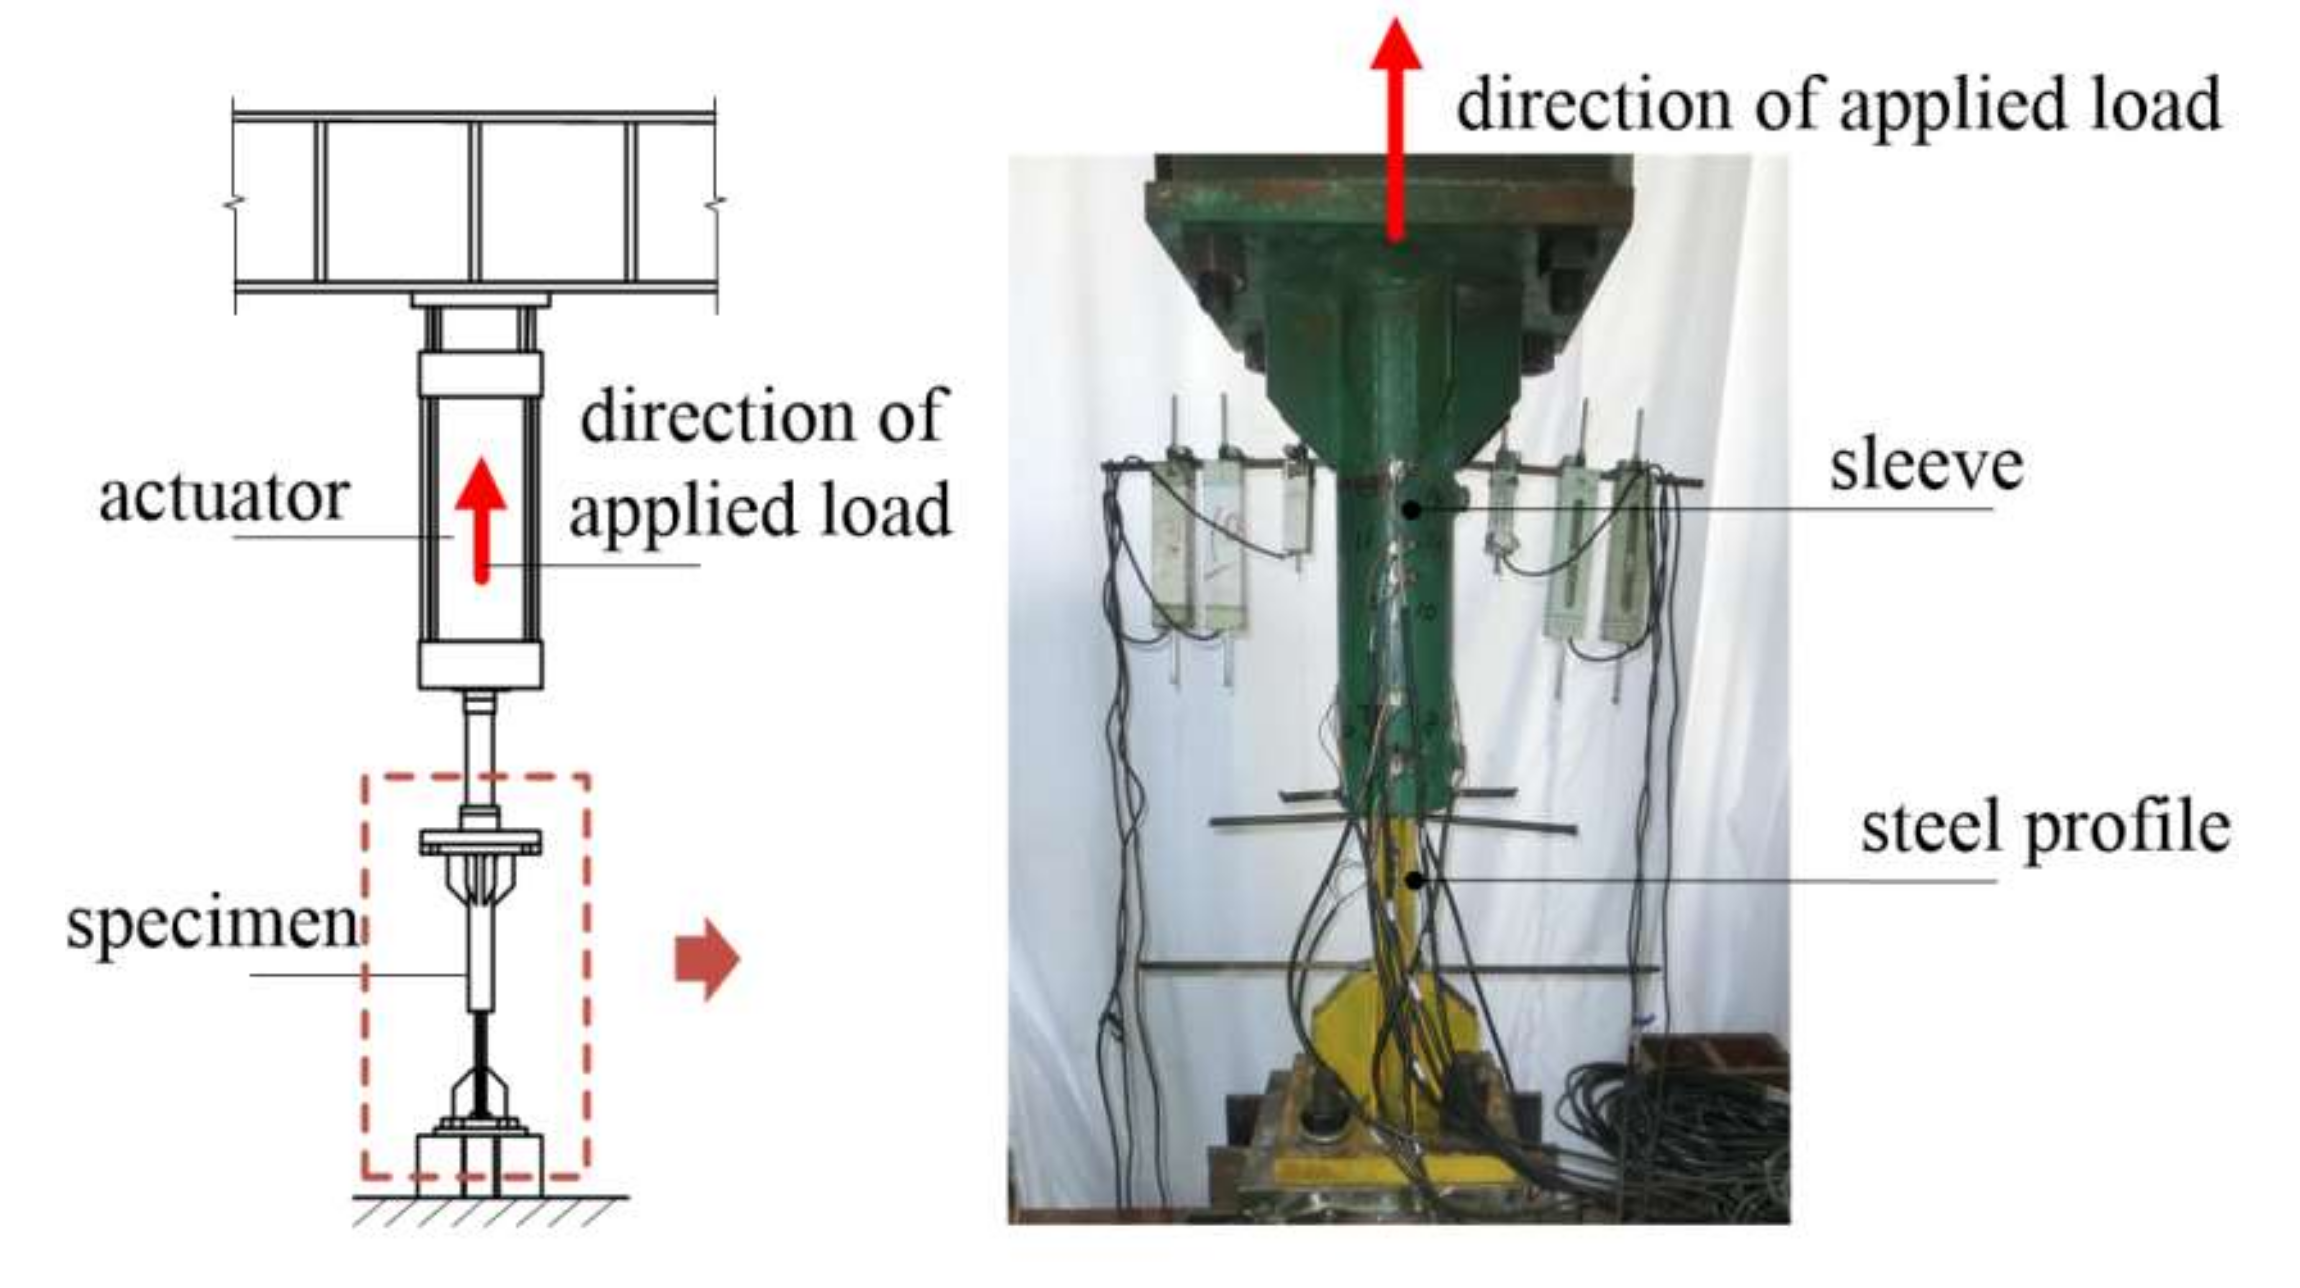
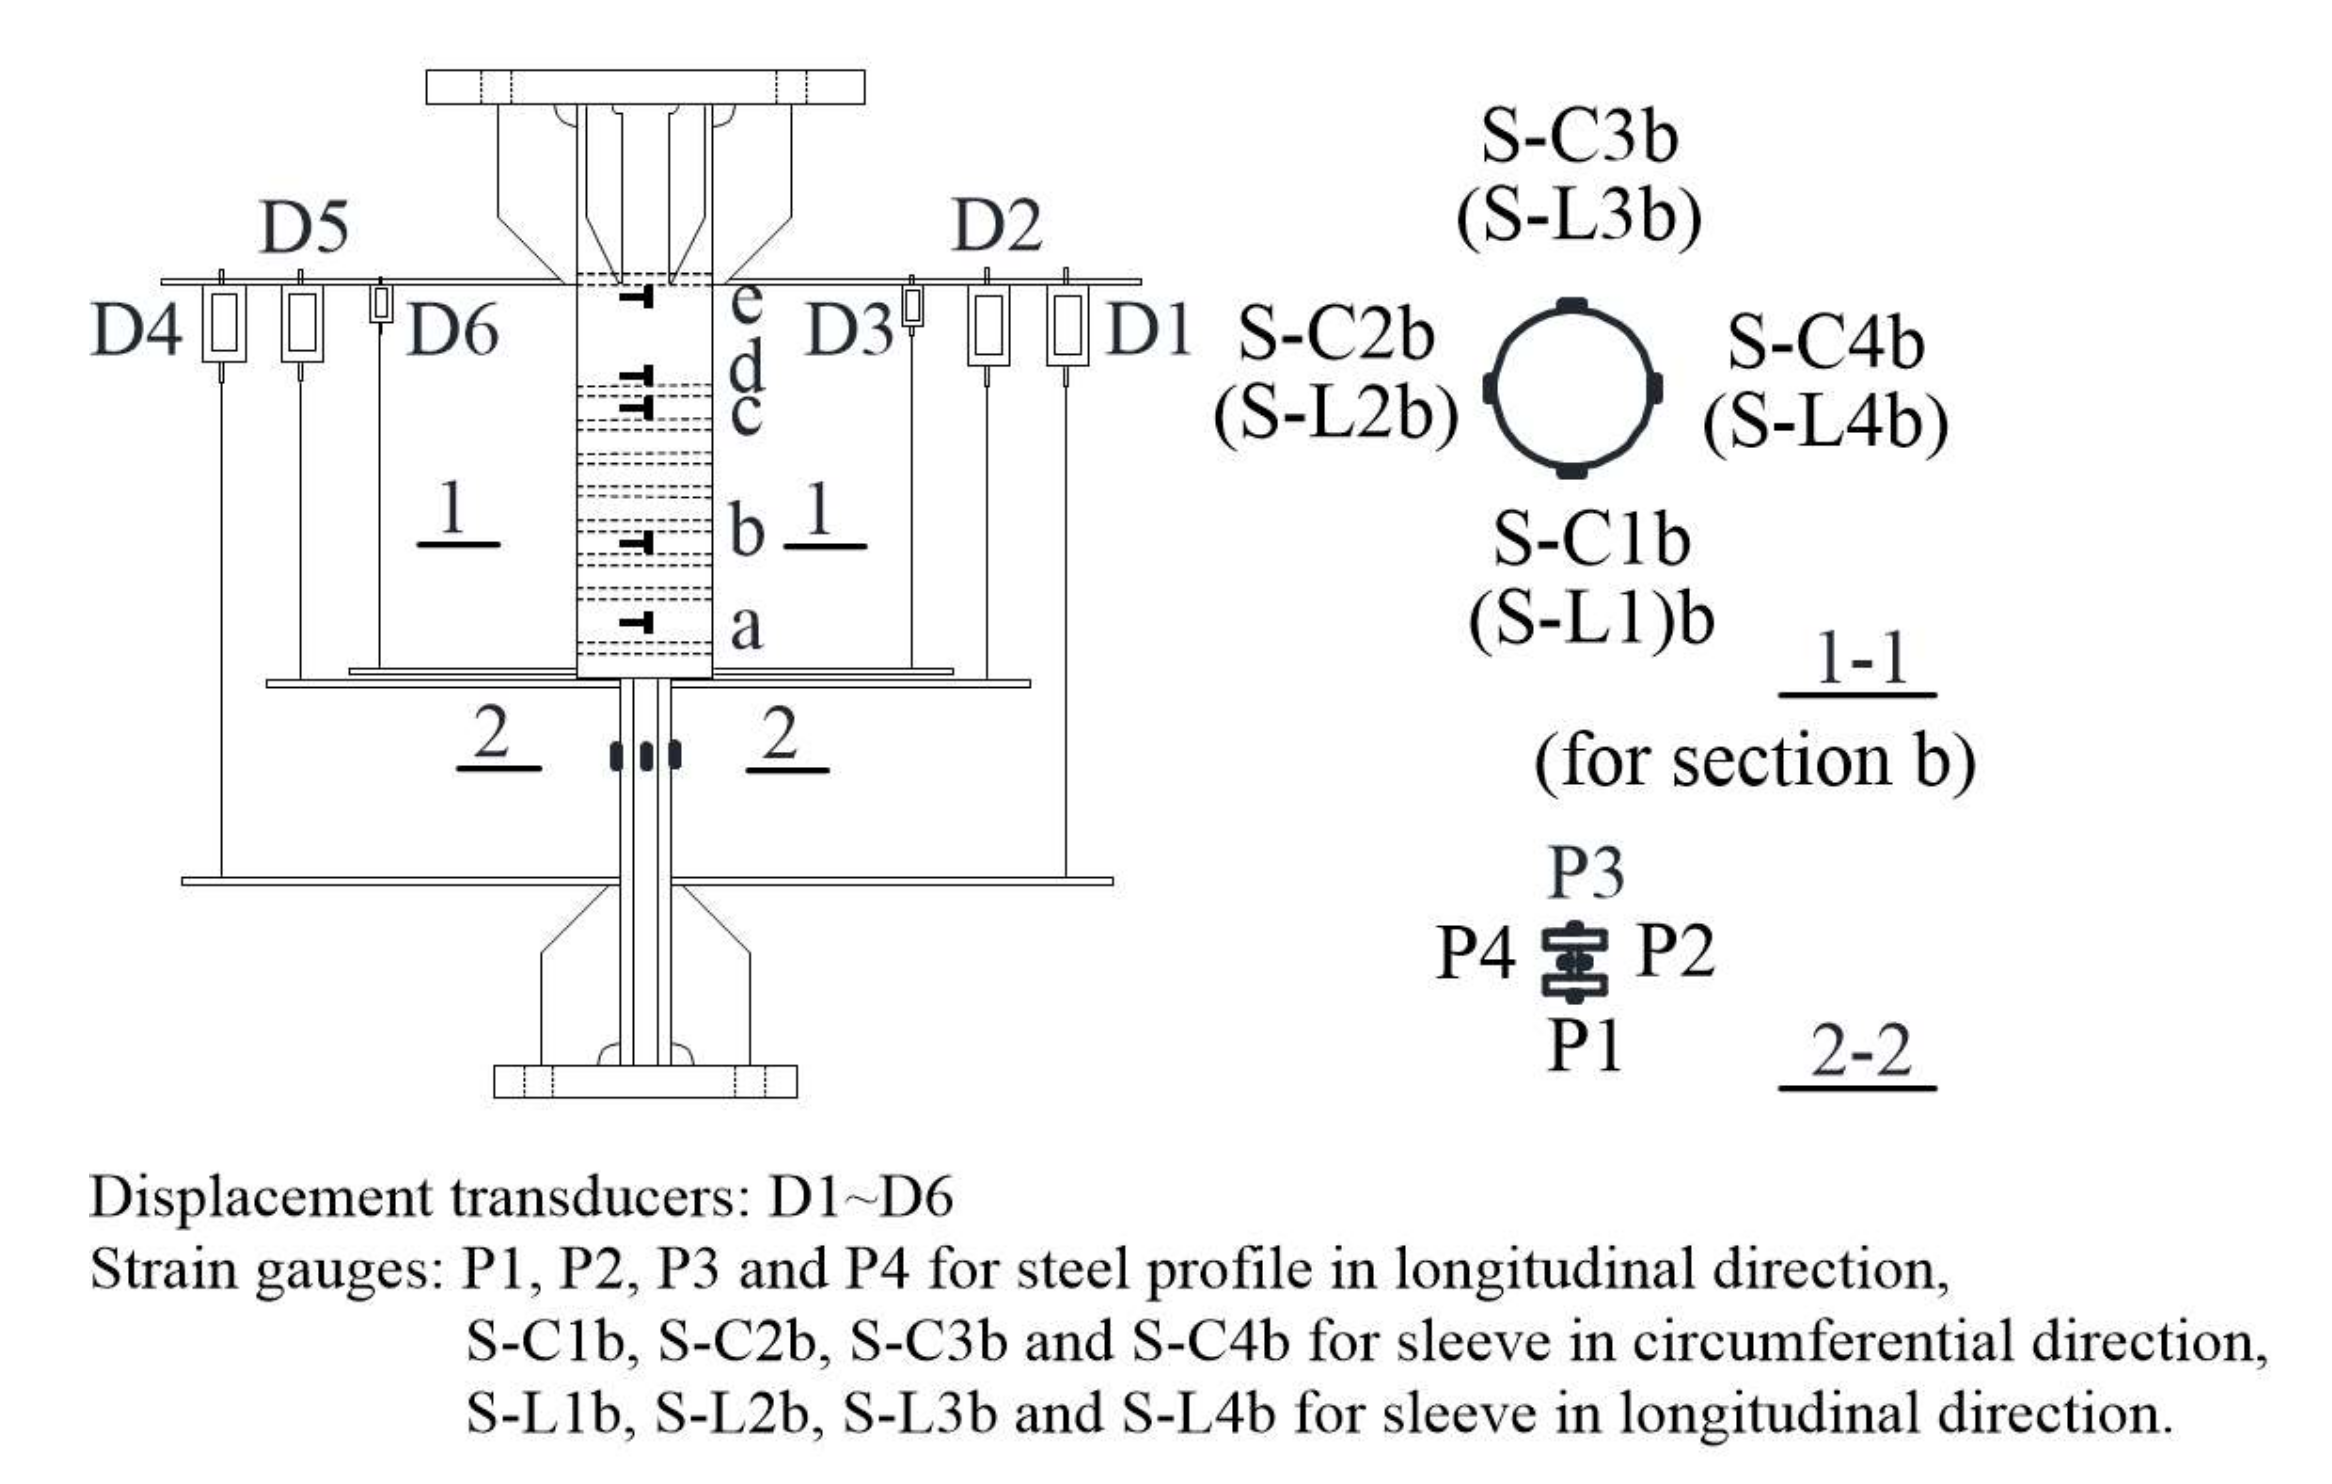
2.3. Test Setup and Instrumentation
3. Test Results
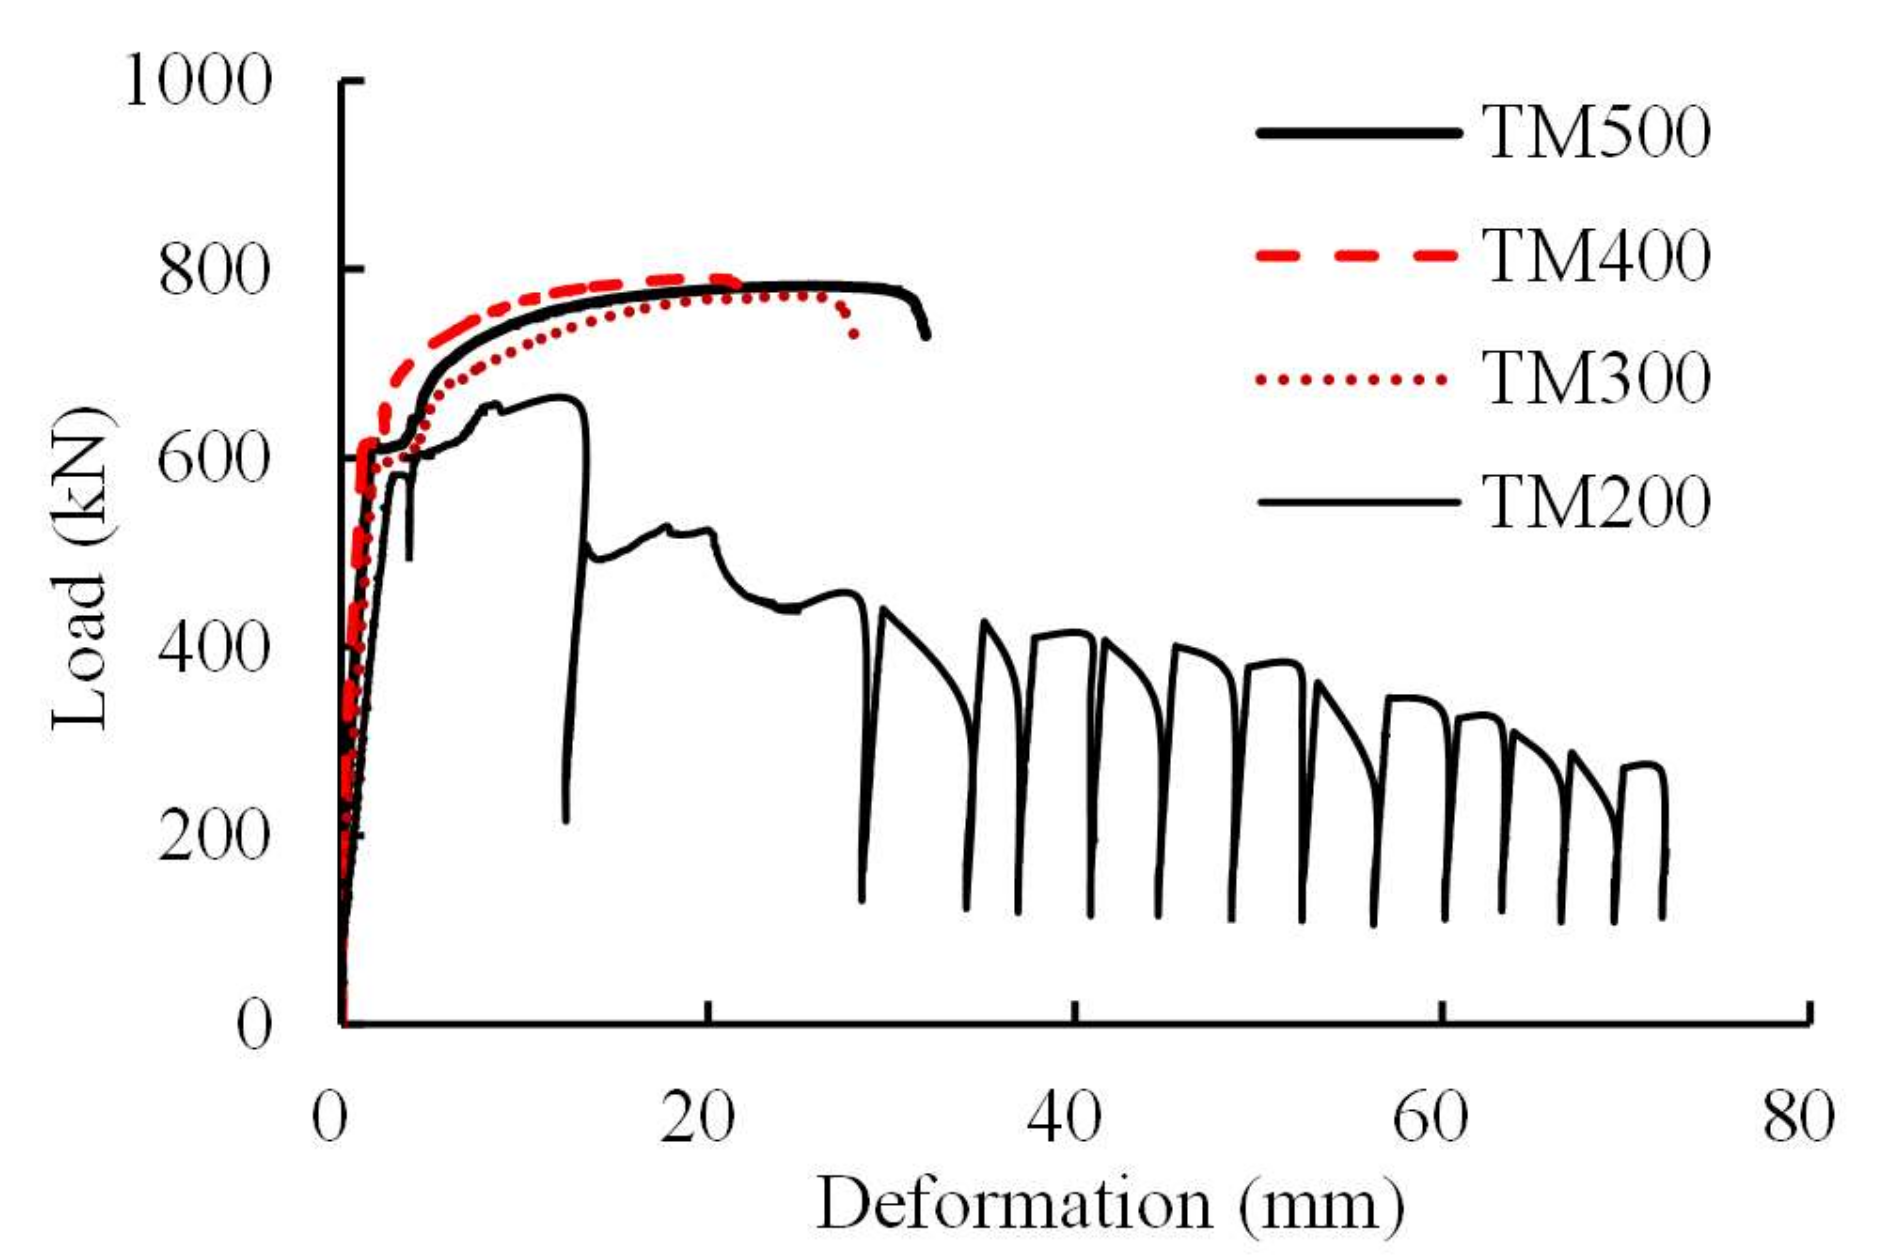
3.1. The First Test Group
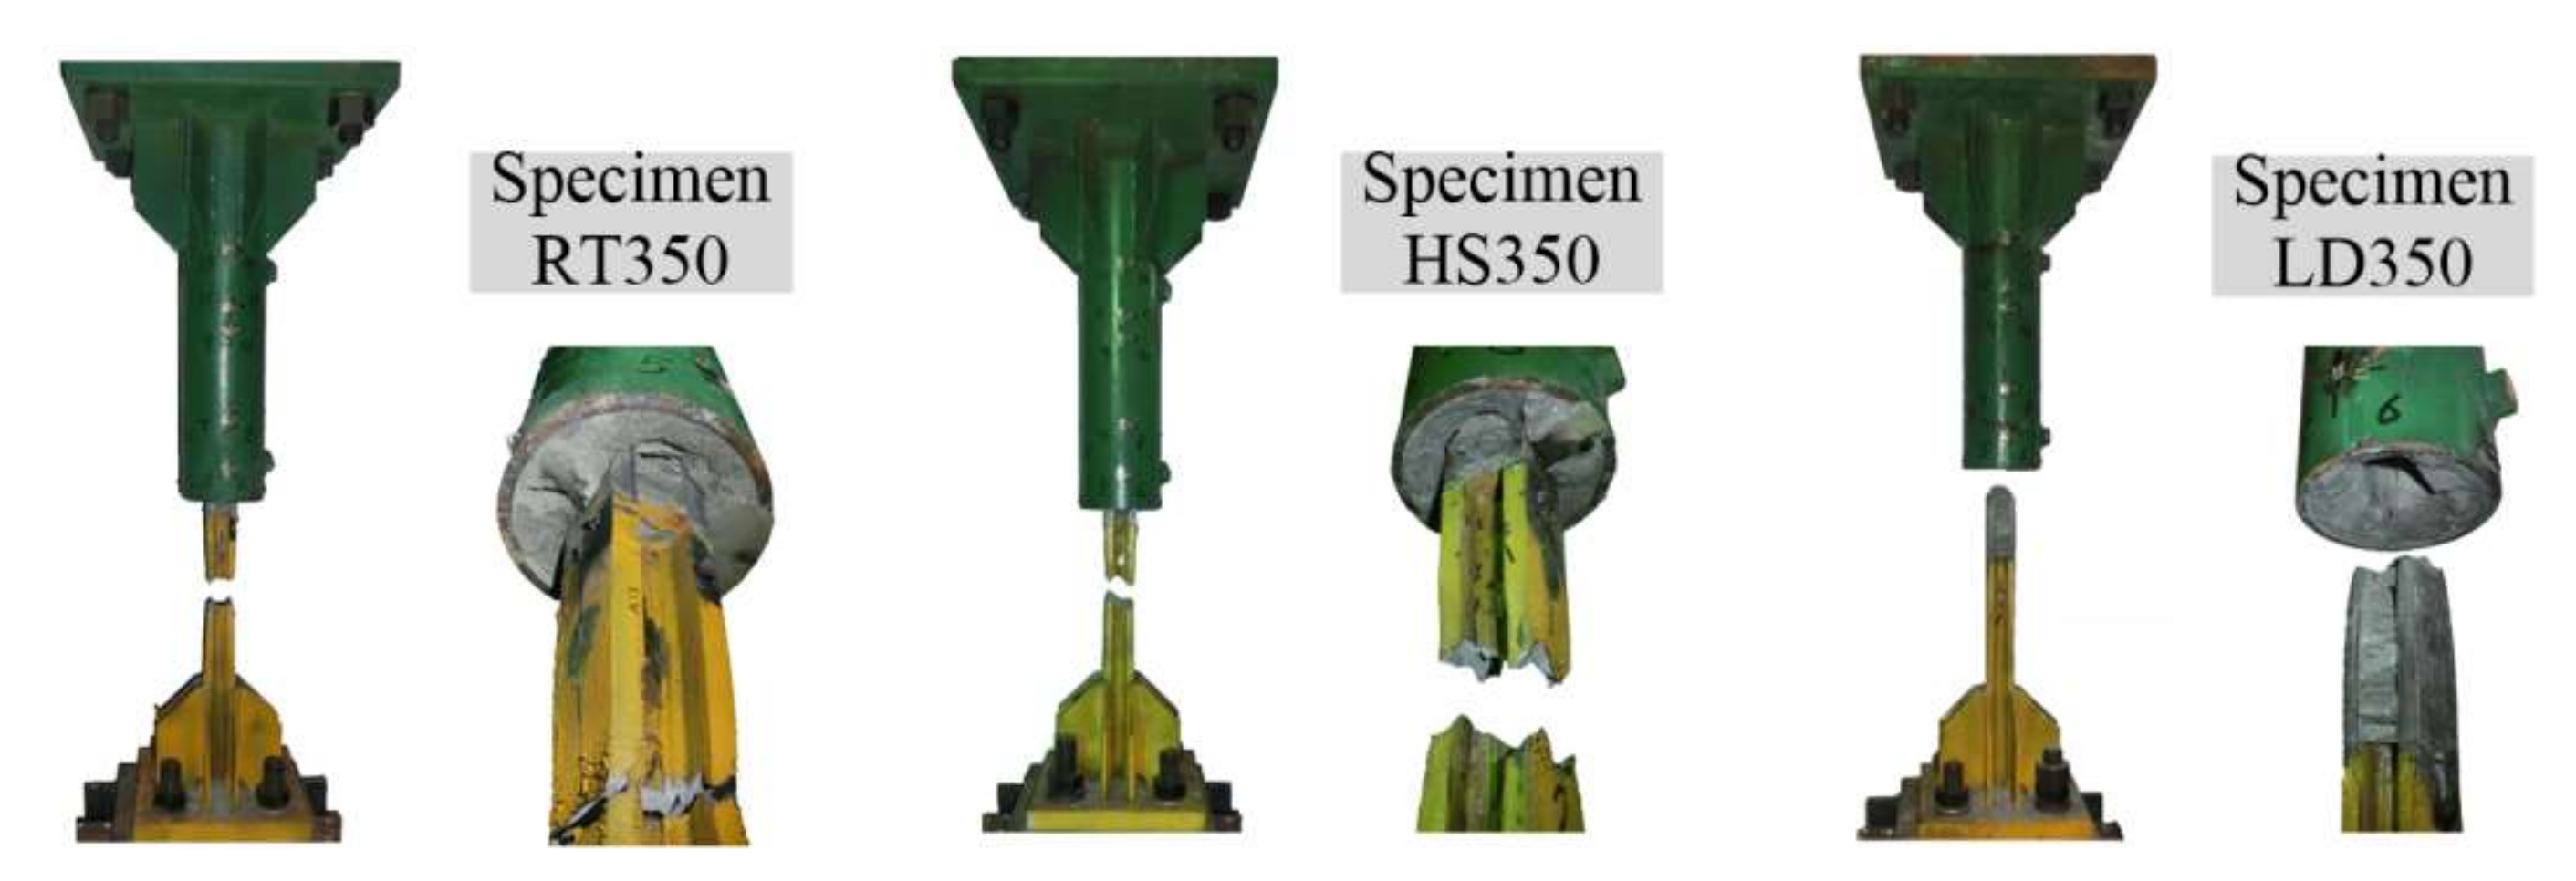
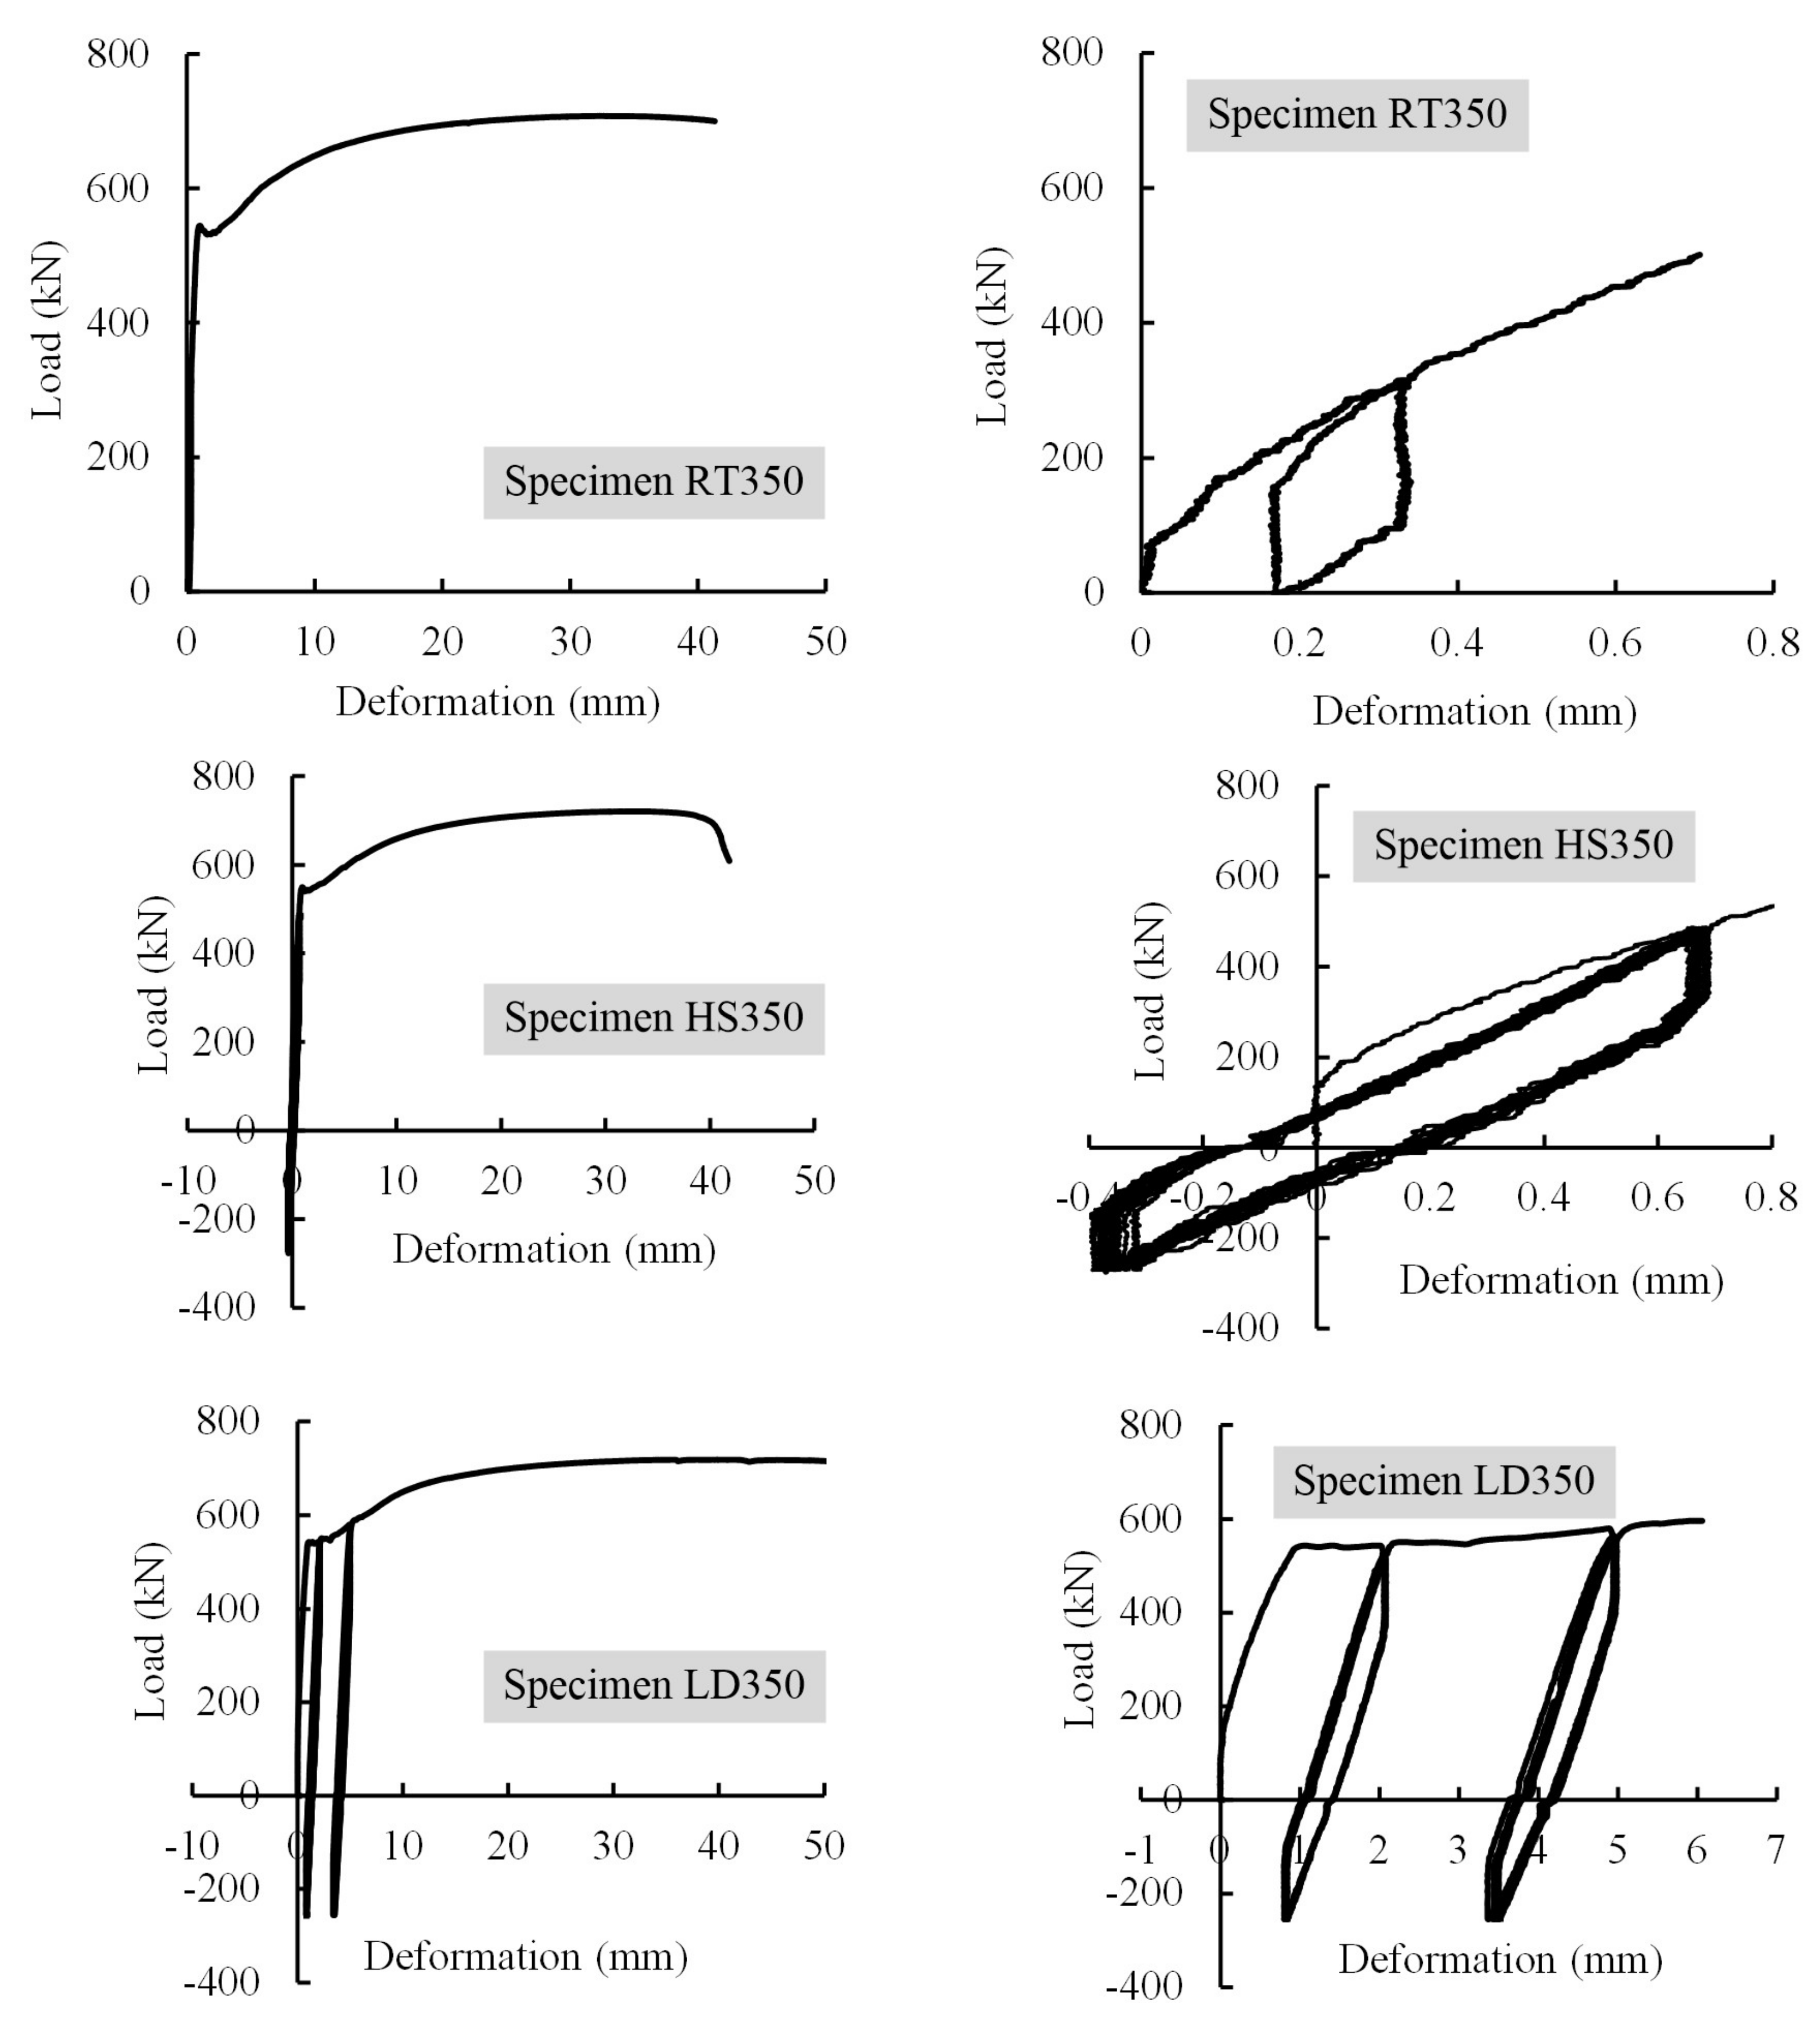
3.2. The Second Test Group
4. Numerical Studies
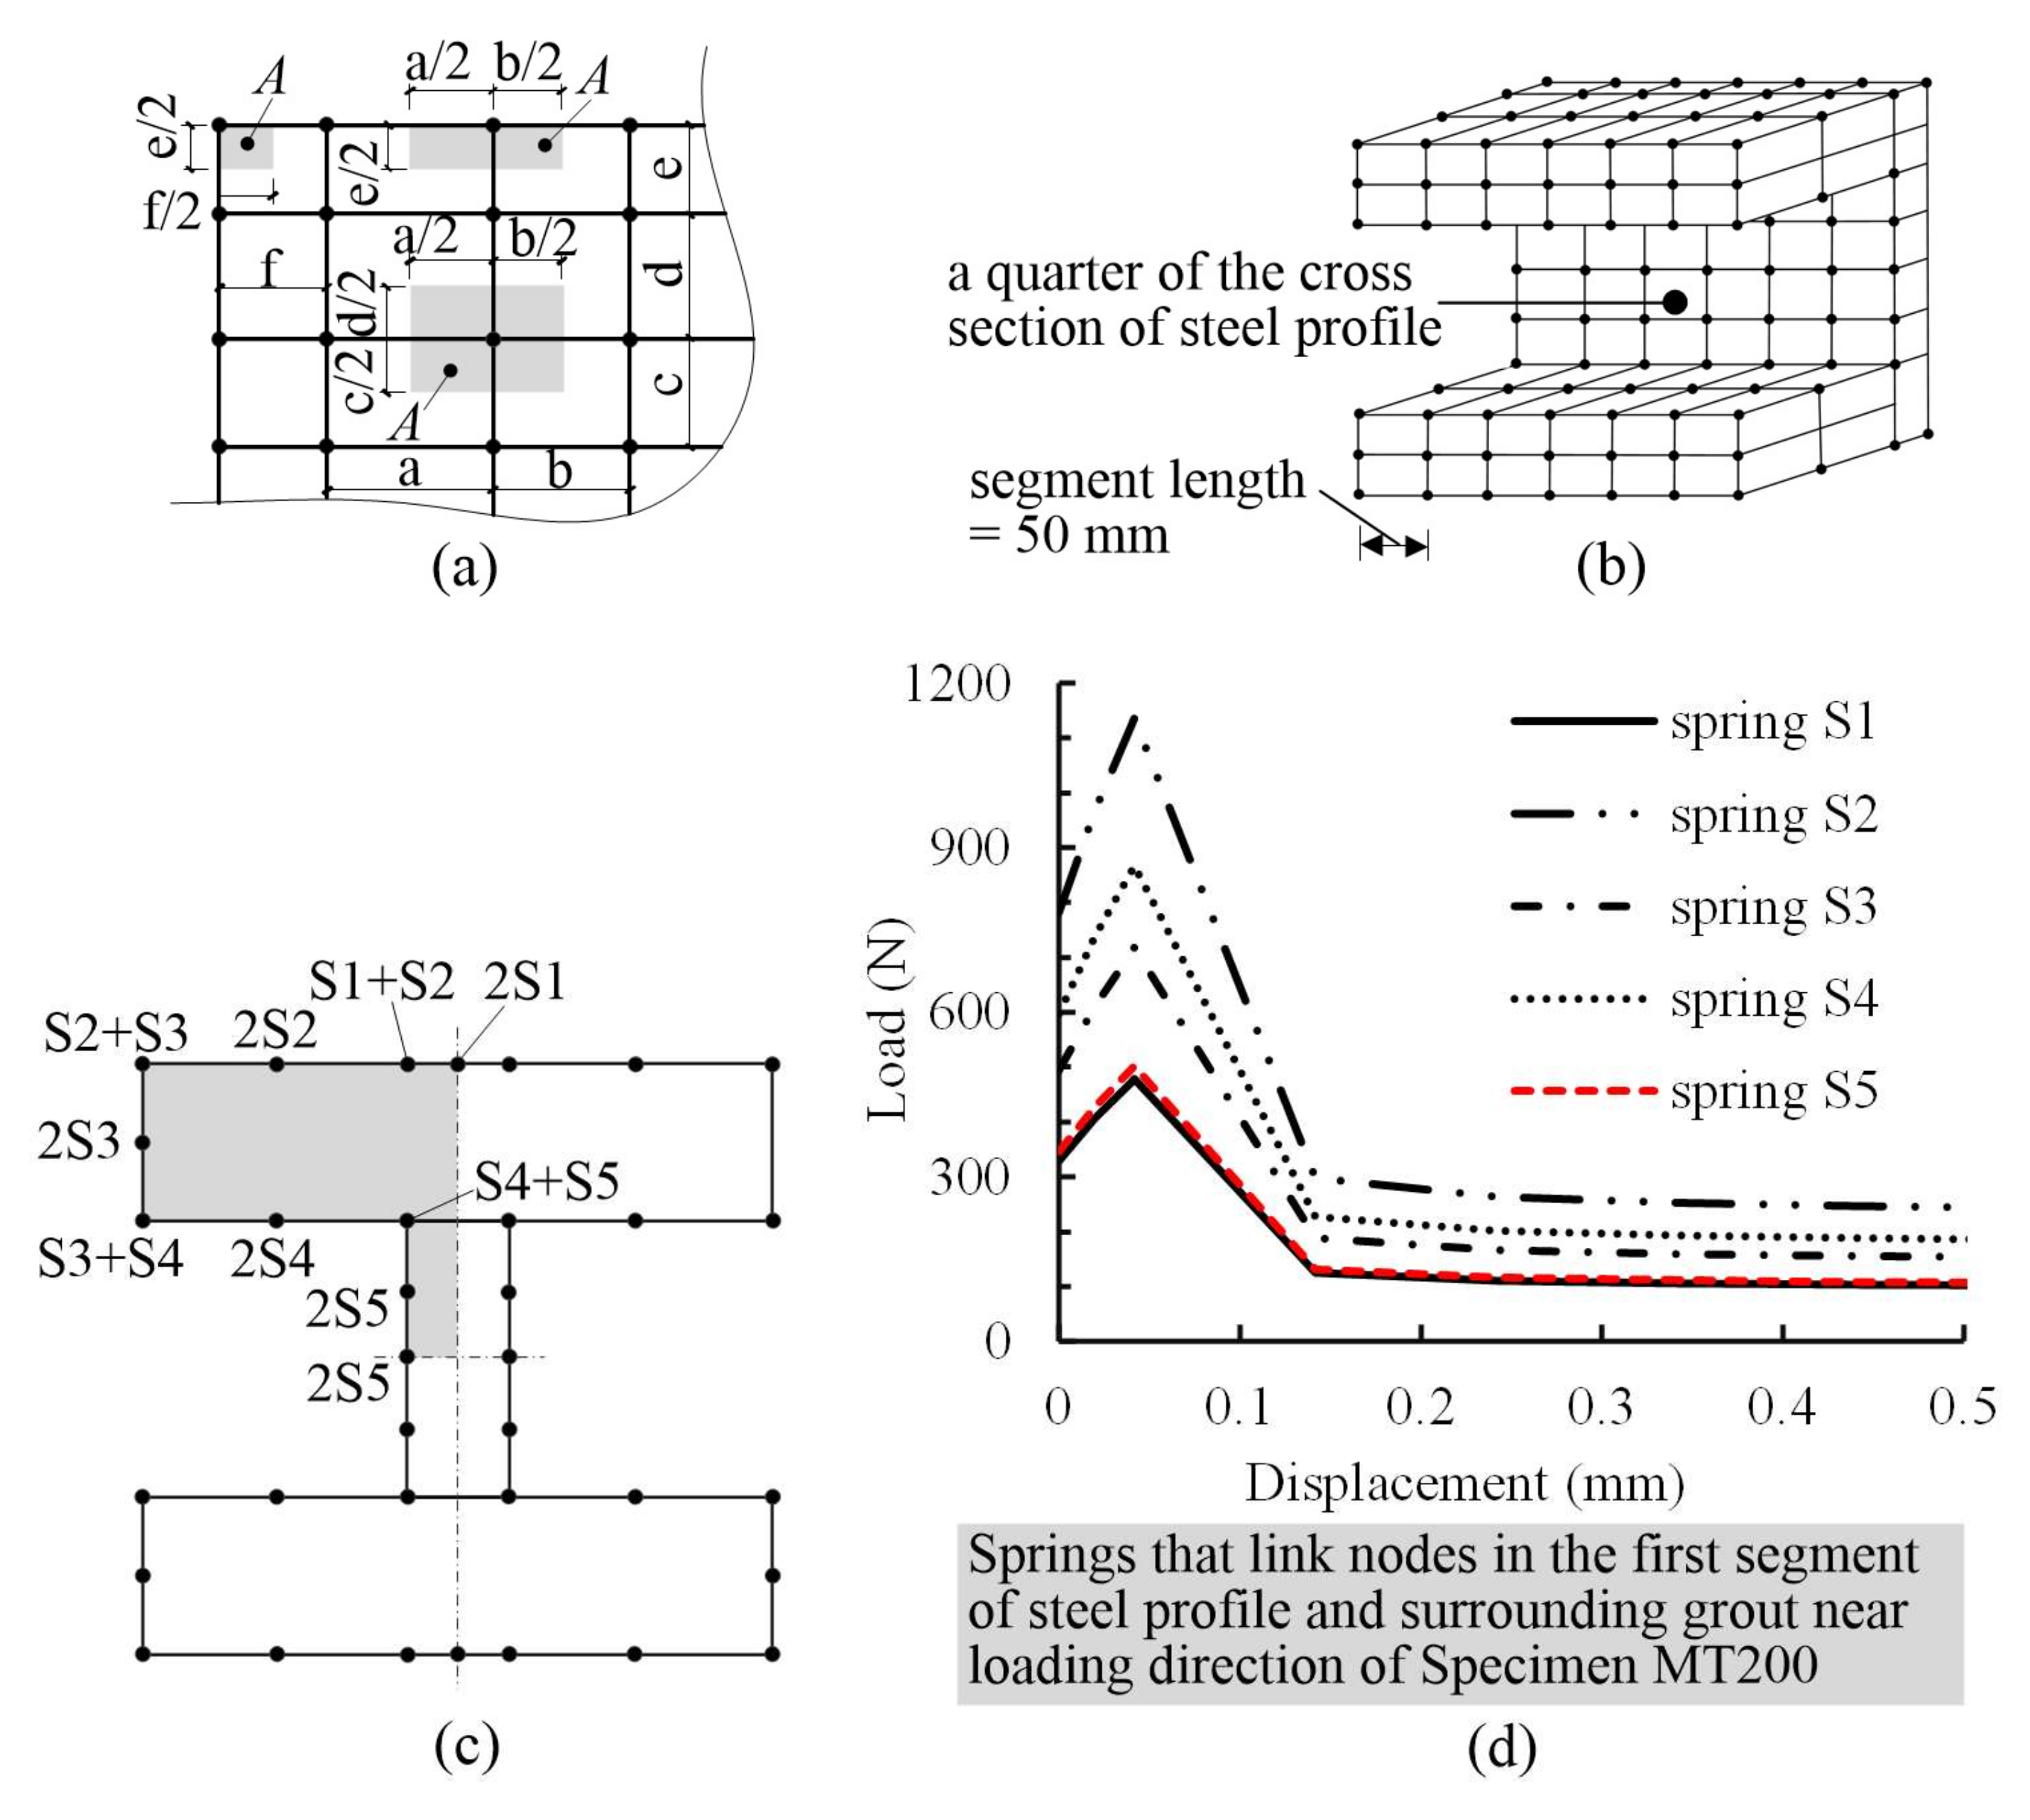
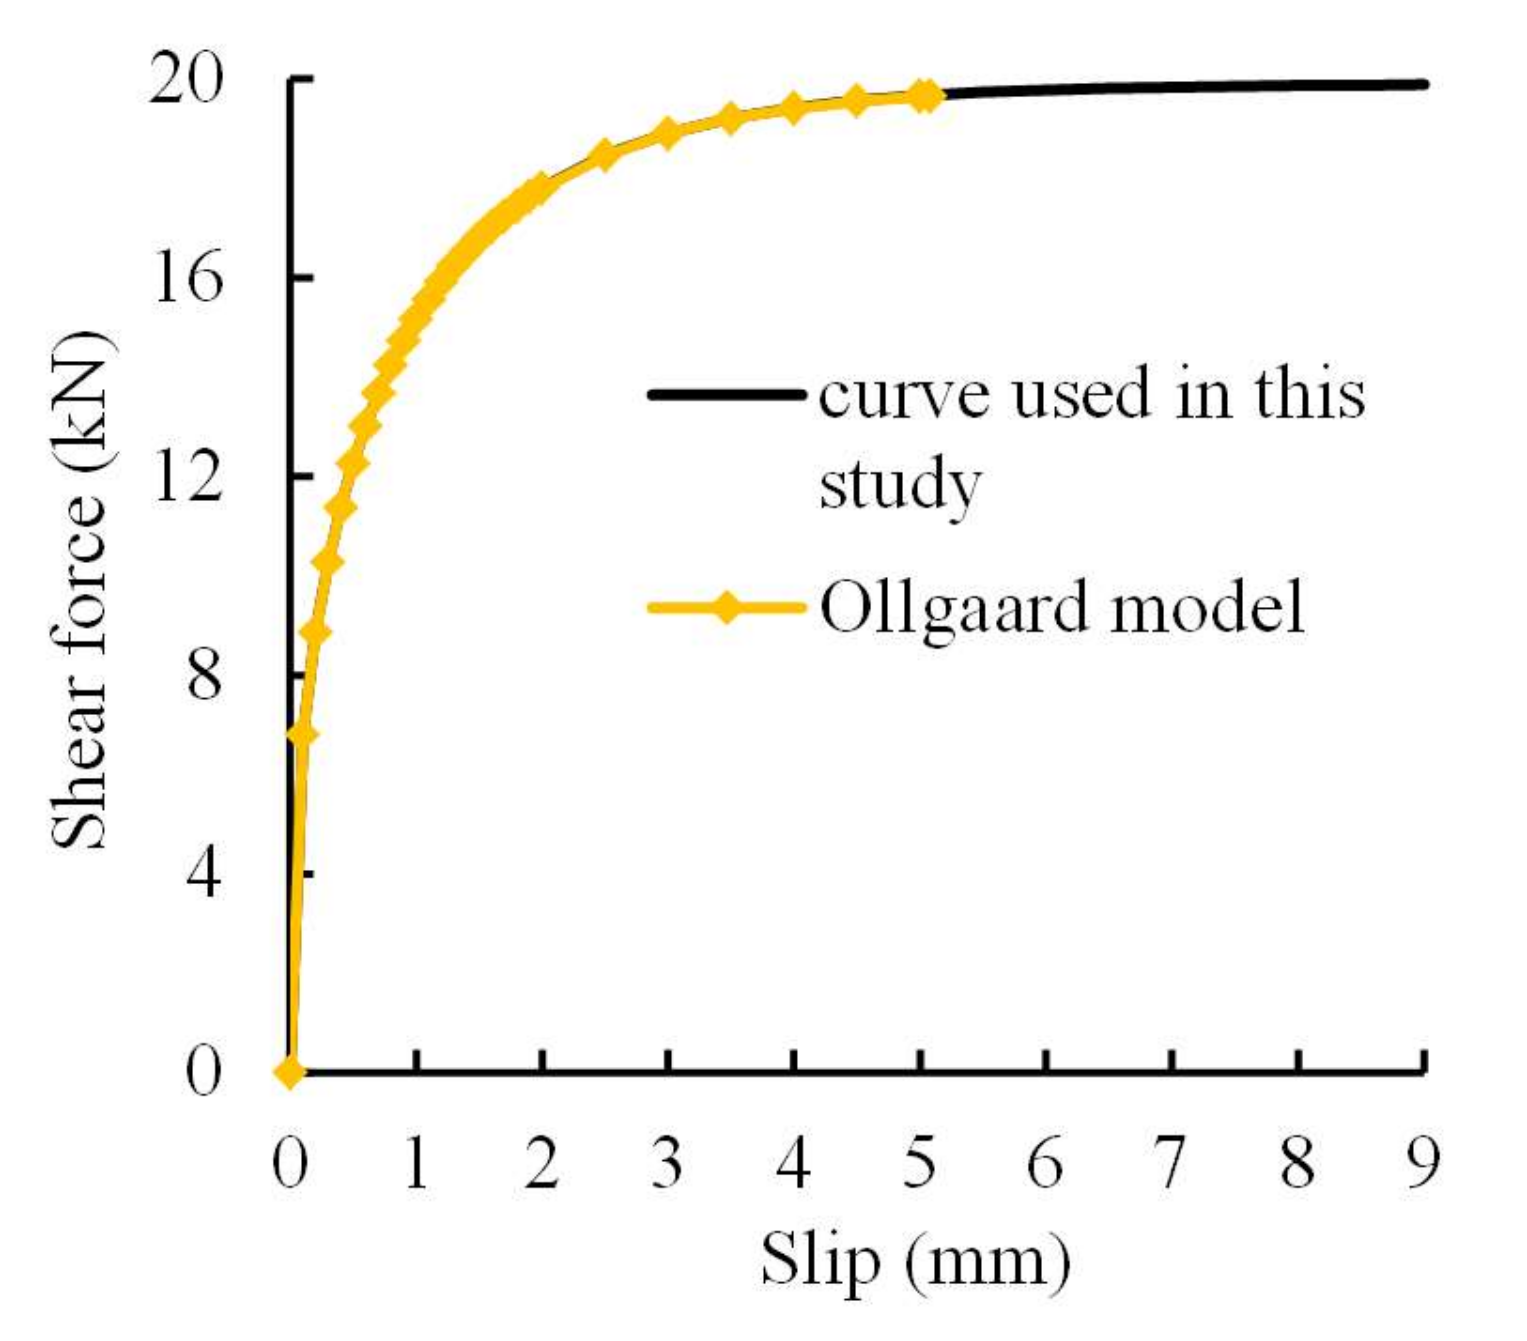
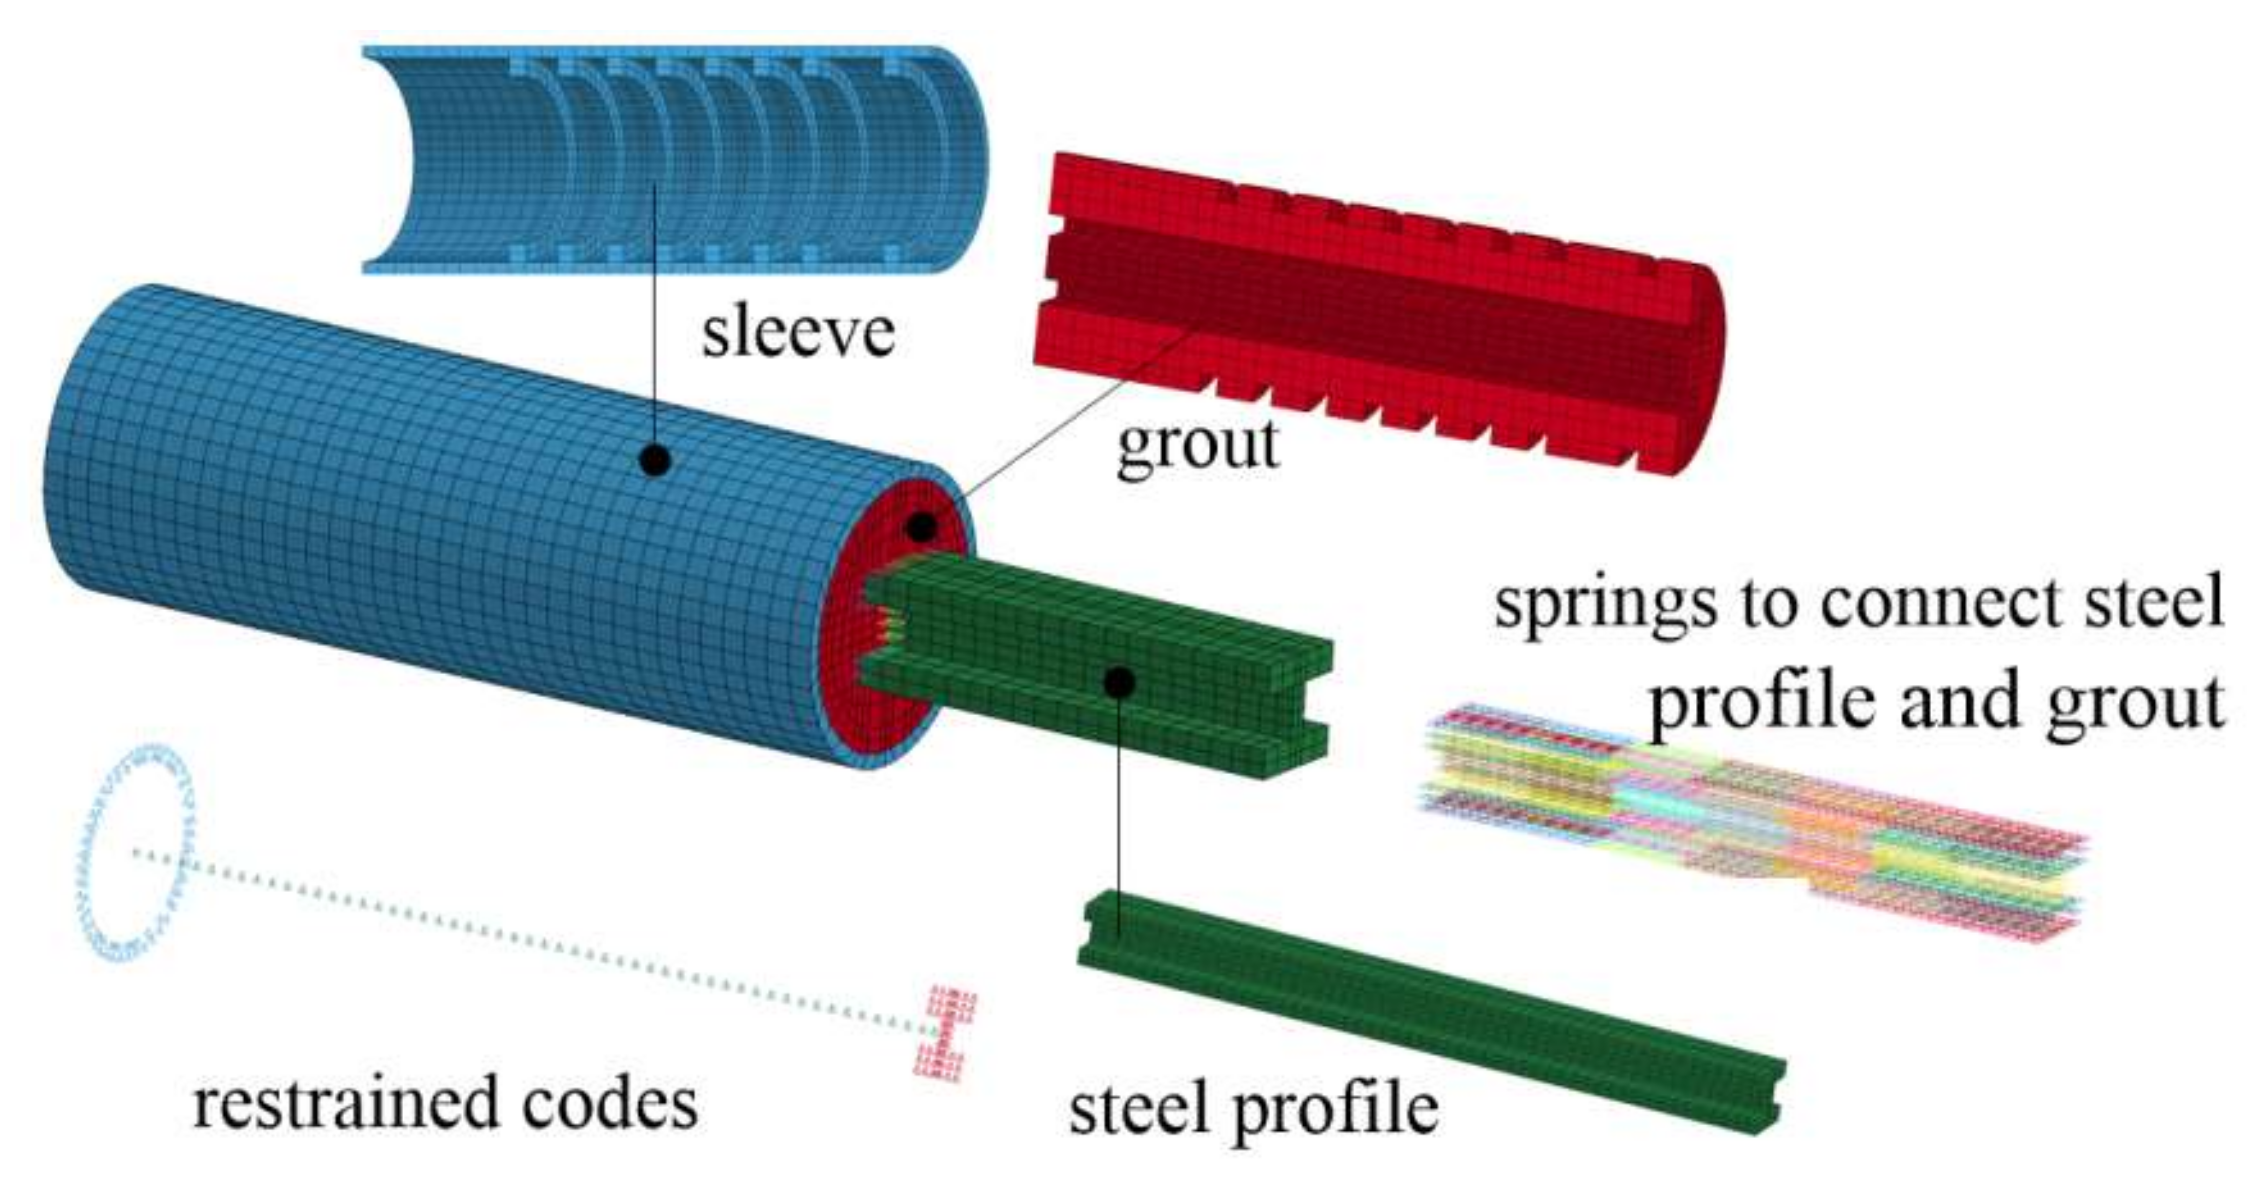
4.1. FEM Models
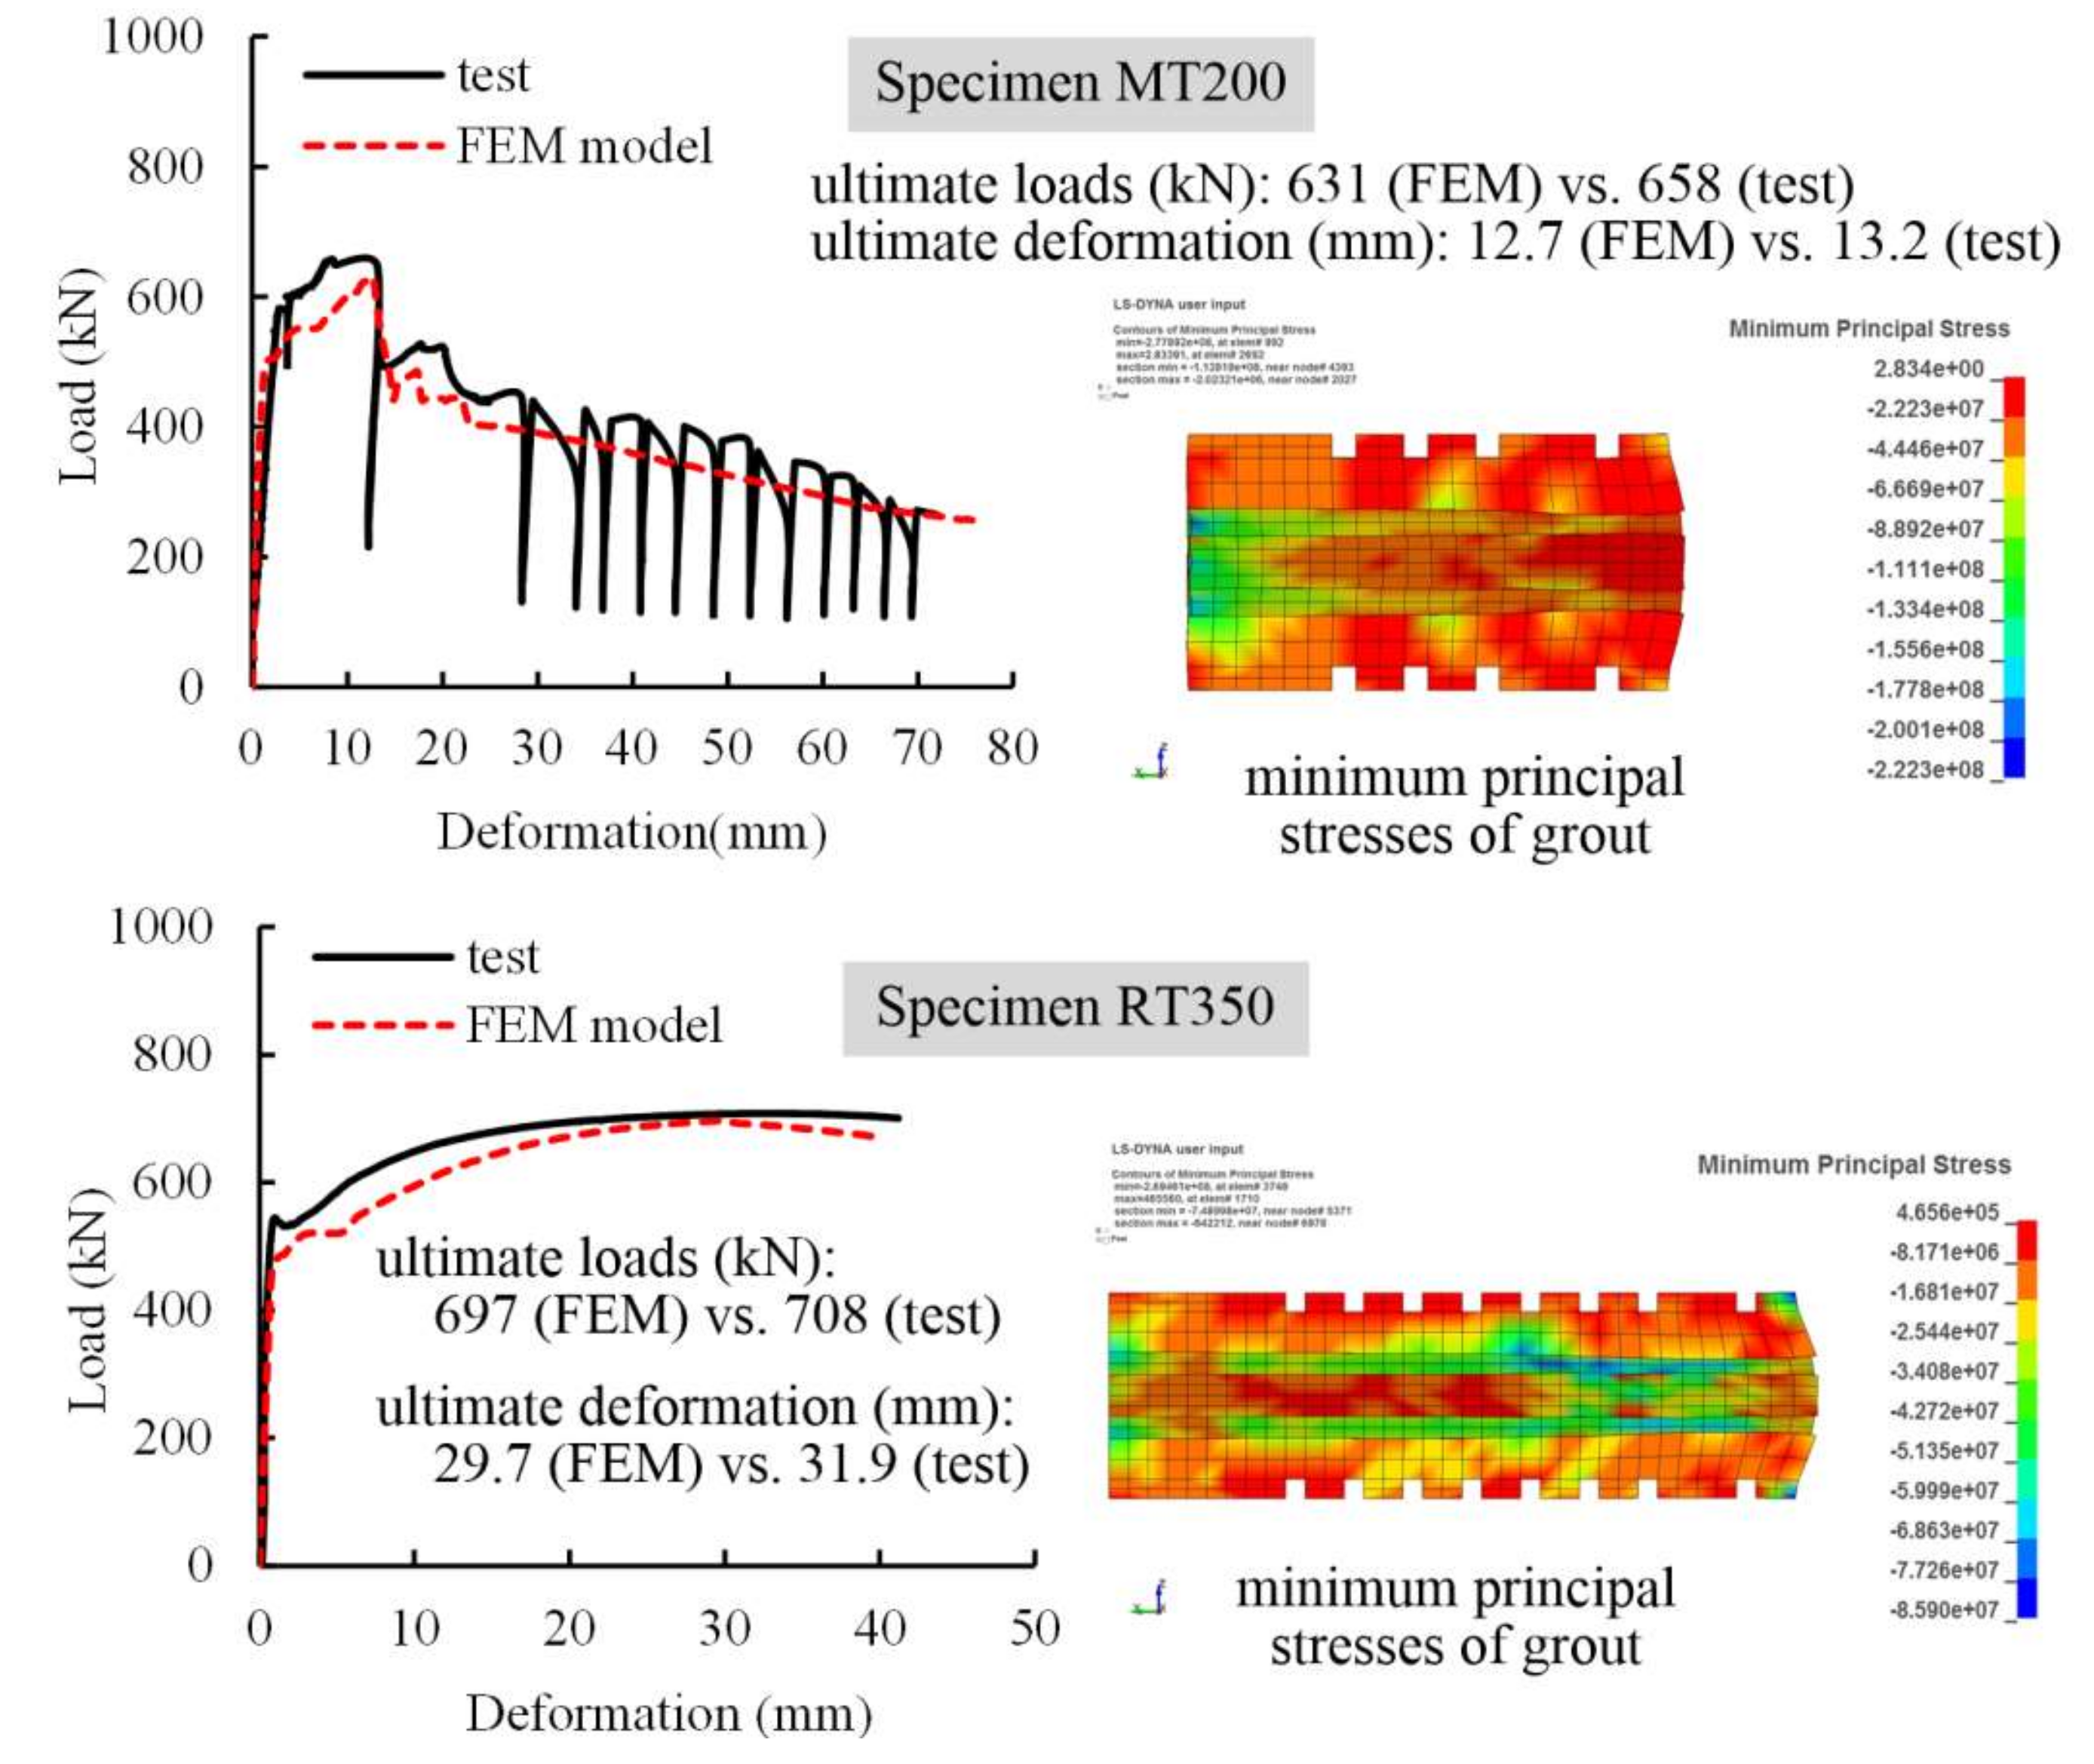
4.2. Model Verification
4.3. Parametric Studies
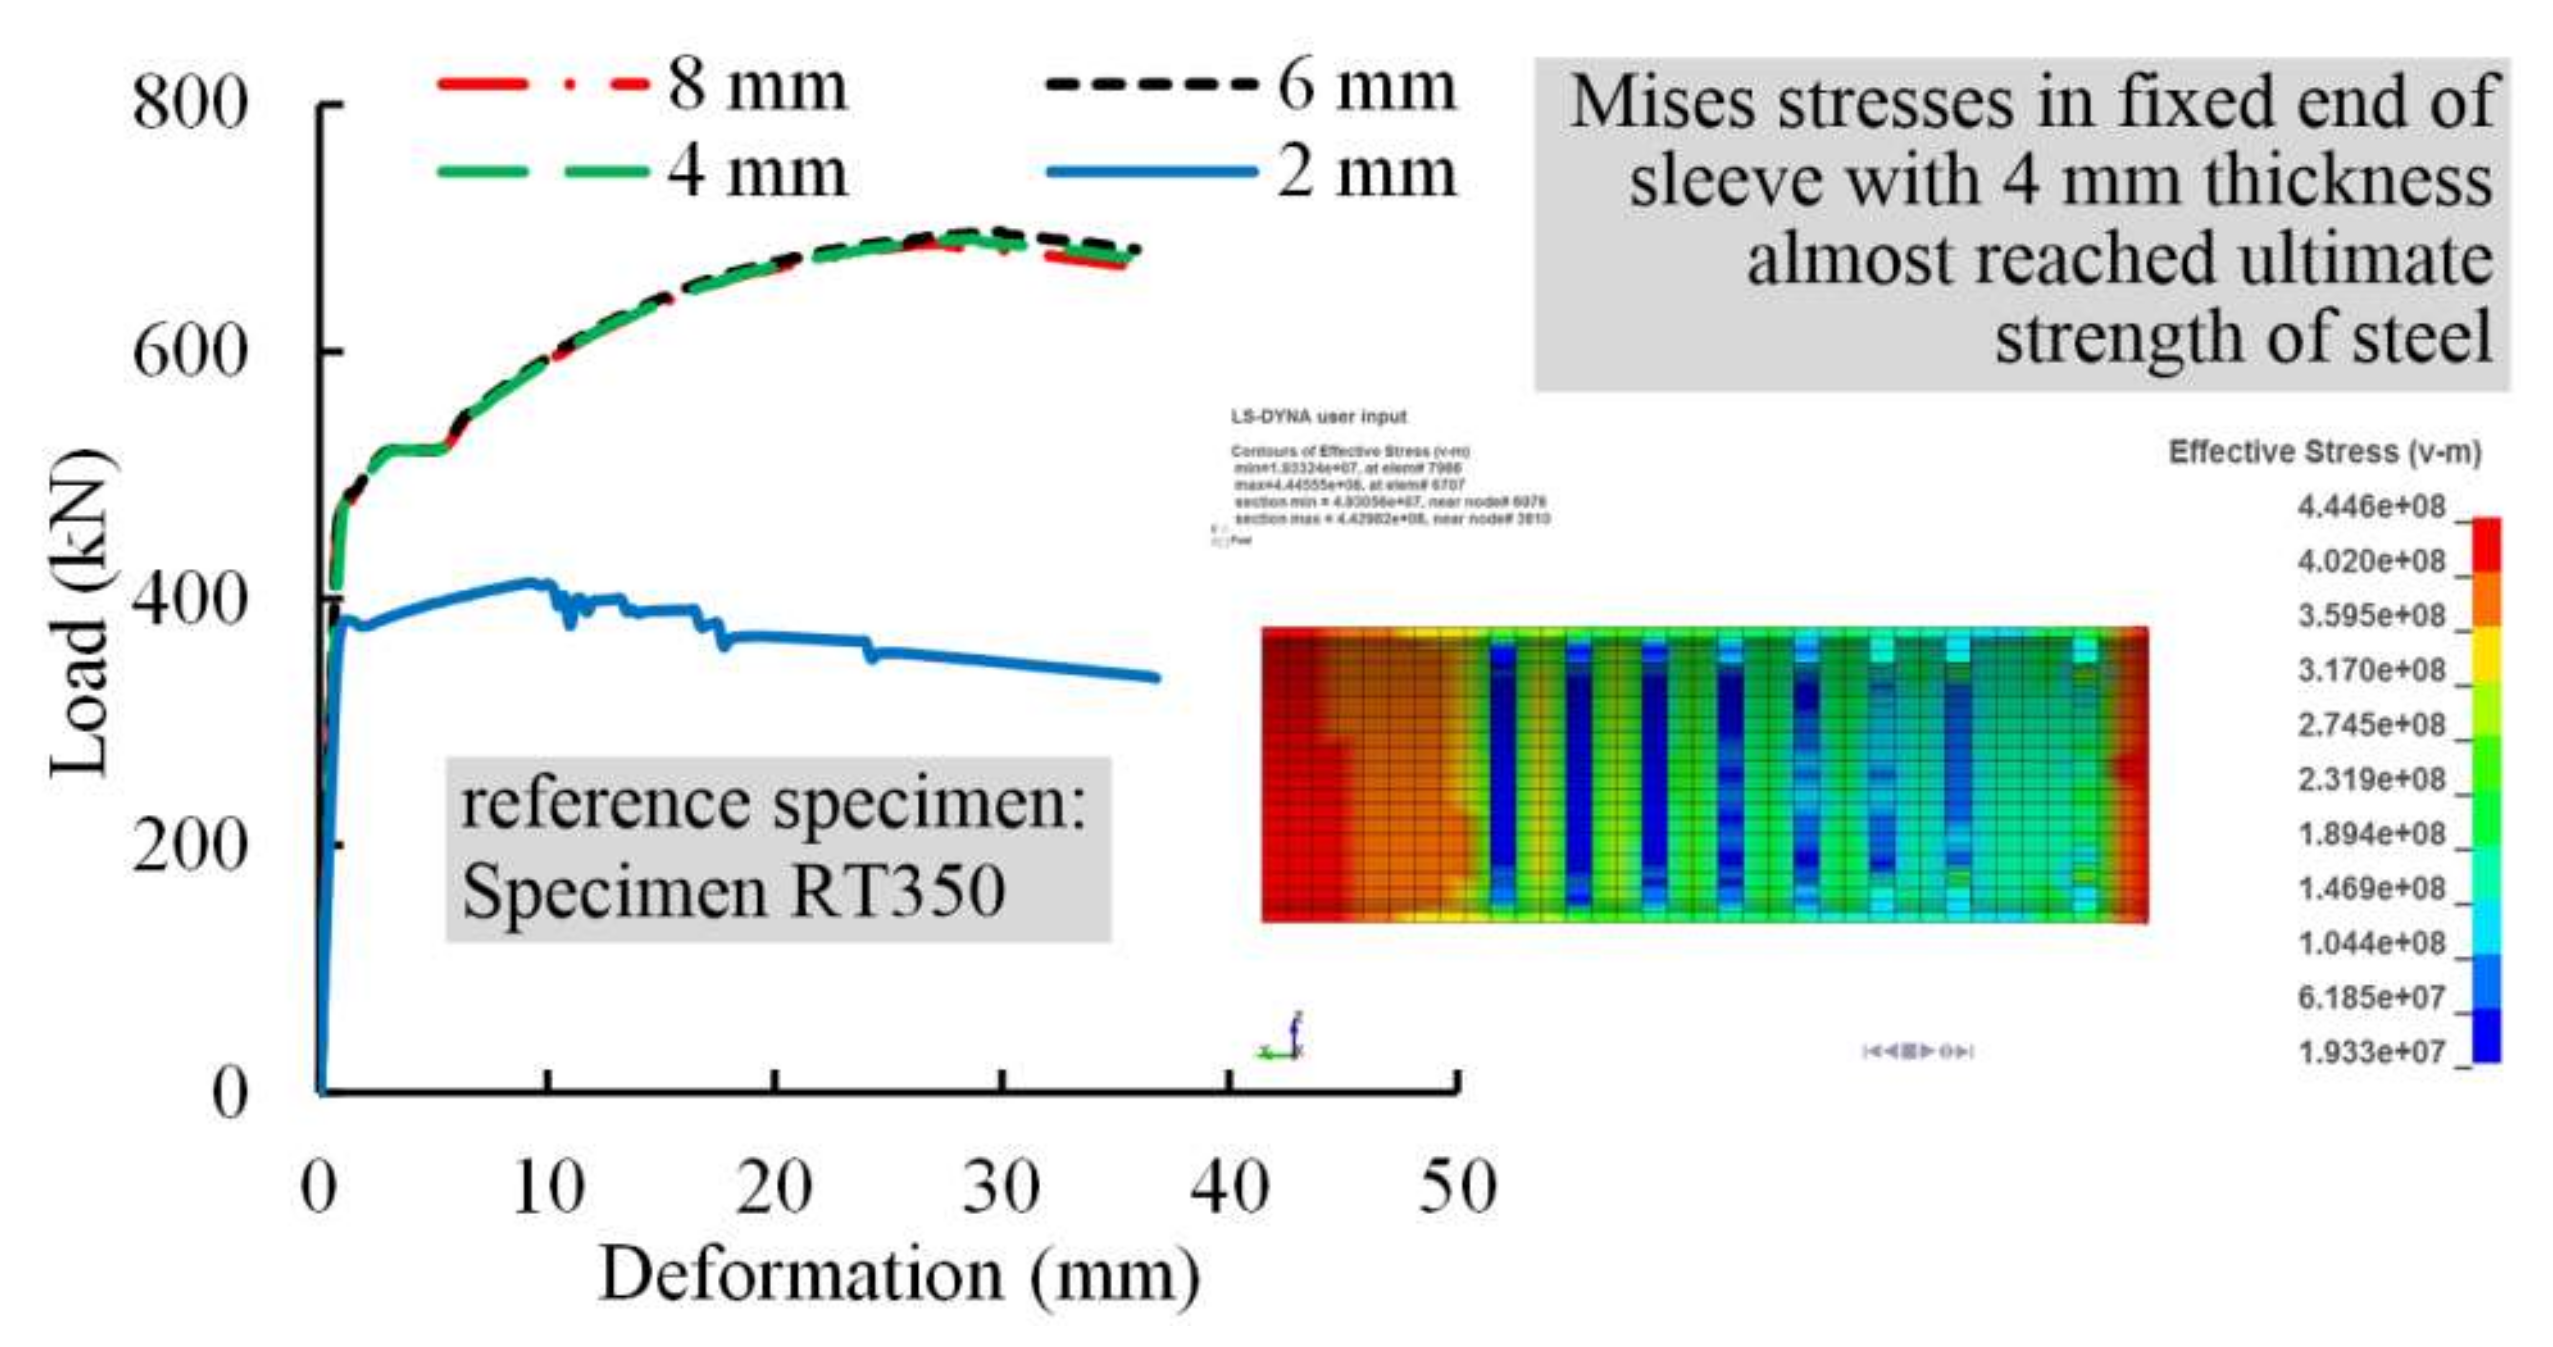
4.3.1. Sleeve Thickness
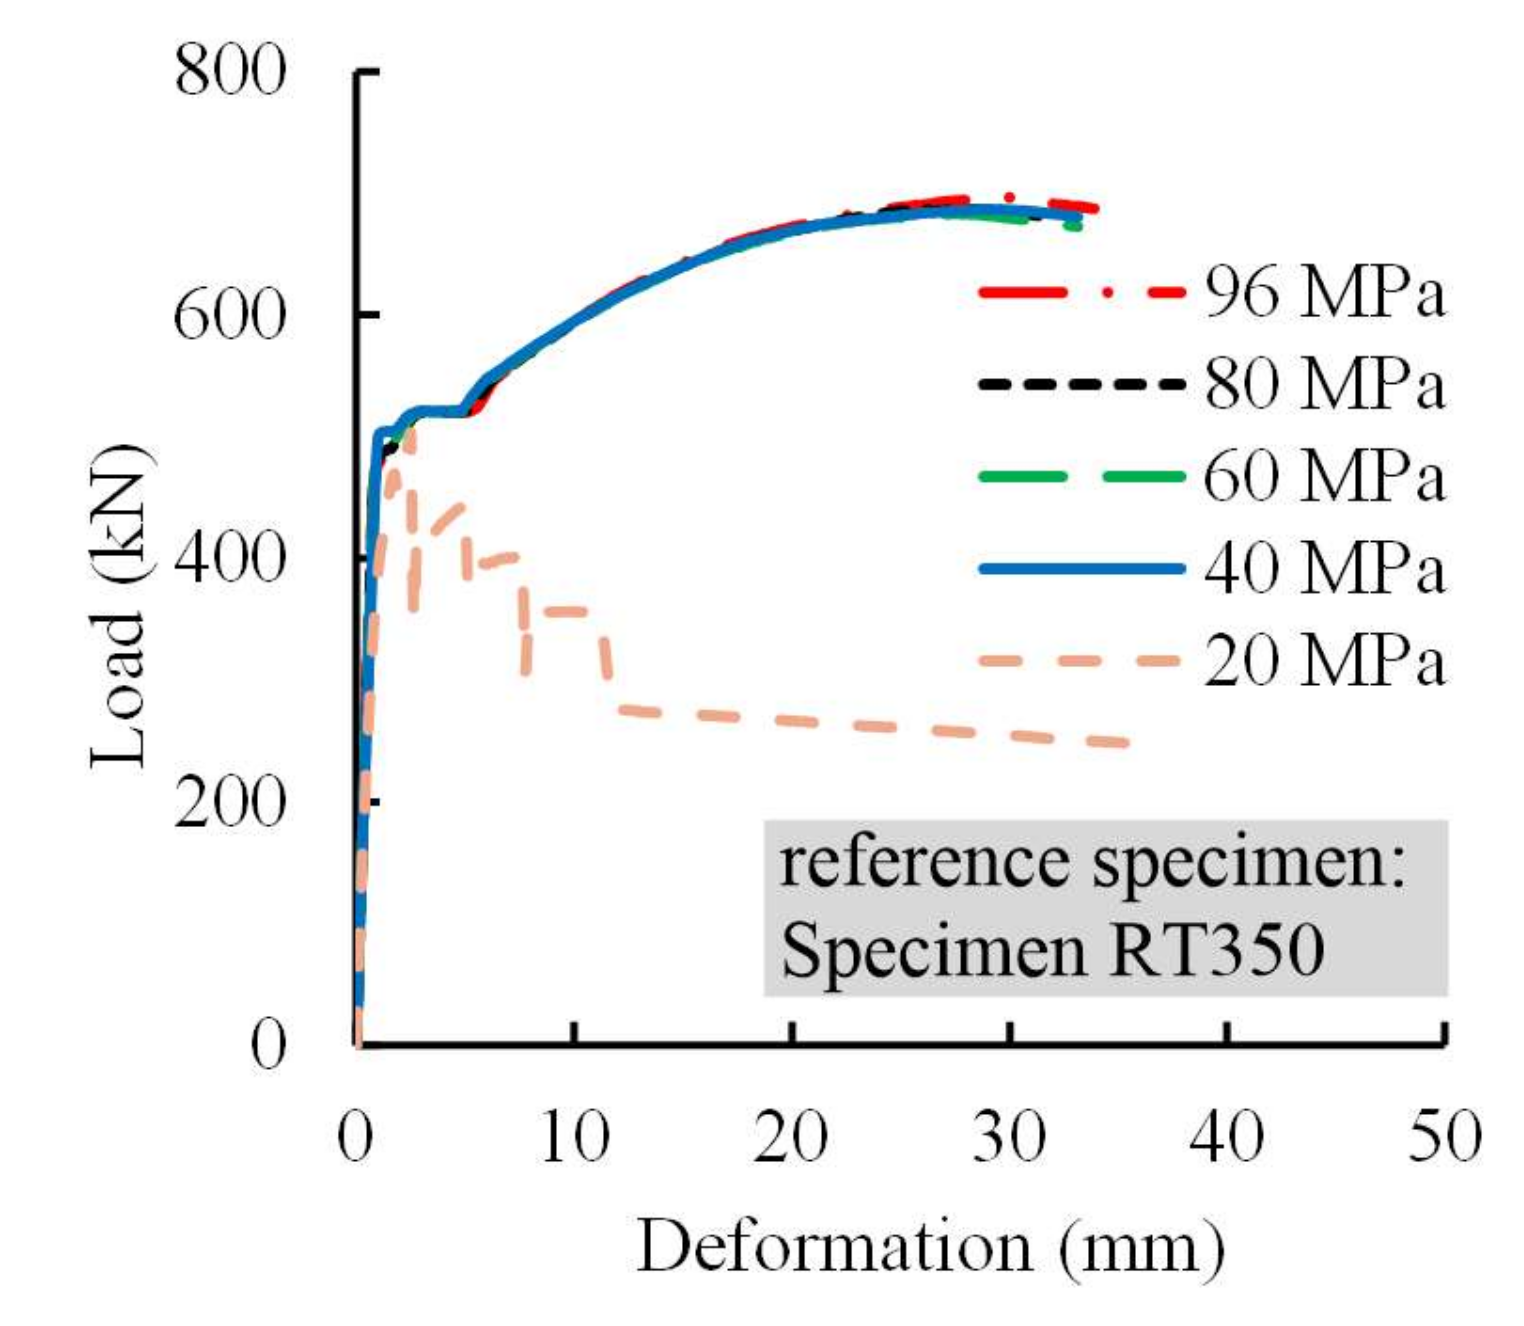
4.3.2. Grout Strength
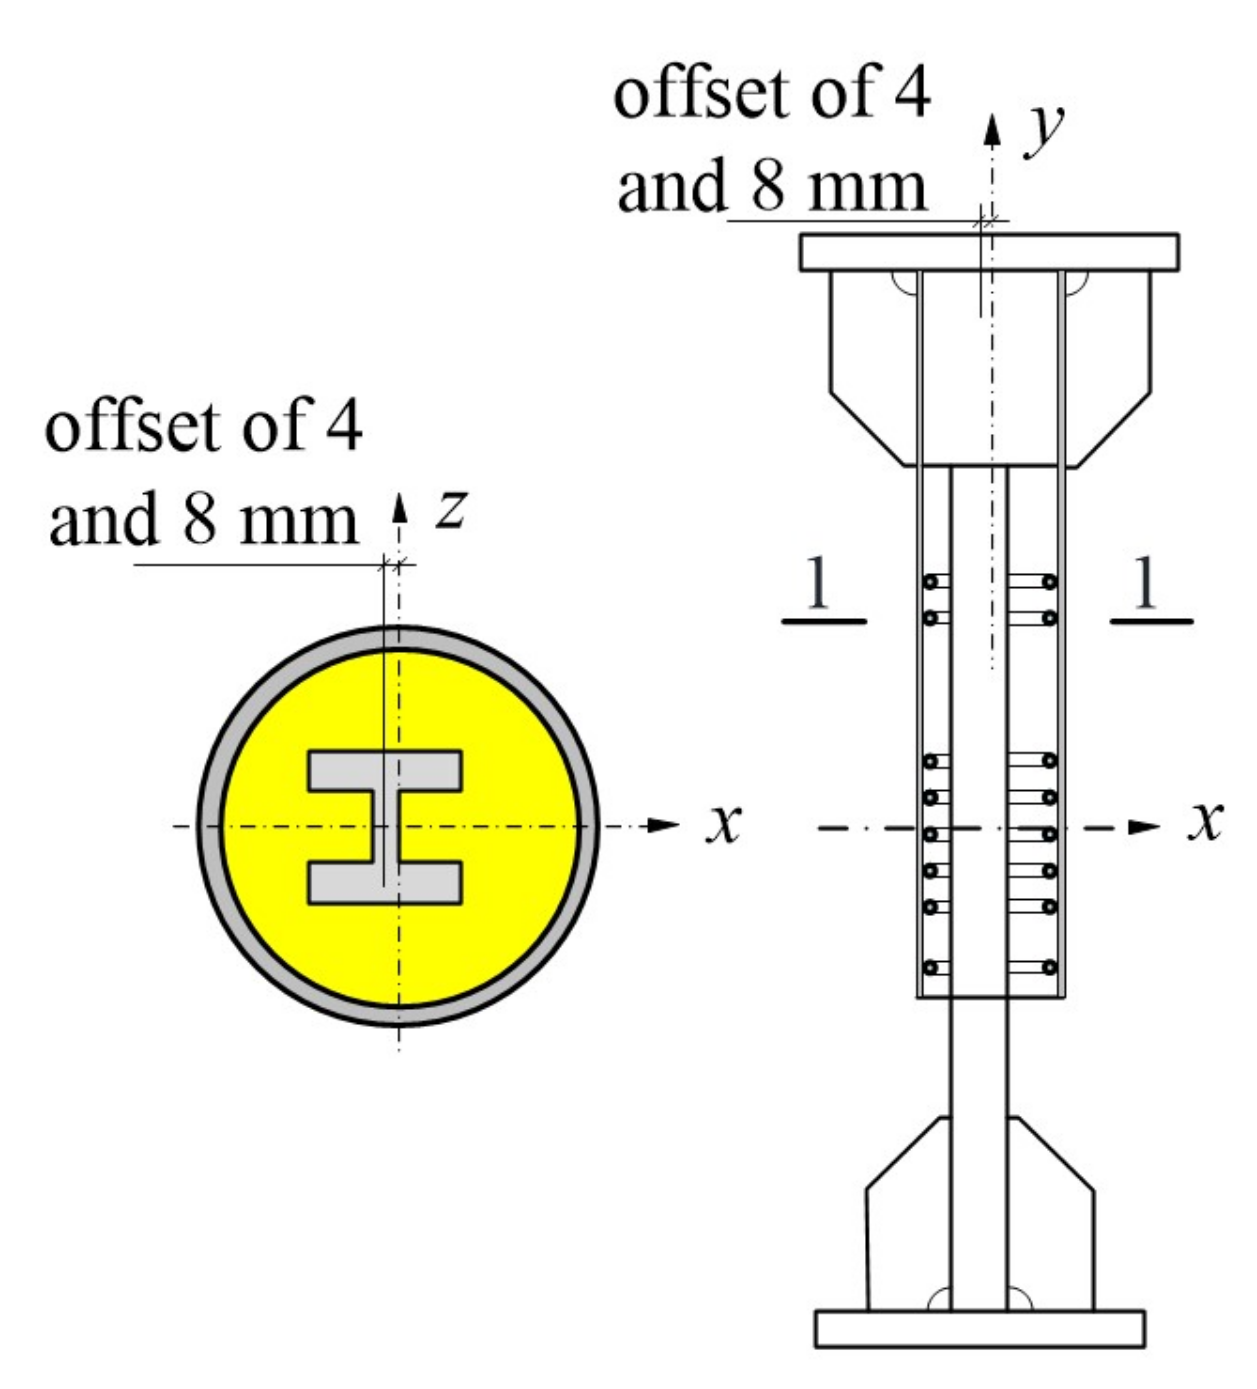
4.3.3. Offset
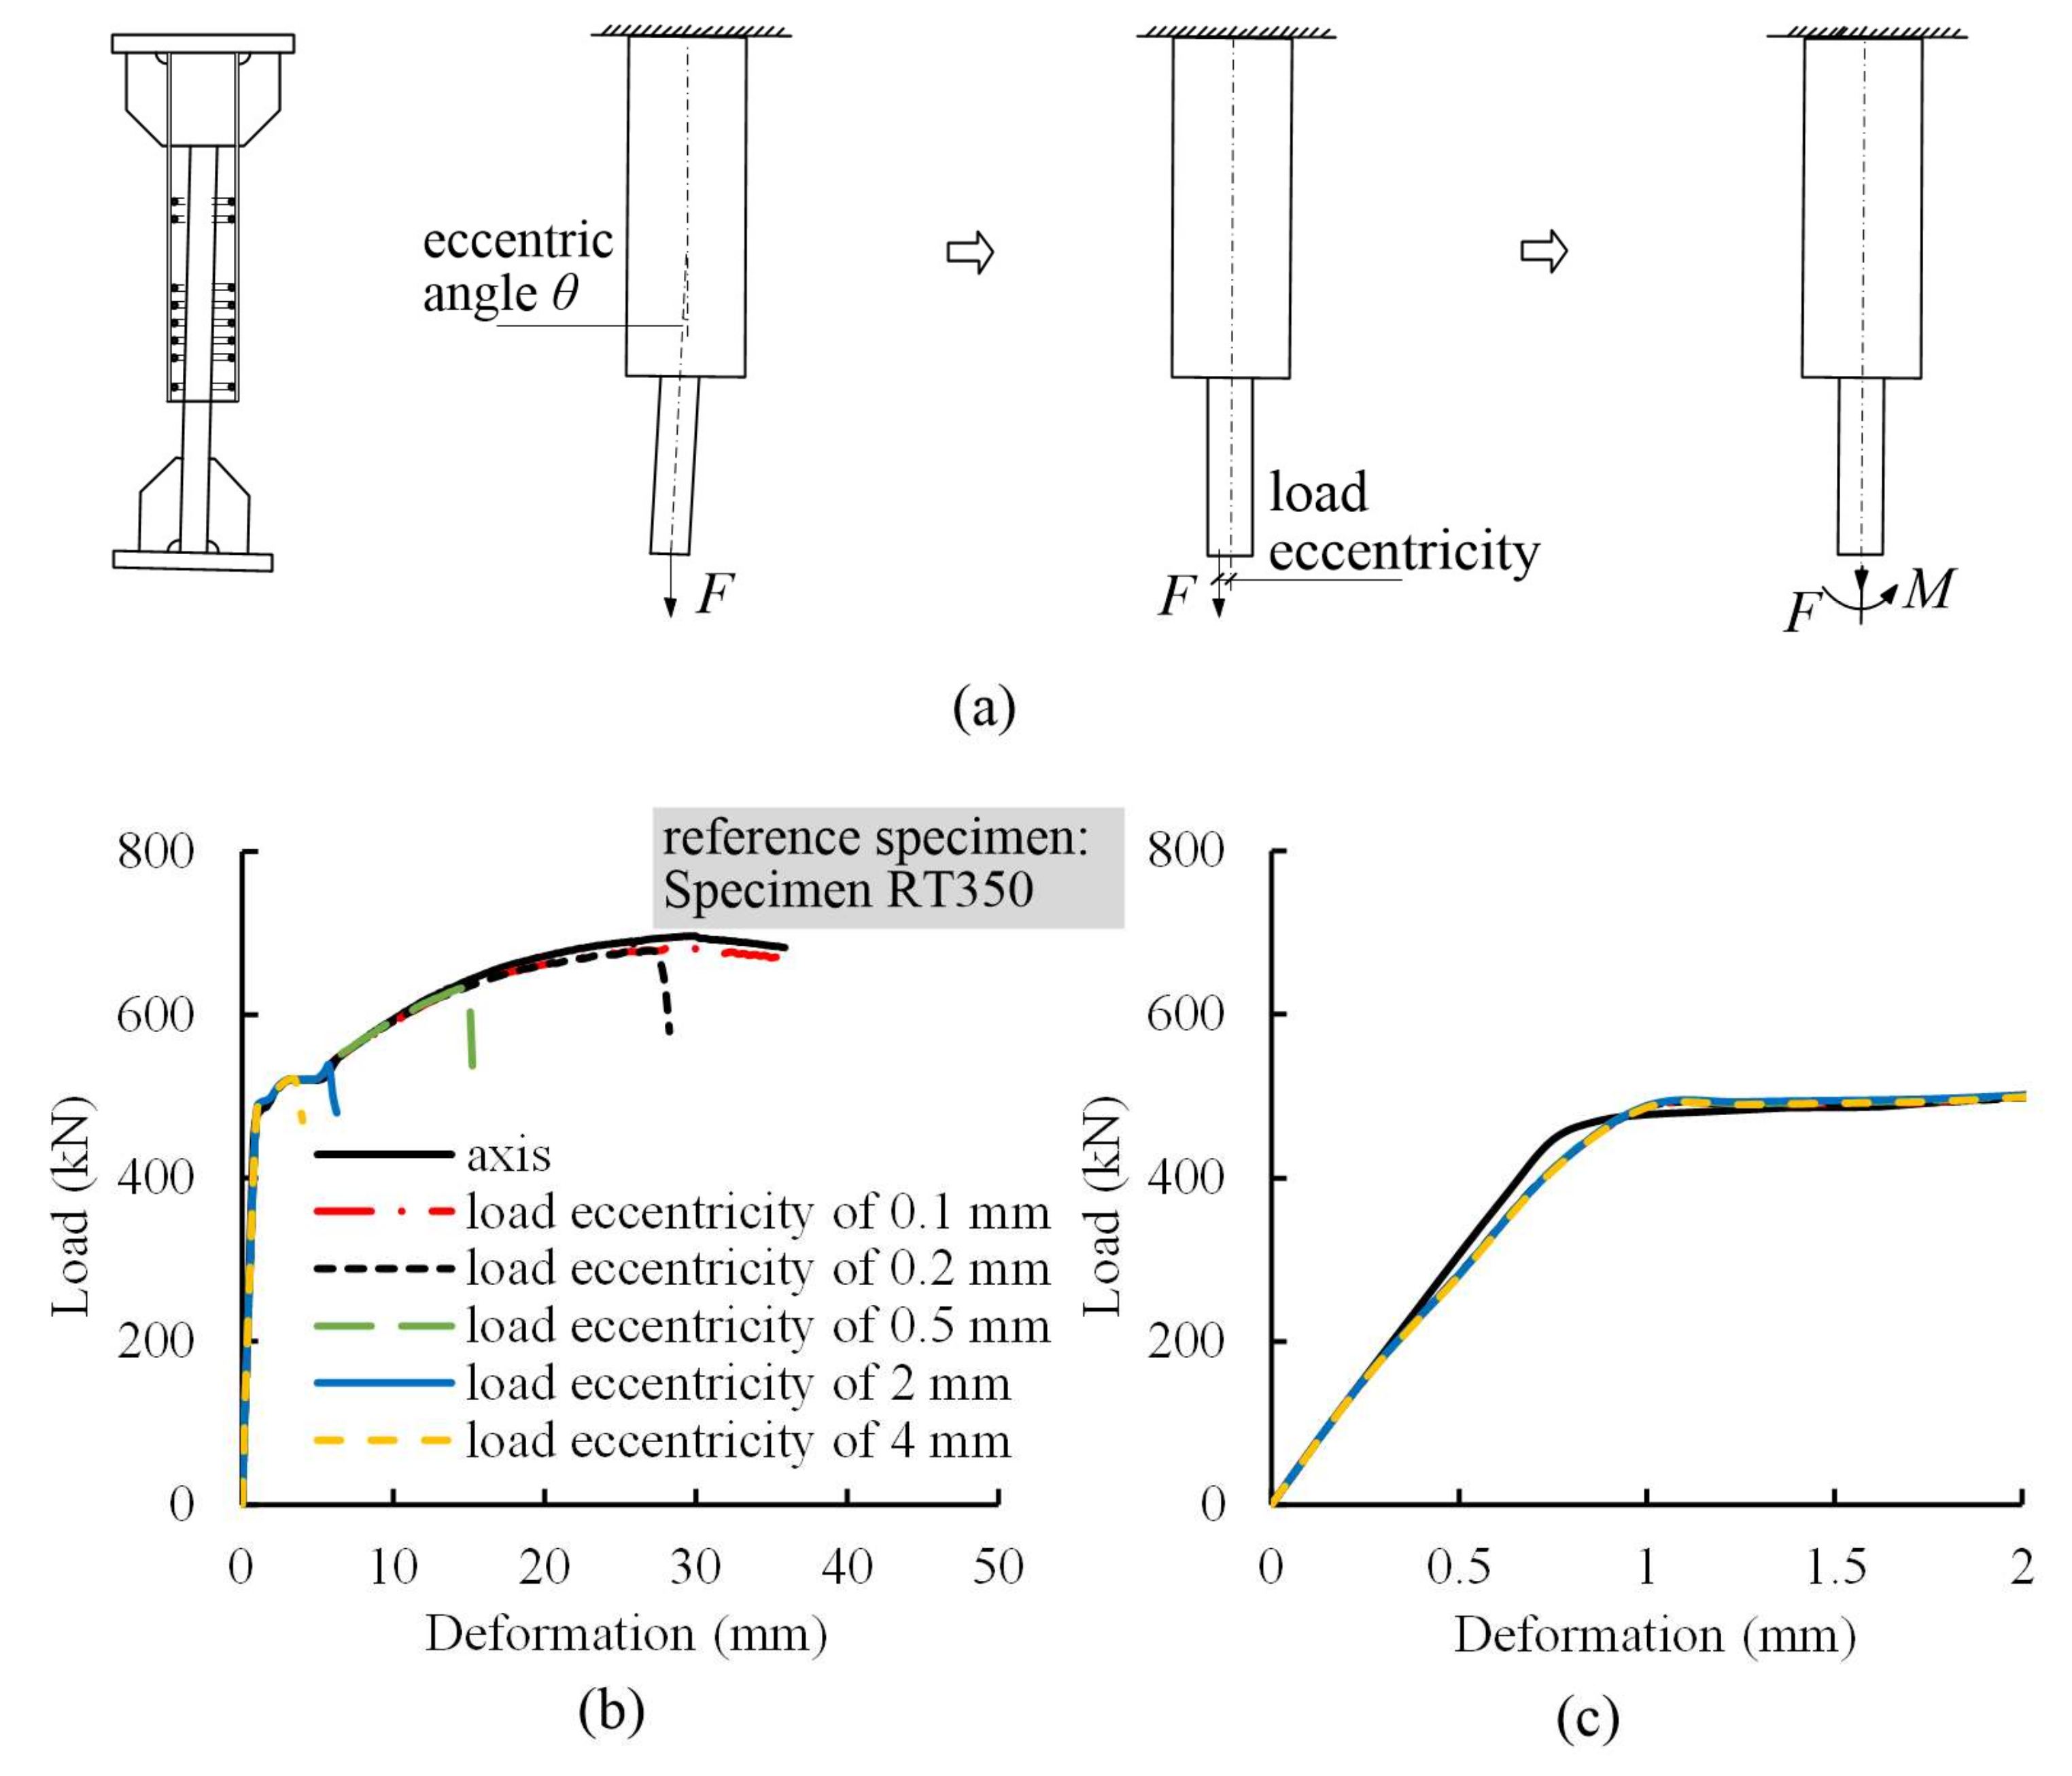
4.3.4. Misalignment
5. Conclusions
- (1)
- Splices with an appropriate anchorage length of the steel profile behaved well under loading schemes of RT, HS, and LS. The skeletons of the load-deformation curves, ultimate strengths and relative elongations at ultimate loads were similar to each other. Minor residential deformation and almost no pinching effect were observed.
- (2)
- Proper sleeve thickness could be determined using the numerical approach to optimize the configuration of splices.
- (3)
- Splice performance was insignificantly affected by the offset of the steel profile and the compressive strengths of grout that exceeded the threshold value. However, splice behavior was significantly affected by the misalignment of the steel profile.
Author Contributions
Funding
Conflicts of Interest
Nomenclature
| Ai | Subordinate area of node i of steel profile |
| As | Cross sectional area of studs |
| Ec | Elasticity modulus of grout |
| F | Spring force |
| fc | Compressive strength of grout |
| fu | Ultimate strength of the steel used for studs |
| Fym | Force corresponding to yield strength of steel profile |
| h | Cross sectional height of steel profile |
| HS | Cyclic loading at high stress |
| MT | Monotonic tensile loading |
| L | Embedded length of steel profile |
| Lg | Gauge length of specimens |
| LS | Cyclic loading at large strain |
| P | Shear force of studs |
| Pu | Ultimate shear resistance of specimens |
| Pu,st | Ultimate shear resistance of studs |
| RT | Repeated tensile loading |
| s | Slip between steel profile and grout |
| u4 | Residual deformation after reversing four times of a LS-series splice |
| u8 | Residual deformation after reversing eight times of a LS-series splice |
| u20 | Elongation at ultimate load after reversing 20 times of a HS-series splice |
| usgt | Elongations at ultimate loads within gauge length |
| δsgt | Relative elongation at ultimate loads within gauge length |
| εym | Yield strain of steel profile |
| τ | Bond stress due to slip between steel profile and grout |
References
- Yahya, C.K.; Sri, S.; Robert, B.F.; Jose, I.R. Seismic-resistant precast concrete structures: State of the art. J. Struct. Eng. 2018, 144, 3118001. [Google Scholar]
- Elliott, K.S. Precast Concrete Structures; CRC Press: Boca Raton, FL, USA, 2017. [Google Scholar]
- Arditi, D.; Ergin, U.; Günhan, S. Factors affecting the use of precast concrete systems. J. Archit. Eng. 2000, 6, 79–86. [Google Scholar] [CrossRef]
- Ameli, M.J.; Brown, D.N.; Parks, J.E.; Pantelides, C.P. Seismic column-to-footing connections using grouted splice sleeves. ACI Struct. J. 2016, 113, 1021–1030. [Google Scholar] [CrossRef]
- Einea, A.; Yamane, T.; Tadros, M.K. Grout-filled pipe splices for precast concrete construction. PCI J. 1995, 40, 82–93. [Google Scholar] [CrossRef]
- Ling, J.H.; Rahman, A.B.A.; Ibrahim, I.S. Feasibility study of grouted splice connector under tensile load. Constr. Build. Mater. 2014, 50, 530–539. [Google Scholar] [CrossRef]
- Henin, E.; Morcous, G. Non-proprietary bar splice sleeve for precast concrete construction. Eng. Struct. 2015, 83, 154–162. [Google Scholar] [CrossRef]
- Ling, J.H.; Rahman, A.B.A.; Ibrahim, I.S.; Hamid, Z.A. Tensile capacity of grouted splice sleeves. Eng. Struct. 2015, 111, 285–296. [Google Scholar] [CrossRef]
- Hosseini, S.J.A.; Rahman, A.B.A.; Osman, M.H.; Saim, A.; Adnan, A. Bond behavior of spirally confined splice of deformed bars in grout. Constr. Build. Mater. 2015, 80, 180–194. [Google Scholar] [CrossRef]
- Lin, F.; Wu, X.B. Mechanical performance and stress-strain relationships for grouted splices under tensile and cyclic loadings. Int. J. Concr. Struct. Mater. 2016, 10, 435–450. [Google Scholar] [CrossRef]
- Zheng, Y.F.; Guo, Z.X.; Liu, J.B.; Chen, X.N.; Xiao, Q.D. Performance and confining mechanism of grouted deformed pipe splice under tensile load. Adv. Struct. Eng. 2016, 19, 86–103. [Google Scholar] [CrossRef]
- Huang, Y.; Zhu, Z.G.; Naito, C.J.; Yi, W.J. Tensile behavior of half grouted sleeve connections: Experimental study and analytical modeling. Constr. Build. Mater. 2017, 152, 96–104. [Google Scholar]
- Kuang, Z.P.; Zheng, G.Y. Computational and experimental mechanical modelling of a composite grouted splice sleeve connector system. Materials 2018, 11, 306. [Google Scholar] [CrossRef] [PubMed]
- Park, R. Perspective on the seismic design of precast concrete structures in New Zealand. PCI J. 1995, 40, 40–60. [Google Scholar] [CrossRef]
- International Federation for Structural Concrete (FIB). Seismic Design of Precast Concrete Building Structures; Bulletin No. 27; International Federation for Structural Concrete (FIB): Lausanne, Switzerland, 2003; ISBN 978-2-88394-067-3. [Google Scholar]
- Tullini, N.; Minghini, F. Cyclic test on a precast reinforced concrete column-to-foundation grouted duct connection. Bull. Earthq. Eng. 2020, 18, 1657–1691. [Google Scholar] [CrossRef]
- Xu, F.; Wang, K.; Wang, S.; Li, W.; Liu, W.; Du, D. Experimental bond behavior of deformed rebars in half-grouted sleeve connections with insufficient grouting defect. Constr. Build. Mater. 2018, 185, 264–274. [Google Scholar] [CrossRef]
- Cao, Z.J.; Li, Q.W. Effect of connection deficiency on seismic performance of precast concrete shear wall-frame structures. J. Earthq. Tsunami 2019, 13, 1940005. [Google Scholar] [CrossRef]
- Lin, F.; Zhao, P.; Fang, Z. A Novel Precast Concrete Shear Wall. Chinese Patent ZL201720190683.0, 2 March 2018. [Google Scholar]
- Ministry of Housing and Urban-Rural Development of the People’s Republic of China. Code for Seismic Design of Buildings (GB50011-2010); China Architecture & Building Press: Beijing, China, 2010. (In Chinese)
- Standardization Administration of the People’s Republic of China. Metallic Materials-Tensile Testing-Part 1: Method of Test at Room Temperature (GB/T 228.1-2010); China Standard Publishing House: Beijing, China, 2011. (In Chinese)
- Ministry of Housing and Urban-Rural Development of the People’s Republic of China. Cementitious Grout for Coupler of Rebar Splicing (JG/T408-2013); China Standard Publishing House: Beijing, China, 2013. (In Chinese)
- Ministry of Housing and Urban-Rural Construction of the People’s Republic of China. Technical Specification for Grout Sleeve Splicing of Rebars (JGJ355-2015); China Architecture & Building Press: Beijing, China, 2015. (In Chinese)
- ICC Evaluation Service Inc. Acceptance Criteria for Mechanical Connector Systems for Steel Reinforcing Bars (AC133); ICC Evaluation Service Inc.: Birmingham, AL, USA, 2014. [Google Scholar]
- Hallquist, J.O. LS-DYNA Theory Manual; Livermore Software Technology Corporation: Livermore, CA, USA, 2016. [Google Scholar]
- Youssf, O.; ElGawady, M.A.; Mills, J.E. Displacement and plastic hinge length of FRP-confined circular reinforced concrete columns. Eng. Struct. 2015, 101, 465–476. [Google Scholar] [CrossRef]
- Xu, J.C.; Wu, C.Q.; Li, Z.X.; Ng, C.T. Numerical analysis of shear transfer across an initially uncrack reinforced concrete member. Eng. Struct. 2015, 102, 296–309. [Google Scholar] [CrossRef]
- Wang, X.; Liu, Y.; Yang, F.; Lu, Y.; Li, X. Effect of concrete cover on the bond-slip behavior between steel section and concrete in SRC structures. Constr. Build. Mater. 2019, 229, 116855. [Google Scholar] [CrossRef]
- Yang, Y. Study on the Basic Theory and Application of Bond-Slip Behavior of Steel Reinforced Concrete. Ph.D. Thesis, Xi’an University of Architecture and Technology, Xi’an, China, 2003. (In Chinese). [Google Scholar]
- Ollgaard, J.G.; Slutter, R.G.; Fisher, J.W. Shear strength of stud connectors in lightweight and normal-weight concrete. AISC Eng. J. 1971, 8, 55–64. [Google Scholar]
- Sebastian, W.M.; McConnel, R.E. Nonlinear FE analysis of steel-concrete composite structures. J. Struct. Eng. 2000, 126, 662–674. [Google Scholar] [CrossRef]
- Nguyen, H.T.; Kim, S.E. Finite element modeling of push-out tests for large stud shear connectors. J. Constr. Steel Res. 2009, 65, 1909–1920. [Google Scholar] [CrossRef]
- Kim, H. Bond strength of mortar-filled steel pipe splices reflecting confining effect. J. Asian Archit. Build. Eng. 2012, 11, 125–132. [Google Scholar] [CrossRef]


| Group No. | Specimen No. | Cross Section of Steel Profile (mm) | Cross Section of Sleeve (mm) | Embedded Length of Steel Profile, L (mm) | Number of Steel Ring Ribs | Number of Steel Studs | Loading Scheme |
|---|---|---|---|---|---|---|---|
| 1 | MT500 | I46 × 46 × 12 × 8 | Φ121 × 6 | 500 | 10 | 8 | MT |
| MT400 | 400 | 10 | 6 | MT | |||
| MT300 | 300 | 8 | 4 | MT | |||
| MT200 | 200 | 4 | 2 | MT | |||
| 2 | RT350 | I46 × 46 × 12 × 8 | Φ121 × 6 | 350 | 8 | 6 | RT |
| HS350 | 350 | 8 | 6 | HS | |||
| LS350 | 350 | 8 | 6 | LS |
| Material | Group No. | Yield Strength (MPa) | Ultimate Strength (MPa) | Elasticity Modulus (GPa) | Yield Strain (%) | Ultimate Strain (%) |
|---|---|---|---|---|---|---|
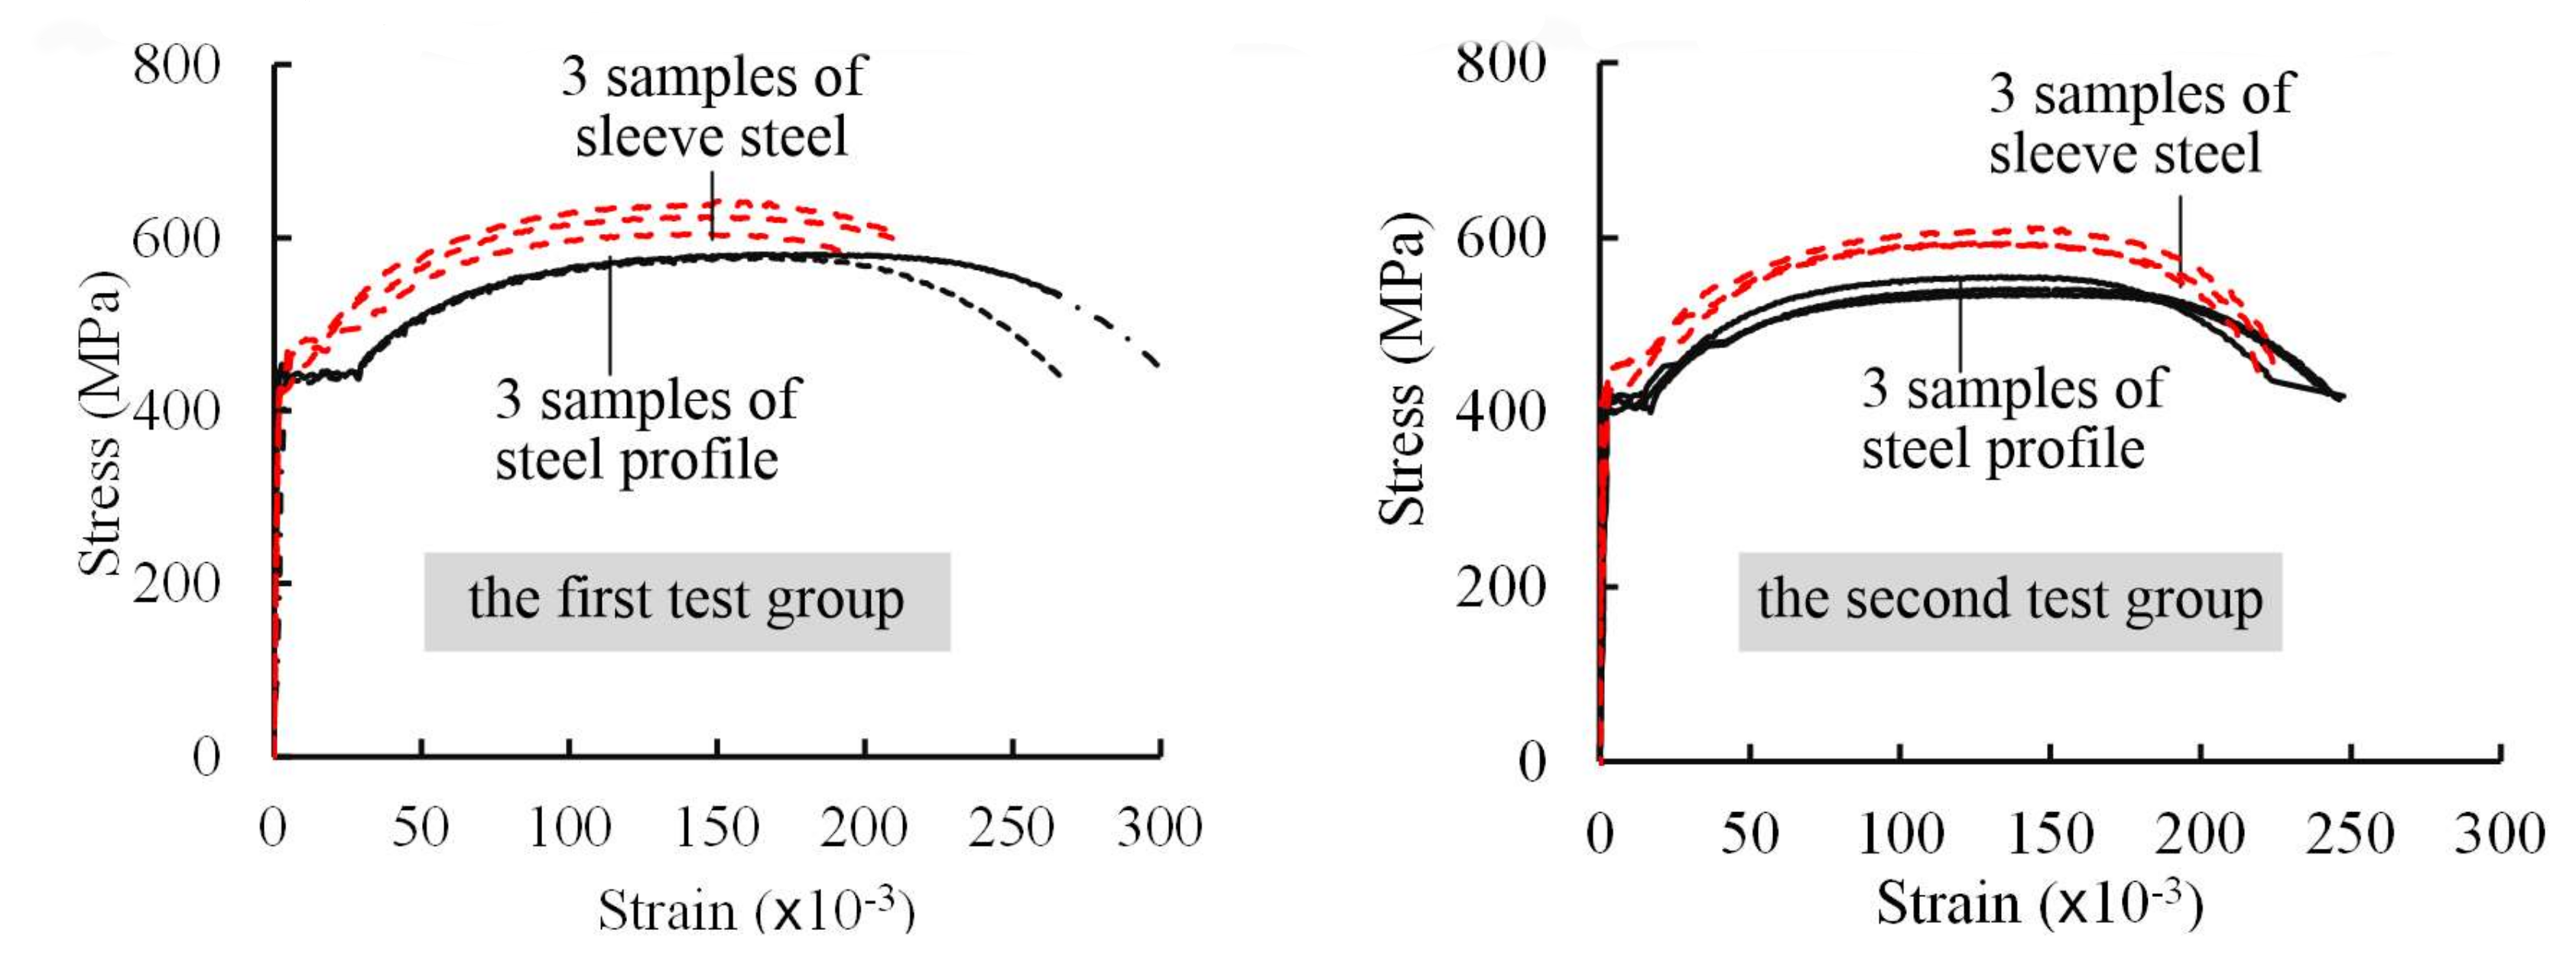
| Steel profile | 1 | 437.4 | 580.0 | 215 | 0.203 | 16.6 |
| 2 | 410.0 | 543.7 | 222 | 0.185 | 14.5 | |
| Steel for sleeves | 1 | 420.7 | 624.0 | 227 | 0.185 | 14.5 |
| 2 | 445.2 | 599.7 | 229 | 0.194 | 13.2 |
| Group No. | Compressive Strength (MPa) | Flexural Strength (MPa) | Elasticity Modulus (×104 MPa) | Tensile Strength (MPa) |
|---|---|---|---|---|
| 1 | 68.0 | 12.7 | - | - |
| 2 | 95.8 | 17.4 | 3.89 | 7.44 |
| Loading Scheme | Loading Procedure |
|---|---|
| Monotonic tensile loading (applied for Specimens MT500, MT400, MT300 and MT200) |  |
| Repeated tensile loading (applied for Specimen RT350) |  |
| Cyclic loading at high stress (applied for Specimen HS350) |  |
| Cyclic loading at large strain (applied for Specimen LS350) |  |
| Specimen No. | Measured Cross Sectional Area of Steel Profile (mm2) | Yield Loads (kN) | Yield Strength (MPa) | Ultimate Loads (kN) | Ultimate Strength (Mpa) | Relative Elongations at Ultimate Loads, δsgt (%) | Failure Mode of Steel Profile |
|---|---|---|---|---|---|---|---|
| MT500 | 1328 | 610 | 460 | 783 | 589 | 3.8 | Fracture |
| MT400 | 1328 | 616 | 464 | 791 | 596 | 3.4 | Fracture |
| MT300 | 1304 | 600 | 460 | 772 | 592 | 5.2 | Fracture |
| MT200 | 1280 | 602 | 470 | 658 | 514 | 2.2 | Pull-out |
| Specimen No. | Measured Cross Sectional Area of Steel Profile (mm2) | Yield Loads(kN) | Yield Strength (Mpa) | Ultimate Loads (kN) | Ultimate Strength (Mpa) | Relative Elongations at Ultimate Loads, δsgt (%) | Failure Mode of Steel Profile |
|---|---|---|---|---|---|---|---|
| RT350 | 1237 | 531 | 430 | 708 | 572 | 6.1 | Fracture |
| HS350 | 1311 | 540 | 412 | 721 | 550 | 6.2 | Fracture |
| LD350 | 1240 | 546 | 440 | 718 | 580 | 6.6 | Fracture |
| Parameter | Reference Specimen | Value for Parameter | Failure Mode | Yield Load (kN) | Ultimate Load (kN) | Ultimate Defor-mation (mm) | δsgt (%) |
|---|---|---|---|---|---|---|---|
| Sleeve thickness | Specimen RT350 | 2 mm | sleeve fracture | - | 413 | 9.2 | 1.7 |
| 4 mm | steel profile fracture | 520 | 697 | 28.7 | 5.4 | ||
| 6 mm | steel profile fracture | 520 | 697 | 29.7 | 5.6 | ||
| 8 mm | steel profile fracture | 520 | 697 | 29.7 | 5.6 | ||
| Grout strength | Specimen RT350 | 20 MPa | steel profile pull-out | - | 503 | 2.5 | 0.5 |
| 40 MPa | steel profile fracture | 520 | 687 | 28.9 | 5.4 | ||
| 60 MPa | steel profile fracture | 520 | 683 | 26.9 | 5.0 | ||
| 80 MPa | steel profile fracture | 520 | 787 | 26.0 | 4.9 | ||
| 96 MPa | steel profile fracture | 520 | 697 | 29.7 | 5.6 | ||
| Offset | Specimen RT350 | 0 mm | steel profile fracture | 520 | 697 | 29.7 | 5.6 |
| 4 mm | steel profile fracture | 520 | 697 | 30.5 | 5.7 | ||
| 8 mm | steel profile fracture | 520 | 697 | 30.3 | 5.6 | ||
| Mis-alignment | Specimen RT350 | 0 rad | steel profile fracture | 520 | 697 | 29.7 | 5.6 |
| 0.008 rad | steel profile fracture | 520 | 683 | 29.0 | 5.4 | ||
| 0.016 rad | steel profile fracture | 520 | 678 | 27.0 | 5.1 | ||
| 0.040 rad | steel profile fracture | 520 | 633 | 14.7 | 2.8 | ||
| 0.162 rad | steel profile fracture | 520 | 539 | 5.7 | 1.1 | ||
| 0.324 rad | steel profile fracture | 520 | 521 | 3.5 | 0.7 |
© 2020 by the authors. Licensee MDPI, Basel, Switzerland. This article is an open access article distributed under the terms and conditions of the Creative Commons Attribution (CC BY) license (http://creativecommons.org/licenses/by/4.0/).
Share and Cite
Lin, F.; Zhao, P. Behavior of Grouted Sleeve Splice for Steel Profile under Tensile Loadings. Materials 2020, 13, 2037. https://doi.org/10.3390/ma13092037
Lin F, Zhao P. Behavior of Grouted Sleeve Splice for Steel Profile under Tensile Loadings. Materials. 2020; 13(9):2037. https://doi.org/10.3390/ma13092037
Chicago/Turabian StyleLin, Feng, and Peng Zhao. 2020. "Behavior of Grouted Sleeve Splice for Steel Profile under Tensile Loadings" Materials 13, no. 9: 2037. https://doi.org/10.3390/ma13092037
APA StyleLin, F., & Zhao, P. (2020). Behavior of Grouted Sleeve Splice for Steel Profile under Tensile Loadings. Materials, 13(9), 2037. https://doi.org/10.3390/ma13092037