Article

Surface Characterization of MoS2 Atomic Layers Mechanically Exfoliated on a Si Substrate

1
Laboratory of Surface Analysis, Institute of Physical Chemistry, Polish Academy of Sciences, Kasprzaka 44/52, 01-224 Warsaw, Poland
2
Biological and Chemical Research Centre, Faculty of Chemistry, University of Warsaw, Żwirki Wigury 101, 02-089 Warsaw, Poland
*
Author to whom correspondence should be addressed.
Materials 2020, 13(16), 3595; https://doi.org/10.3390/ma13163595
Submission received: 16 July 2020 / Revised: 8 August 2020 / Accepted: 12 August 2020 / Published: 14 August 2020

Abstract

:
Mo disulfide overlayers with the thickness exceeding 1.77 nm were obtained on Si substrates through mechanical exfoliation. The resulting Mo disulfide flakes were then analyzed ex situ using combination of Auger electron spectroscopy (AES), elastic-peak electron spectroscopy (EPES) and scanning electron microscopy (SEM) in order to characterize their surface chemical composition, electron transport phenomena and surface morphology. Prior to EPES measurements, the Mo disulfide surface was sputter-cleaned and amorphized by 3 kV argon ions, and the resulting S/Mo atomic ratio varied in the range 1.80–1.88, as found from AES measurements. The SEM images revealed single crystalline small-area (up to 15 μm in lateral size) Mo disulfide flakes having polygonal or near-triangular shapes. Such irregular-edged flakes exhibited high crystal quality and thickness uniformity. The inelastic mean free path (IMFP), characterizing electron transport, was evaluated from the relative EPES using Au reference material for electron energies E = 0.5–2 keV. Experimental IMFPs, λ, determined for the AES-measured surface compositions were approximated by the simple function λ = kEp, where k = 0.0289 and p = 0.946 were fitted parameters. Additionally, these IMFPs were compared with IMFPs resulting from the two methods: (i) present calculations based on the formalism of the Oswald et al. model; (ii) the predictive equation of Tanuma et al. (TPP-2M) for the measured Mo0.293S0.551C0.156 surface composition (S/Mo = 1.88), and also for stoichiometric MoS2 composition. The fitted function was found to be reasonably consistent with the measured, calculated and predicted IMFPs. We concluded that the measured IMFP value at 0.5 keV was only slightly affected by residual carbon contamination at the Mo disulfide surface.

1. Introduction

Recently, transition-metal dichalcogenides (TMDCs) have attracted substantial research interest due to their electronic, optical and tribological properties. Molybdenum disulfide (MoS2) is one of the TMDCs that has been successfully exfoliated into a very stable single monolayer or few layers-thick material [1]. In particular, atomically thin MoS2 with the structural configuration of two-dimensional and/or three-dimensional atomic layers has emerged as the most promising low-dimensional nanomaterial for novel applications in nanoelectronics [2], photovoltaics [3], valleytronics [4], and hydrogen evolution reaction catalysis [5,6,7].
For the fabrication of MoS2-based nano-materials, mechanical exfoliation [1] of bulk MoS2 crystals is a typical method to isolate and transfer high-quality single- and few-layer MoS2 onto relevant substrates. However, this method is difficult for large-scale production due the lack of control in the thickness, shape, size, and position of molybdenum disulfide layers. Commercial applications require thin film deposition techniques for large-area (cm-scale) growth of continuous films on wafer substrates. Such deposition processes that allow direct synthesis on substrates should be highly scalable and should be an integral part of microelectronic manufacturing. Gas-phase methods like chemical vapor deposition (CVD) [8] and atomic layer deposition (ALD) [9] hold the greatest promise in meeting these requirements.
It is well known that surface properties (composition, morphology, electron transport, etc.) of thin molybdenum disulfide layers play a decisive role for the aforementioned technological applications. The accurate quantification of Mo disulfide surface analysis using electron spectroscopies, e.g., Auger electron spectroscopy (AES), requires knowledge of the electron inelastic mean free path (IMFP) value, which is still unavailable. IMFP, however, characterizes electron transport properties in the surface region of each solid. It has been postulated [10] that the IMFPs that are in agreement with the definition can be calculated from experimental optical data [10,11,12,13,14] or they can be derived from elastic-peak electron spectroscopy (EPES) experiments [15,16]. It has also been demonstrated that EPES is a convenient tool for the determination of the IMFP values from studies of overlayers with thickness in the range of nanometers [17]. Such experiments were recently performed to evaluate IMFPs in the yttrium oxide overlayers grown on yttrium substrate [18]. The IMFPs in materials, for which no IMFP calculations or EPES experiments have been conducted, can be also estimated with unknown accuracy from the TPP-2M predictive equation [19]. This universal equation was developed by Tanuma, Powell and Penn from an analysis of their computed IMFPs for 27 elements and 14 organic compounds. It is based on the Bethe equation for inelastic electron scattering in matter but with some modifications to describe the IMFP dependence on energy for energies less than 200 eV. The TPP-2M IMFPs, similarly to those calculated from optical data, refer to the bulk of a solid.
In the case of the EPES method, it is known that the elastic electron backscattering probability is related to the intensity of the so-called elastic peak in the energy spectrum. Contrarily, the elastic backscattering probability can also be derived from theoretical models describing the electron transport in solids. These models can provide the relation between the elastic peak signal intensity and the IMFP which is the basis for determination of this parameter. Dubus et al. [20] critically compared and discussed the assumptions that simplify different theoretical models of electron transport. As a result of this review, the Oswald–Kasper–Gaukler (OKG) model [21] was selected as being suitable for analytical applications. The formalism of the OKG model was further modified by including relativistic effects [20] and was tested in the analytical practice of EPES [22]. It has been found [23] that the accuracy of the IMFPs calculated from the modified model is comparable with IMFPs from the Monte Carlo simulations of electron trajectories in elemental solids. This model extended to alloys and compounds [24] is applied in the present work for determining the IMFP in Mo disulfide from the elastic peak intensity.
The aim of this work was to examine the surface properties (surface composition, surface morphology, and electron transport) of molybdenum disulfide layer obtained on Si substrate in controlled conditions. For the first time, according to our knowledge, we evaluate the IMFPs in thin Mo disulfide overlayer with different surface stoichiometry for electron transport in the range of 0.5–2 keV, using the relative EPES measurements. These measurements are preceded by AES and scanning electron microscopy (SEM) examination of the surface composition and morphology of the molybdenum disulfide overlayer.

2. Experimental

Samples: MoS2 was mechanically exfoliated by the Scotch-tape method [25] from commercially available bulk MoS2 crystals (SPI Supplies, West Chester, PA, USA, cat. no. #429MM-AB), and then transferred on fine polished and basically undoped <111> Si crystals with resistivity of more than 10,000 Ω·cm (ITME, Warsaw, Poland). This preparation procedure is essentially identical to that used earlier to obtain thick MoS2 flakes [26,27].
For determination of the electron IMFP in the molybdenum disulfide sample, gold foil (0.1 mm–thick, 99.9975%+ purity, bought from Alfa Aesar GmbH and Co KG, Karlsruhe, Germany) was used as a reference material.
Methods of surface characterization and pretreatments: Surface characterization of molybdenum disulfide overlayer of Si substrate were performed using the two electron spectroscopies AES and EPES, and also SEM.
The AES characterization was performed using Microlab 350 spectrometer (Thermo Scientific, Waltham, MA, USA) with a spherical sector analyzer. The Auger spectra were recorded in the differential mode dN(E)/dE at the normal incidence of the primary electron beam of 5 keV. The spectra were quantified using the software Avantage (ver. 4.88, Thermo Fisher Scientific Inc., Waltham, MA, USA) for the Mo M4.5N2.3V (190 eV), S LMM (153 eV) and C KLL (275 eV) peak intensities [28]. Their Auger sensitivity factors extracted from this software package were 1.278, 4.758 and 0.614, respectively. The Auger spectra were obtained from the sample surfaces which were initially sputter-cleaned by 3 kV Ar+ ions (a maximal ion current was about 1.3 μA) rastered over a 3 × 3 mm2 surface area at an incidence angle of 30° with respect to surface normal. This sputter-cleaning was maintained for 30 s prior to EPES studies.
Elastic-peak intensities for both the Mo disulfide surface and the surface of Au reference material were also recorded using a Microlab 350 spectrometer at electron energies of 500, 1000, 1500 and 2000 eV. The Au reference material has been recently indicated as the preferable standard material [29] having the known energy dependence of the IMFP recommended for the EPES method [10]. In relative EPES experiments, the electron gun was located at the normal to the surface and the analyzer axis was located at 60° to the surface normal. The acceptance half-angle of the analyzer was 6°. The EPES procedure of relative measurements applied in the present work was already described in [16]. The electron energy dependence of the IMFP, characterizing electron transport, for the surface composition of the analyzed Mo disulfide sample was determined using the software package EPES [30] which allows elastic-peak spectra processing and Monte Carlo simulations of electron trajectories in solids.
Before the EPES measurements, the surfaces of Mo disulfide and Au samples were also cleaned by sputtering with 3 kV argon ions to remove surface contamination. After 30 s of sputtering, oxygen and carbon contaminants were entirely removed from the surface region of gold; however, some residual carbon contamination at the molybdenum disulfide surface was still detected by AES analysis.
Surface morphology of the Mo disulfide flakes was also studied by the Microlab 350 (Thermo Scientific, Waltham, MA, USA) apparatus, which is additionally equipped with SEM technique. The field emission gun (FEG) was used to recorded SEM images at beam energy 3 kV. At low excitation energy, real topography of the flake surfaces and their uniformity in terms of thickness could be observed. Moreover, the homogeneity of the chemical composition of the analyzed flakes was confirmed by performing chemical composition maps for the analyzed elements: S, Mo and Si using the same excitation energy.

3. Results and Discussion

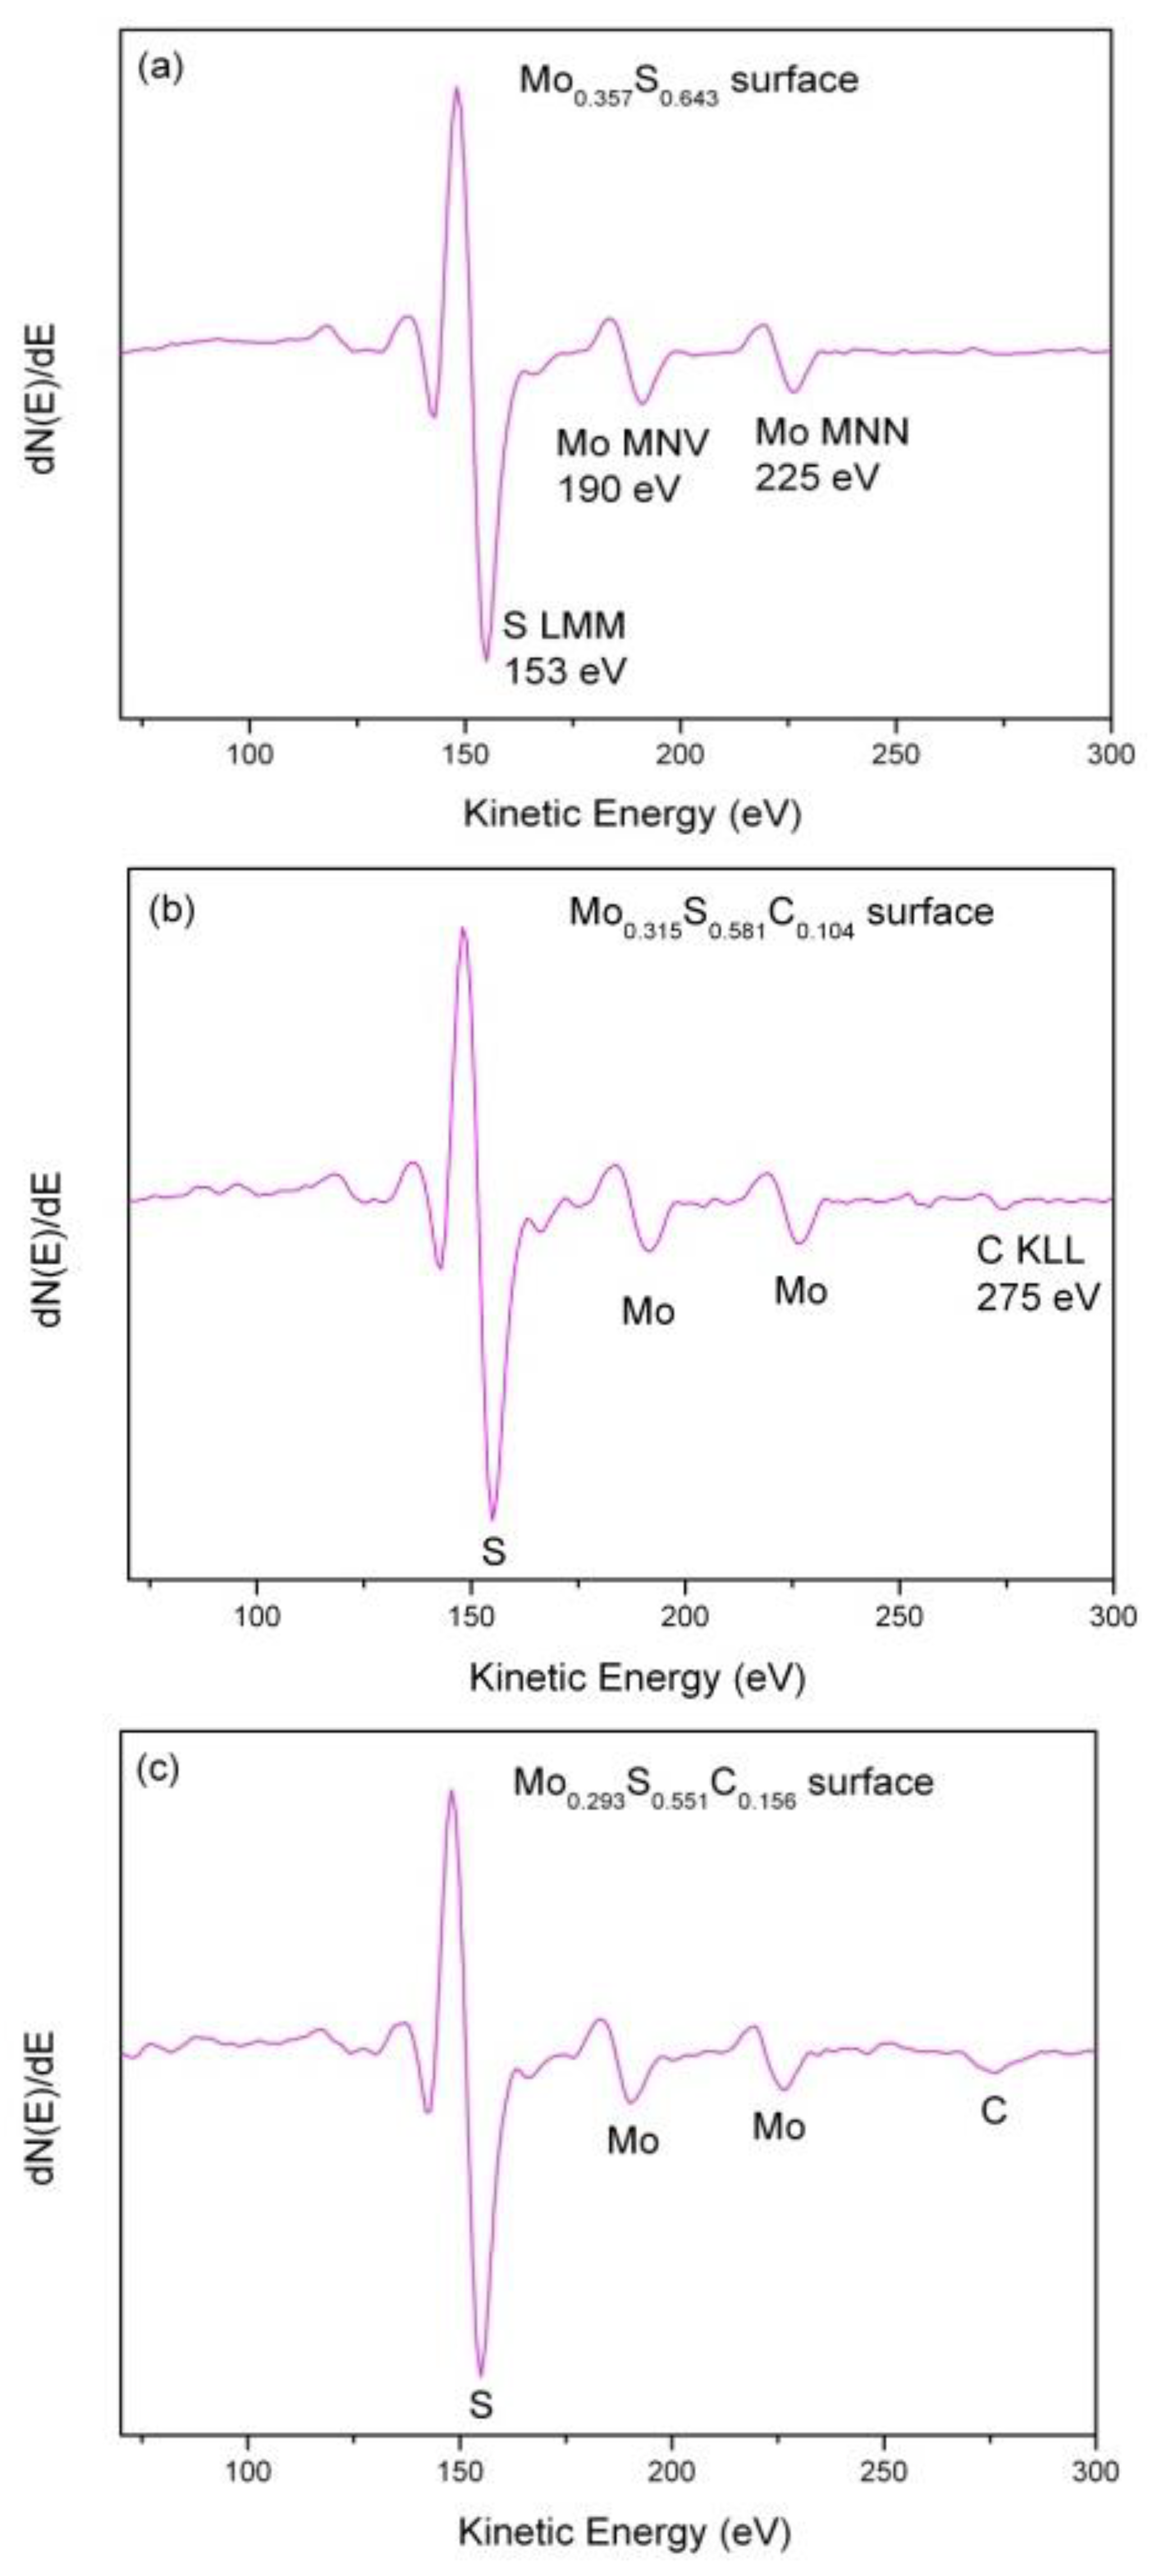
3.1. Auger Electron Spectroscopy (AES) Characterization

The surface composition of molybdenum disulfide/silicon heterostructures was examined by AES analysis. Figure 1 shows the Auger spectra from the three Mo disulfide surfaces after 3 kV Ar+ ion sputtering for 30 s. This is a standard cleaning procedure to minimalize and/or remove surface contamination (i.e., removing 4.8 nm in depth of material) prior to EPES measurements. We note only molybdenum (the two prominent Auger MNV and MNN peaks at 190 and 225 eV, respectively) and sulfur (the Auger LMM peak at 153 eV) in Figure 1a while Figure 1b,c shows additionally carbon (the Auger KLL peak at 275 eV) at the sputter–cleaned surfaces. As a result of quantitative Auger analysis, a final elemental composition of each Mo disulfide surface can be expressed as Mo0.357S0.643, Mo0.315S0.581C0.104, and Mo0.293S0.551C0.156. The resulting S/Mo atomic concentration (AC) ratios are found to be 1.80, 1.84, and 1.88, respectively, and these values are smaller than the MoS2 value. There is an excellent agreement between our AES results and the recently reported result of quantitative X-ray photoelectron spectroscopy (XPS) analysis for the exfoliated (0001) MoS2 surface after annealing under ultrahigh vacuum (UHV) conditions [31]. In this case, a sulfur-deficient surface composition of MoS1.8 was found.
As shown in Figure 1b,c, the as-sputtered MoS2 surfaces still contain about 10–15 at.% of carbon contamination, most likely caused by mechanical exfoliation. In addition, there is the lack of any Si peaks originating from the substrate material in the AES spectra (Figure 1) recorded from Mo disulfide/Si heterostructures.
To estimate the thickness of the molybdenum disulfide (Mo0.357S0.643) or the molybdenum disulfide-carbon (Mo0.315S0.581C0.104, Mo0.293S0.551C0.156) overlayers determined by an AES analysis depth, we should know the IMFPs for Auger electrons emitted by S, Mo and C atoms at the kinetic energies 153 eV, 190 eV and 275 eV [28], respectively. The TPP-2M predictive formula implemented in the NIST Electron Inelastic-Mean-Free-Path Database (SRD 71) [32] were used to calculate these IMFPs in the considered layers. Among the three elements, the smallest IMFP value of about 0.59 ± 0.08 nm was found for 153 eV LMM electrons of sulfur while the largest value of IMFP is equal to 0.82 ± 0.12 nm for C KLL electrons at 275 eV. Thus, the Mo disulfide layer was found to be at least 1.77 nm thick under the present AES measurement conditions (95% of the measured Auger electrons originate from the near-surface region up to a depth of 3 IMFPs). If this layer consisted of carbon atoms, its thickness can be larger than the value 3 × 0.82 nm = 2.46 nm.
Influence of surface carbon on the EPES-determined IMFP for molybdenum disulfide will be explained later.

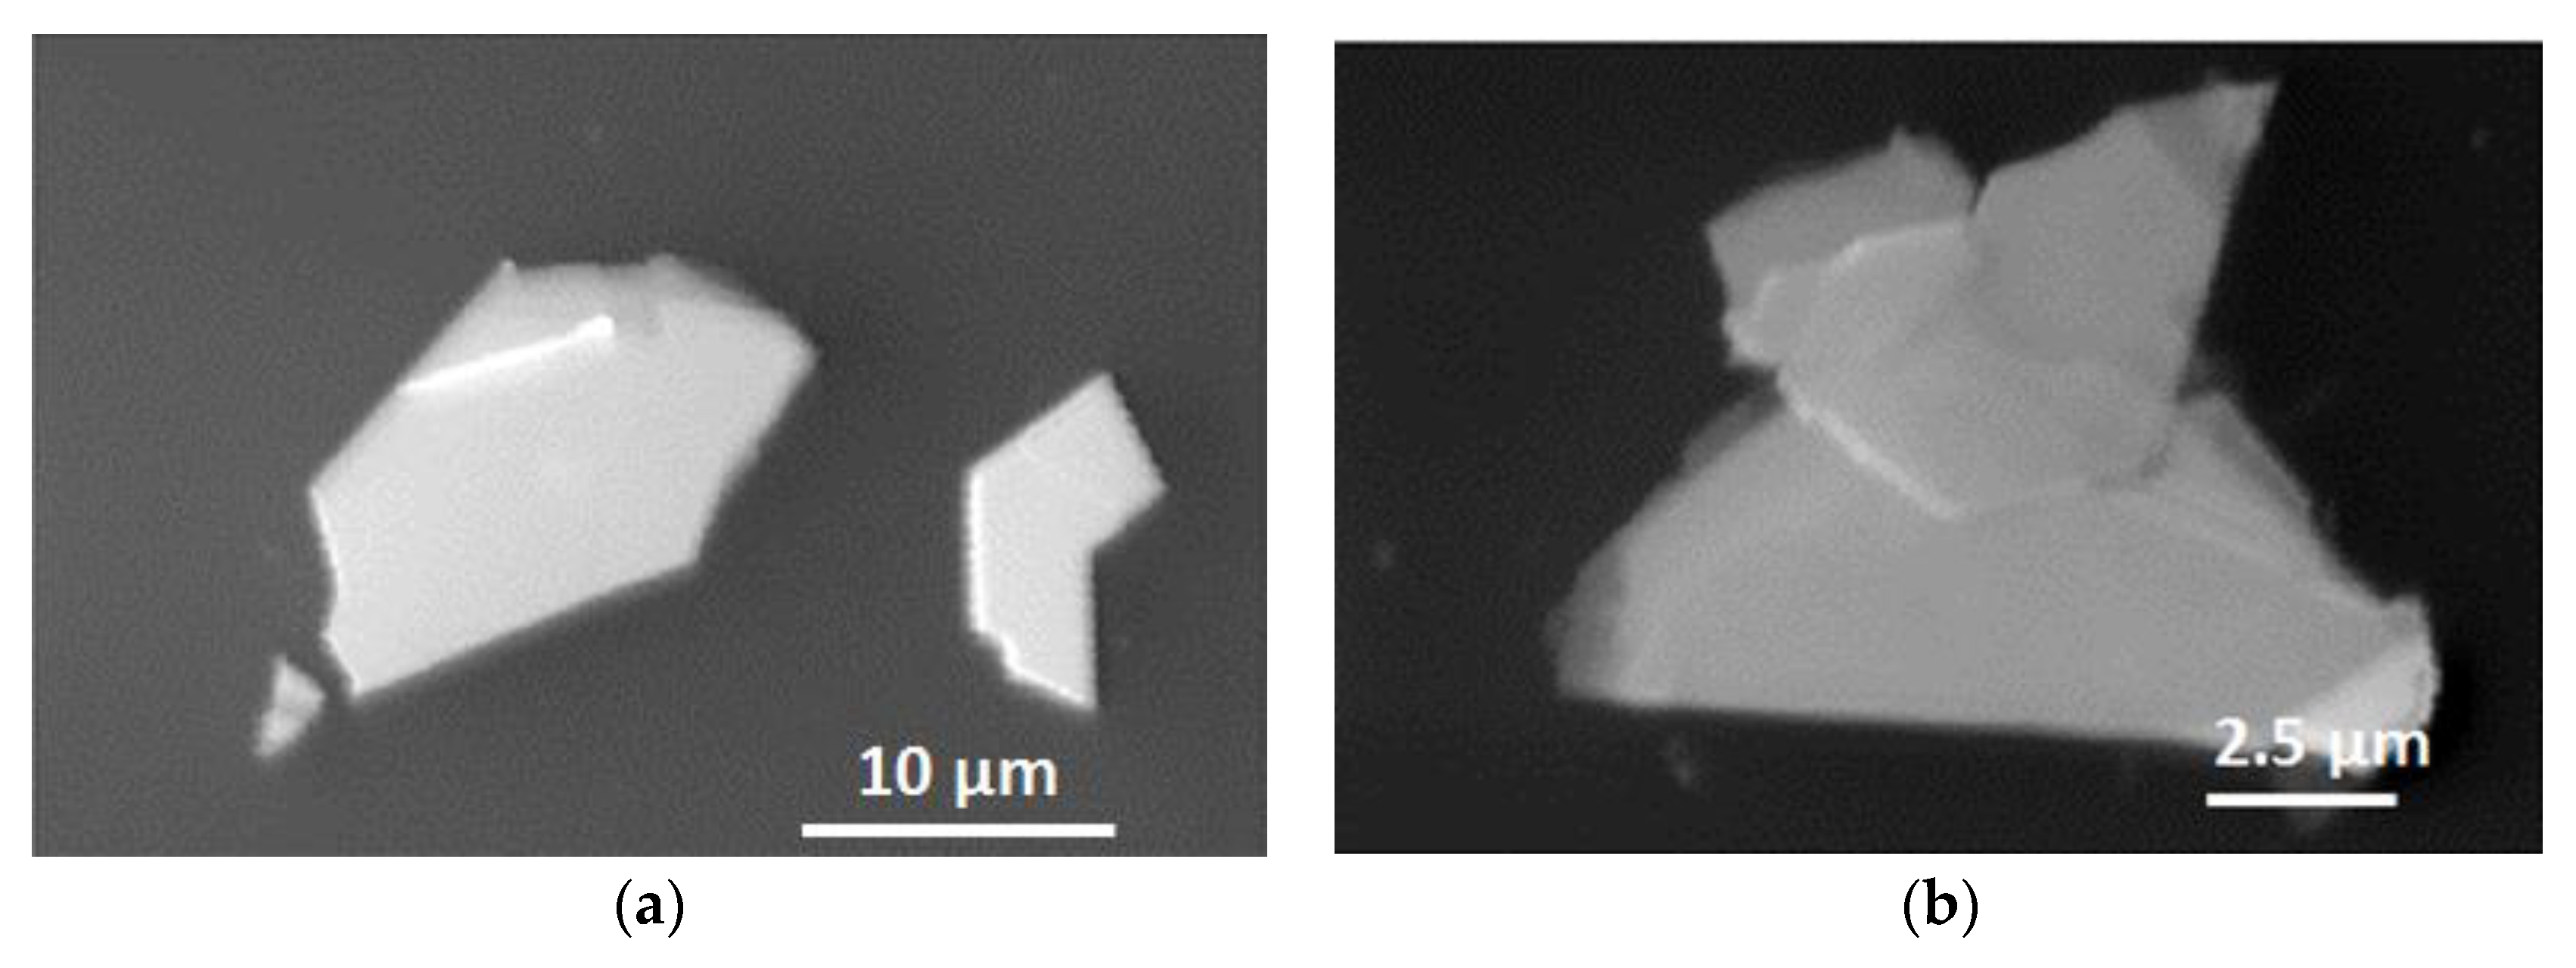
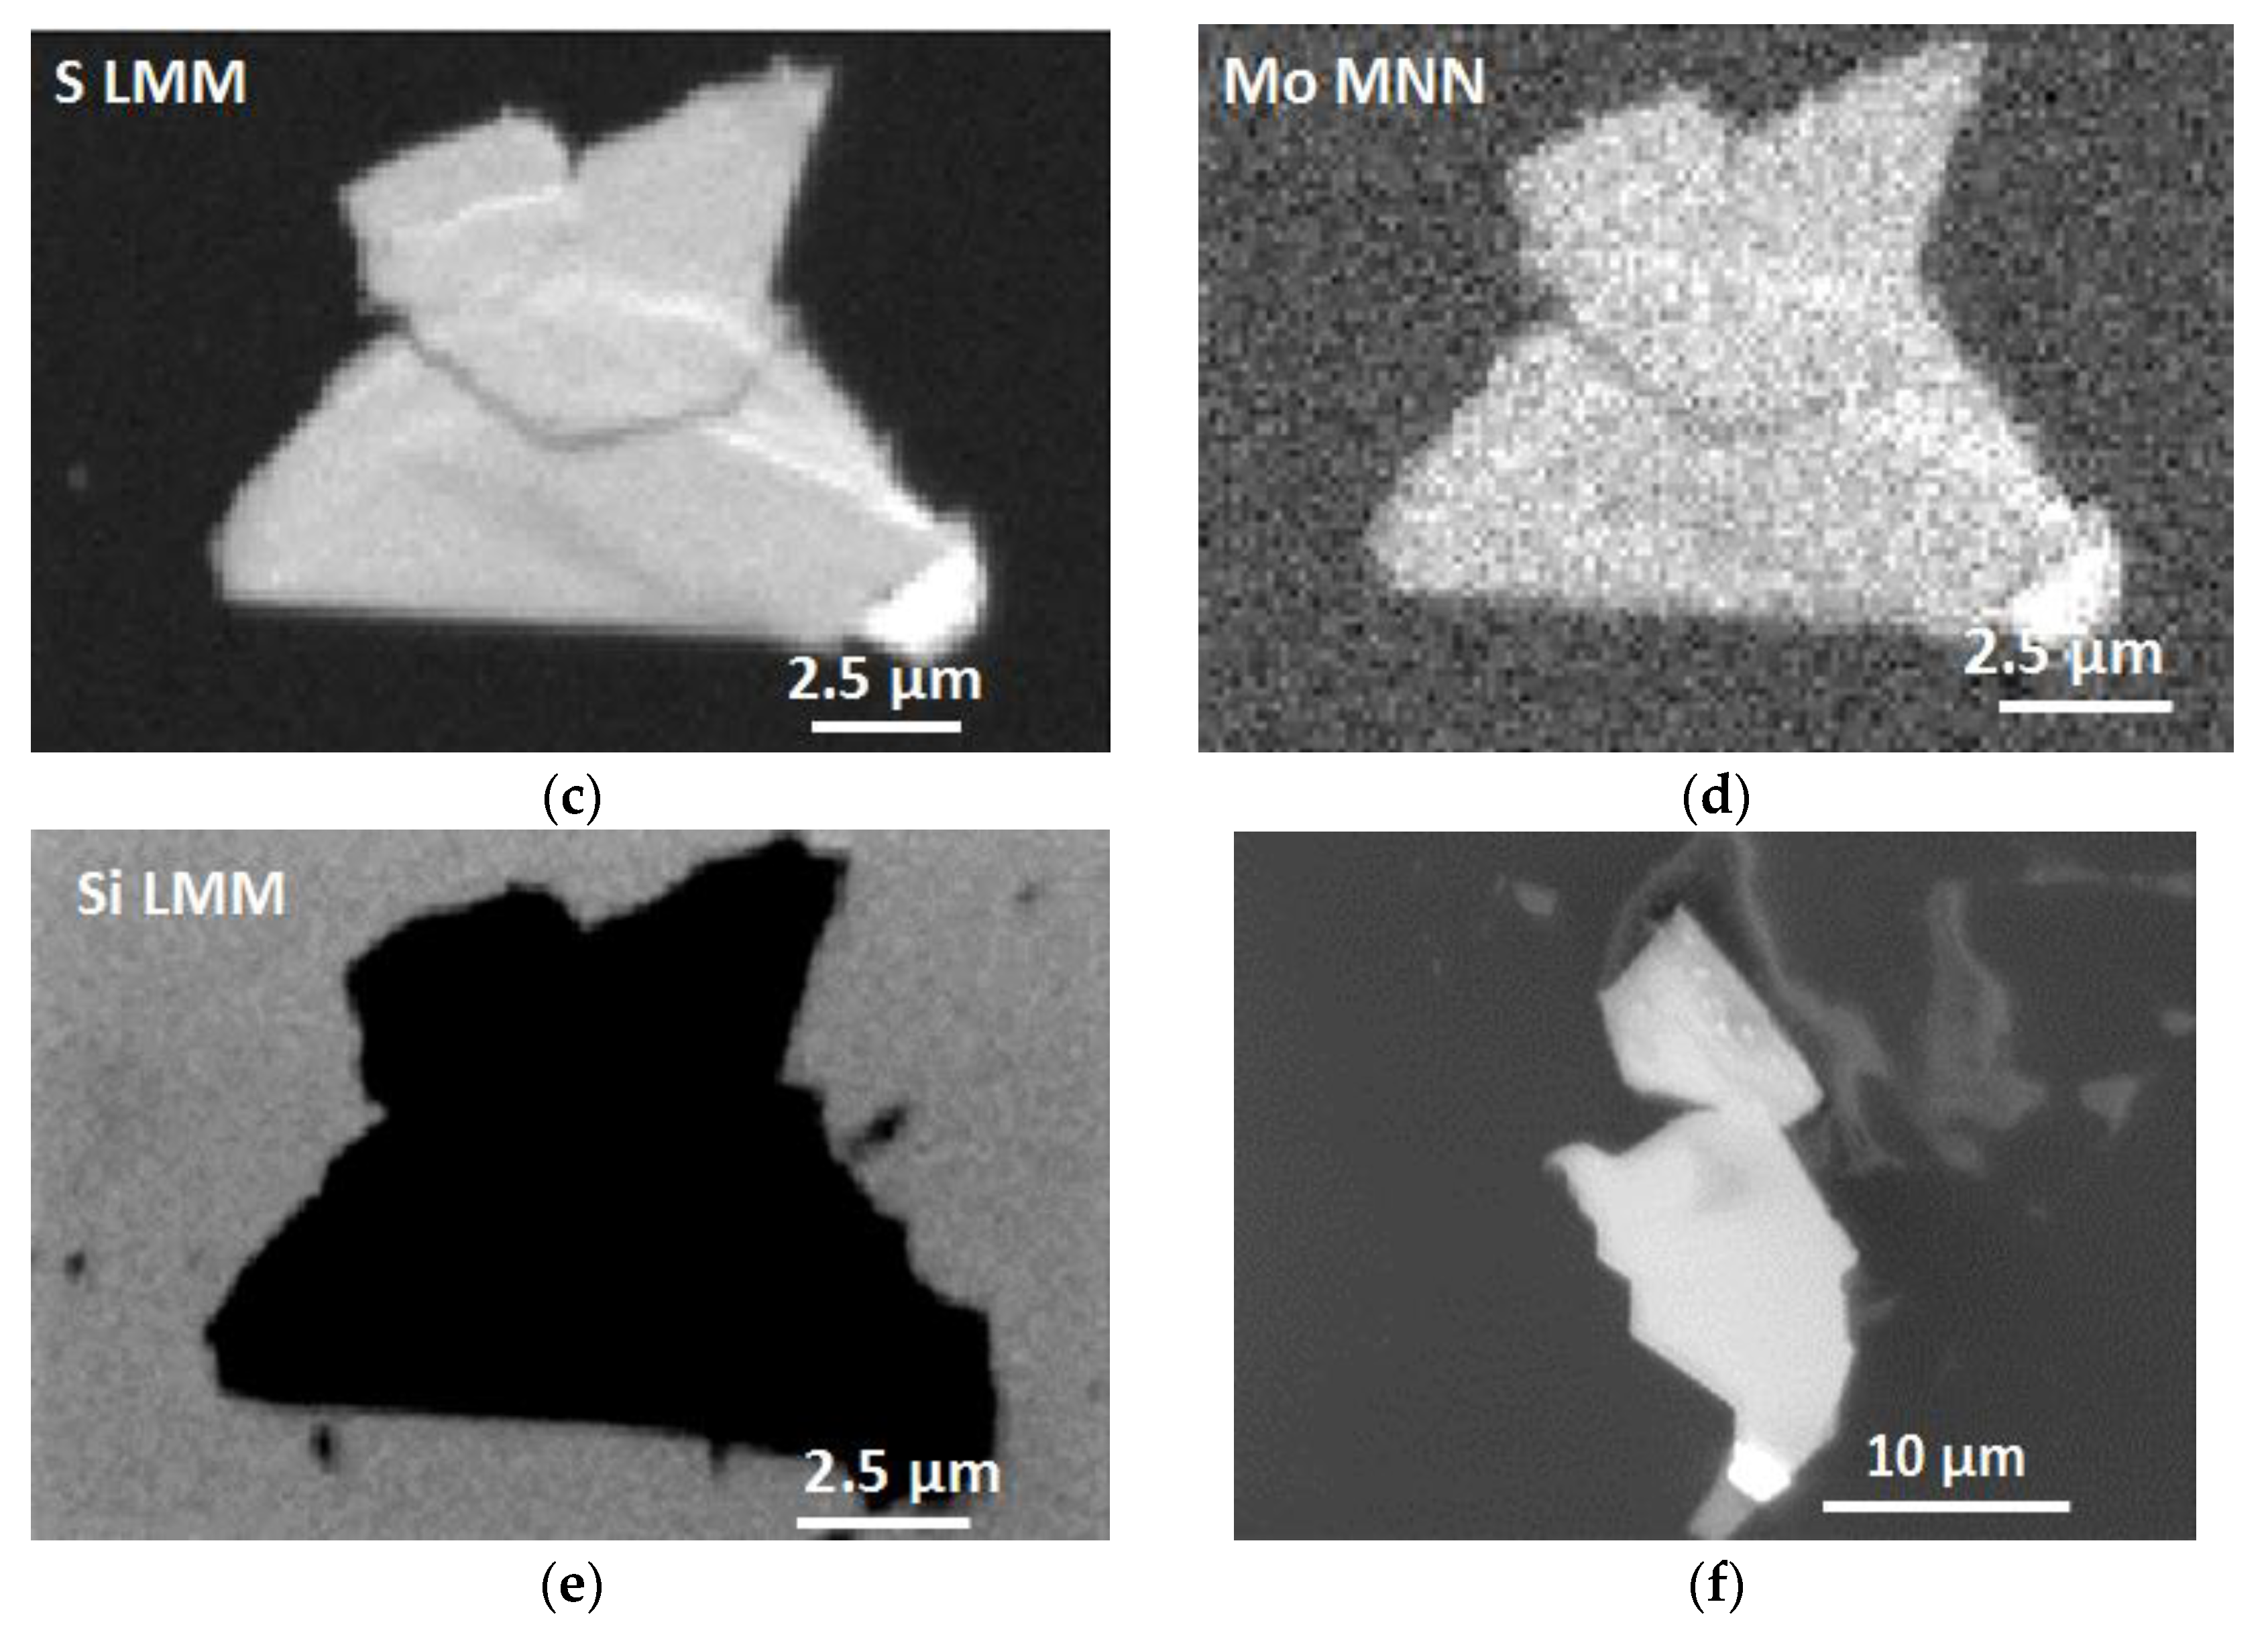
3.2. Scanning Electron Microscopy (SEM) Characterization

The morphology of molybdenum disulfide flakes exfoliated on silicon substrates was characterized by SEM. We conducted this characterization on the same flakes, which were earlier analyzed by AES. Figure 2a shows the SEM images of Mo disulfide flakes exhibiting the bi-component Mo0.357S0.643 surface (the large flake seen in Figure 2a; AES/EPES-analyzed surface area is located around the center of this flake), and also both the three-component Mo0.315S0.581C0.104 (AES/EPES-analyzed surface area is located around the central zone of partially overlapping flakes seen in Figure 2b) and Mo0.293S0.551C0.156 (the large flake seen in Figure 2f; AES/EPES-analyzed surface area is located near the flake center) surfaces. The SEM analysis reveals single crystalline small-area (up to 15 µm in lateral size) of Mo disulfide flakes having polygonal or near-triangular shapes, as shown in Figure 2. It is important to note that such irregular-edged flakes exhibit high crystal quality and thickness uniformity. Moreover, the distribution images of the Auger S LMM, Mo MNN and Si LMM signals from the surface of the flake presented in Figure 2b shows unambiguously homogeneous distribution of S and Mo atoms (Figure 2c–e). It is noteworthy that in Figure 2e there is no signal from Si, which means that the analyzed surface area has the appropriate thickness for EPES analysis and homogeneous chemical composition. The S LMM and Mo MNN Auger signals implies the presence of molybdenum sulfide flake on the Si substrate.

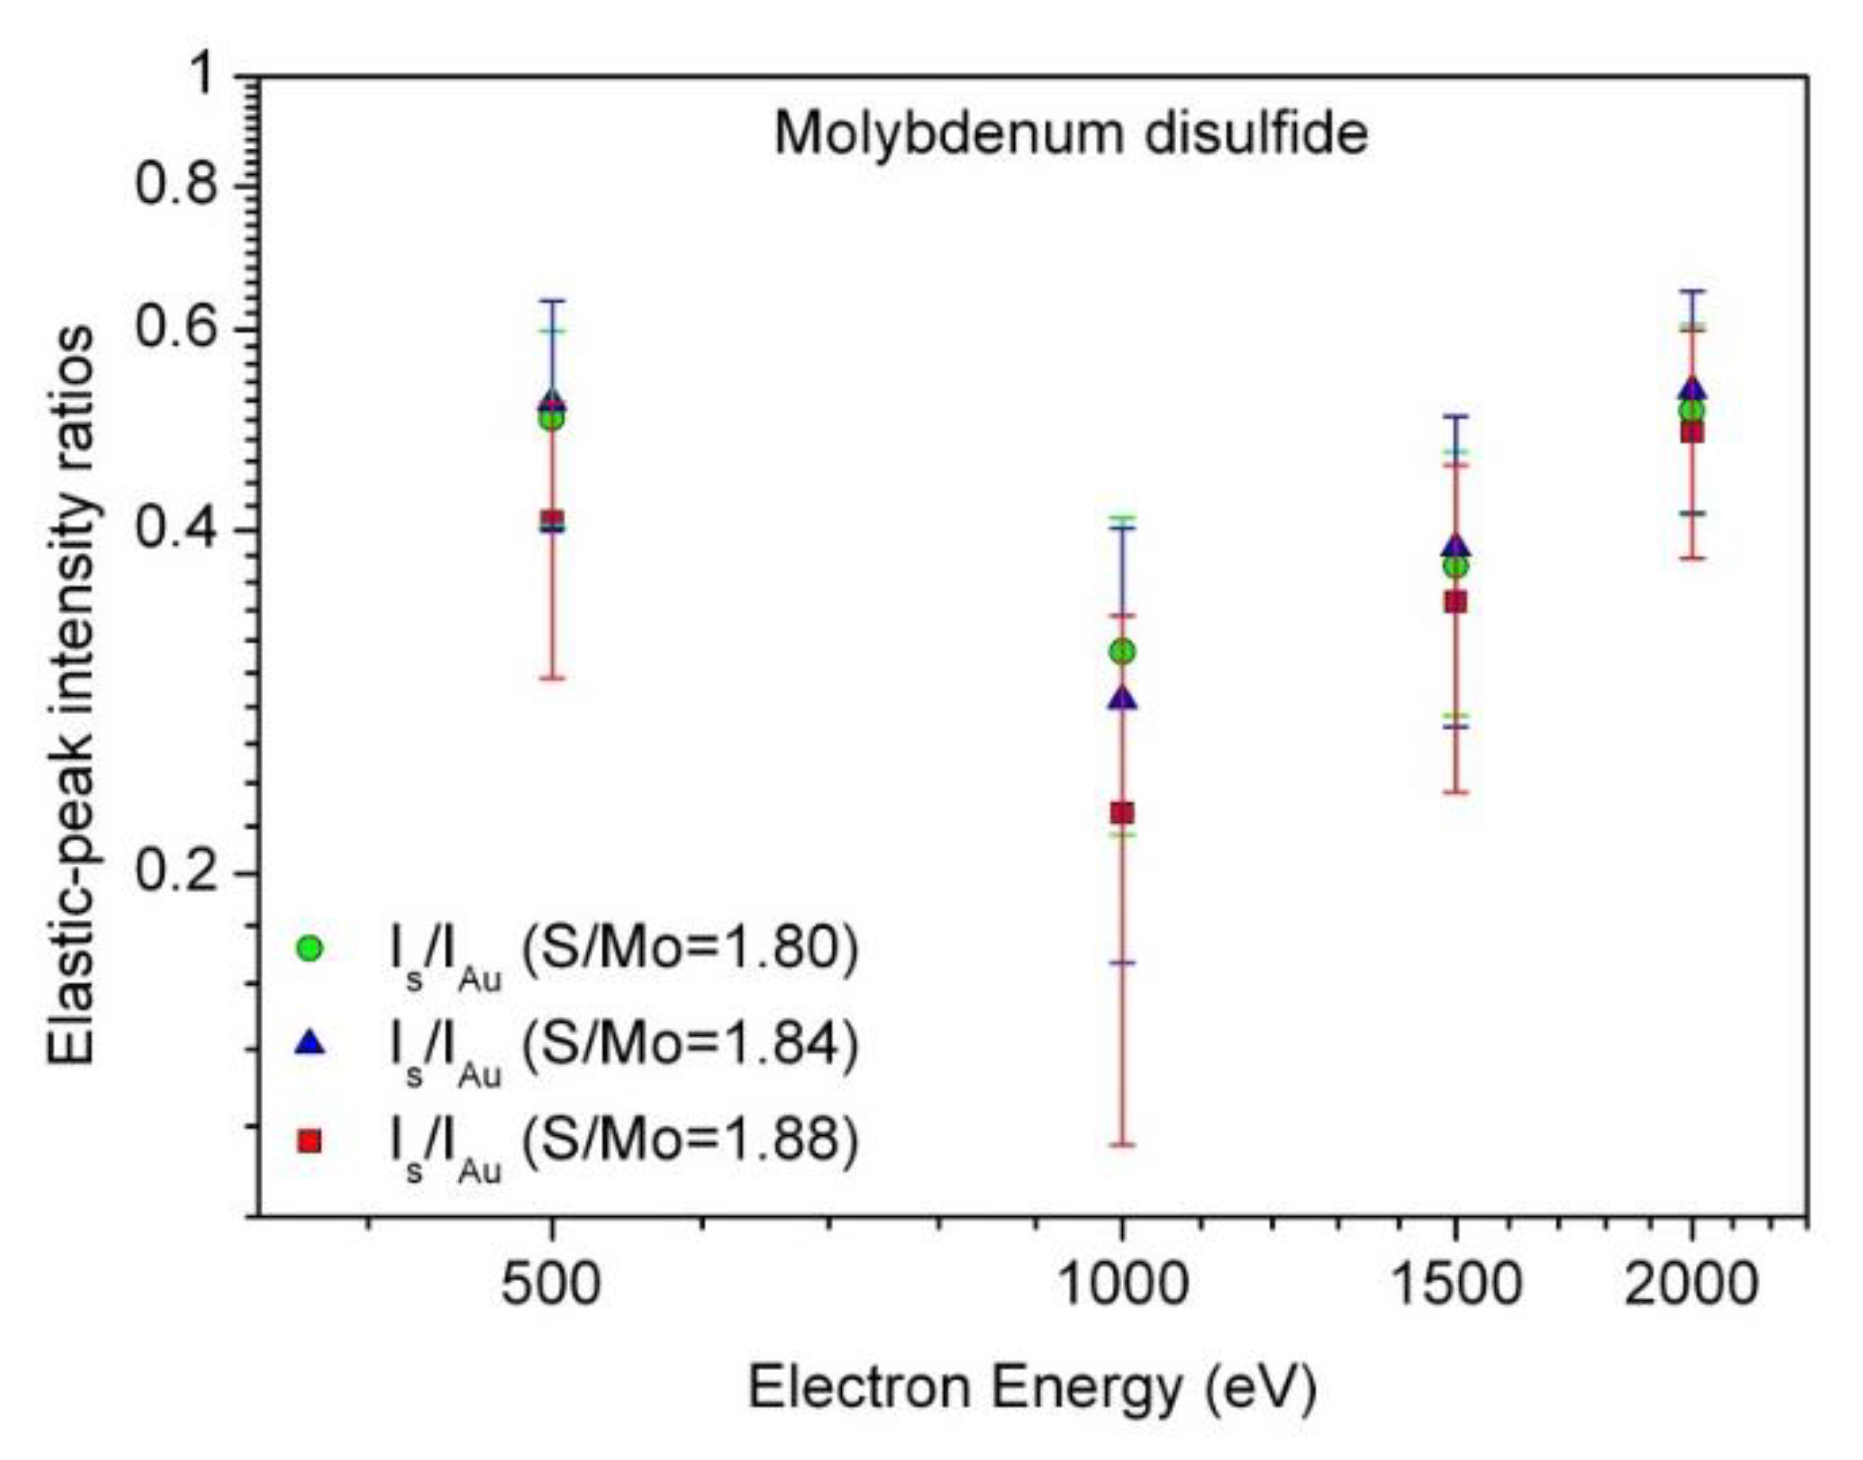
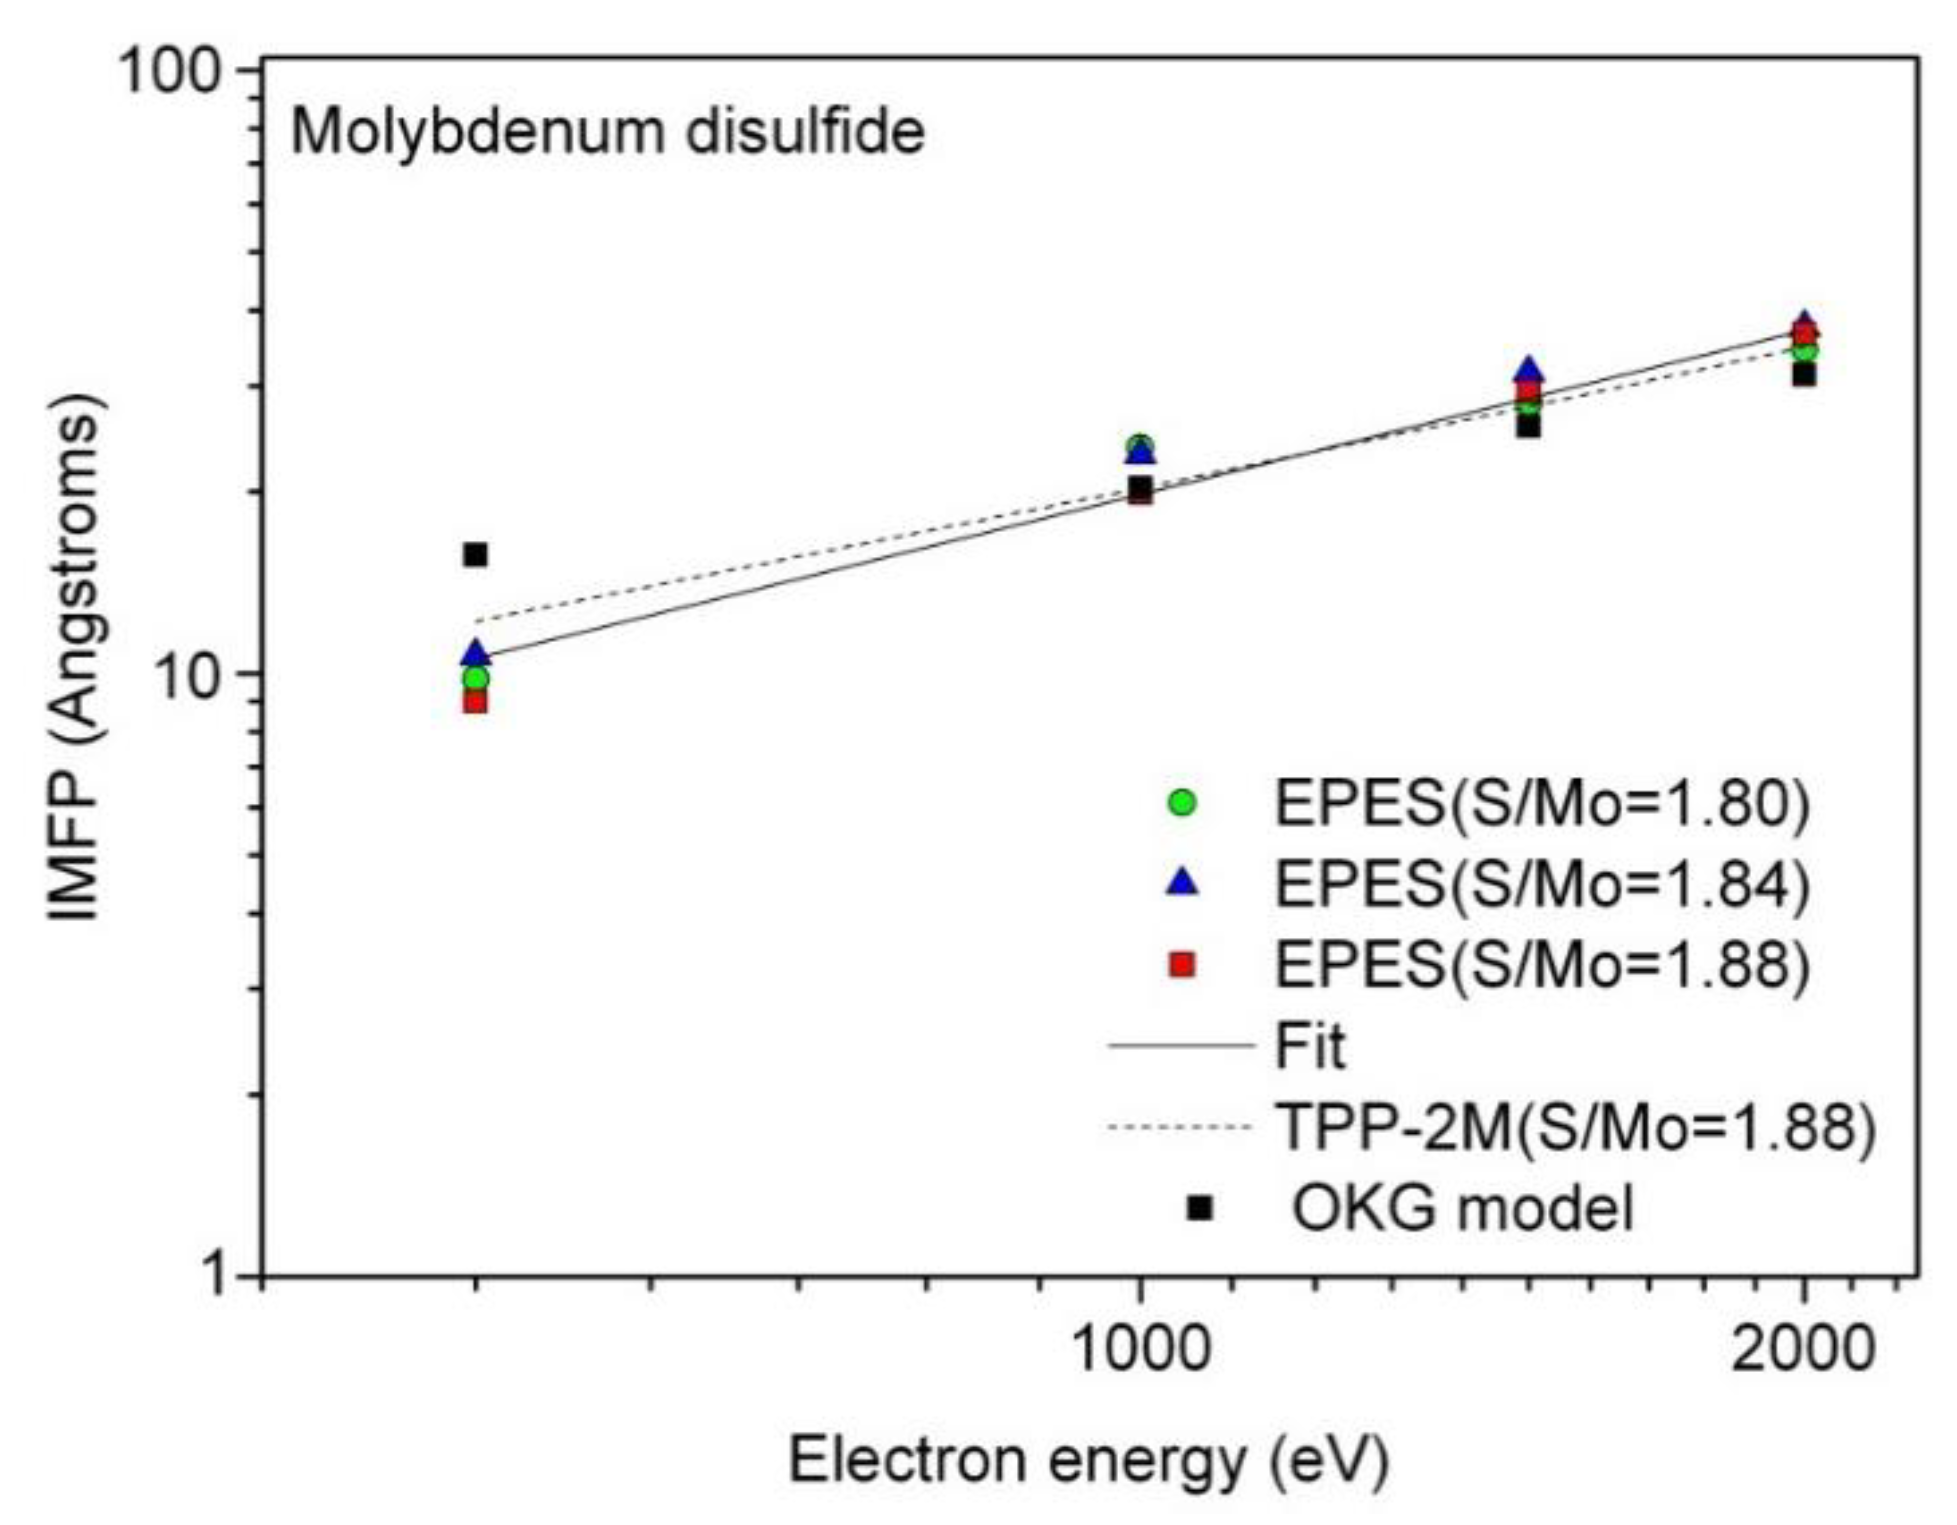
3.3. Elastic-Peak Electron Spectroscopy (EPES) Characterization: Evaluation of the Electron Inelastic Mean Free Path (IMFP)

To evaluate the IMFPs and their energy dependence, the intensity of the measured elastic peaks were determined using the software EPES [30]. Figure 3 shows the ratios of measured elastic-peak intensity IS for the Mo disulfide flake surfaces with S/Mo atomic contents ratios ranging from 1.80 to 1.88 to the corresponding intensity IAu for the Au standard with error bars, as functions of electron energy.
We observe that the intensity ratios for the surface S/Mo ratio of 1.88 are the smallest in an entire energy range below 2000 eV. As follows from Figure 3, these values are smaller by 23–39% than those obtained for the S/Mo ratios of 1.8 and 1.84 in the energy range 500–1000 eV. The observed differences among the Is/IAu values can be explained mainly by the influence of surface inelastic-electron excitations. It is well known that the elastic-peak intensity for both the studied sample and the standard material is diminished by the surface excitations, and some deviations are possible if the surface excitations for both materials differ considerably. Generally, we may state that the surface excitation effects decrease with increasing electron energy. The surface excitation effects are not accounted for in the presently used software package EPES. Another source of the noticeable differences considered here can be due to the presence of carbon contamination in the surface region of Mo disulfide (with the S/Mo ratios of 1.84 and 1.88), especially at 500 eV. The measured elastic-peak intensities were finally used for determining the IMFP values in MoS2.
Figure 4 and Table 1 show comparison of the EPES IMFPs evaluated for the considered surface stoichiometries (in S/Mo AC ratios) and electron energies, and the values resulting from the TPP-2M predictive formula [19] for the Mo0.293S0.551C0.156 (the S/Mo AC ratio of 1.88) and MoS2 surfaces. Here are the IMFPs calculated using the OKG theoretical model [21] for the Mo0.293S0.551C0.156 surface. There are also the function fitted to the EPES IMFPs measured for energies between 500 eV and 2000 eV.
The following function was applied in Figure 4 for the fit [10]:
λ f i t = k E p  
where λfit is the IMFP obtained from the fit (in angstroms), E is the electron energy (in eV) and k and p are fitting parameters. The resulting values of k and p are 0.0289 and 0.946, respectively. Fit quality was assessed by calculating the percentage deviation and the mean percentage deviation between the measured and fitted IMFPs, as we explain below.
The IMFP values, λ, can be obtained as well from the NIST Database [32] which contains IMFPs calculated from experimental optical data [10,11,12,13,14] and has an option of calculating the IMFPs from the TPP-2M predictive formula [19] for any material, as a function of electron energy E in the range from 50 eV to 2000 eV according to:
λ = E E p 2 [ β l n ( γ E ) ( C / E ) + ( D / E 2 ) ]
β = 0.10 + 0.944 E p   2 + E g 2 + 0.069 ρ 0.1  
γ = 0.191 ρ 0.5  
C = 1.97 0.91 U  
D = 53.4 20.8 U  
U = N v ρ M = E p 2 829.4
where Ep = 28.8(Nvρ/M)1/2 is the free-plasmon energy (in eV), Nv is the number of valence electrons per atom (for elemental solids) or molecule (for compounds), ρ is the density (in g·cm−3), M is the atomic or molecular weight and Eg is the band-gap energy (in eV). For stoichiometric MoS2, values of Eg, Ep, and ρ are 1.8 eV [33,34], 21.72 eV and 5.06 g·cm−3 [35], respectively, and Nv = 18 is calculated using the sum of contributions from molybdenum and sulfur. For molybdenum disulfide contaminated by amorphous carbon, ρ = 4.75 g·cm−3 (Mo0.315S0.581C0.104) or ρ = 4.6 g·cm−3 (Mo0.293S0.551C0.156) are calculated as a relative contribution of molybdenum disulfide (5.06 g·cm−3) and amorphous carbon (ρ = 2.1 g·cm−3) [35].
As shown in Figure 4 together with the values listed in Table 1, except for the smallest electron energy of 500 eV, experimental values are found to be larger by 0.5–13% than the predicted values, depending on the energy. The differences between IMFPs related to MoS2 and carbon-containing Mo disulfide surfaces are estimated to be up to 0.46 nm for electron energies of 500–2000 eV.
We also made comparisons between the experimental and TPP-2M IMFPs and the corresponding IMFPs from the OKG theoretical model [21]. As follows from Figure 4 and Table 1, the latter IMFPs are smaller by 5.1–13.6% and 8.3–22.3% than those obtained from other methods at energies of 1500 and 2000 eV, respectively. In contrast, the IMFP from the OKG calculations has the largest value (1.57 nm) at 500 eV, and it is almost identical to the remaining three IMFPs considered here at 1000 eV.
In order to provide a quantitative description of the fit shown in Figure 4, both the percentage deviation Δj from the fitted function and the mean percentage deviation Rj from the fitted function were calculated from:
Δ j = 100 ( λ j λ f i t ) λ f i t  
R j = 100 1 r j = 1 r | λ j λ f i t λ f i t |  
where λj is a measured IMFP for a given Mo disulfide surface at a particular energy, and r is the number of IMFP measurements.
Table 2 shows the percentage deviations Δj between the measured and fitted IMFPs using Equation (8), as a function of electron energy for each examined surface with respect to the Au standard. The mean percentage deviation Rj from the fitted function, evaluated from Equation (9) (7.11%), is also shown in Table 2. The smallest Δj values were found for the surface exhibiting the S/Mo AC ratio of 1.88 at electron energies of 1000 eV (0%) and 1500V (+0.34%), while the largest deviation of +19.09% appear for the disulfide surface with the S/Mo AC ratio of 1.8 at the energy of 1000 eV. The Rj value of 7.11% can be considered acceptably small, so that the fitted function (Equation (1)) was generally consistent with the energy dependence of the EPES IMFPs.
To quantify the comparison of the measured and approximated by Equation (1) IMFPs for the examined Mo disulfide surfaces (solid line in Figure 4) and the IMFPs resulting from the TPP-2M predictive formula [19] for stoichiometric MoS2 (Table 1), we calculated the percentage deviation Δf and the mean percentage deviation Rf. These deviations, in similarity to Equations (8) and (9), are defined as follows:
Δ f = 100 ( λ f i t λ T P P ) λ T P P
R f = 100 1 r j = 1 r | λ f i t λ T P P λ T P P |
where λTPP denotes the IMFP value estimated from the TPP-2M formula (Equations (2)–(7)) [19] for MoS2 at a particular electron energy. Energy dependence of the percentage deviation Δf (Equation (10)) and the value of the mean percentage deviation Rf (Equation (11)) are shown in Table 2 as well.
Close inspection of Table 2 reveals the deviation Δf to be in the range from +0.5% to −13.44%, and the largest value of this deviation is visible at the electron energy of 500 eV. The Rf value resulting from Equation (11) is equal to 8.77%, and it can be considered acceptably small. Generally, good agreement is found between the measured and approximated by Equation (1) IMFPs and those predicted from the TPP-2M formula [19]. The EPES results prove the high reliability of this formula for the Mo disulfide.
To evaluate the influence of carbon contamination content (up to 15.6 at.%) on the present EPES IMFPs in Mo disulfide, we use values of the information depth (ID) of EPES measurements involving elastic electron backscattering for carbon [18]. These calculations for carbon have been performed at electron energies 0.5–2 keV for the present EPES measurement configuration. Assuming 95% of electron trajectories in a given experimental geometry and for an electron energy of interest, the calculated EPES ID values were found to be 1.11, 1.91, 2.63 and 3.30 nm for energies of 0.5, 1, 1.5 and 2 keV [18]. Except for the lowest energy of 0.5 keV, these values are smaller than IMFPs at energies between 1 keV and 2 keV (Figure 4, Table 1). Therefore, the presence of carbon contamination in the near surface region of Mo disulfide has only a small effect on the EPES-derived IMFP at 0.5 keV (Figure 4, Table 1). We also did not detect any Mo oxides [36].

4. Conclusions

In the current work, we characterized thin Mo disulfide crystals obtained using mechanical exfoliation [26,27] and deposited on Si substrates. The surface chemical composition, morphology and electron transport phenomena of prepared Mo disulfide flakes were characterized ex-situ by the combination of AES, SEM and EPES. Prior to the EPES measurements, AES analysis showed that the Mo disulfide overlayer with the thickness exceeding 1.77 nm revealed the maximal AC ratio of S to Mo of 1.88, close to stoichiometric MoS2 (2.0). It revealed also the maximal content of about 15 at.% of residual surface carbon. On the basis of SEM results, the presence of single crystalline Mo disulfide flakes exhibiting high crystal quality and thickness uniformity was established. It was found that EPES based on the Au standard can be a useful method for determination of reliable IMFPs in the Mo disulfide.
According to our knowledge, we evaluated for the first time the IMFP values in MoS2 with different surface stoichiometry for 0.5–2 keV electrons, using relative EPES measurements. Experimental IMFPs were approximated by a formula: k E p , Equation (1), with the parameters k = 0.0289 and p = 0.946. Experimental IMFPs were compared with the IMFPs resulting from other two sources. Calculations were based on the formalism of the Oswald et al. model [21]. We used also the TPP-2M formula for predicting IMFPs [19]. The EPES IMFPs were found to be in good agreement with the corresponding IMFPs derived from the Oswald et al. model and the TPP-2M predictive formula representing by Equations (2)–(7). Experimental IMFP values were larger by 0.5–13% than the predicted IMFP values in the energy range of 1–2 keV. The Rf deviation from Equation (11) between the EPES IMFPs and the TPP-2M IMFPs was equal to 8.77%. The influence of surface carbon on the EPES IMFPs for molybdenum disulfide was found to be negligibly small (up to 0.46 nm) for electron energies of 0.5–2 keV, and it was the largest at 0.5 keV, as expected.

Author Contributions

M.K.: Conceptualization, Investigation, Formal analysis, Data curation, Writing—original draft and editing. M.P.: Methodology, Investigation, Formal analysis, Writing—review and editing, Supervision. R.S.: Methodology, Investigation, Writing—review and editing. A.J.: Methodology, Investigation, Writing—review and editing. All authors have read and agreed to the published version of the manuscript.

Funding

R.S. acknowledges research support of the National Science Center, Poland, grant no. 2017/27/B/ST4/00697.

Conflicts of Interest

The authors declare no conflict of interest.

References

  1. Huang, X.; Zeng, Z.; Zhang, H. Metal dichalcogenide nanosheets: Preparation, properties and applications. Chem. Soc. Rev. 2013, 42, 1934–1946. [Google Scholar] [CrossRef]
  2. Wang, Q.H.; Kalantar-Zadeh, K.; Kis, A.; Coleman, J.N.; Strano, M.S. Electronics and optoelectronics of two-dimensional transition metal dichalcogenides. Nat. Nanotechnol. 2012, 7, 699–712. [Google Scholar]
  3. Feng, J.; Qian, X.; Huang, C.; Li, J. Strain-engineered artificial atom as a broad-spectrum solar energy funnel. Nat. Photonics 2012, 6, 866–872. [Google Scholar] [CrossRef]
  4. Mak, K.F.; McGill, K.L.; Park, J.; McEuen, P.L. The valley Hall effect in MoS2 transistors. Science 2014, 344, 1489–1492. [Google Scholar] [CrossRef] [PubMed] [Green Version]
  5. Karunadasa, H.I.; Montalvo, E.; Sun, Y.; Majda, M.; Long, J.R.; Chang, C.J. A molecular MoS2 edge site mimic for catalytic hydrogen generation. Science 2012, 335, 698–702. [Google Scholar] [CrossRef] [PubMed] [Green Version]
  6. Lukowski, M.A.; Daniel, A.S.; Meng, F.; Forticaux, A.; Li, L.; Jin, S. Enhanced hydrogen evolution catalysis from chemically exfoliated metallic MoS2 nanosheets. J. Am. Chem. Soc. 2013, 135, 10274–10277. [Google Scholar] [CrossRef] [PubMed]
  7. Xie, J.; Zhang, H.; Li, S.; Wang, R.; Sun, X.; Zhou, M.; Zhou, J.; Lou, X.W.; Xie, Y. Defect-rich MoS2 ultrathin nanosheets with additional active edge sites for enhanced electrocatalytic hydrogen evolution. Adv. Mater. 2013, 25, 5807–5813. [Google Scholar] [CrossRef] [PubMed]
  8. Kim, S.-Y.; Kwak, J.; Ciobanu, C.V.; Kwon, S.-Y. Recent developments in controlled vapor-phase growth of 2D group 6 transition metal dichalcogenides. Adv. Mater. 2019, 31, 1804939. [Google Scholar] [CrossRef]
  9. Kalanyan, B.; Beams, R.; Katz, M.B.; Davydov, A.V.; Maslar, J.E.; Kanjolia, R.K. MoS2.thin films from a (Nt Bu)2 (NMe2)2 Mo and 1-propanethiol atomic layer deposition process. J. Vac. Sci. Technol. 2019, 37. [Google Scholar] [CrossRef]
  10. Powell, C.J.; Jablonski, A. Evaluation of calculated and measured electron inelastic mean free paths near solid surfaces. J. Phys. Chem. Ref. Data 1999, 28, 19–62. [Google Scholar] [CrossRef]
  11. Penn, D.R. Electron mean-free-path calculations using a model dielectric function. Phys. Rev. 1987, B 35, 482–486. [Google Scholar] [CrossRef]
  12. Tanuma, S.; Powell, C.J.; Penn, D.R. Calculations of electron inelastic mean free paths: VIII. Data for 15 elemental solids over the 50–2000 eV range. Surf. Interface Anal. 2005, 37, 1–14. [Google Scholar] [CrossRef]
  13. Tanuma, S.; Powell, C.J.; Penn, D.R. Calculation of electron inelastic mean free paths. (IMFPs) VII. Reliability of the TPP-2M IMFP predictive equation. Surf. Interface Anal. 2003, 35, 268–275. [Google Scholar] [CrossRef]
  14. Tanuma, S.; Powell, C.J.; Penn, D.R. Calculations of electron inelastic mean free paths. IX. Data for 41 elemental solids over the 50 eV to 30 keV range. Surf. Interface Anal. 2011, 43, 689–713. [Google Scholar] [CrossRef]
  15. Gergely, G. Elastic peak electron spectroscopy for auger electron spectroscopy and electron energy loss spectroscopy. Surf. Interface Anal. 1981, 3, 201–205. [Google Scholar] [CrossRef]
  16. Jablonski, A. Determination of the electron inelastic mean free path in solids from the elastic electron backscattering intensity. Surf. Interface Anal. 2005, 37, 1035–1044. [Google Scholar] [CrossRef]
  17. Jablonski, A. Surface sensitivity of elastic peak electron spectroscopy. Appl. Surf. Sci. 2016, 378, 87–101. [Google Scholar] [CrossRef]
  18. Krawczyk, M.; Lisowski, W.; Pisarek, M.; Nikiforow, K.; Jablonski, A. Surface characterization of low-temperature grown yttrium oxide. Appl. Surf. Sci. 2018, 437, 347–356. [Google Scholar] [CrossRef]
  19. Tanuma, S.; Powell, C.J.; Penn, D.R. Calculations of electron inelastic mean free paths. V. Data for 14 organic compounds over the 50–2000 eV range. Surf. Interface Anal. 1994, 21, 165–176. [Google Scholar] [CrossRef]
  20. Dubus, A.; Jablonski, A.; Tougaard, S. Evaluation of theoretical models for elastic electron backscattering from surfaces. Progress Surf. Sci. 2000, 63, 135–175. [Google Scholar] [CrossRef]
  21. Oswald, R.; Kasper, E.; Gaukler, K.H. A multiple scattering theory of elastic electron backscattering from amorphous surfaces. J. Electr. Spectrosc. Relat. Phenom. 1993, 61, 251–274. [Google Scholar] [CrossRef]
  22. Jablonski, A. Determination of the IMFP from electron elastic backscattering probability. Surf. Interface Anal. 2000, 29, 582–595. [Google Scholar] [CrossRef]
  23. Jablonski, A. Angular distribution of elastic electron backscattering from surfaces: Determination of the electron inelastic mean free path. J. Phys. D Appl. Phys. 2014, 47, 055301. [Google Scholar] [CrossRef]
  24. Jablonski, A. Analytical theory of elastic electron backscattering from elements, alloys, and compounds: Comparison with experimental data. J. Electr. Spectr. Rel. Phenom. 2016, 206, 24–45. [Google Scholar] [CrossRef]
  25. Yi, M.; Shen, Z. A review on mechanical exfoliation for the scalable production of graphene. J. Mater. Chem. 2015, 3, 11700–11715. [Google Scholar] [CrossRef]
  26. Spychalski, W.L.; Pisarek, M.; Szoszkiewicz, R. Microscale insight into oxidation of single MoS2 crystals in air. J. Phys. Chem. 2017, 121, 26027–26033. [Google Scholar] [CrossRef]
  27. Ukegbu, U.; Szoszkiewicz, R. Microscopic kinetics of heat-induced oxidative etching of thick MoS2 crystals. J. Phys. Chem. 2019, 123, 22123–22129. [Google Scholar] [CrossRef]
  28. Childs, K.D.; Carlson, B.A.; LaVanier, L.A.; Moulder, J.F.; Paul, D.F.; Stickle, W.F.; Watson, D.G. Handbook of Auger Electron Spectroscopy, a Book of Reference Data for Identification and Interpretation in Auger Electron Spectroscopy, 3rd ed.; Hedberg, C.L., Ed.; Physical Electronics Inc.: Eden Prairie, MN, USA, 1995. [Google Scholar]
  29. Jablonski, A.; Zemek, J. Remarks on some reference materials for applications in elastic peak electron spectroscopy. Anal. Sci. 2010, 26, 239–246. [Google Scholar] [CrossRef] [Green Version]
  30. Jablonski, A.; Krawczyk, M. Determination of the Electron IMFP from Elastic Peak Electron Spectroscopy, Users’ Guide, 1st ed.; Institute of Physical Chemistry, Polish Academy of Sciences: Warsaw, Poland, 2014; (Electronic version obtainable from authors). [Google Scholar]
  31. Wang, X.; Cormier, C.R.; Khosravi, A.; Smyth, C.M.; Shallenberger, J.R.; Addou, R.; Wallace, R.M. In situ exfoliated 2D molybdenum disulfide analyzed by XPS. Surf. Sci. Spectra 2020, 27. [Google Scholar] [CrossRef]
  32. Powell, C.J.; Jablonski, A. NIST Electron. Inelastic-Mean-Free-Path Database SRD 71: Version 1.2; National Institute of Standards and Technology: Gaithersburg, MA, USA, 2010. [Google Scholar]
  33. Ataca, C.; Sahin, H.; Ciraci, S. Stable, single-layer MX2 transition-metal oxides and dichalcogenides in a honeycomb-like structure. J. Phys. Chem. 2012, C 116, 8983–8999. [Google Scholar] [CrossRef]
  34. Mak, K.F.; Lee, C.; Hone, J.; Shan, J.; Heinz, T.F. Atomically thin MoS2: A new direct-.gap semiconductor. Phys. Rev. Lett. 2010, 105, 136805. [Google Scholar] [CrossRef] [Green Version]
  35. Haynes, W.M. CRC Handbook of Chemistry and Physics, 94th ed.; CRC Press: Boca Raton, FL, USA; New York, NY, USA; London, UK, 2013. [Google Scholar]
  36. Szoszkiewicz, R.; Rogala, M.; Dąbrowski, P. Surface-bound and volatile Mo oxides produced during oxidation of single MoS2 crystals in air and high relative humidity. Materials 2020, 13, 3067. [Google Scholar] [CrossRef]
Figure 1. Auger electron spectroscopy (AES) spectra of the sputter-cleaned (3 kV Ar+ ions, 30 s) molybdenum disulfide flakes with increasing S/Mo ratio prior to elastic-peak electron spectroscopy (EPES) measurements: (a) S/Mo = 1.80; (b) S/Mo = 1.84; (c) S/Mo = 1.88.
Materials 13 03595 g001
Figure 2. Scanning electron microscopy (SEM) images of the examined surfaces of Mo disulfide flakes exfoliated on silicon substrates with increasing S/Mo AC ratio: (a) S/Mo = 1.80; (b) S/Mo = 1.84; (ce): Distribution images of elements for the Mo disulfide flake from (b): S (LMM) in (c), Mo (MNN) in (d) and Si (LMM) in (e) on the flake surface suggesting chemical homogeneity of considered surfaces; (f) another flake with S/Mo = 1.88.
Materials 13 03595 g002aMaterials 13 03595 g002b
Figure 3. Energy dependence of the measured elastic-peak intensity ratios, Is/IAu, recorded from molybdenum disulfide surfaces with increasing S/Mo AC ratio: S/Mo = 1.80 (open circles); S/Mo = 1.84 (open triangles); S/Mo = 1.88 (open squares), and gold surfaces (αin = 0°, αout = 60° measured from the surface normal). Error bars for the Is/IAu ratios represent one standard deviation.
Materials 13 03595 g003
Figure 4. Energy dependence of the inelastic mean free path (IMFP) determined using the Au standard for the Mo0.357S0.643 (open circles, S/Mo = 1.8), Mo0.315S0.581C0.104 (open triangles, S/Mo = 1.84) and Mo0.293S0.551C0.156 (open squares, S/Mo = 1.88) surfaces. The solid squares indicate the IMFPs calculated using the Oswald–Kasper–Gaukler (OKG) theoretical model [21] for the Mo0.293S0.551C0.156 surface. The solid line are values of the fitted function (Equation (1)) to EPES IMFPs. The dashed line shows IMFP values predicted from the TPP-2M formula [19] for the Mo0.293S0.551C0.156 surface.
Materials 13 03595 g004
Table 1. The IMFP values (in nm) determined from EPES for Mo disulfide flakes with different surface stoichiometries, the IMFPs estimated from the TPP-2M formula (Equation (2)) [19], and the IMFPs calculated from the OKG theoretical model [21] for the indicated disulfide surface stoichiometries.
IMFP (nm)
Surface Stoichiometry (in S/Mo AC Ratios)
S/Mo = 1.80S/Mo = 1.84S/Mo = 1.88S/Mo = 1.88S/Mo = 2.00
E (eV)EPESEPESEPESTPP-2MOKG theoryTPP-2M
5000.981.070.901.221.571.19
10002.372.311.992.032.031.98
15002.813.162.932.772.572.70
20003.453.753.663.483.133.39
Table 2. The percentage deviations Δj and Δf, calculated from Equations (8) and (10) for the considered Mo disulfide stoichiometries (in S/Mo AC ratios) and electron energies. Two final rows show the resulting mean percentage deviations Rj and Rf, calculated from Equations (9) and (11), for the considered surface stoichiometries and electron energies.
Δj Deviation (%)
Energy(eV)S/Mo = 1.80S/Mo = 1.84S/Mo = 1.88Δf Deviation (%)
500−4.853.88−12.62−13.44
100019.0916.0800.50
1500−3.778.220.348.15
2000−9.92−2.09−4.4412.98
Mean Rj deviation (%): 7.11; Mean Rf deviation (%): 8.77.

