Article

Gd3+-Doping Effect on Upconversion Emission of NaYF4: Yb3+, Er3+/Tm3+ Microparticles

by
Aleksandra A. Vidyakina
1,2,
Ilya E. Kolesnikov
1,3,
Nikita A. Bogachev
1,2,
Mikhail Y. Skripkin
1,2,
Ilya I. Tumkin
1,2,
Erkki Lähderanta
3 and
Andrey S. Mereshchenko
1,2,*
1
Saint-Petersburg State University, 7/9 Universitetskaya Emb., St. 199034 Petersburg, Russia
2
Sirius University of Science and Technology, 1 Olympic Ave, 354340 Sochi, Russia
3
LUT University, Skinnarilankatu 34, 53850 Lappeenranta, Finland
*
Author to whom correspondence should be addressed.
Materials 2020, 13(15), 3397; https://doi.org/10.3390/ma13153397
Submission received: 3 July 2020 / Revised: 24 July 2020 / Accepted: 27 July 2020 / Published: 31 July 2020
(This article belongs to the Special Issue Synthesis, Morphology, and Properties of Functional Nanomaterials)

Abstract

:
β-NaYF4 microcrystals co-doped with Yb3+, Er3+/Tm3+, and Gd3+ ions were synthesized via a hydrothermal method using rare-earth chlorides as the precursors. The SEM and XRD data show that the doped β-NaYF4 form uniform hexagonal prisms with an approximate size of 600–800 nm. The partial substitution of Y by Gd results in size reduction of microcrystals. Upconversion luminescence spectra of microcrystals upon 980 nm excitation contain characteristic intra-configurational ff bands of Er3+/Tm3+ ions. An addition of Gd3+ ions leads to a significant enhancement of upconversion luminescence intensity with maxima at 5 mol % of dopant.

Graphical Abstract

1. Introduction

Rare earth-based materials are known to demonstrate efficient upconversion properties and are able to transform near-infrared (NIR) light to visible or even UV light via multiphoton processes [1,2,3]. NaYF4 doped by rare earth ions is one of the most efficient upconversion phosphors among numerous luminescent materials due to the low phonon energy of host lattice, which reduces the amount of nonradiative transitions [4,5]. Lanthanide elements have attracted intense attention in recent years in numerous fields, such as photodynamic therapy [6,7], flat-panel displays [8], solid-state lasers [9,10,11], bio-imaging [4,12,13], and biosensing [14].
NaYF4: Yb3+, Tm3+/Er3+ upconversion microcrystals are known to have the best luminescence property of all fluorescent materials [15]. Different methods for the synthesis of NaYF4: Yb3+, Tm3+/Er3+ have been recently reported, including hydrothermal and solvothermal methods [16,17,18,19]. Using various synthetic approaches, particles of different sizes can be obtained. In solvothermal synthesis with oleic acid/octadecene solvent, hexagonal nanoparticles of a small size (<100 nm) are obtained. Microcrystals of a larger size (>500 nm), which can be fabricated by hydrothermal synthesis, usually have higher luminescence intensity. The Tm3+ and Er3+ ions act as optical active centers; the Yb3+ ion is a sensitizer that absorbs NIR light and then transfers energy to Tm3+ or Er3+.
In our work, we partially substituted Yb3+ by Gd3+ ions in NaYF4: Yb3+, Tm3+/Er3+ materials to improve upconverting properties. It was previously demonstrated that Gd3+ co-doping improves the luminescent properties of rare earth-based materials [17,20]. By introducing Gd3+ ions into the NaYF4 crystal lattice, it is possible to change local symmetry, thus increasing the probability of energy transfer processes, which could increase luminescence intensity. We studied the structure and upconverting luminescent properties of NaYF4: Gd3+/Yb3+/Tm3+ and NaYF4: Gd3+/Yb3+/Er3+ microparticles synthesized via a hydrothermal method. We found that co-doping of 5% Gd3+ ions in NaYF4: Yb3+, Tm3+/Er3+ increases the upconversion luminescence intensity in the visible range by 2–5 times upon 980 nm excitation.

2. Materials and Methods

Anhydrous chlorides of the rare earth elements (YCl3, ErCl3, GdCl3, YbCl3, and TmCl3, 99.999%) were purchased from Chemcraft (Russia), NaOH, NH4F, sodium citrate, and ethanol were purchased from Sigma-Aldrich Pty Ltd. (Germany), and used without additional purification.
Microcrystalline β-NaYF4 samples co-doped with Yb3+, Er3+, Tm3+, and Gd3+ were synthesized by the hydrothermal method using citric acid as a stabilizing agent. We redesigned the previously reported hydrothermal method of synthesis [16,17,18,19]. In the typical synthesis, yttrium, ytterbium(III), gadolinium(III), and thulium(III)/erbium(III) chlorides (total amount of rare earth chlorides was 0.75 mmol) with 3 mmol of citric acid were dissolved in distilled water to obtain 5 mL solution in total. Chlorides of rare earth elements were taken in stoichiometric amounts. Then, 2.5 mL of aqueous solution containing 9 mmol of NaOH was added to the flask of the previous solution. After vigorous stirring for 30 min, 8 mL of aqueous solution containing 11 mmol of NaOH and 11 mmol of NH4F was introduced into the above solution. The solution was maintained after vigorous stirring for 30 min at room temperature before being transferred to a Teflon-lined autoclave with an internal volume of 20 mL. The hydrothermal syntheses were conducted in an electric oven at 180 °C for 24 h. After that, the precipitate was separated from the reaction mixture by centrifugation, washed with ethanol and deionized water, and dried at 60 °C for 24 h. The desired microstructure materials were obtained in a form of white powders.
Dopant concentration, particle size, and crystallite phase are known to significantly influence the efficiency of upconversion luminescence [21,22]. Earlier studies demonstrated that the Yb3+ optimal concentration is about 20 at % [23,24,25]. Our preliminary experiments demonstrated that in NaY0.8-yYb0.20TmyF4 and NaY0.8-zYb0.20ErzF4, the optimal concentration of Tm3+ and Er3+ is in the range of 0.5–1 at %, which agrees with earlier studies where the optimal dopant concentration for Tm3+ and Er3+ ions varied from 1% to 2% [18,20,22,23]. Therefore, in this work, we synthesized and studied the two Gd3+ co-doping series of upconverting microcrystals with 1% Tm3+/Er3+ concentration: NaY0.79−xYb0,20Tm0.01GdxF4 and NaY0.79−xYb0,20Er0.01GdxF4 (x = 0–0.2).
The morphologies of microstructures of the synthesized samples were characterized using scanning electron microscopy (SEM) with a Zeiss Merlin electron microscope (Zeiss, Germany) with energy-dispersive X-ray spectroscopy (EDX) module (Oxford Instruments INCAx-act, UK) and confirmed by atomic force microscopy (AFM) using a Nanoeductor II microscope (NT-MDT Spectrum Instruments, Moscow, Russia); the AFM measurements were performed in a semi-contact regime. X-ray powder diffraction (XRD) measurements were performed on a D2 Phaser (Bruker, Billerica, MA, USA) X-ray diffractometer using (Cu Kα radiation, λ = 1.54056 Å) radiation. The upconversion luminescence emission spectra were recorded with an Fluorolog-3 fluorescence spectrometer (Horiba Jobin Yvon, Japan) with diode laser (wavelength 980 nm, power 320 mW, and beam diameter 2 mm) as an excitation source for upconversion luminescence. Lifetime measurements were performed with the same spectrometer using pulsed Xe lamp (pulse duration 3 µs).

3. Results and Discussion

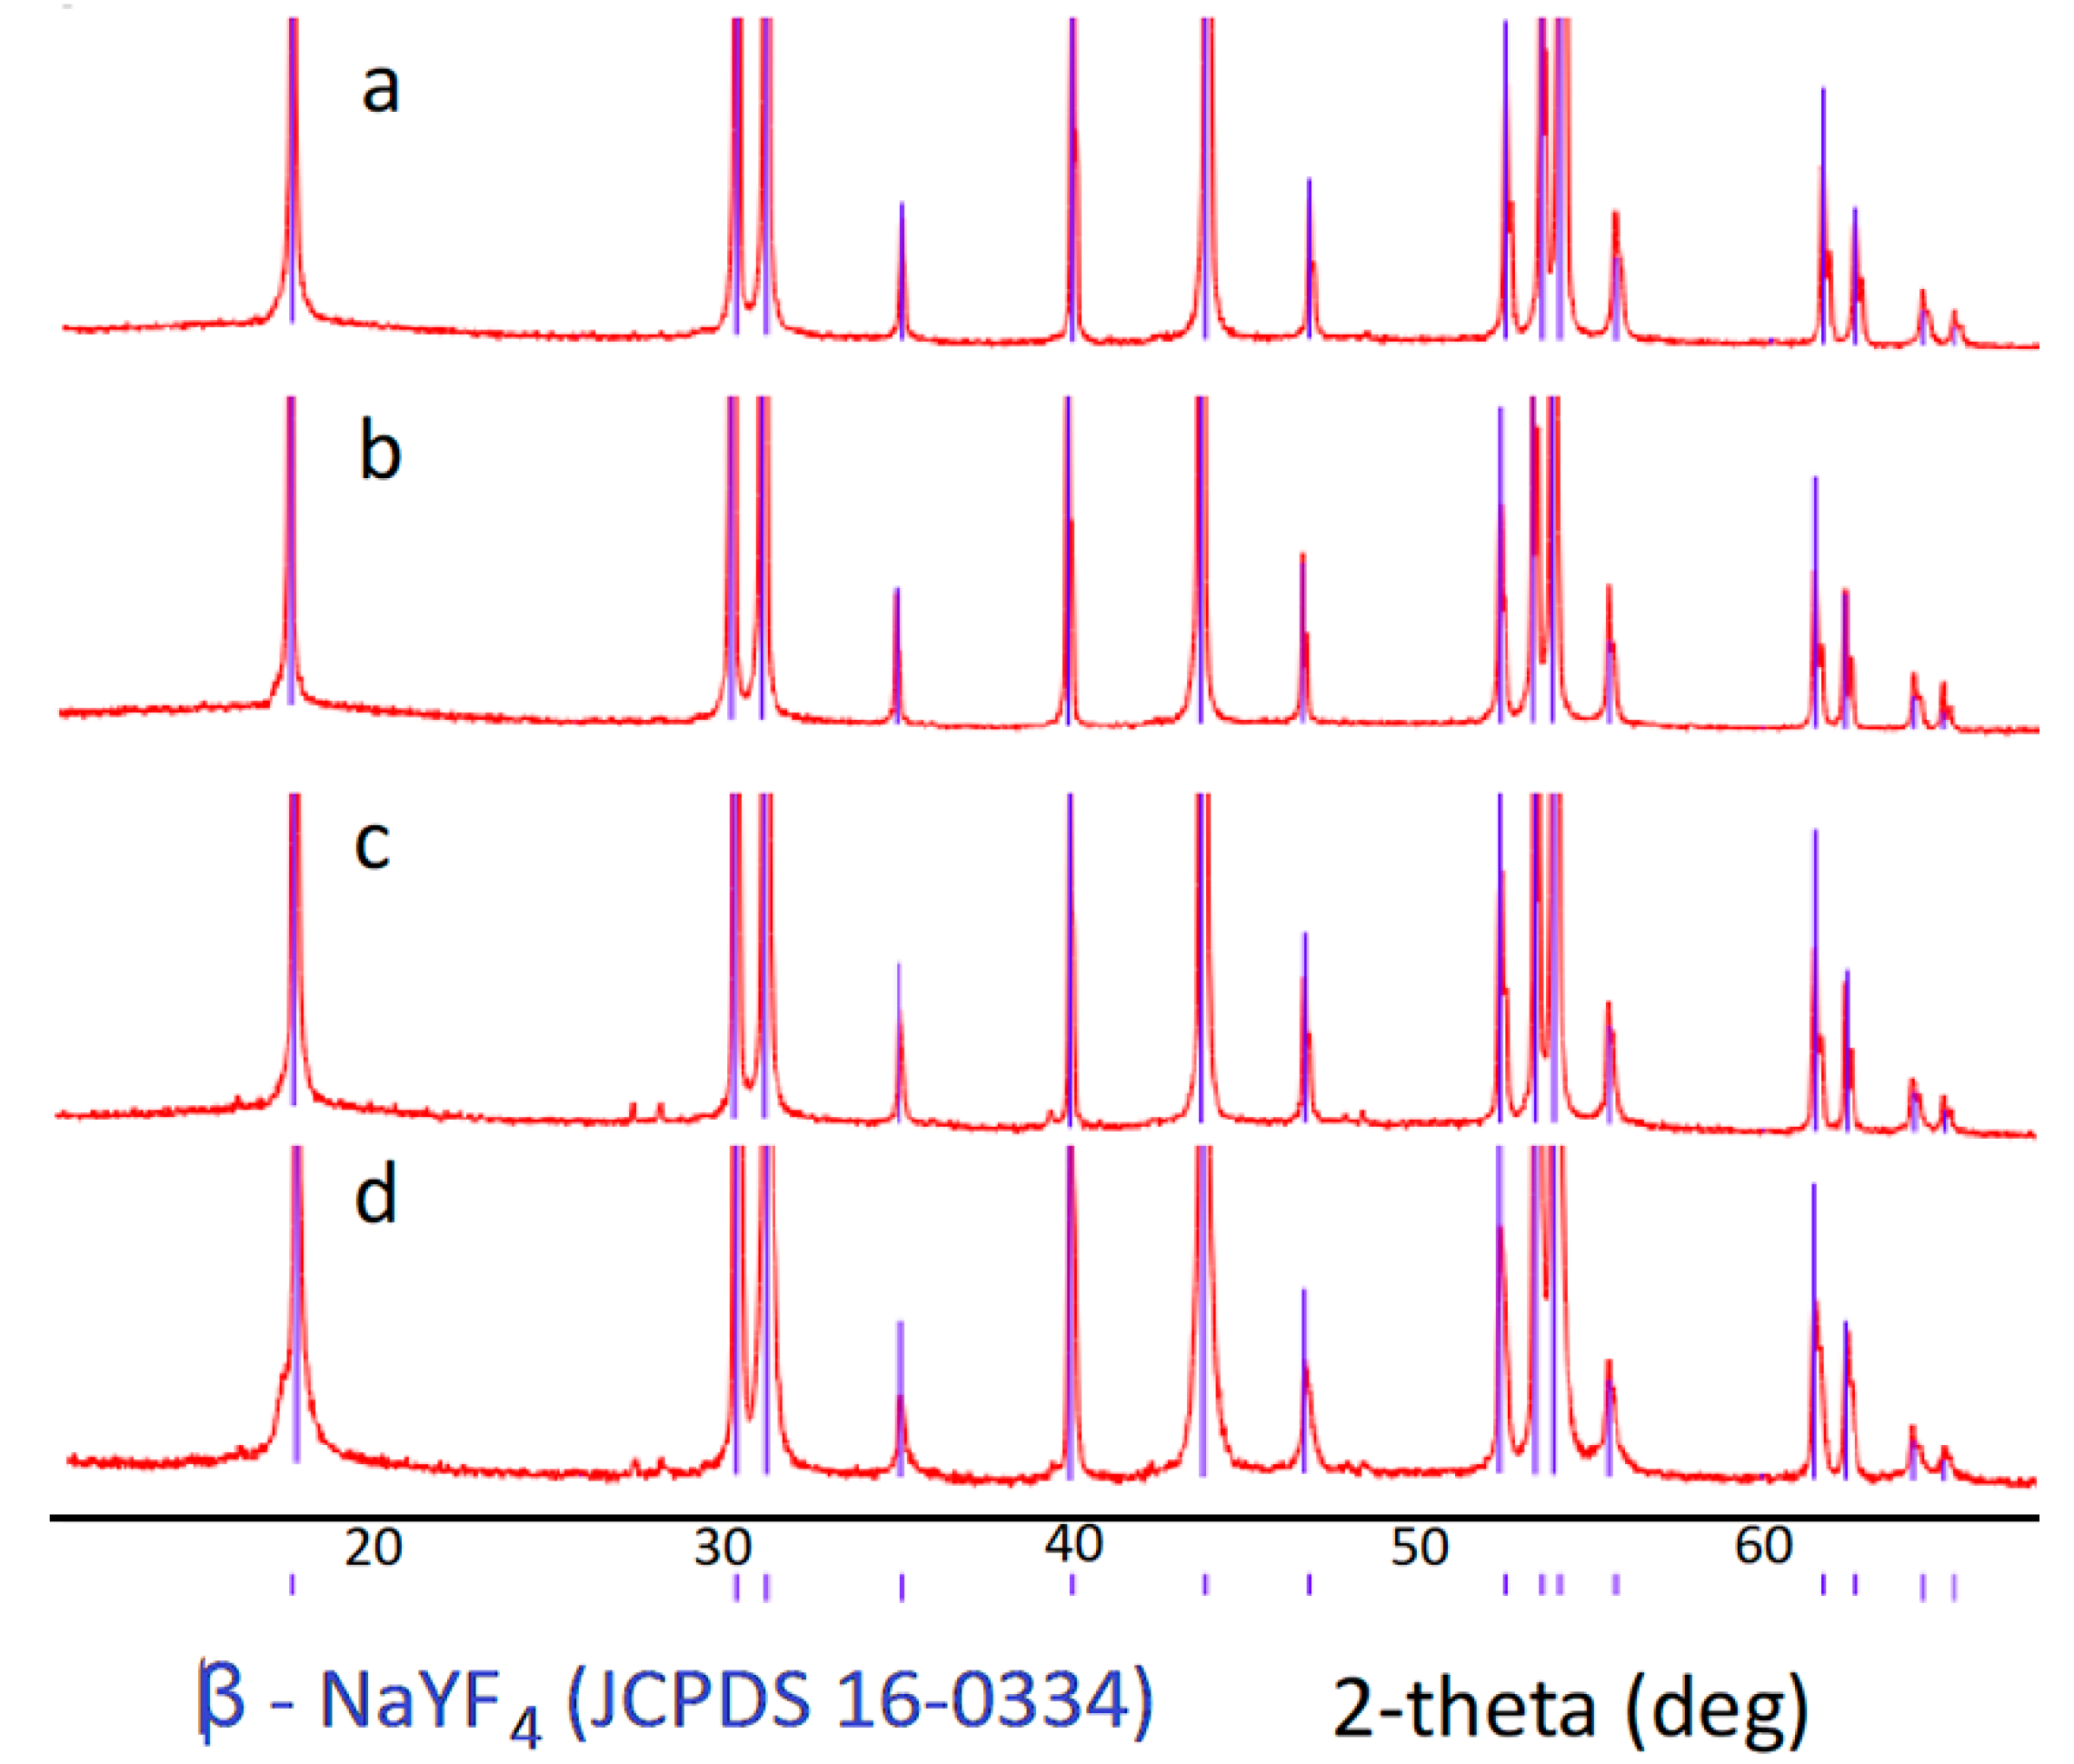
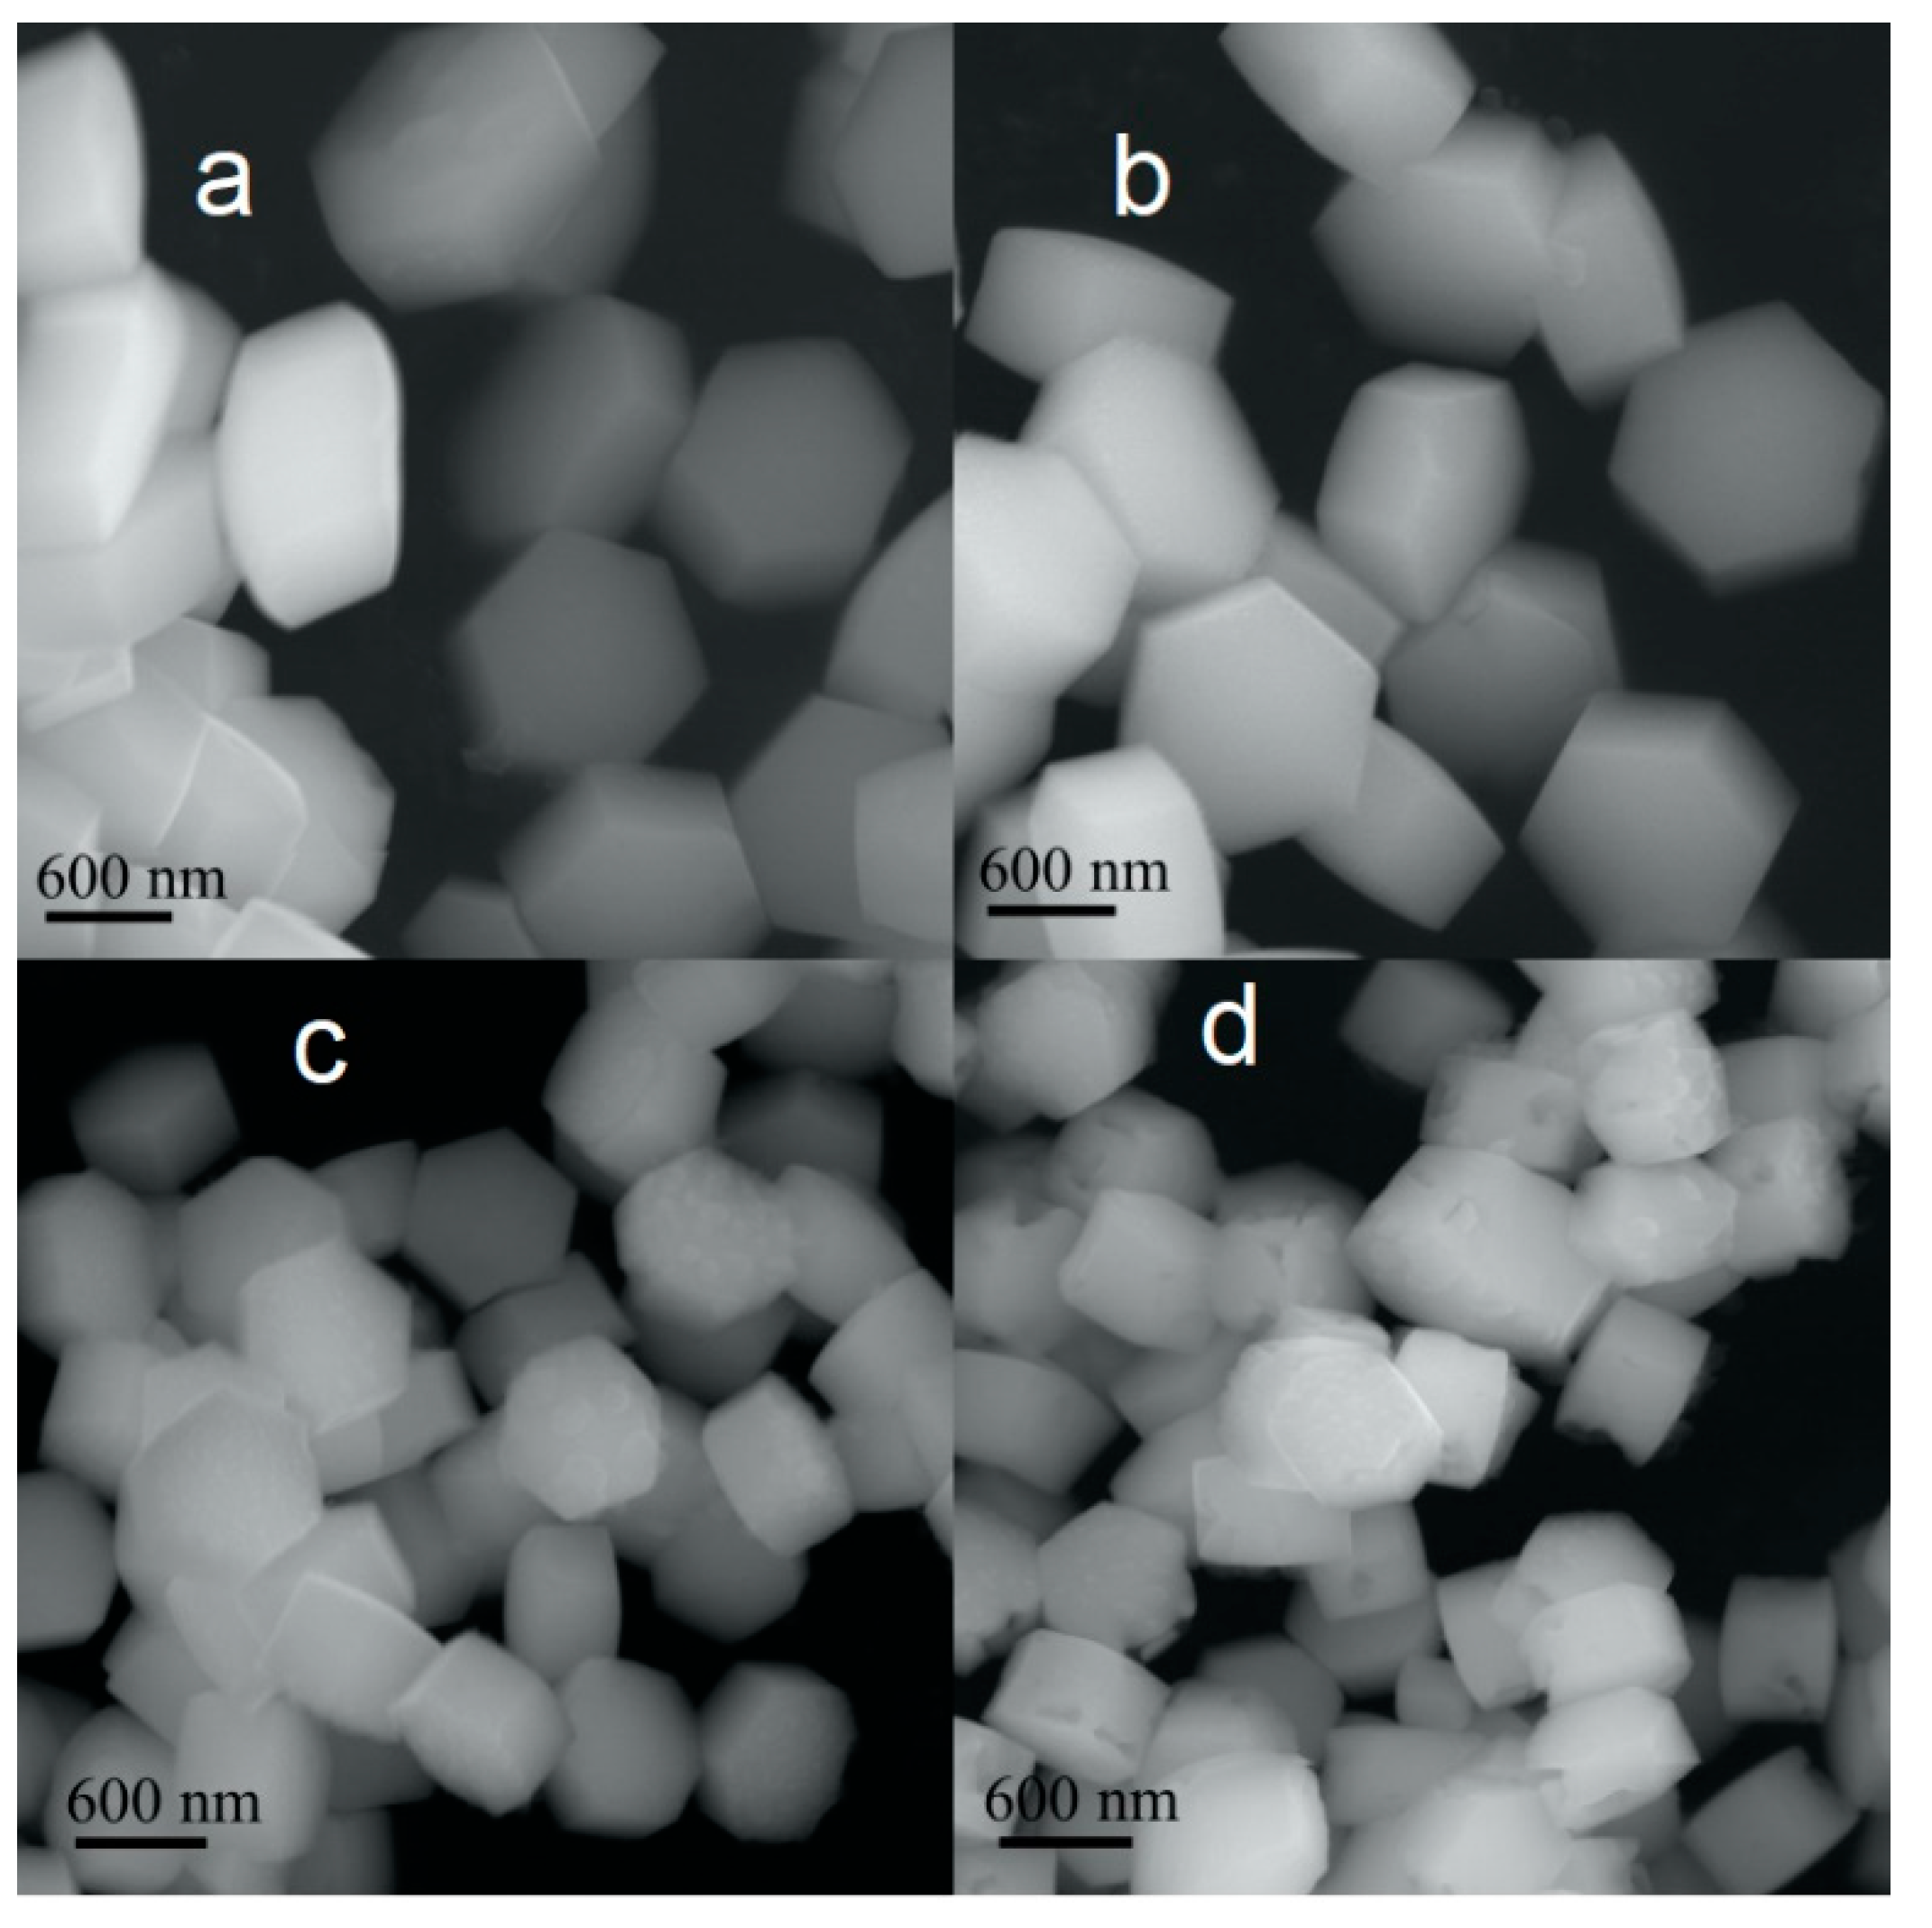
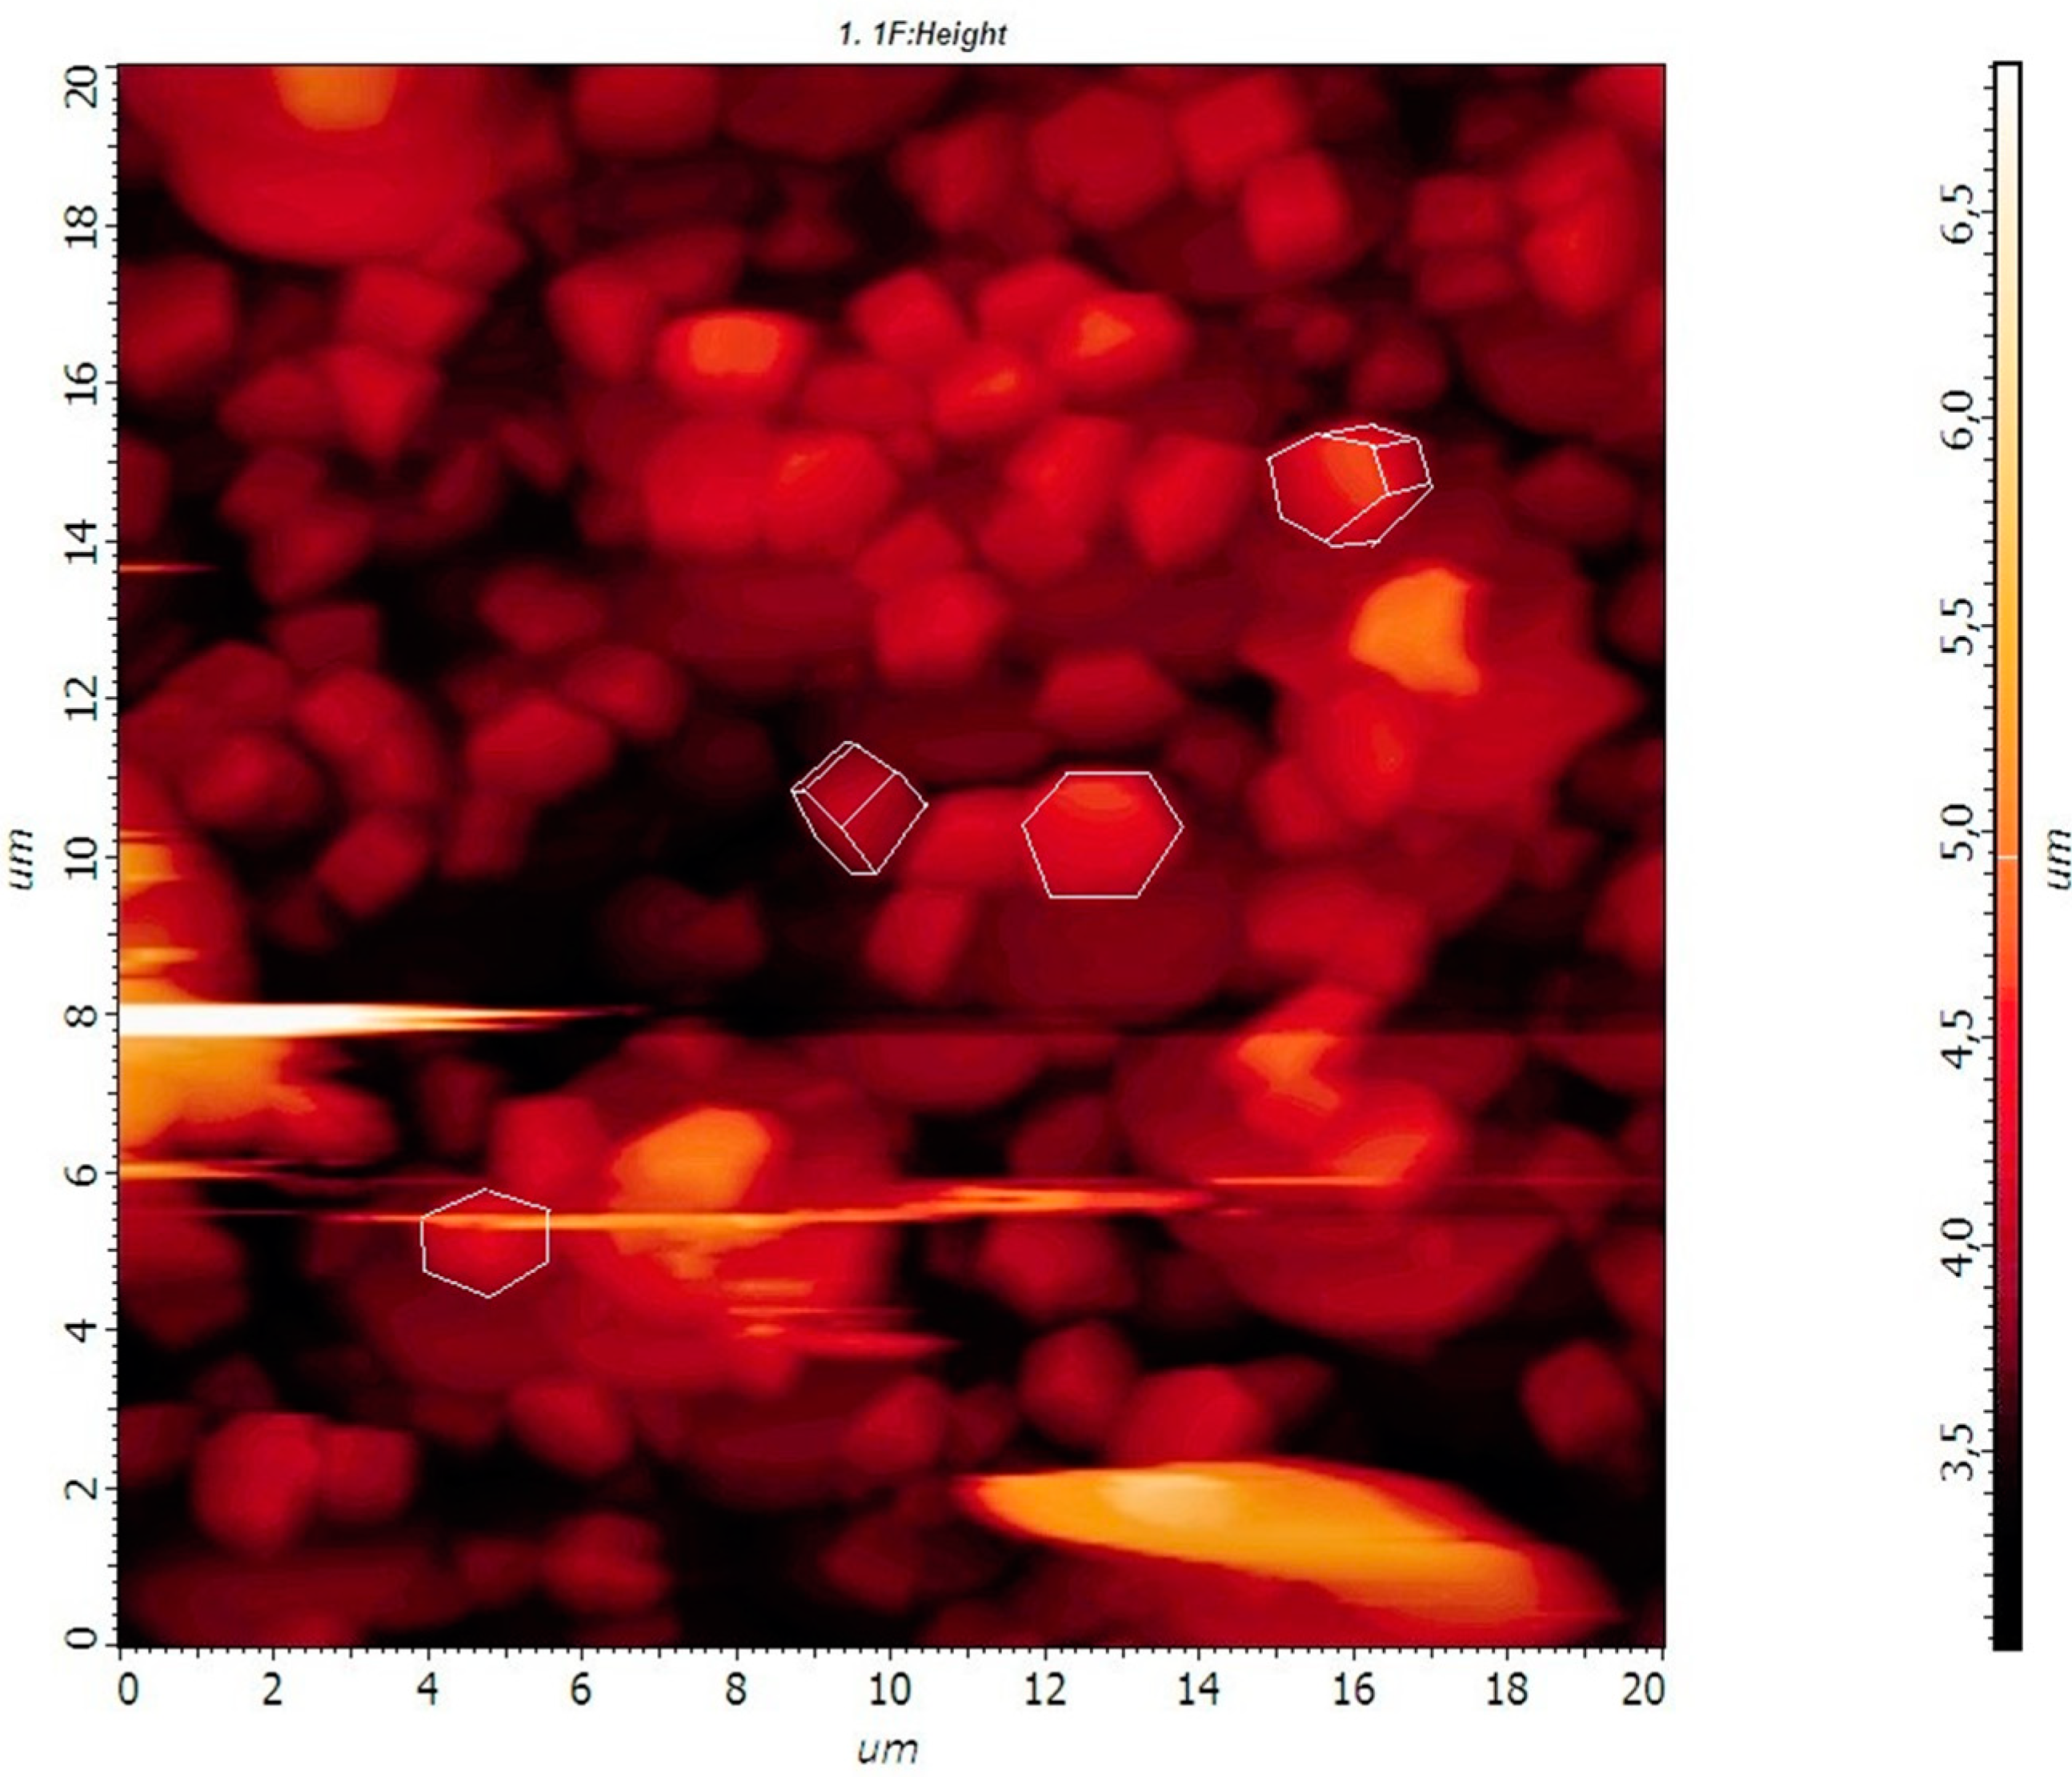
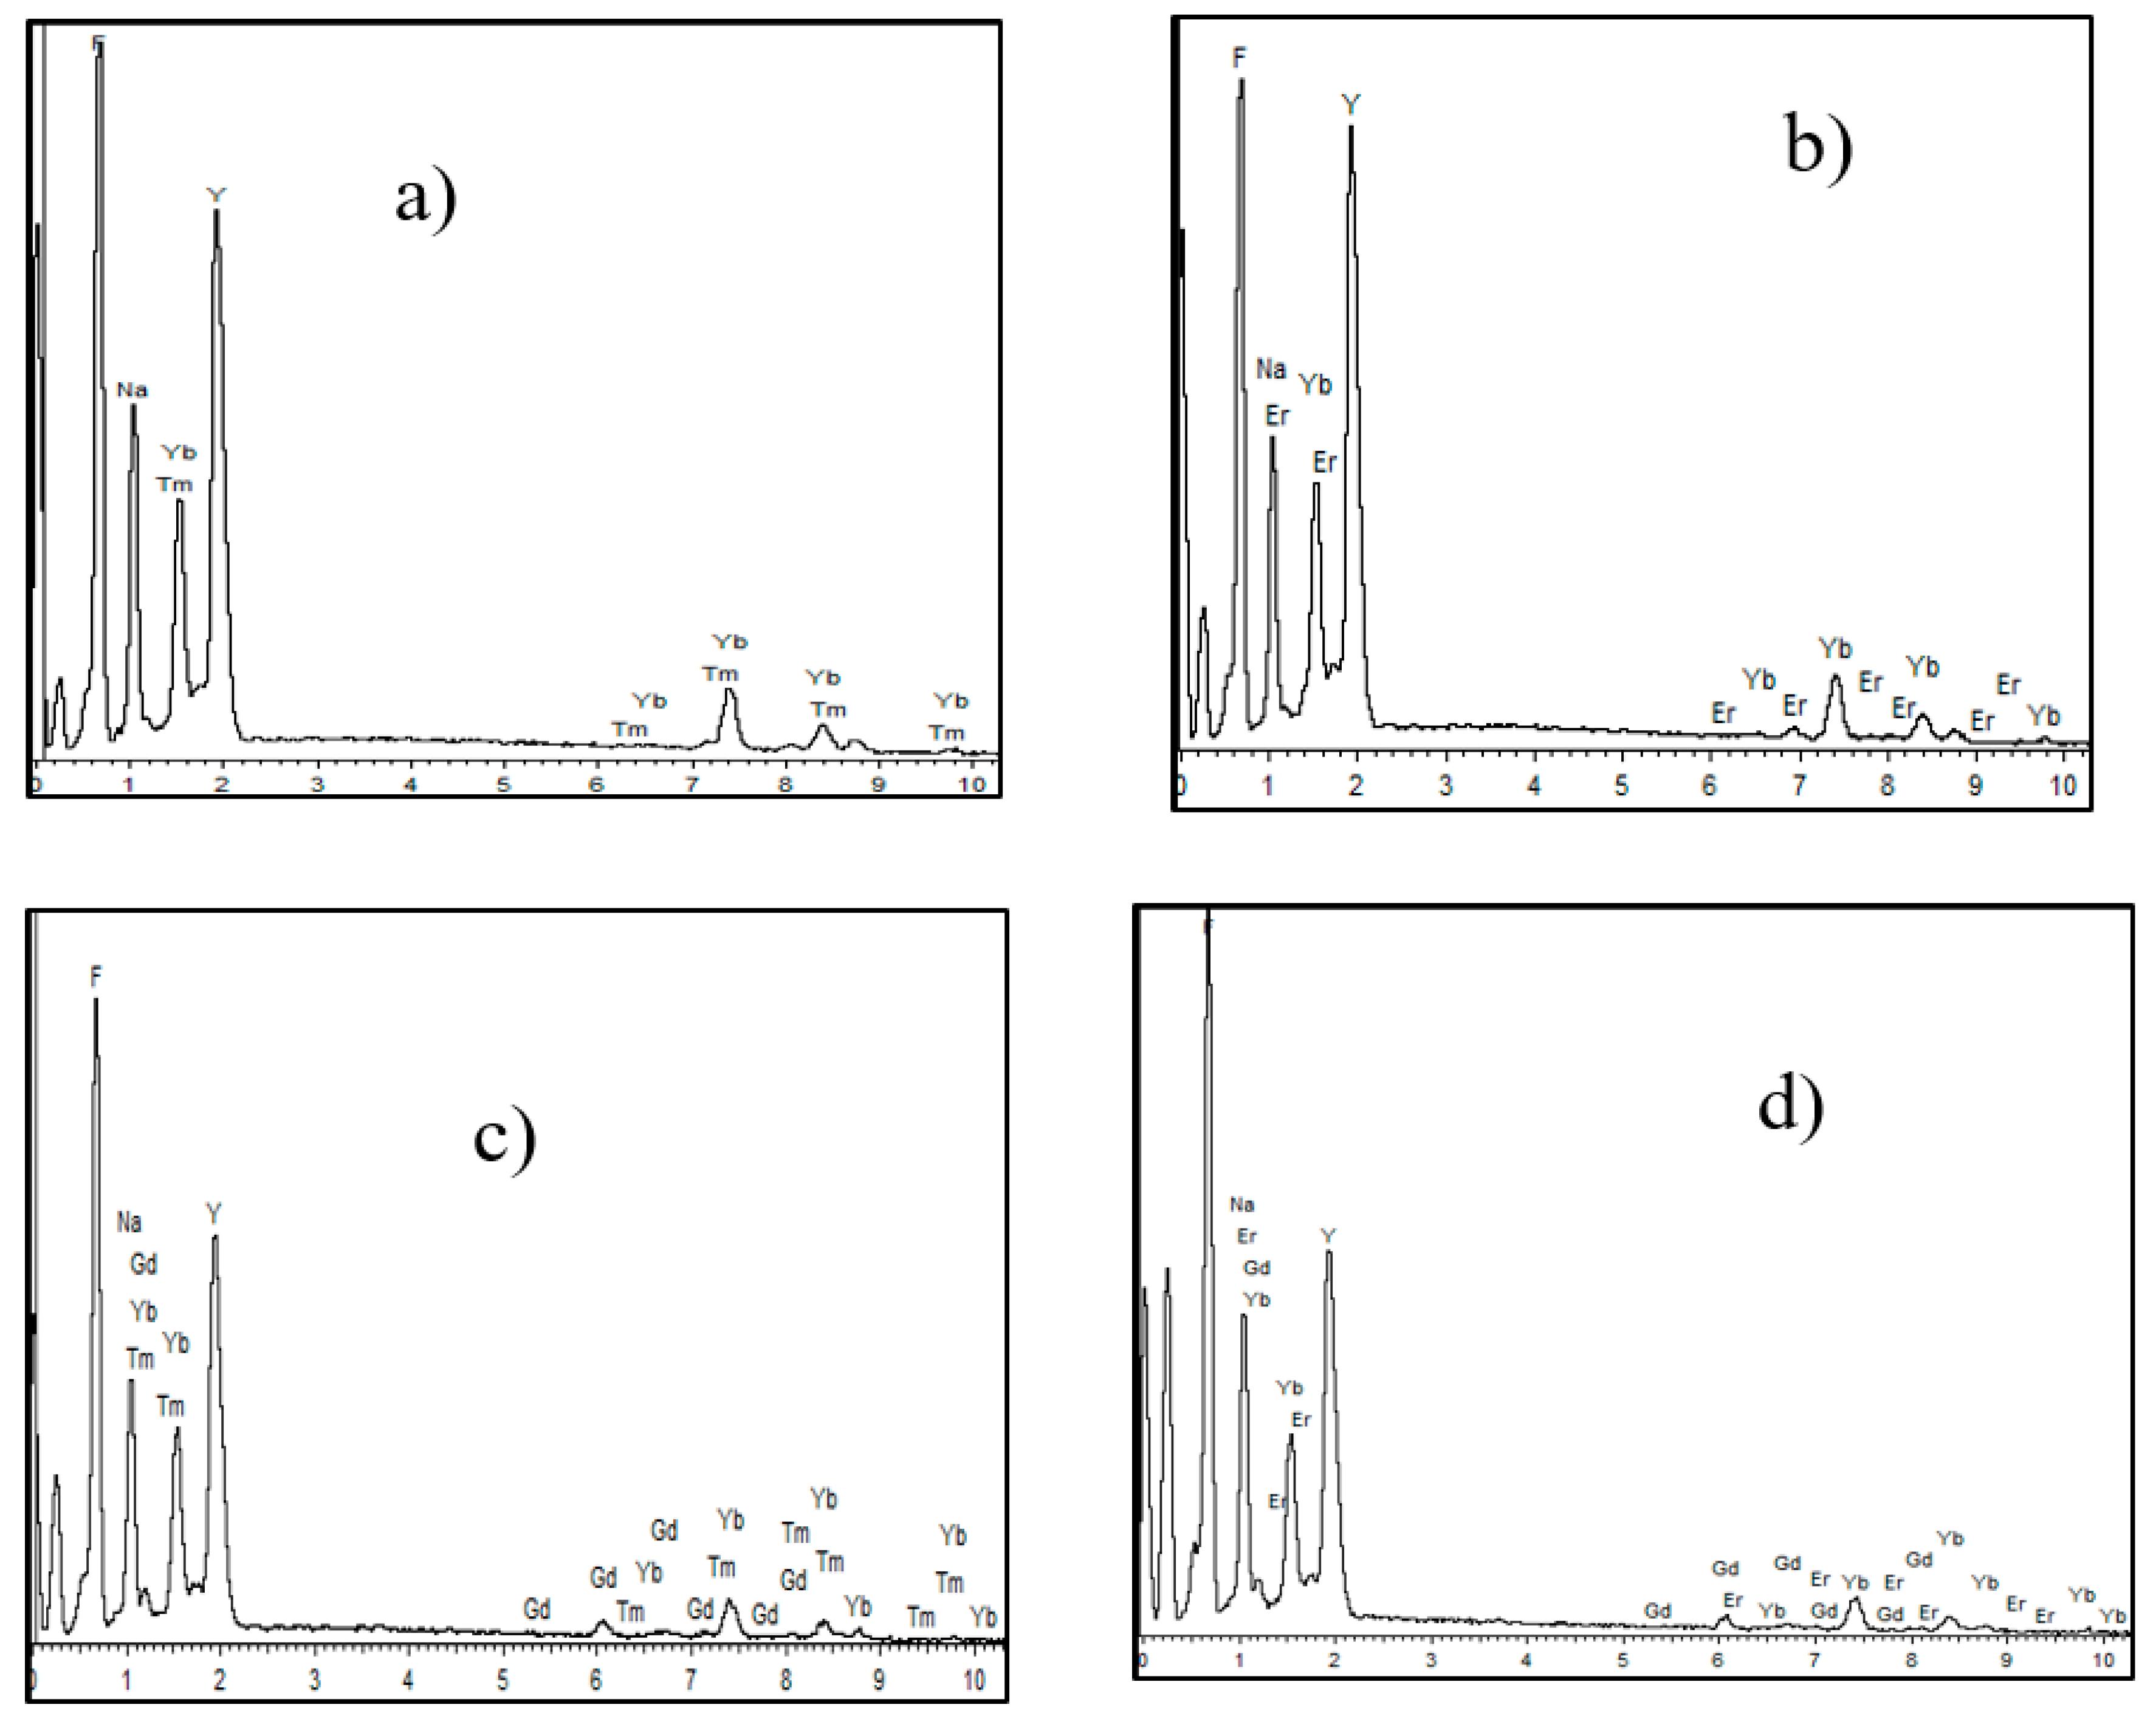
3.1. Crystal Structure and Morfology

NaYF4 exists in two phases [5,26,27,28]: cubic α-NaYF4 phase and hexagonal β-NaYF4 phase. The upconverting efficiency of the hexagonal phase NaYF4: Yb,Tm/Er materials are significantly higher [19,29,30]. X-ray powder diffraction (XRD) patterns of the synthesized samples are given in Figure 1.
The diffraction maxima positions of all our samples matched the standard values for pure hexagonal β-NaYF4 (JCPDS No. 16-0334). No diffraction peaks attributed to impurities were observed. We found that the addition of Gd did not lead to a phase transformation. The XRD data of all the samples were the same; therefore, only several XRD patterns are given here for simplicity.
Scanning electron microscope (SEM) was used to analyze the shape and size of the microcrystals. SEM images of various composition microcrystals are shown in Figure 2.
All the samples consisted of sub-micron-sized uniform hexagonal prism-shaped particles (Figure 2a–d). The morphology of the microcrystals obtained by SEM agreed with that obtained by AFM (Figure 3).
The microcrystals without Gd3+ dopant (Figure 2a,b) had a uniform morphology and an average length along the diagonal direction of about 800 nm. Notably, the addition of the Gd3+ dopant (Figure 2c,d) led to a decrease in the size of the microcrystals that is clearly seen from the SEM images. Addition of Gd3+ ions in NaYF4: Yb, Tm/Er also resulted in the formation of surface defects (Figure 2c,d), such as cracks and chips. The size of the crystals is probably guided by crystal growth rates. Earlier studies demonstrated that substitution of yttrium ion by larger gadolinium(III) ion (ionic radii of Y3+ and Gd3+ are 1.159 and 1.193 Å, respectively) results in an increase in the electron charge density of the crystal surface [31,32]. Therefore, the larger electron charge density in the Gd3+-containing crystal nucleus slows the diffusion of negatively charged fluoride ions, which leads to a reduction in the crystal growth rate and a smaller final size of Gd3+ co-doped microcrystals. Furthermore, the difference in charge density inside the crystal can result in a minor change of local symmetry of rare earth ions and surface structural defects. The composition of microcrystals was roughly estimated by energy dispersive X-ray analysis (EDX). The EDX spectra (Figure 4) indicated the presence of all elements (Y, Yb, F, Na, Gd, and Er/Tm) in the synthesized materials.

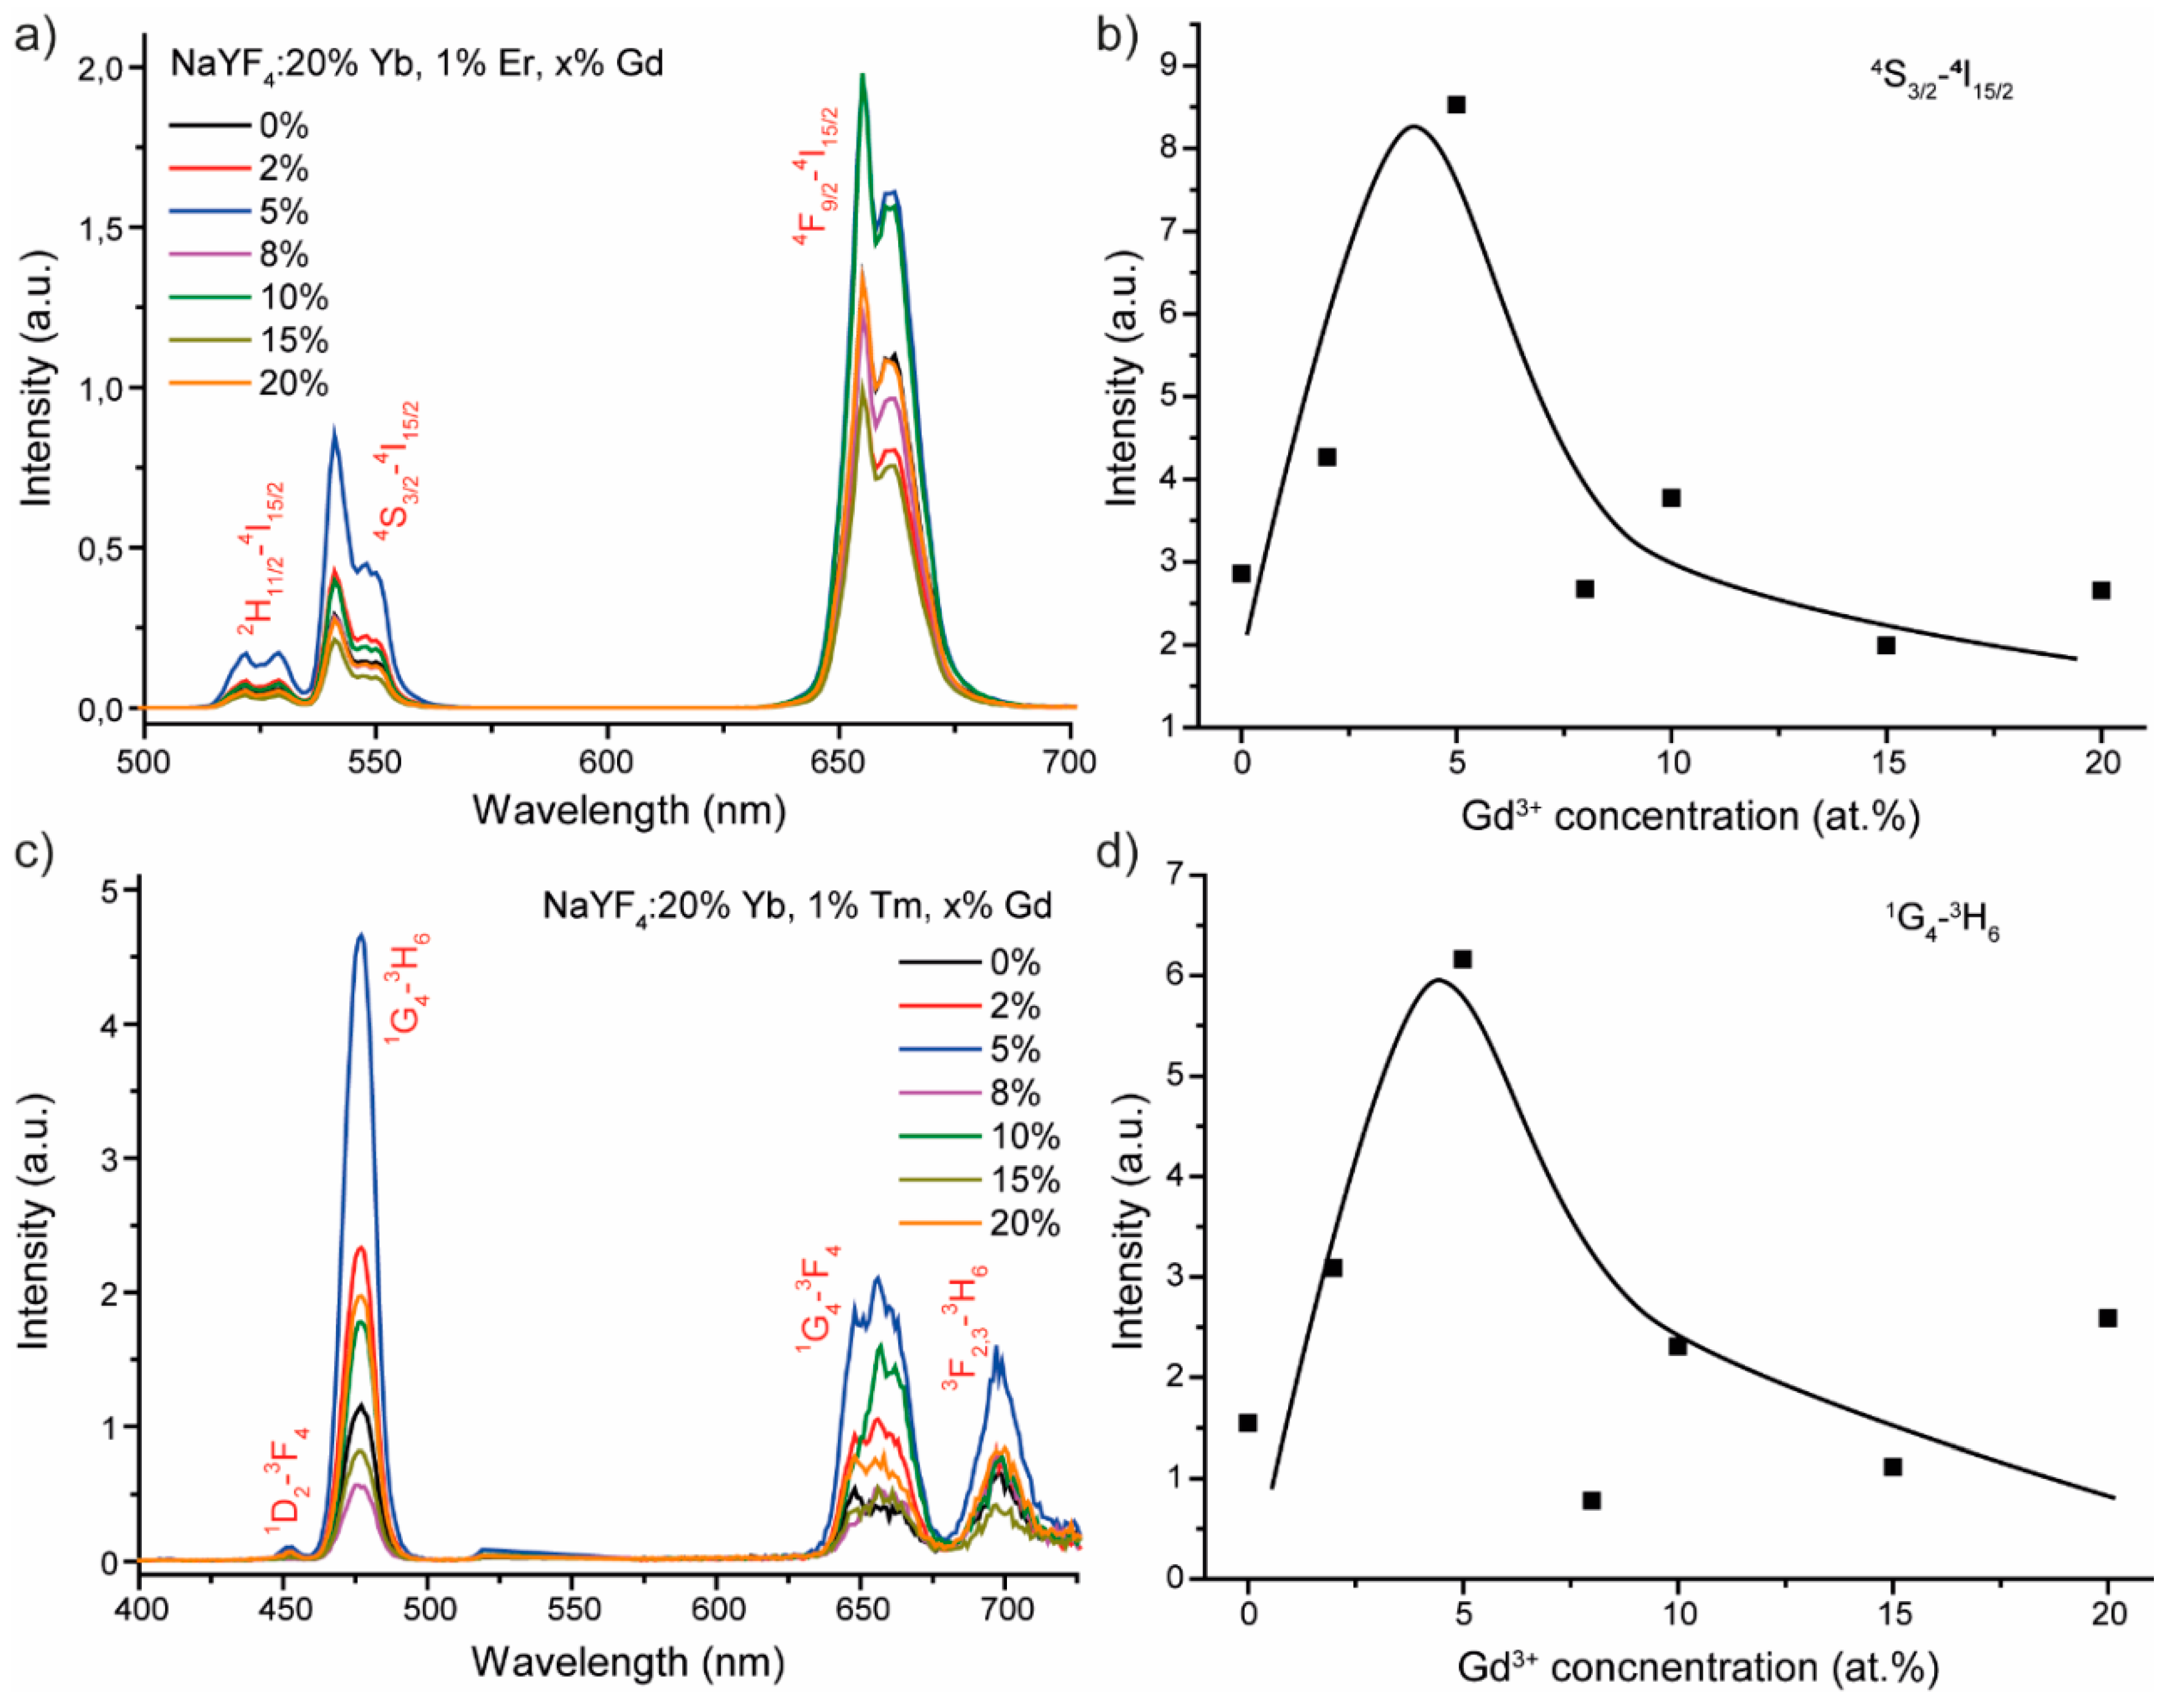
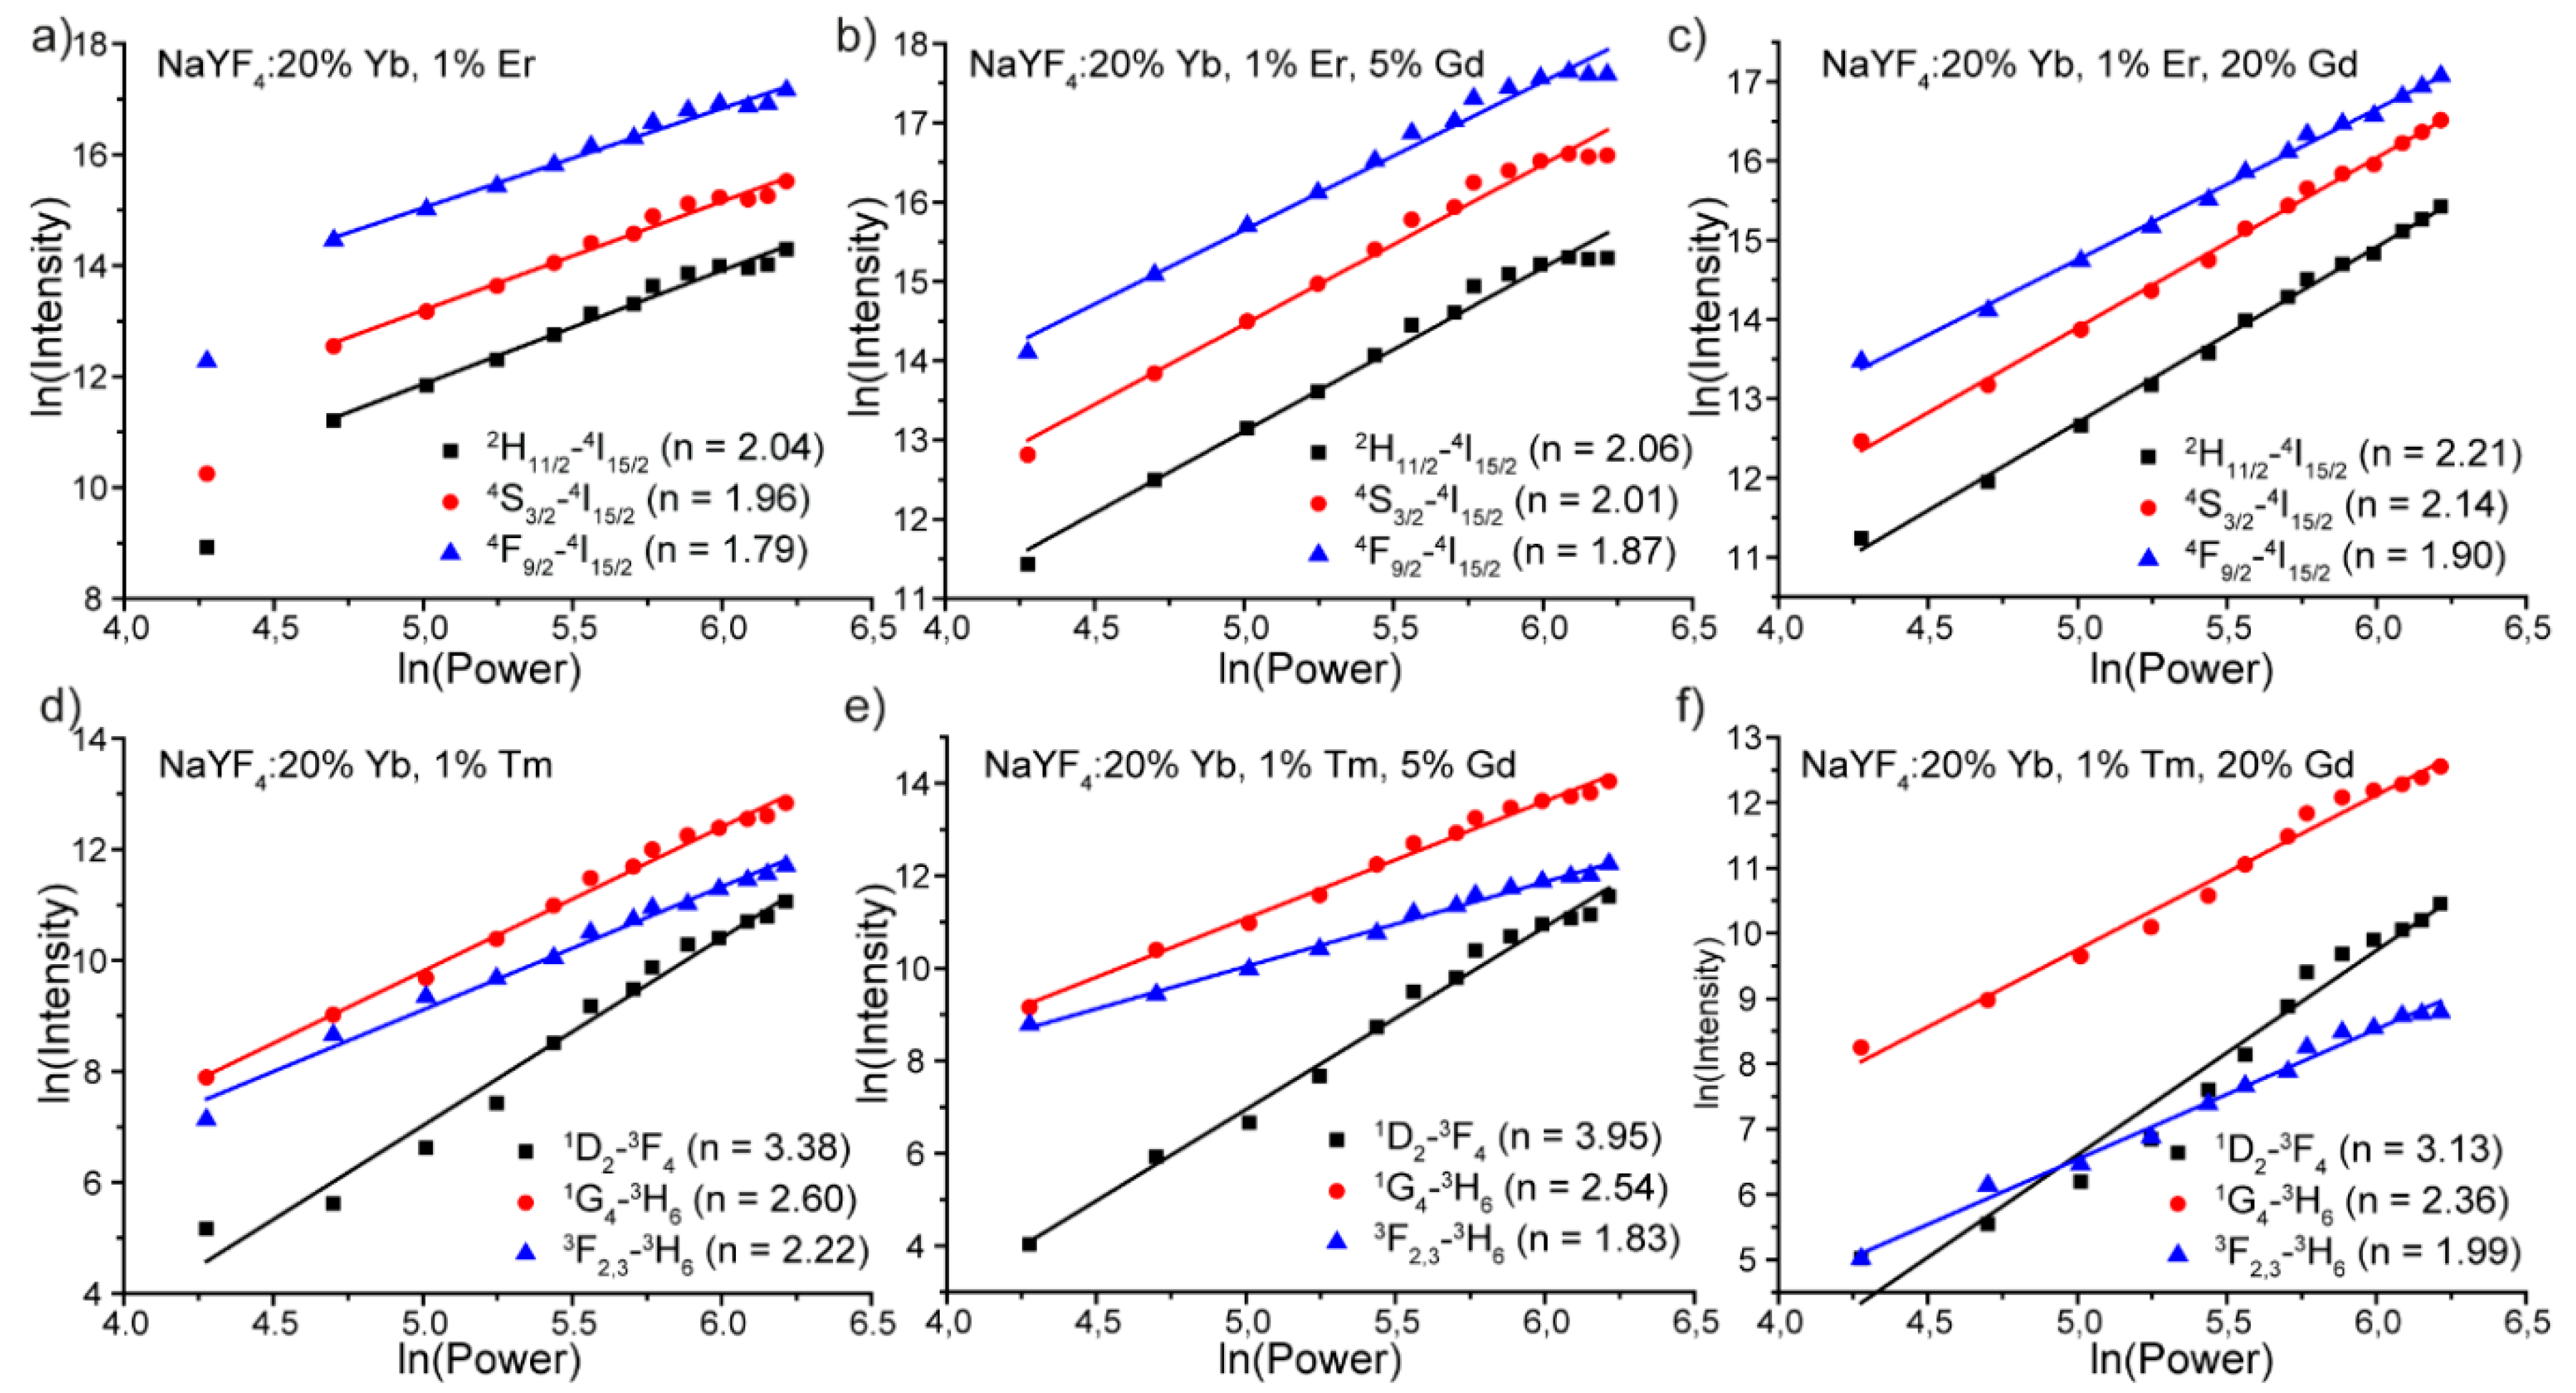
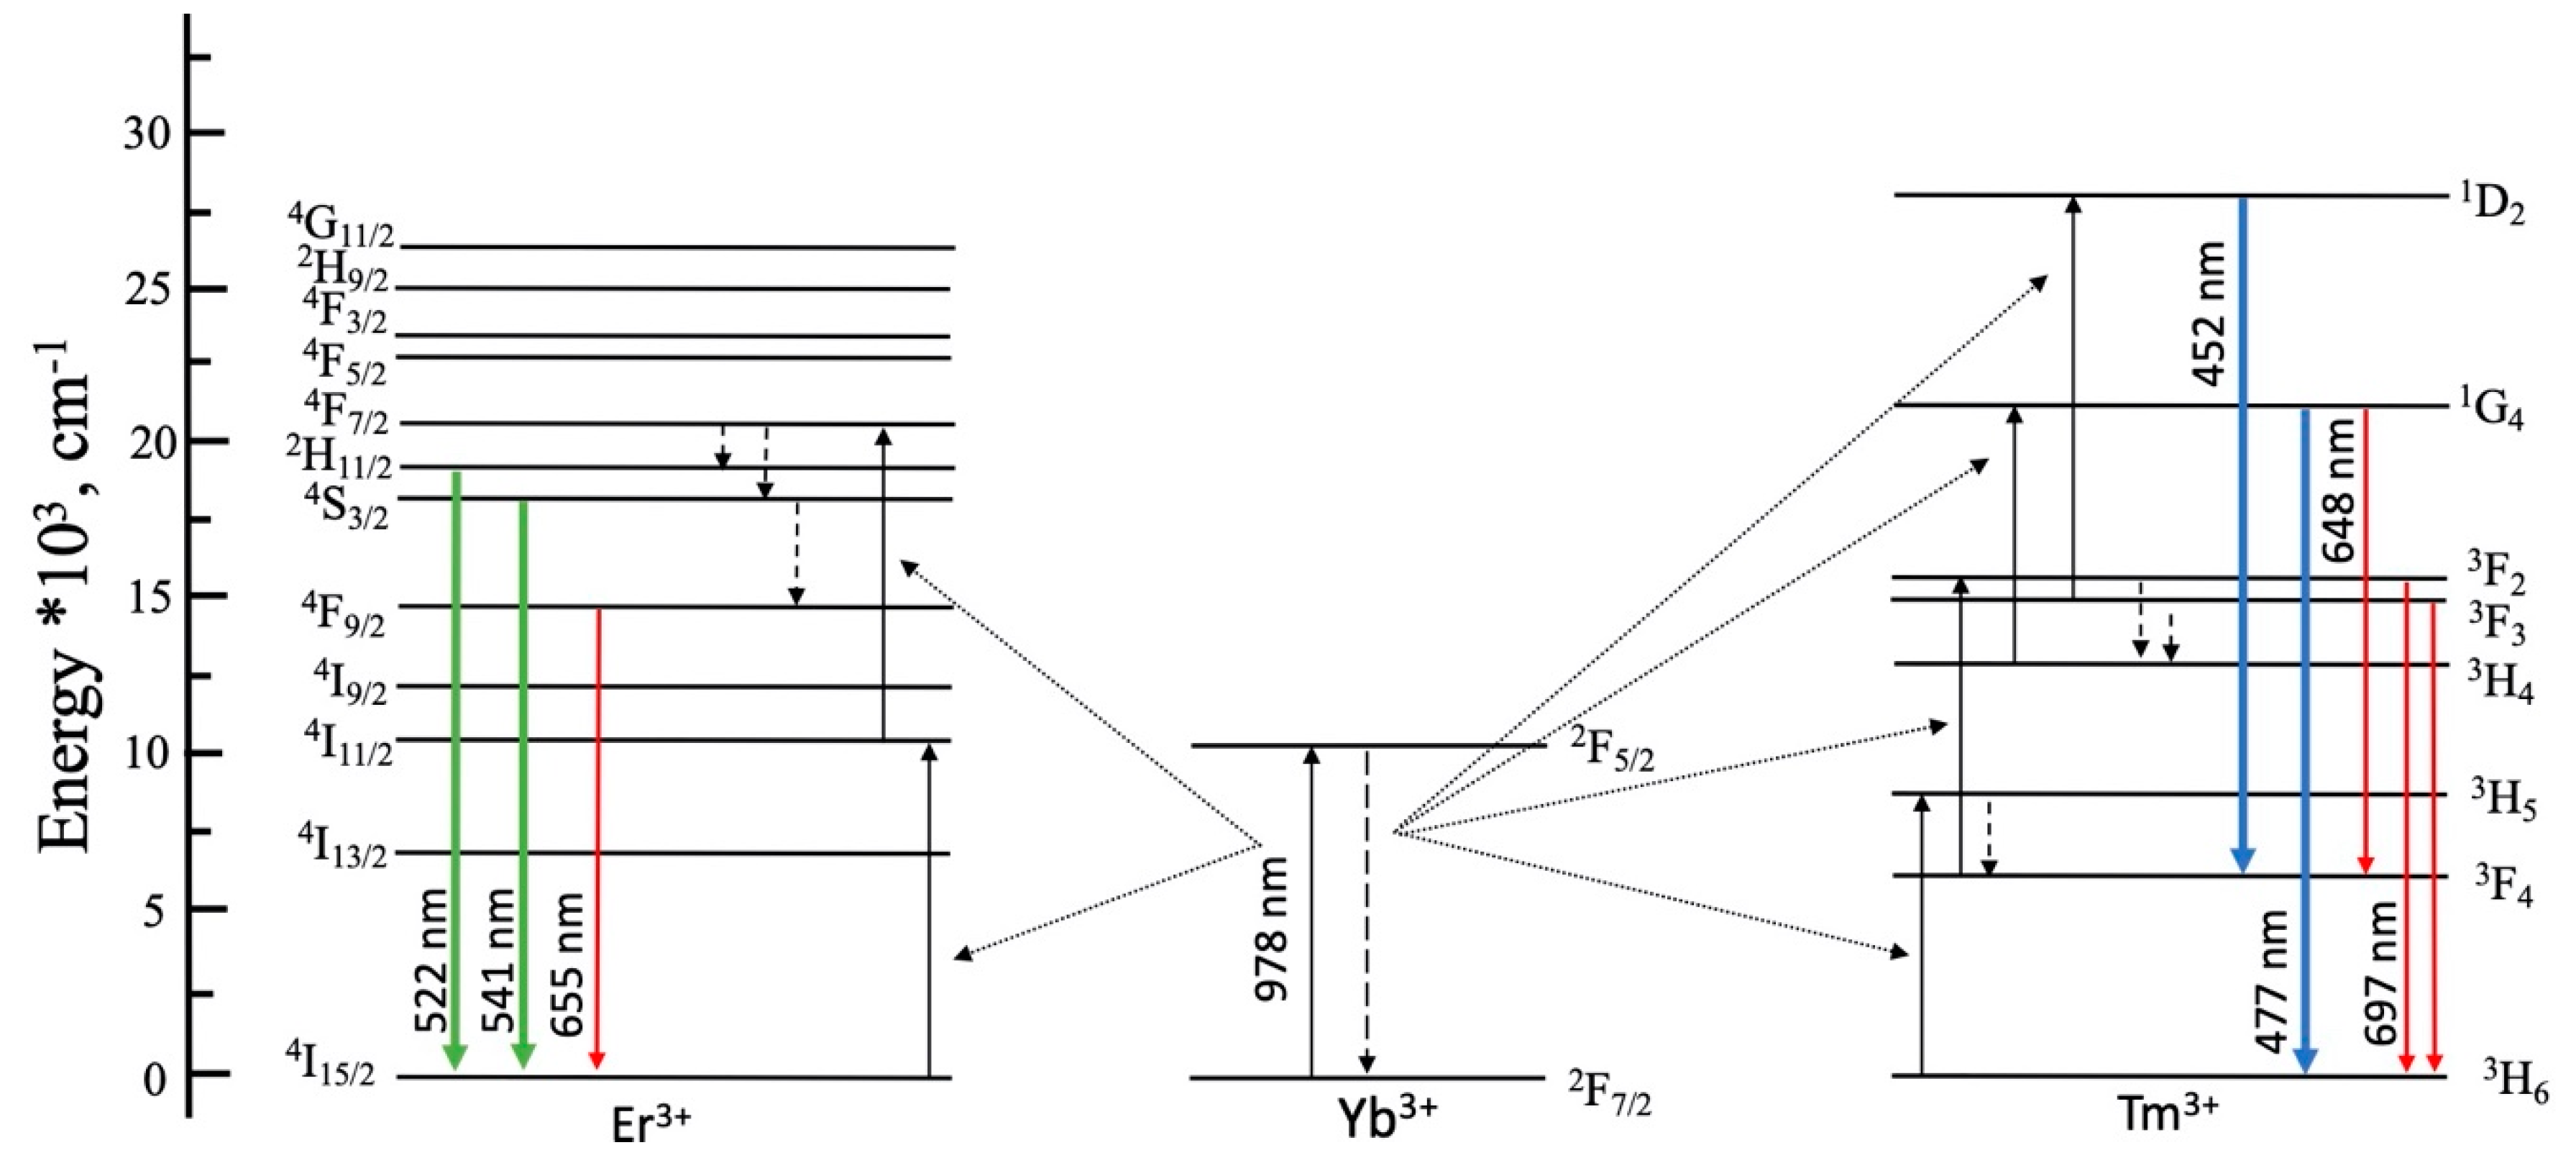
3.2. Luminescence Properties

Upconversion spectra of NaYF4: 20% Yb, 1% Er microcrystals with different Gd3+ concentration upon 980 nm excitation are shown in Figure 5a.
Emission spectra measured in the spectral range 500–700 nm consisted of characteristic sharp lines corresponding to the intra-configurational 4f transitions of erbium ions. The observed emission peaks are assigned to 2H11/24I15/2 (522 and 529 nm), 4S3/24I15/2 (541 and 548 nm), and the most prominent 4F9/24I15/2 (655 and 661 nm) transitions [17,33]. Note, concentration of Gd3+ ions non-monotonically affected emission intensity. Optimal Gd3+ co-doping concentration was 5% for green emission, whereas red emission showed equal intensities for 5% and 10% Gd3+ co-doped samples. An example of Gd3+ concentration dependence of emission intensity (4S3/24I15/2 integral intensity) of NaYF4: 20% Yb, 1% Er, Gd phosphors is shown in Figure 5b. At first, luminescence intensity increased along with Gd3+ ions growth, reaching a maximum at 5%. Further increase in Gd3+ ions resulted in concentration quenching.
Figure 5c presents upconversion spectra of NaYF4:20% Yb, 1% Tm powders with different Gd concentration upon 980 nm excitation. The obtained emission spectra include the following transitions: 1D23F4 (452 nm), 1G43H6 (477 nm), 1G43F4 (648 nm and 656 nm), and 3F2,33H6 (697 nm) [32,34]. Similar to NaYF4: Yb, Er, Gd samples, the addition of gadolinium ions in NaYF4: Yb, Tm phosphors significantly affected emission intensity. Evolution of 1G43H6 integral intensity as a function of Gd3+ concentration is presented in Figure 5d. Analyzing the obtained experimental data, we concluded that the best luminescence intensity enhancement was achieved for 5% Gd3+-co-doped powder.
Upconversion intensity enhancement by Gd3+ co-doping of NaYF4: Yb, Er or NaYF4: Yb, Tm is usually explained by host phase transition from cubic to hexagonal, which would significantly improve luminescence intensity [17,35]. However, in our case, hexagonal phase formed even in the case of Gd3+-free powders. Introduction of Gd3+ ions in the NaYF4 host leads to the formation of crystal lattice defects, as shown in Figure 2c,d, which change the symmetry of the surroundings of ytterbium, thulium, and erbium ions. Thereby, energy transfer processes and/or radiative transitions become more possible from the symmetry point of view, which leads to an increase in luminescence intensity [36]. This suggestion is confirmed by comparison of Gd3+ (r = 1.193 Å) and Y3+ (r = 1.159 Å) ionic radii [31] displaying possible appearance of crystal lattice defects as a result of gadolinium co-doping. The addition of a large amount of Gd3+ ions reduced Er3+ and Tm3+ luminescence due to two co-directional processes. Firstly, large numbers of crystal lattice defects enhance nonradiative decay rate, which decreases luminescence intensity. Secondly, high Gd3+ co-doping concentration promotes energy transfer from high excited states of thulium and erbium to gadolinium ions [36].
To study the mechanism of upconversion processes in NaYF4: Yb, Er, Gd and NaYF4: Yb, Tm, Gd phosphors, we measured the emission intensity dependence on pump power. The upconversion emission intensity (IUC) increased proportionally to the pumping power (p) of the excitation source according to IUC–Pn, where n is the number of photons that pump the population in a particular energy level [26,36]. Therefore, n, the number of photons involved in the upconversion emission, can be obtained from the logarithmic plot of the integral emission intensity vs. the incident laser power. Figure 6a–c show the plot of the integral emission intensity of the green and red emission lines as a function of the pump laser power for NaYF4: Yb, Er, Gd powders.
All experimental data can be perfectly fitted using linear function with the slopes of 1.79–2.22 on a log-log plot giving n ≈ 2. We concluded that the observed 2H11/24I15/2, 4S3/24I15/2 and 4S3/24I15/2 transitions in NaYF4: Yb, Er, and Gd samples originated from two-photon process [37] irrespective of Gd3+ co-doping concentration. Figure 4d–f present integral emission intensity of the blue and red emission lines as a function of the pump laser power for NaYF4: Yb, Tm, and Gd powders. Similar to NaYF4: Yb, Er, and Gd samples, the amount of Gd3+ ions did not affect the number of photons needed to excite certain transition. 1D23F4, 1G43H6, and 3F2,33H6 transitions require absorption of 4, 3, and 2 photons, respectively.
Based on the obtained experimental data, the energy level diagrams of Yb3+, Er3+, and Tm3+ ions, as well as the possible energy transfer mechanisms for upconversion emissions in NaYF4 host upon 980 nm excitation, are shown in Figure 7.
Gd3+ ions have a very large energy gap between ground 8S7/2 and first-excited 6P7/2 states (>30,000 cm−1). Therefore, gadolinium ions could participate in energy transfer processes in highly-doped NaYF4: Yb, Er, Gd and NaYF4: Yb, Tm, Gd samples. Large numbers of Gd3+ ions promote quenching of Er3+ and Tm3+ emission through depopulation of their upper excited levels by following energy transfers: 4G9/24I15/2 (Er3+):8S7/26IJ (Gd3+), 4G7/2 and 2K13/24I15/2 (Er3+):8S7/26PJ (Gd3+); 3P0,1,23H6 (Tm3+):8S7/26IJ (Gd3+); and 1I63H6 (Tm3+):8S7/26P7/2,5/2 (Gd3+) [36,37,38]. When upper energy levels of Er3+ and Tm3+ are populated (even minor amounts), there are two possibilities of energy dissipation: (1) internal conversion to lower levels of Er3+ and Tm3+ followed by luminescence and (2) the energy transfer to Gd3+. Therefore, a large concentration of Gd3+ ions significantly decreases the population of upper energy levels of Er3+ and Tm3+, leading to some decrease in the population of the states from which luminescence occurs.
To provide a more detailed study of the Gd3+ co-doping effect on luminescence properties of NaYF4: Yb, Er, Gd and NaYF4: Yb, Tm, and Gd powders, we carried out kinetics measurements. Decay curves of NaYF4: 20% Yb, 1% Er/1% Tm (without Gd3+ co-doping); NaYF4: 20% Yb, 1% Er/1% Tm, 5% Gd (the most prominent sample); and NaYF4: 20% Yb, 1% Er/1% Tm, 20% Gd (highly Gd3+ co-doped sample) were recorded (Figure 8).
Notably, the kinetics studies were performed upon Stokes excitation (λex = 375 and 355 nm for Er3+ and Tm3+-doped phosphors, respectively). 4S3/24I15/2 (541 nm) and 4F9/24I15/2 (655 nm) transitions were monitored in Er3+-doped samples, and 1G43H6 (477 nm) transition was measured in Tm3+-doped powders. All experimental decay curves displayed non-single exponential behavior and two exponential models were applied for fitting. Average luminescence lifetime (τav) was calculated according to the following equation to simplify comparison [35,36]:
τ av = A 1 τ 1 2 + A 2 τ 2 2 A 1 τ 1 + A 2 τ 2
where A1 and A2 are pre-exponential constants, and τ1 and τ2 are fitting lifetimes (Table S1, Supplementary Materials). The calculated lifetimes of NaYF4: Yb, Er, Gd and NaYF4: Yb, Tm, Gd powders are listed in Table 1. The obtained lifetimes are in agreement with the previous studies, where the typical luminescence lifetimes are in the range of 0.1–0.5 ms depending on the morphology and composition [38,39,40,41].
The introduction of 5% Gd3+ ions affected the average lifetime more profoundly compared with 20% Gd3+ doped sample, which is consistent with earlier the observed concentration dependence of emission intensity. Nonmonotonic lifetime changes in Er3+ and Tm3+-doped phosphors may be due to different mechanisms of Gd doping on the monitored emission transitions.

4. Conclusions

We synthesized hexagonal NaYF4 microcrystals co-doped with different rare earth ions Yb3+, Tm3+/Er3+, and Gd3+ via a hydrothermal method: NaY0.79−хYb0,20Er0.01GdxF4 and NaY0.79−хYb0,20Tm0.01GdxF4 (x = 0–0.2). The size of the synthesized particles was determined to be about 800 nm for NaY079Yb0,20Tm0.01F4 and NaY0.79Yb0,20Er0.01F4, and about 600 nm for NaY0.79−хYb0,20Er0.01GdxF4 and NaY0.79−хYb0,20Tm0.01GdxF4. The decrease in particle size when co-doped with Gd3+ ions is explained by the slower crystal growth rates due to an increase in the electron charge density of the crystal surface in Gd3+-co-doped microcrystals. XRD showed that all the samples consisted of hexagonal phase and the addition of Gd3+ did not lead to phase transformation.
All synthesized materials demonstrated prominent upconversion luminescence upon 980 nm excitation. The addition of gadolinium enhances upconversion luminescence. This is probably associated with the appearance of crystal lattice defects, which change the symmetry of the surroundings of ytterbium, thulium, and erbium ions. Thus, energy transfer processes and/or radiative transitions become enabled from the symmetry point of view, which results in an increase in luminescence intensity. Larger numbers of Gd3+ ions promote quenching of Er3+ and Tm3+ emission through depopulation of their upper excited levels. We found an optimal composition of the particles for the maximum intensity luminescence: NaYF4: 20% Yb, 1% Er, 5% Gd and NaYF4: 20% Yb, 1% Tm, 5% Gd. Possible energy transfer mechanisms for upconversion emissions in NaYF4 host co-doped with different rare earth ions Yb, Tm, Er, and Gd upon 980 nm excitation were proposed.

Supplementary Materials

The following are available online at https://www.mdpi.com/1996-1944/13/15/3397/s1, Figure S1: (a) The dependence of red emission (655 nm) intensity on the Gd3+ amount in NaYF4: 20% Yb, 1%, Er, Gd microparticles; (b) the dependence of red emission (648 nm) intensity on the Gd3+ amount in of NaYF4: 20% Yb, 1%, Tm, Gd microparticles, Table S1: Luminescence lifetimes of Yb, 1% Er/1% Tm, Gd microparticles.

Author Contributions

Synthesis, writing—original draft preparation, A.A.V.; measuring the luminescence spectra, writing—review and editing, I.E.K.; data analysis, I.I.T.; analysis and interpretation of luminescence spectra, review and editing, E.L., writing—review and editing, N.A.B.; data analysis, M.Y.S.; supervision, funding acquisition, A.S.M. All authors have read and agreed to the published version of the manuscript.

Funding

Russian Fund for Basic Research (RFBR), project number 20-33-70025.

Acknowledgments

The measurements were performed in the Research Park of Saint-Petersburg State University (Magnetic Resonance Research Centre, SPbU Computing Centre, Cryogenic Department, Interdisciplinary Resource Centre for Nanotechnology, Centre for X-ray Diffraction Studies, and Centre for Optical and Laser Materials Research). The reported study was funded by RFBR, project number 20-33-70025. The authors acknowledge Evgeniy Kipelkin, David Zheglov, Nikolay Nedelko, Aglaya Kazumova, Nikita Saratovskiy, Kamil Zakharov, Anna Oleynik, and Olga Freinkman for help with the experiments.

Conflicts of Interest

The authors declare no conflict of interest.

References

  1. Auzel, F. Upconversion and Anti-Stokes Processes with f and d Ions in Solids. Chem. Rev. 2004, 4, 139–173. [Google Scholar] [CrossRef] [PubMed]
  2. Liang, L.; Wu, H.; Hu, H.; Wu, M.; Su, Q. Enhanced blue and green upconversion in hydrothermally synthesized hexagonal NaY1−xYbxF4: Ln3+(Ln3+ = Er3+ or Tm3+). J. Alloys Compd. 2004, 368, 94–100. [Google Scholar] [CrossRef]
  3. Page, R.H.; Schaffers, K.I.; Waide, P.A.; Tassano, J.B.; Payne, S.A.; Krupke, W.K. Upconversion-pumped luminescence efficiency of rare-earth-doped hosts sensitized with trivalent ytterbium. J. Opt. Soc. Am. B 1998, 15, 996–1008. [Google Scholar] [CrossRef]
  4. Kumar, B.R.; Nyk, M.; Ohulchanskyy, T.Y.; Flask, C.A.; Prasad, P.N. Combined Optical and MR Bioimaging Using Rare Earth Ion Doped NaYF4 Nanocrystals. Adv. Funct. Mater. 2009, 19, 853–859. [Google Scholar] [CrossRef]
  5. Wang, Z.; Tao, F.; Yao, L.; Cai, W.; Li, X. Selected synthesis of cubic and hexagonal NaYF4 crystals via a complex-assisted hydrothermal route. J. Cryst. Growth 2006, 290, 296–300. [Google Scholar] [CrossRef]
  6. Chen, X.; Zhao, Z.; Jiang, M.; Que, D.; Shi, S.; Zheng, N. Preparation and photodynamic therapy application of NaYF4: Yb, Tm/NaYF4: Yb, Er multifunctional upconverting nanoparticles. New J. Chem. 2013, 37, 1782–1788. [Google Scholar] [CrossRef]
  7. Liu, X.; Qian, H.; Ji, Y.; Li, Z.; Shao, Y.; Hu, Y.; Tong, G.; Li, L.; Guo, W.; Guo, H. Mesoporous silica-coated NaYF4 nanocrystals: Facile synthesis, in vitro bioimaging and photodynamic therapy of cancer cells. RSC Adv. 2012, 2, 12263–12268. [Google Scholar] [CrossRef]
  8. Miteva, T.; Yakutkin, V.; Nelles, G.; Baluschev, S. Annihilation assisted upconversion: All-organic, flexible and transparent multicolour display. New J. Phys. 2008, 10, 103002. [Google Scholar] [CrossRef]
  9. Martin, N.; Boutinaud, P.; Malinowski, M.; Mahiou, R.; Cousseins, J.C. Optical spectra and analysis of Pr3+ in b-NaYF4. J. Alloys Compd. 1998, 277, 304–306. [Google Scholar] [CrossRef]
  10. Tropper, A.C.; Carter, J.N.; Lauder, R.D.T.; Hanna, D.C. Analysis of blue and red laser performance of the infrared-pumped praseodymium-doped fluoride fiber laser. J. Opt. Soc. Am. B 1994, 11, 886–893. [Google Scholar] [CrossRef] [Green Version]
  11. Sandrock, T.; Scheife, H.; Heumann, E.; Huber, G. High-power continuous-wave upconversion fiber laser at room temperature. Opt. Let. 1997, 22, 808–810. [Google Scholar] [CrossRef] [PubMed]
  12. Yu, X.; Li, M.; Xie, M.; Chen, L.; Li, Y.; Wang, Q. Dopant-Controlled Synthesis of Water-Soluble Hexagonal NaYF4 Nanorods with Efficient Upconversion Fluorescence for Multicolor Bioimaging. Nano Res. 2010, 3, 51–60. [Google Scholar] [CrossRef] [Green Version]
  13. Ren, W.; Tian, G.; Jian, S.; Gu, Z.; Zhou, L.; Yan, L.; Jin, S.; Yin, W. TWEEN coated NaYF4: Yb, Er/NaYF4 core/shell upconversion nanoparicles for bioimaging and drug delivery. RSC Adv. 2012, 2, 7037–7041. [Google Scholar] [CrossRef]
  14. Das, P.; Sedighi, A.; Krull, U.J. Cancer biomarker determination by resonance energy transfer using functional fluorescent nanoprobes. Anal. Chim. Acta. 2018, 1041, 1–24. [Google Scholar] [CrossRef] [PubMed]
  15. Wang, W.; Huang, W.; Ni, Y.; Lu, C.; Xu, Z. Different Upconversion Properties of β-NaYF4: Yb3+, Tm3+/Er3+ in Affecting the Near-Infrared-Driven Photocatalytic Activity of High-Reactive TiO2. ACS Appl. Mater. Interfaces 2014, 6, 340–348. [Google Scholar] [CrossRef] [PubMed]
  16. Jiang, T.; Qin, W.; Zhou, J. Hydrothermal synthesis and aspect ratio dependent upconversion luminescence of NaYF4: Yb3+/Er3+ microcrystals. J. Nanosci. Nanotechnol. 2016, 16, 3806–3810. [Google Scholar] [CrossRef]
  17. Klier, D.T.; Kumke, M.U. Upconversion Luminescence Properties of NaYF4:Yb:Er Nanoparticles Co-doped with Gd3+. Opt. Mater. 2015, 90, 200–207. [Google Scholar] [CrossRef]
  18. He, E.; Zheng, H.; Gao, W.; Tu, Y.; Lu, Y.; Li, G. Investigation of upconversion and downconversion fluorescence emissions from β-NaLn1F4: Yb3+, Ln23+ (Ln1 = Y, Lu; Ln2 = Er, Ho, Tm, Eu) hexagonal disk system. Mater. Res. Bull. 2013, 48, 3505–3512. [Google Scholar] [CrossRef]
  19. Ding, M.; Lu, C.; Cao, L.; Ni, Y.; Xu, Z. Controllable synthesis, formation mechanism and upconversion luminescence of β-NaYF4: Yb3+/Er3+ microcrystals by hydrothermal process. Cryst. Eng. Comm. 2013, 15, 8366–8373. [Google Scholar] [CrossRef]
  20. Vukovic, M.; Mancic, L.; Dinic, I.; Vulic, P.; Nikolic, M.; Tan, Z.; Milosevic, O. The gadolinium effect on crystallization behavior and luminescence of β-NaYF4: Yb, Er phase. Int. J. Appl. Ceram. Technol. 2019, 17, 1445–1452. [Google Scholar] [CrossRef]
  21. Pires, A.M.; Heer, S.; Güdel, H.U.; Serra, O.A. Er, Yb Doped Yttrium Based Nanosized Phosphors: Particle Size, “Host Lattice” and Doping Ion Concentration Effects on Upconversion Efficiency. J. Fluoresc. 2006, 16, 461–468. [Google Scholar] [CrossRef] [PubMed]
  22. Zhang, J.; Riesen, H. Mechanochemical preparation of nanocrystalline NaYF4: Gd3+/Yb3+/Tm3+: An efficient upconversion phosphor. Chem. Phys. Lett. 2015, 641, 1–4. [Google Scholar] [CrossRef]
  23. Yi, G.D.; Chow, G.M. Synthesis of Hexagonal-Phase NaYF4: Yb, Er and NaYF4: Yb, Tm Nanocrystals with Efficient Up-Conversion Fluorescence. Adv. Funct. Mater. 2006, 16, 2324–2329. [Google Scholar] [CrossRef]
  24. Liu, X.; Zhao, J.; Sun, Y.; Song, K.; Yu, Y.; Du, C.; Kong, X.; Zhang, H. Ionothermal synthesis of hexagonal-phase NaYF4:Yb3+, Er3+/Tm3+ upconversion nanophosphors. Chem. Comm. 2009, 43, 6628–6630. [Google Scholar] [CrossRef]
  25. Zhou, S.; Deng, K.; Wei, X.; Jiang, G.; Duan, C.; Chen, Y.; Yin, M. Upconversion luminescence of NaYF4: Yb3+, Er3+ for temperature sensing. Opt. Commun. 2013, 291, 138–142. [Google Scholar] [CrossRef]
  26. Liang, B.X.; Wang, X.; Zhuang, J.; Peng, Q.; Li, Y. Synthesis of NaYF4 Nanocrystals with Predictable Phase and Shape. Adv. Funct. Mater. 2007, 17, 2757–2765. [Google Scholar] [CrossRef]
  27. Sui, Y.; Tao, K.; Tian, Q.; Sun, K. Interaction Between Y3+ and Oleate Ions for the Cubic-to-Hexagonal Phase Transformation of NaYF4 Nanocrystals. J. Phys. Chem. 2012, 116, 1732–1739. [Google Scholar] [CrossRef]
  28. Qian, H.; Zhang, Y. Synthesis of Hexagonal-Phase Core-Shell NaYF4 Nanocrystals with Tunable Upconversion Fluorescence. Langmuir 2008, 24, 12123–12125. [Google Scholar] [CrossRef]
  29. Tong, L.; Li, X.; Hua, R.; Li, X.; Zheng, H.; Sun, J.; Zhang, J.; Cheng, L.; Chen, B. Comparative study on upconversion luminescence and temperature sensing of α- and β- NaYF4: Yb3+/Er3+ nano-/micro-crystals derived from a microwave-assisted hydrothermal route. J. Lumin. 2015, 167, 386–390. [Google Scholar] [CrossRef]
  30. Yu, S.; Gao, X.; Jing, H.; Zhao, J.; Su, H. A synthesis and up-conversional photoluminescence study of hexagonal phase NaYF4:Yb,Er nanoparticles. Cryst. Eng. Comm. 2013, 15, 10100–10106. [Google Scholar] [CrossRef]
  31. Wang, F.; Han, Y.; Lim, C.S.; Lu, Y.; Wang, J.; Xu, J.; Chen, H.; Zhang, C.; Hong, M.; Liu, X. Simultaneous phase and size control of upconversion nanocrystals through lanthanide doping. Nature 2010, 463, 1061–1065. [Google Scholar] [CrossRef] [PubMed]
  32. Damasco, J.A.; Chen, G.; Shao, W.; Agren, H.; Huang, H.; Song, W.; Lovell, J.F.; Prasad, P.N. Size-Tunable and Monodisperse Tm3+/Gd3+-Doped Hexagonal NaYF4 Nanoparticles with Engineered Efficient Near Infrared-to-Near Infrared Upconversion for in Vivo Imaging. ACS Appl. Mater. Interfaces 2014, 6, 13884–13893. [Google Scholar] [CrossRef] [PubMed] [Green Version]
  33. Kalinichev, A.A.; Kurochkin, M.A.; Kolomytsev, A.Y.; Khasbieva, R.S.; Kolesnikov, E.Y.; Lähderanta, E.; Kolesnikov, I.E. Yb3+/Er3+-codoped GeO2-PbO-PbF2 glass ceramics for ratiometric upconversion temperature sensing based on thermally and non-thermally coupled levels. Opt. Mater. 2019, 90, 200–207. [Google Scholar] [CrossRef]
  34. Kolesnikov, I.E.; Kurochkin, M.A.; Kalinichev, A.A.; Kolesnikov, E.Y.; Lähderanta, E. Optical temperature sensing in Tm3+/Yb3+-doped GeO2-PbO-PbF2 glass ceramics based on ratiometric and spectral line position approaches. Sens. Actuators A 2018, 284, 251–259. [Google Scholar] [CrossRef]
  35. Wu, Y.; Lin, S.; Shao, W.; Zhang, X.; Xu, J.; Yu, L.; Chen, K. Enhanced up-conversion luminescence from NaYF4:Yb,Er nanocrystals be Gd3+ ions induced phase transformation and plasmonic Au nonsphere arrays. RSC Adv. 2016, 6, 102869–102874. [Google Scholar] [CrossRef]
  36. Shi, F.; Zhao, Y. Sub-10 nm and monodisperse b-NaYF4: Yb, Tm, Gd nanocrystals with intense ultraviolet upconversion luminescence. J. Mater. Chem. 2014, 2, 2198–2203. [Google Scholar] [CrossRef]
  37. Galleani, G.; Santagneli, S.H.; Lendemi, Y.; Messaddeq, Y. Ultraviolet Upconversion Luminescence in a Highly Transparent Triply-Doped Gd3+-Tm3+-Yb3+ Fluoride-Phosphate Glasses. J. Phys. Chem. 2018, 122, 2275–2284. [Google Scholar] [CrossRef]
  38. Zheng, K.; Zhao, D.; Zhang, D.; Liu, N.; Shi, F.; Qin, W.J. Sensitized high-order ultraviolet upconversion emissions of Gd3+ by Er3+ in NaYF4 microcrystals. J. Alloys Compd. 2011, 509, 5848–5852. [Google Scholar] [CrossRef]
  39. Li, C.; Quan, Z.; Yang, J.; Yang, P.; Lin, J. Highly Uniform and Monodisperse β-NaYF4: Ln3+ (Ln = Eu, Tb, Yb/Er, and Yb/Tm) Hexagonal Microprism Crystals: Hydrothermal Synthesis and Luminescent Properties. Inorg. Chem. 2007, 46, 6329–6337. [Google Scholar] [CrossRef]
  40. Arppe, R.; Hyppänen, I.; Perälä, N.; Peltomaa, R.; Kaiser, M.; Würth, C.; Christ, S.; Resch-Genger, U.; Schäferling, M.; Soukka, T. Quenching of the upconversion luminescence of NaYF4:Yb3+, Er3+ and NaYF4: Yb3+, Tm3+ nanophosphors by water: The role of the sensitizer Yb3+ in non-radiative relaxation. Nanoscale 2015, 7, 11746–11757. [Google Scholar] [CrossRef] [Green Version]
  41. Shi, F.; Wang, J.; Zhang, D.; Qin, G.; Qin, W. Greatly enhanced size-tunable ultraviolet upconversion luminescence of monodisperse β-NaYF4: Yb, Tm nanocrystals. J. Mater.Chem. 2011, 21, 13413–13421. [Google Scholar] [CrossRef]
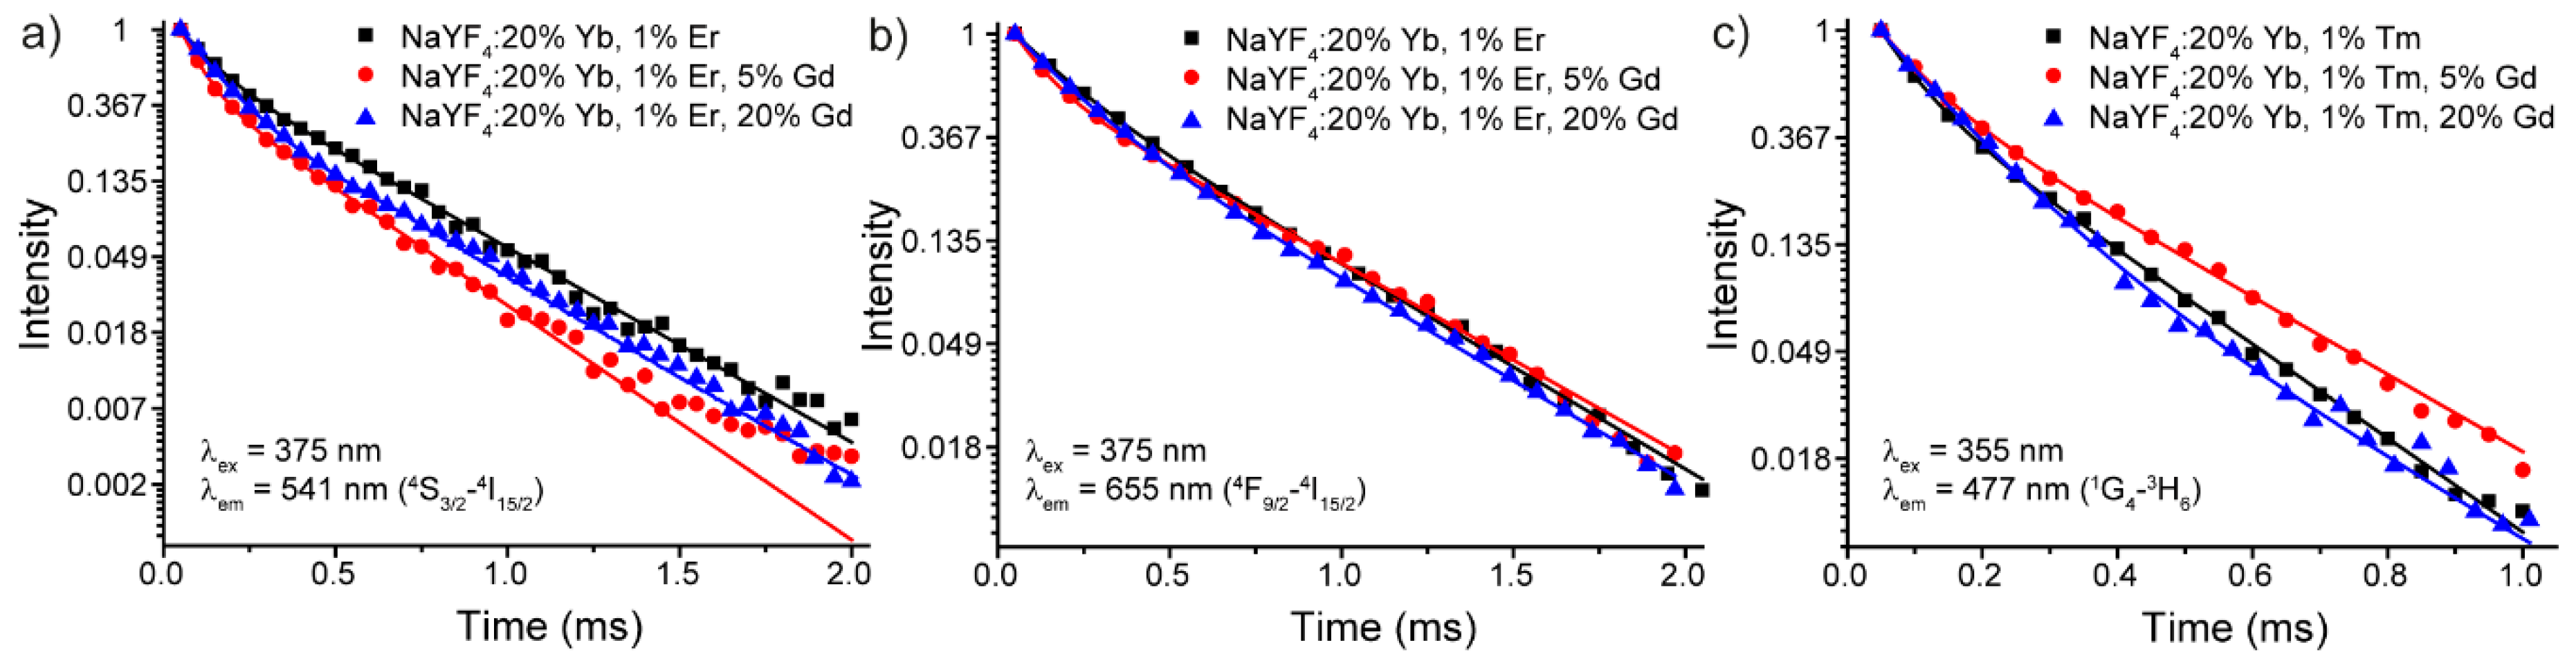
Figure 1. XRD patterns of the samples: (a) β -NaYF4: 20% Yb, 1% Tm, (b) β -NaYF4: 20%Yb, 1% Er, (c) β -NaYF4: 20% Yb, 1% Tm, 5% Gd, and (d) β -NaYF4: 20% Yb, 1% Er, 5% Gd. Blue lines show standard values for pure hexagonal β -NaYF4.
Materials 13 03397 g001
Figure 2. SEM images of the samples: (a) β -NaYF4: 20% Yb, 1% Tm, (b) β -NaYF4: 20% Yb, 1% Er, (c) β -NaYF4: 20% Yb, 1% Tm, 5% Gd, and (d) β -NaYF4: 20% Yb, 1% Er, 5% Gd. All the samples were synthesized with the same reaction time (24 h).
Materials 13 03397 g002
Figure 3. AFM image of the sample β -NaYF4: 20%Yb, 1% Tm, 5% Gd.
Materials 13 03397 g003
Figure 4. EDX spectra of the samples: (a) β -NaYF4: 20%Yb, 1% Tm, (b) β -NaYF4: 20%Yb, 1% Er, (c) β -NaYF4: 20%Yb, 1% Tm, 5% Gd, and (d) β -NaYF4: 20%Yb, 1% Er, 5% Gd.
Materials 13 03397 g004
Figure 5. (a) Upconversion luminescence of NaYF4: 20% Yb, 1% Er microparticles with different Gd3+ concentrations, (b) the dependence of green emission (541 nm) intensity on the Gd3+ amount, (c) upconversion luminescence of NaYF4: 20% Yb, 1% Tm microparticles with different Gd3+ concentration, and (d) the dependence of blue emission (477 nm) intensity on the Gd3+ amount.
Materials 13 03397 g005
Figure 6. Dependence of integral upconversion luminescence on laser power of (a) NaYF4: 20% Yb, 1% Er; (b) NaYF4: 20% Yb, 1% Er, 5% Gd; (c) NaYF4: 20% Yb, 1% Er, 20% Gd; (d) NaYF4: 20% Yb, 1% Tm; (e) NaYF4: 20% Yb, 1% Tm, 5% Gd; and (f) NaYF4: 20% Yb, 1% Tm, 20% Gd microparticles.
Materials 13 03397 g006
Figure 7. Schematic energy level diagrams of Yb3+, Tm3+, Er3+, and possible upconversion emission processes upon 980 nm excitation.
Materials 13 03397 g007
Figure 8. Decay curves of NaYF4: 20% Yb, 1% Er/1% Tm, Gd microparticles monitored for (a) 4S3/24I15/2 (541 nm), (b) 4F9/24I15/2 (655 nm), and (c) 1G43H6 (477 nm) transitions.
Materials 13 03397 g008
Table 1. Average luminescence lifetimes of Yb, 1% Er/1% Tm, Gd microparticles.
SampleTransitionτav, ms
NaYF4: 20% Yb, 1% Er4S3/24I15/2 (541 nm)0.34
NaYF4: 20% Yb, 1% Er, 5% Gd 0.25
NaYF4: 20% Yb, 1% Er, 20% Gd 0.33
NaYF4: 20% Yb, 1% Er4F9/24I15/2 (655 nm)0.46
NaYF4: 20% Yb, 1% Er, 5% Gd 0.48
NaYF4: 20% Yb, 1% Er, 20% Gd 0.44
NaYF4: 20% Yb, 1% Tm1G43H6 (477 nm)0.19
NaYF4: 20% Yb, 1% Tm, 5% Gd 0.23
NaYF4: 20% Yb, 1% Tm, 20%Gd 0.18

