A Method to Assess the Relevance of Nanomaterial Dissolution during Reactivity Testing

 , ,
, , 
Abstract

1. Introduction
2. Materials and Methods
2.1. Materials
2.2. FRAS
2.3. EPR
2.4. DCFH2-DA
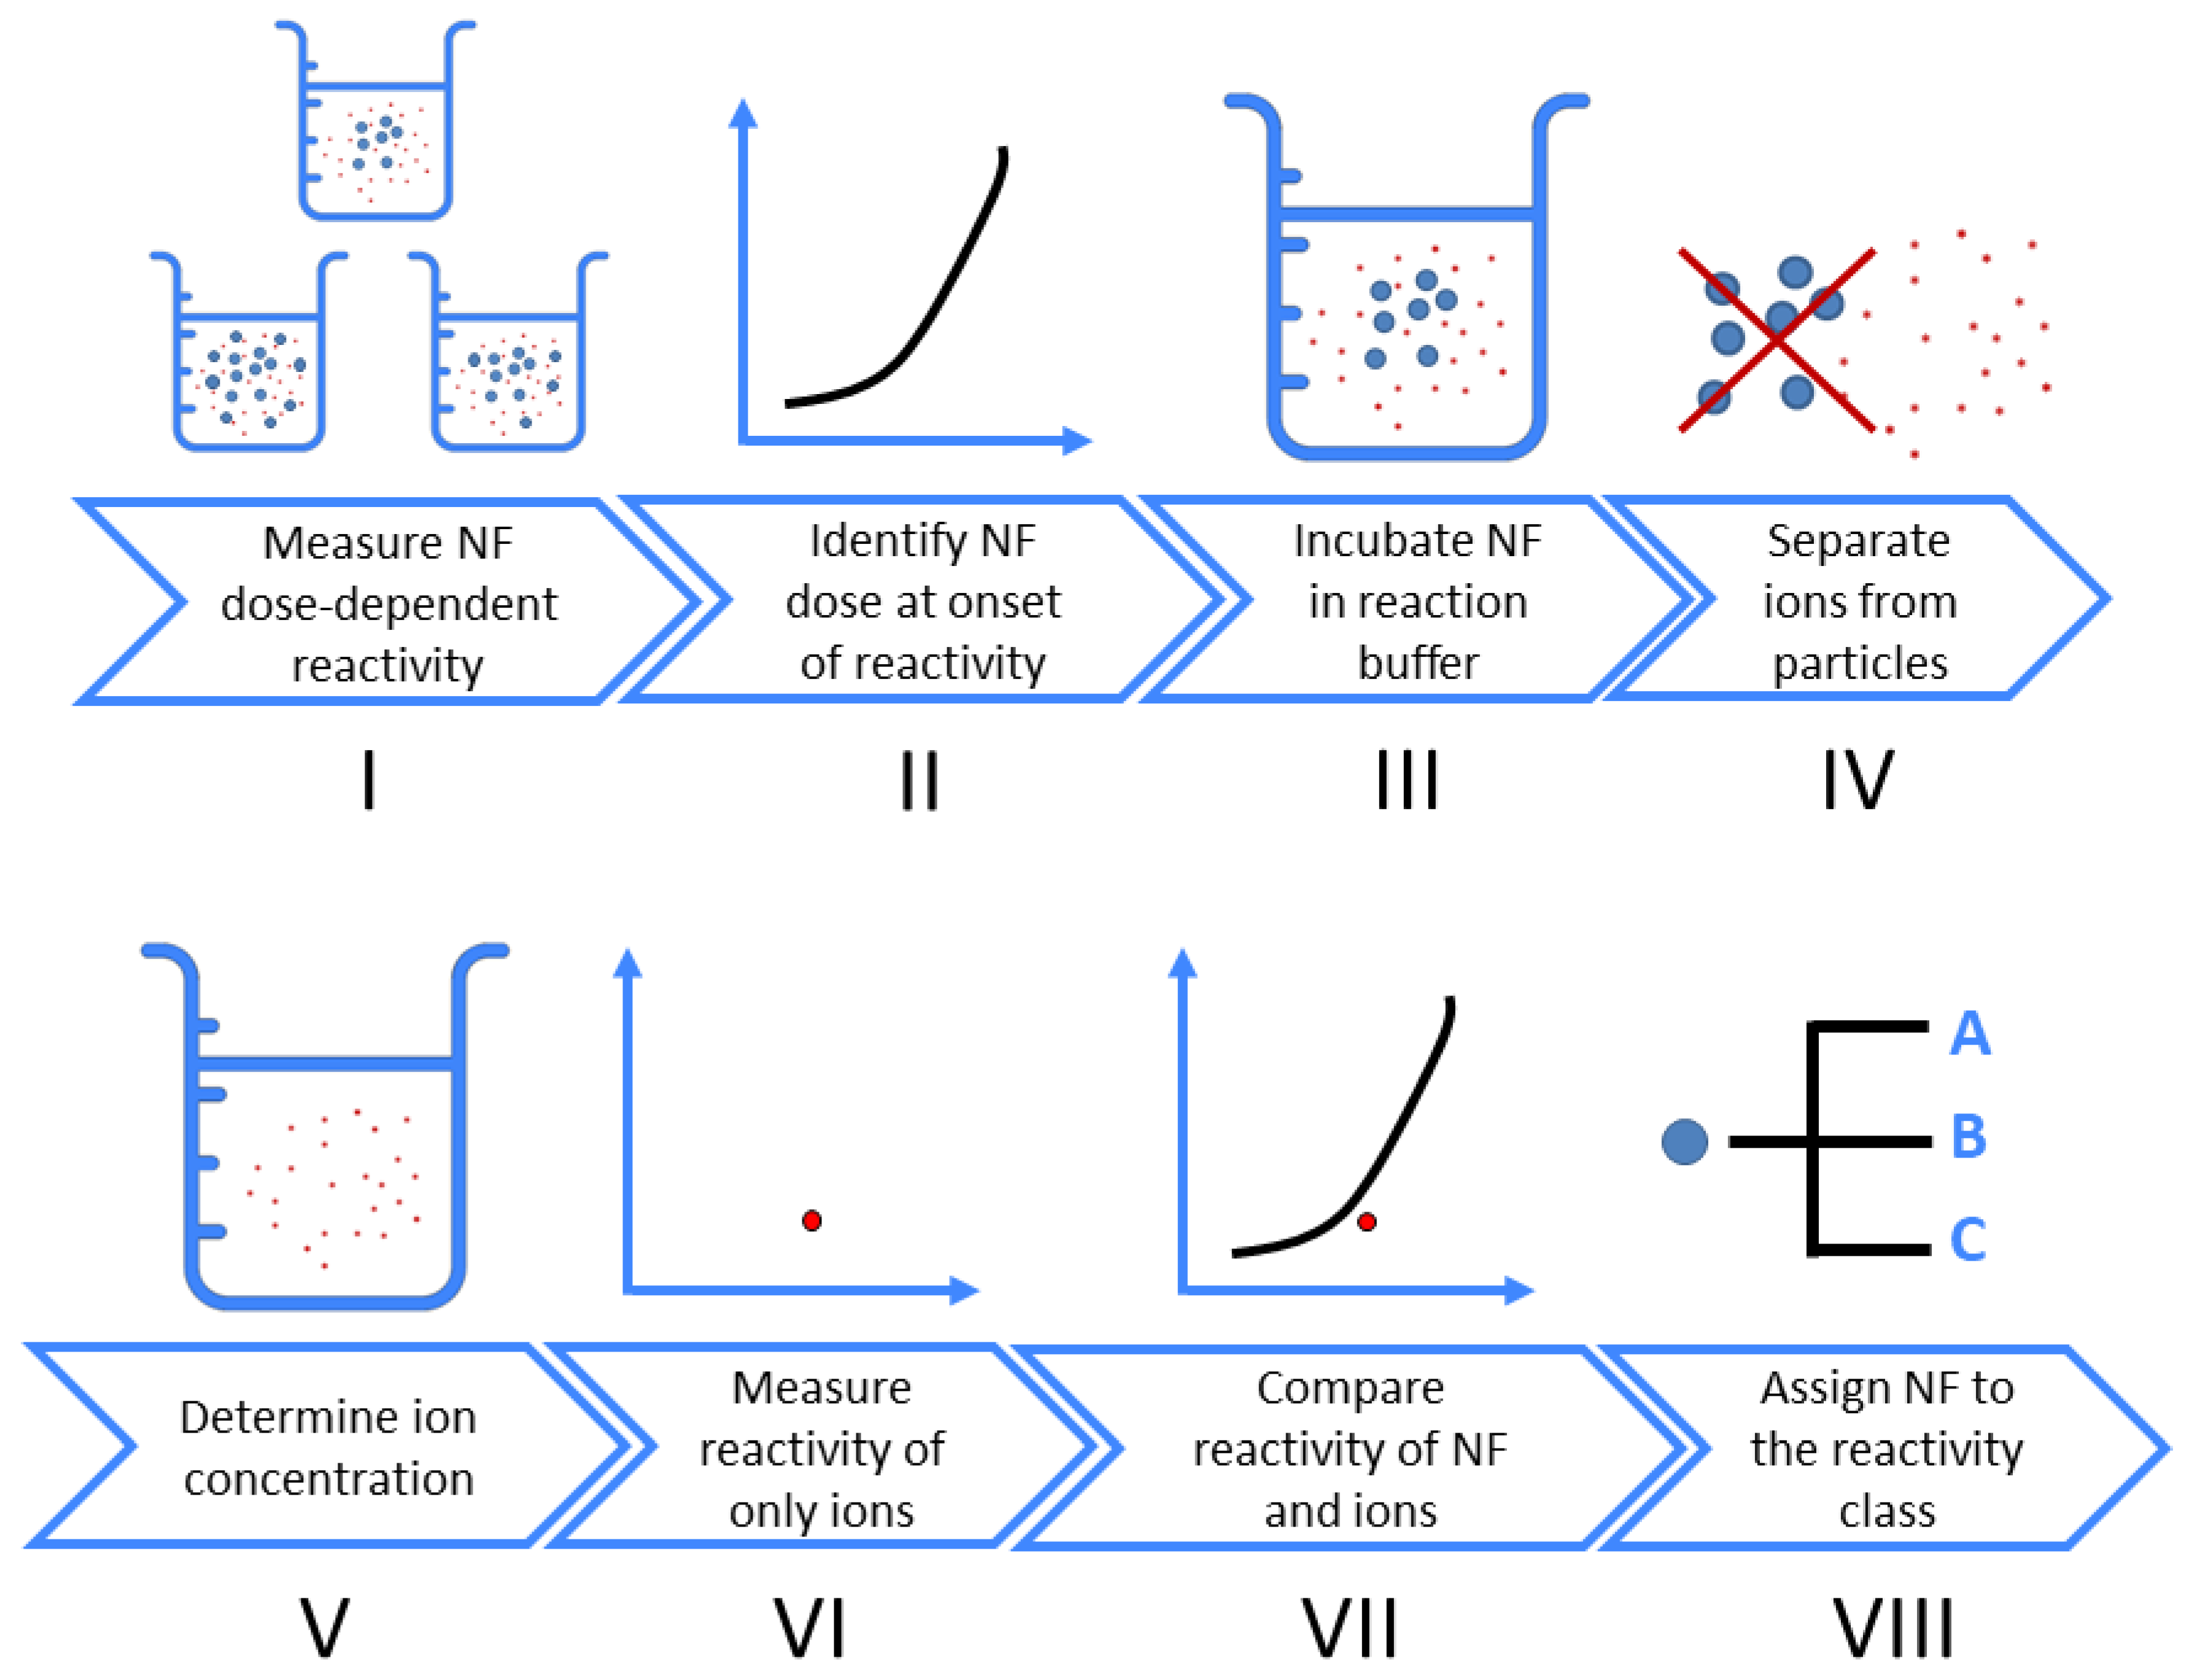
2.5. Workflow
3. Results and Discussion
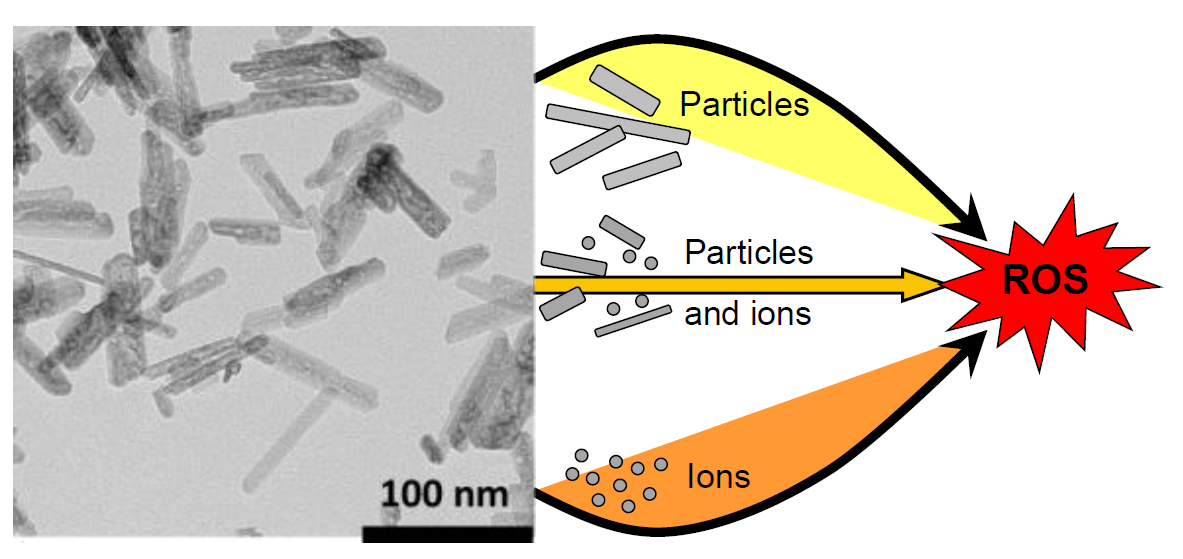
3.1. Concept of Reactivity Classes and Workflow
- (A)
- Soluble NFs, for which suspension reactivity is determined by particle reactivity, either because the ions released are less reactive than the NF or because ion release kinetics are slow or because the solubility limit is below the ion effect threshold.
- (a)
- Most literature shows that a reduced toxicity of ions as compared to particle toxicity is the exception rather than the rule [22].
- (b)
- Examples include spherical SiO2 at pH above 6.
- (B)
- Soluble NFs, for which both particles and ions contribute significantly to reactivity, depending on medium and exposure duration. Read-across of NFs is possible only after detailed analysis of rates of dissolution as well as information on the reactivity of NFs and ions.
- (a)
- Ag-particles in a system with apparent equilibration of ion release.
- (C)
- Soluble NFs, for which suspension reactivity can be quantified by read-across using ion reactivity. This can be the consequence of two options: (I) The case in which reactivity of ions and particles is similar; (II) the case in which the concentration of released ions strongly exceeds the concentration of particles, whilst this does not discount by the possibility of the particles being far more reactive than the ions, the rate of dissolution is such that the ions are considered the primary source of reactivity.
- (a)
- Examples with regard to toxicity include Pb-based perovskites (very high rates of dissolution) and ZnO-nanoparticles of different size and shape (time-dependent kinetics, but in general toxicity of Zn-ions and Zn NFs similar).
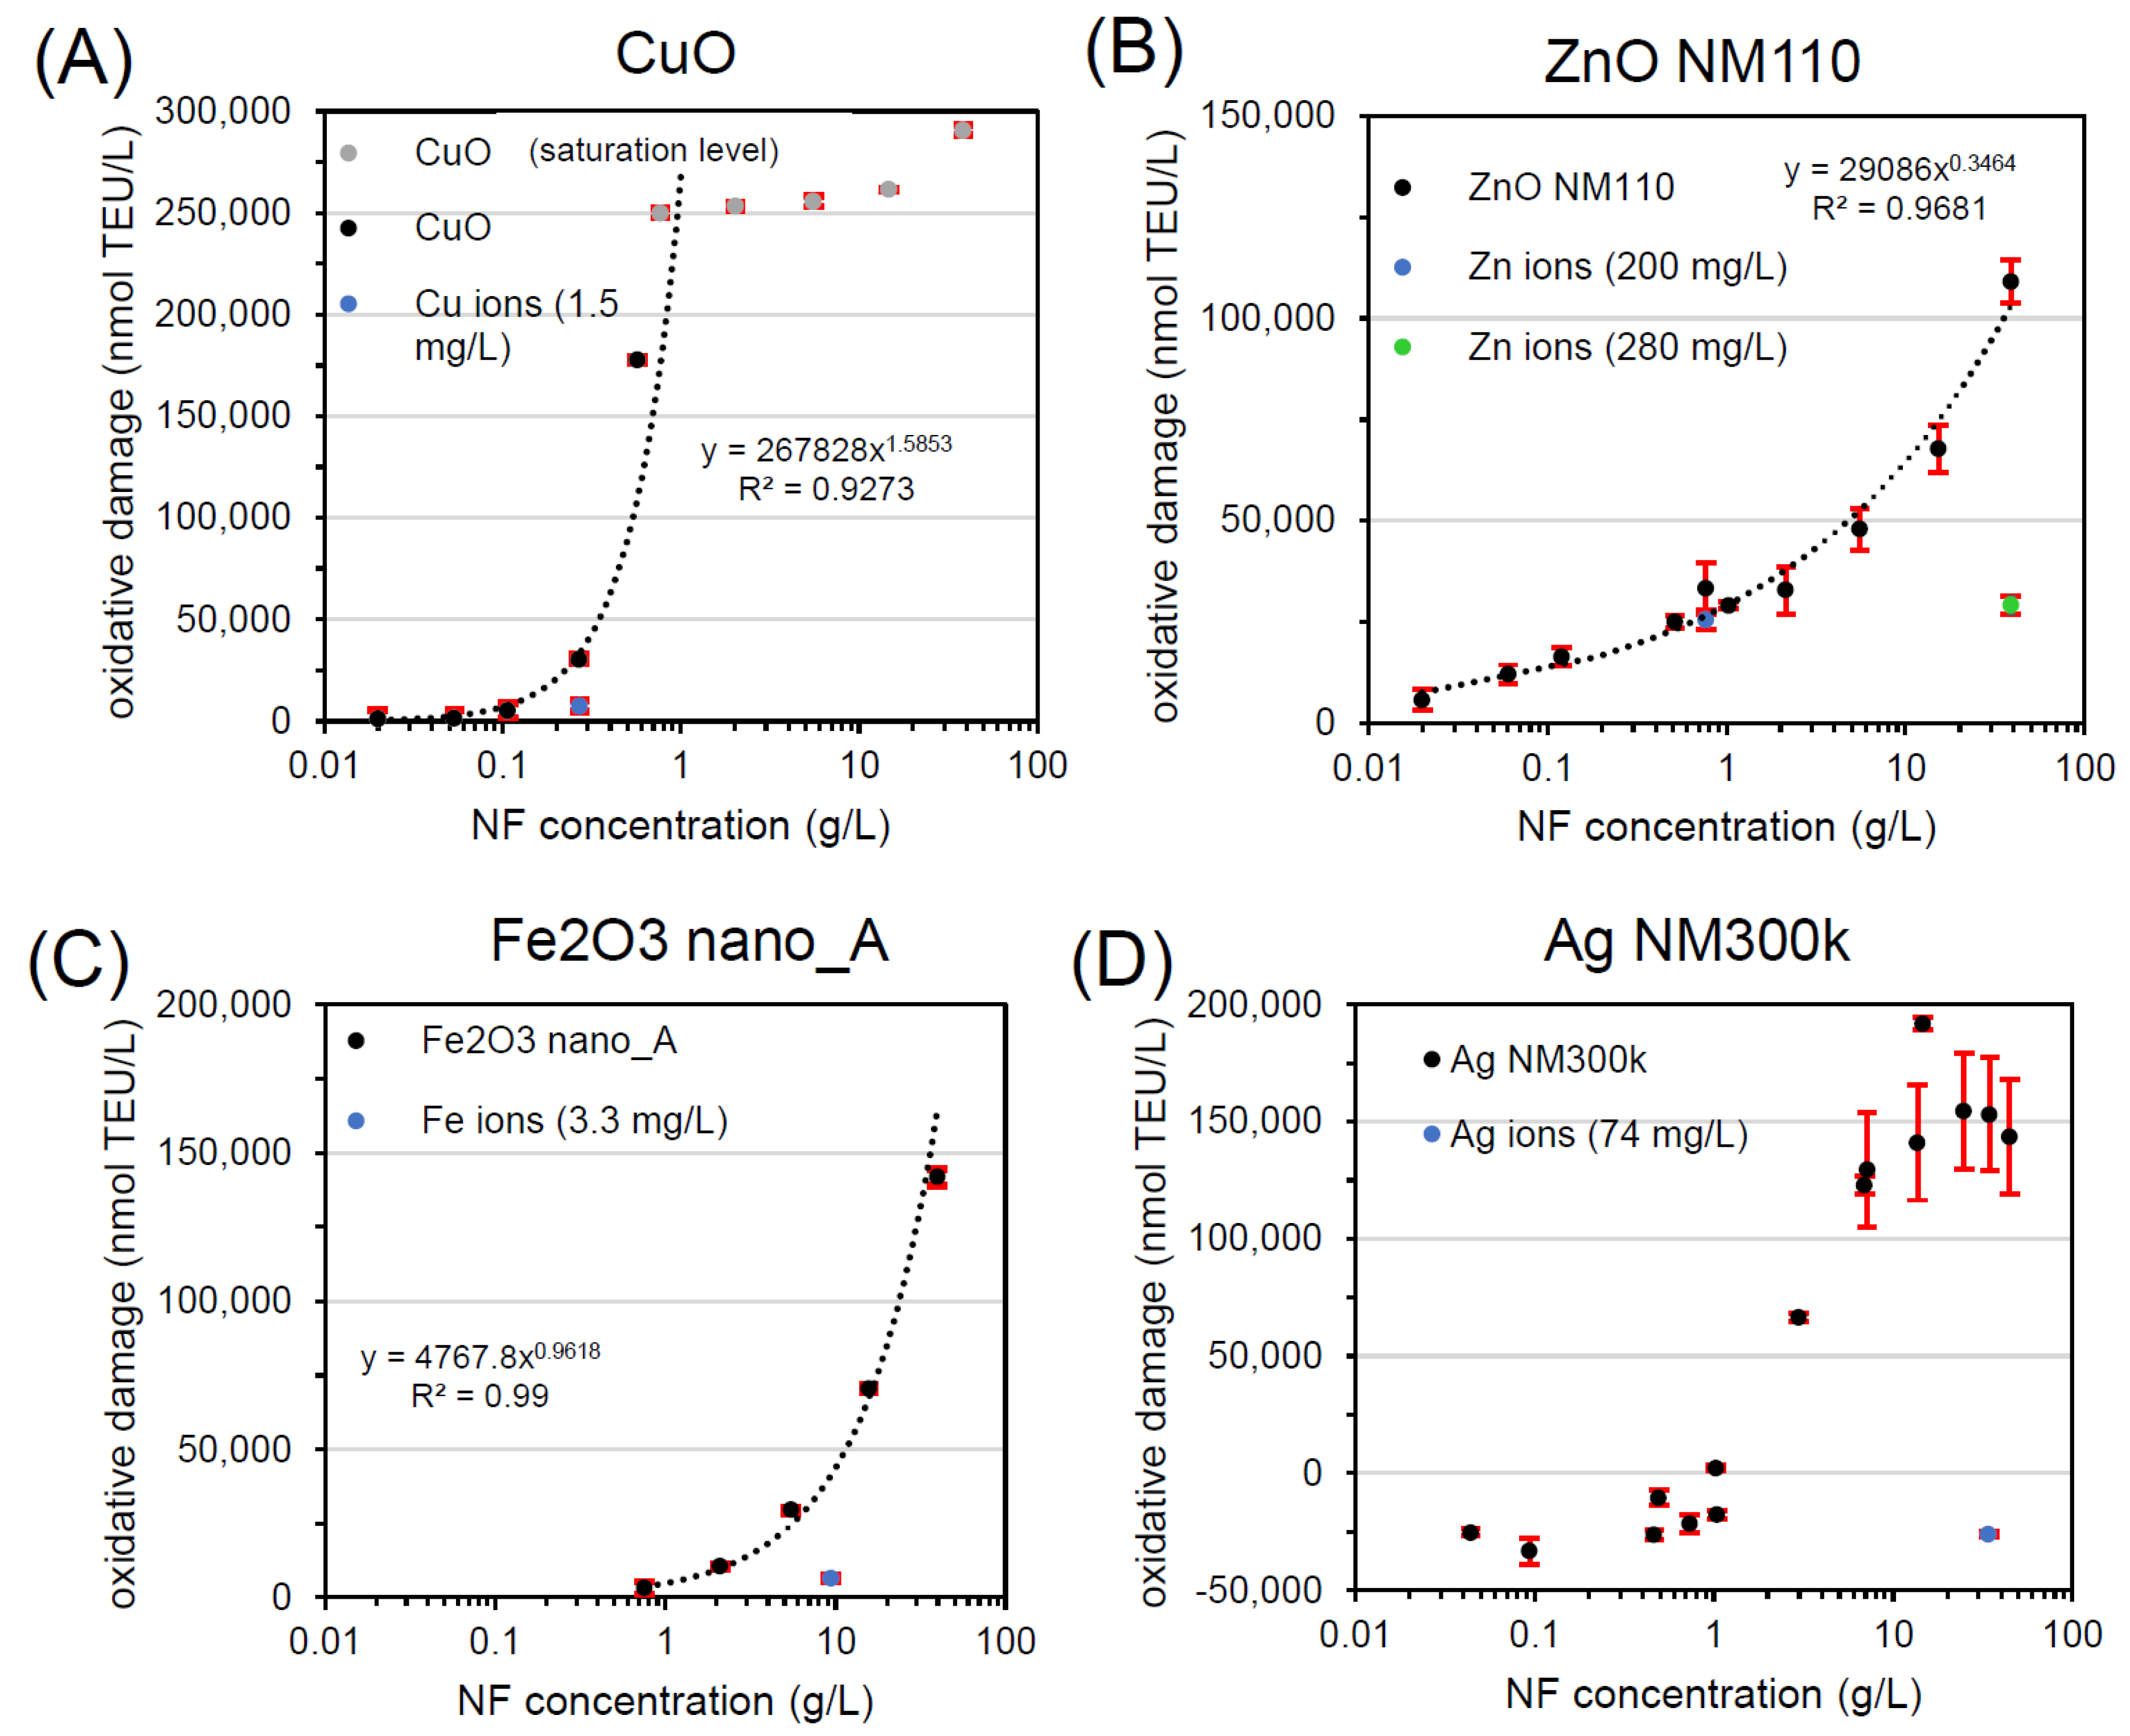
3.2. Implementation of Workflow on Different NFs in One Assay
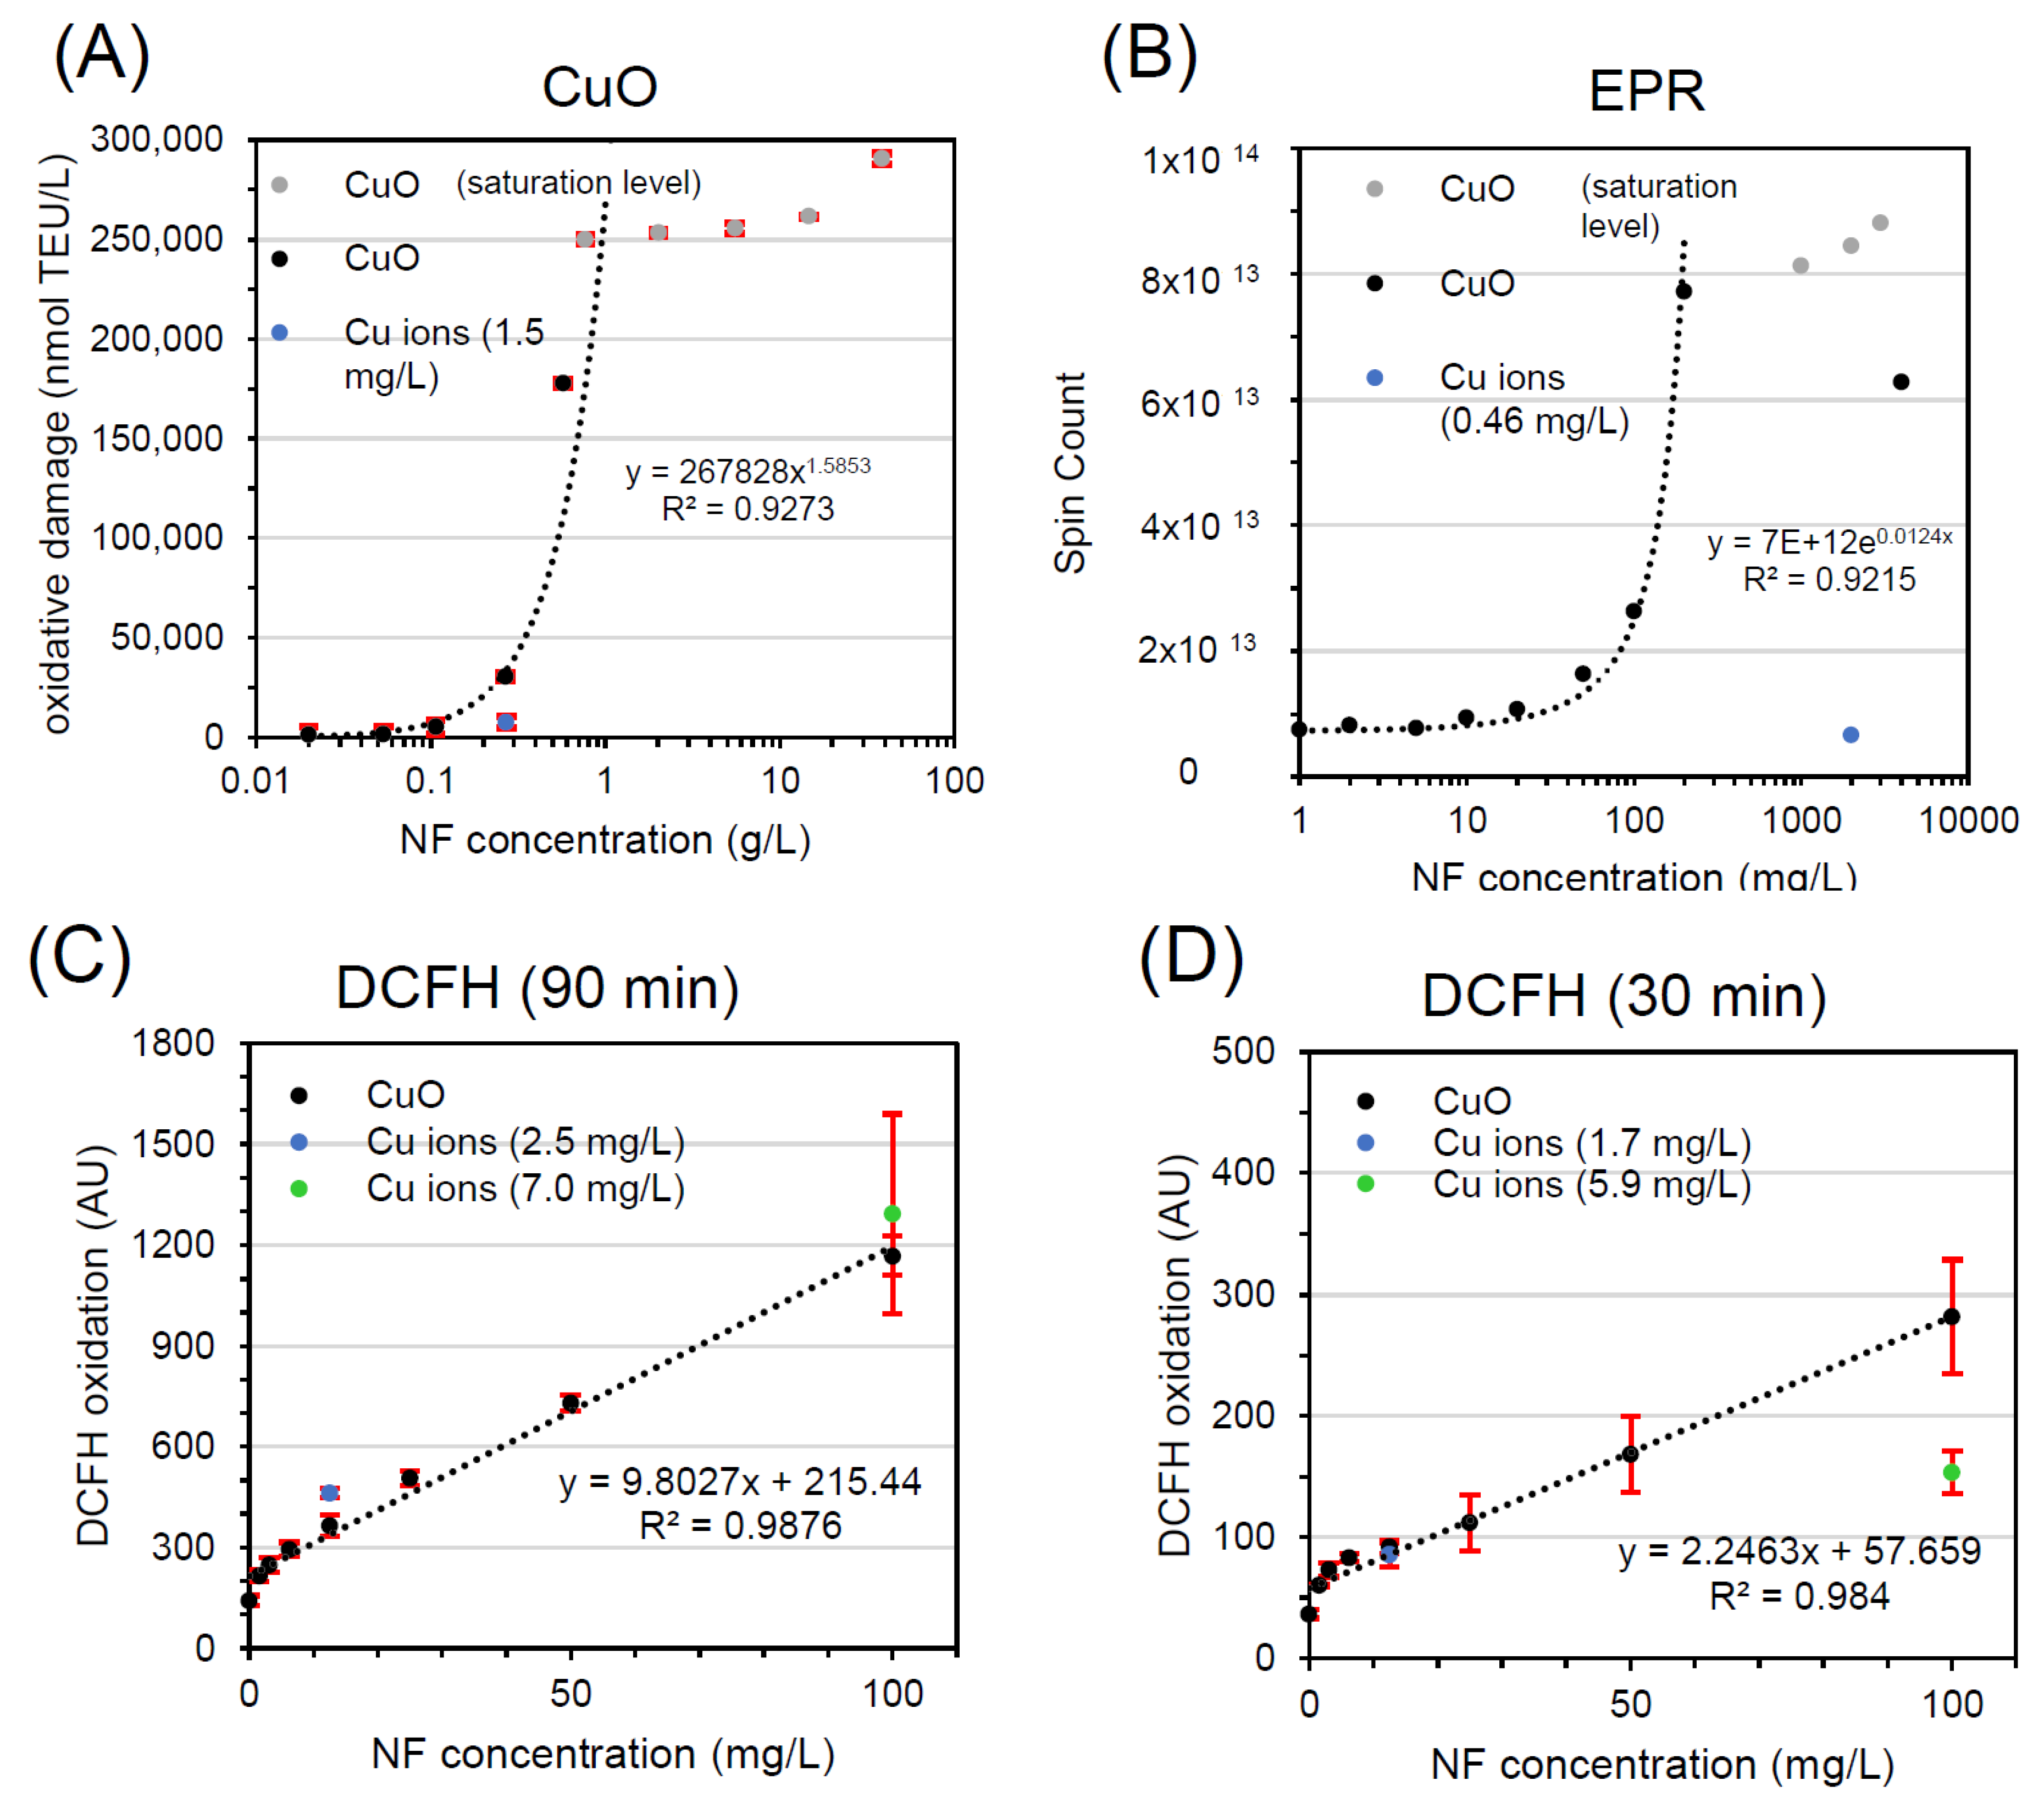
3.3. Implementation of Workflow on One NF in Different Assays
4. Conclusions
Supplementary Materials
Author Contributions
Funding
Conflicts of Interest
References
- Ministère de l’Environnement, Éléments Issus des Déclarations des Substances à L’État Nanoparticulaire: Exercice 2015; Ministère de l’Environnement, de l’Énergie et de la Mer: Paris, France, 2015.
- Wohlleben, W.; Punckt, C.; Aghassi-Hagmann, J.; Siebers, F.; Menzel, F.; Esken, D.; Drexel, C.-P.; Zoz, H.; Benz, H.U.; Weier, A.; et al. Nanoenabled Products: Categories, Manufacture, and Applications: Protocols and Industrial Innovations. In Metrology and Standardization for Nanotechnology: Protocols and Industrial Innovations; Mansfield, E., Kaiser, D.L., Fujita, D., Voorde, M.V.d., Eds.; John Wiley & Sons: Hoboken, NJ, USA, 2017; pp. 411–464. [Google Scholar]
- The European Commission. Commission Regulation (EU) 2018/1881 of 3 December 2018 amending Regulation (EC) No 1907/2006 of the European Parliament and of the Council on the Registration, Evaluation, Authorisation and Restriction of Chemicals (REACH) as regards Annexes I, III, VI, VII, VIII, IX, X, XI, and XII to address nanoforms of substances (Text with EEA relevance.). In C/2018/7942; The European Commission, Ed.; Publications Office of the European Union: Luxembourg, 2018. [Google Scholar]
- Oomen, A.G.; Steinhäuser, K.G.; Bleeker, E.A.J.; van Broekhuizen, F.; Sips, A.; Dekkers, S.; Wijnhoven, S.W.P.; Sayre, P.G. Risk assessment frameworks for nanomaterials: Scope, link to regulations, applicability, and outline for future directions in view of needed increase in efficiency. NanoImpact 2018, 9 (Suppl. C), 1–13. [Google Scholar] [CrossRef]
- Oomen, A.G.; Bleeker, E.A.; Bos, P.M.; van Broekhuizen, F.; Gottardo, S.; Groenewold, M.; Hristozov, D.; Hund-Rinke, K.; Irfan, M.-A.; Marcomini, A.; et al. Grouping and read-across approaches for risk assessment of nanomaterials. Int. J. Environ. Res. Public Health 2015, 12, 13415–13434. [Google Scholar] [CrossRef] [PubMed]
- Zhang, H.; Ji, Z.; Xia, T.; Meng, H.; Low-Kam, C.; Liu, R.; Pokhrel, S.; Lin, S.; Wang, X.; Liao, Y.P.; et al. Use of Metal Oxide Nanoparticle Band Gap to Develop a Predictive Paradigm for Oxidative Stress and Acute Pulmonary Inflammation. ACS Nano 2012, 6, 4349–4368. [Google Scholar] [CrossRef] [PubMed]
- Arts, J.H.E.; Hadi, M.; Irfan, M.-A.; Keene, A.M.; Kreiling, R.; Lyon, D.; Maier, M.; Michel, K.; Petry, T.; Sauer, U.G.; et al. A decision-making framework for the grouping and testing of nanomaterials (DF4nanoGrouping). Regul. Toxicol. Pharmacol. 2015, 71, 1–27. [Google Scholar] [CrossRef] [PubMed]
- Hund-Rinke, K.; Schlich, K.; Kühnel, D.; Hellack, B.; Kaminski, H.; Nickel, C. Grouping concept for metal and metal oxide nanomaterials with regard to their ecotoxicological effects on algae, daphnids and fish embryos. NanoImpact 2018, 9, 52–60. [Google Scholar]
- Wohlleben, W.; Hellack, B.; Nickel, C.; Herrchen, M.; Hund-Rinke, K.; Kettler, K.; Riebeling, C.; Haase, A.; Funk, B.; Kühnel, D.; et al. The nanoGRAVUR framework to group (nano)materials for their occupational, consumer, environmental risks based on a harmonized set of material properties, applied to 34 case studies. Nanoscale 2019, 11, 17637–17654. [Google Scholar] [CrossRef] [PubMed]
- McCarrick, S.; Wei, Z.; Moelijker, N.; Derr, R.; Persson, K.-A.; Hendriks, G.; Odnevall Wallinder, I.; Hedberg, Y.; Karlsson, H.L. High variability in toxicity of welding fume nanoparticles from stainless steel in lung cells and reporter cell lines: The role of particle reactivity and solubility. Nanotoxicology 2019, 13, 1293–1309. [Google Scholar] [CrossRef] [PubMed]
- Appendix, R.6-1 for Nanoforms Applicable to the Guidance on QSARs and Grouping of Chemicals; European Chemical Agency (ECHA): Helsinki, Finland, 2019; ED-04-19-681-EN-N.
- Appendix for Nanoforms Applicable to the Guidance on Registration and Substance Identification; European Chemicals Agency (ECHA): Helsinki, Finland, 2019; ED-02-889-EN-N.
- Bi, X.; Westerhoff, P. Ferric reducing reactivity assay with theoretical kinetic modeling uncovers electron transfer schemes of metallic-nanoparticle-mediated redox in water solutions. Environ. Sci. Nano 2019, 6, 1791–1798. [Google Scholar] [CrossRef]
- Hellack, B.; Nickel, C.; Albrecht, C.; Kuhlbusch, T.A.J.; Boland, S.; Baeza-Squiban, A.; Wohlleben, W.; Schins, R.P.F. Analytical methods to assess the oxidative potential of nanoparticles: A review. Environ. Sci. Nano 2017, 4, 1920–1934. [Google Scholar] [CrossRef]
- Gray, E.P.; Browning, C.L.; Wang, M.; Gion, K.D.; Chao, E.Y.; Koski, K.J.; Kane, A.B.; Hurt, R.H. Biodissolution and cellular response to MoO 3 nanoribbons and a new framework for early hazard screening for 2D materials. Environ. Sci. Nano 2018, 5, 2545–2559. [Google Scholar] [CrossRef] [PubMed]
- Anders, C.B.; Eixenberger, J.E.; Franco, N.A.; Hermann, R.J.; Rainey, K.D.; Chess, J.J.; Punnoose, A.; Wingett, D.G. ZnO nanoparticle preparation route influences surface reactivity, dissolution and cytotoxicity. Environ. Sci. Nano 2018, 5, 572–588. [Google Scholar] [CrossRef] [PubMed]
- Stark, W.; Stoessel, P.; Wohlleben, W.; Hafner, A. Industrial applications of nanoparticles. Chem. Soc. Rev. 2015, 44, 5793–5805. [Google Scholar] [CrossRef] [PubMed]
- JRC Nanomaterials Repository. Available online: https://ec.europa.eu/jrc/en/scientific-tool/jrc-nanomaterials-repository (accessed on 2 May 2020).
- Maier, G.; Romazanov, J.; Krug, H.; Hund-Rinke, K.; Locoro, G.; Wick, P.; Kuhlbusch, T.A.J.; Werner, J.; Mast, J.; Kördel, W.; et al. NM-Series of Representative Manufactured Nanomaterials. NM-300 Silver Characterisation, Stability, Homogeneity—Study; JRC60709; European Commission Joint Research Centre: Brussels, Belgium, 2011; pp. 1–86. [Google Scholar]
- Hsieh, S.-F.; Bello, D.; Schmidt, D.F.; Pal, A.K.; Stella, A.; Isaacs, J.A.; Rogers, E.J. Mapping the Biological Oxidative Damage of Engineered Nanomaterials. Small 2013, 9, 1853–1865. [Google Scholar] [CrossRef] [PubMed]
- Gandon, A.; Werle, K.; Neubauer, N.; Wohlleben, W. In Surface reactivity measurements as required for grouping and read-across: An advanced FRAS protocol. J. Phys. Conf. Ser. 2017, 838, 012033. [Google Scholar] [CrossRef]
- Hua, J.; Vijver, M.G.; Ahmad, F.; Richardson, M.K.; Peijnenburg, W.J.G.M. Toxicity of different-sized copper nano- and submicron particles and their shed copper ions to zebrafish embryos. Environ. Toxicol. Chem. 2014, 33, 1774–1782. [Google Scholar] [CrossRef]
- Pal, A.; Hsieh, S.-F.; Khatri, M.; Isaacs, J.; Demokritou, P.; Gaines, P.; Schmidt, D.; Rogers, E.; Bello, D. Screening for oxidative damage by engineered nanomaterials: A comparative evaluation of FRAS and DCFH. J. Nanopart. Res. 2014, 16, 1–20. [Google Scholar] [CrossRef]


| NF | Assay | NF Conc. (g/L) | Total Assay Reactivity | Ion Conc. (mg/L) | Ion Release (% of Total Cu Content) | Ion Contribution to Reactivity in Relation to Particle Response | Class |
|---|---|---|---|---|---|---|---|
| CuO | FRAS | 0.27 | 30,497 ± 1910 nmol TEU/L | 0.017 | 0.006 | <<25% * | A |
| EPR | 2.0 | 8.45 × 10¹³ Spin count | 0.46 | 0.023 | 7.8% | A | |
| DCFH2-DA (90 min) | 12.5 × 10⁻³ | 364 ± 32 AU | 2.5 | 24.9 | 127% | C | |
| 100 × 10−3 | 1168 ± 58 AU | 7.0 | 8.8 | 111% | C | ||
| DCFH2-DA (30 min) | 12.5 × 10⁻³ | 92 ± 5 AU | 1.7 | 16.7 | 93% | C | |
| 100 × 10−3 | 282 ± 47 AU | 5.9 | 7.4 | 54% | B | ||
| ZnO NM110 | FRAS | 0.77 | 33,252 ± 6470 nmol TEU/L | 200 | 26 | 92% | C |
| 38.8 | 109,075 ± 5297 nmol TEU/L | 280 | 0.72 | 25% | B | ||
| Fe2O3 nano_A | 9.4 | 41,141 ± 426 nmol TEU/L | 3.3 | 0.035 | 16% | A | |
| Ag NM300k | 34.6 | 153,010 ± 24,221 nmol TEU/L | 74 | 0.21 | n.a. | A |
© 2020 by the authors. Licensee MDPI, Basel, Switzerland. This article is an open access article distributed under the terms and conditions of the Creative Commons Attribution (CC BY) license (http://creativecommons.org/licenses/by/4.0/).
Share and Cite
Peijnenburg, W.J.G.M.; Ruggiero, E.; Boyles, M.; Murphy, F.; Stone, V.; Elam, D.A.; Werle, K.; Wohlleben, W. A Method to Assess the Relevance of Nanomaterial Dissolution during Reactivity Testing. Materials 2020, 13, 2235. https://doi.org/10.3390/ma13102235
Peijnenburg WJGM, Ruggiero E, Boyles M, Murphy F, Stone V, Elam DA, Werle K, Wohlleben W. A Method to Assess the Relevance of Nanomaterial Dissolution during Reactivity Testing. Materials. 2020; 13(10):2235. https://doi.org/10.3390/ma13102235
Chicago/Turabian StylePeijnenburg, Willie J. G. M., Emmanuel Ruggiero, Matthew Boyles, Fiona Murphy, Vicki Stone, Derek A. Elam, Kai Werle, and Wendel Wohlleben. 2020. "A Method to Assess the Relevance of Nanomaterial Dissolution during Reactivity Testing" Materials 13, no. 10: 2235. https://doi.org/10.3390/ma13102235
APA StylePeijnenburg, W. J. G. M., Ruggiero, E., Boyles, M., Murphy, F., Stone, V., Elam, D. A., Werle, K., & Wohlleben, W. (2020). A Method to Assess the Relevance of Nanomaterial Dissolution during Reactivity Testing. Materials, 13(10), 2235. https://doi.org/10.3390/ma13102235