Investigation of Shear-Induced Deformation of Reinforcing Textiles by Optical Measurement Devices

 , , and
Abstract
1. Introduction
1.1. Determination of Shear Deformation Behavior
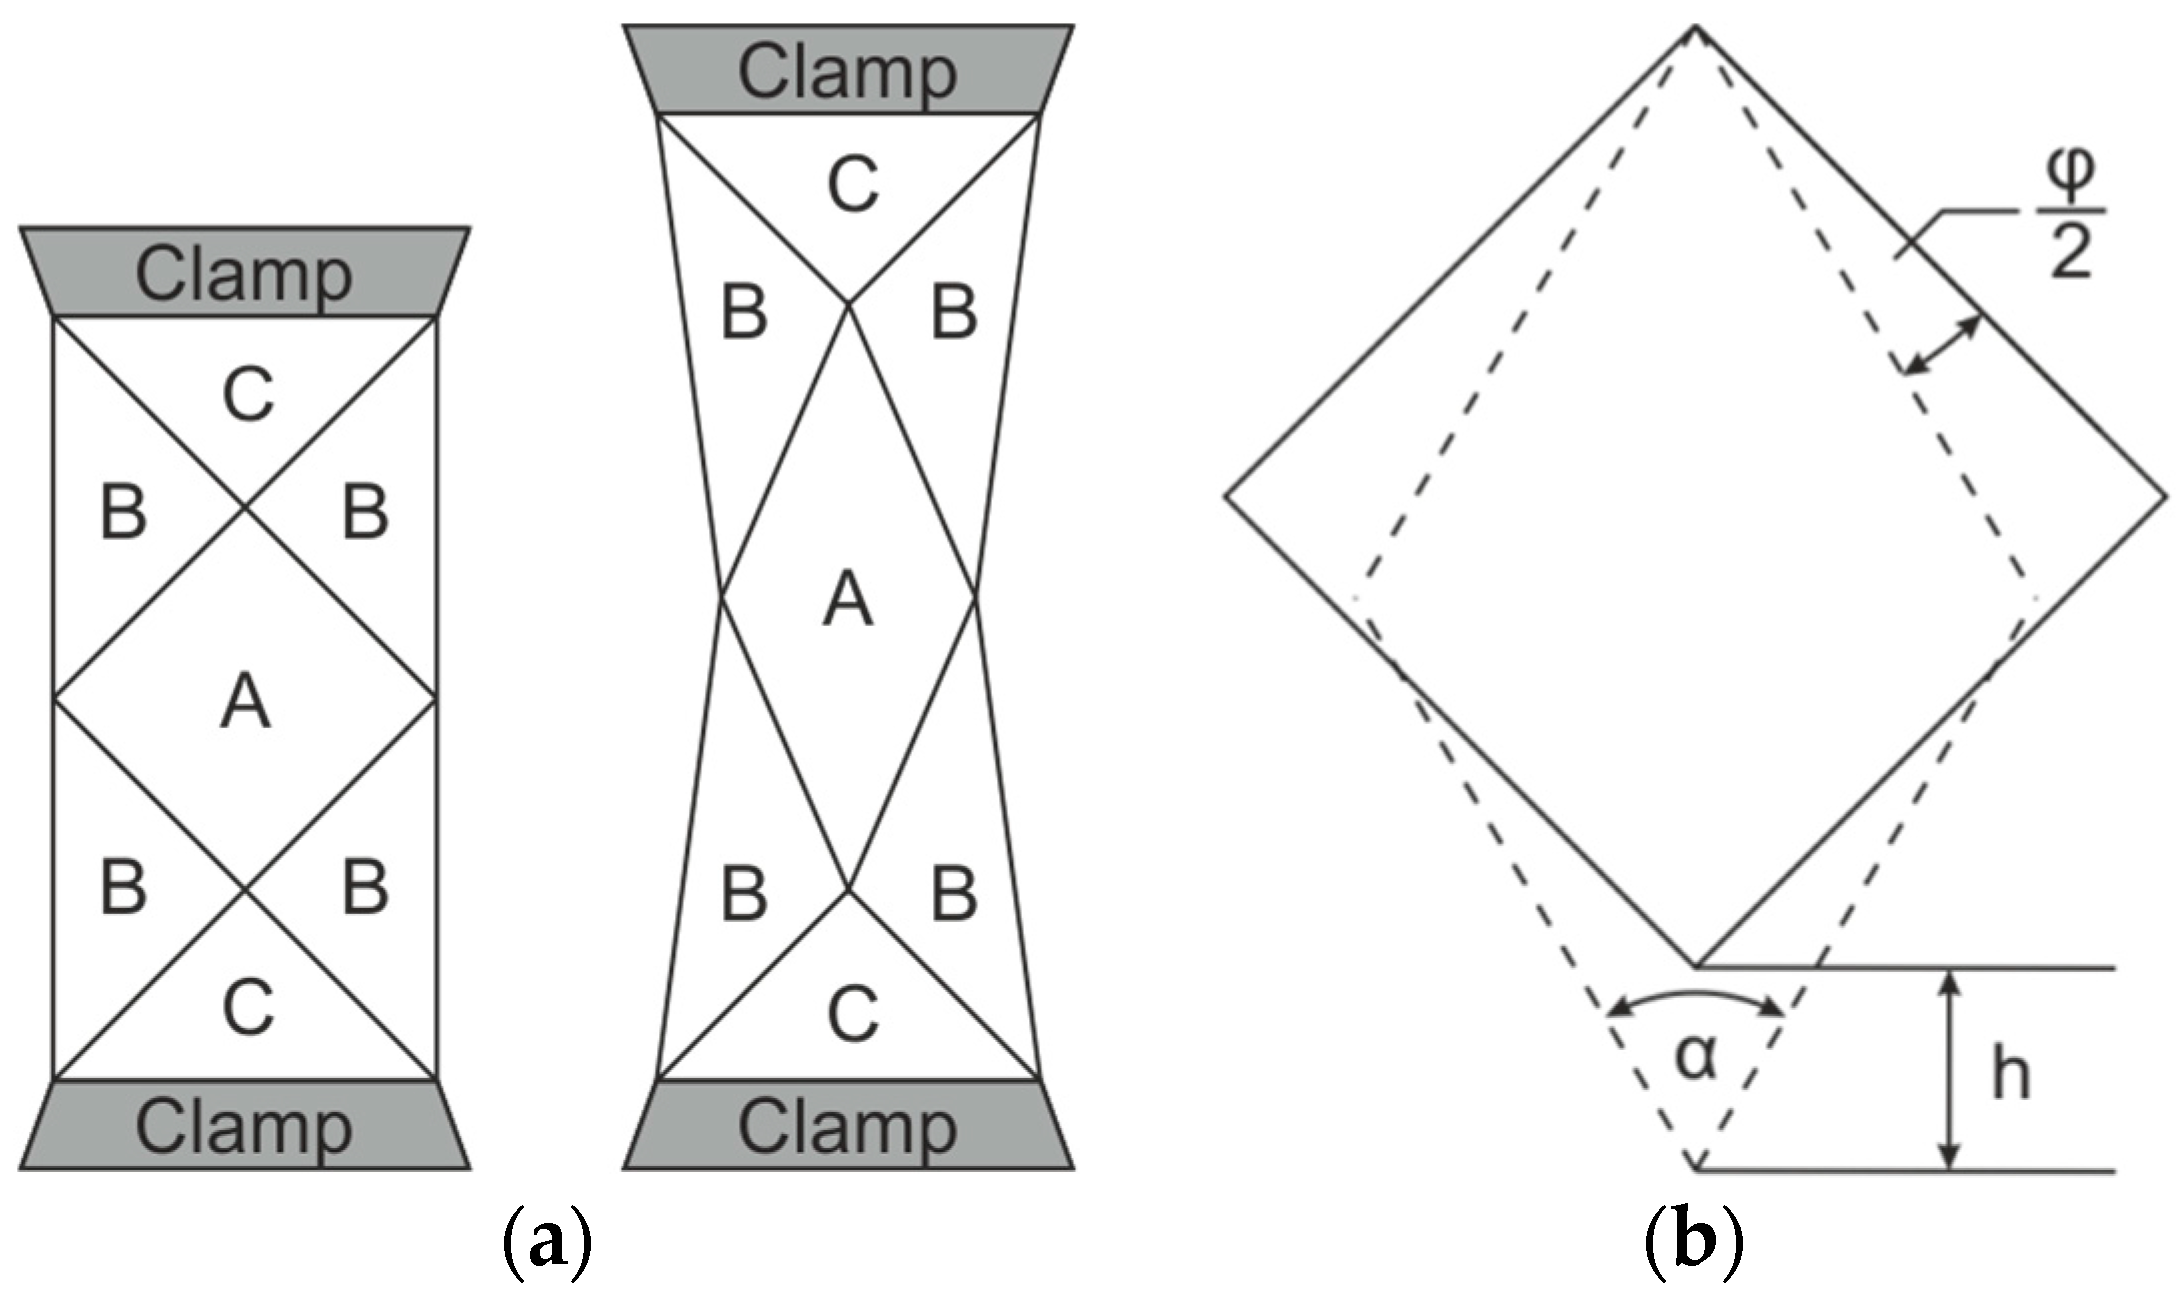
1.1.1. Bias Extension Test
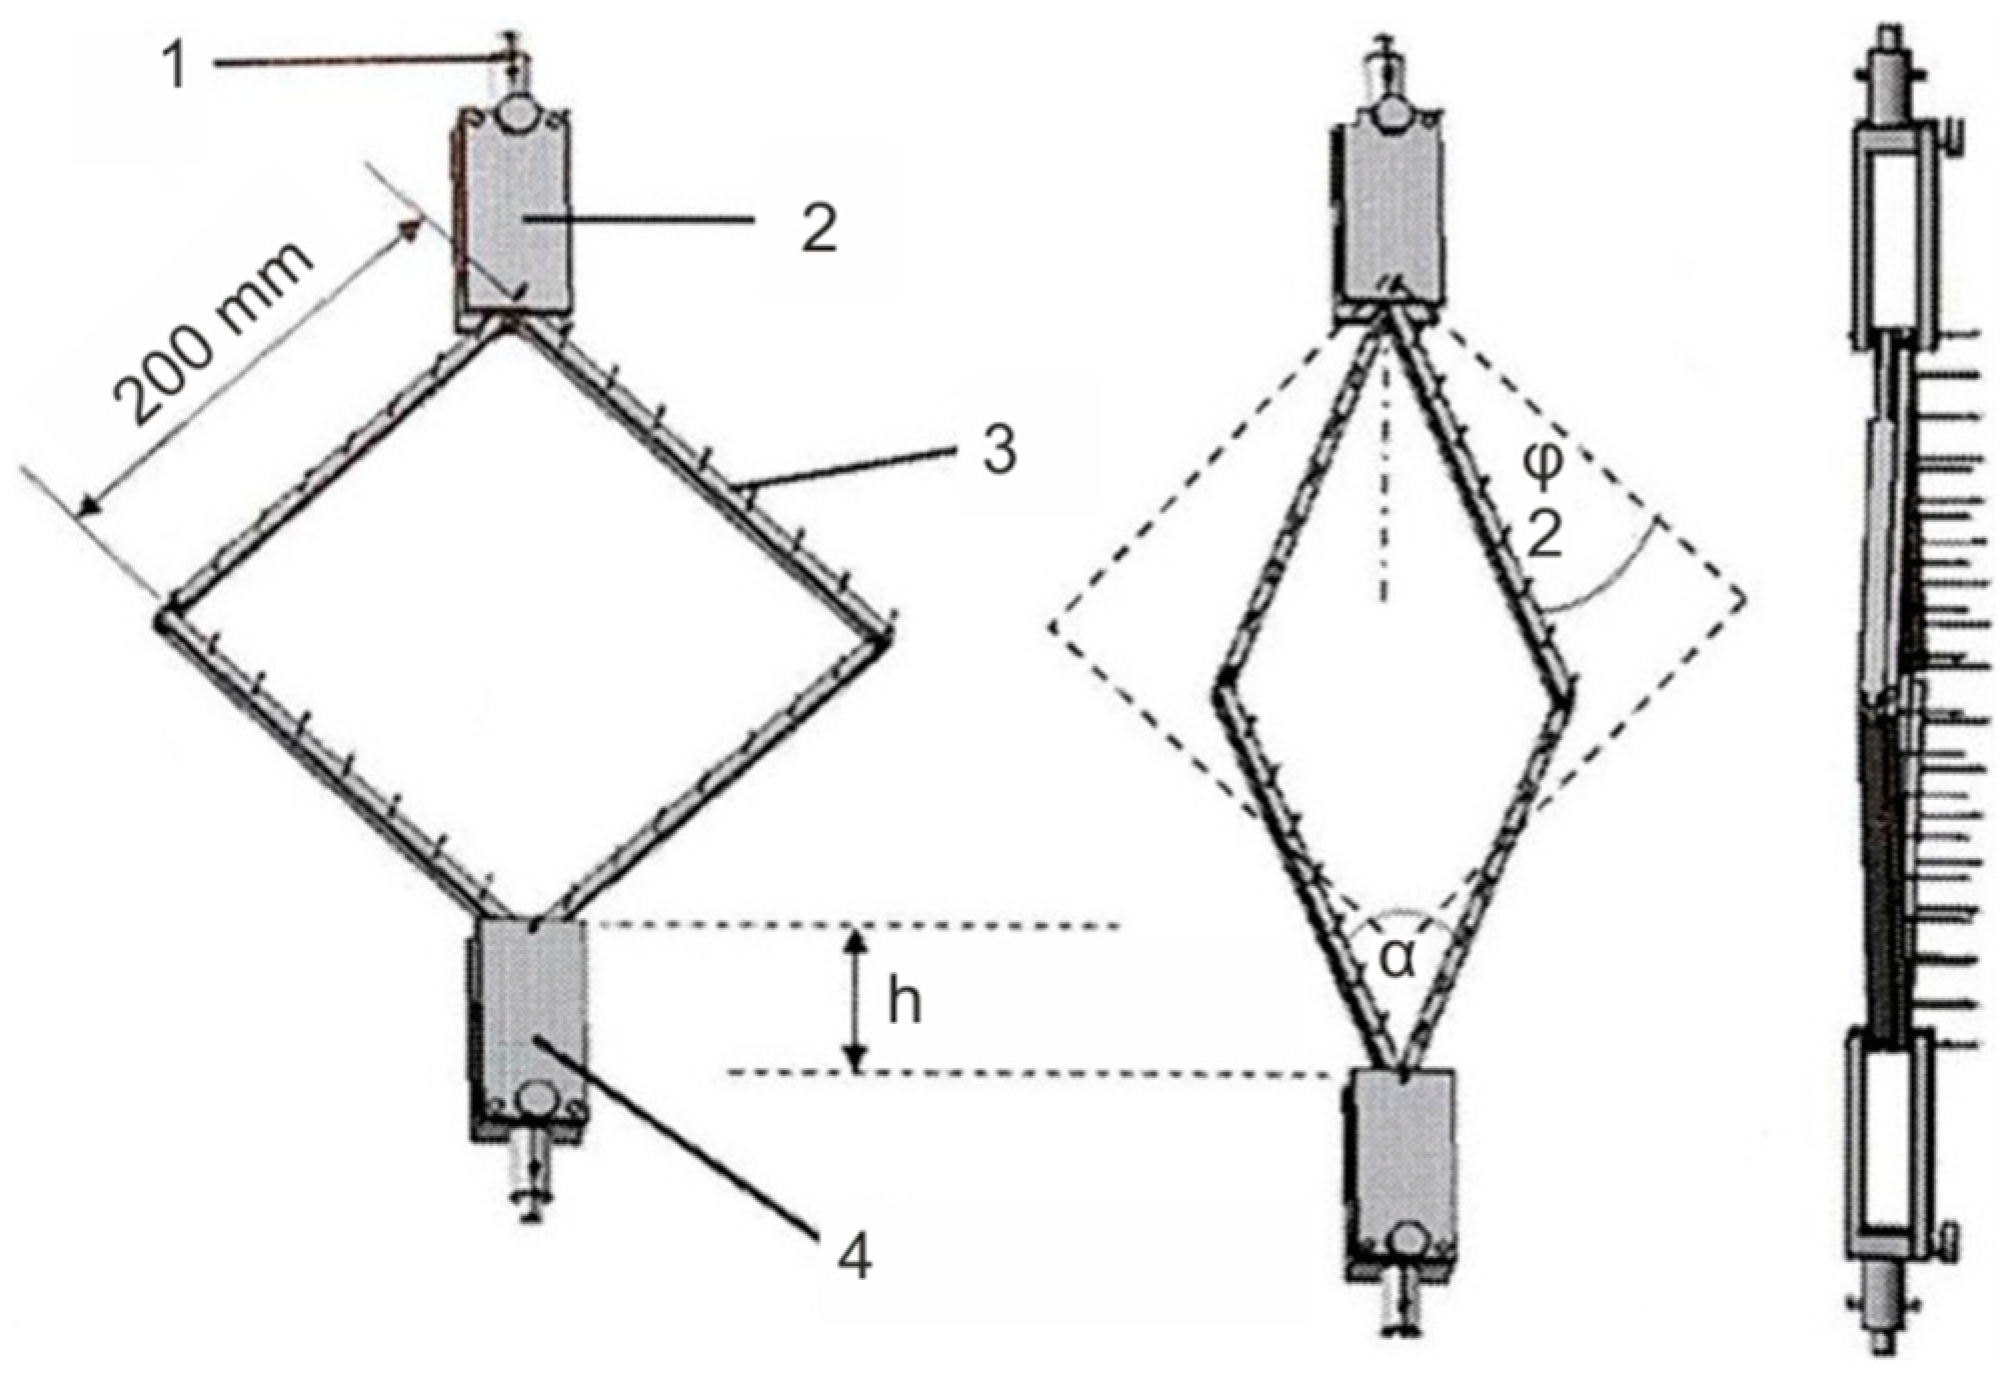
1.1.2. Picture Frame Test
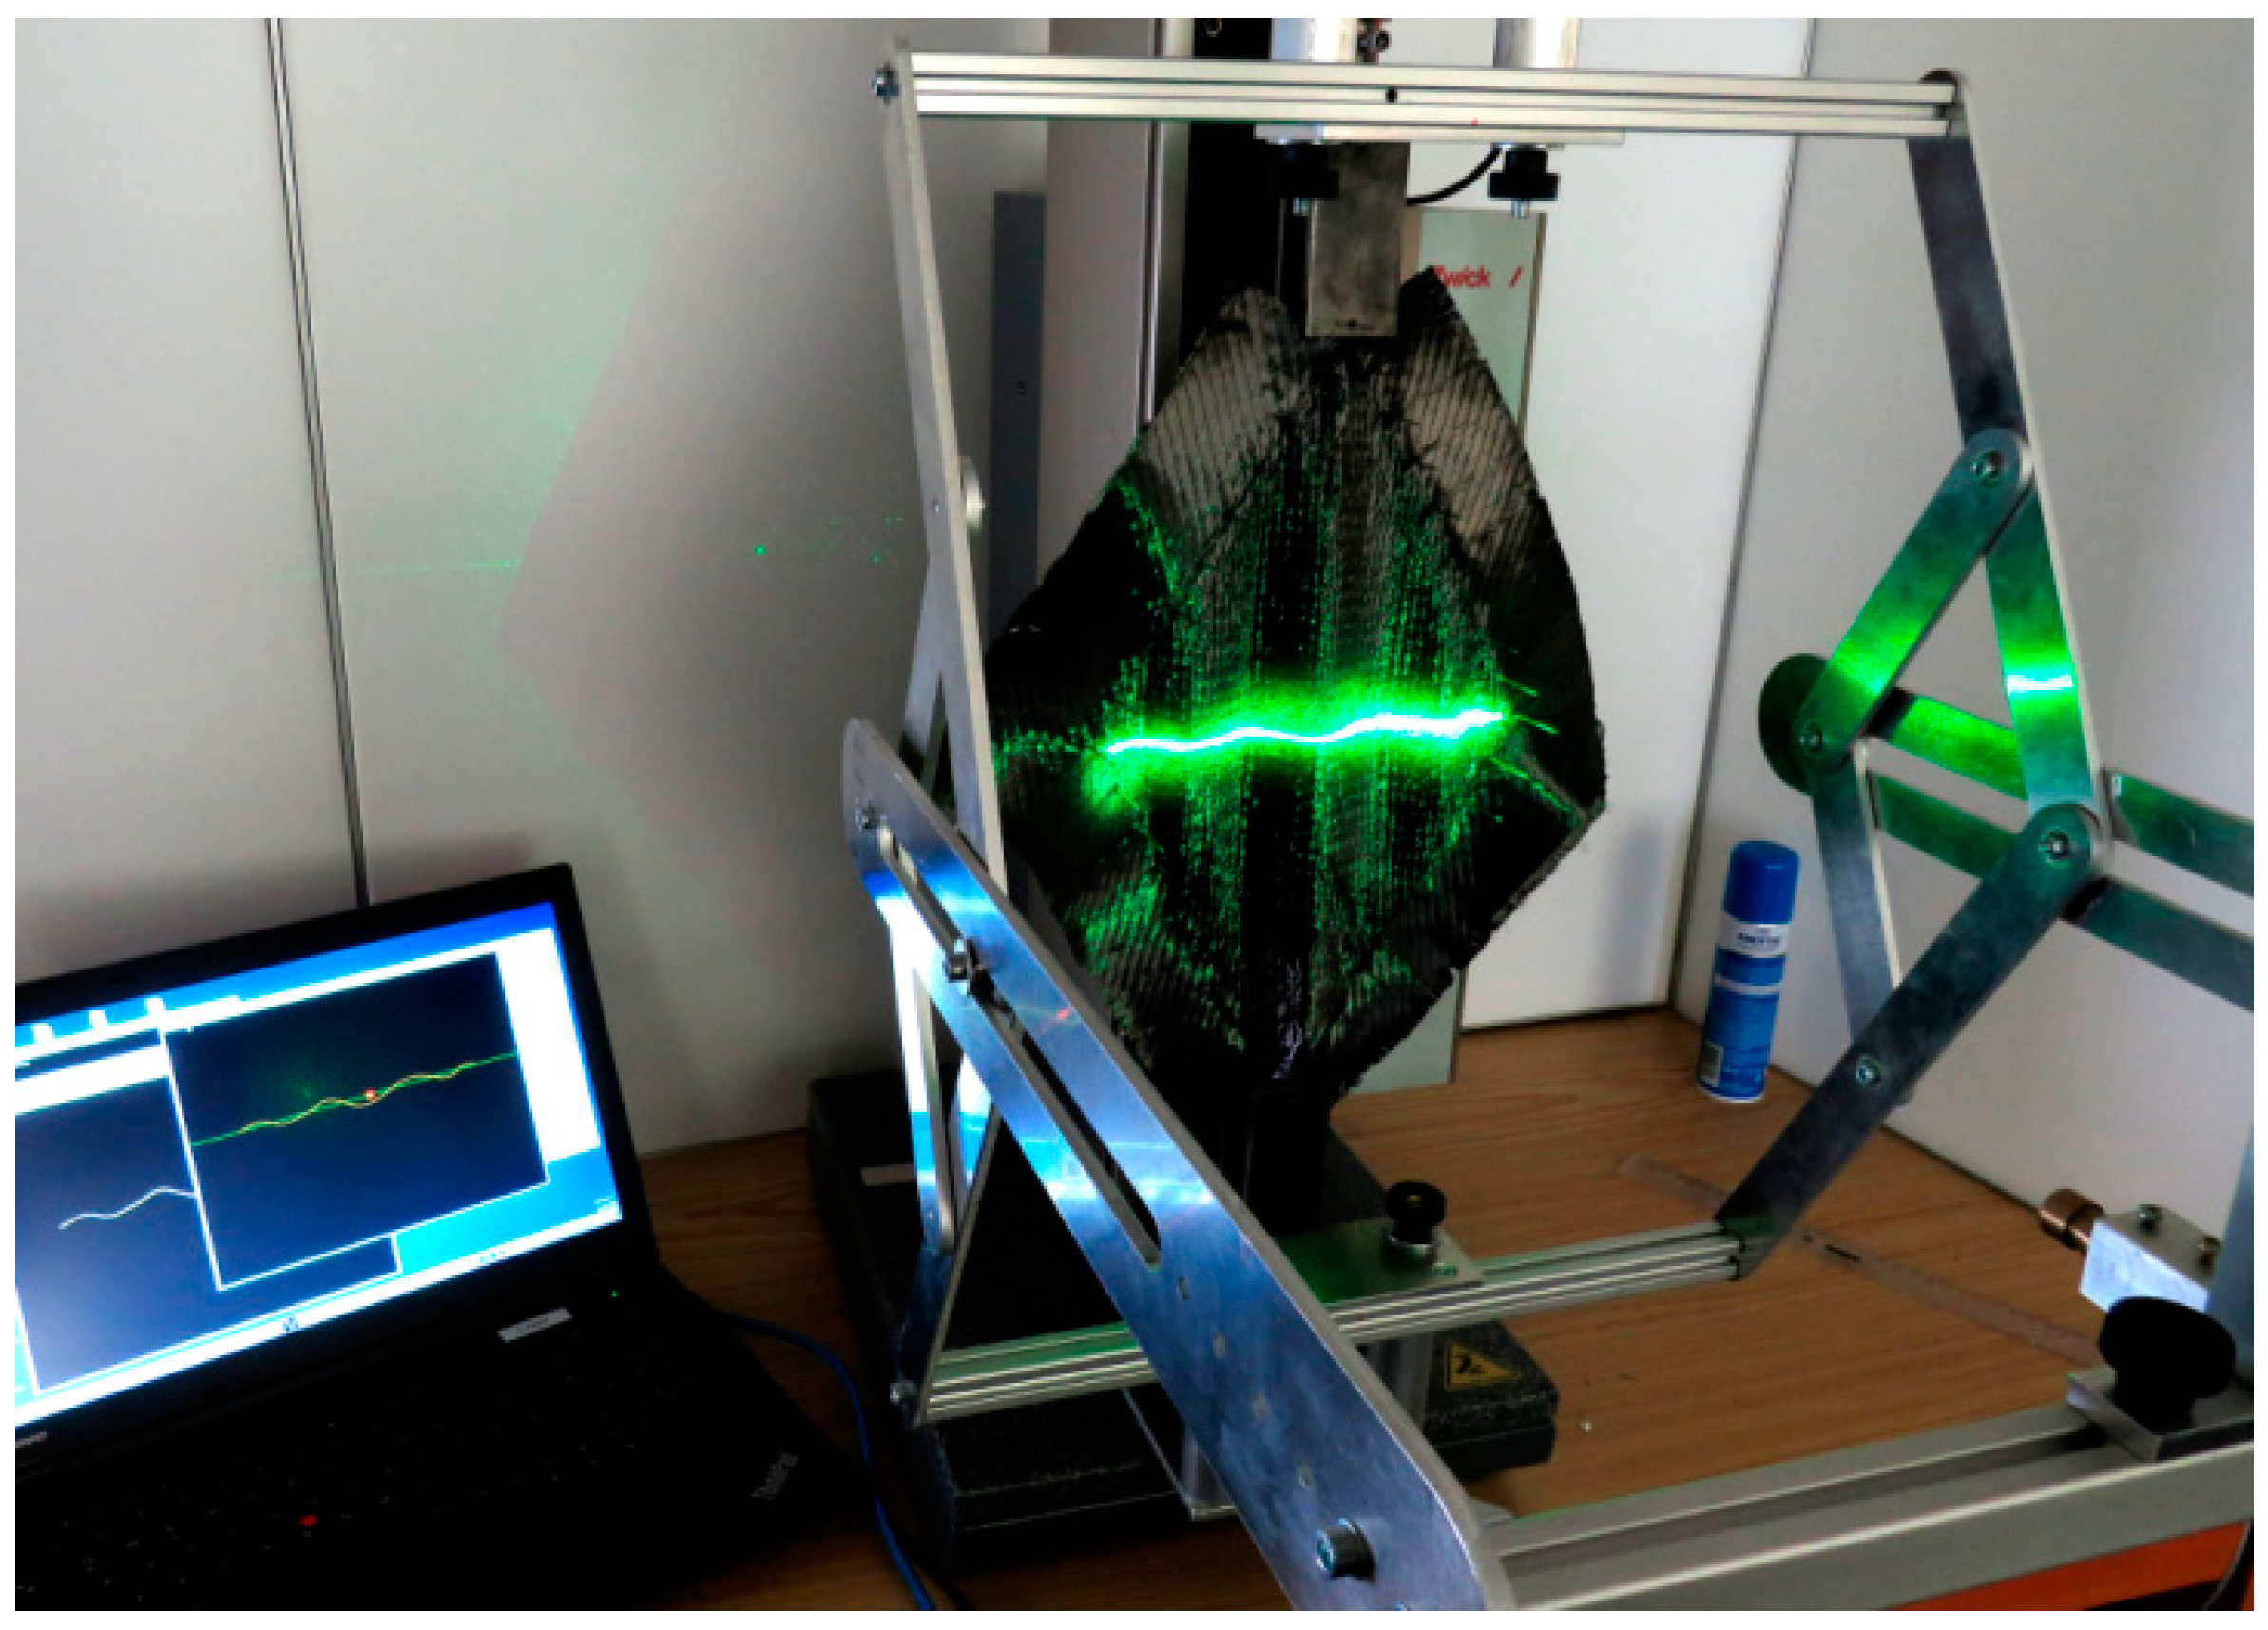
2. Materials and Methods
| Test device: | Monoaxial tensile test machine Z 2.5, ZWICK, Ulm, Germany |
| Force sensor: | 500 N |
| Sample size: | 300 mm × 300 mm |
| Picture frame edge length: | 200 mm × 200 mm |
| Deformation distance: | 60 mm (corresponds to a shear angle of φ ≈ 28°) |
| Test speed: | 100 mm/min |
| Test conditions: | Standard climate (DIN EN ISO 139), T = 20 °C, rel. humidity = 65% |
| Recorded data: | Force F at increments of Δh = 0.1 mm in transverse direction Displacement |
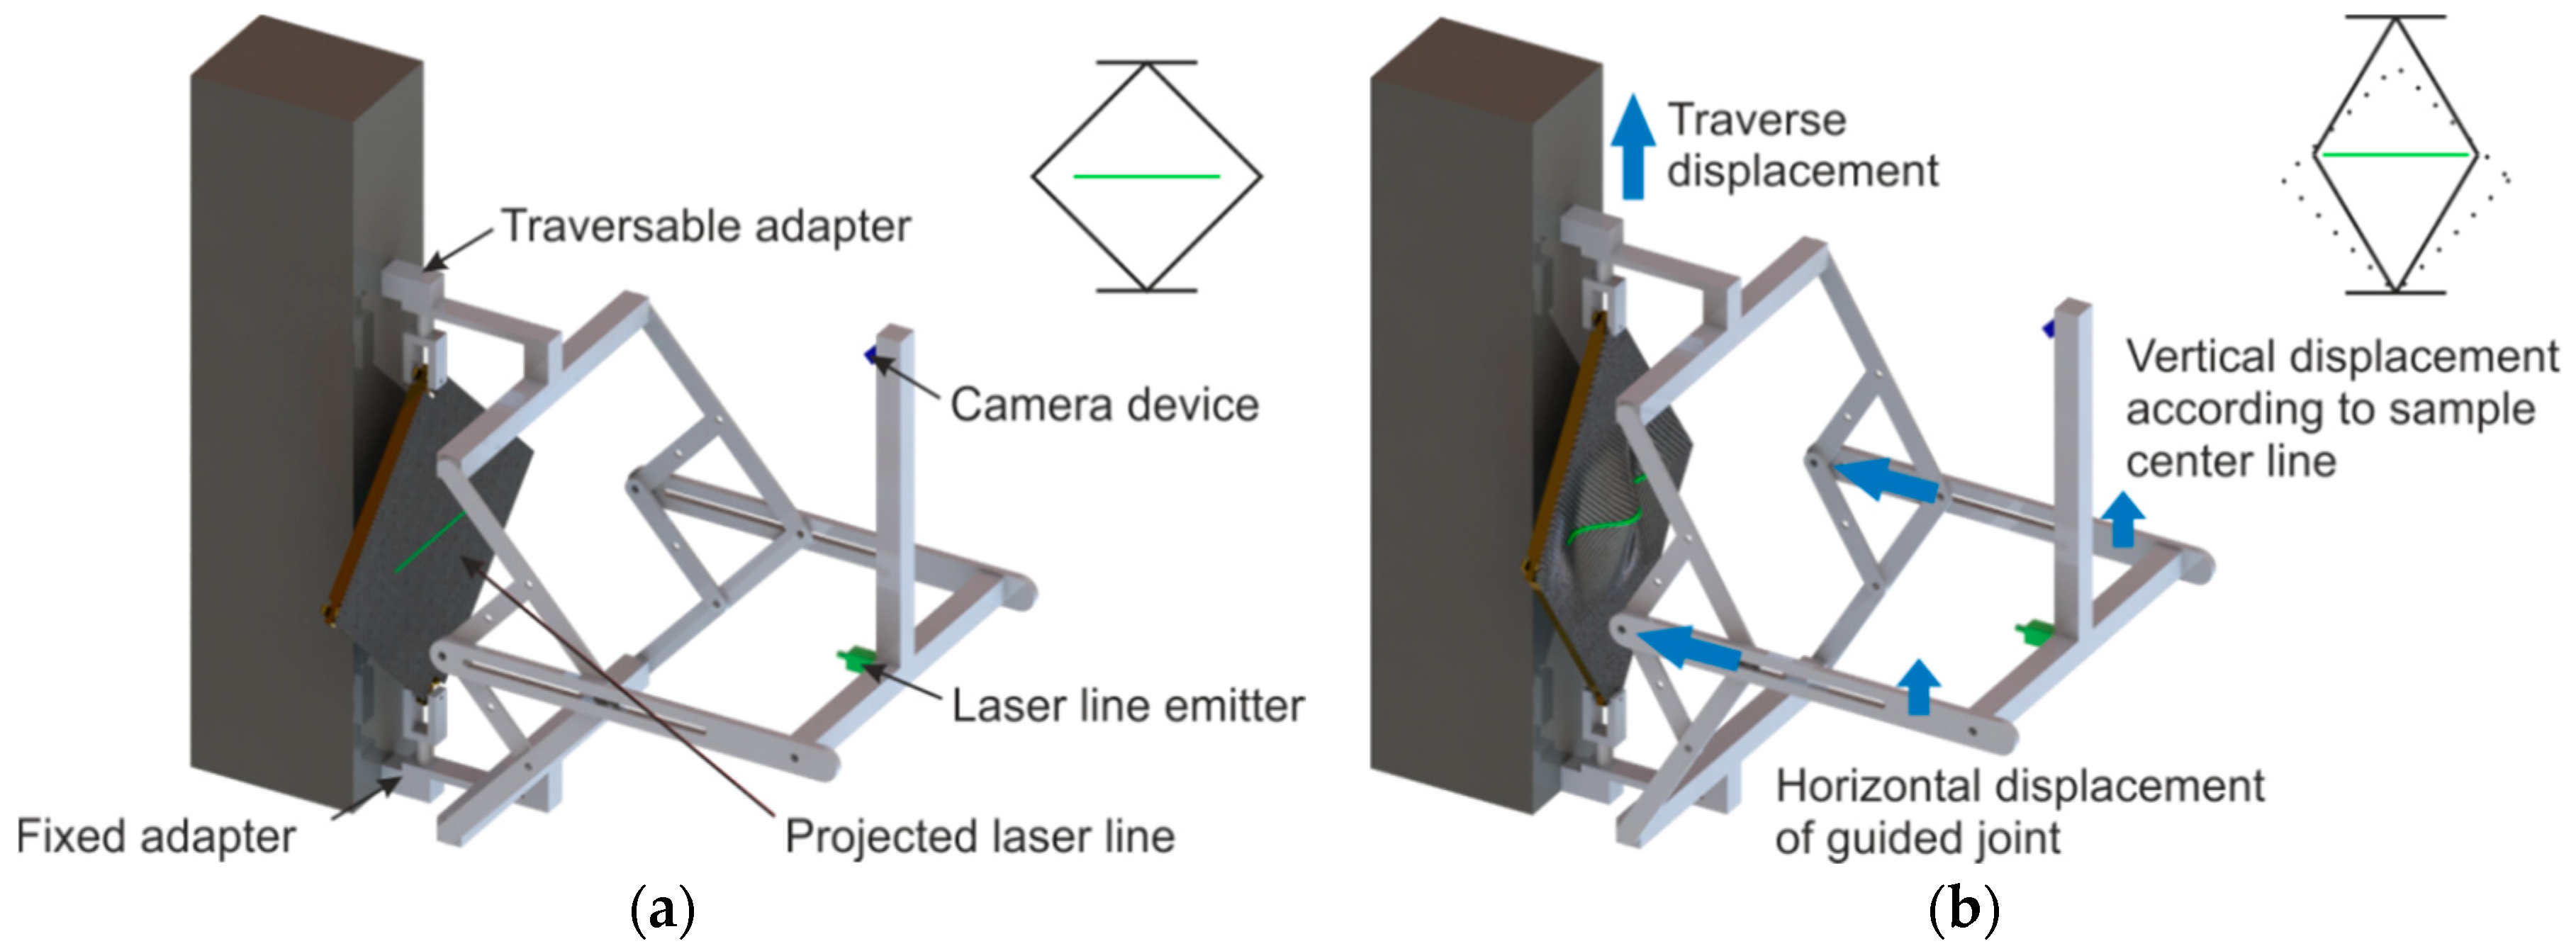
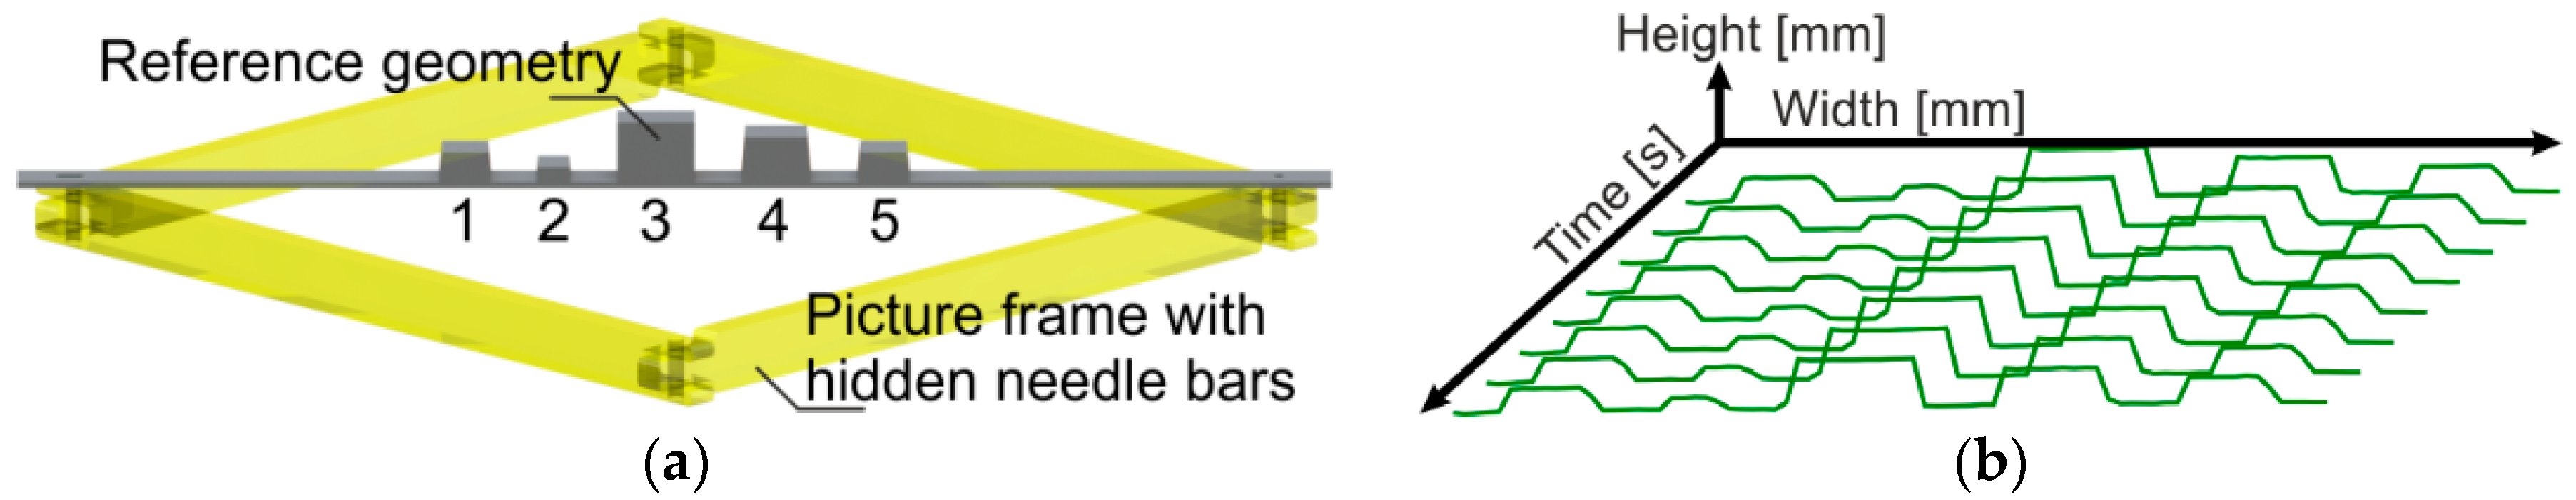
Device Calibration
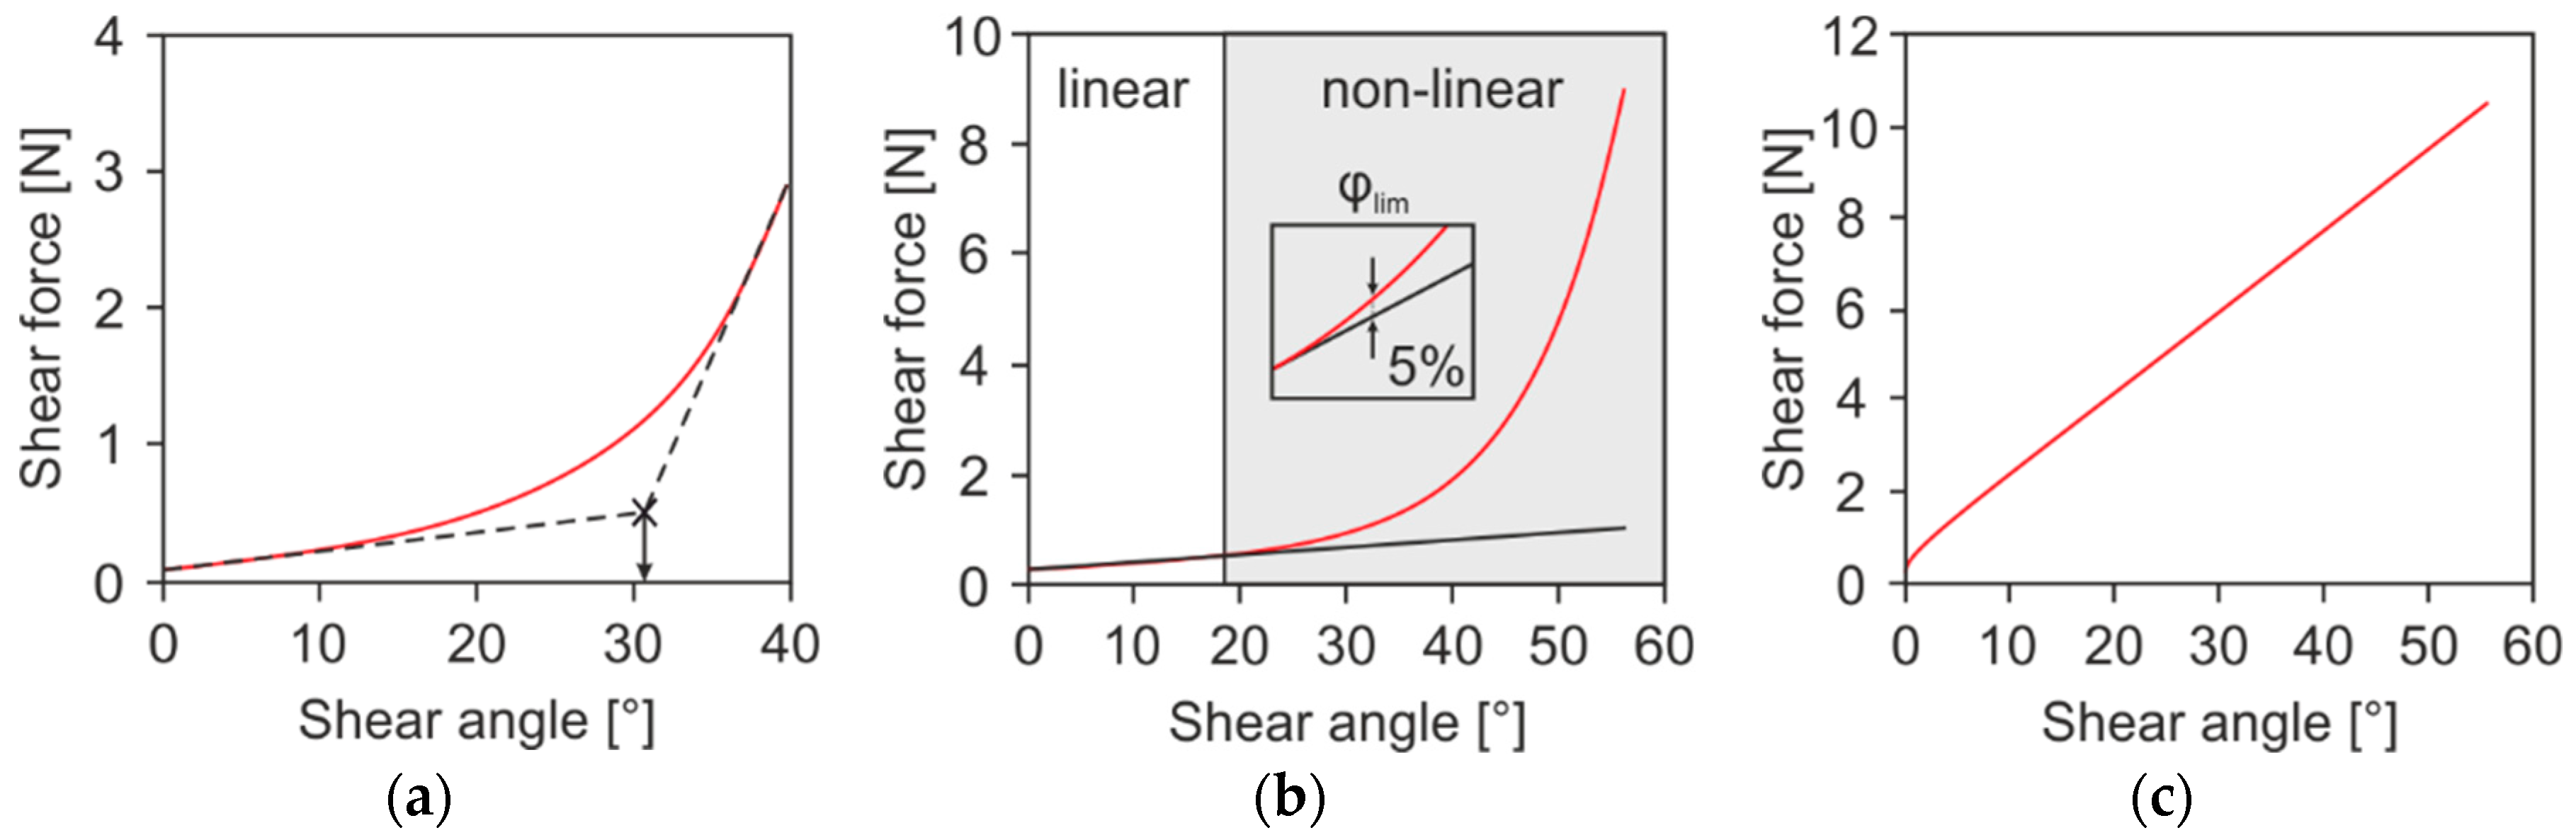
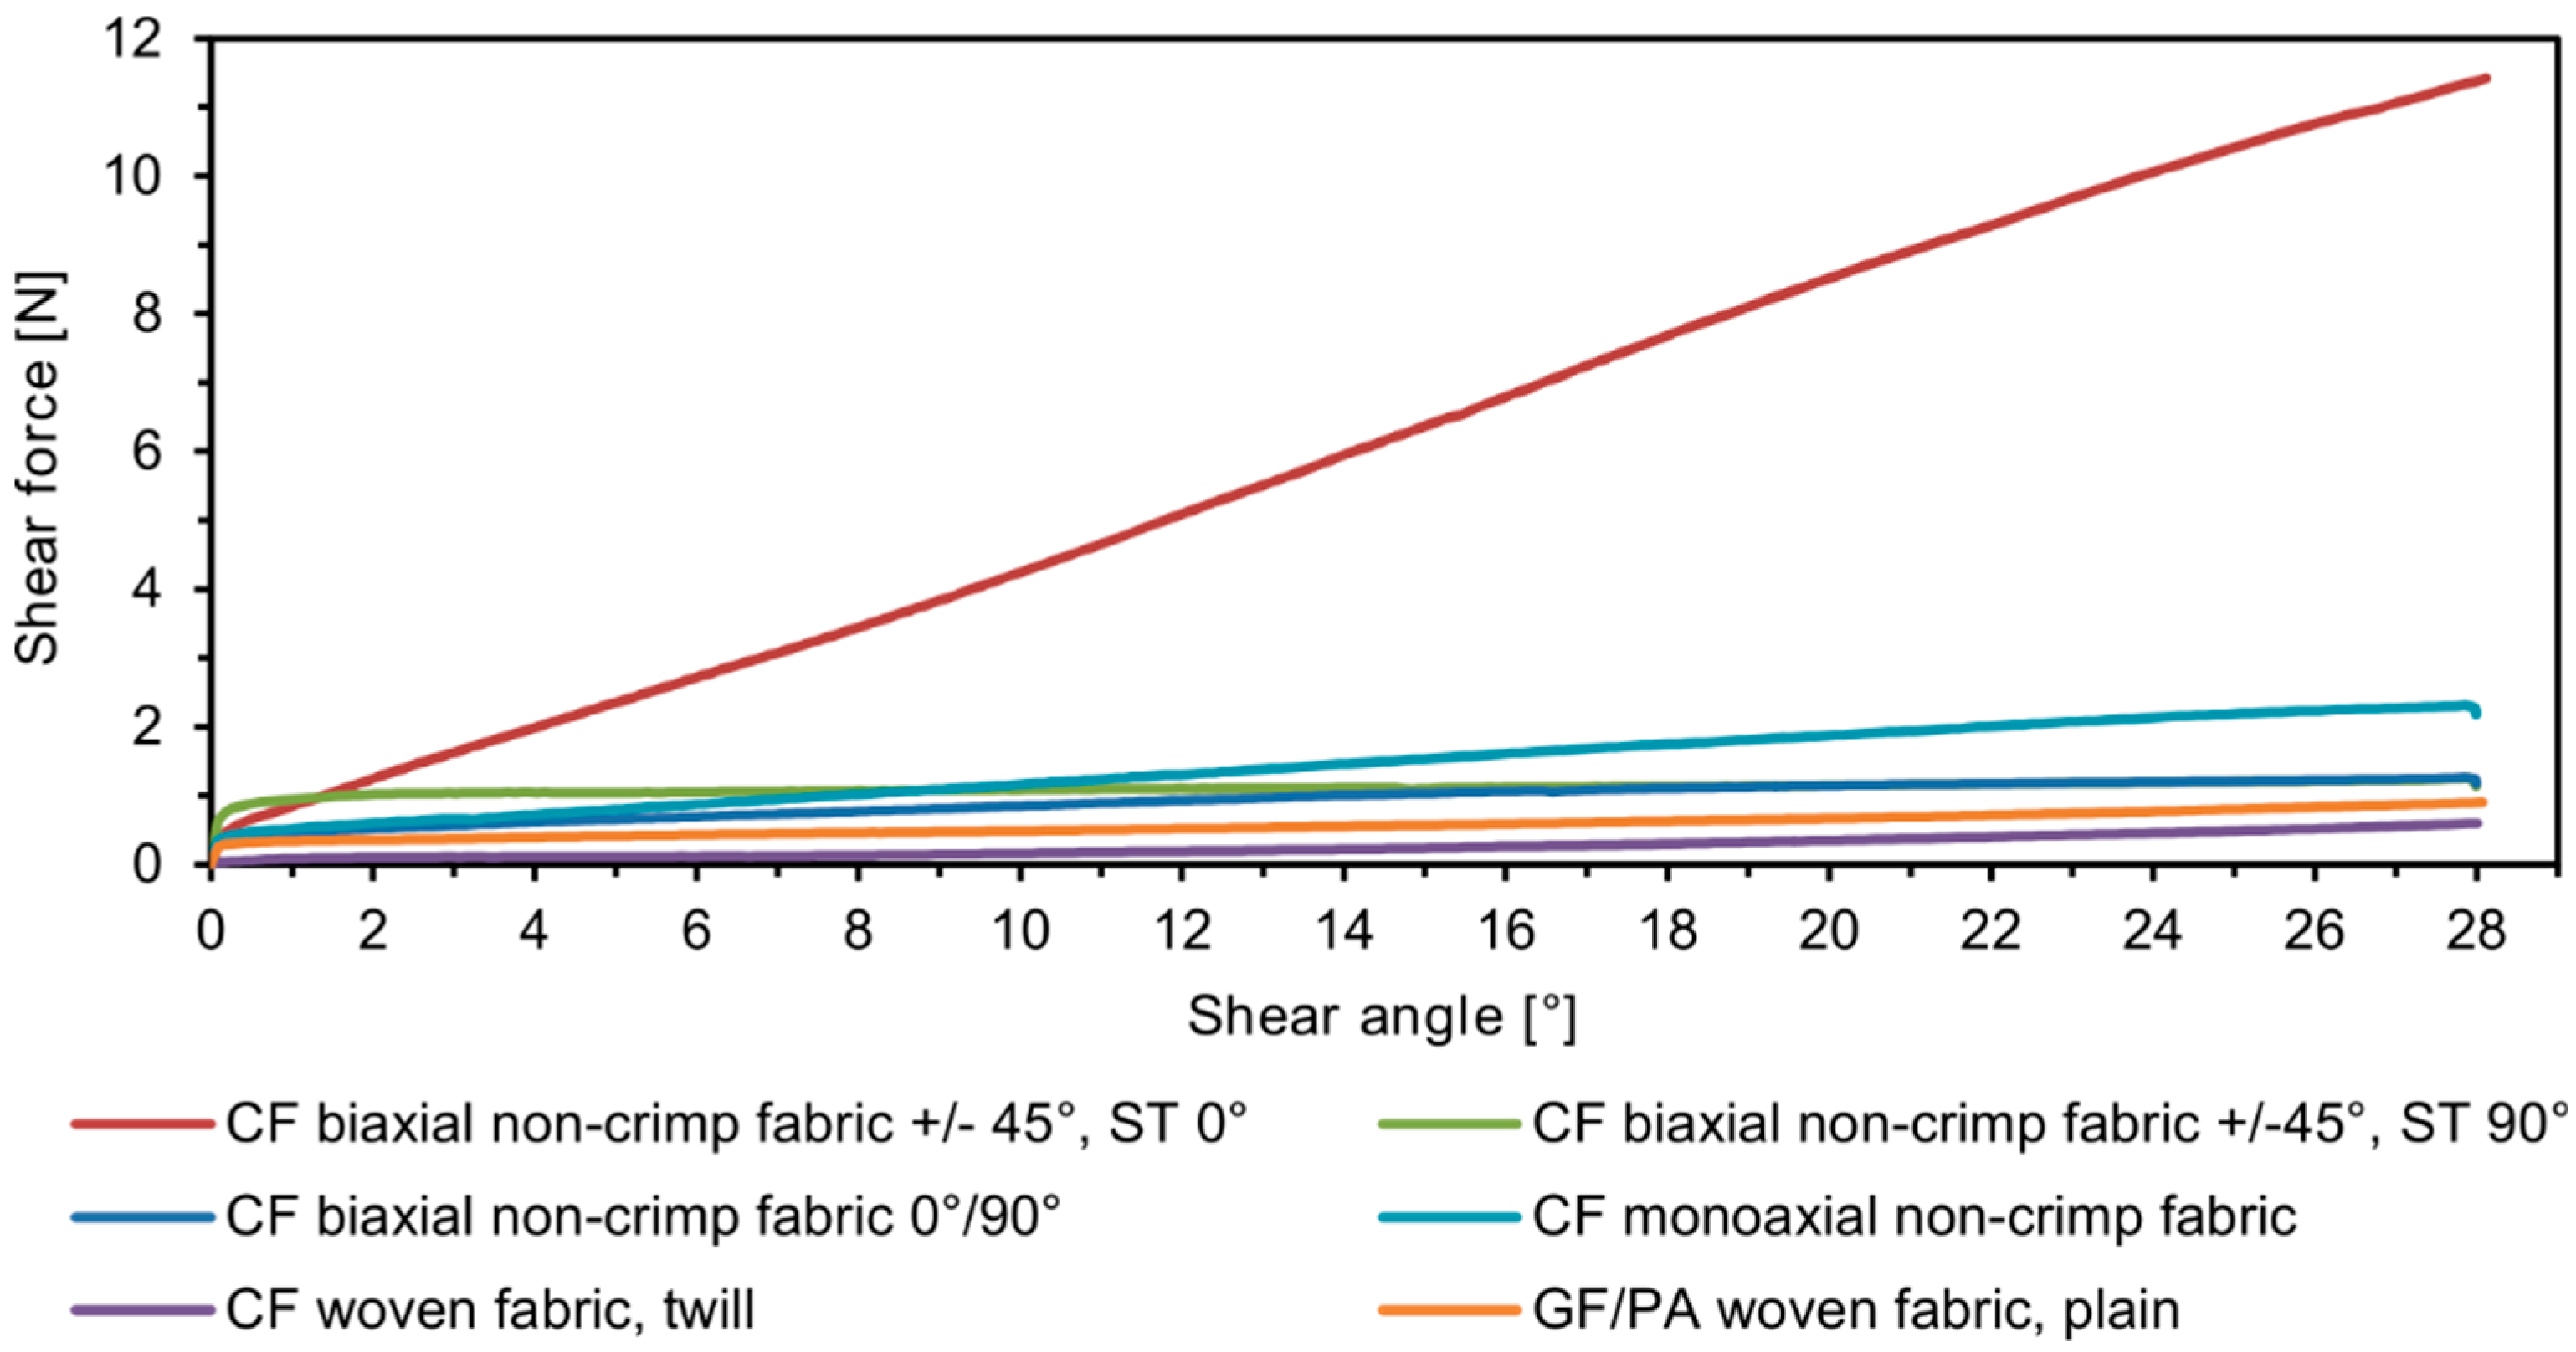
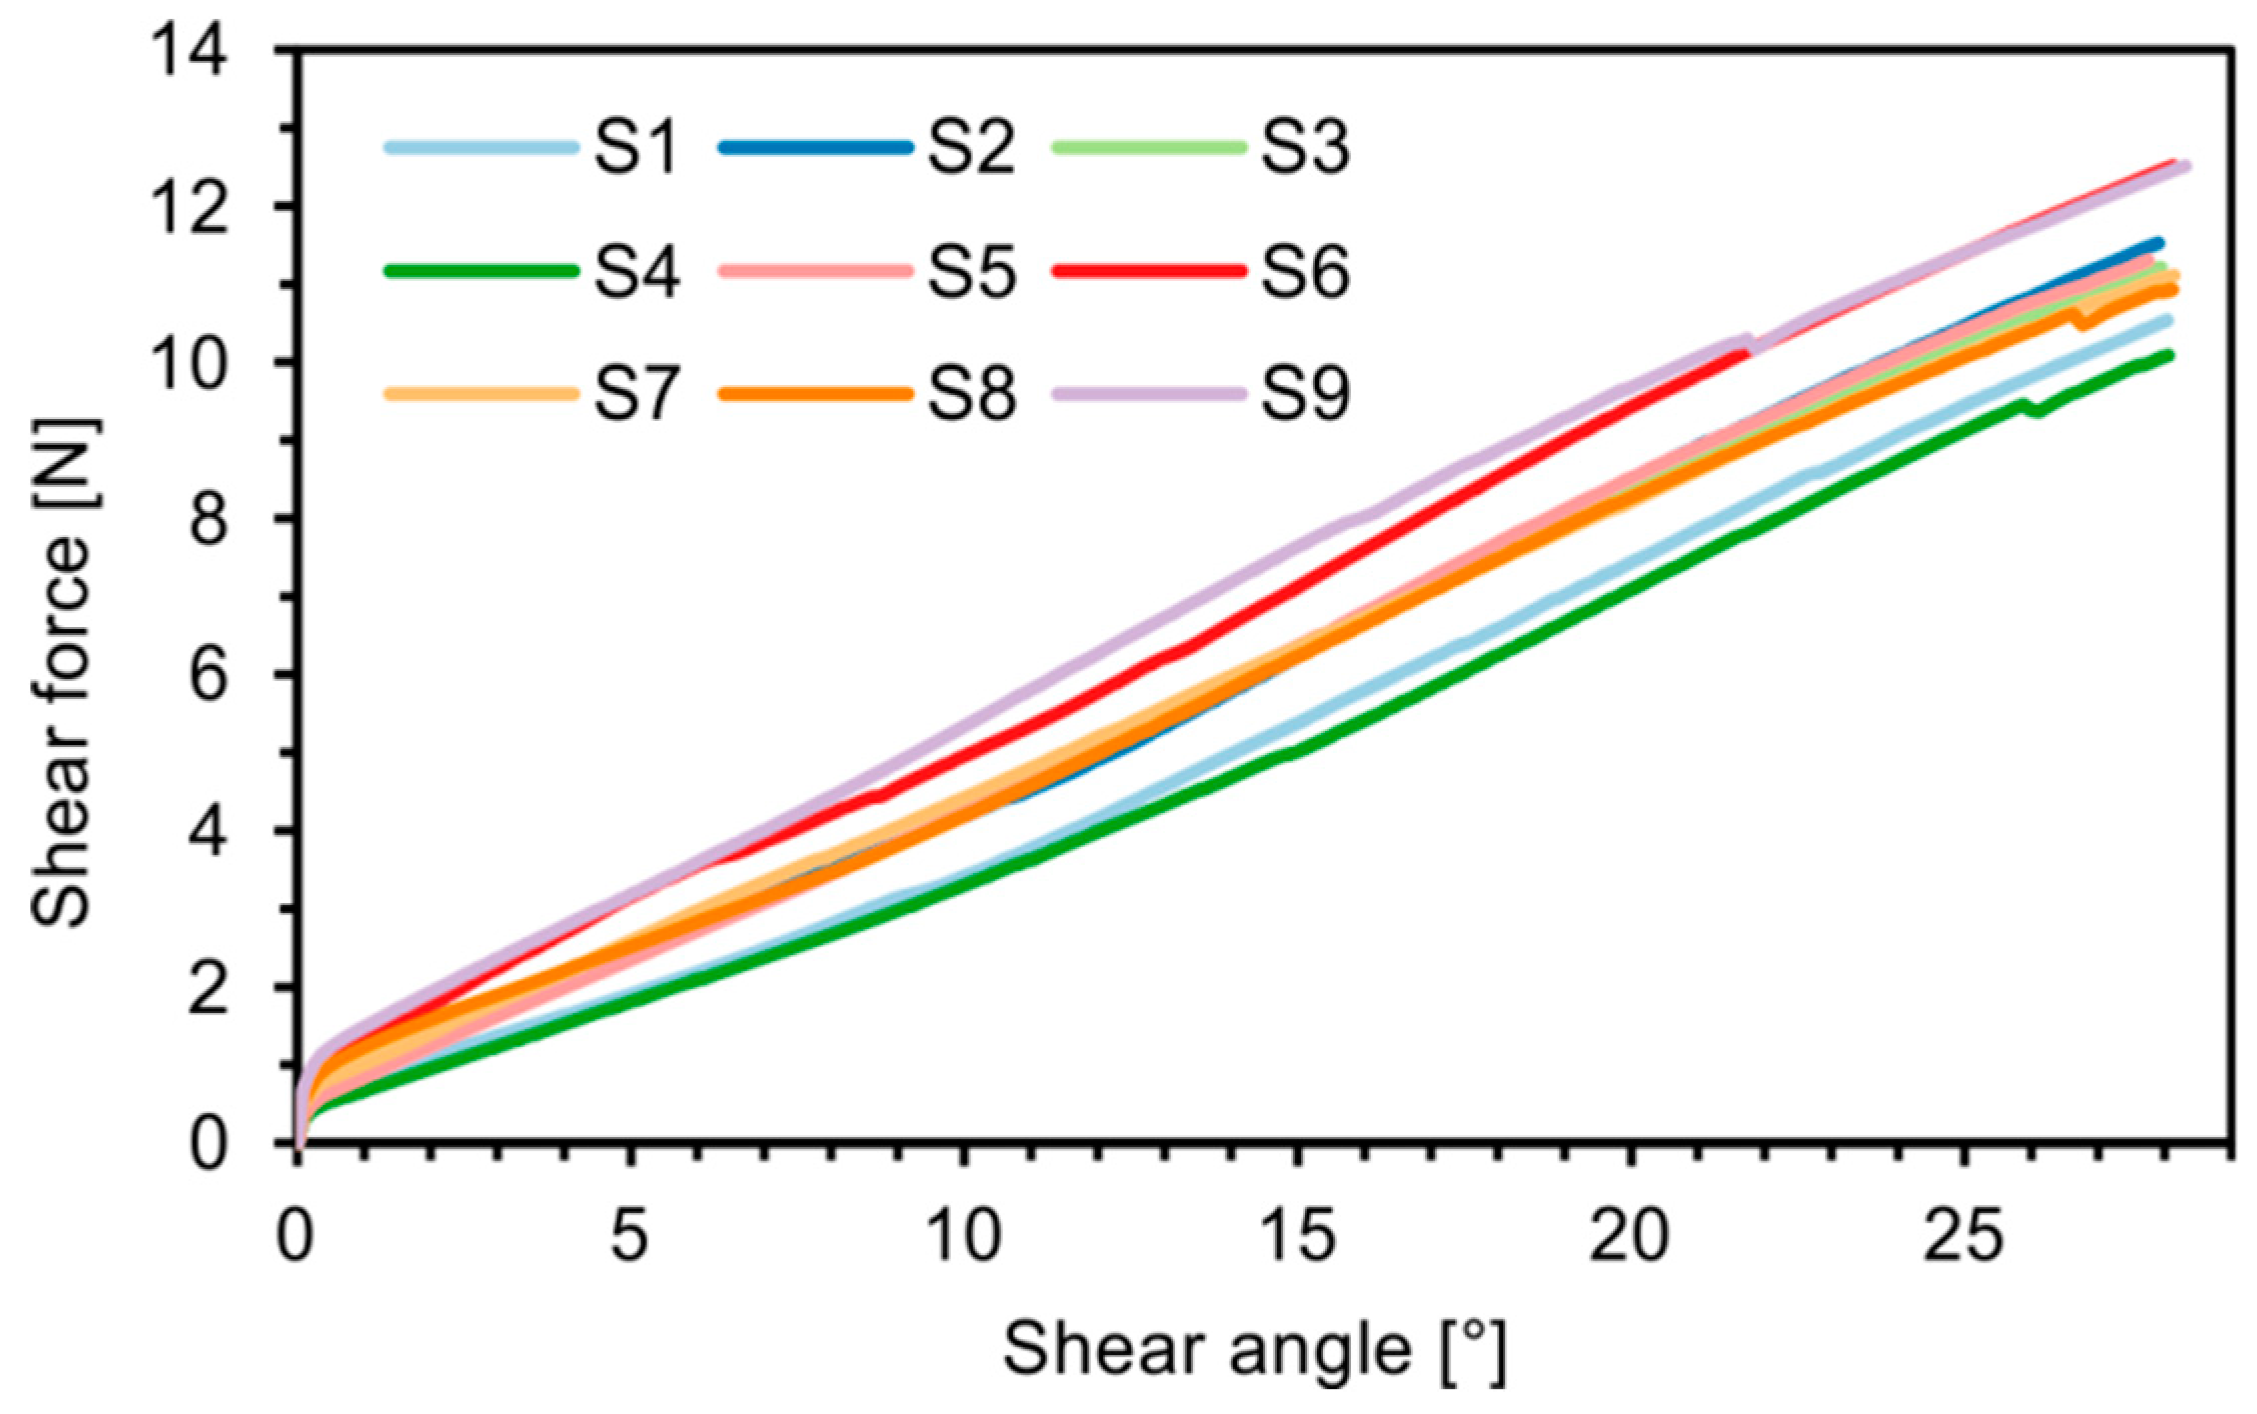
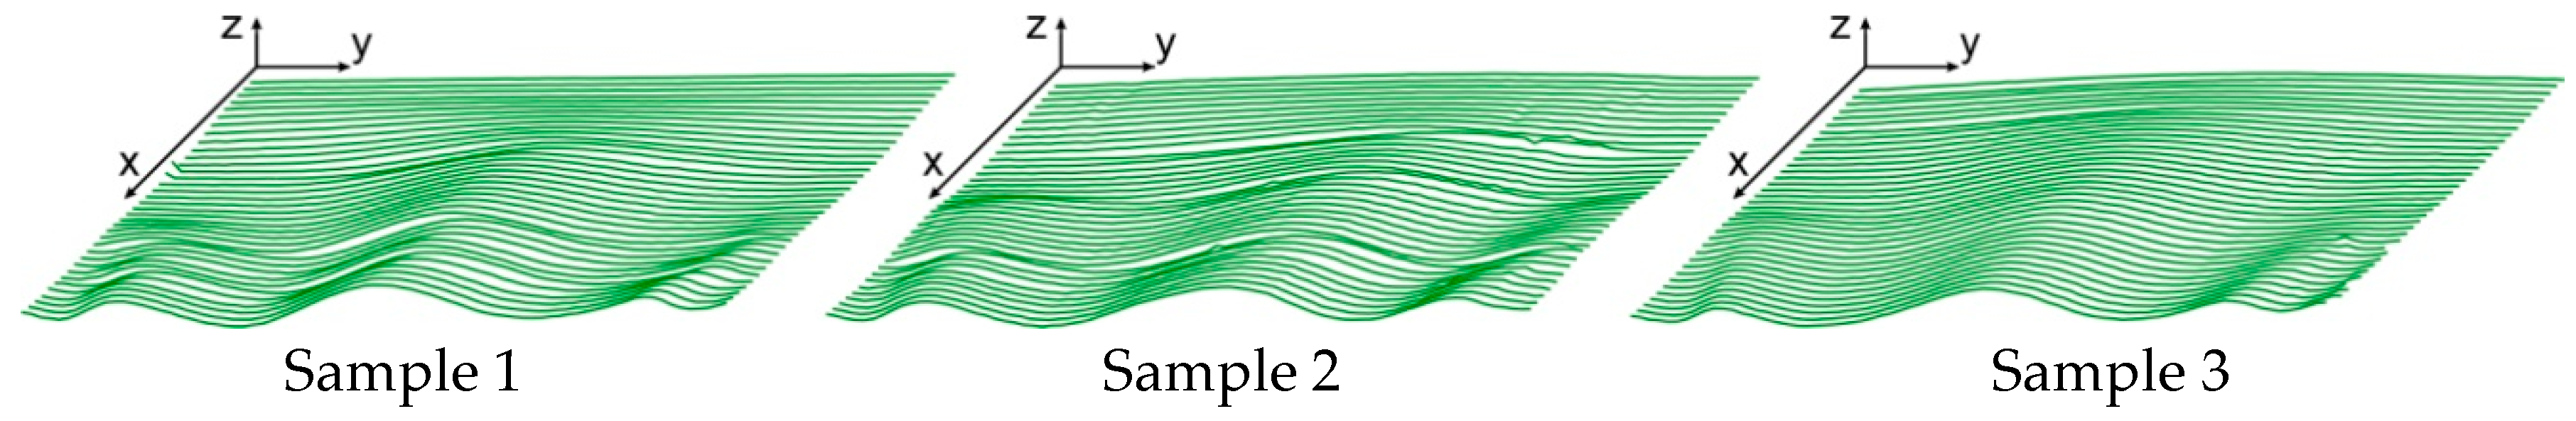
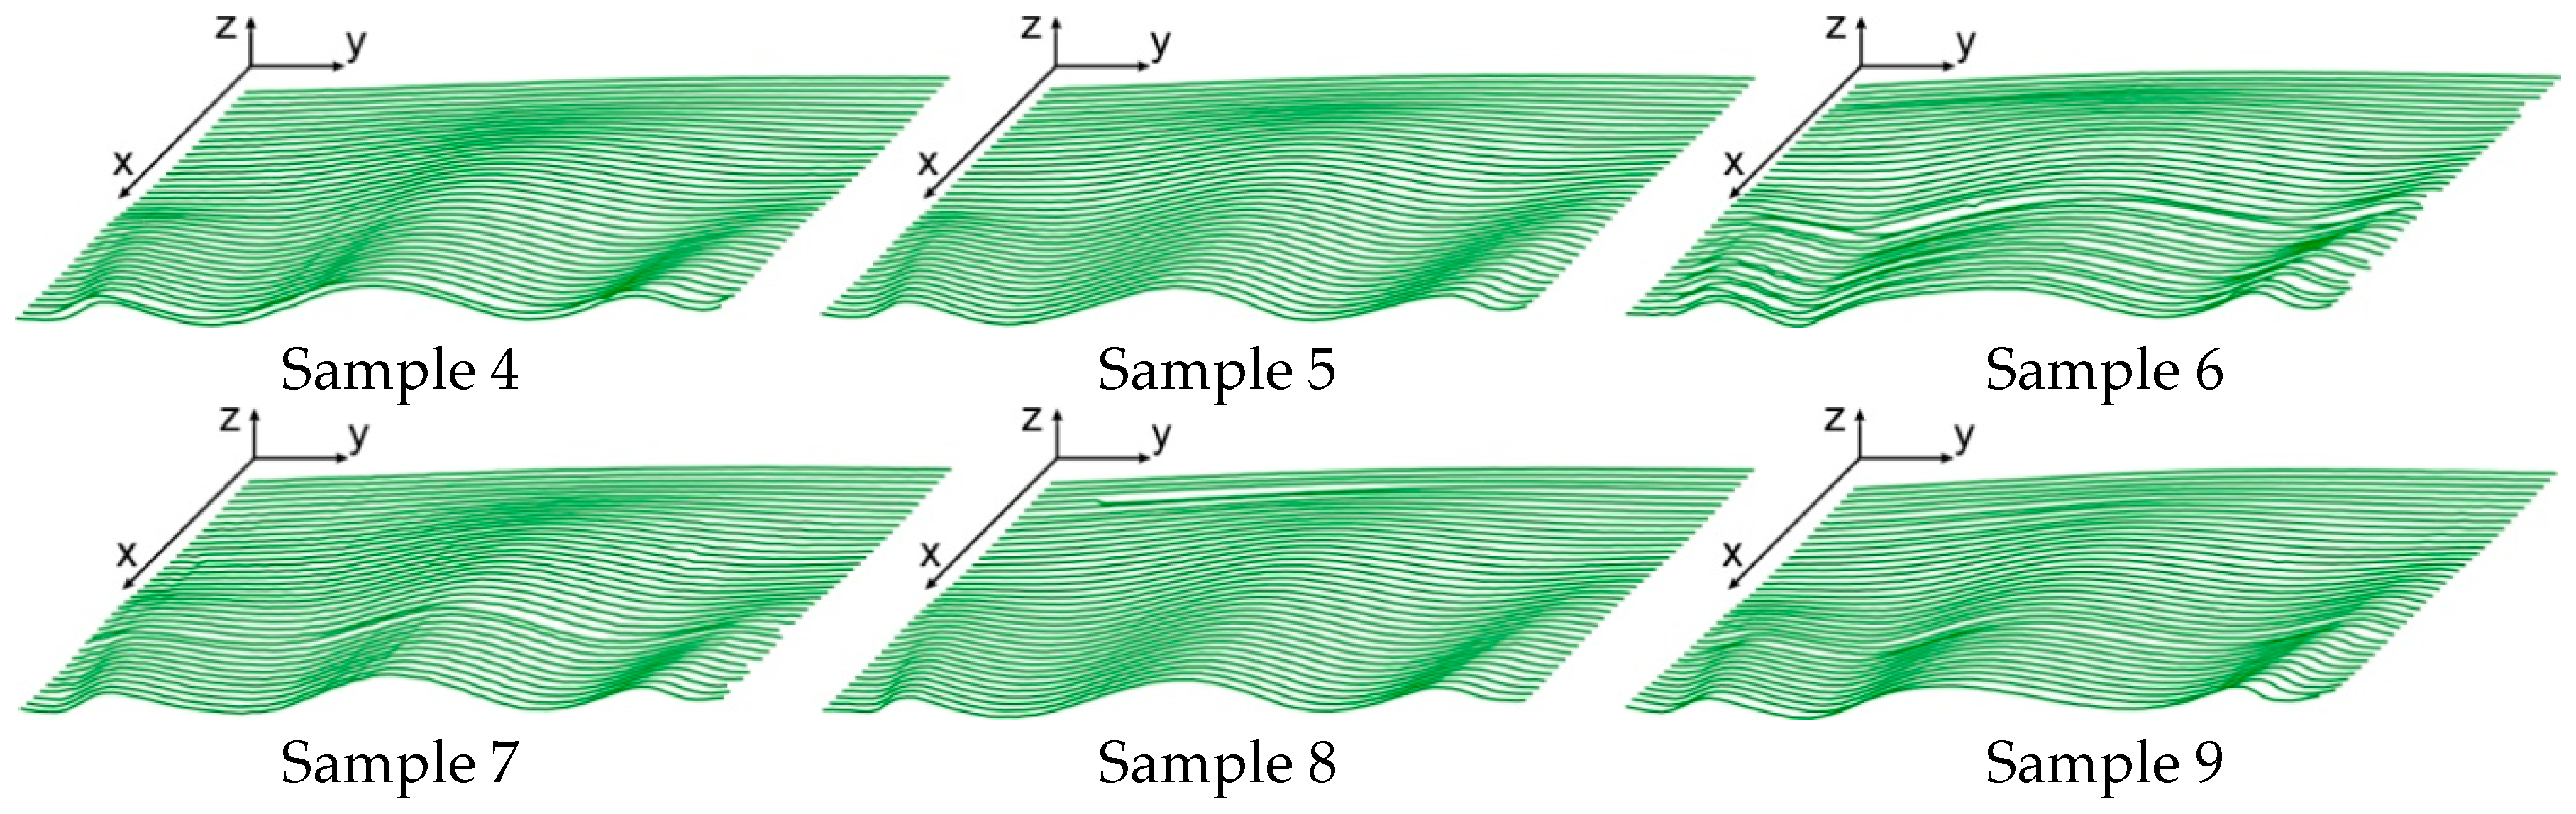
3. Results
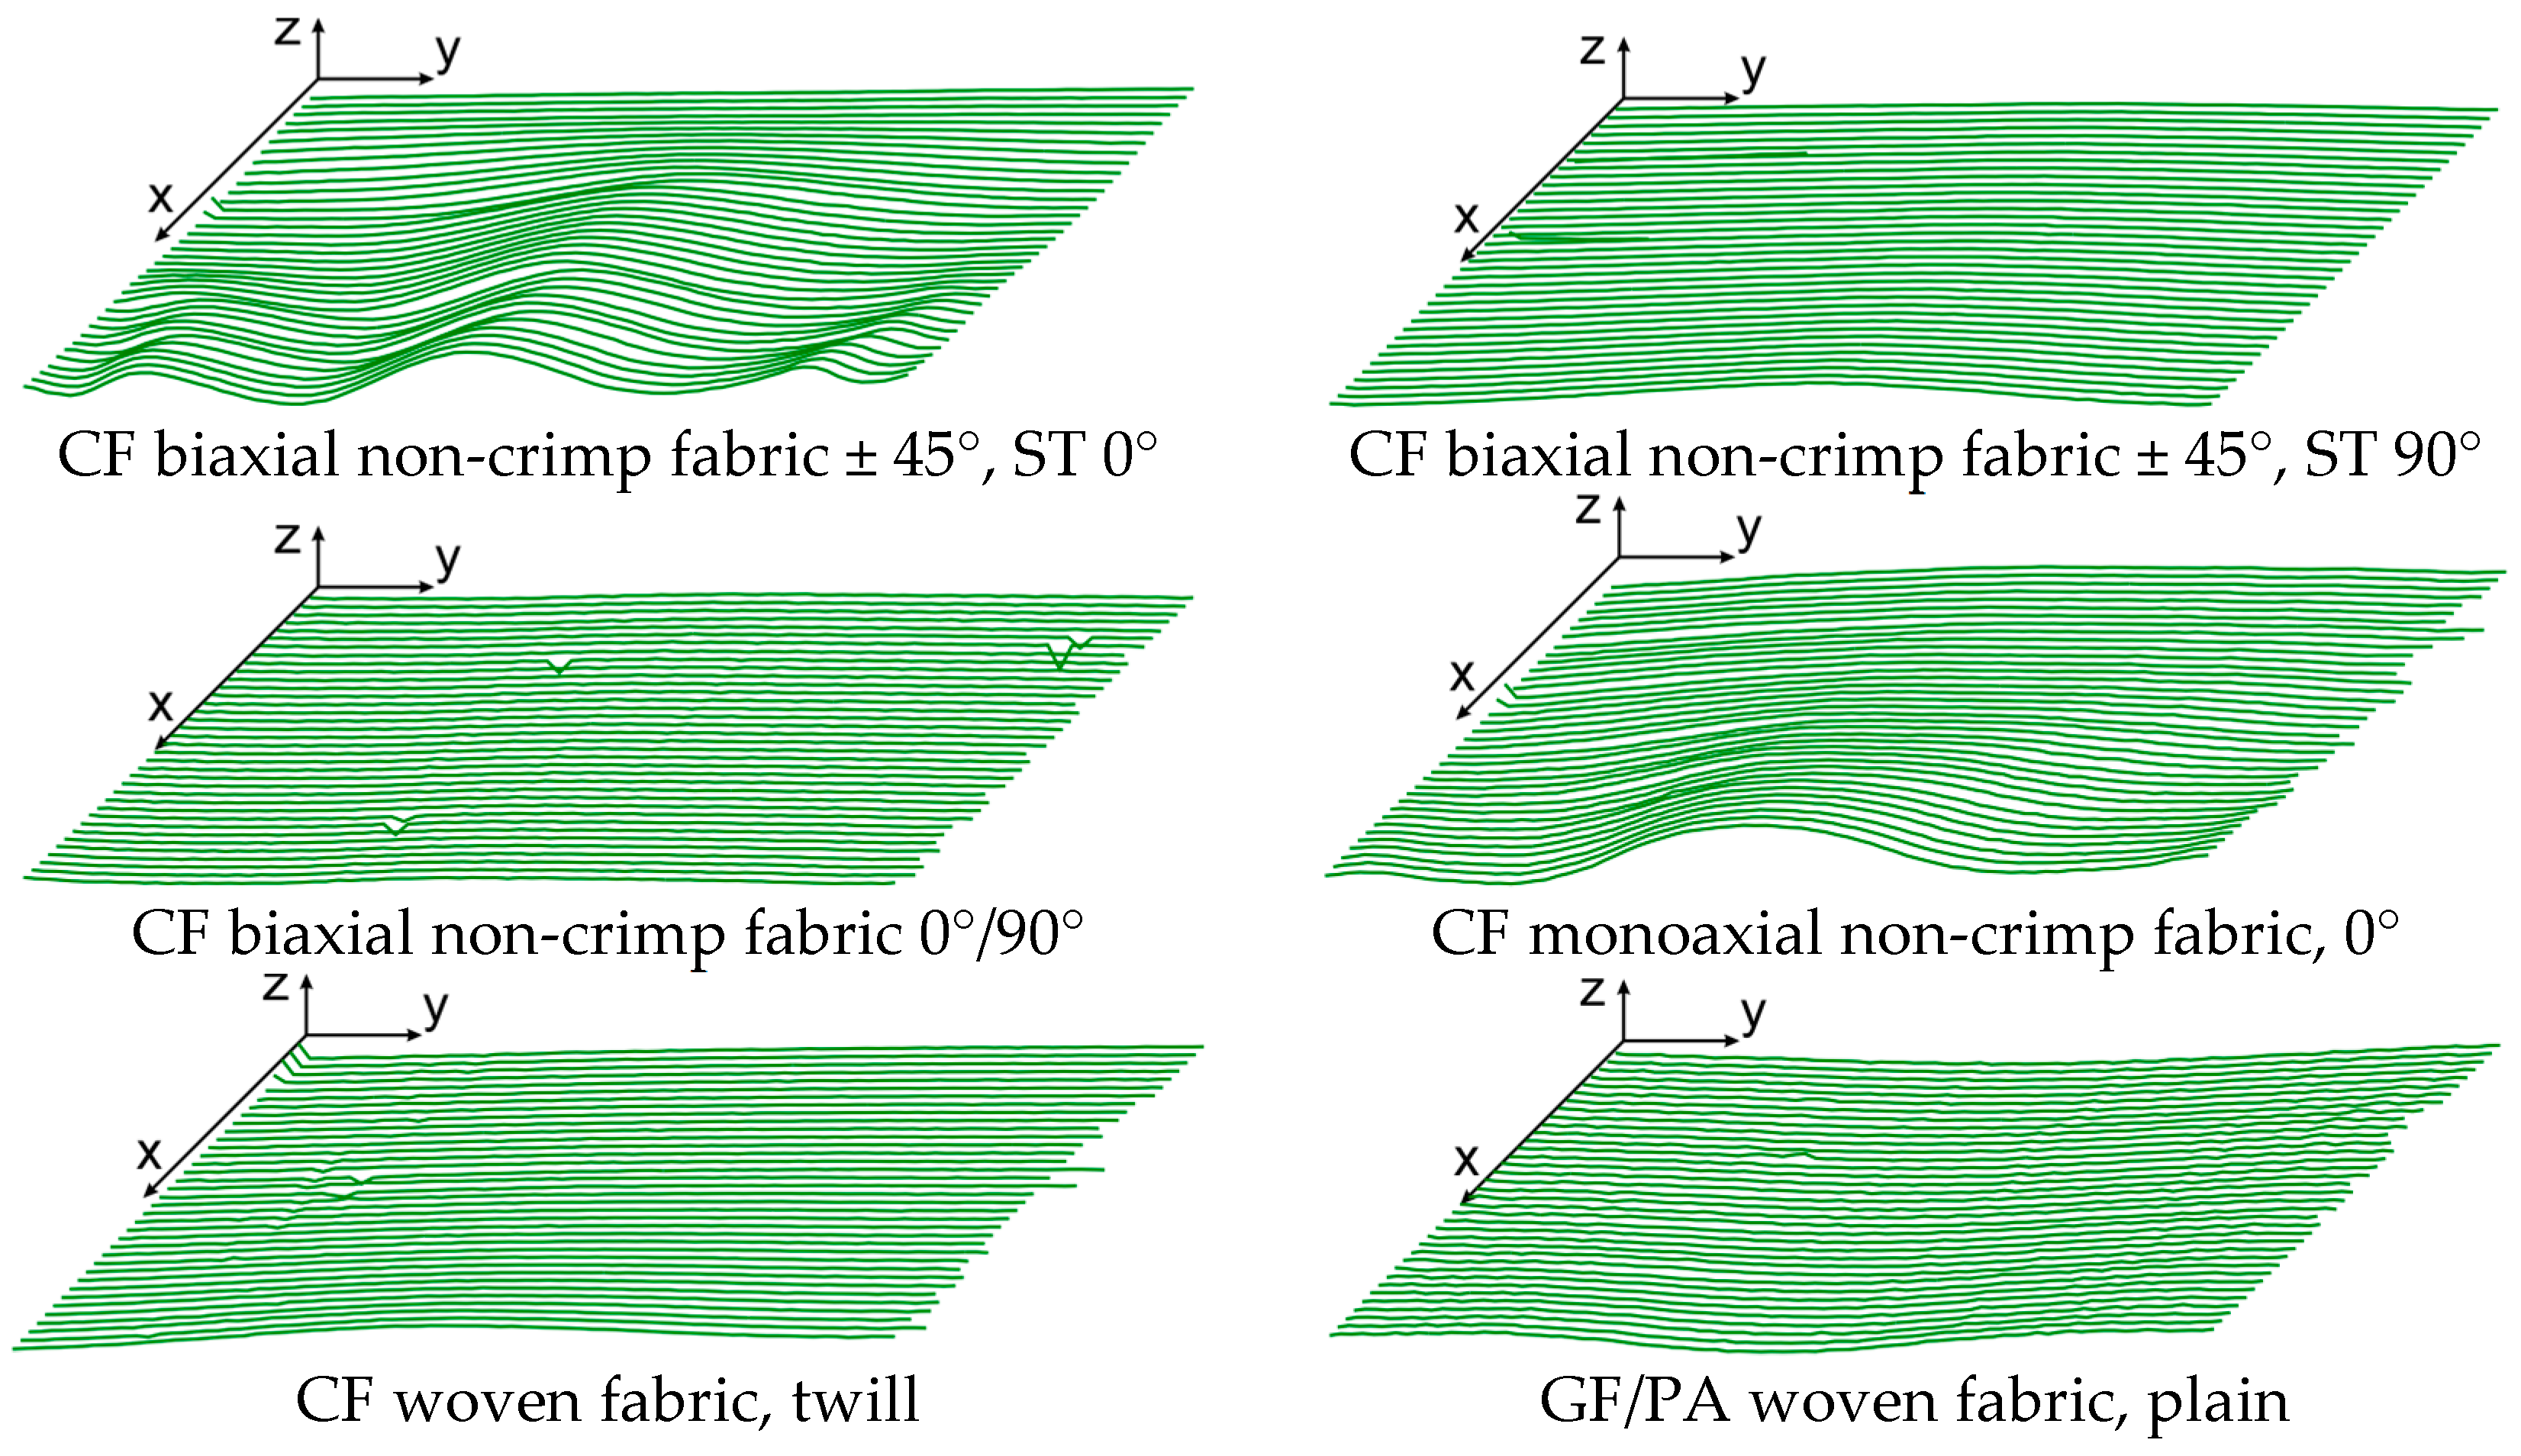
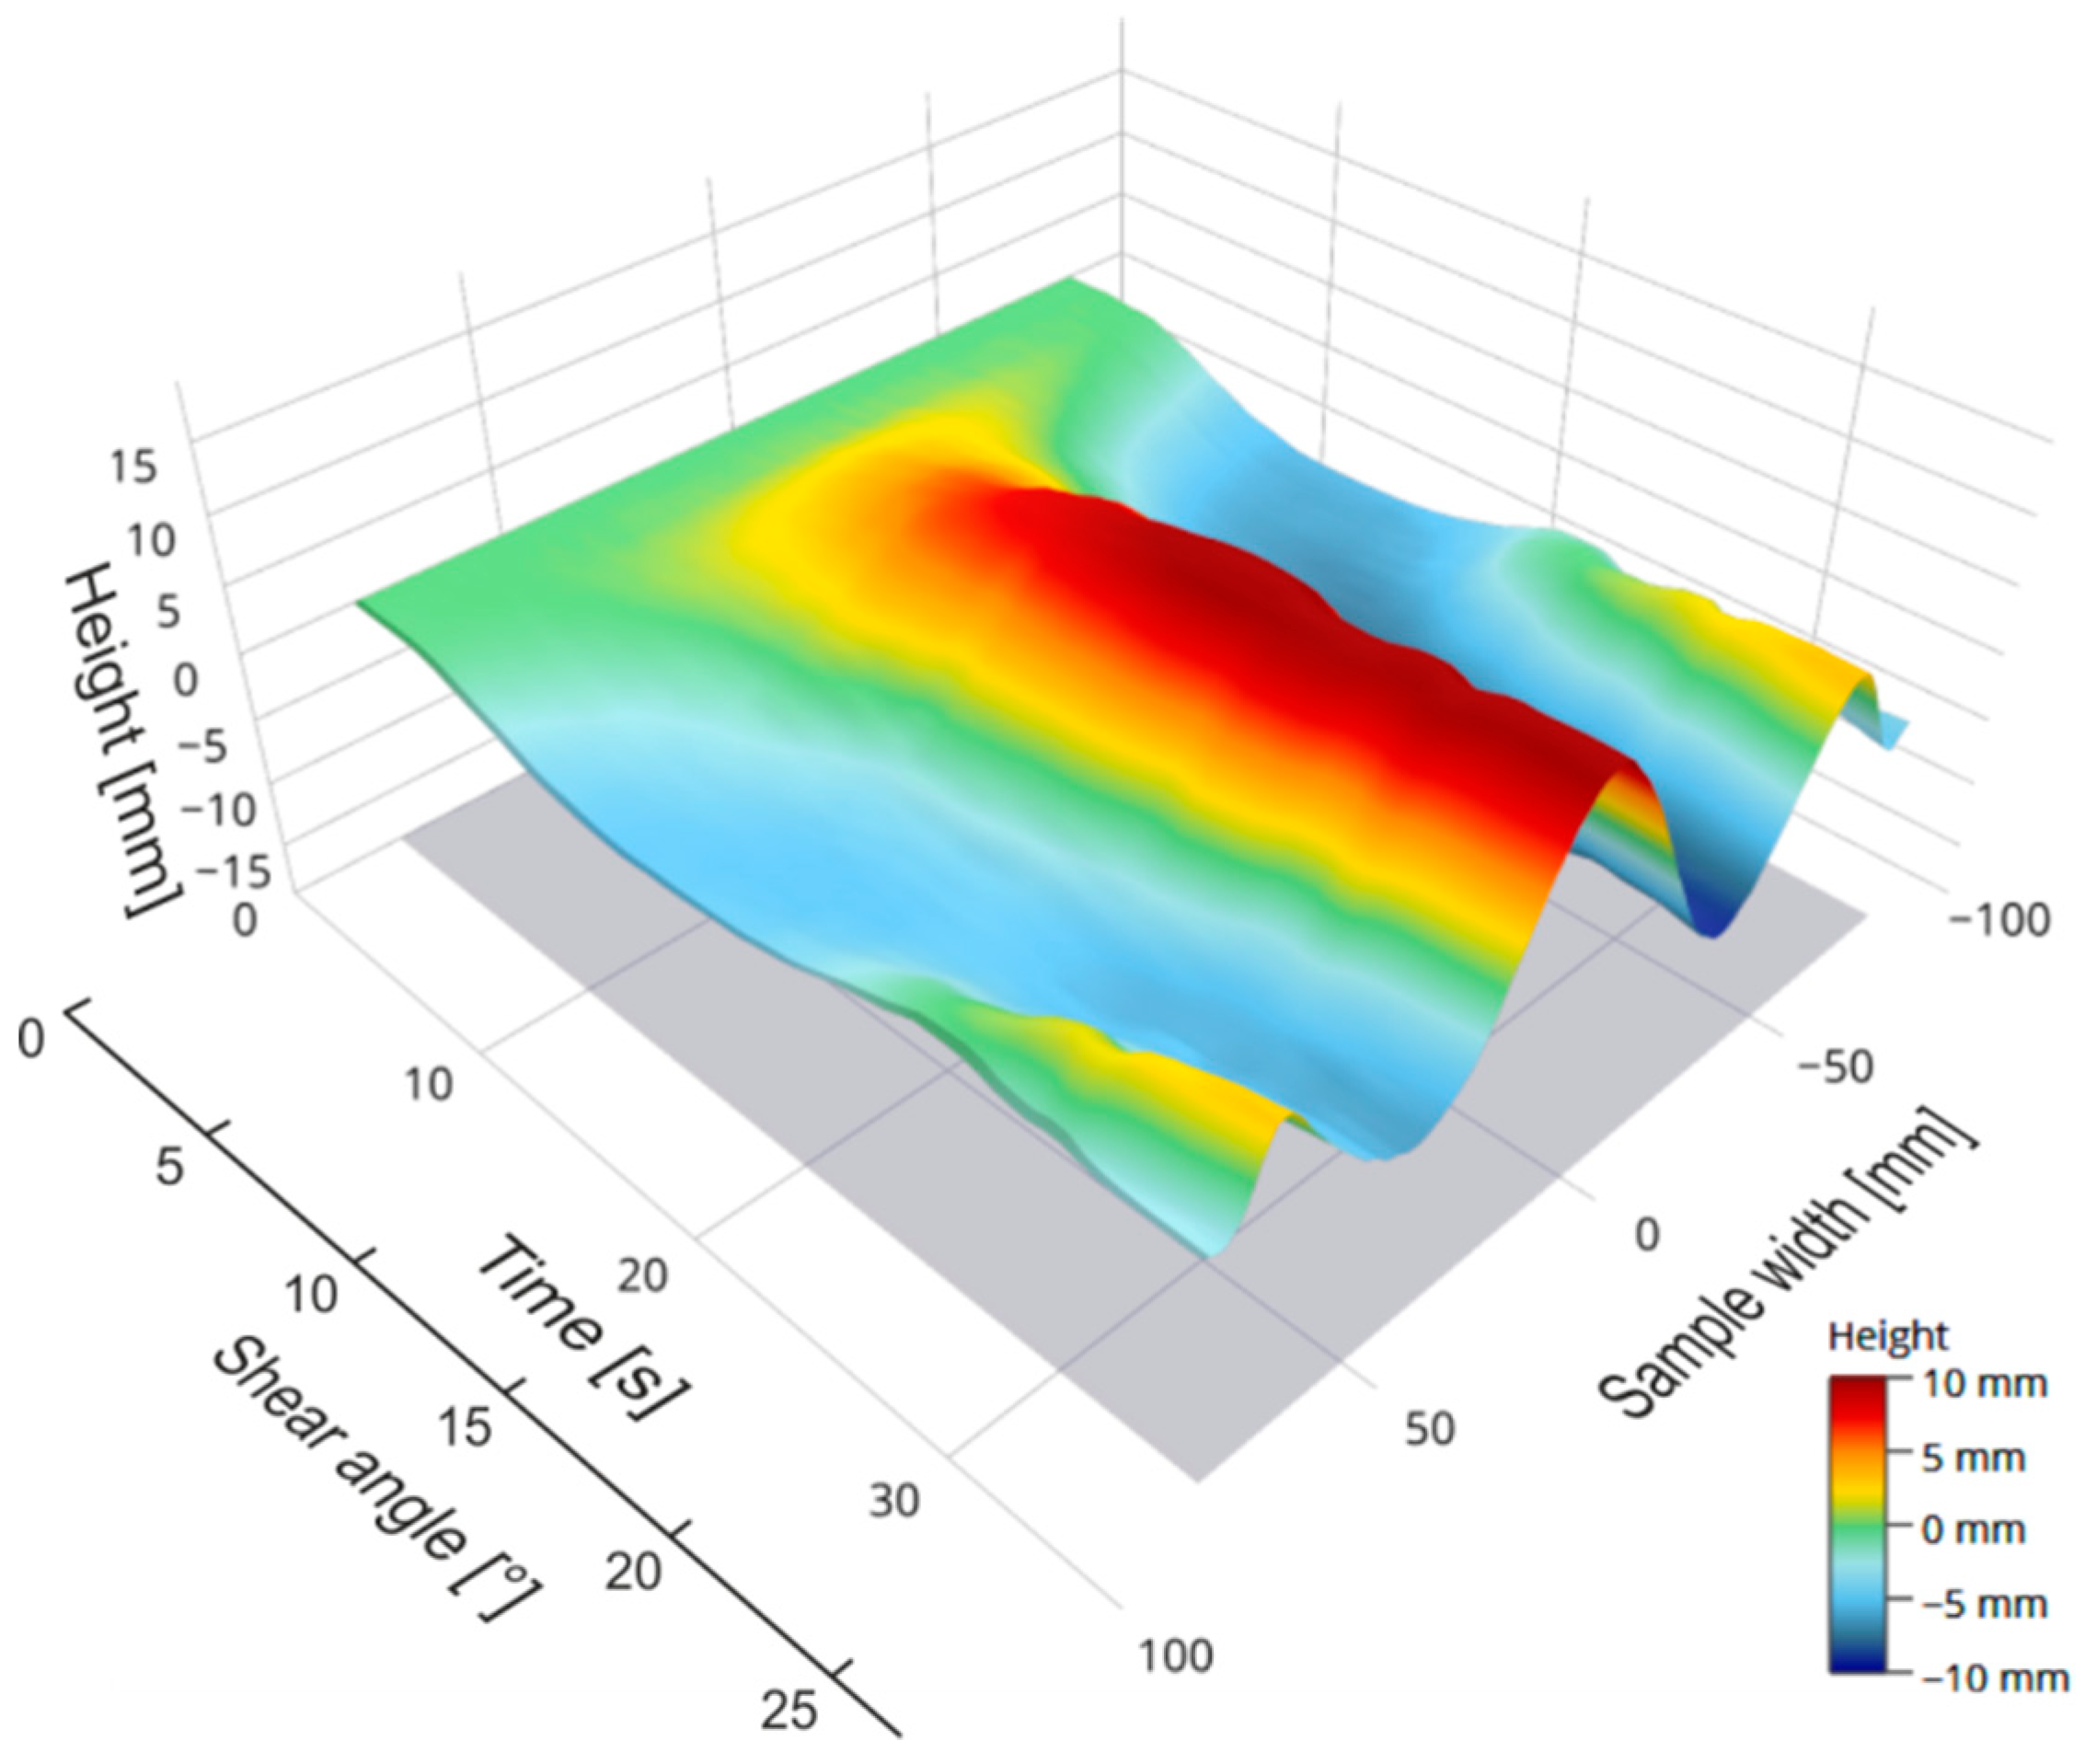
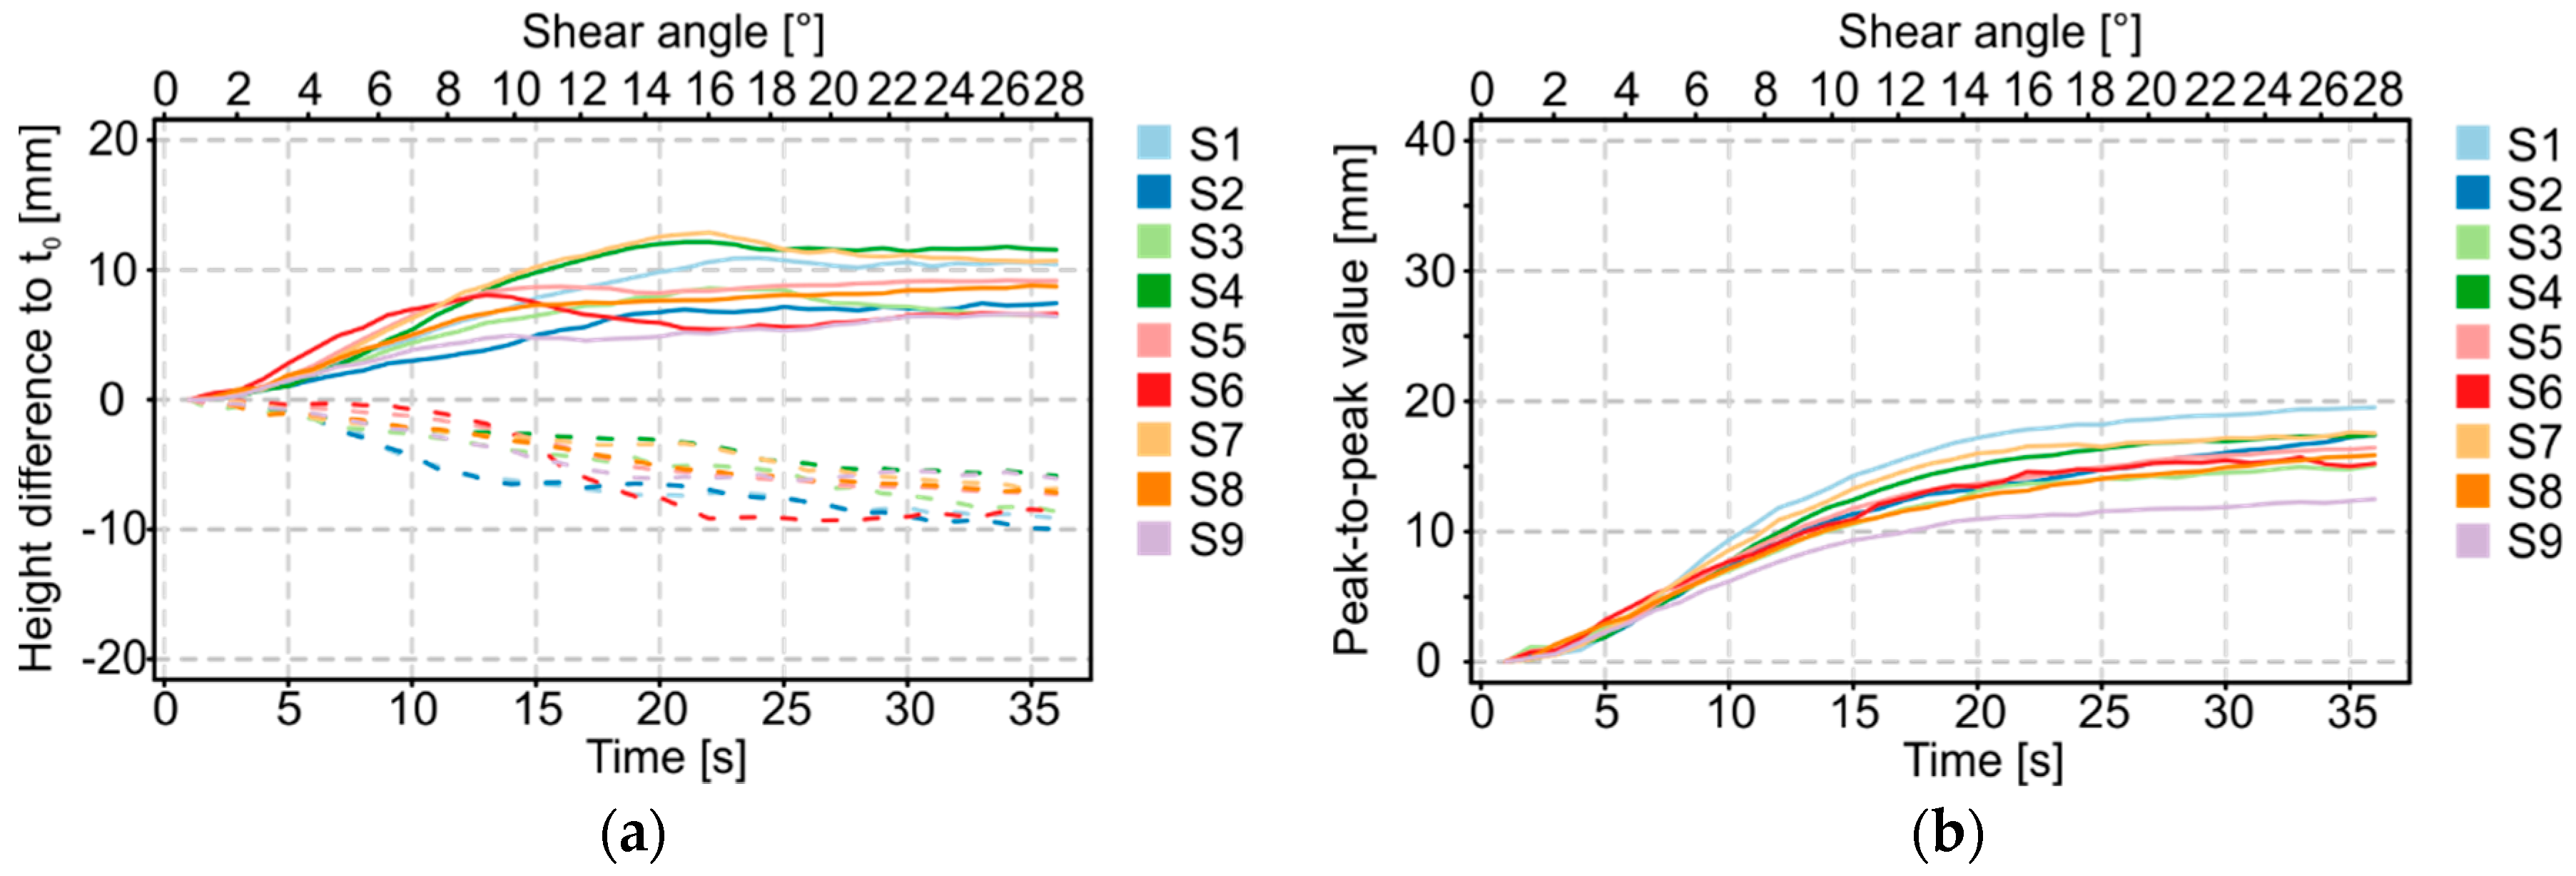
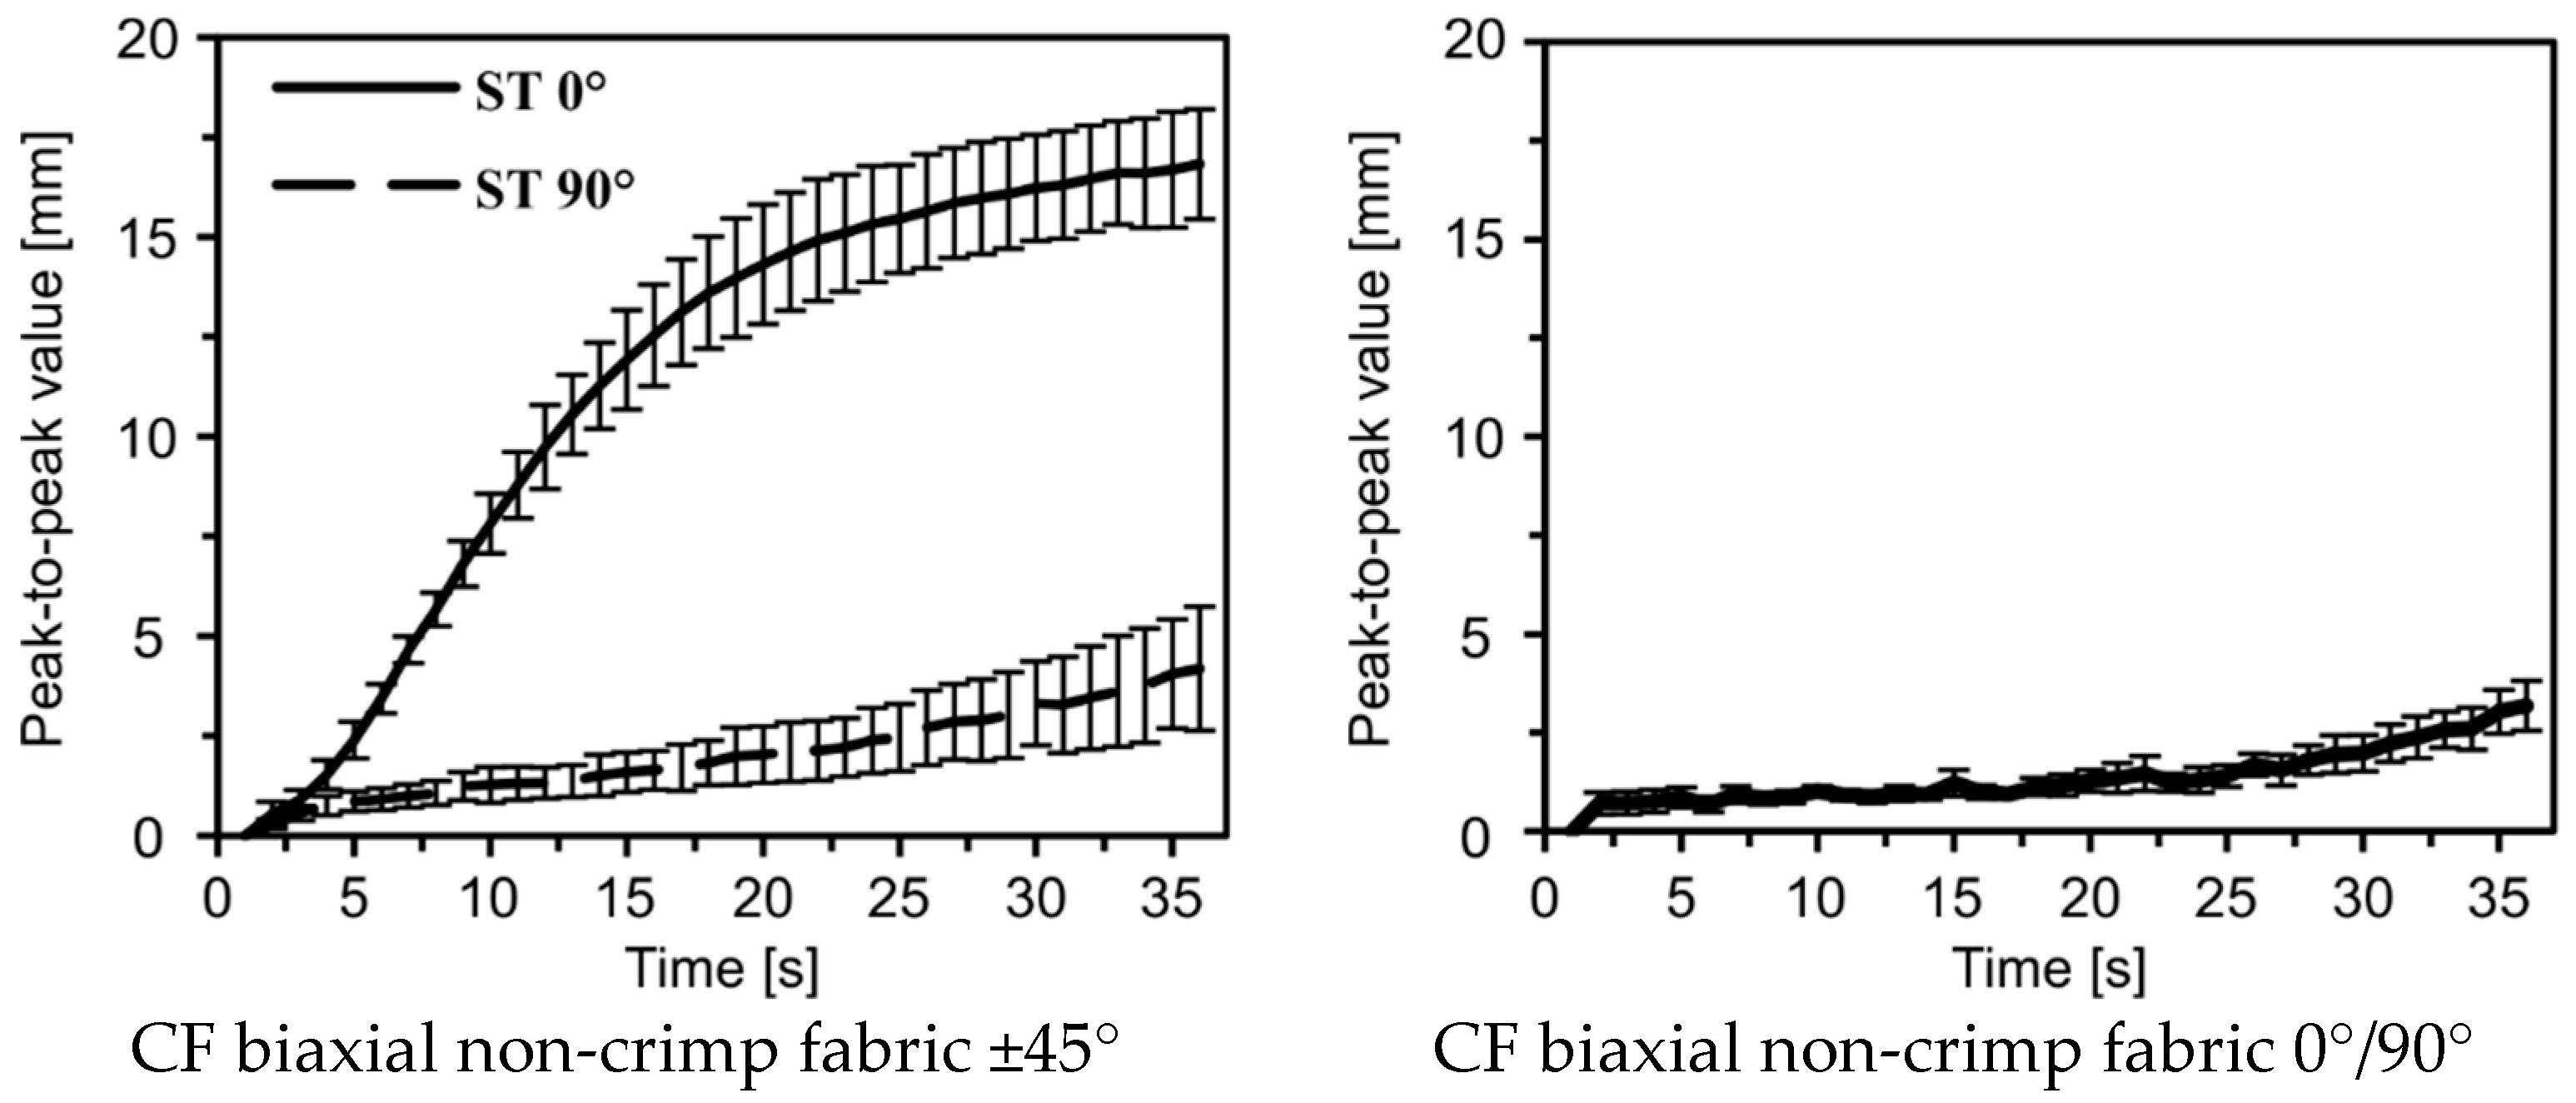
3.1. Additional Options for the Analysis of Optically Measured Shear Deformation
4. Conclusions
Author Contributions
Funding
Conflicts of Interest
References
- Cherif, C. (Ed.) Textile Materials for Lightweight Constructions: Technologies–Methods–Materials–Properties, 1st ed.; Springer: Berlin, Germany, 2016. [Google Scholar]
- Kenkare, N.; May-Plumlee, T. Evaluation of drape characteristics in fabrics. Int. J. Cloth. Sci. Technol. 2005, 17, 109–123. [Google Scholar] [CrossRef]
- Sauer, M.; Kühnel, M. Composite Market Report 2017. Carbon Composite e.V., Ed. Available online: https://www.carbon-composites.eu/media/2996/ccev-avk-marktbericht-2017.pdf (accessed on 28 February 2019).
- Lemanski, S.L.; Wang, J.; Sutcliffe, M.P.F.; Potter, K.D.; Wisnom, M.R. Modelling failure of composite specimens with defects under compression loading. Compos. Part A Appl. Sci. Manuf. 2013, 48, 26–36. [Google Scholar] [CrossRef]
- Mukhopadhyay, S.; Jones, M.I.; Hallett, S.R. Compressive failure of laminates containing an embedded wrinkle; experimental and numerical study. Compos. Part A Appl. Sci. Manuf. 2015, 73, 132–142. [Google Scholar] [CrossRef]
- Yu, W.R.; Harrison, P.; Long, A. Finite element forming simulation for non-crimp fabrics using a non-orthogonal constitutive equation (vol 36, pg 1079, 2005). Compos. Part A Appl. Sci. Manuf. 2005, 36, 1600. [Google Scholar] [CrossRef]
- Hamila, N.; Boisse, P.; Sabourin, F.; Brunet, M. A semi-discrete shell finite element for textile composite reinforcement forming simulation. Int. J. Numer. Methods Eng. 2009, 79, 1443–1466. [Google Scholar] [CrossRef]
- Haanappel, S.P.; Ten Thije, R.H.; Sachs, U.; Rietman, B.; Akkerman, R. Formability analyses of uni-directional and textile reinforced thermoplastics. Compos. Part A Appl. Sci. Manuf. 2014, 56, 80–92. [Google Scholar] [CrossRef]
- Smith, J.R.; Vaidya, U.K.; Johnstone, J.K. Analytical modeling of deformed plain woven thermoplastic composites. Int. J. Mater. Form. 2014, 7, 379–393. [Google Scholar] [CrossRef]
- Huebner, M.; Rocher, J.-E.; Allaoui, S.; Hivet, G.; Gereke, T.; Cherif, C. Simulation-based investigations on the drape behavior of 3D woven fabrics made of commingled yarns. Int. J. Mater. Form. 2016, 9, 591–599. [Google Scholar] [CrossRef]
- Krzywinski, S. Verbindung von Design und Konstruktion in der textilen Konfektion unter Anwendung von CAE; TUDpress Verlag der Wissenschaften GmbH, Habilitation; Technische Universität Dresden: Dresden, Germany, 2005. [Google Scholar]
- Cao, J.; Akkerman, R.; Boisse, P.; Chen, J.; Cheng, H.S.; de Graaf, E.F.; Gorczyca, J.L.; Harrison, P.; Hivet, G.; Launay, J.; et al. Characterization of mechanical behavior of woven fabrics: Experimental methods and benchmark results. Compos. Part A Appl. Sci. Manuf. 2008, 39, 1037–1053. [Google Scholar] [CrossRef]
- Mohammed, U.; Lekakou, C.; Dong, L.; Bader, M.G. Shear deformation and micromechanics of woven fabrics. Compos. Part A Appl. Sci. Manuf. 2000, 31, 299–308. [Google Scholar] [CrossRef]
- Zhu, B.; Yu, T.X.; Tao, X.M. An experimental study of in-plane large shear deformation of woven fabric composite. Compos. Sci. Technol. 2007, 67, 252–261. [Google Scholar] [CrossRef]
- Boisse, P.; Hamila, N.; Guzman-Maldonado, E.; Madeo, A.; Hivet, G.; dell’Isola, F. The bias-extension test for the analysis of in-plane shear properties of textile composite reinforcements and prepregs: A review. Int. J. Mater. Form. 2017, 10, 473–492. [Google Scholar] [CrossRef]
- Mack, C.; Taylor, H.M. 39—The fitting of woven cloth to surfaces. J. Text. Inst. Trans. 1956, 47, T477–T488. [Google Scholar] [CrossRef]
- Van Der Weeën, F. Algorithms for draping fabrics on doubly-curved surfaces. Int. J. Numer. Methods Eng. 1991, 31, 1415–1426. [Google Scholar] [CrossRef]
- Cherouat, A.; Borouchaki, H.; Billoeet, J.-L. Geometrical and mechanical draping of composite fabric. Eur. J. Comput. Mech. 2005, 14, 693–707. [Google Scholar] [CrossRef]
- Orawattanasrikul, S. Experimentelle Analyse der Scherdeformation biaxial Verstärkter Mehrlagengestricke; Dissertation: Dresden, Germany, 2006. [Google Scholar]
- Hivet, G.; Duong, A.V. A contribution to the analysis of the intrinsic shear behavior of fabrics. J. Compos. Mater. 2011, 45, 695–716. [Google Scholar] [CrossRef]
- Harrison, P.; Clifford, M.J.; Long, A.C. Shear characterisation of viscous woven textile composites: A comparison between picture frame and bias extension experiments. Compos. Sci. Technol. 2004, 64, 1453–1465. [Google Scholar] [CrossRef]
- Launay, J.; Hivet, G.; Duong, A.V.; Boisse, P. Experimental analysis of the influence of tensions on in plane shear behaviour of woven composite reinforcements. Compos. Sci. Technol. 2008, 68, 506–515. [Google Scholar] [CrossRef]
- Rashidi, A.; Milani, A.S. A multi-step biaxial bias extension test for wrinkling/de-wrinkling characterization of woven fabrics: Towards optimum forming design guidelines. Mater. Des. 2018, 146, 273–285. [Google Scholar] [CrossRef]
- Zhu, B.; Yu, T.X.; Tao, X.M. Large deformation and slippage mechanism of plain woven composite in bias extension. Compos. Part A Appl. Sci. Manuf. 2007, 38, 1821–1828. [Google Scholar] [CrossRef]
- Boisse, P.; Hamila, N.; Vidal-Salle, E.; Dumont, F. Simulation of wrinkling during textile composite reinforcement forming. Influence of tensile, in-plane shear and bending stiffnesses. Compos. Sci. Technol. 2011, 71, 683–692. [Google Scholar] [CrossRef]
- Schirmaier, F.J.; Weidenmann, K.A.; Kaerger, L.; Henning, F. Characterisation of the draping behaviour of unidirectional non-crimp fabrics (UD-NCF). Compos. Part A Appl. Sci. Manuf. 2016, 80, 28–38. [Google Scholar] [CrossRef]
- Bel, S.; Boisse, P.; Dumont, F. Analyses of the deformation mechanisms of non-crimp fabric composite reinforcements during preforming. Appl. Compos. Mater. 2012, 19, 513–528. [Google Scholar] [CrossRef]
- Bel, S.; Hamila, N.; Boisse, P.; Dumont, F. Finite element model for NCF composite reinforcement preforming: Importance of inter-ply sliding. Compos. Part A Appl. Sci. Manuf. 2012, 43, 2269–2277. [Google Scholar] [CrossRef]
- Lomov, S.V.; Barburski, M.; Stoilova, T.; Verpoest, I.; Akkerman, R.; Loendersloot, R.; Ten Thije, R.H. Carbon composites based on multiaxial multiply stitched preforms. Part 3: Biaxial tension, picture frame and compression tests of the preforms. Compos. Part A Appl. Sci. Manuf. 2005, 36, 1188–1206. [Google Scholar] [CrossRef]
- Peng, X.Q.; Cao, J.; Chen, J.; Xue, P.; Lussier, D.S.; Liu, L. Experimental and numerical analysis on normalization of picture frame tests for composite materials. Compos. Sci. Technol. 2004, 64, 11–21. [Google Scholar] [CrossRef]
- Lomov, S.V.; Boisse, P.; Deluycker, E.; Morestin, F.; Vanclooster, K.; Vandepitte, D.; Verpoest, I.; Willems, A. Full-field strain measurements in textile deformability studies. Compos. Part A Appl. Sci. Manuf. 2008, 39, 1232–1244. [Google Scholar] [CrossRef]
- Harrison, P.; Abdiwi, F.; Guo, Z.; Potluri, P.; Yu, W.R. Characterising the shear-tension coupling and wrinkling behaviour of woven engineering fabrics. Compos. Part A Appl. Sci. Manuf. 2012, 43, 903–914. [Google Scholar] [CrossRef]
- Dangora, L.M.; Hansen, C.J.; Mitchell, C.J.; Sherwood, J.A.; Parker, J.C. Challenges associated with shear characterization of a cross-ply thermoplastic lamina using picture frame tests. Compos. Part A Appl. Sci. Manuf. 2015, 78, 181–190. [Google Scholar] [CrossRef]
- Lebrun, G.; Bureau, M.N.; Denault, J. Evaluation of bias-extension and picture-frame test methods for the measurement of intraply shear properties of PP/glass commingled fabrics. Compos. Struct. 2003, 61, 341–352. [Google Scholar] [CrossRef]
- Li, L.; Zhao, Y.; Vuong, H.g.; Chen, Y.; Yang, J.; Duan, Y. In-plane shear investigation of biaxial carbon non-crimp fabrics with experimental tests and finite element modeling. Mater. Des. 2014, 63, 757–765. [Google Scholar] [CrossRef]
- Hosseini, A.; Kashani, M.H.; Sassani, F.; Milani, A.S.; Ko, F.K. Identifying the distinct shear wrinkling behavior of woven composite preforms under bias extension and picture frame tests. Compos. Struct. 2018, 185, 764–773. [Google Scholar] [CrossRef]
- Souter, B.J. Effect of Fiber Architecture on Formability of Textile Preforms; Dissertation: Nottingham, UK, 2001. [Google Scholar]
- Zhu, B.; Yu, T.X.; Teng, J.; Tao, X.M. Theoretical Modeling of Large Shear Deformation and Wrinkling of Plain Woven Composite. J. Compos. Mater. 2009, 43, 125–138. [Google Scholar] [CrossRef]
- Cherif, C. Drapierbarkeitssimulation von Verstärkungstextilien für den Einsatz in Faserverbundwerkstoffen mit der Finite-Element-Methode; Dissertation: Aachen, Germany, 1999. [Google Scholar]
- Kim, D.K.; Jang, B.T.; Hwang, C.J. A Planar Perspective Image Matching using Point Correspondes and Rectangle-to-Quadrilateral Mapping. In Proceedings of the Fifth IEE Southwest Symposium on Image Analysis and Interpretation, Santa Fe, NM, USA, 7–9 April 2002; pp. 1532–1537. [Google Scholar] [CrossRef]
- R Core Team. R: A Language and Environment for Statistical Computing; R Foundation for Statistical Computing: Vienna, Austria, 2016; Available online: URL https://www.R-project.org/ (accessed on 28 February 2019).


| Identification | Appearance | Mass Per Unit Area | Warp Yarn | Weft Yarn | Sewing Thread | ||
|---|---|---|---|---|---|---|---|
| Material/Orientation | Linear Density | Stitch Length | |||||
| (g/m²) | (tex) | (tex) | (°) | (dtex) | (mm) | ||
| CF biaxial non-crimp fabric ±45° |  | 300 | 1600 | 1600 | PES/0 | 36 | 2.9 |
| CF biaxial non-crimp fabric 0°/90° |  | 349 | 800 | 400 | PES/0 | 180 | 2.5 |
| CF monoaxial non-crimp fabric 0° |  | 330 | 1600 | - | PES/0 PES/90 | 820 340 | 2.5 |
| CF woven fabric, twill 2/2 |  | 400 | 800 | 800 | - | - | - |
| GF/PA woven fabric, plain |  | 625 | 1800 | 1800 | - | - | - |
| Criteria | Peak 1 | Peak 2 | Peak 3 | Peak 4 | Peak 5 |
|---|---|---|---|---|---|
| Nominal value (mm) | 10.00 | 5.00 | 20.00 | 15.00 | 10.00 |
| Measured value (mm) | 9.59 | 4.83 | 19.72 | 14.21 | 10.23 |
| Absolute Deviation (%) | 4.12 | 3.44 | 1.42 | 5.28 | 2.35 |
© 2019 by the authors. Licensee MDPI, Basel, Switzerland. This article is an open access article distributed under the terms and conditions of the Creative Commons Attribution (CC BY) license (http://creativecommons.org/licenses/by/4.0/).
Share and Cite
Rothe, S.; Wendt, E.; Krzywinski, S.; Halász, M.; Bakonyi, P.; Tamás, P.; Bojtos, A. Investigation of Shear-Induced Deformation of Reinforcing Textiles by Optical Measurement Devices. Materials 2019, 12, 1029. https://doi.org/10.3390/ma12071029
Rothe S, Wendt E, Krzywinski S, Halász M, Bakonyi P, Tamás P, Bojtos A. Investigation of Shear-Induced Deformation of Reinforcing Textiles by Optical Measurement Devices. Materials. 2019; 12(7):1029. https://doi.org/10.3390/ma12071029
Chicago/Turabian StyleRothe, Stefan, Ellen Wendt, Sybille Krzywinski, Marianna Halász, Peter Bakonyi, Peter Tamás, and Attila Bojtos. 2019. "Investigation of Shear-Induced Deformation of Reinforcing Textiles by Optical Measurement Devices" Materials 12, no. 7: 1029. https://doi.org/10.3390/ma12071029
APA StyleRothe, S., Wendt, E., Krzywinski, S., Halász, M., Bakonyi, P., Tamás, P., & Bojtos, A. (2019). Investigation of Shear-Induced Deformation of Reinforcing Textiles by Optical Measurement Devices. Materials, 12(7), 1029. https://doi.org/10.3390/ma12071029