Experimental and Modeling Study of the Evolution of Mechanical Properties of PAN-Based Carbon Fibers at Elevated Temperatures


Abstract
:
1. Introduction
2. Experimental
2.1. Raw Materials
2.2. Elevated Temperature Exposures
2.3. Tensile Tests
2.4. Thermal Gravimetric Analysis (TGA)
2.5. Surface Morphology
2.6. Elements and Functional Groups
2.6.1. X-ray Photoelectron Spectroscopy (XPS)
2.6.2. Fourier Transform Infrared Spectroscopy (FTIR)
3. Theoretical Model
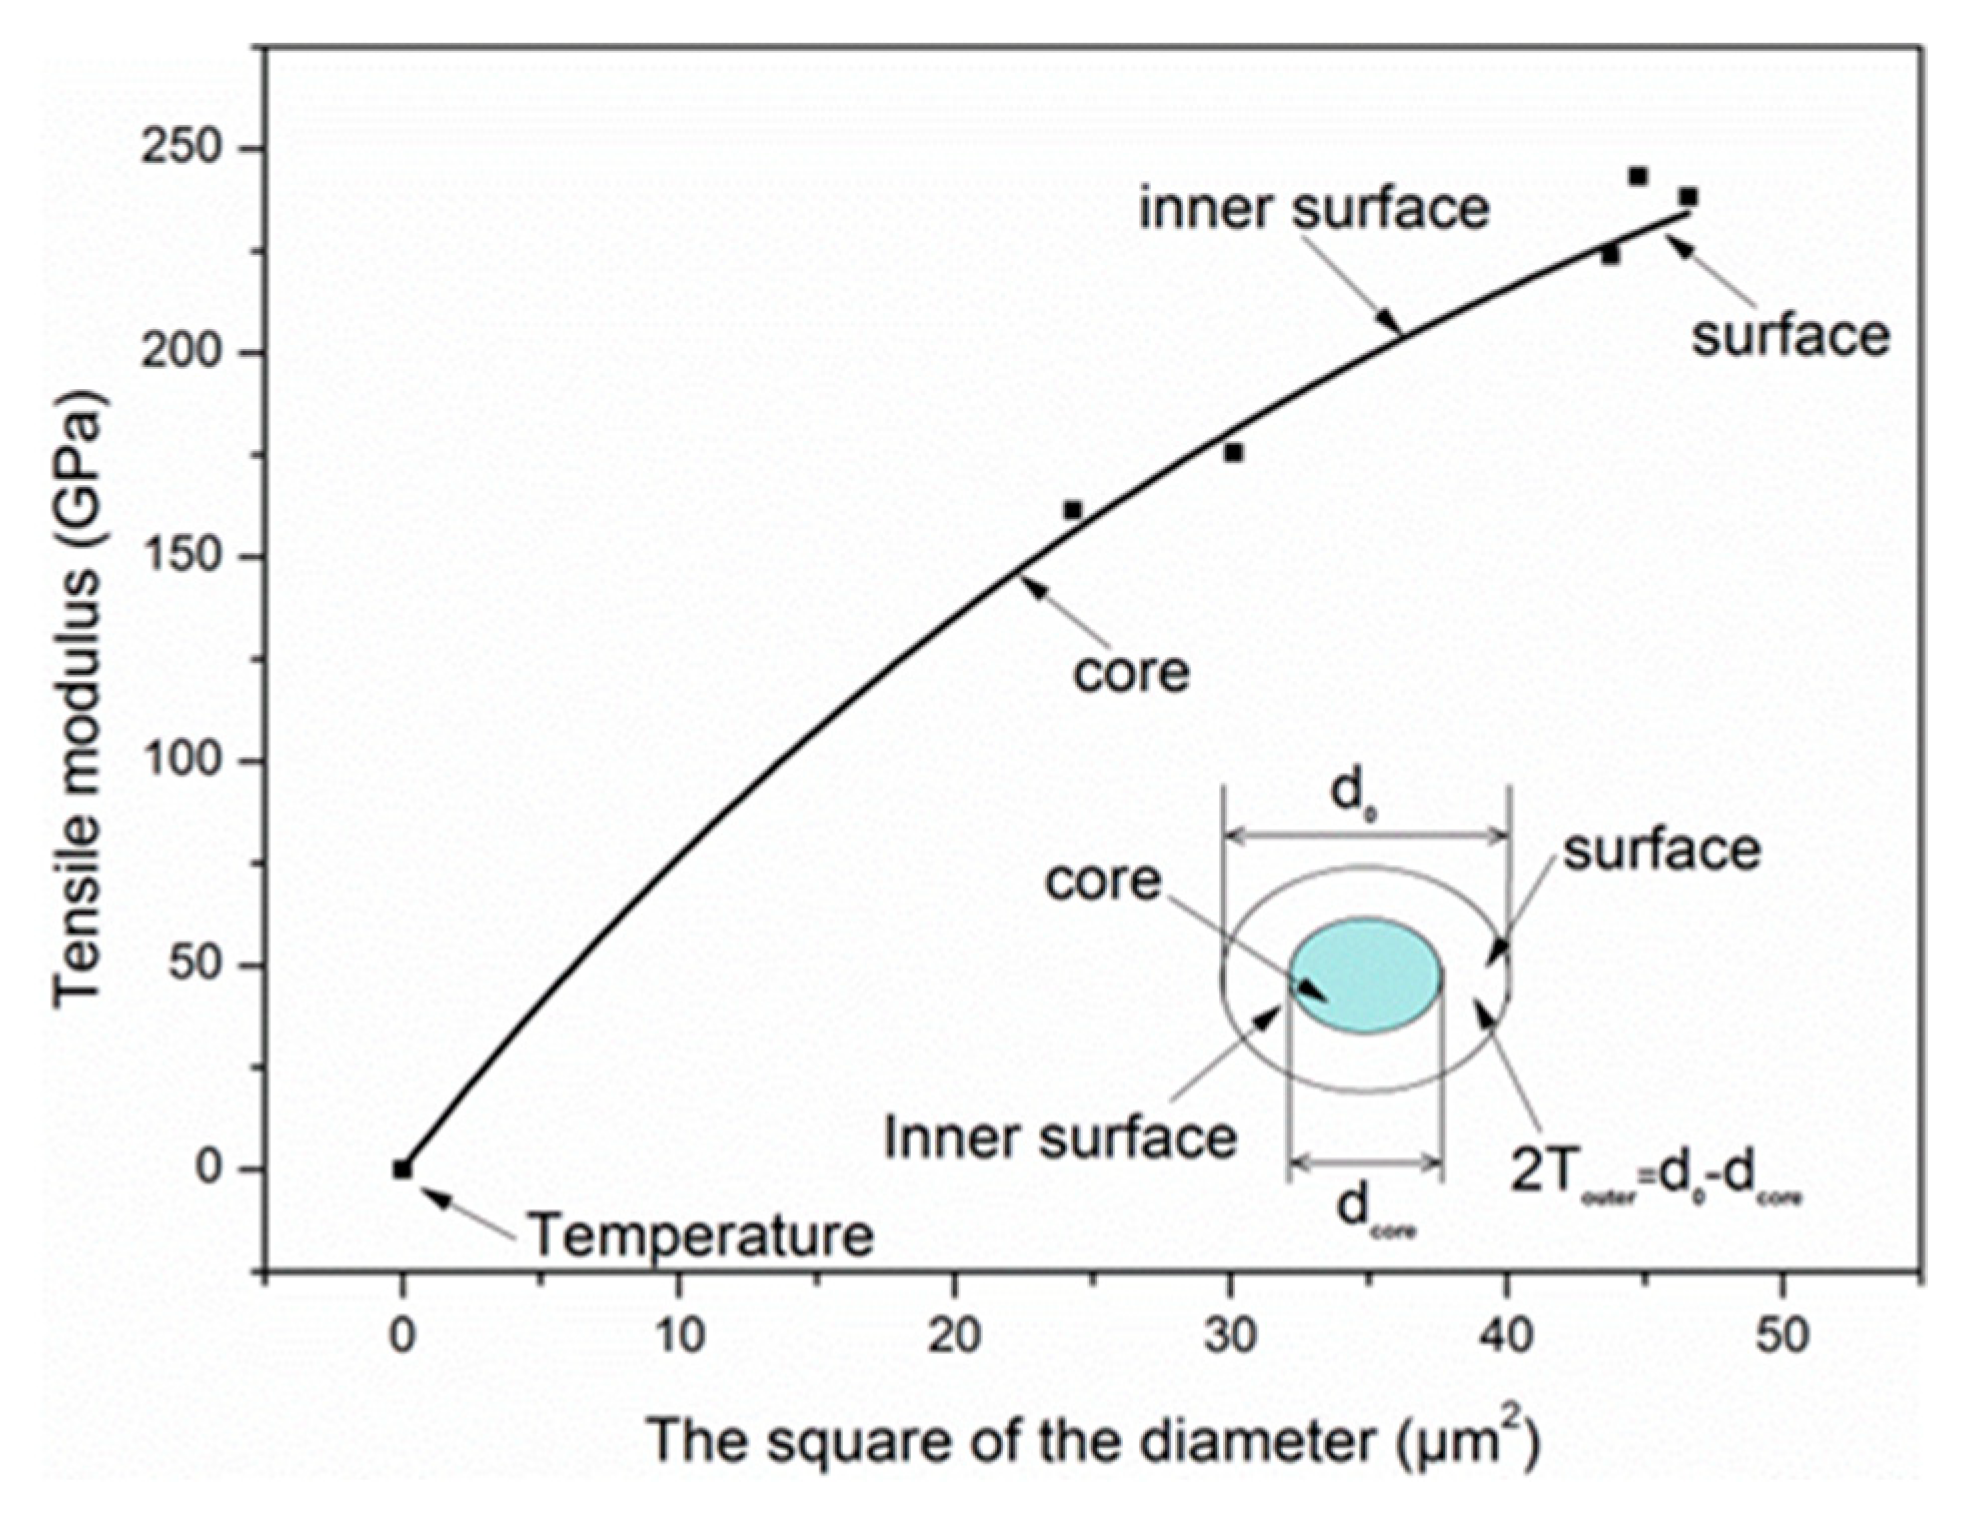
3.1. Rule-of-Mixture of the Tensile Modulus for the Skin–Core Heterogeneity of Carbon Fiber
3.2. The Modulus for Shear between Graphite Planes
4. Results and Discussion
4.1. Mechanical Properties
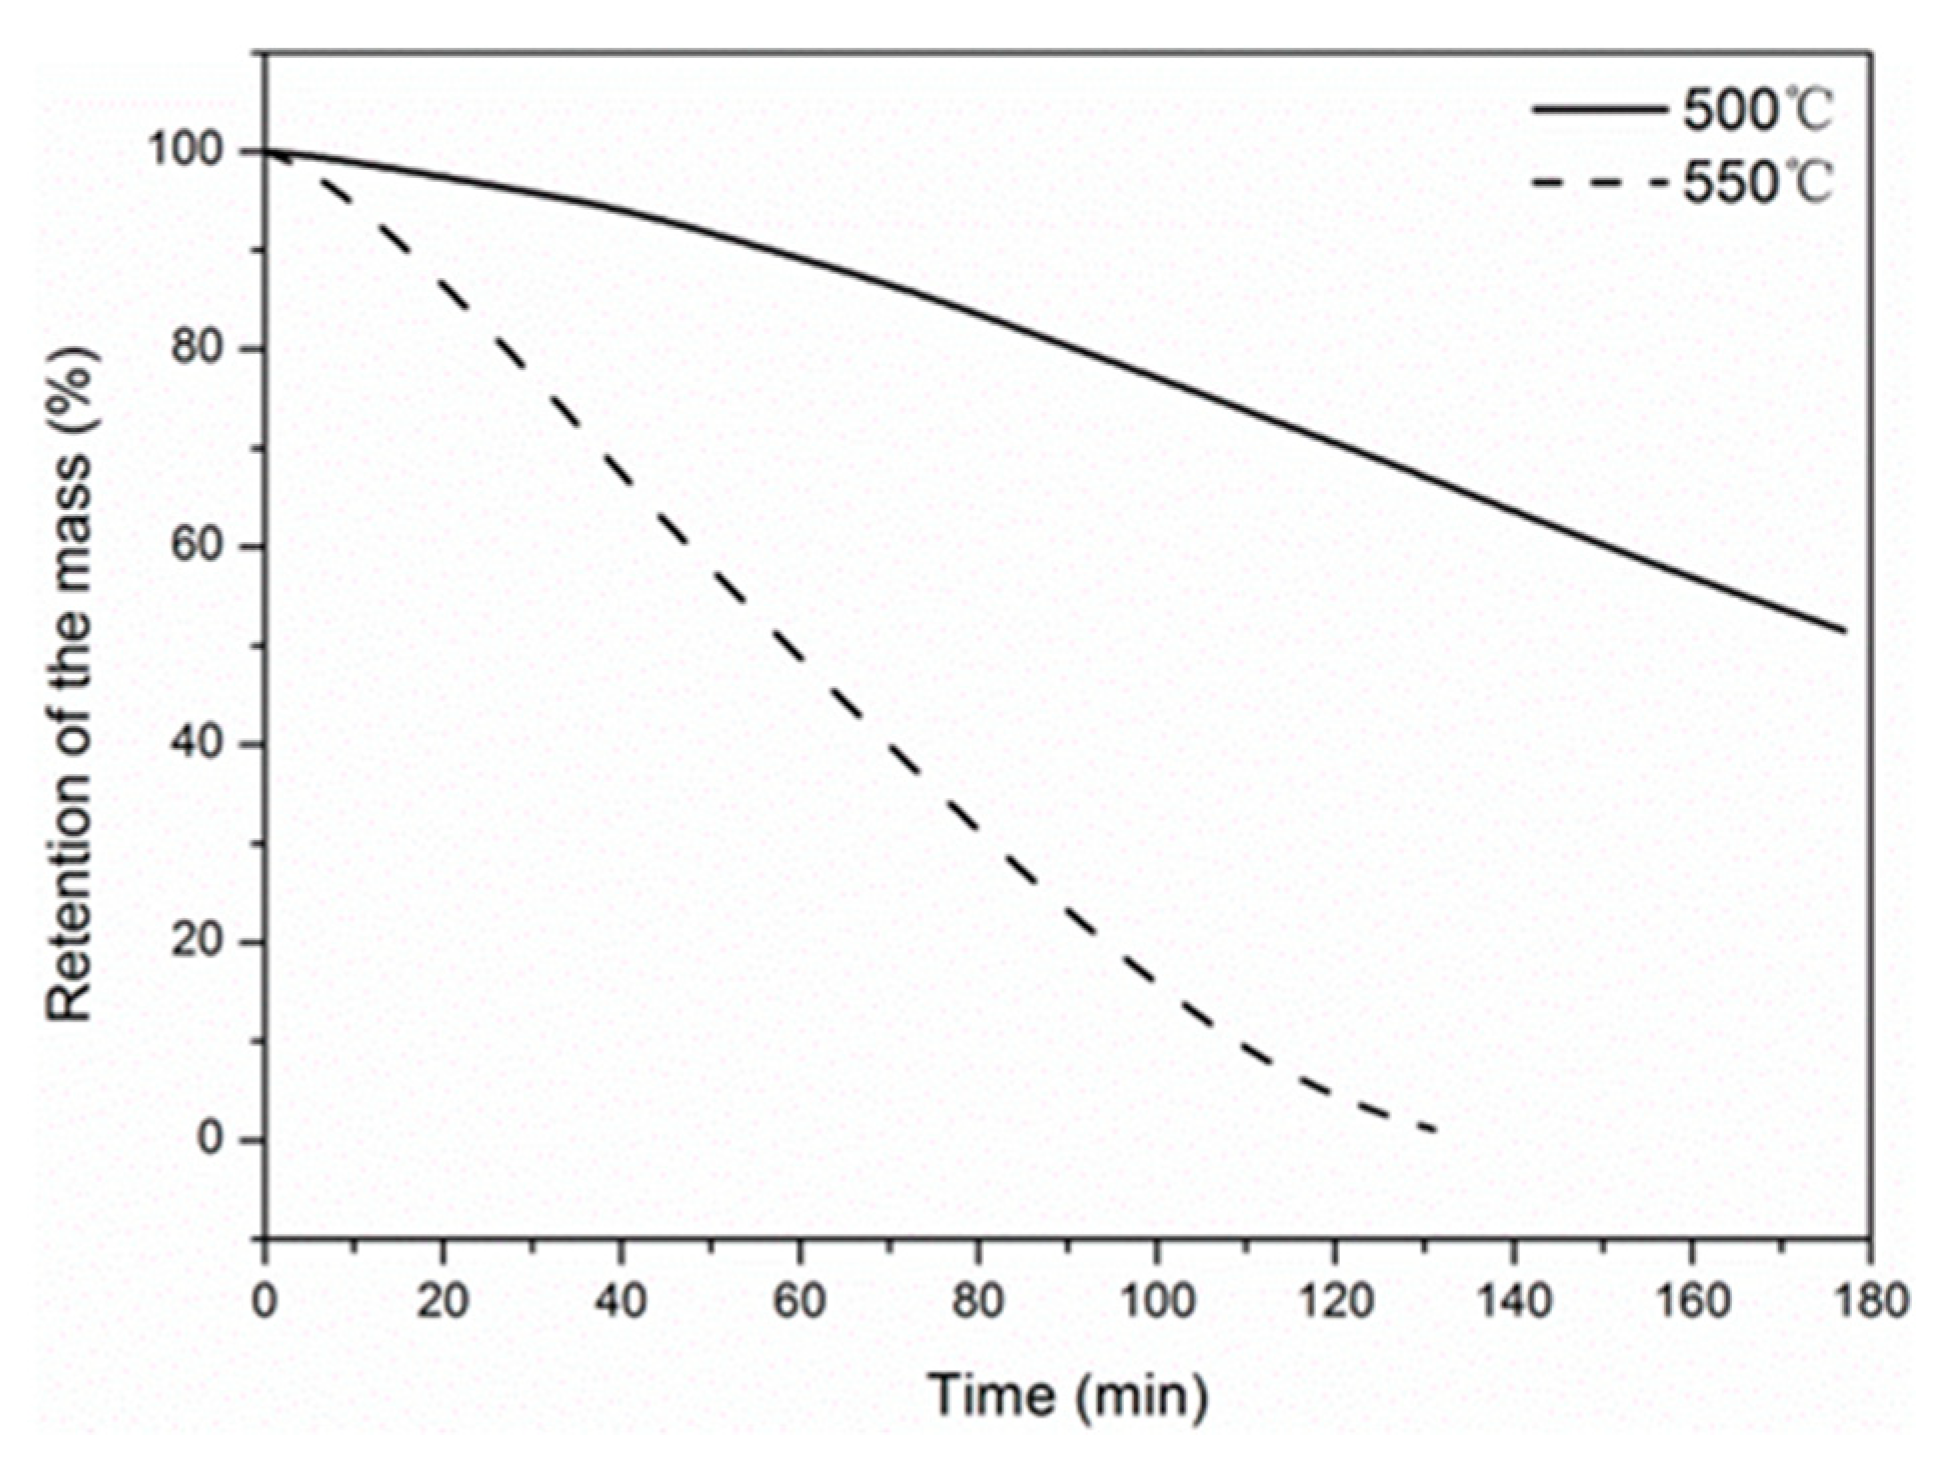
4.2. Thermal Gravimetric Analysis
4.3. Surface Topography
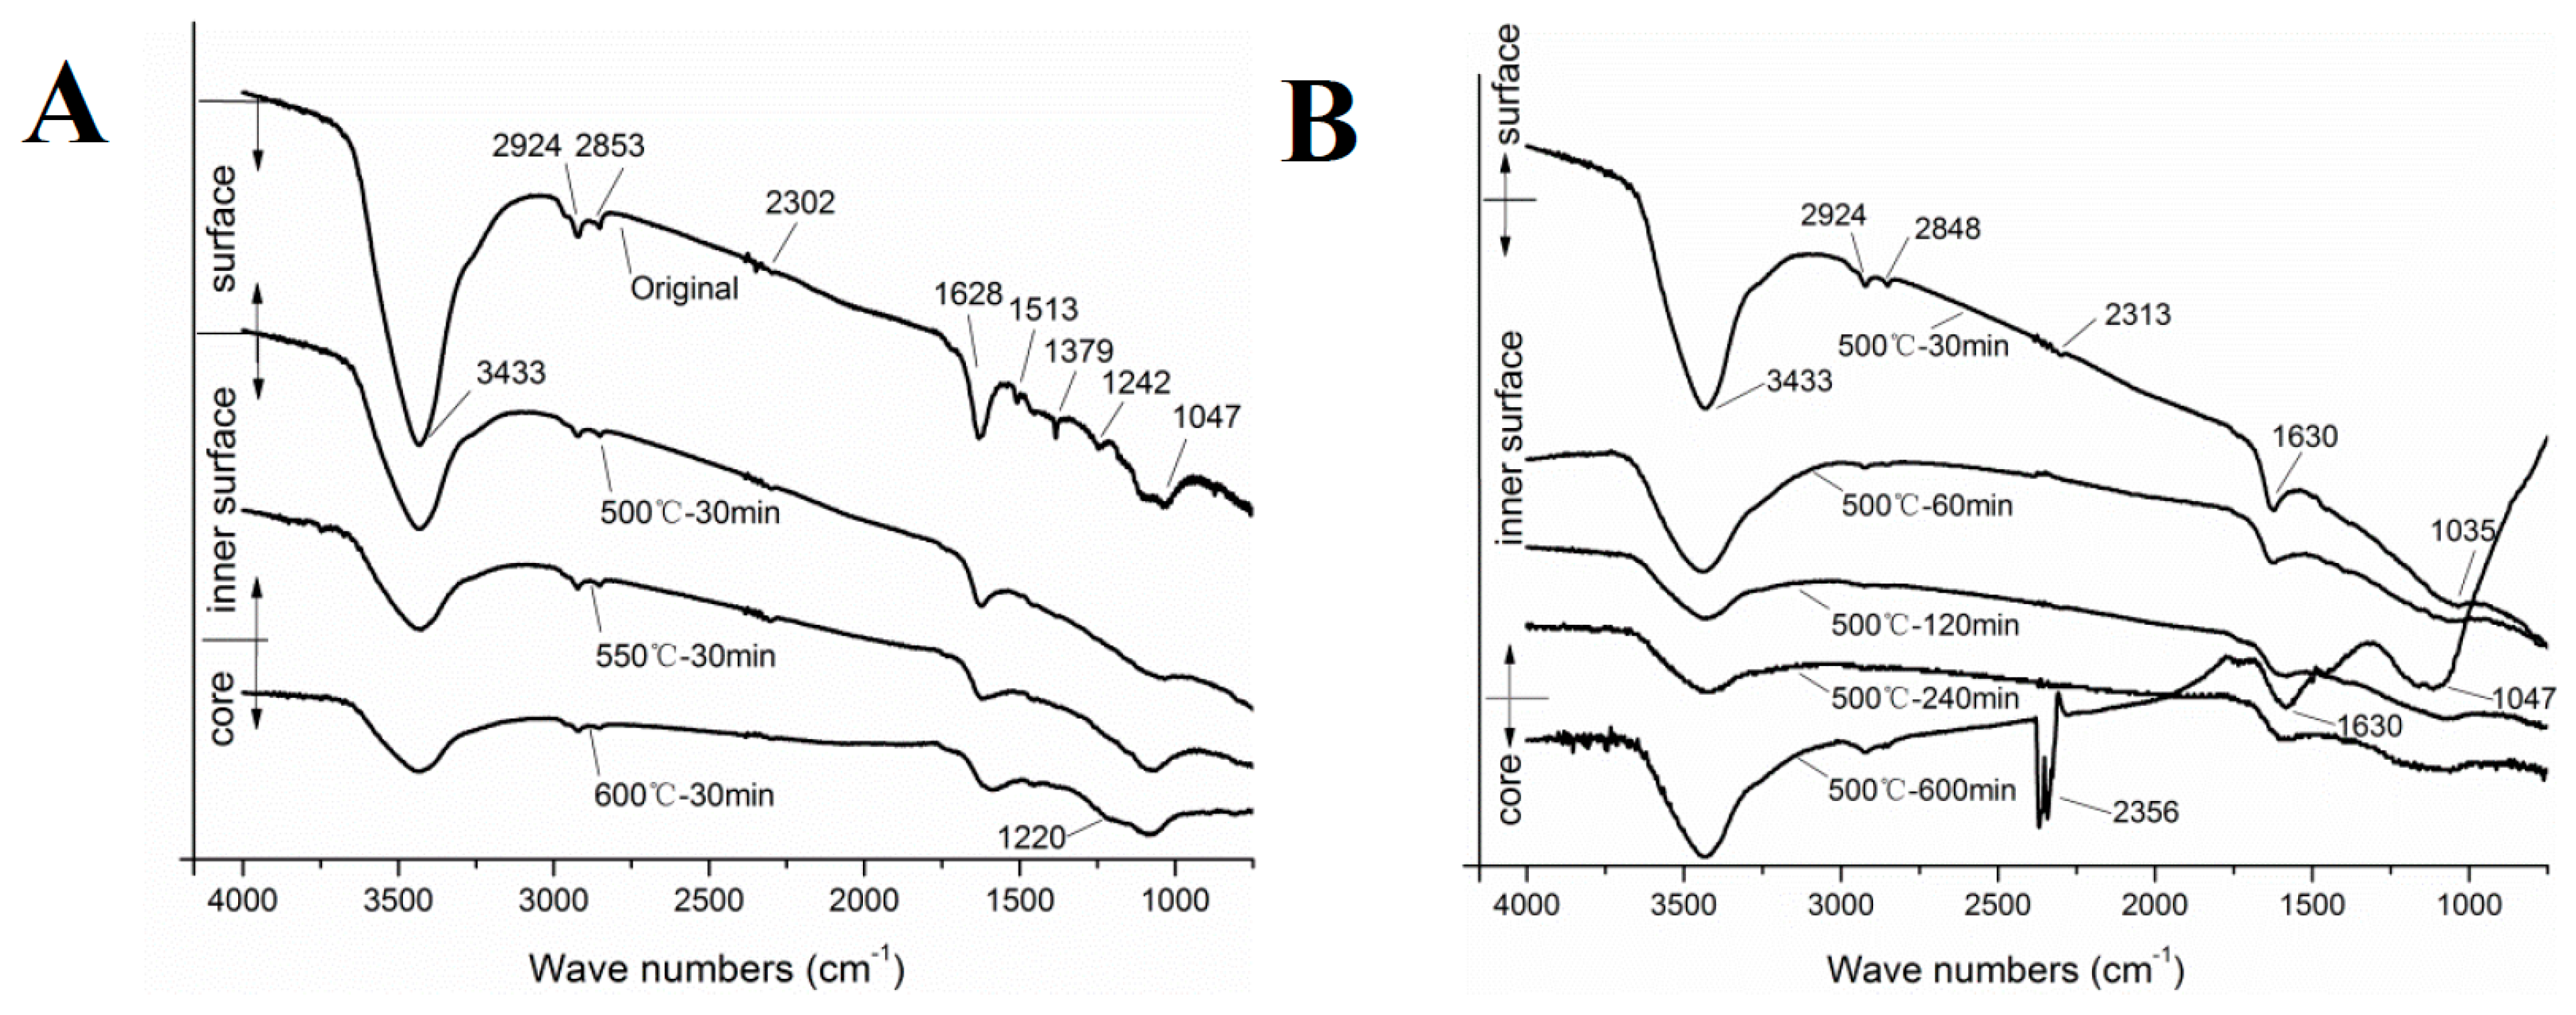
4.4. Elements and Functional Groups
4.5. Modeling of Tensile Properties
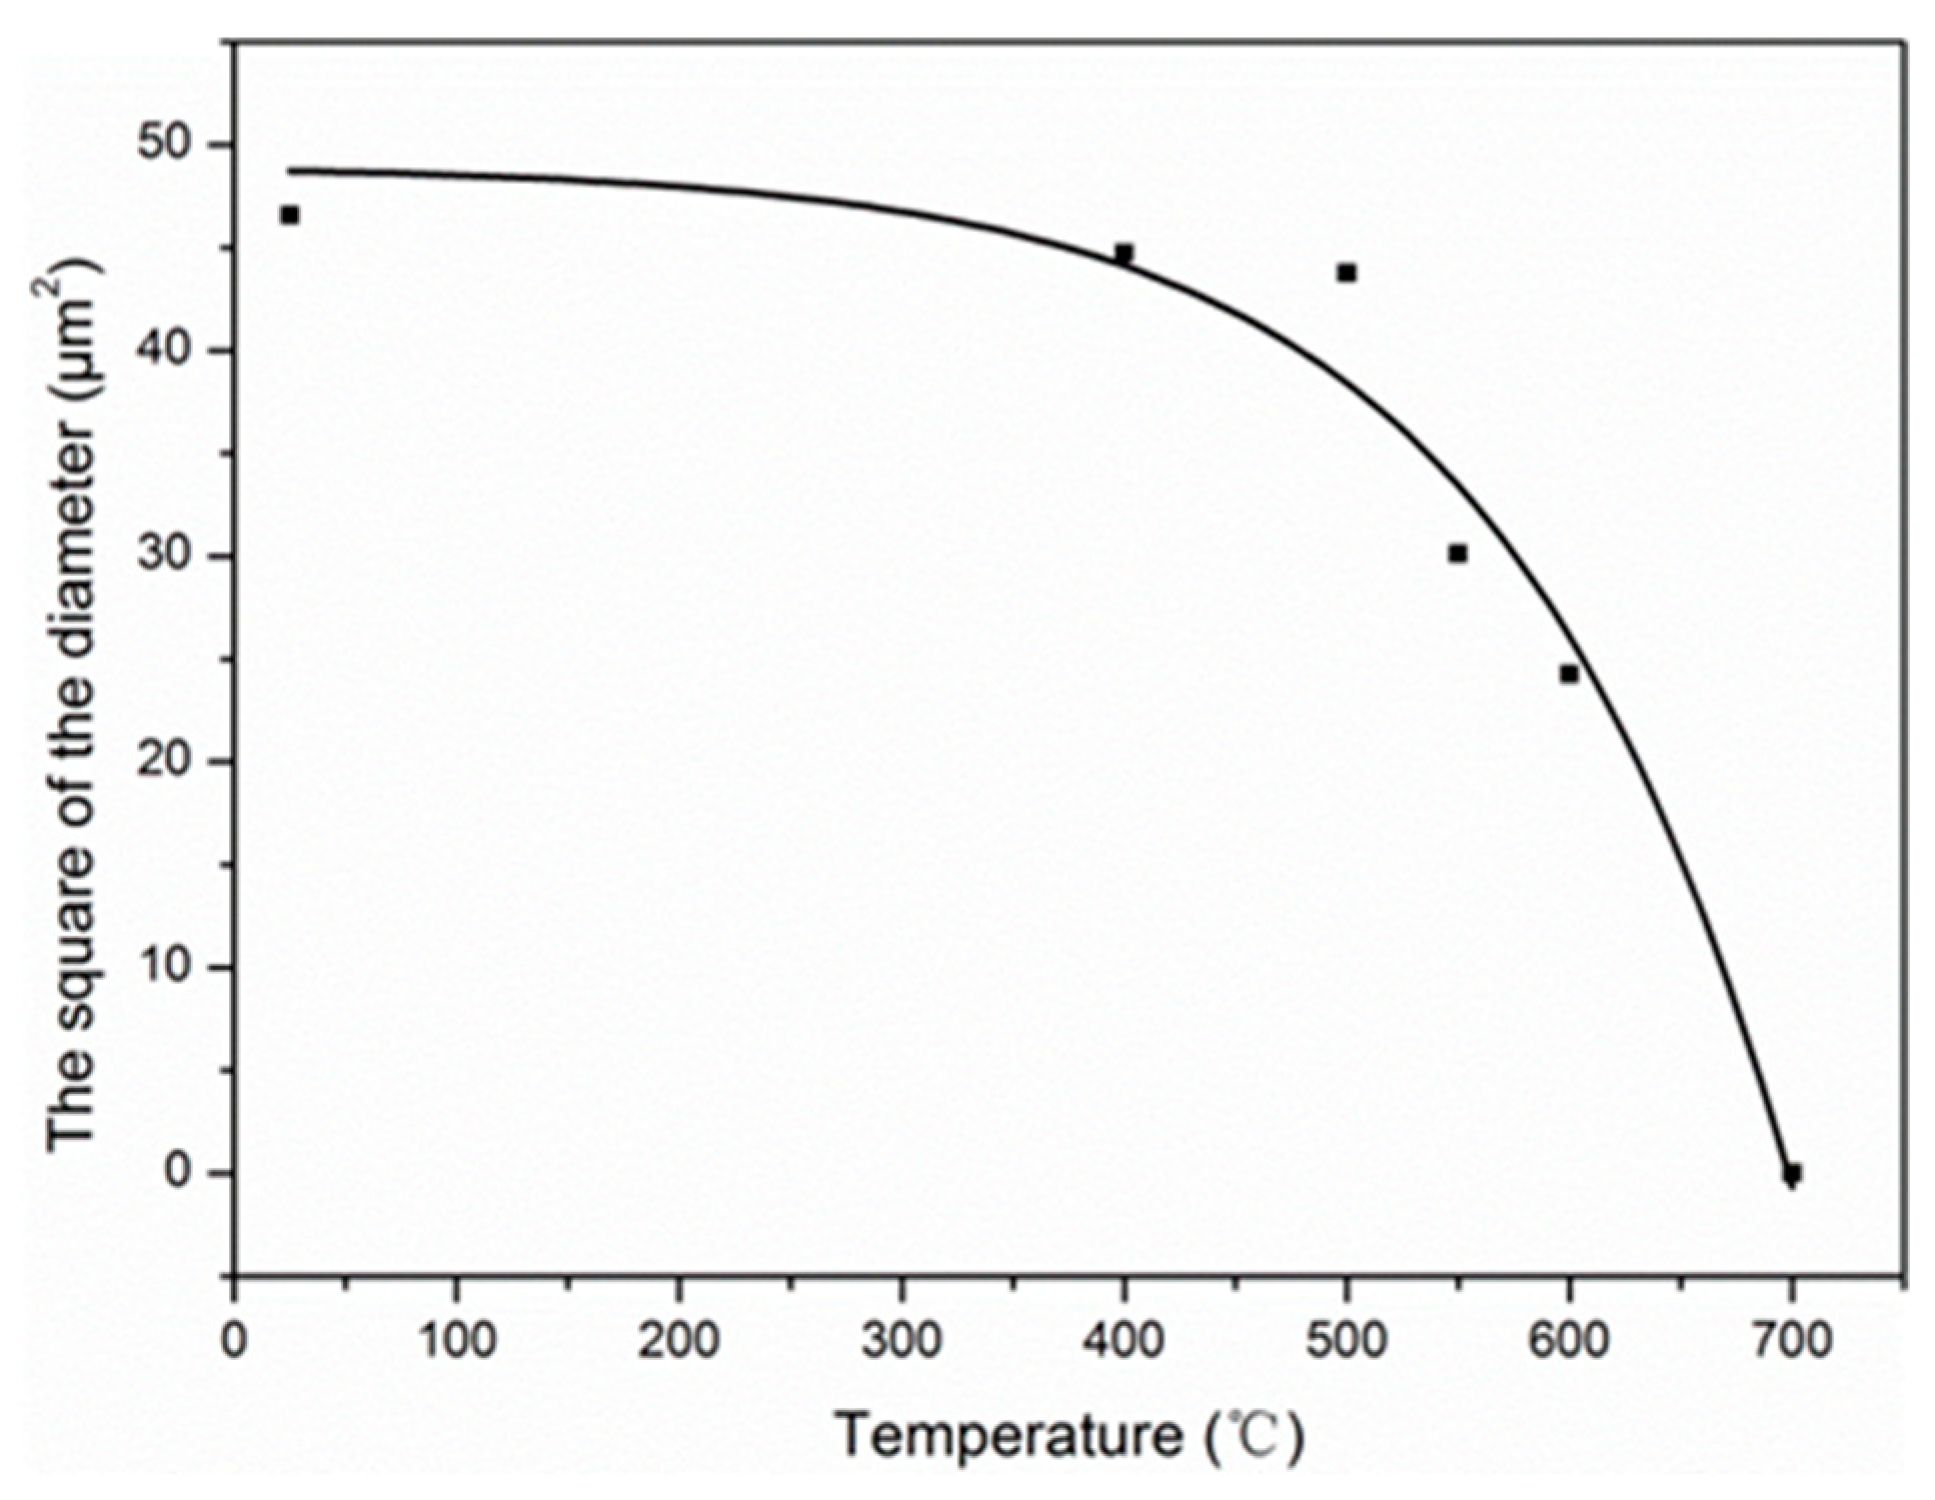
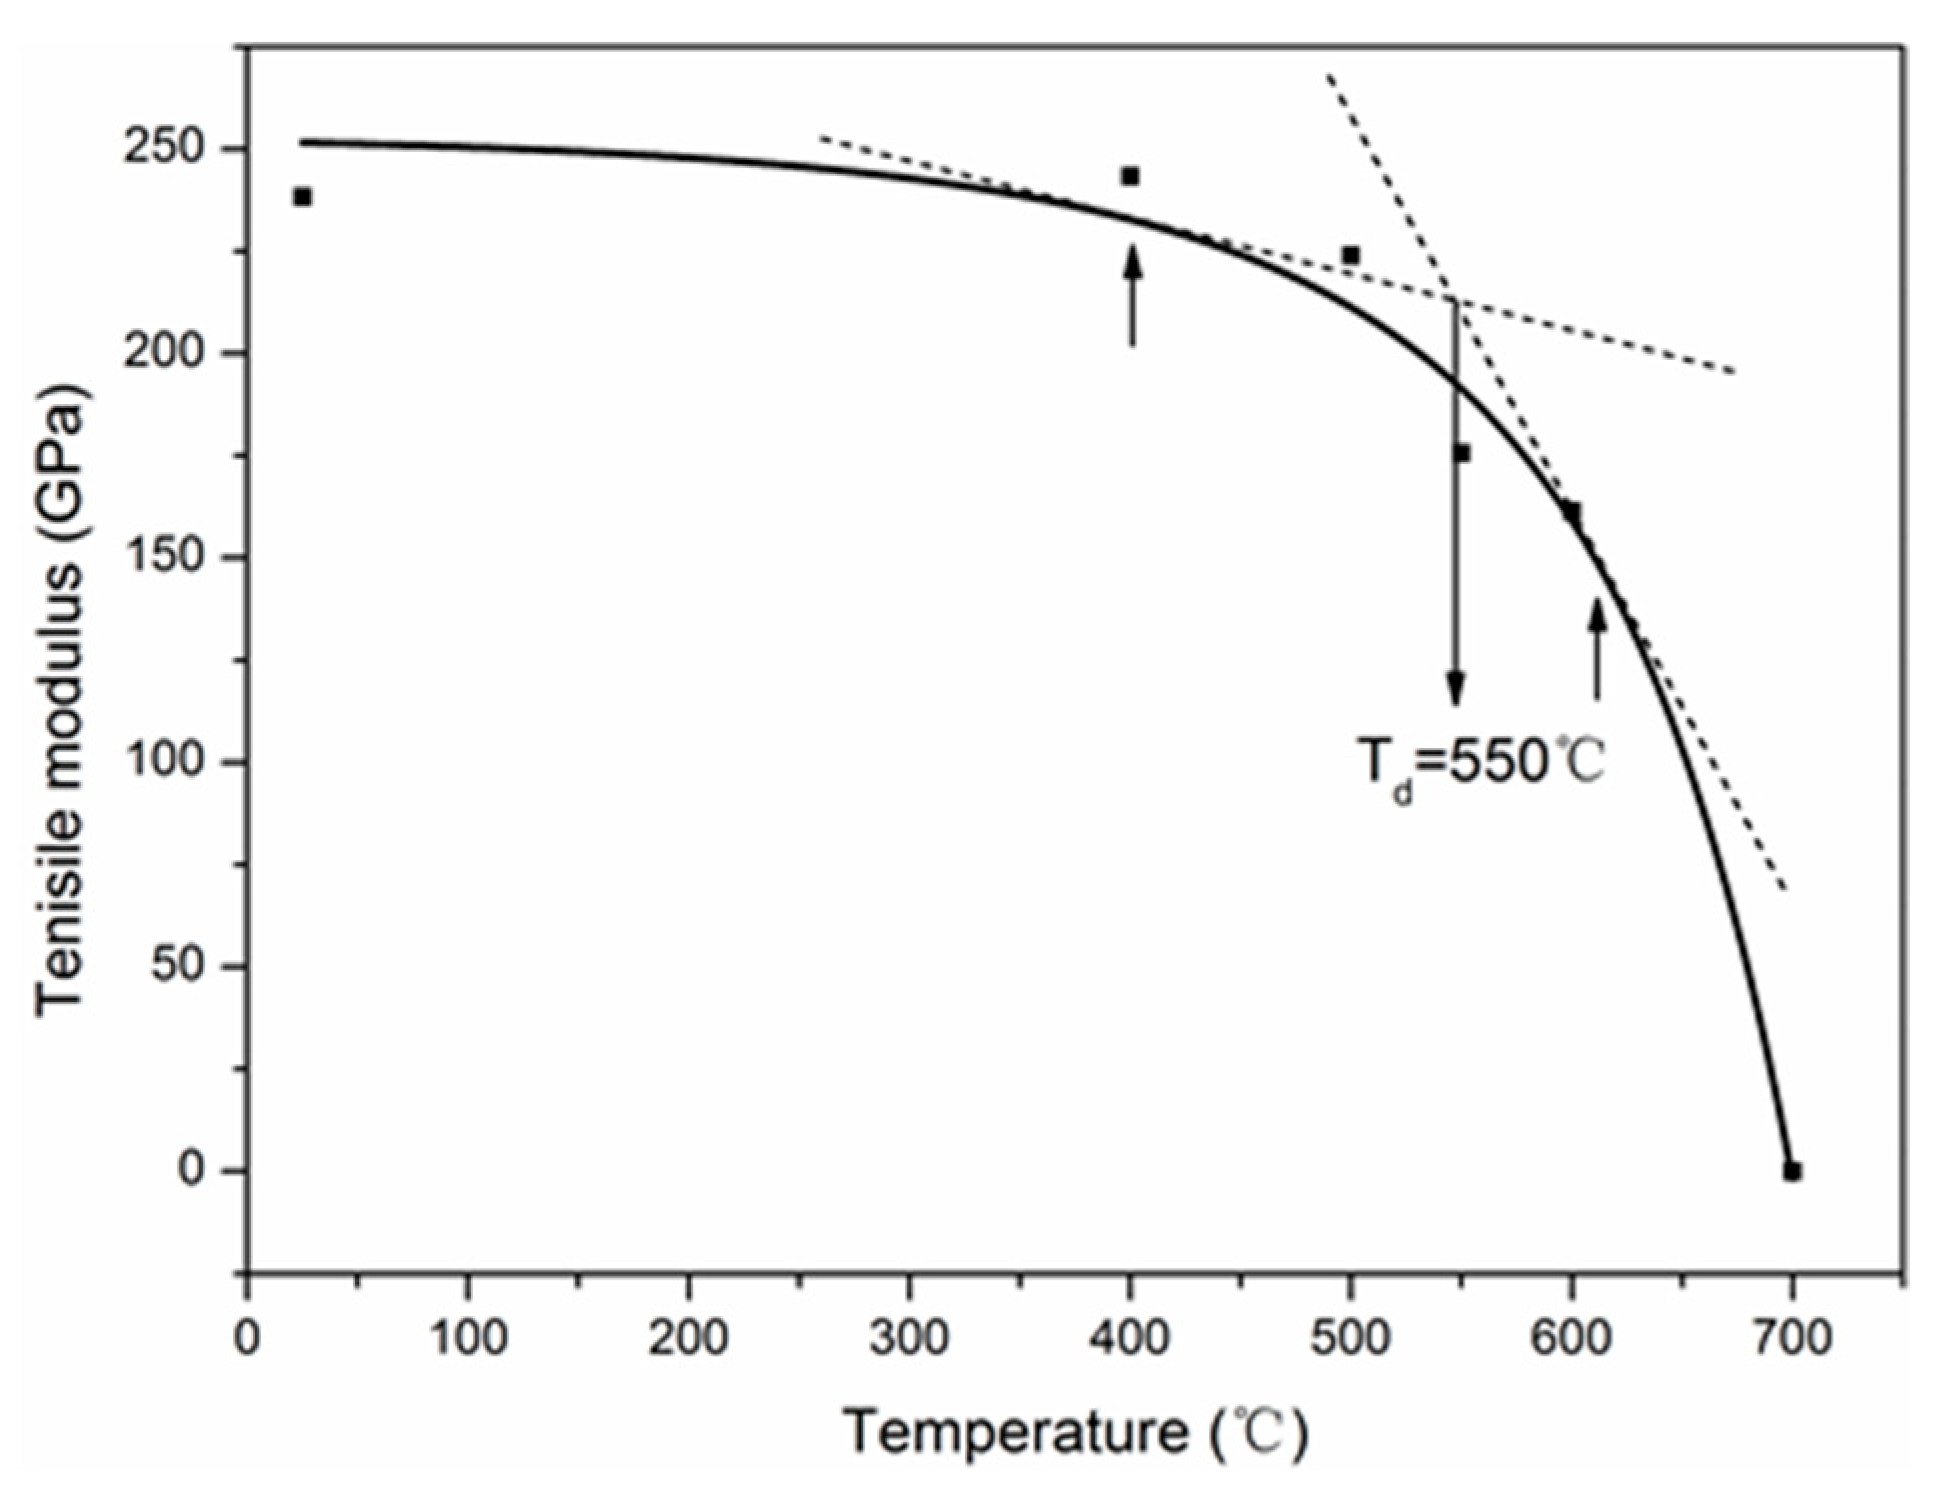
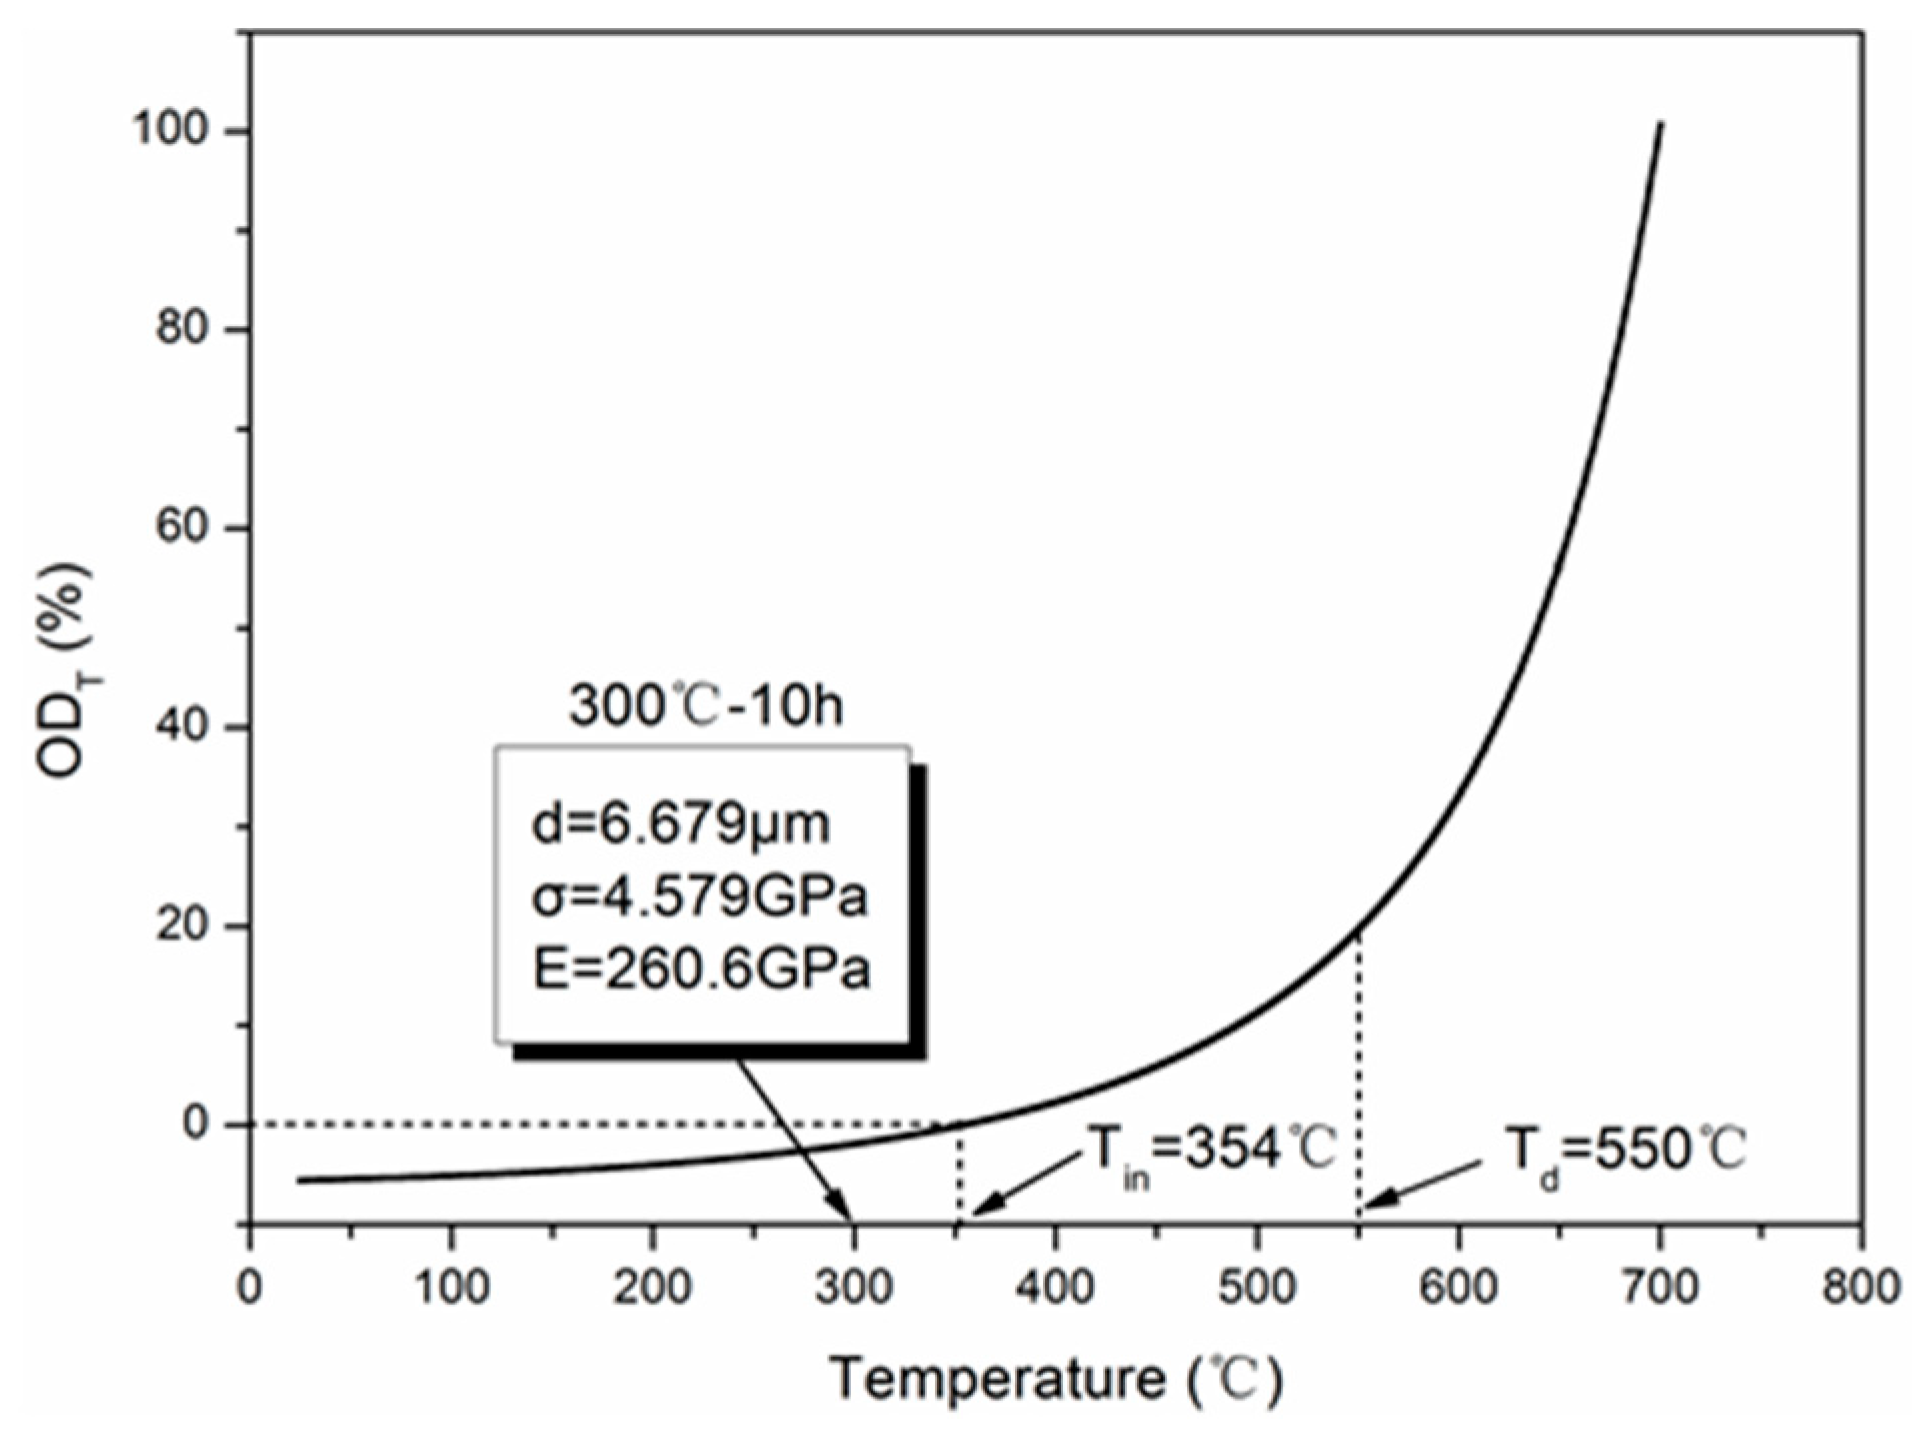
4.5.1. Tensile Modulus
Exposure Temperatures
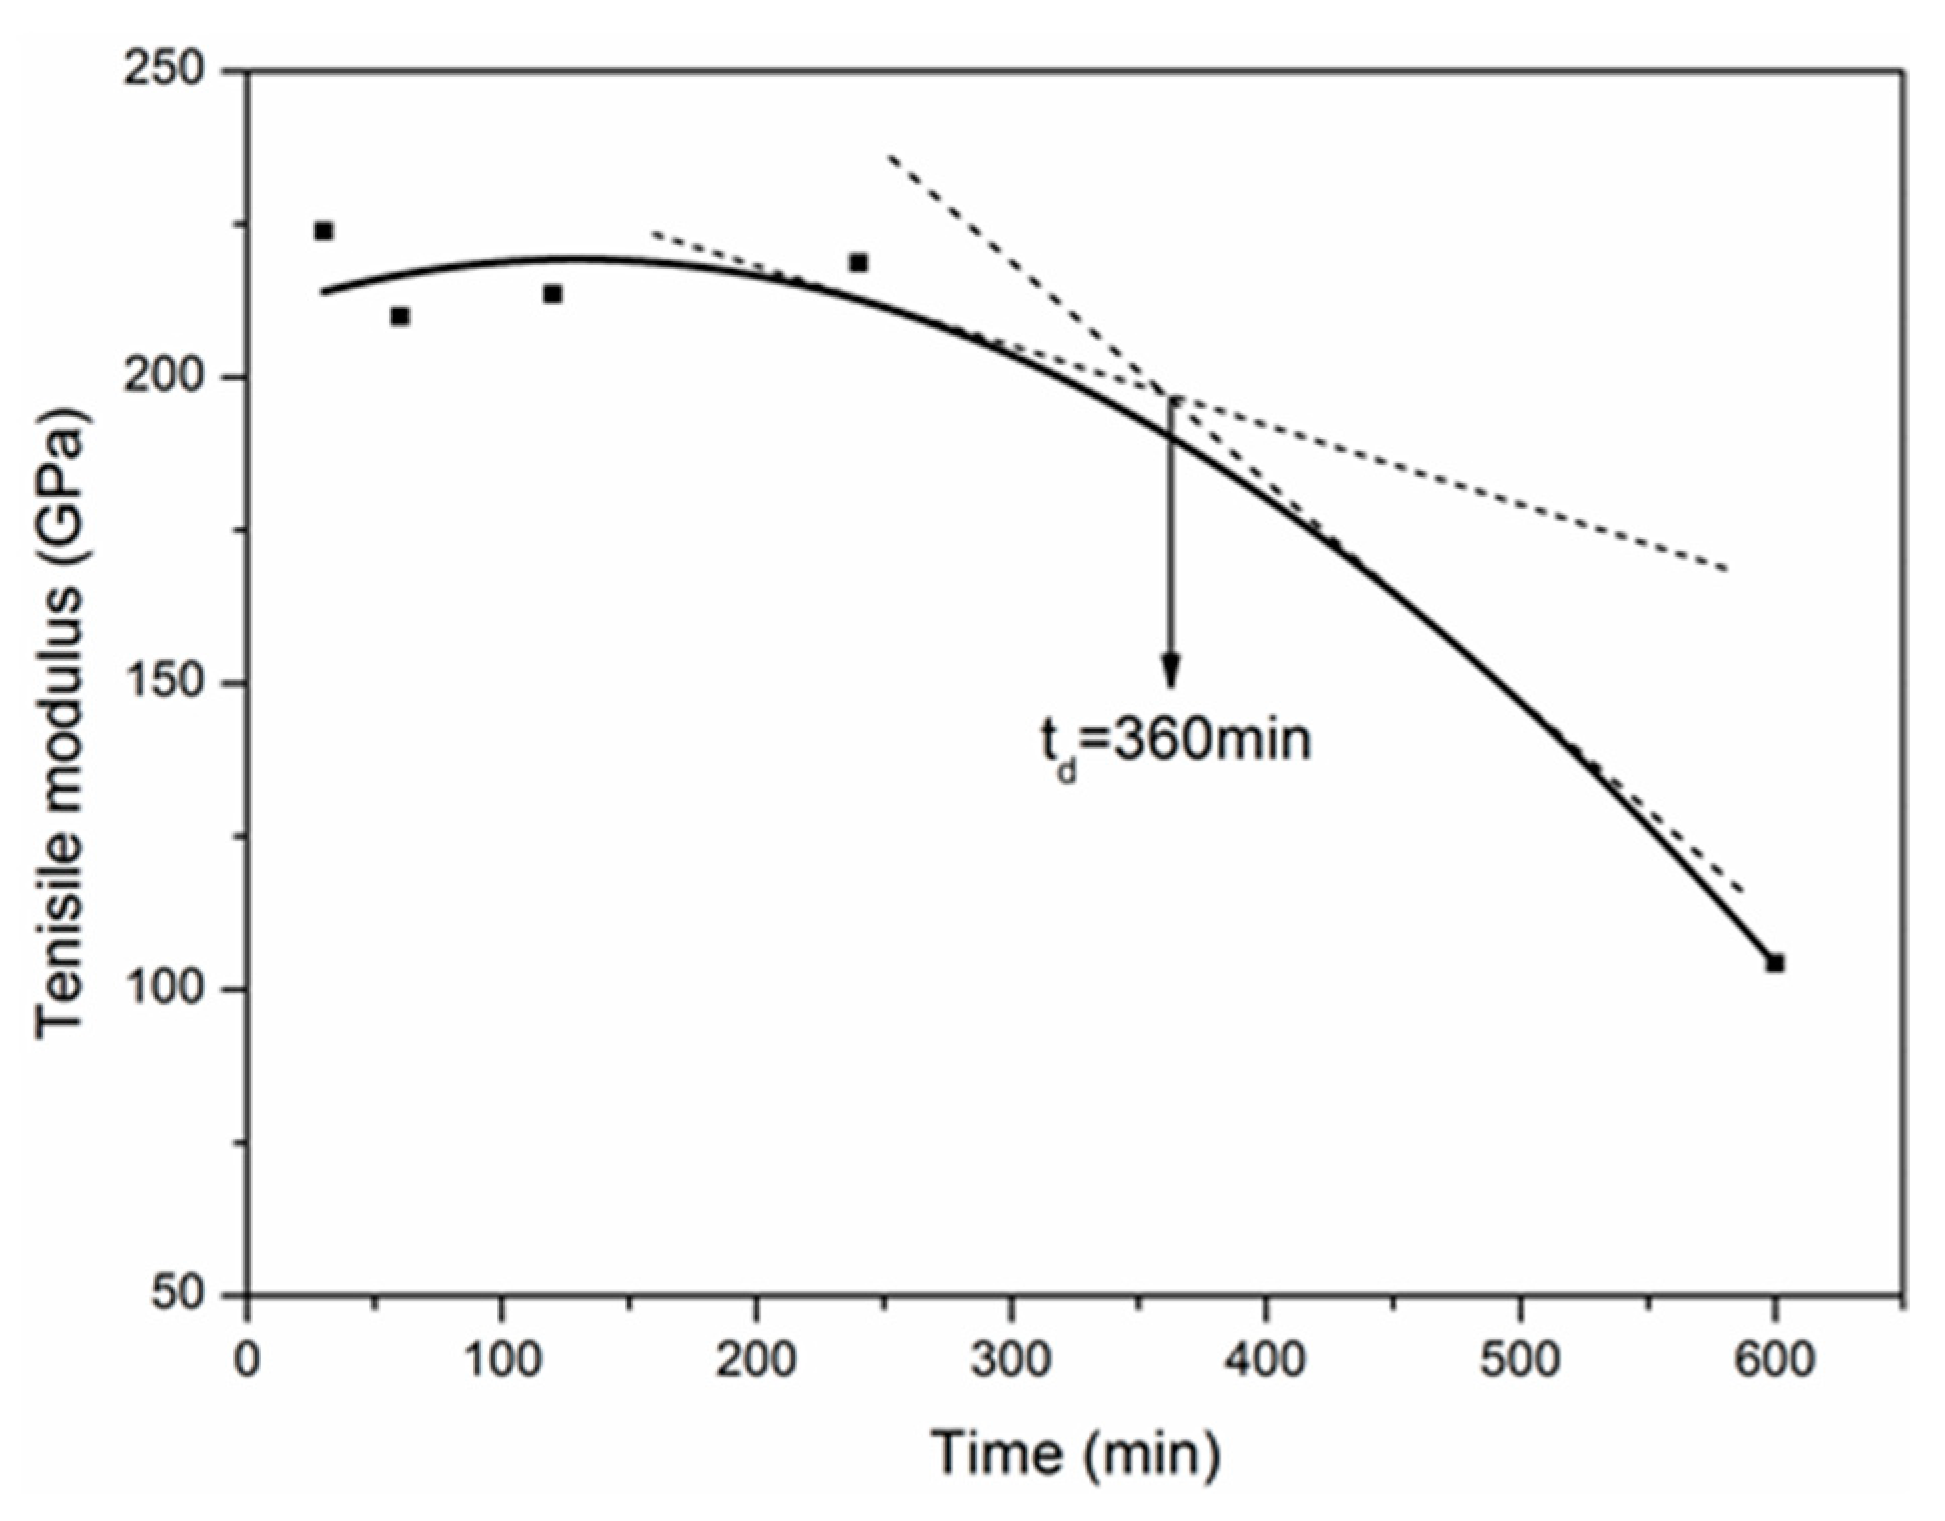
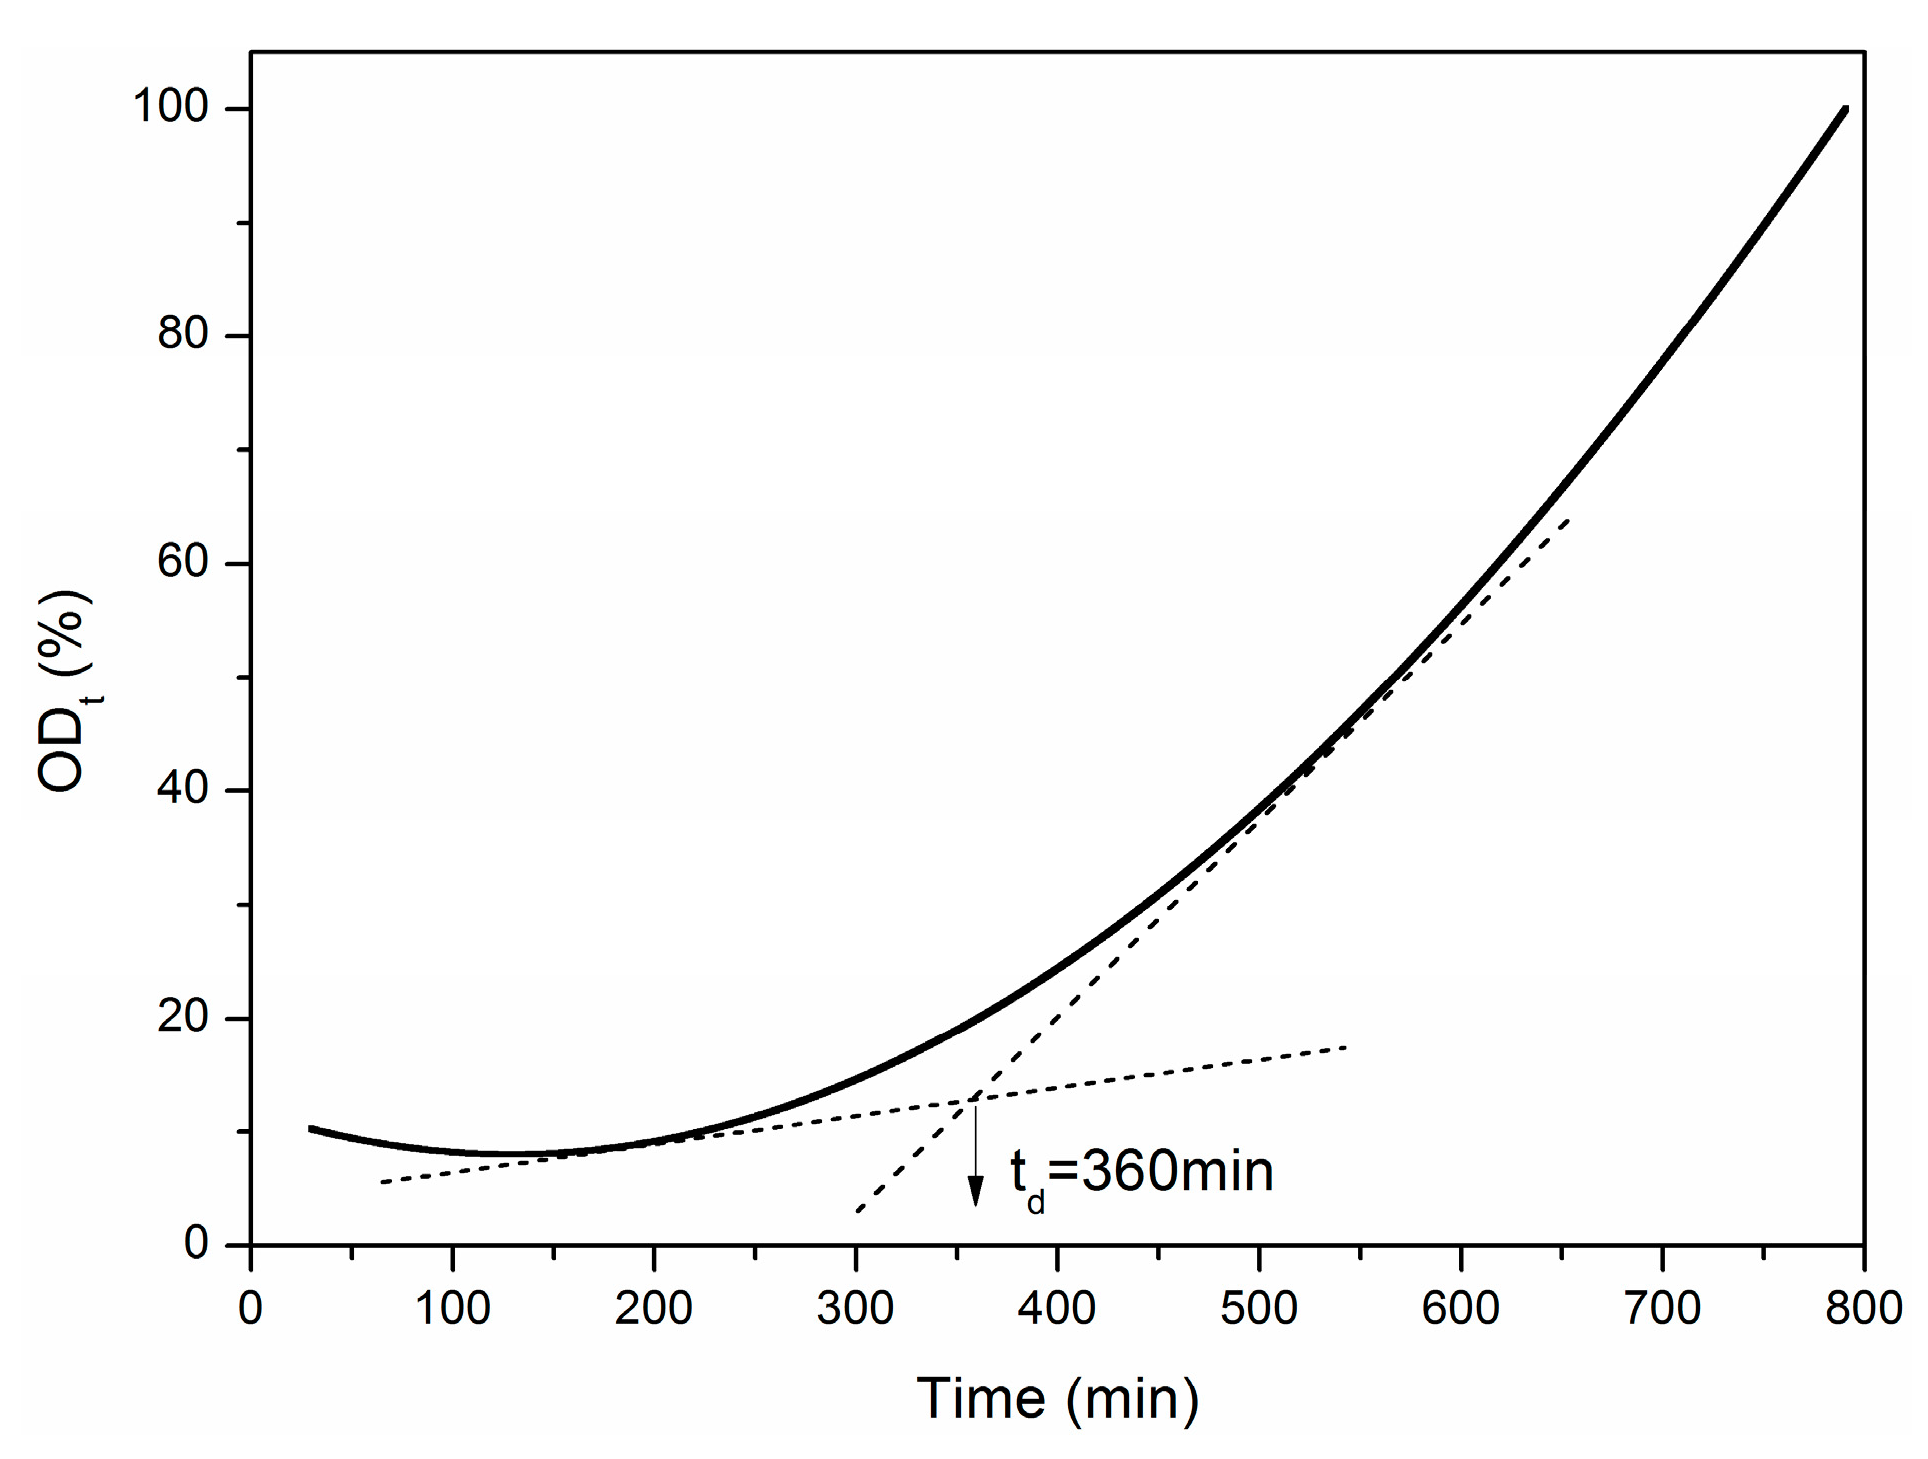
Exposure Time
Time–Temperature Equivalence
Arbitrary Exposure Temperatures and Times
4.5.2. Tensile Strength
Exposure Temperatures
Exposure Time
5. Conclusions
Author Contributions
Funding
Conflicts of Interest
References
- Cao, S.H.; Wu, Z.S.; Wang, X. Tensile Propeterties of CFRP and Hybrid FRP Composites at Elevated Temperatures. J. Compos. Mater. 2009, 43, 315–330. [Google Scholar]
- Wang, Z.K.; Xian, G.J.; Zhao, X.L. Effects of hydrothermal aging on carbon fibre/epoxy composites with different interfacial bonding strength. Constr. Build. Mater. 2018, 161, 634–648. [Google Scholar] [CrossRef]
- Van Den Einde, L.; Zhao, L.; Seible, F. Use of FRP composites in civil structural applications. Constr. Build. Mater. 2003, 17, 389–403. [Google Scholar] [CrossRef]
- Wang, Z.K.; Zhao, X.L.; Xian, G.J.; Wu, G.; Raman, R.K.S.; Al-Saadi, S. Effect of sustained load and seawater and sea sand concrete environment on durability of basalt- and glass-fibre reinforced polymer (B/GFRP) bars. Corros. Sci. 2018, 138, 200–218. [Google Scholar] [CrossRef]
- Mouritz, A.P.; Feih, S.; Kandare, E.; Mathys, Z.; Gibson, A.G.; Des Jardin, P.E.; Case, S.W.; Lattimer, B.Y. Review of fire structural modelling of polymer composites. Compos. Part A Appl. Sci. Manuf. 2009, 40, 1800–1814. [Google Scholar] [CrossRef]
- Carlos, T.B.; Rodrigues, J.P.C.; de Lima, R.C.A.; Dhima, D. Experimental analysis on flexural behaviour of RC beams strengthened with CFRP laminates and under fire conditions. Compos. Struct. 2018, 189, 516–528. [Google Scholar] [CrossRef]
- Dong, K.; Hu, K.X.; Gao, W.Y. Fire Behavior of Full-Scale CFRP-Strengthened RC Beams Protected with Different Insulation Systems. J. Asian Archit. Build. 2016, 15, 581–588. [Google Scholar] [CrossRef]
- Turkowski, P.; Sulik, P. Fire Protection of CFRP-strengthened RC Structures. In Response of Structures under Extreme Loading; DEStech: Lancaster, PA, USA, 2015; pp. 789–796. [Google Scholar]
- Mouritz, A.P.; Mathys, Z.; Gardiner, C.P. Thermomechanical modelling the fire properties of fibre-polymer composites. Compos. Part B Eng. 2004, 35, 467–474. [Google Scholar] [CrossRef]
- Vieille, B.; Coppalle, A.; Carpier, Y.; Maaroufi, M.A.; Barbe, F. Influence of matrix nature on the post-fire mechanical behaviour of notched polymer-based composite structures for high temperature applications. Compos. Part B Eng. 2016, 100, 114–124. [Google Scholar] [CrossRef]
- Feih, S.; Mouritz, A.P.; Mathys, Z.; Gibson, A.G. Tensile strength modeling of glass fiber-polymer composites in fire. J. Compos. Mater. 2007, 41, 2387–2410. [Google Scholar] [CrossRef]
- Li, Y.; Wang, L.N.; Xie, W.H.; Chen, J.J. Influence of SiC Coating on the Oxidation Behavior of PAN Carbon Fiber at Elevated Temperatures. In Proceedings of the Second International Conference on Advanced Textile Materials & Manufacturing Technology, Hangzhou, China, 20 October 2010; pp. 54–58. [Google Scholar]
- Li, L.B. Modeling the effect of oxidation on fatigue life of carbon fiber-reinforced ceramic-matrix composites at elevated temperature. Mater. Sci. Eng. A Struct. 2015, 640, 106–117. [Google Scholar]
- Li, L.B. Modeling the effect of oxidation on hysteresis loops of carbon fiber-reinforced ceramic-matrix composites under static fatigue at elevated temperature. J. Eur. Ceram. Soc. 2016, 36, 465–480. [Google Scholar]
- Wang, H.J.; Wang, H.F.; Li, D.F.; Zhu, X.M.; He, F.; Wang, X.K. The effect of graphitization temperature on the microstructure and mechanical properties of carbon fibers. New Carbon Mater. 2005, 20, 157–163. [Google Scholar]
- Li, D.H.; Lu, C.X.; Wu, G.P.; Yang, Y.; An, F.; Feng, Z.H.; Li, X.T. Structural heterogeneity and its influence on the tensile fracture of PAN-based carbon fibers. RSC Adv. 2014, 4, 60648–60651. [Google Scholar] [CrossRef]
- Wang, C.; Huang, Y.D.; Wang, B. Study on heat-resistant property of adhesive/carbon-carbon composites joints. Int. J. Adhes. Adhes. 2006, 26, 206–211. [Google Scholar] [CrossRef]
- Iwashita, N.; Sawada, Y.; Shimizu, K.; Shinke, S.; Shioyama, H. Effect of Matrix Texture on Tensile-Strength and Oxidation Behavior of Carbon-Fiber-Reinforced Carbon Composites. Carbon 1995, 33, 405–413. [Google Scholar] [CrossRef]
- Liu, F.J.; Wang, H.J.; Xue, L.B.; Fan, L.D.; Zhu, Z.P. Effect of microstructure on the mechanical properties of PAN-based carbon fibers during high-temperature graphitization. J. Mater. Sci. 2008, 43, 4316–4322. [Google Scholar] [CrossRef]
- Wang, S.; Chen, Z.-H.; Ma, W.-J.; Ma, Q.-S. Influence of heat treatment on physical–chemical properties of PAN-based carbon fiber. Ceram. Int. 2006, 32, 291–295. [Google Scholar] [CrossRef]
- Reddy, D.V.; Sobhan, K.; Young, J.D. Fire Resistance of Structural Concrete Retrofitted with Carbon Fiber-Reinforced Polymer Composites. Transp. Res. Rec. 2015, 2522, 151–160. [Google Scholar] [CrossRef]
- Thi, C.N.; Pansuk, W.; Torres, L. Flexural Behavior of Fire-Damaged Reinforced Concrete Slabs Repaired with Near-Surface Mounted (NSM) Carbon Fiber Reinforced Polymer (CFRP) Rods. J. Adv. Concr. Technol. 2015, 13, 15–29. [Google Scholar] [CrossRef]
- Kandare, E.; Kandola, B.K.; Myler, P.; Edwards, G. Thermo-mechanical Responses of Fiber-reinforced Epoxy Composites Exposed to High Temperature Environments. Part I: Experimental Data Acquisition. J. Compos. Mater. 2010, 44, 3093–3114. [Google Scholar] [CrossRef]
- Lamouroux, F.; Bourrat, X.; Nasalain, R.; Sevely, J. Structure Oxidation Behavior Relationship in the Carbonaceous Constituents of 2d-C/Pyc/Sic Composites. Carbon 1993, 31, 1273–1288. [Google Scholar] [CrossRef]
- Feih, S.; Mouritz, A.P. Tensile properties of carbon fibres and carbon fibre-polymer composites in fire. Compos. Part A Appl. Sci. Manuf. 2012, 43, 765–772. [Google Scholar] [CrossRef]
- Yin, Y.; Binner, J.G.P.; Cross, T.E.; Marshall, S.J. The Oxidation Behavior of Carbon-Fibers. J. Mater. Sci. 1994, 29, 2250–2254. [Google Scholar] [CrossRef]
- Zhu, H.; Li, T.; Zhu, G.L.; Wang, X.W.; Wu, G.; Fan, S.G. Fire Resistance of Strengthened RC Members Using NSM CFRP Bars with a Cladding Layer. J. Compos. Constr. 2019, 23, 04018066. [Google Scholar] [CrossRef]
- Yu, J.T.; Wang, Y.C.; Hu, K.X.; Yu, K.Q.; Xiao, J.Z. The performance of near-surface mounted CFRP strengthened RC beam in fire. Fire Saf. J. 2017, 90, 86–94. [Google Scholar]
- Turkowski, P.; Lukomski, M.; Sulik, P.; Roszkowski, P. Fire Resistance of CFRP-strengthened Reinforced Concrete Beams under Various Load Levels. Procedia Eng. 2017, 172, 1176–1183. [Google Scholar] [CrossRef]
- Carlos, T.B.; Rodrigues, J.P.C. Experimental bond behaviour of a CFRP strengthening system for concrete elements at elevated temperatures. Constr. Build. Mater. 2018, 193, 395–404. [Google Scholar] [CrossRef]
- Ferreira, D.; Duarte1, L.; Piloto, L.M.A.P. CFRP fire behavior-passive protection system. In Proceedings of the 7th International Conference on Safety and Durability of Structures, Vila Real, Portugal, 10–12 May 2016. [Google Scholar]
- Wang, Z.; Huang, X.Y.; Xian, G.J.; Li, H. Effects of Surface Treatment of Carbon Fiber: Tensile Property, Surface Characteristics, and Bonding to Epoxy. Polym. Compos. 2016, 37, 2921–2932. [Google Scholar] [CrossRef]
- Yamanaka, K.; Nakano, S. Quantitative elasticity evaluation by contact resonance in an atomic force microscope. Appl. Phys. A Mater. 1998, 66, S313–S317. [Google Scholar] [CrossRef]
- Morita, K.; Murata, Y.; Ishitani, A.; Murayama, K.; Ono, T.; Nakajima, A. Characterization of Commercially Available Pan (Polyacrylonitrile)-Based Carbon-Fibers. Pure Appl. Chem. 1986, 58, 455–468. [Google Scholar] [CrossRef]
- Jones, B.F.; Duncan, R.G. The effect of fibre diameter on the mechanical properties of graphite fibres manufactured from polyacrylonitrile and rayon. J. Mater. Sci. 1971, 6, 289–293. [Google Scholar] [CrossRef]
- Bennett, S.C.; Johnson, D.J. Electron-microscope studies of structural heterogeneity in PAN-based carbon fibres. Carbon 1979, 17, 25–39. [Google Scholar] [CrossRef]
- Wicks, B.J.; Coyle, R.A. Microstructural inhomogeneity in carbon fibres. J. Mater. Sci. 1976, 11, 376–383. [Google Scholar] [CrossRef]
- Guigon, M.; Oberlin, A. Heat-Treatment of High-Tensile Strength Pan-Based Carbon-Fibers—Microtexture, Structure and Mechanical-Properties. Compos. Sci. Technol. 1986, 27, 1–23. [Google Scholar] [CrossRef]
- Sauder, C.; Lamon, J.; Pailler, R. The tensile behavior of carbon fibers at high temperatures up to 2400 °C. Carbon 2004, 42, 715–725. [Google Scholar] [CrossRef]
- Sauder, C.; Lamon, J. Prediction of elastic properties of carbon fibers and CVI matrices. Carbon 2005, 43, 2044–2053. [Google Scholar] [CrossRef]
- Northolt, M.G.; Veldhuizen, L.H.; Jansen, H. Tensile Deformation of Carbon-Fibers and the Relationship with the Modulus for Shear between the Basal Planes. Carbon 1991, 29, 1267–1279. [Google Scholar] [CrossRef]
- Liu, J.E.; Tian, Y.L.; Chen, Y.J.; Liang, J.Y.; Zhang, L.F.; Fong, H. A surface treatment technique of electrochemical oxidation to simultaneously improve the interfacial bonding strength and the tensile strength of PAN-based carbon fibers. Mater. Chem. Phys. 2010, 122, 548–555. [Google Scholar] [CrossRef]
- Watanabe, J.; Tanaka, F.; Okuda, H.; Okabe, T. Tensile strength distribution of carbon fibers at short gauge lengths. Adv. Compos. Mater. 2014, 23, 535–550. [Google Scholar] [CrossRef]
- Xiao, H.; Lu, Y.G.; Wang, M.H.; Qin, X.Y.; Zhao, W.Z.; Luan, J. Effect of gamma-irradiation on the mechanical properties of polyacrylonitrile-based carbon fiber. Carbon 2013, 52, 427–439. [Google Scholar] [CrossRef]
- Keller, T.M. Oxidative protection of carbon fibers with poly(carborane-siloxane-acetylene). Carbon 2002, 40, 225–229. [Google Scholar] [CrossRef]
- Naito, K.; Tanaka, Y.; Yang, J.M.; Kayawa, Y. Tensile properties of ultrahigh strength PAN-based, ultrahigh modulus pitch-based and high ductility pitch-based carbon fibers. Carbon 2008, 46, 189–195. [Google Scholar] [CrossRef]
- He, J.M.; Zheng, N.; Ye, Z.M.; Huang, Y.D. Investigation on atomic oxygen erosion resistance of self-assembly film at the interphase of carbon fiber composites. J. Reinf. Plast. Compos. 2012, 31, 1291–1299. [Google Scholar]
- Ngoc, U.N.T.; Hong, S.C. Structural Evolution of Poly(acrylonitrile-co-itaconic acid) during Thermal Oxidative Stabilization for Carbon Materials. Macromolecules 2013, 46, 5882–5889. [Google Scholar]


| Composite Type | Temperature Range (°C) | Maximum Exposure Time (h) | Fire Protection Coating |
|---|---|---|---|
| CFRP bars [27] | 0–400 | 2 | Inorganic mortar cladding |
| CFRP strips [28] | 0–1000 | 3 | Intumescent coating |
| CFRP strips [29] | 0–1100 | 5 | Fire protective boards |
| CFRP laminates [6] | 0–1000 | 2.5 | Vermiculite-perlite mortar fire protection |
| CFRP laminates [30] | 0–165 | 8 | - |
| CFRP laminates [31] | 0–600 | 1 | Laminate plaster board/intumescent paint |
| Samples | GXY (GPa) | τXY (GPa) | Samples | GXY (GPa) | τXY (GPa) |
|---|---|---|---|---|---|
| Original a | 31.584 | 1.399 | 500 °C–30 min | 31.067 | 1.213 |
| 400 °C–30 min | 31.452 | 1.346 | 500 °C–1 h b | 30.635 | 0.999 |
| 550 °C–30 min | 29.363 | 0.803 | 500 °C–2 h | 30.755 | 0.703 |
| 600 °C–30 min | 28.729 | 0.833 | 500 °C–4 h | 30.901 | 0.619 |
| 700 °C–30 min | 0 | 0 | 500 °C–10 h | 25.076 | 0.442 |
| Samples | Shape Parameter (m) | Samples | Shape Parameter (m) |
|---|---|---|---|
| Original | 5.217 | 500 °C–1 h | 5.229 |
| 400 °C–30 min | 5.560 | 500 °C–2 h | 3.684 |
| 500 °C–30 min | 5.483 | 500 °C–4 h | 3.388 |
| 550 °C–30 min | 3.816 | 500 °C–10 h | 2.570 |
| 600 °C–30 min | 5.293 | - | - |
| Samples | C (%) | O (%) | N (%) | O/C (%) |
|---|---|---|---|---|
| Original | 69.8 | 25.61 | 4.59 | 36.69 |
| 300 °C–10 h | 75.45 | 23.77 | 0.79 | 31.50 |
| 500 °C–30 min | 61.95 | 34.05 | 4.00 | 54.96 |
| 550 °C–30 min | 58.86 | 35.26 | 5.89 | 59.90 |
| 500 °C–2 h | 61.05 | 34.33 | 4.62 | 56.23 |
| 500 °C–10 h | 34.15 | 61.26 | 4.59 | 179.36 |
| Samples | C–C | C–OH (C–O–C) | C=O | COOH (R) | ||||
|---|---|---|---|---|---|---|---|---|
| Binding Energy (eV) | Percentage (%) | Binding Energy (eV) | Percentage (%) | Binding Energy (eV) | Percentage (%) | Binding Energy (eV) | Percentage (%) | |
| Original | 284.13 | 72.12 | 285.64 | 22.57 | 287.52 | 5.31 | - | - |
| 300 °C–10 h | 284.60 | 76.51 | 286.11 | 14.21 | 288.45 | 9.28 | - | - |
| 500 °C–30 min | 284.54 | 71.44 | 286.11 | 17.65 | 287.76 | 5.56 | 289.72 | 5.35 |
| 550 °C–30 min | 284.41 | 51.53 | 285.72 | 34.82 | 287.47 | 10.24 | 288.92 | 3.41 |
| 500 °C–2 h | 284.22 | 41.83 | 285.20 | 40.41 | 287.10 | 12.11 | 289.19 | 5.65 |
| 500 °C–10 h | 284.26 | 37.61 | 285.36 | 47.59 | 287.35 | 13.97 | 289.71 | 0.83 |
© 2019 by the authors. Licensee MDPI, Basel, Switzerland. This article is an open access article distributed under the terms and conditions of the Creative Commons Attribution (CC BY) license (http://creativecommons.org/licenses/by/4.0/).
Share and Cite
Li, C.; Xian, G. Experimental and Modeling Study of the Evolution of Mechanical Properties of PAN-Based Carbon Fibers at Elevated Temperatures. Materials 2019, 12, 724. https://doi.org/10.3390/ma12050724
Li C, Xian G. Experimental and Modeling Study of the Evolution of Mechanical Properties of PAN-Based Carbon Fibers at Elevated Temperatures. Materials. 2019; 12(5):724. https://doi.org/10.3390/ma12050724
Chicago/Turabian StyleLi, Chenggao, and Guijun Xian. 2019. "Experimental and Modeling Study of the Evolution of Mechanical Properties of PAN-Based Carbon Fibers at Elevated Temperatures" Materials 12, no. 5: 724. https://doi.org/10.3390/ma12050724
APA StyleLi, C., & Xian, G. (2019). Experimental and Modeling Study of the Evolution of Mechanical Properties of PAN-Based Carbon Fibers at Elevated Temperatures. Materials, 12(5), 724. https://doi.org/10.3390/ma12050724