1. Introduction
In bridge structures, compared to other components, defects occur more frequently in the concrete deck because it is directly subjected to traffic loads [
1,
2]. Among the various defects, delamination often develops in the concrete cover due to the corrosion effect of steel bars in reinforced concrete [
2,
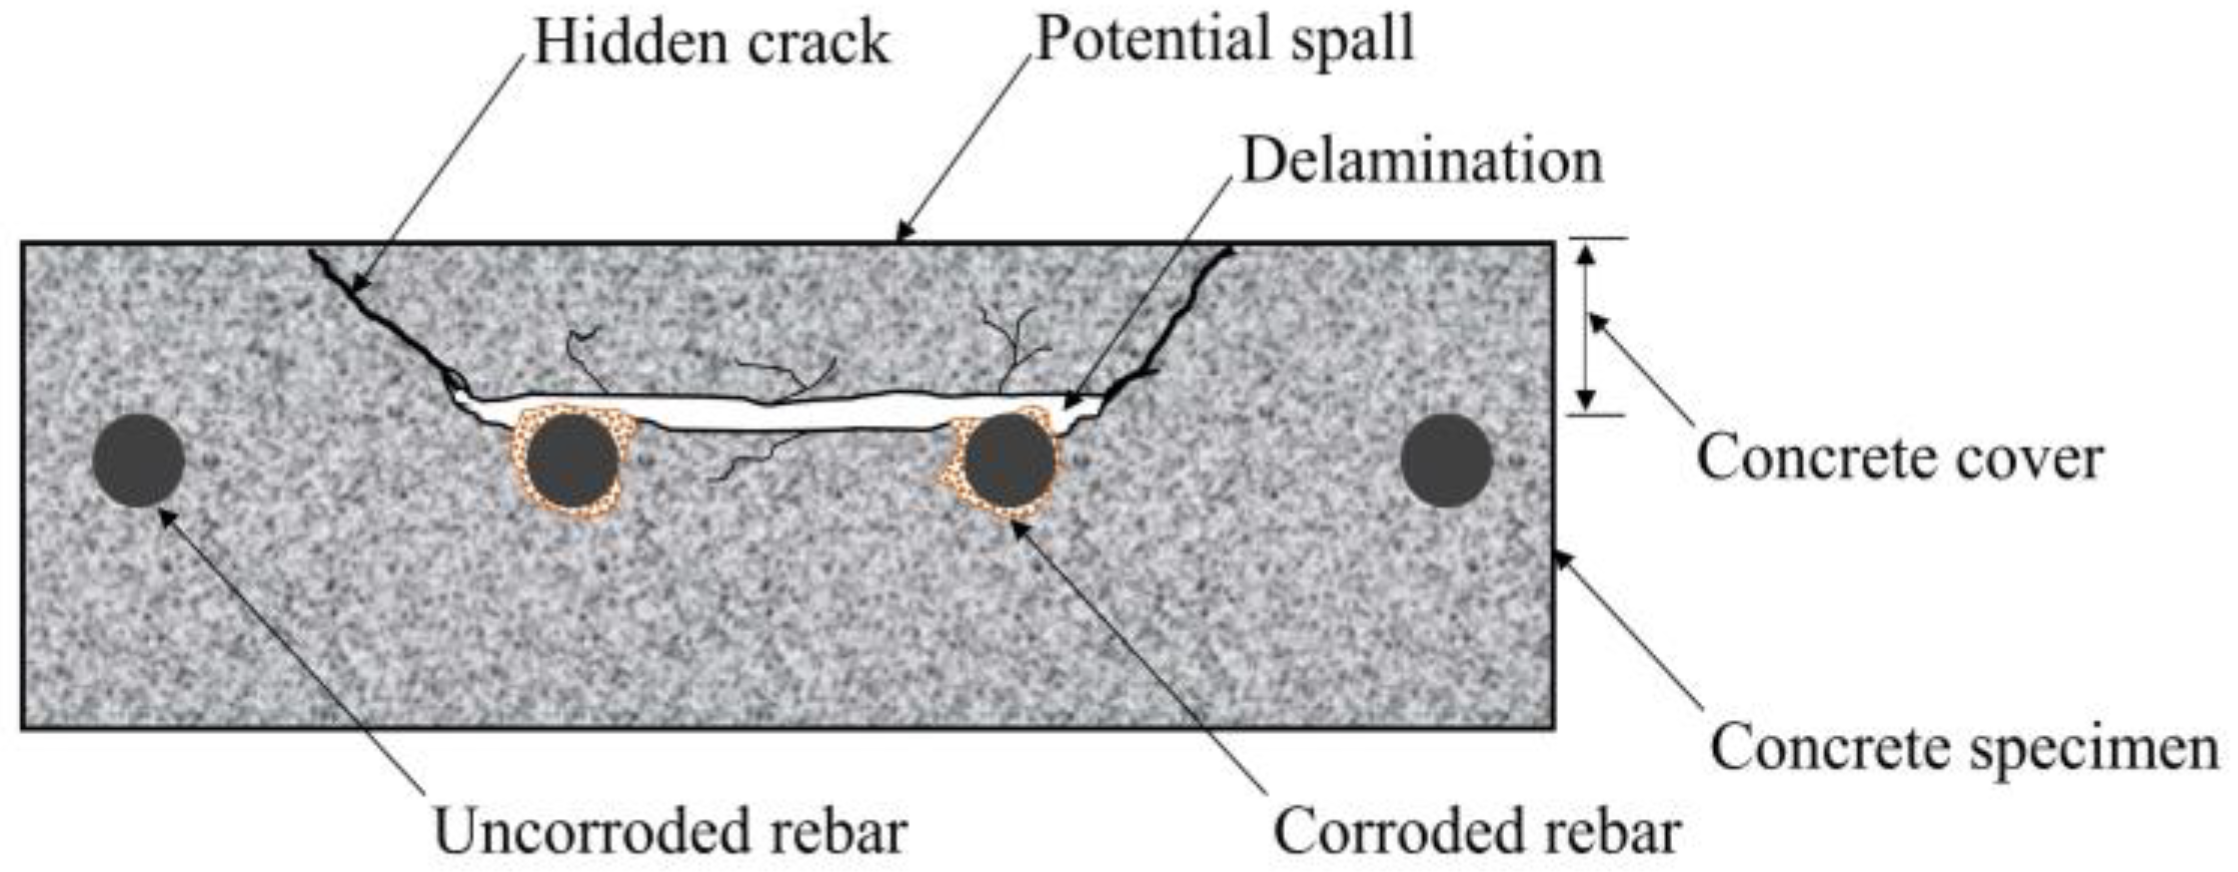
3]. Delamination is one of the most dangerous deteriorations because it is usually invisible under visual inspection and can lead to potential spalls (
Figure 1). Therefore, delaminations need to be detected as accurately as possible to maintain normal working conditions of the bridge structure.
To investigate the health of a concrete bridge deck in terms of delamination, conventional methods such as chain dragging and hammer sounding are widely used, coupled with modern non-destructive techniques (NDTs) to enhance the accuracy and quality of the inspection. The NDTs that are currently used in concrete bridge inspections include infrared thermography (IRT), ground penetrating radar, ultrasonic surface waves, impact echo, and electrical resistivity [
3,
4,
5,
6,
7,
8,
9,
10,
11,
12,
13]. In the IRT method, there are two different approaches: passive and active [
14]. In active IRT, several minutes to a few hours should be spent to inspect just small regions of structures that are not exposed directly to the sun because the structure surface must be heated by an artificial heat source [
15,
16,
17,
18,
19,
20,
21,
22,
23,
24,
25,
26,
27]. On the other hand, passive IRT has been proven to be the preferred method to inspect structure components exposed directly to the sunlight [
4,
12,
13,
28,
29,
30,
31]. The information related to potential delaminations can be extracted accurately without using any extra artificial heat source. Therefore, the concrete bridge deck is scanned more rapidly and simply using passive IRT compared to the active approach.
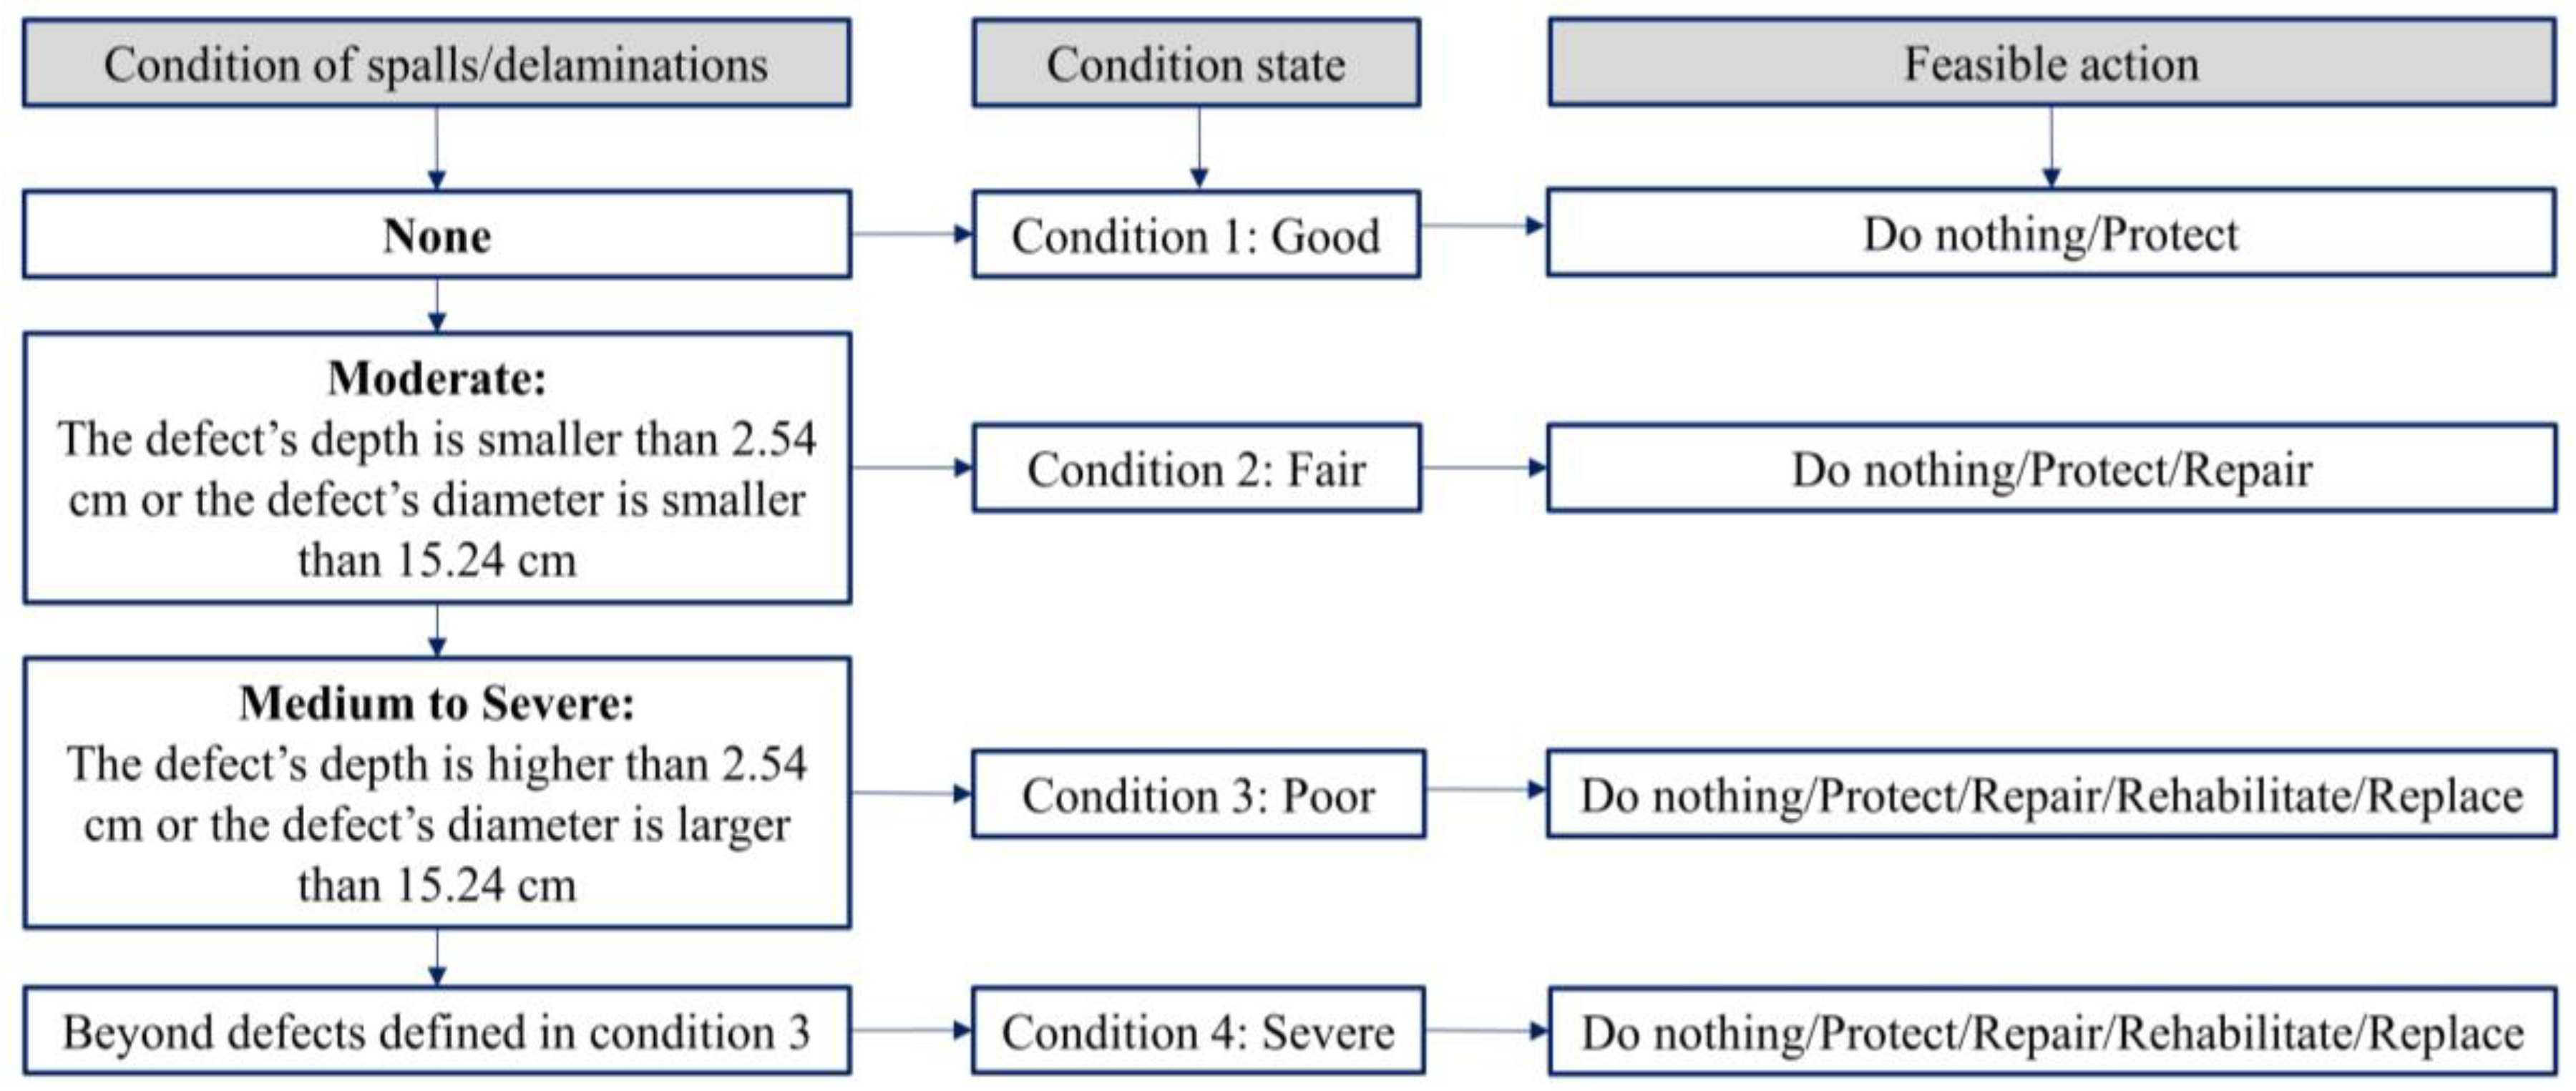
According to the American Association of State Highway and Transportation Officials (AASHTO)-Manual for Bridge Element Inspection (2015), the condition of the concrete bridge deck is divided into four states from one to four based on the level of the severity of the damages as shown in
Figure 2 [
32]. If delaminations/spalls occur inside the concrete bridge deck, it means that it does not belong to the condition state 1 (good status). The condition states 2 (fair status) and 3 (poor status) correspond to the areas of moderate and severe delaminations/spalls, respectively. In the condition state 2, the delamination depth (
d) is smaller than 2.54 cm or diameter (
w) is less than 15.24 cm, while
d is greater than 2.54 cm or
w is larger than 15.24 cm in the condition state 3. When a structure is in the condition state 4 (severe status), load reduction, bridge closure, or replacement with a new structure should be performed. It is found that both the size and depth of delamination are critical indicators used to classify the health condition of concrete bridge deck.
Moreover, although the effect of the size and depth of the delamination on the detectability of delaminations has been studied in several works, it still remains to be a controversial issue. A shallower delamination with a small size sometimes may not be detected, but a deeper delamination with a larger size may be identified. Thus, in consideration of the practical application for concrete bridge deck inspection, the employment of the passive IRT technique with various width-to-depth ratios (WTDRs, the ratios between the size and depth of delaminations) is investigated in detail in this work. This implies that the effect of the size and depth of delamination is not considered independently, like previous works, but is studied using the WTDR [
1,
29,
30].
In addition, as the environment strongly affects the detectability of defects in passive IRT, suggesting a suitable inspection time is mentioned in previous researches [
12,
13,
29,
30,
33,
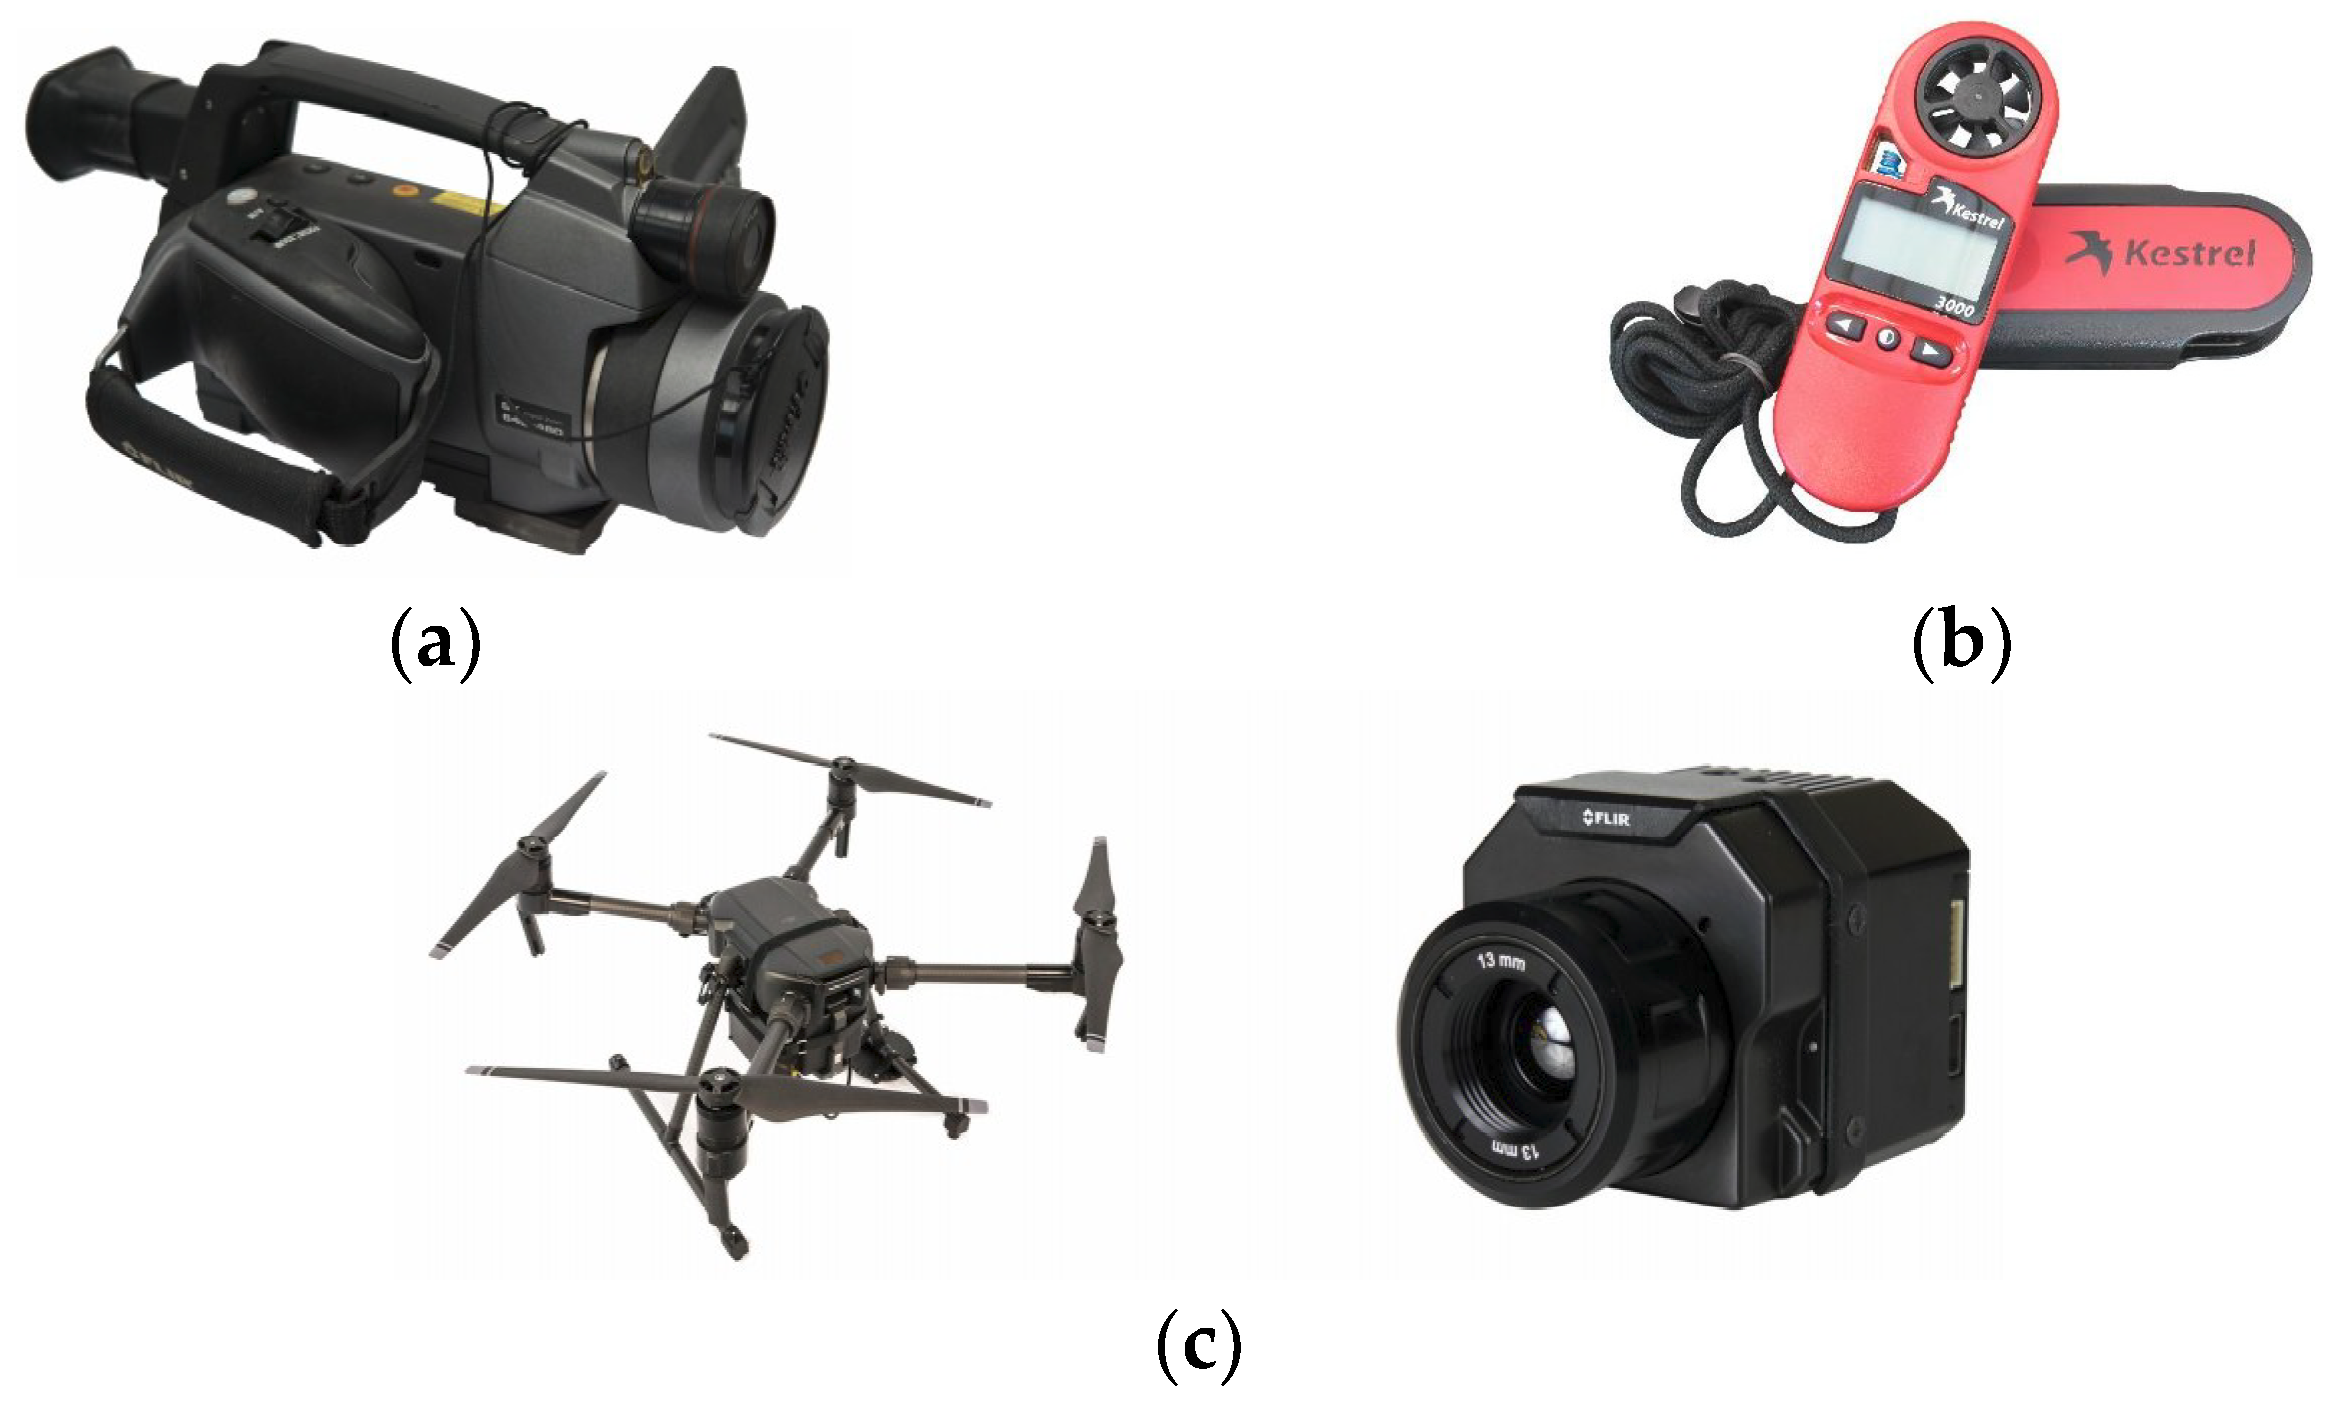
34]. However, this topic might not be studied fully, especially for defects with small size or WTDR, it therefore is one of the main tasks in the present work. In addition, the applicability of unmanned aerial vehicles (UAVs) is studied for both quantitative as well as qualitative assessment of the concrete bridge deck conditions. The UAV mounting an IR camera (UAV-IRC) is used alongside the handheld IR camera (H-IRC). The UAV-IRC is more suitable for places where the H-IRC might not be used owing to heavy and high-speed traffic. The results of the UAV-IRC would be verified by those from the H-IRC. This study determines the limits and applicability of passive IRT in detecting delamination with different WTRDs in concrete bridge deck. Hence, a comprehensive system for bridge inspection combining H-IRC and UAV is expected to be developed.
2. Literature Review
Regarding the detectability of subsurface defects in concrete structures using passive IRT techniques, the main concerns growing in recent years are the effect of delamination parameters like the size, depth, and thickness, effect of the type of the infrared detector, impact of weather conditions, and effective inspection time, as well as the minimum threshold of the surface temperature difference used to define a defect as detectable or undetectable [
1,
29,
30,
35,
36].
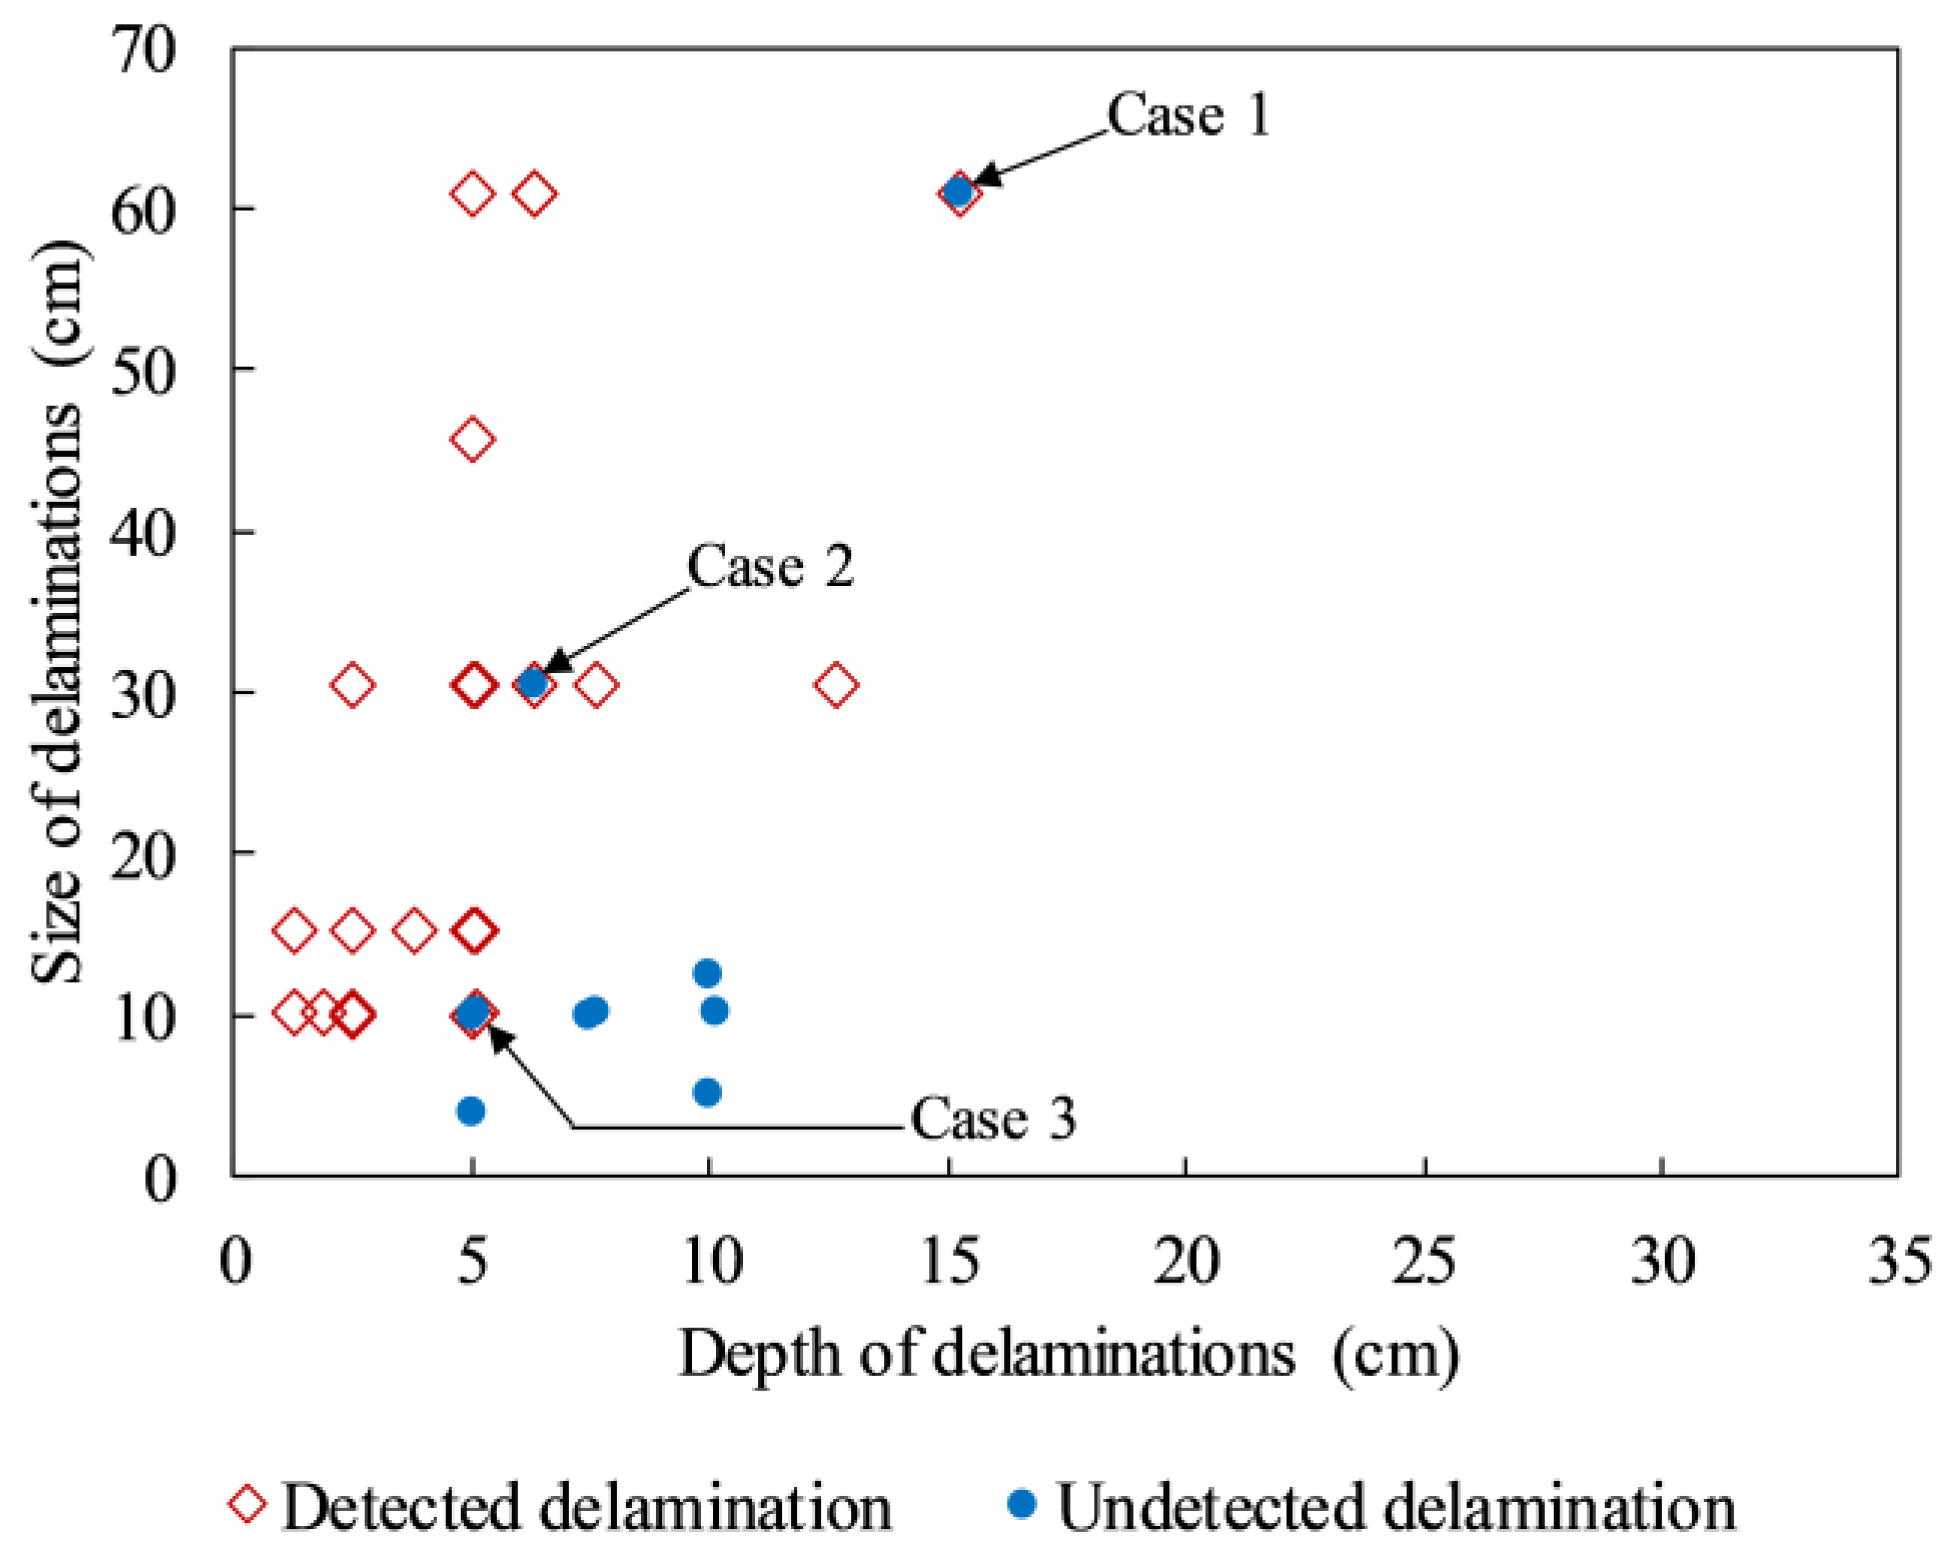
The detected depth of delaminations has been studied by researchers like Yehia et al. in 2007, Farrag et al. in 2016, Sultan et al. in 2017, and Hiasa et al. in 2018 [
1,
13,
36,
37]. Detected and undetected depths of delaminations with various sizes are depicted in
Figure 3 as summarized from previous works [
1,
2,
13,
29,
30,
34,
35,
36,
37,
38,
39]. It is noted that the results shown in
Figure 3 were based on normal concrete specimens, using an uncooled IR camera, and monitored via the passive IRT approach. In
Figure 3, the blue filled-in circle represents undetectable delaminations while the red unfilled-in diamond stands for detectable delaminations.
It can be observed in
Figure 3 that despite having the same WTDR, delaminations could be detected or undetected. The reason is that the experiments were performed in different environmental conditions, and the parameters of the artificial delaminations, the dimensions of concrete specimens and the specification of IR detector are not the same. For example, in the case of delaminations with the same WTDR of 4.0 shown as “Case 1” in
Figure 3, one delamination could be detected while other one was not identified. The same phenomenon can be observed as pointed out in “Case 2” (WTDR = 4.8) and “Case 3” (WTDR = 2.0). Thus, the conclusions given in the previous works regarding the detected depth and size of delaminations still remain a controversial topic. Hence, further studies need to be conducted, especially in the case of heterogeneous material, such as concrete. In this work, WTDR is considered instead of the depth or size separately unlike in previous studies.
The most effective time to conduct the concrete inspection (i.e., either daytime or nighttime) proposed in the above-mentioned studies is also inconsistent. Washer et al. in 2009 and 2010, conducted tests on a concrete specimen for approximately six months on the field [
29,
30]. During the test, every 10 min, the surface temperature of the specimen was monitored by an IR camera. Washer et al. recommended that the optimum times of the day for identifying delaminations at depths of 25, 51, 76, and 127 mm are after sunrise 5 h and 40 min, 6 h, 7 h and 9 h, respectively [
29,
30]. However, in 2018, Hiasa et al. proposed different times to perform the delamination inspection in concrete structures based on the results of the field test on four concrete specimens in which an IR camera was utilized to capture the surface temperature of the specimen from 7:00 am to 12:00 am [
1]. They concluded that delaminations at depths of 5.1 and 7.6 cm could not be detected. It was suggested that delaminations at depths of 1.3 and 2.5 cm can be detected at any time except during the interchange periods of 09:00–9:30 and 15:00–16:00. The authors stated that the inspections should be conducted during nighttime because the available time during nighttime is longer than that during daytime, and the probability of the misdetection of the delaminations may be reduced.
Furthermore, Yehia et al. (2007), Kee et al. (2012), and Gucunski et al. (2013) gave their own recommendations about the available inspection time [
12,
13,
34]. Yehia mentioned that during the period from 10:00 to noon, delaminations with depths equal to or smaller than 5.1 cm were shown more clearly than from noon until 3 pm [
13]. Focusing on deep delaminations of 6.35 and 15.24 cm, Kee et al. stated that delaminations could be detected clearly at 45 min after sunrise during the cooling cycle or after sunrise 7 h and 45 min while no delaminations were shown at 3 h and 45 min after sunrise [
34]. Gucunski et al. recommended that 40 min after sunrise is a better time than around noon for the delamination inspection [
12]. As reviewed above, the proposed times are completely different and this can be explained by the effects of different environmental conditions, delamination characteristics, concrete specimen dimensions, infrared detectors, and experiment setup. Hence, the determination of feasible inspection time should be studied further, especially in the case of small WTDR delamination in order to reduce the misdetection problem in the concrete bridge inspection.
In passive IRT, the IR camera is normally kept in hand or mounted on a car to scan the concrete bridge deck. In these cases, although the lane closure is not required, the vehicle speed on the bridge is reduced and it is inconvenient in certain aspects. Recently, some researchers have utilized UAV-IRC to capture thermal images in order to conduct bridge inspection [
40,
41,
42,
43,
44]. In 2017, Omar et al. used UAV-IRC to detect defects in a concrete bridge [
40]. In their study, the severity of the delaminated area in the concrete bridge deck was indicated by a condition map based on their proposed objective thresholds. Khan et al. in 2015 used the UAV-IRC to collect thermal images of a mock-up bridge. As a result, potential defects in the concrete bridge deck were indicated [
41]. In addition, the effect of technical data of IR camera, UAV and the overlap of individual images were considered by Vasterling and Meyer in 2013 and Gillins et al. in 2016 [
43,
44]. They stated that the uncooled sensor IR camera with 8–14 μm of bandwidth is a good choice for the UAV-IRC because of its lightweight. The flight altitude should be selected based on the camera resolution and separated images should be taken with a minimum overlap of 50%. In all works mentioned above, the effects of WTDRs as well as the ranges of the WTDRs in which delaminations may be detected by using UAV-IRC have not been presented. These matters will be clarified in this study and the applicability of UAV-IRC is examined by comparing its results with those of experiments from H-IRC.
In the present work, the experiments were carried out on a concrete slab embedded artificial delaminations with various WTDRs using passive IRT. Two IR detectors with different specifications are used including an H-IRC and a UAV-IRC. To develop a comprehensive system in inspecting the bridge using both H-IRC and UAV, the aims of this study is to: (1) Examine the effect of WTDRs on the detectability of delaminations in a concrete specimen; (2) Determine the minimum WTDR of a delamination that can be detected during the daytime and nighttime; (3) Propose a suitable time for concrete bridge deck inspection using passive IRT technique; (4) Evaluate the applicability of UAV-IRC on delamination detection in concrete bridge decks.
3. Fundamentals of Passive IRT
In the passive IRT technique, there are two configuration modes including transmission and reflection [
28]. In transmission mode, heat sources and IR cameras are placed on two opposite sides of the specimen whereas they are placed on the same side of the specimen in the reflection mode [
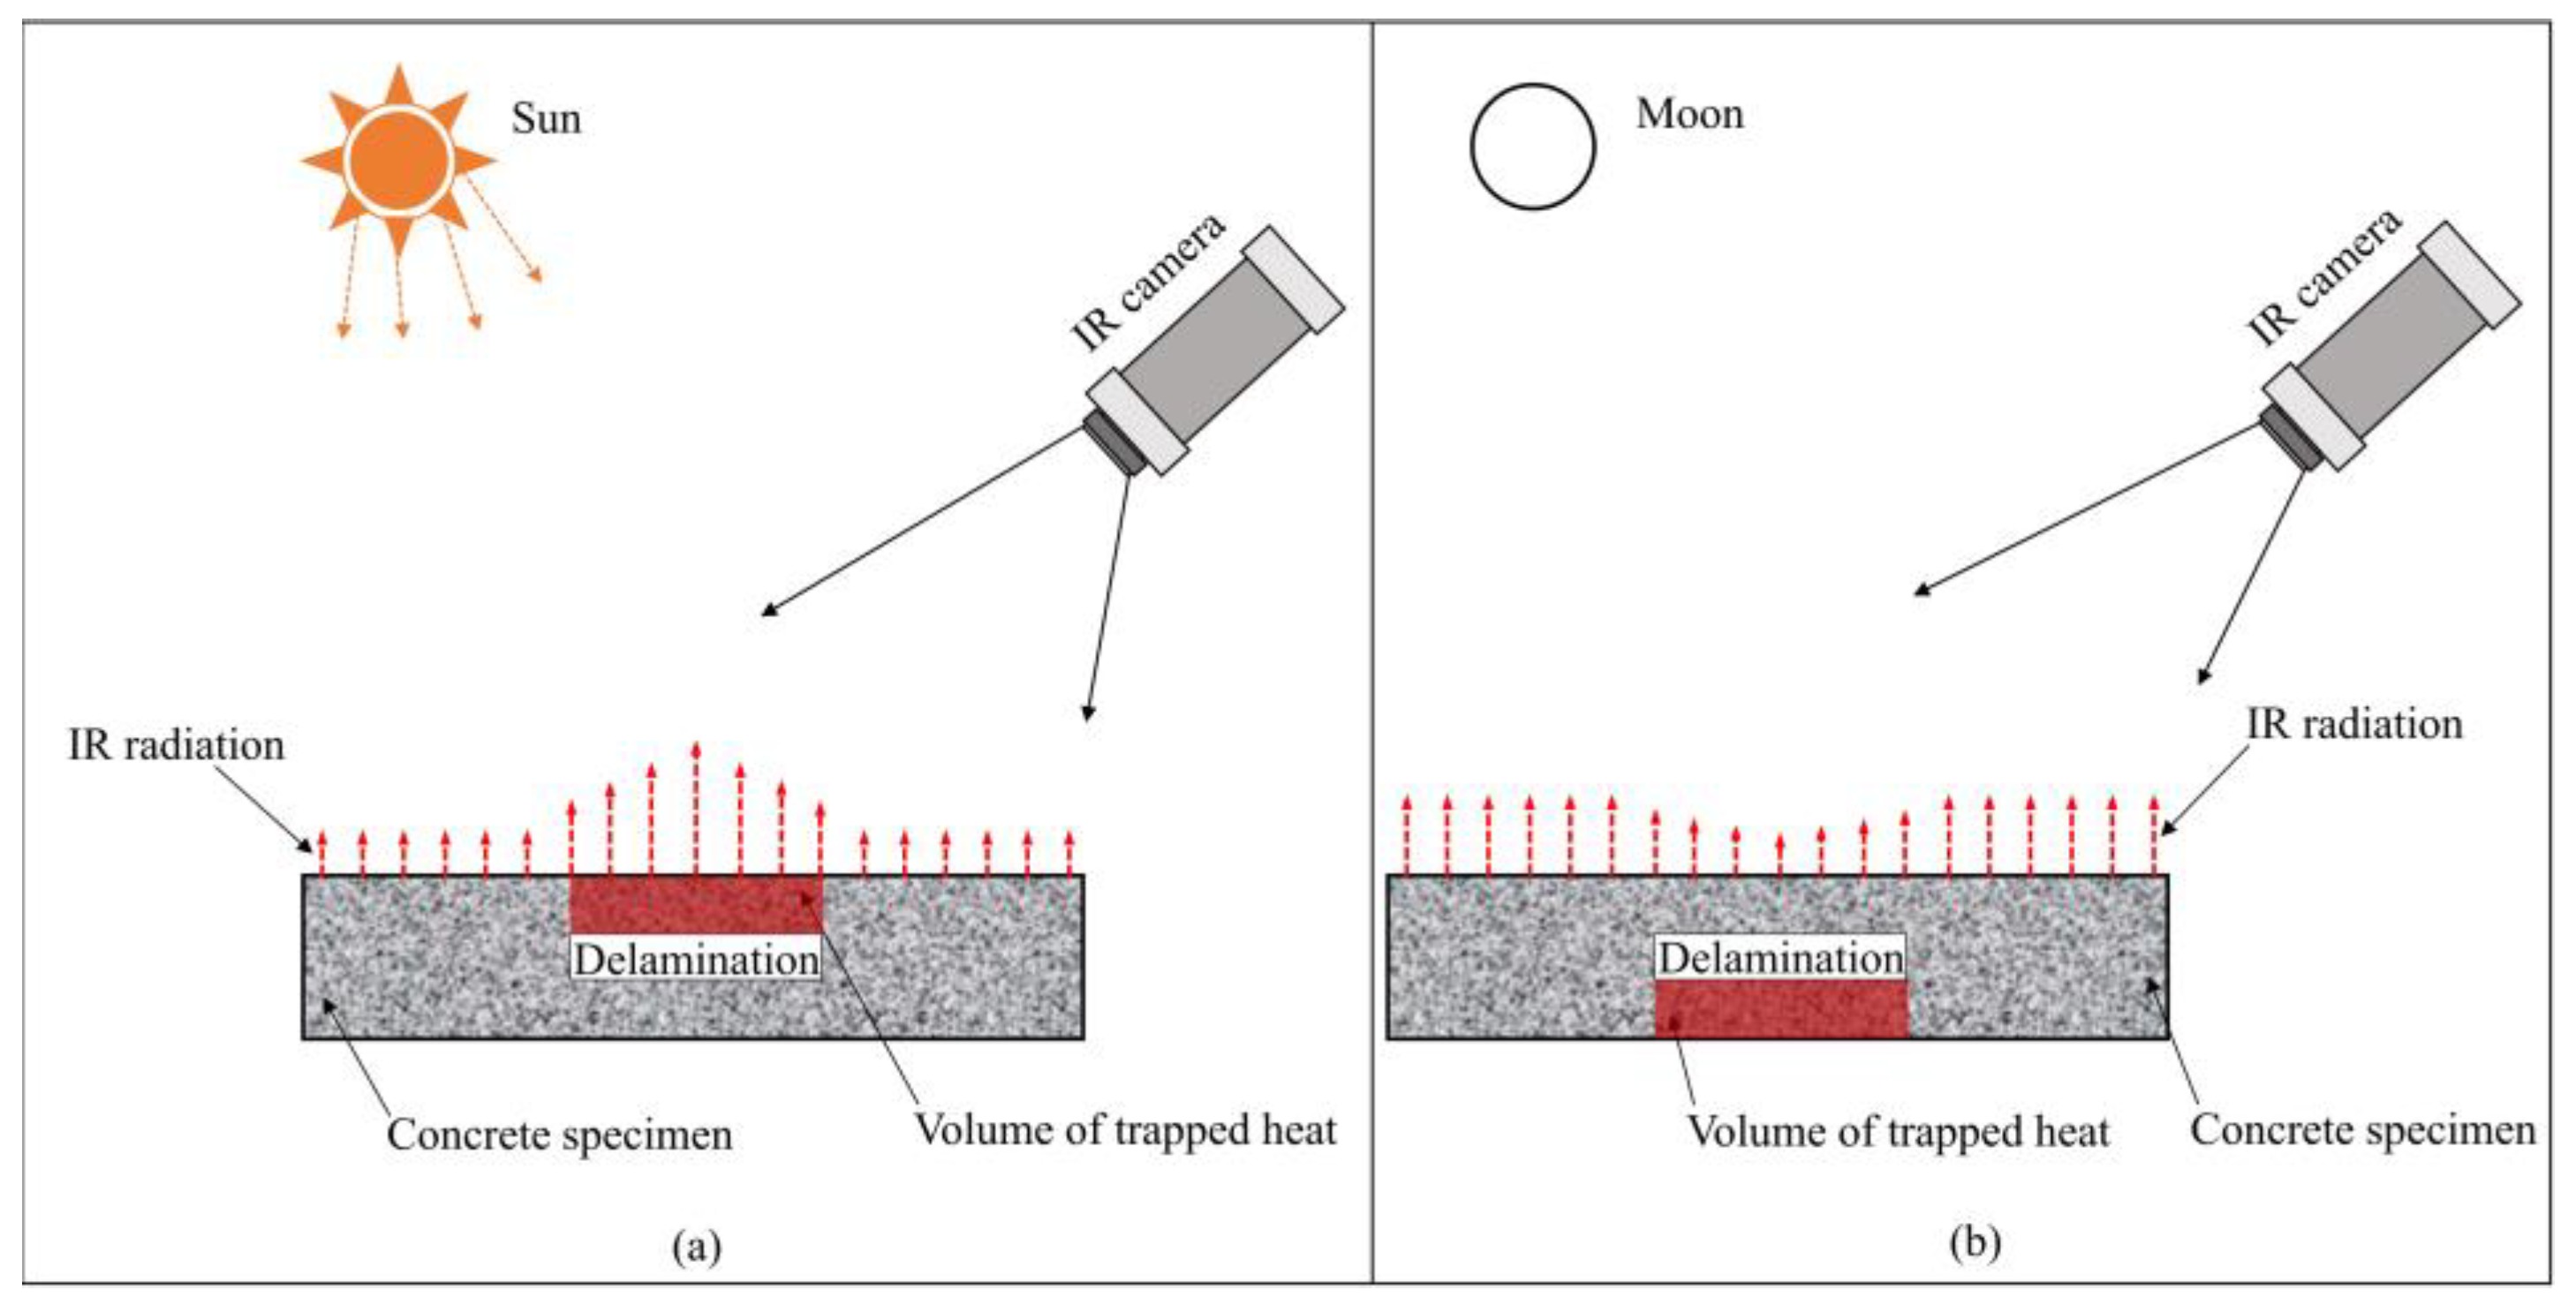
28]. In the present work, the reflection mode is chosen (during daytime) to detect delaminations in a concrete slab because this mode is more popular and applicable for concrete bridge deck inspection, especially in cases of bridges with great heights. The mechanism of the detectability of delaminations during both daytime and nighttime is briefly explained as shown in
Figure 4.
During the daytime, energy from the sun heats up the concrete surface. If a delamination exists inside the concrete structure, the volume of the trapped heat develops above the delamination because the thermal conductivity of air (approximately 0is much lower than that of the concrete (between 0.4 and 1.8 W/m°C), then the energy from the trap.024 W/m°C) ped heat volume turns back to the surface [
1,
2,
45,
46]. Therefore, the concrete surface above the delaminations becomes hotter than the neighborhoods during the daytime. In contrast, the heat is radiated back to the sky, thus the volume of the trapped heat is under the delamination during nighttime [
1]. As a result, the concrete surface above the delamination is cooler than its surroundings during nighttime. When utilizing an IR camera to capture the thermal images at a suitable time, defects can be observed based on the difference of the surface temperature between the delaminated and surrounding areas.
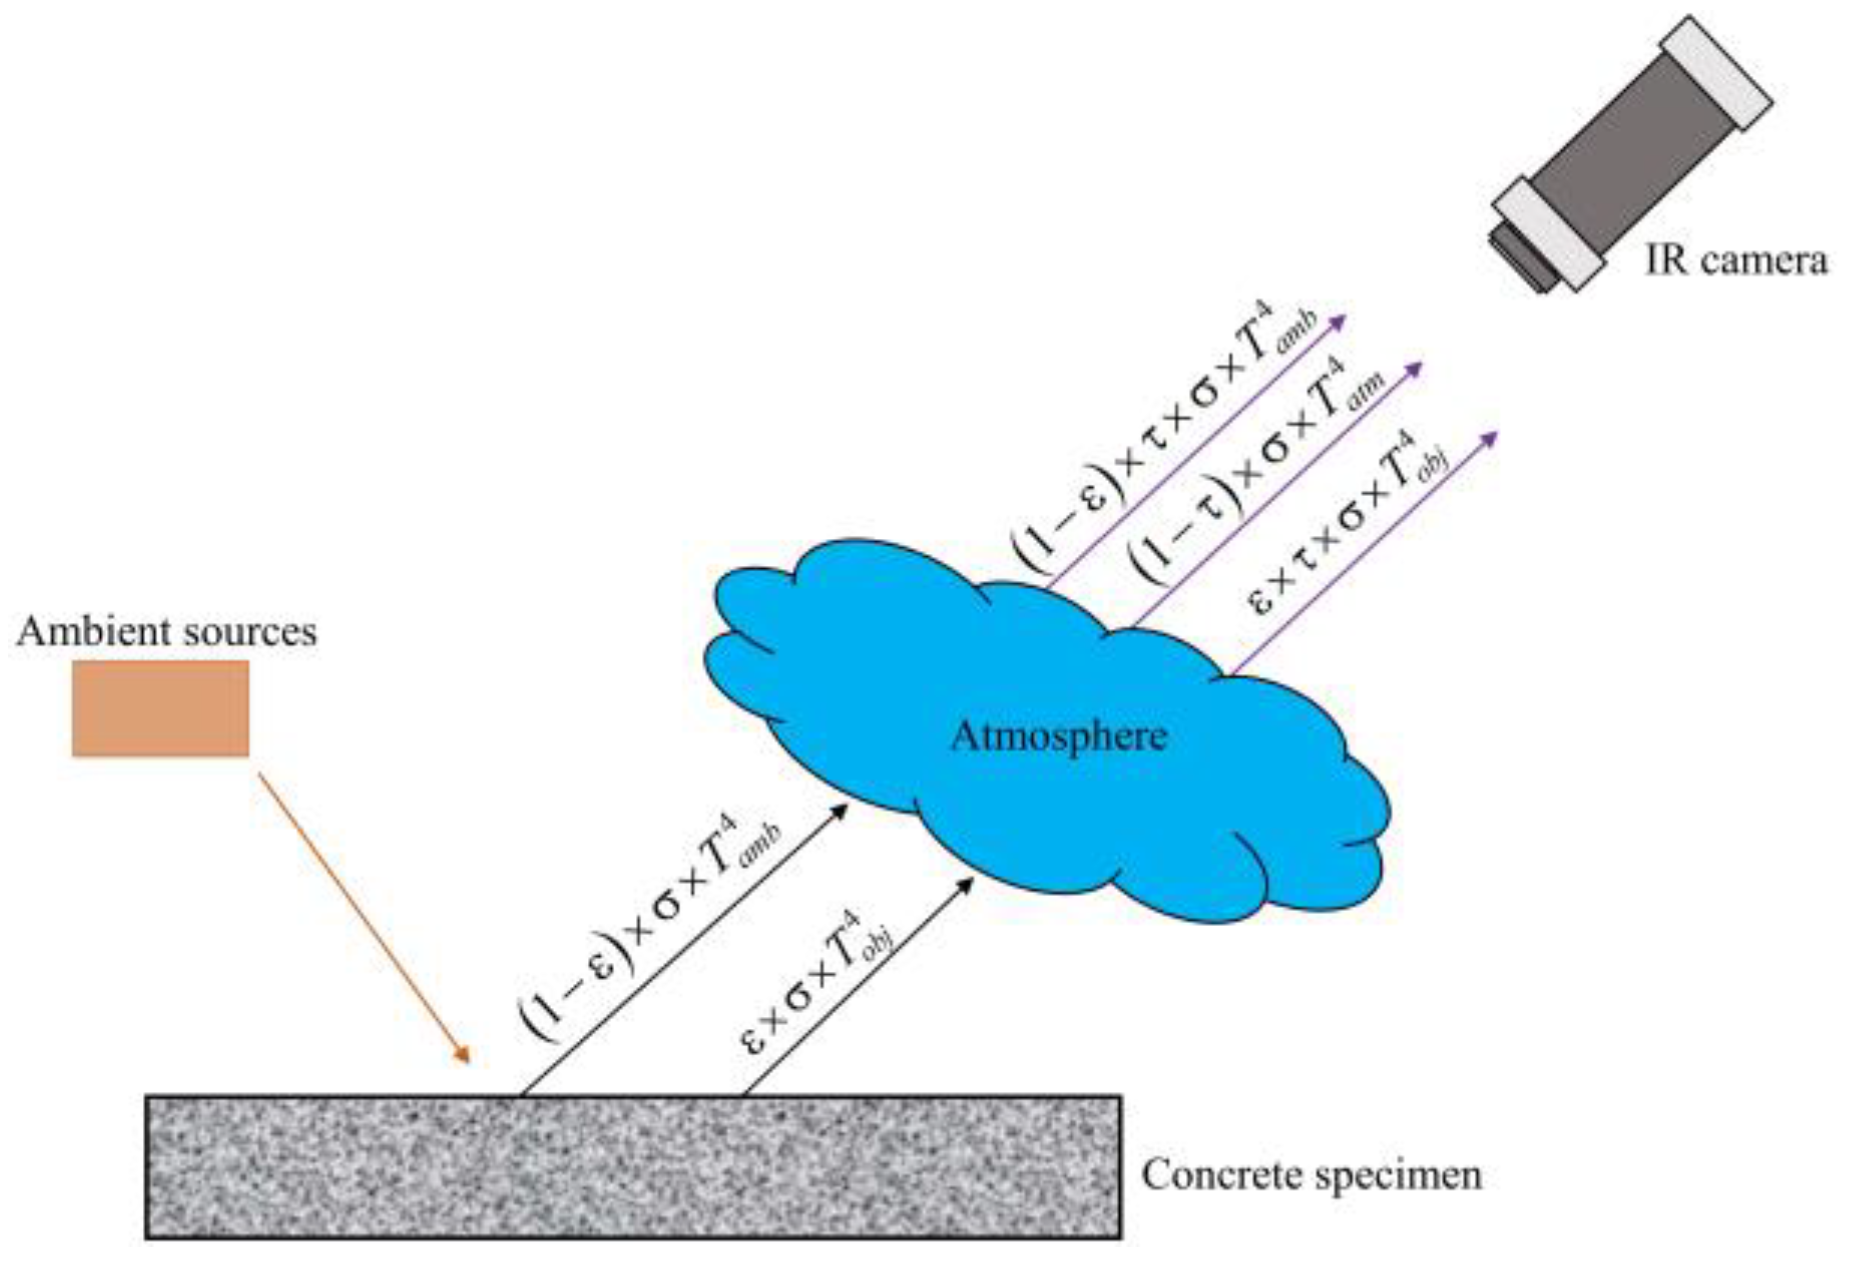
The total radiation (
Wtot) is captured by an IR camera not only from the object but also from ambient sources and the atmosphere, as shown in Equation (1) and
Figure 5 [
47]. The surface temperature of the object can be computed automatically by using Equation (2).
where
is the emission from the object,
is the reflected emission from ambient sources,
is the emission from the atmosphere,
Tobj is the temperature of the object,
Tamb is the reflected temperature from ambient sources,
Tatm is the atmospheric temperature, ε is the emissivity of the object, τ is the transmittance of the atmosphere, σ is the Stefan-Boltzmann constant (σ = 5.67 × 10 − 8 W/m
2K
4), thereby (1 − ε) is the reflectance of the object, and (1 − τ) is the emissivity of the atmosphere. The values of ε,
Tamb, and
Tatm must be set in the camera as input data.
5. Detectability of Delaminations Using H-IRC
5.1. Surface Temperature
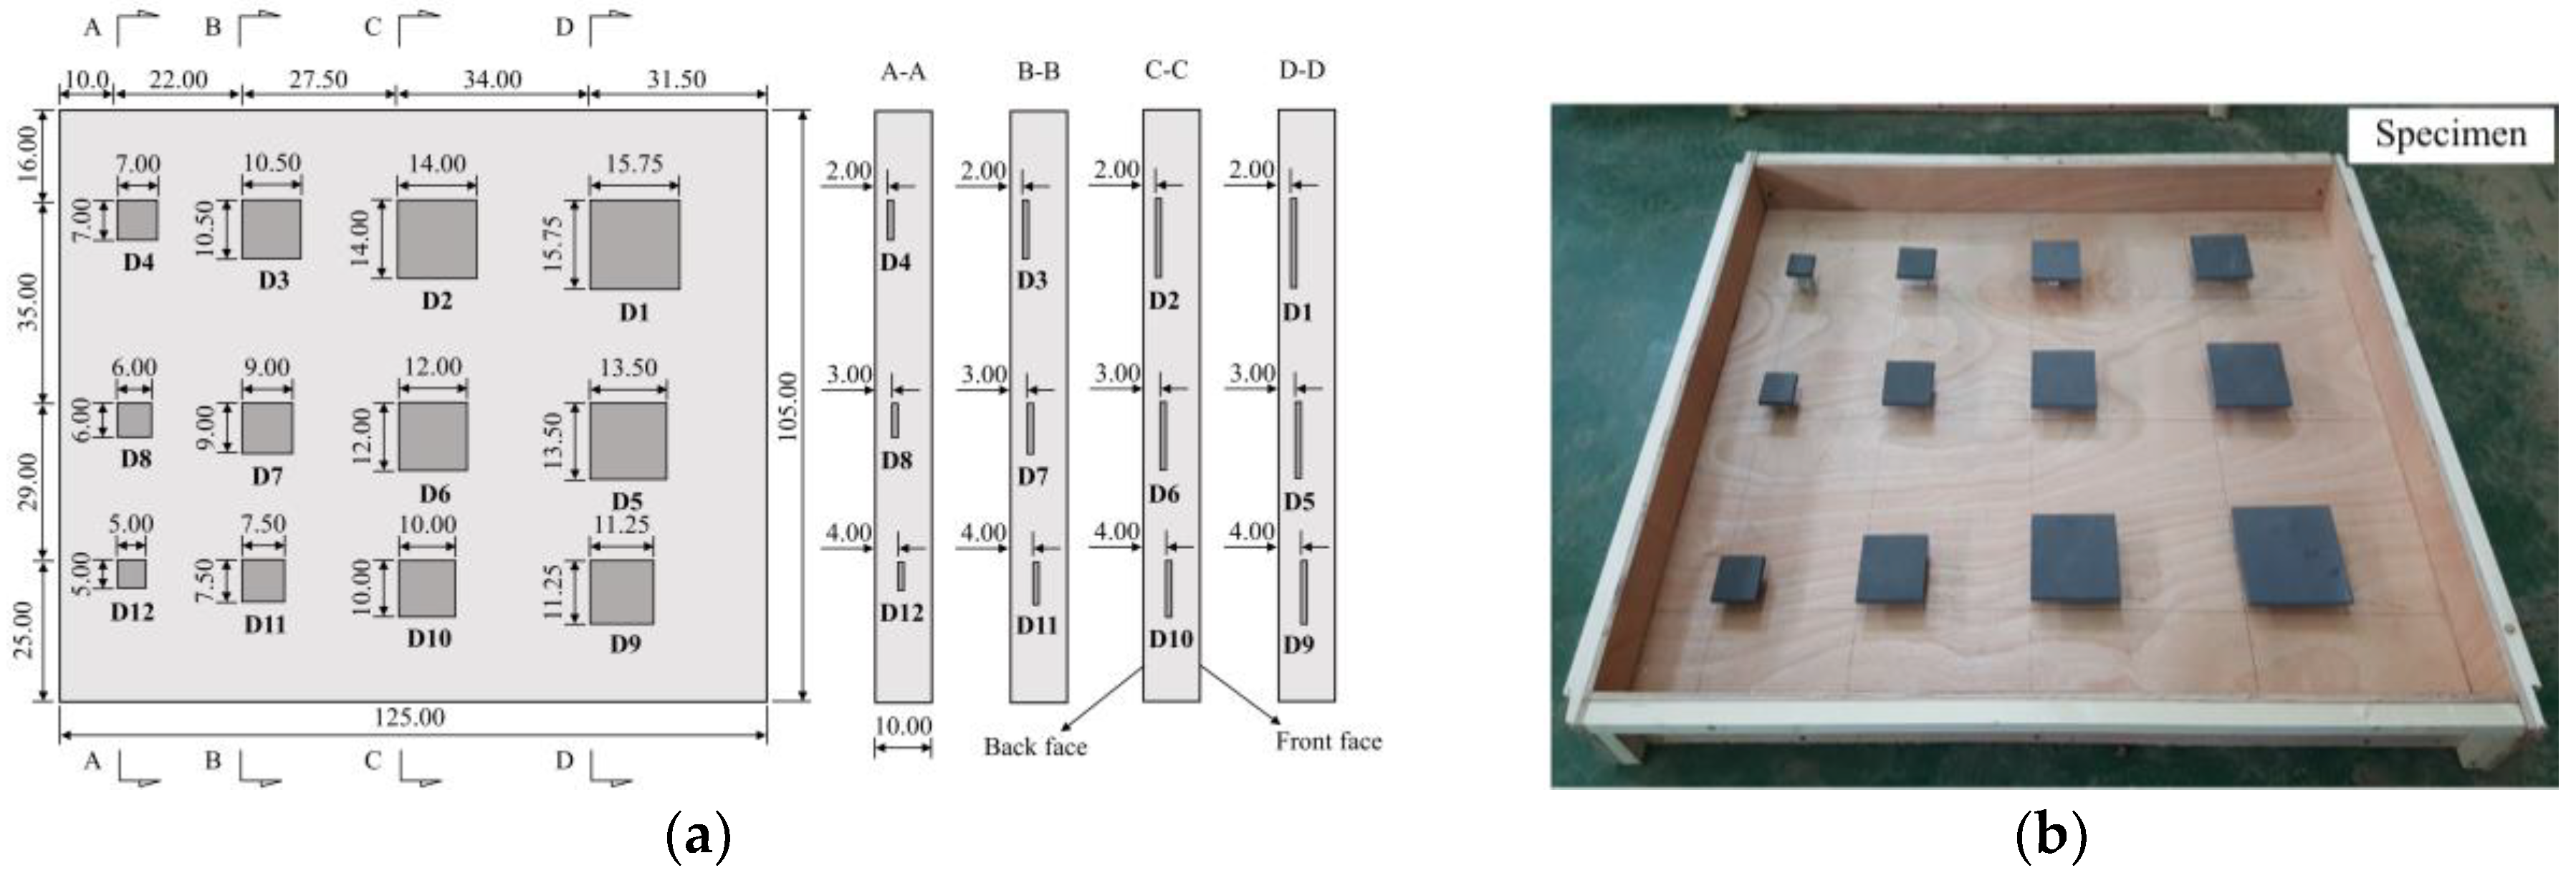
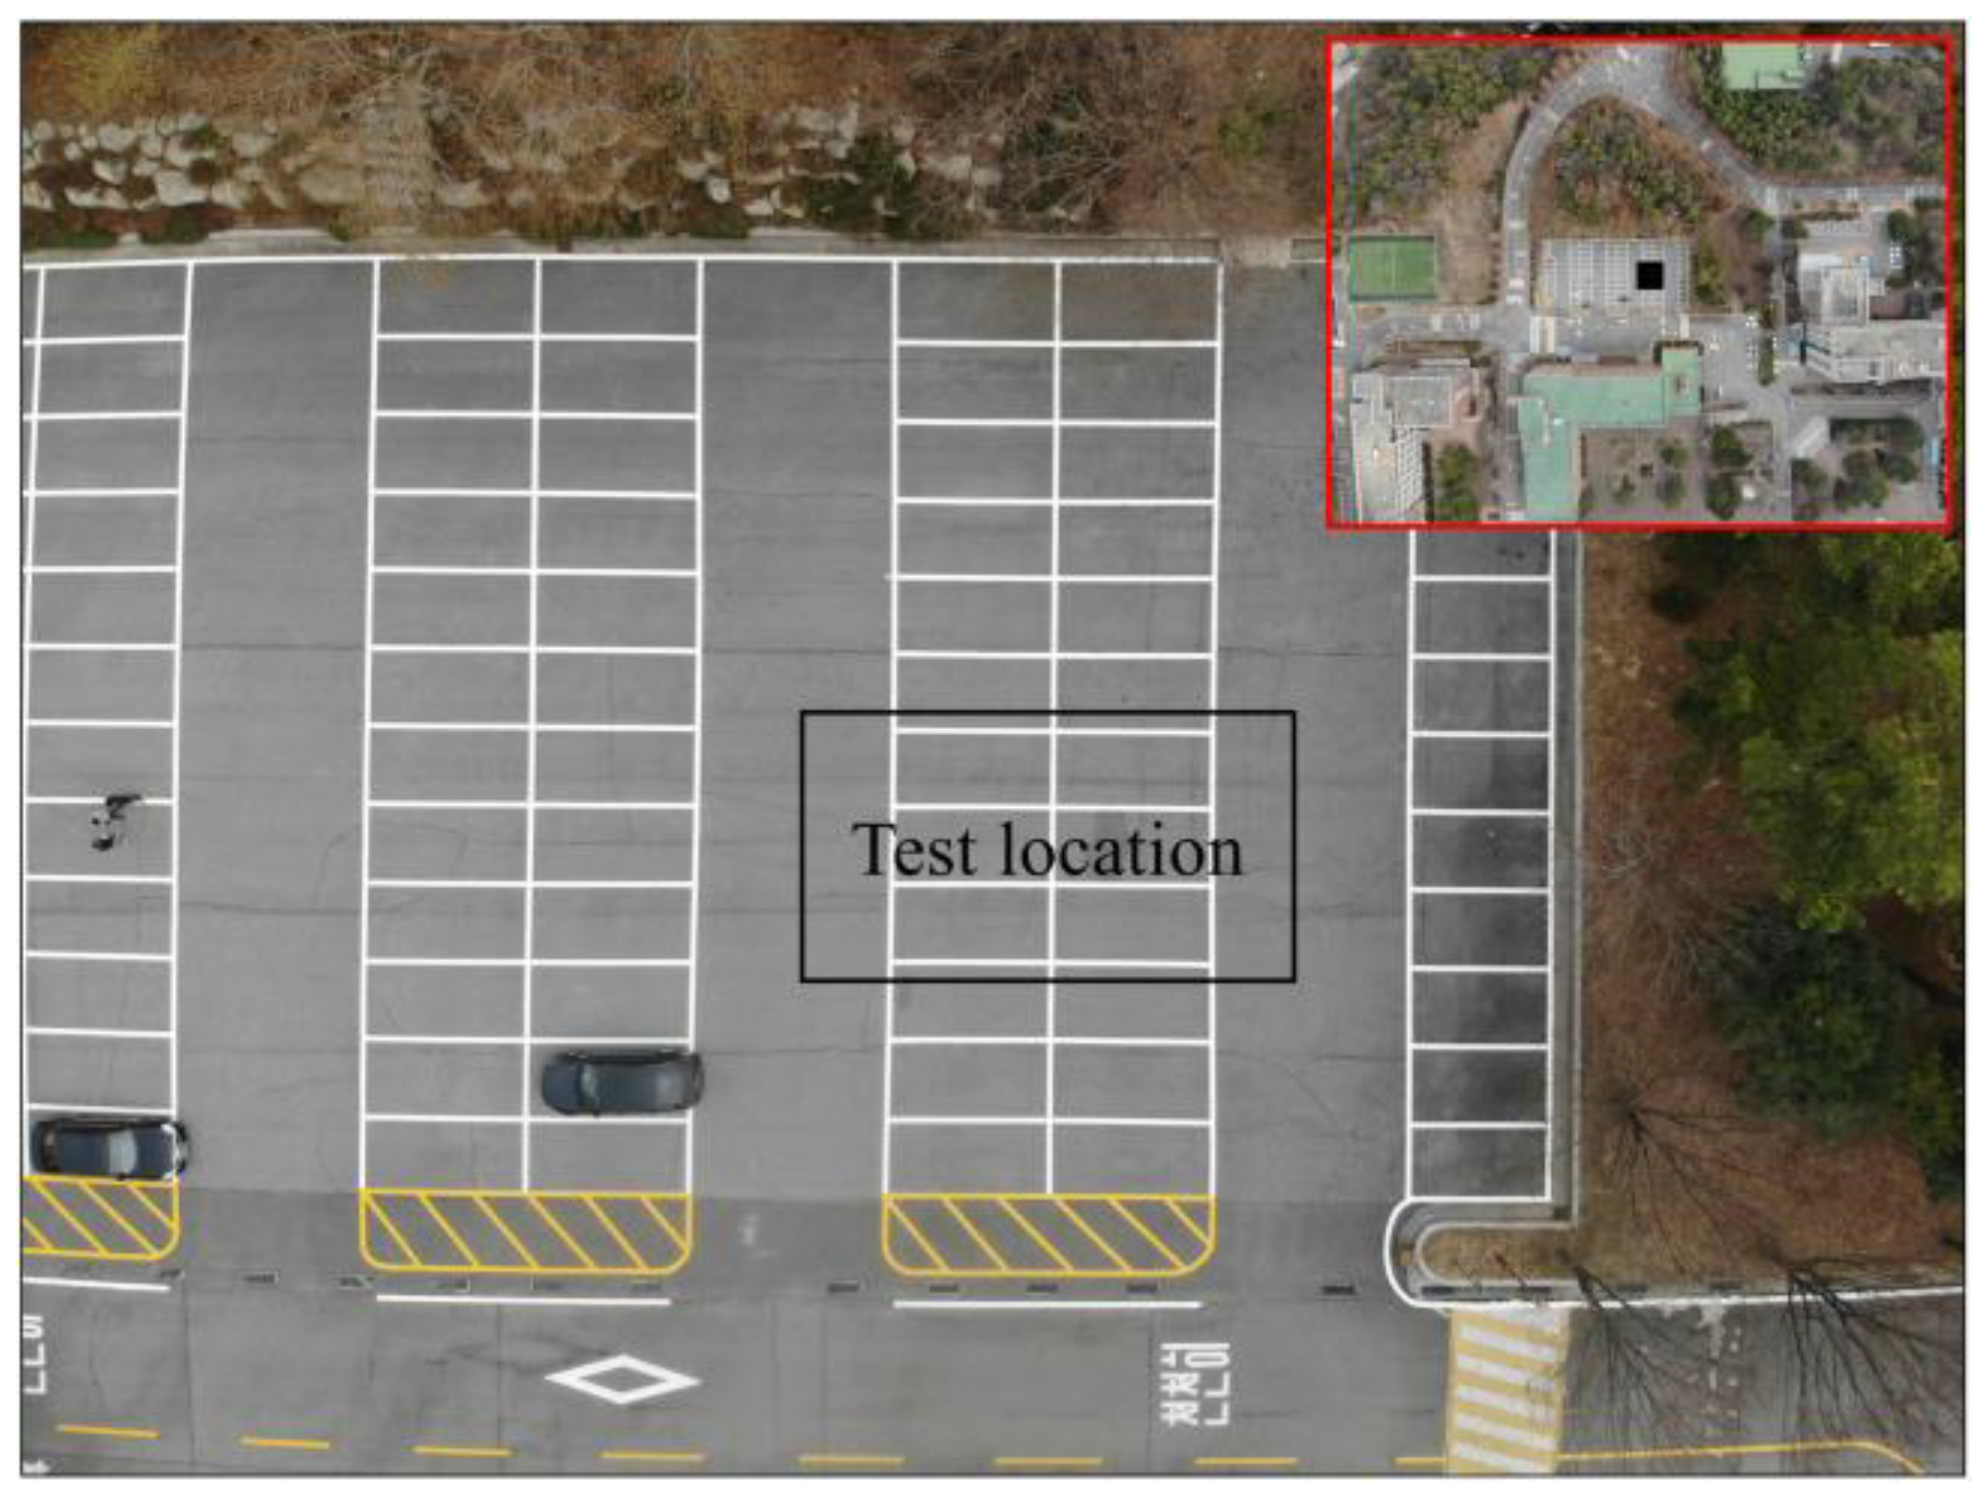
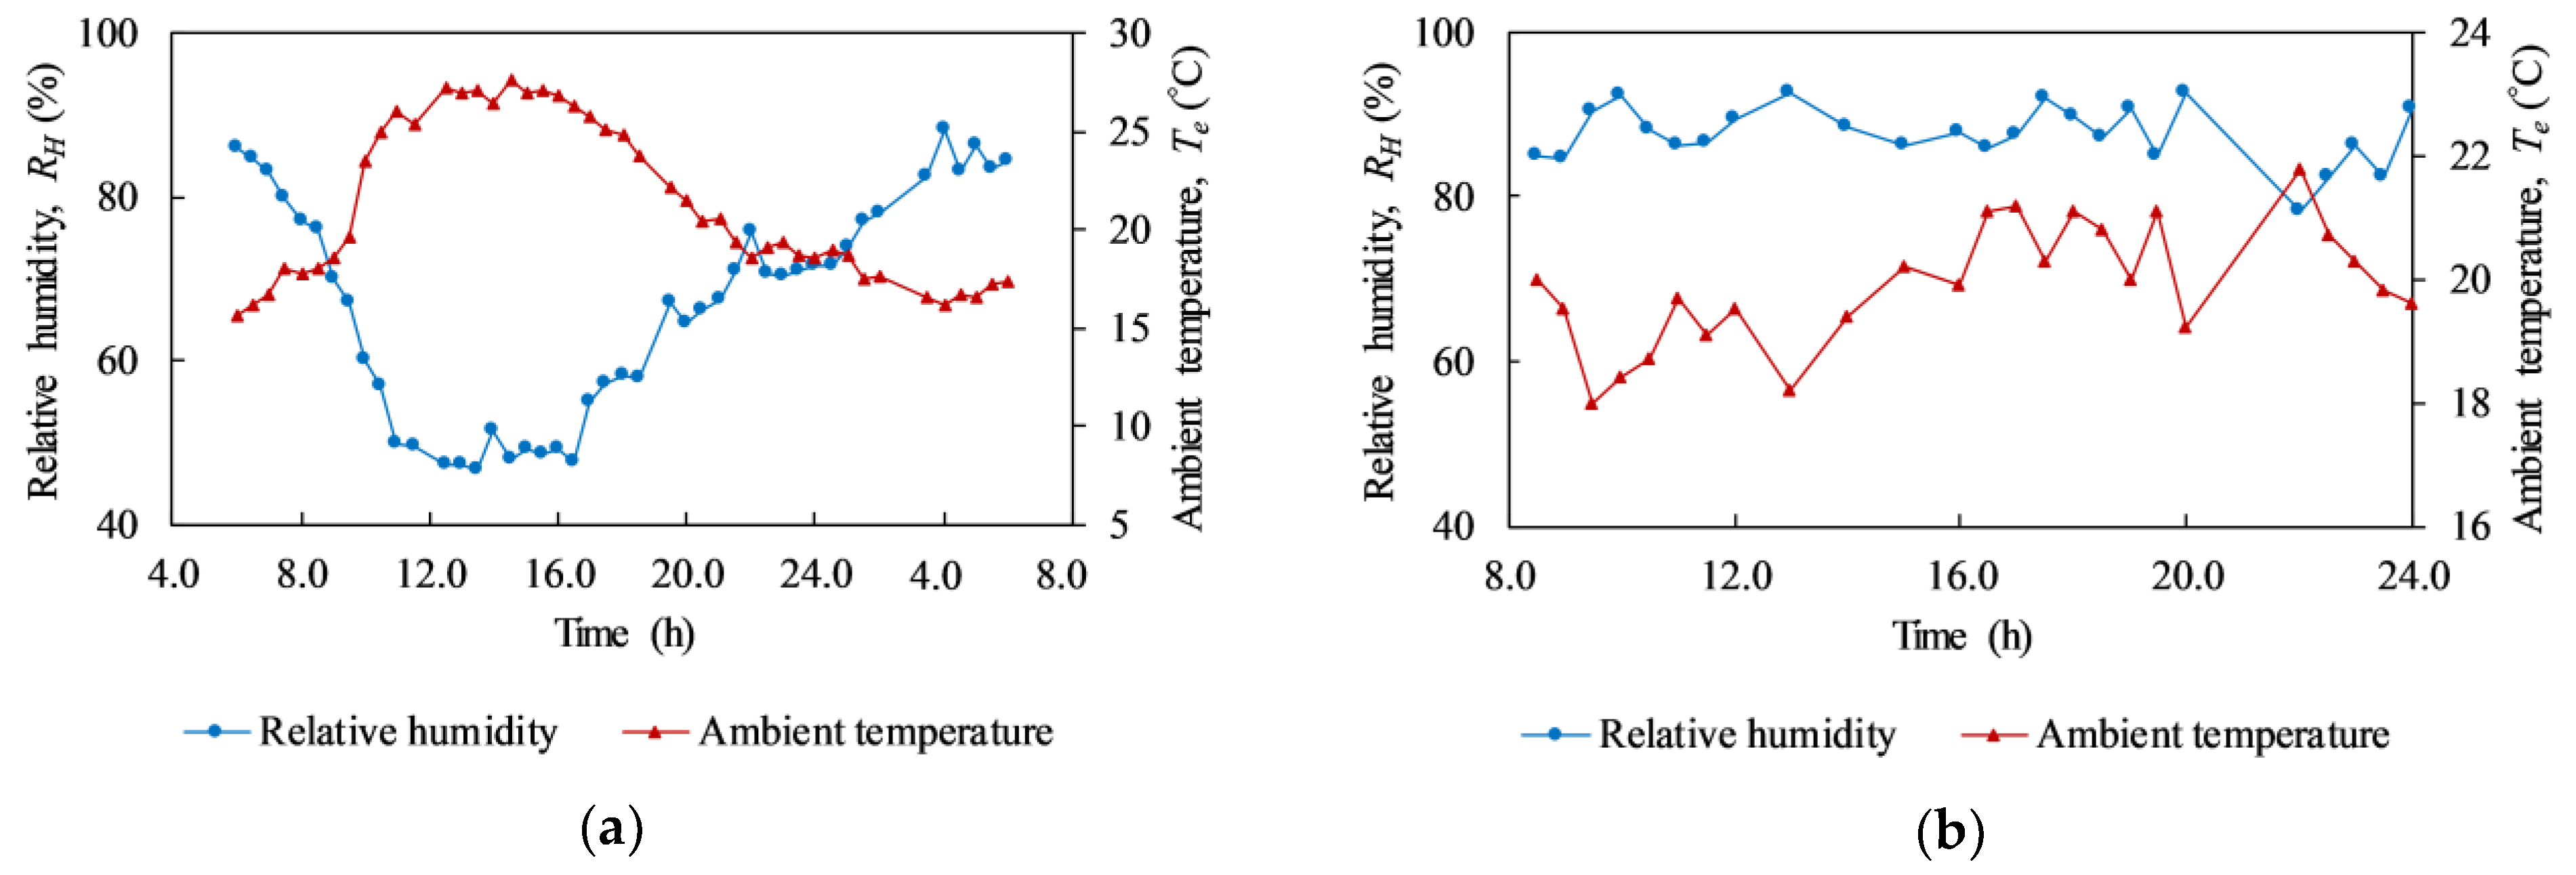
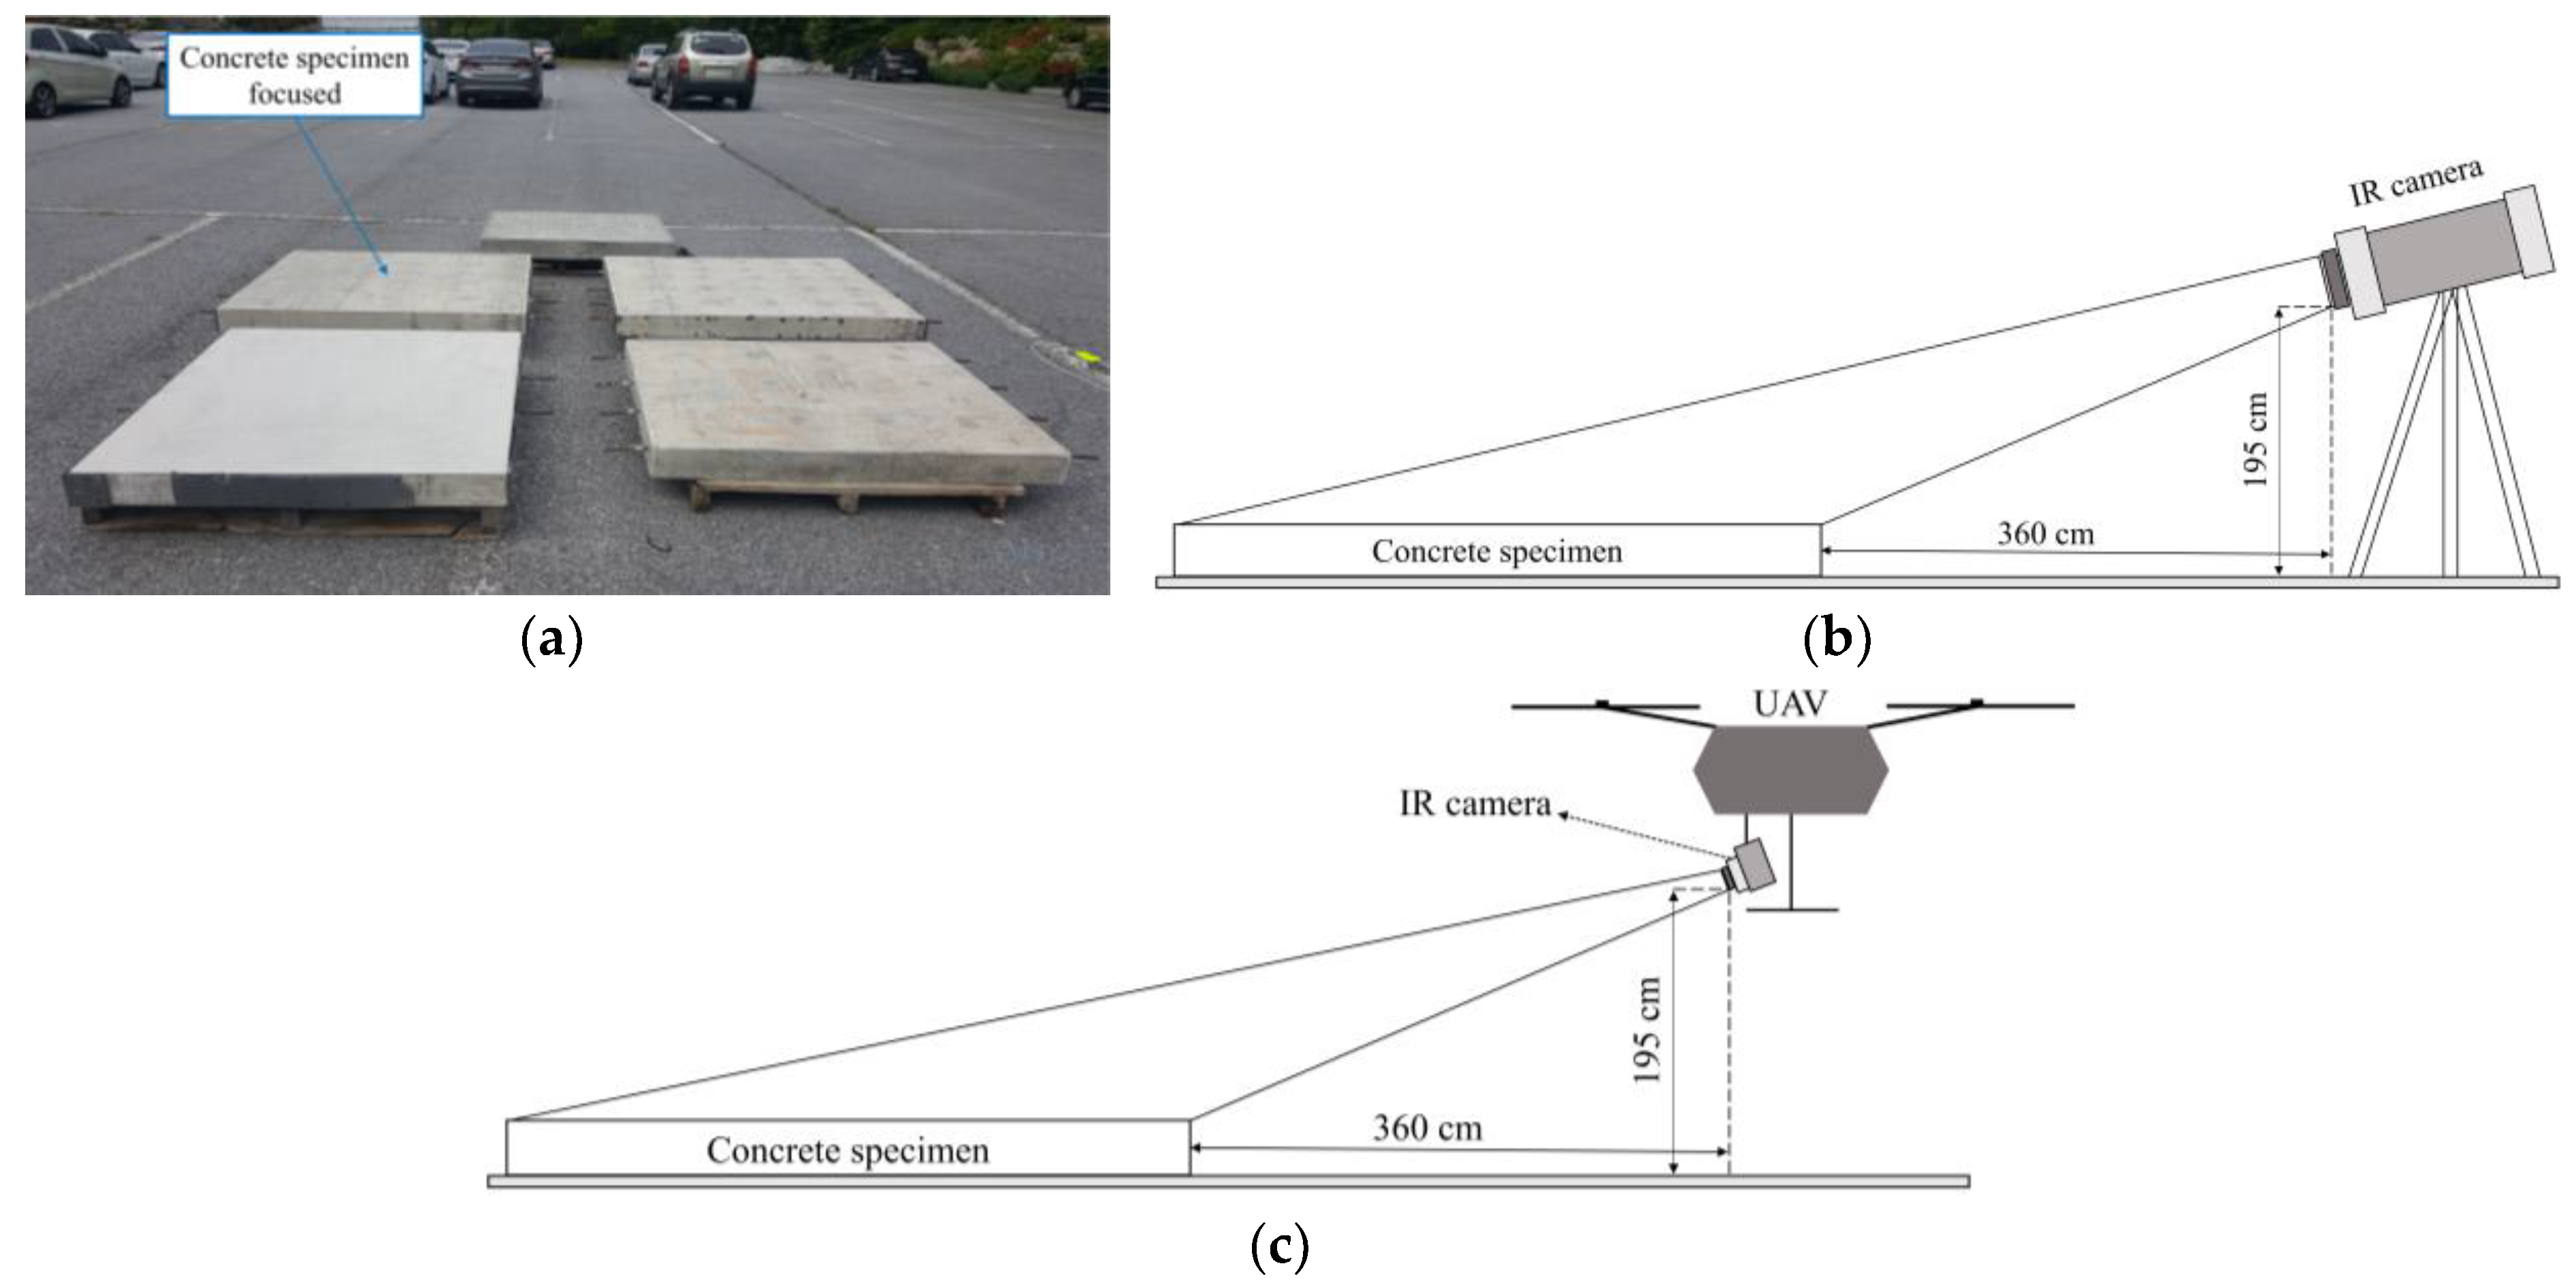
The temperature of the concrete specimen surface is analyzed focusing on the back face with delaminations at depths equal to or less than 4 cm during both sunny day (day 1) and rainy day (day 2). It should be noted that in the experiment, sunrise appeared at 5:30 and sunset was at 18:40 on day 1. However, the sun started heating the specimen from 6:45 and stopped heating at 17:35 owing to the shadow of trees and buildings near the experiment site as shown in
Figure 7.
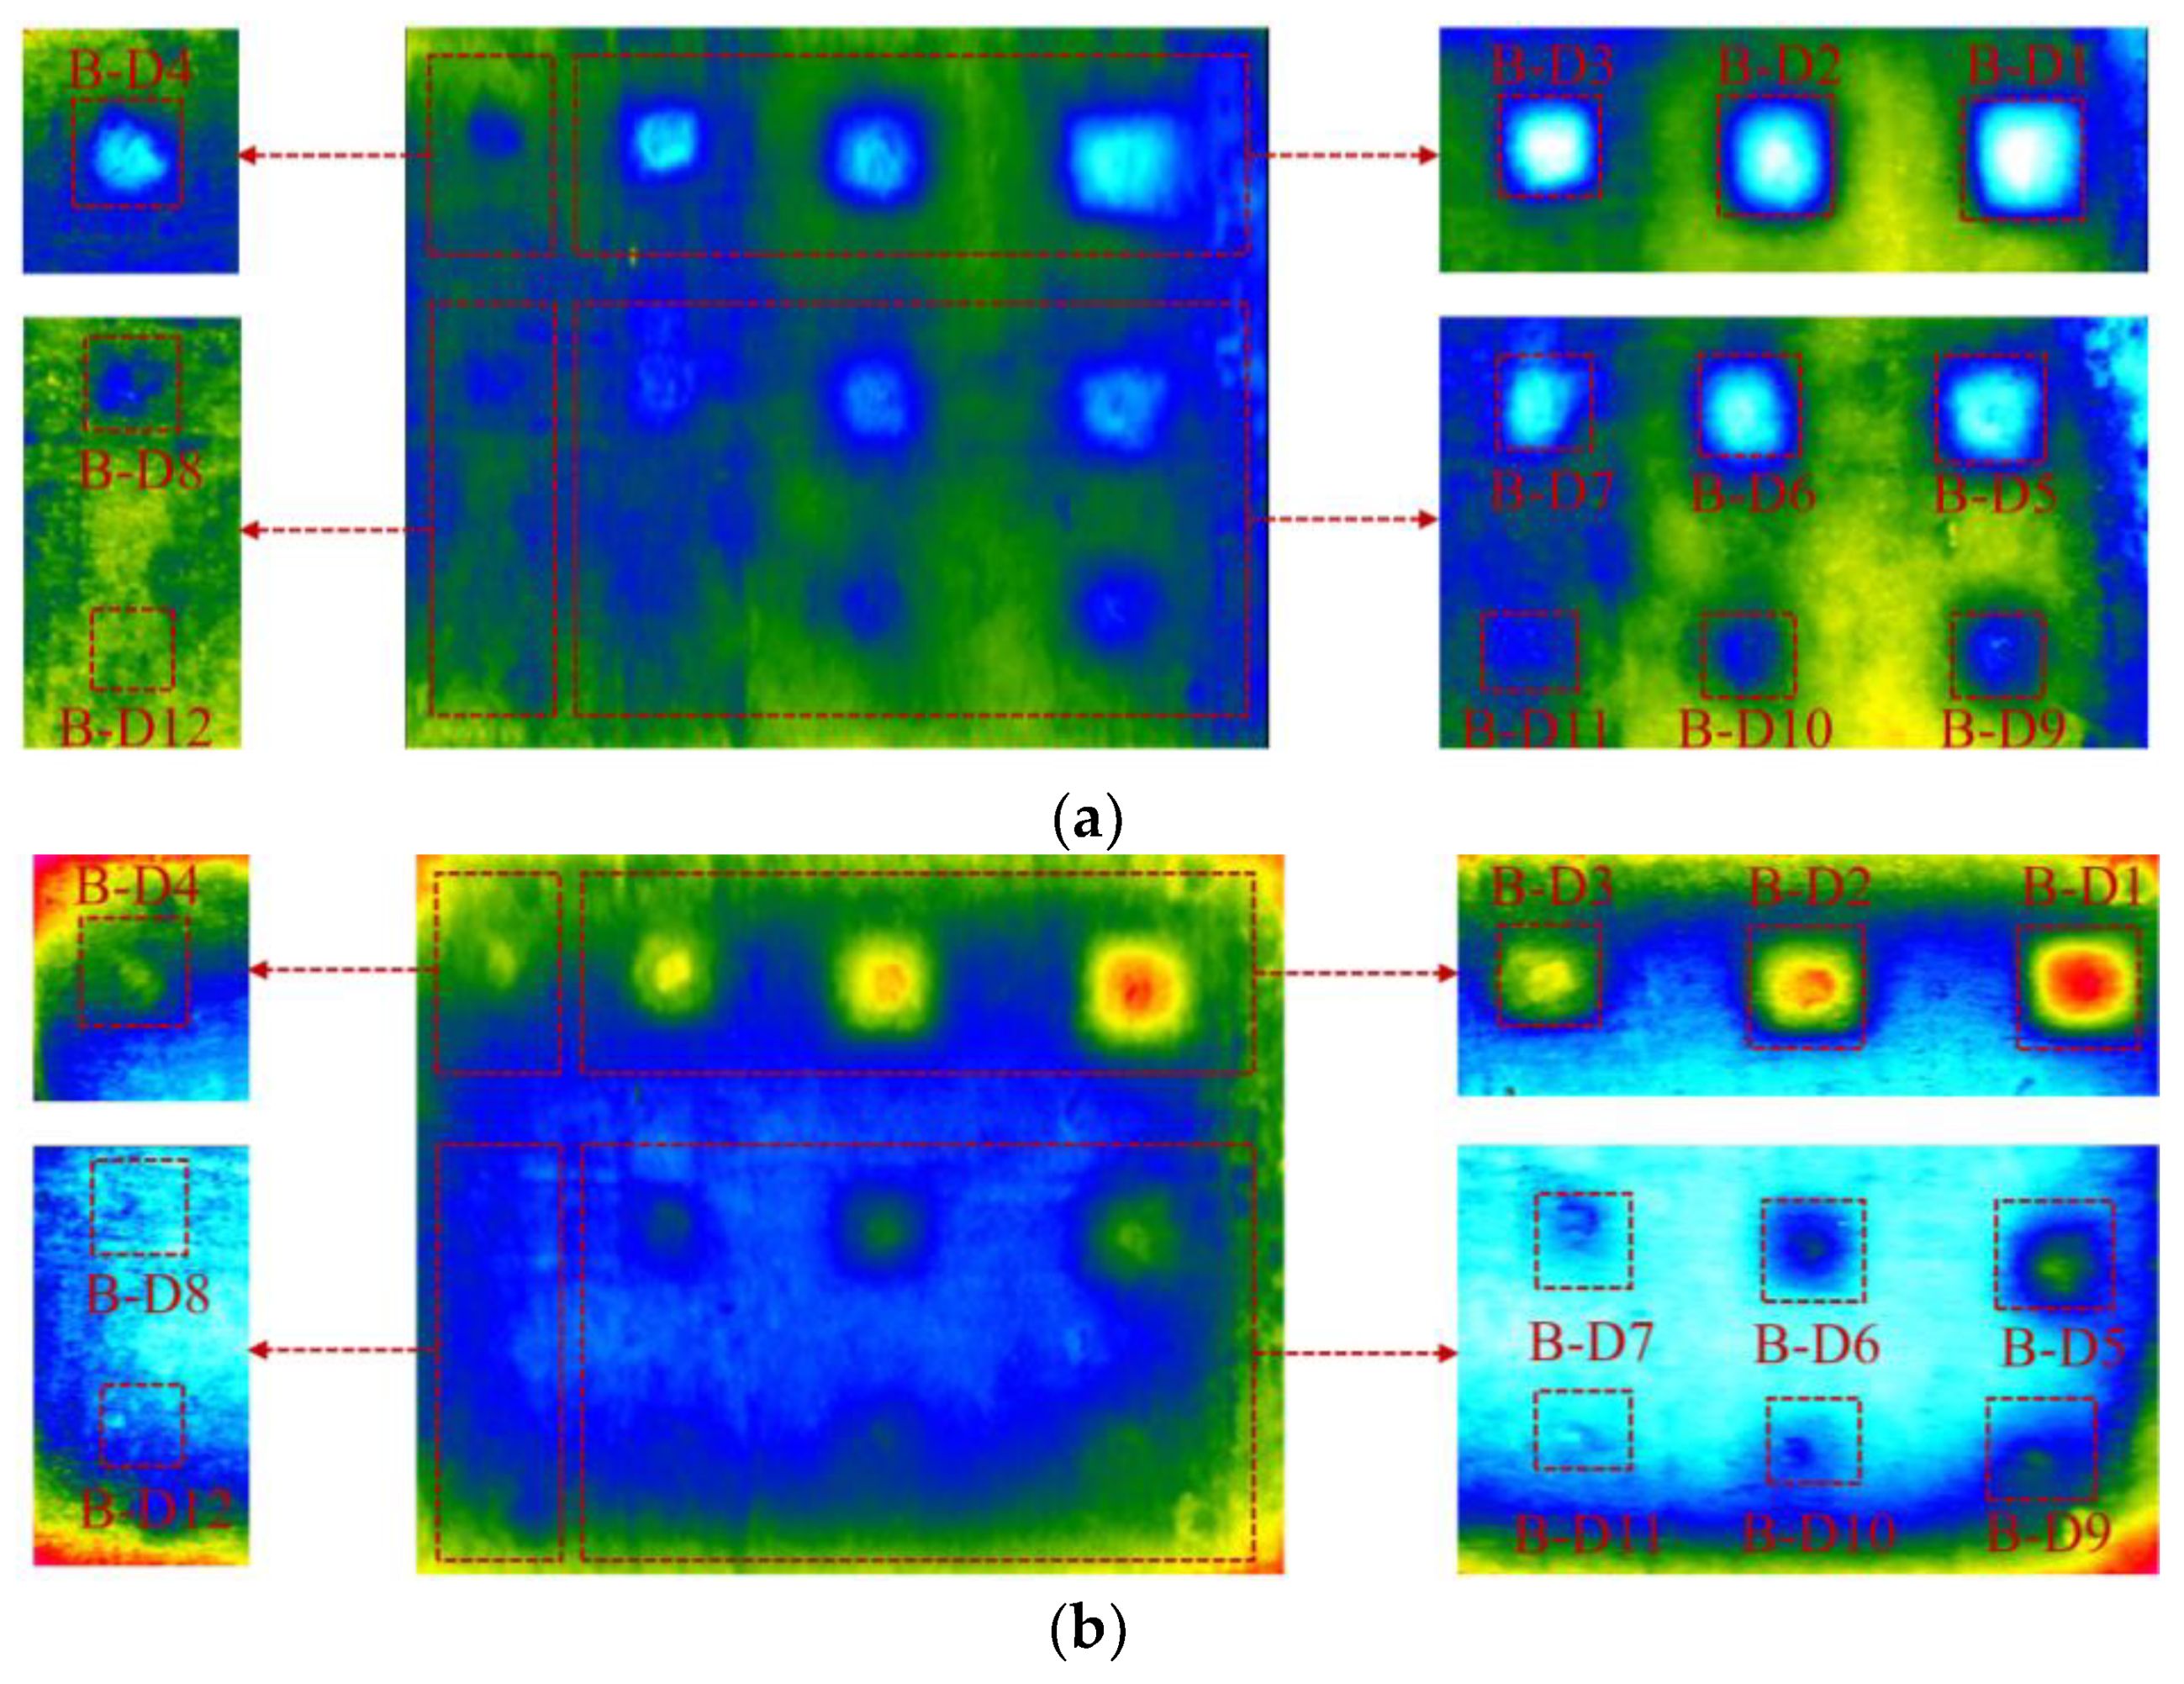
The thermal images of the back face at 11:00 and 20:30 during the sunny day (day 1) are shown in
Figure 11a,b, respectively. There are five images shown in each of the
Figure 11a,b. This is because in the experiment one thermal image was captured for the entire specimen surface, and then four individual thermal images were recorded for four areas of specimen as shown by the red dashed rectangular. The reason in capturing four individual images is to reduce the temperature range of the thermal image for avoiding the misdetection of delamination that may occur if only one thermal image was recorded. There is a gap between the surface temperature above a delaminated area (
Tde) and its surrounding (
Tso). Particularly,
Tde is higher than
Tso owing to the effect of daytime heating (
Figure 11a) while
Tde becomes cooler than
Tso during the nighttime (
Figure 11b). Based on the temperature difference between
Tde and
Tso, delaminations can be observed on the thermal images during both the daytime and nighttime. In this section, the surface temperatures above a defect (
Tde) and its surrounding (
Tso) calculated as the mean value of surface temperatures within “delaminated area” and “sound area” respectively as presented in
Section 5.2. The time when the temperature on the surface above a delamination changes from hotter to cooler in relation to its neighborhood or vice versa is called “interchange period”. The interchange period can be observed more clearly in consideration of the absolute contrast that is discussed in detail in
Section 5.2.
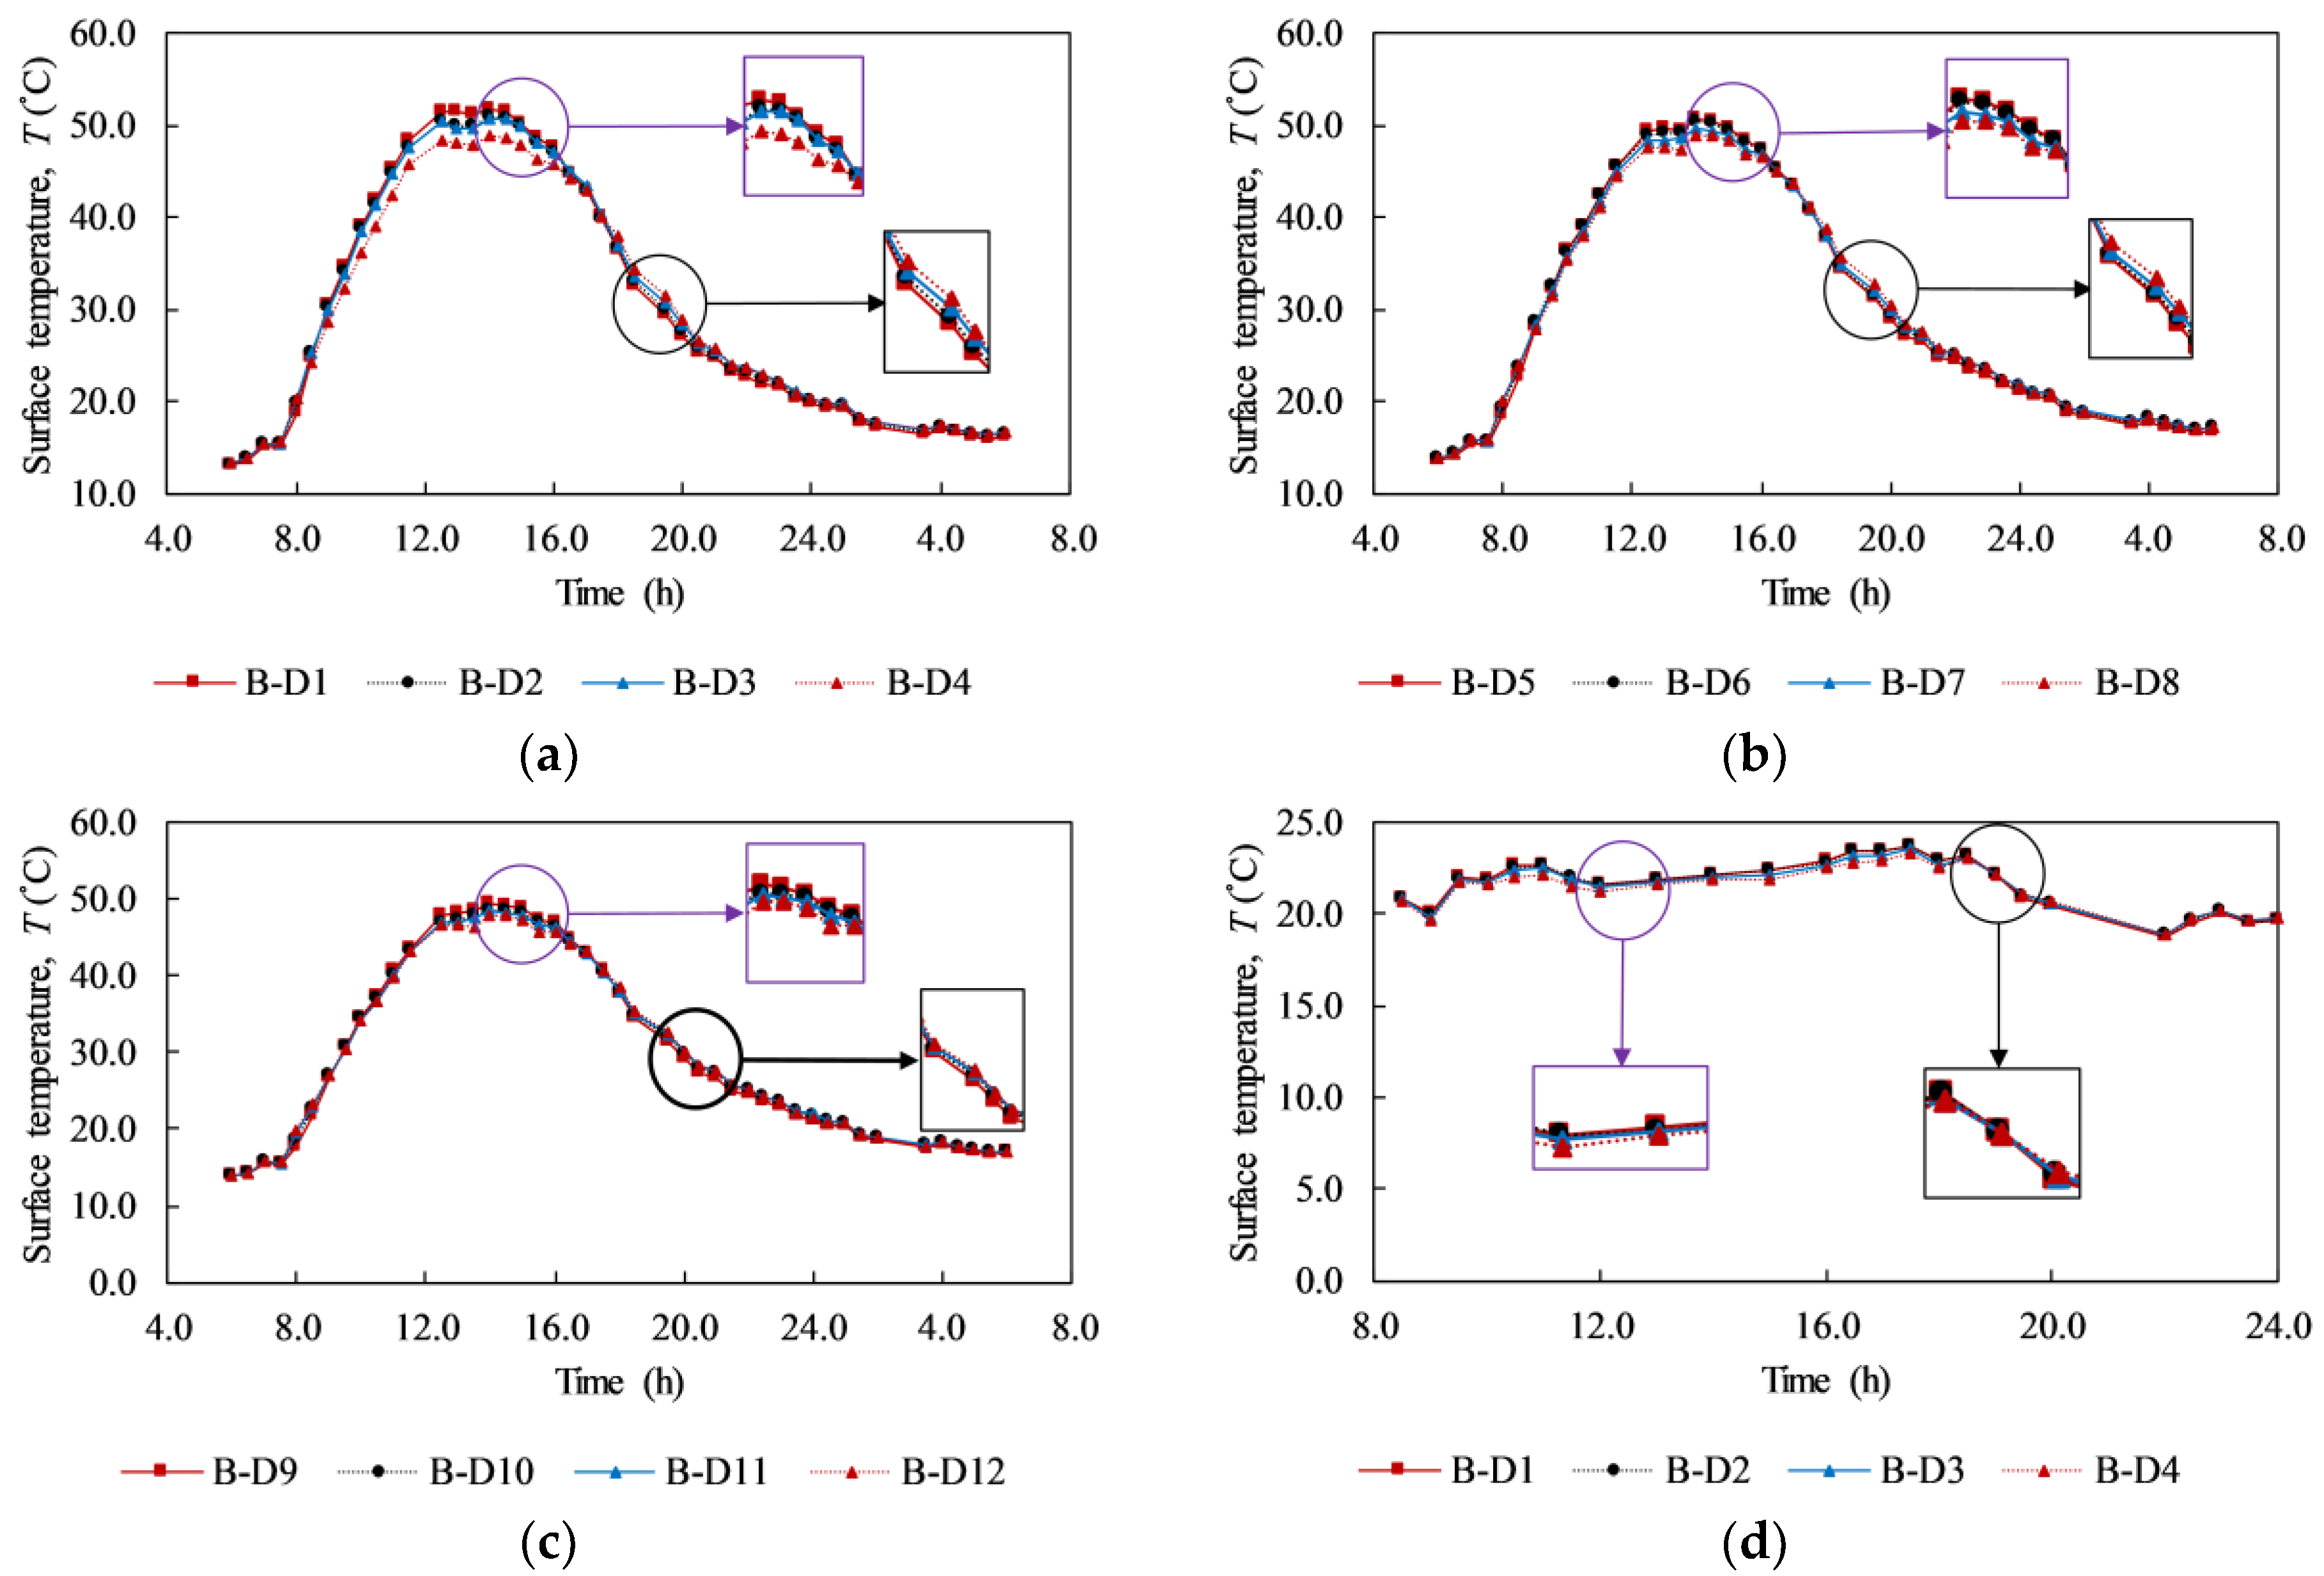
Figure 12 shows the surface temperature (
Tde) within delaminated areas on day 1 and day 2.
Figure 12a–c plot
Tde values during day 1 (the sunny day) for delaminations with depths of 2, 3, and 4 cm, respectively. It should be noted that each graph depicts delaminations that have the same depth but different sizes. Certain key phenomena can be indicated as follows:
First, all
Tde value lines have the same tendency. There is a small increase of
Tde in the first 2 h from 6:00 before it increases considerably and reaches the peak area around noon. Around 13:30, the sky became cloudy, which causes a significant decrease in the surface temperature, as mentioned by Hiasa et al. [
1]. After noon, the surface temperature rapidly drops until 22:00; however, from 22:00 on the previous day to 5:30 the next day the
Tde lines go down with a smaller slope. Then, the surface temperature increases slightly from 5:30 to 6:00 the next day.
Secondly, the effect of the delamination size on the surface temperature of the specimen during daytime and nighttime can be seen clearly. Small figures are added on the graphs in
Figure 12 to zoom out the difference between the
Tde value lines during daytime and nighttime. Overall, with the same depth, a larger delamination has a higher surface temperature than a smaller one during daytime while it becomes smaller during nighttime. For example, at 14:00, the surface temperatures are 51.66, 50.83, 50.72, and 48.81 °C corresponding to delaminations B-D1, B-D2, B-D3, and B-D4, as indicated in
Figure 12. For the same set of delaminations, the observed surface temperatures are 27.00, 27.64, 28.37, and 28.90 °C at 20:30. The reason for this phenomenon is the effect of the trapped heat volume. During daytime, the trapped heat volume is developed above delamination under the heat energy from the sun. However, at the same depth, in comparison to a larger delamination, the trapped heat volume of a smaller delamination has a smaller intensity and diffuses more significantly in all directions leading to the decrease in the surface temperature [
45]. During nighttime, the heat energy is radiated back into the air from the ground; thus, the volume of trapped heat is located under the delamination. Therefore, a higher surface temperature above a smaller delamination compared to a larger one is observed during nighttime.
The surface temperature above the delaminations with different sizes at a depth of 2 cm during the rainy day is presented in
Figure 12d. There is no tendency in the surface temperature change during daytime and nighttime compared to the sunny day. During the rainy day, a slightly higher surface temperature can be produced in the case of a larger delamination, but it is quite difficult to observe this as the difference is small. For instance, at 12:00 the surface temperature above delamination B-D1 (21.66 °C) has a slightly higher value (0.01 °C) than delamination B-D2 (21.65 °C).
5.2. Absolute Contrast
Contrast-based methods are the simplest image processing techniques that can be applied to enhance the thermograms quality. Even though a requirement of selection of sound area is the disadvantage of these methods, they are still the most common techniques utilized to preprocess image sequences [
18,
28]. In this study, in order to evaluate the detectability of delaminations with different WTDRs using passive IRT, the absolute contrast (Δ
T(t)), which is defined as the temperature difference above a defect (
Tde(t)) and its neighborhood (
Tso(t)) at the same time, as shown in Equation (3), is employed [
28].
The selection of areas of region of interest (ROI) used to compute
Tde(t) and
Tso(t) is depicted in
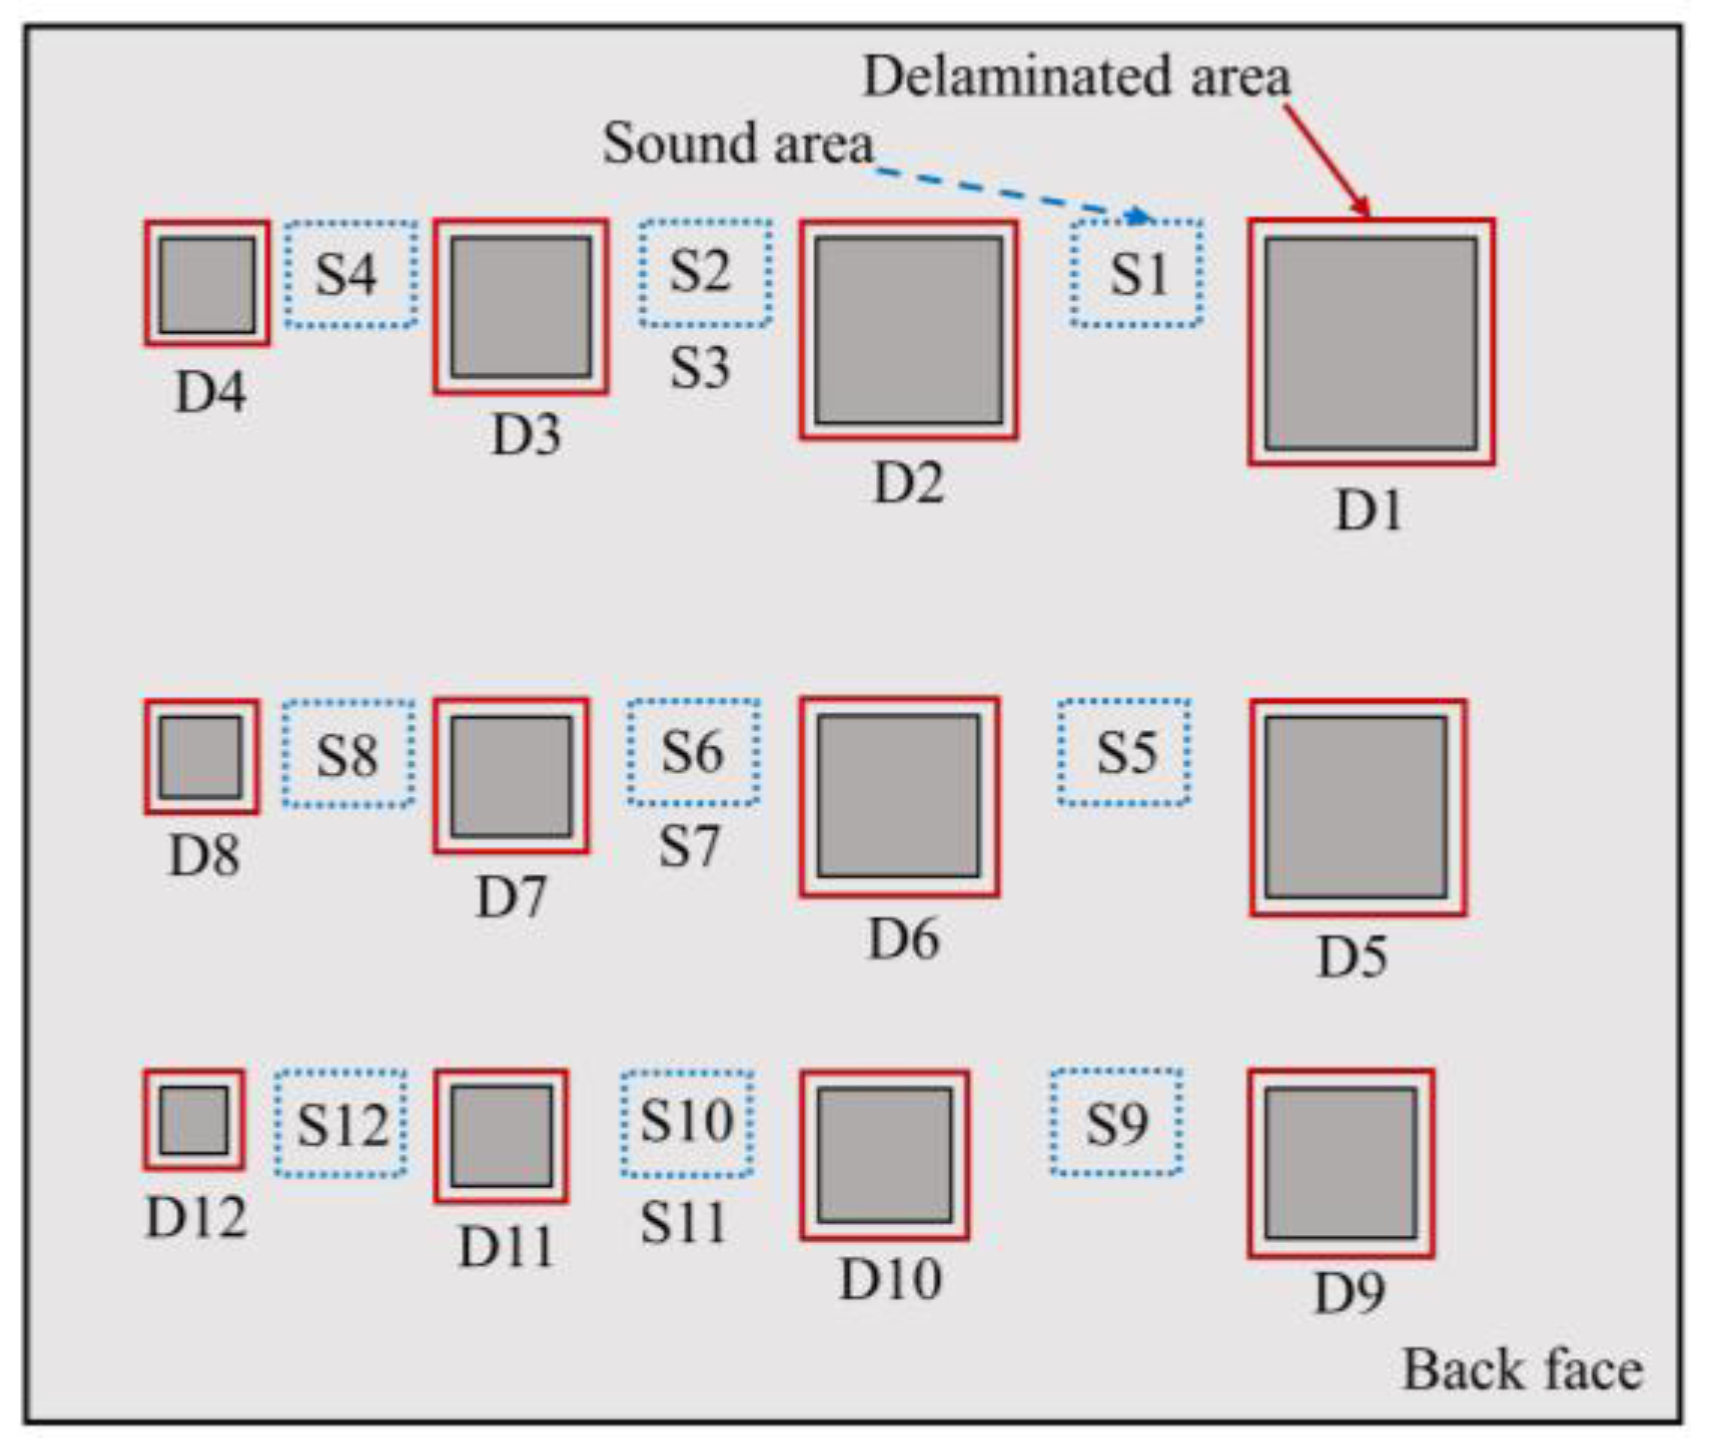
Figure 13, where
Tde(t) is the average surface temperature of a ROI above a defect, called as the “delaminated area” whereas
Tso(t) is determined from of a ROI nearby the delamination denoted as the “sound area”. The average surface temperature is employed as mentioned by Vaghefi in 2013 that is more effective compared to only one pixel or a group of three pixels [
26,
52,
53]. The size of delaminated areas is similar with the dimension of respective delamination while the size of all sound areas is same (around of 8 cm × 8 cm). Nine sound areas at the middle position of defects are selected for twelve delaminations. The level of upper edges of delaminated and sound area for each delamination are similar. There are three couples of delaminations at the middle region of specimen (D2 and D3, D6 and D7, D10 and D11) in which each pair refers to the same sound area to avoid the misdetection phenomenon. As per the ASTM Standards, a delamination is considered as detectable if the amplitude of the absolute contrast (Δ
T(t)) known as “temperature difference” is 0.5 °C or higher [
51]. Thus, this threshold is used in our present study. The higher the absolute contrast, the greater the certainty that delamination may appear.
In the experiment, delaminations with depth of 5, 6, and 7 cm (F-D1 to F-D12) were not detected at any given time during the test (day 3 and day 4). Then, the absolute contrast is analyzed focusing on the back face that delaminations (B-D1 to B-D12) are located at depths equal to or less than 4 cm (day 1 and day 2).
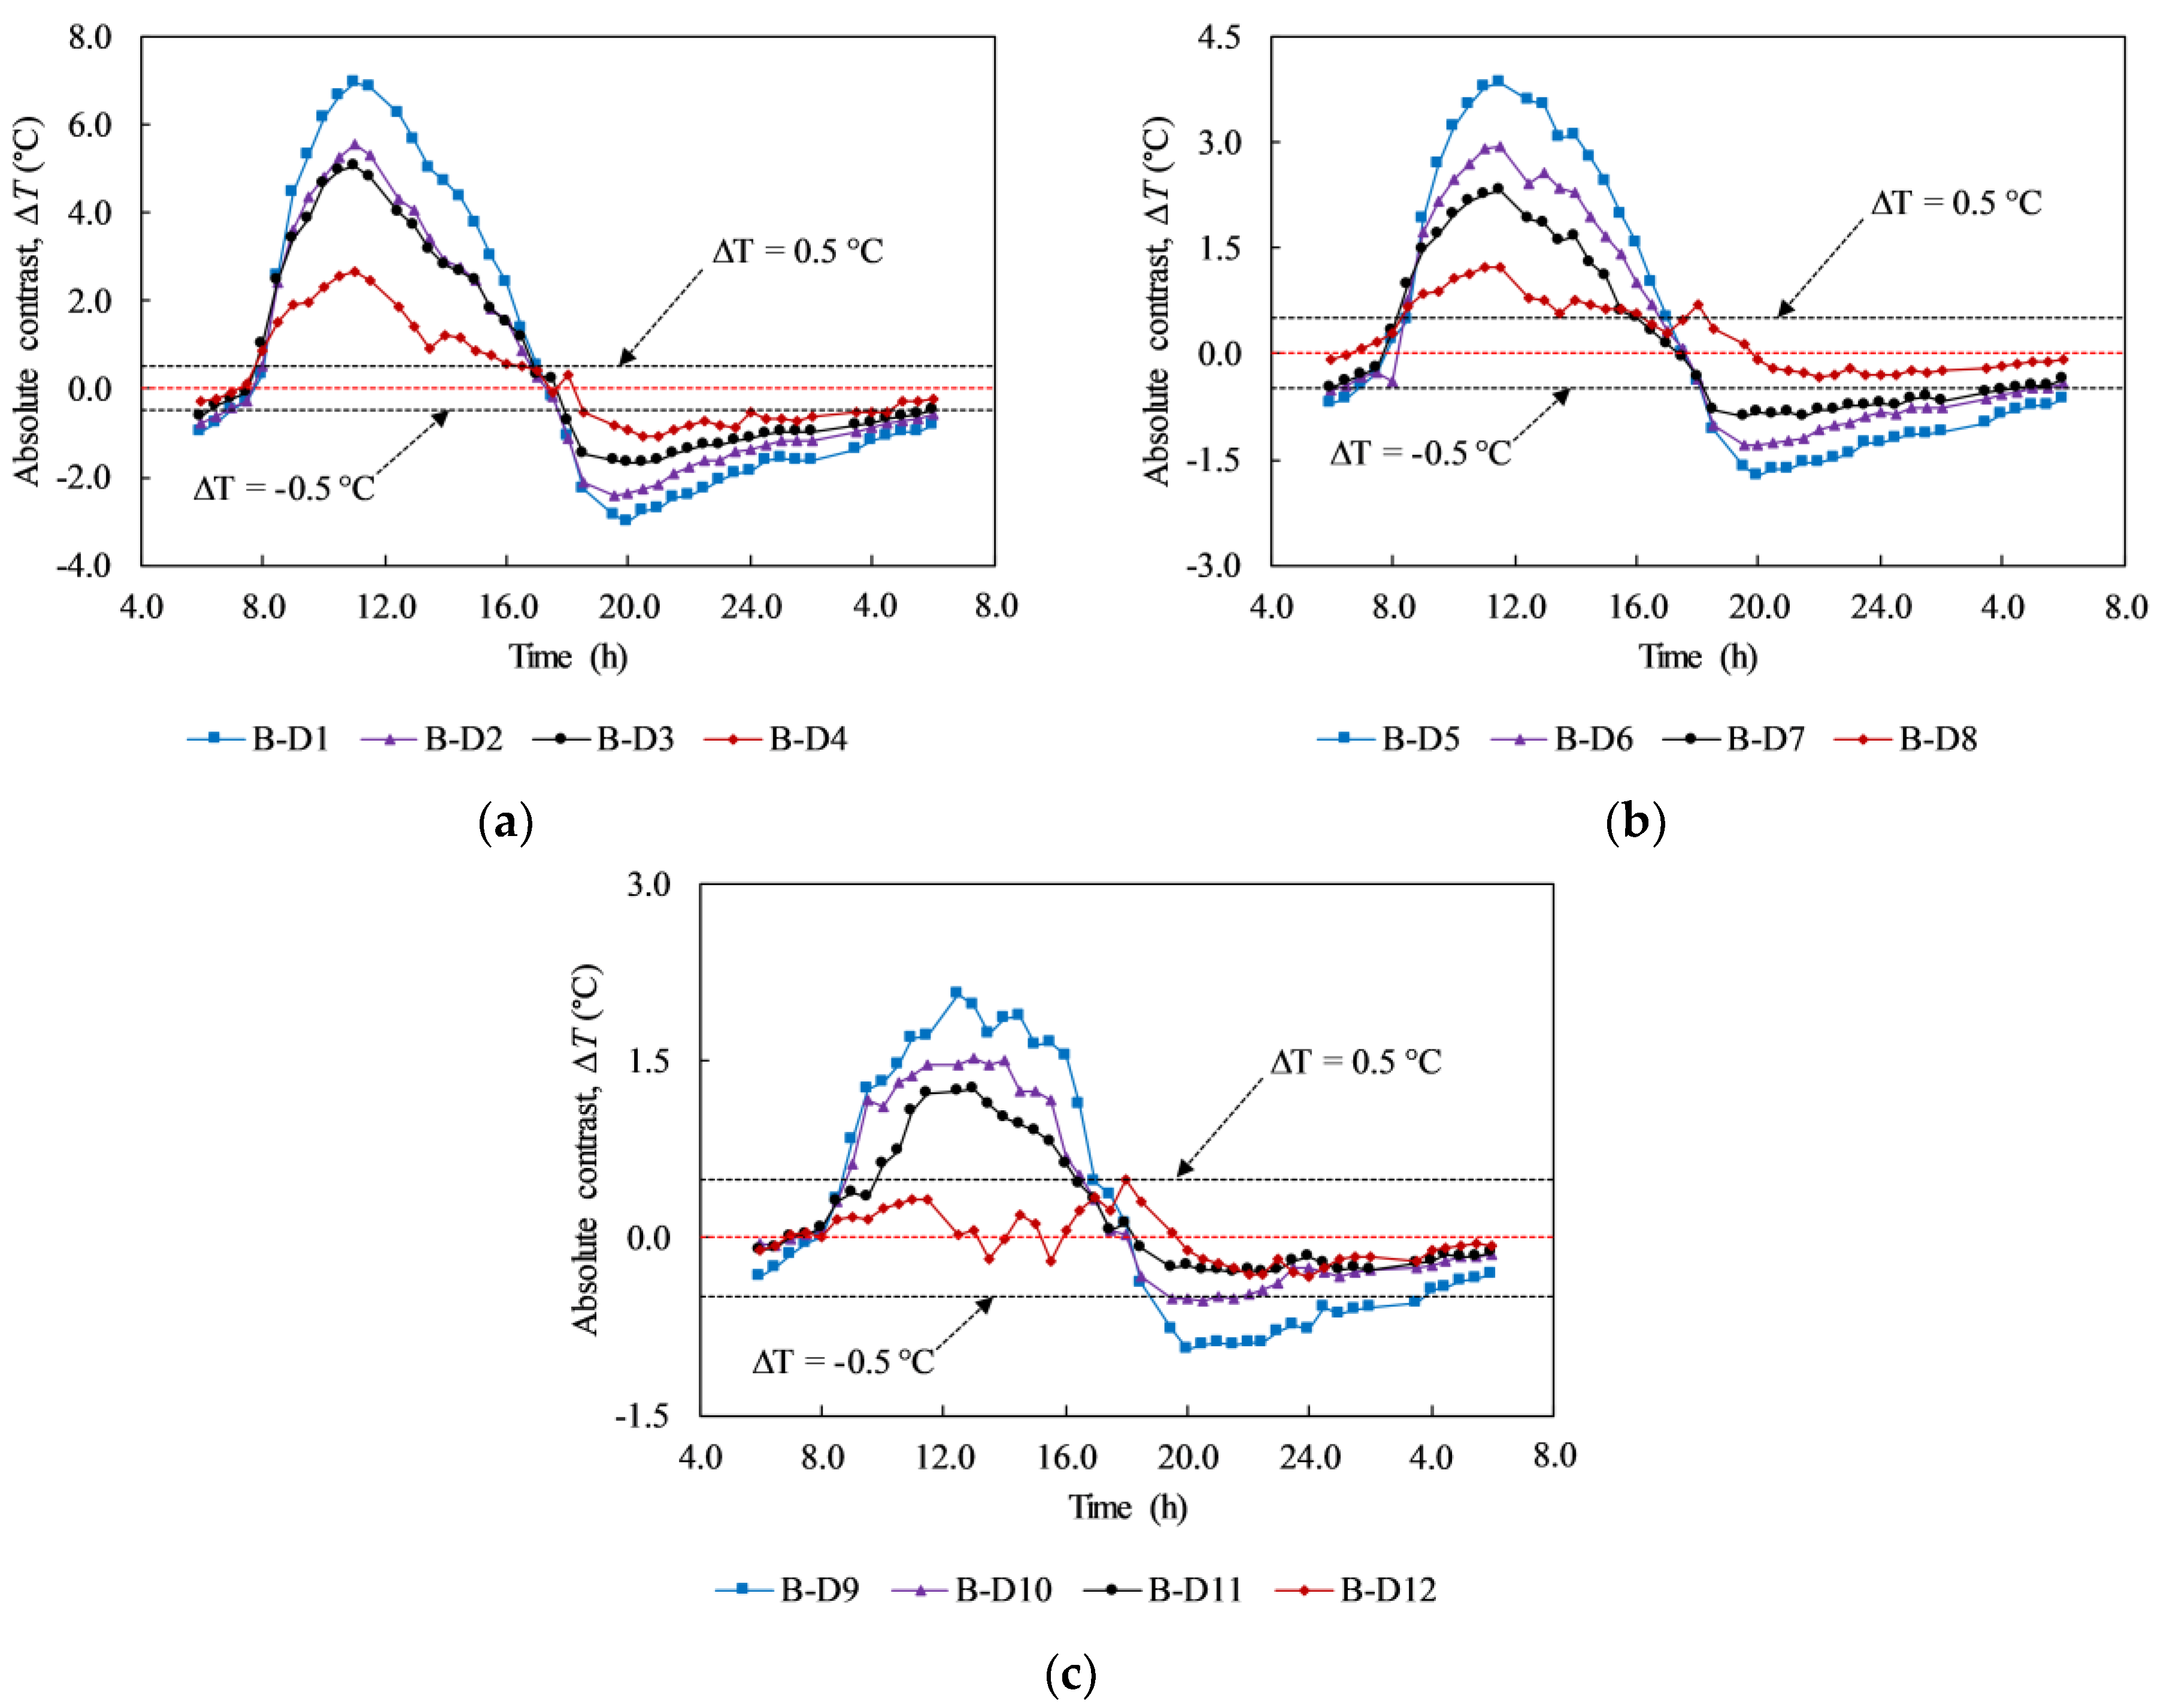
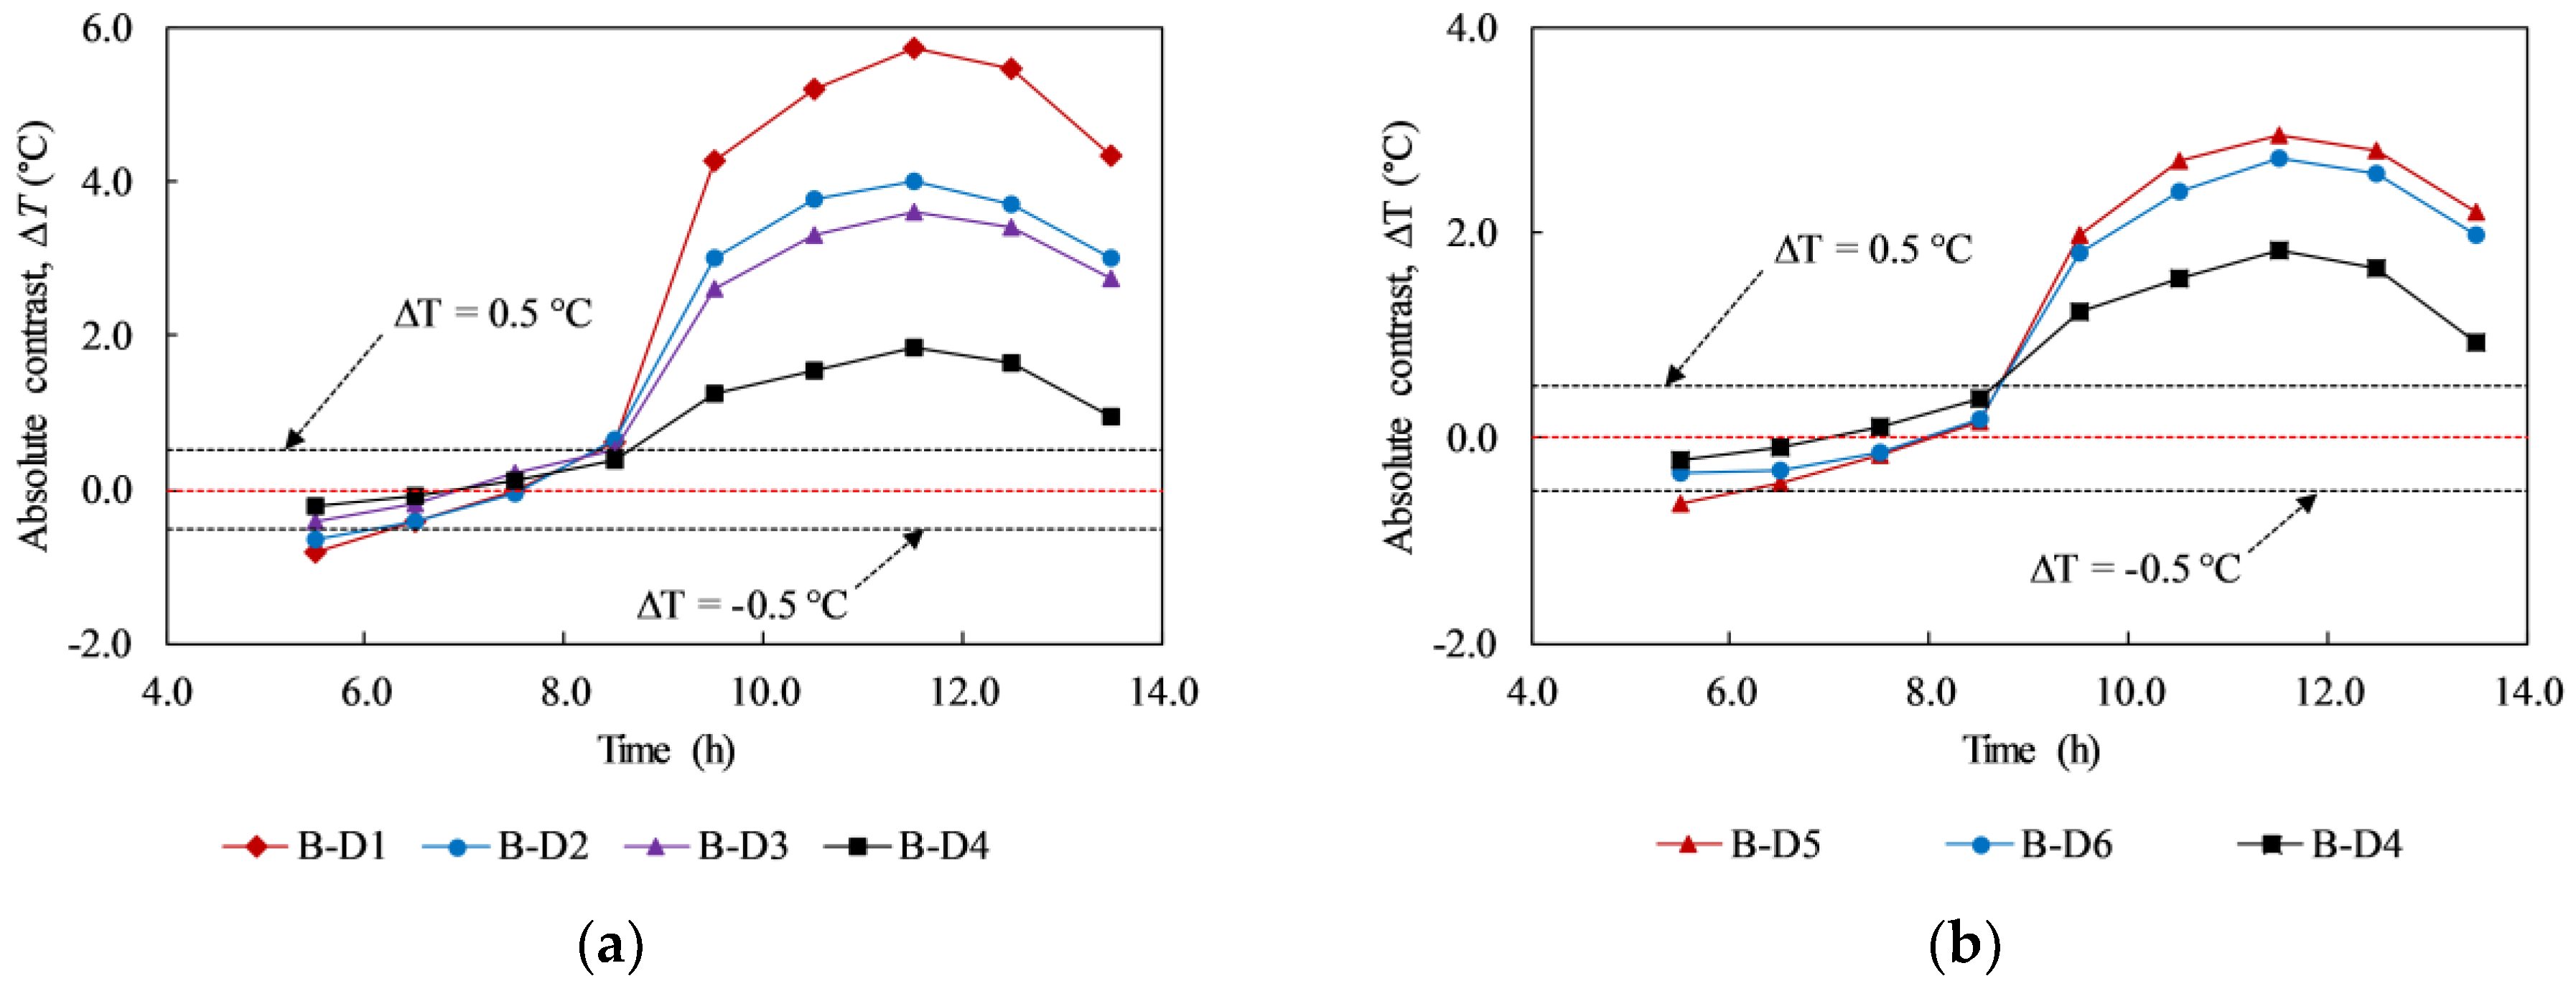
Figure 14 shows the absolute contrast of all delaminations during the sunny days. In each graph, delaminations with the same depth but different sizes are depicted. The absolute contrast profiles have a similar tendency in comparison with the surface temperature and ambient temperature. In general, the absolute contrast increases quickly and reaches a positive peak value around noon. After that, it reduces and attains the maximum negative value before increasing again during early morning in the next day.
Owing to the formation of the volume of trapped heat under the daytime heating effect, the surface above a delamination becomes warmer than its surrounding while it is cooler at night because of the nighttime cooling effect. It is shown in the graphs in
Figure 14 that there are two interchange periods between positive values (daytime heating effect) and negative values (nighttime cooling effect) of the absolute contrast. The first interchange period occurred due to the shift from cooling effect during the nighttime to heating effect during the daytime, while the second period is caused by the change from the daytime heating effect to the nighttime cooling effect. At the interchange period, delaminations cannot be observed by the IR camera because the temperature difference between the delaminated area and sound area is small (≤0.5 °C). The interchange period lasts for approximately 2 h during both the morning time (from 6:00 to 8:00) and afternoon time (from 16:30 to 18:30) under the given experimental conditions.
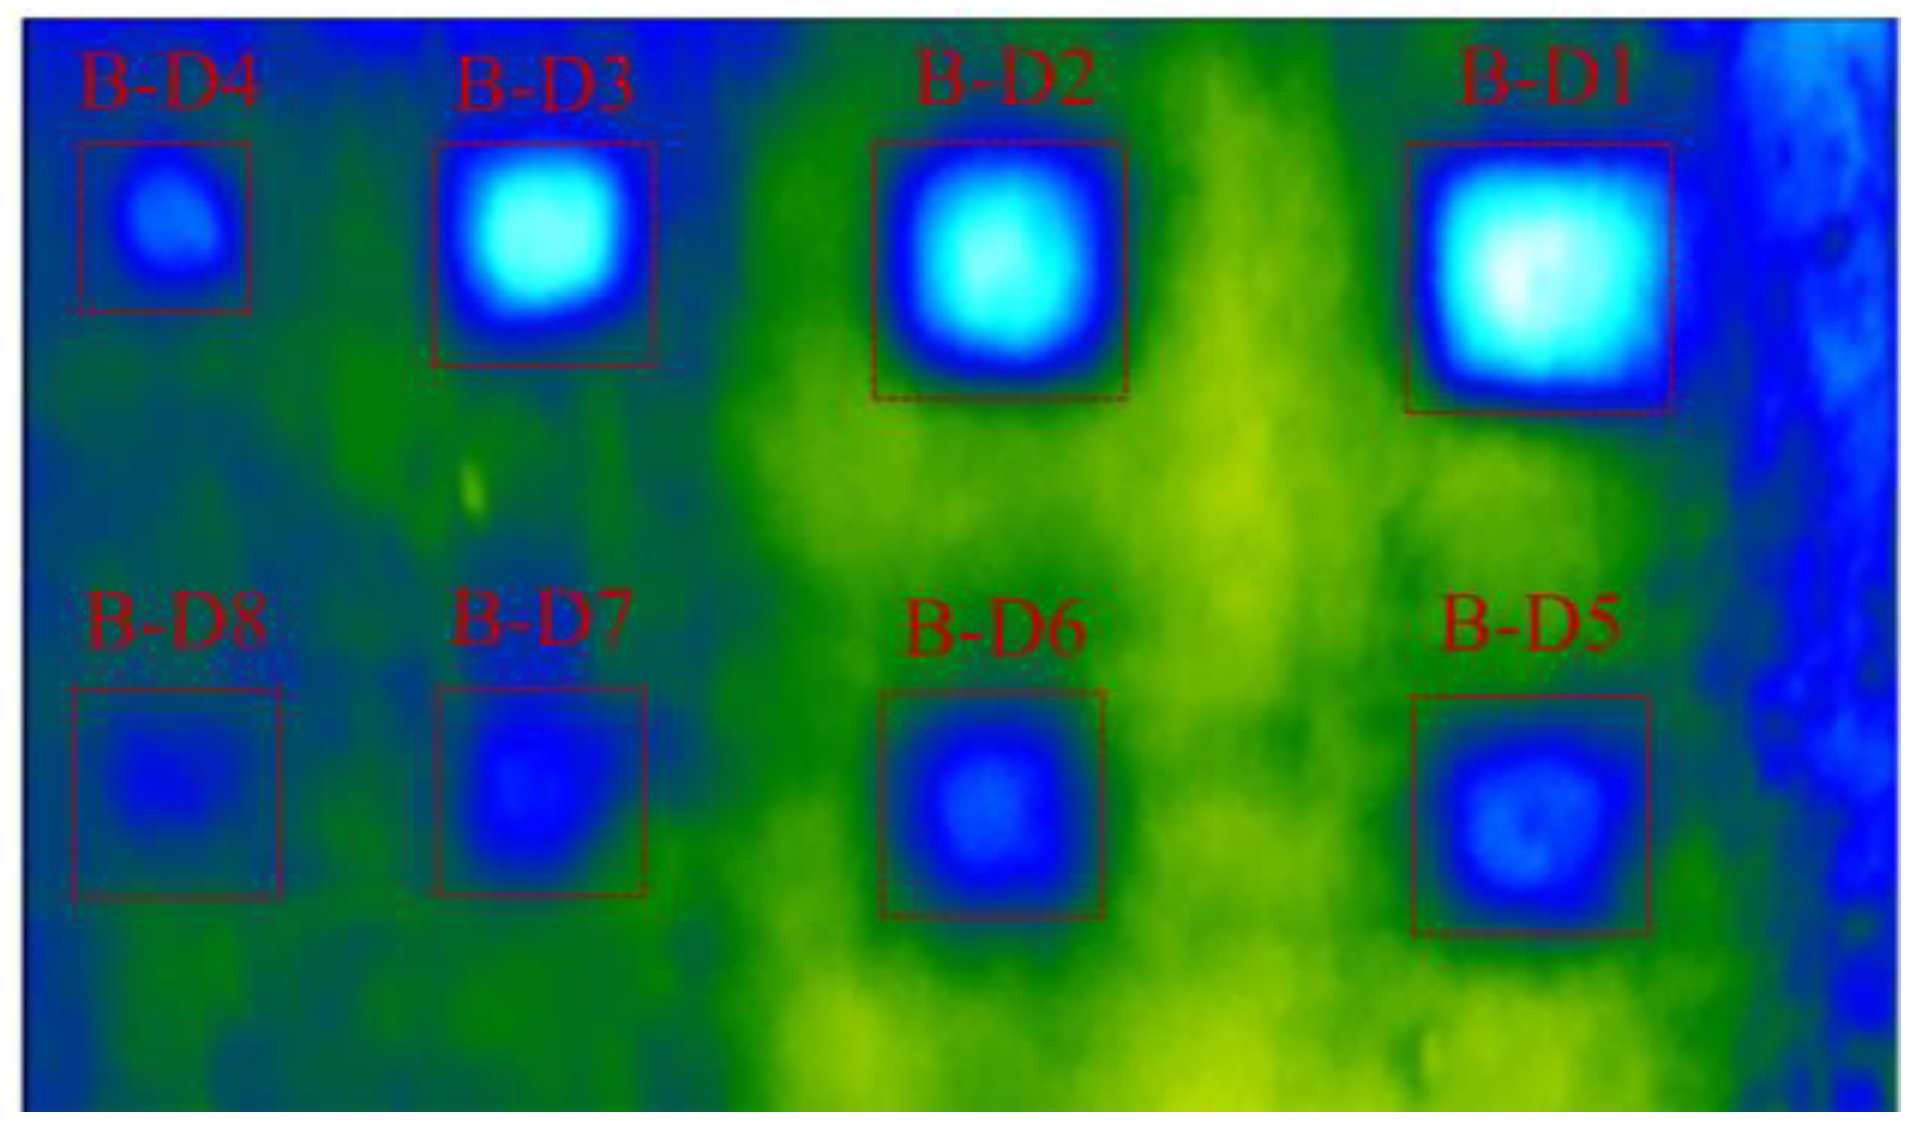
The effect of the size of delaminations on the temperature difference is studied as well. Under the heating effect during daytime and cooling effect during nighttime, a larger delamination produces a higher temperature difference than a smaller delamination. This phenomenon is caused by the intensity of the trapped heat volume and effect of the diffusion heat. For example, at 11:30, the temperature difference of delaminations B-D1, B-D2, B-D3, and B-D4, which have the same depth of 3 cm and different sizes of 13.5, 12.0, 9.0, and 6.0 cm, respectively, corresponds to 6.86, 5.32, 4.80, and 2.48 °C. This implies that delamination B-D1 can be observed more clearly than delaminations B-D2, B-D3, and B-D4 on the thermal image, as illustrated in
Figure 15.
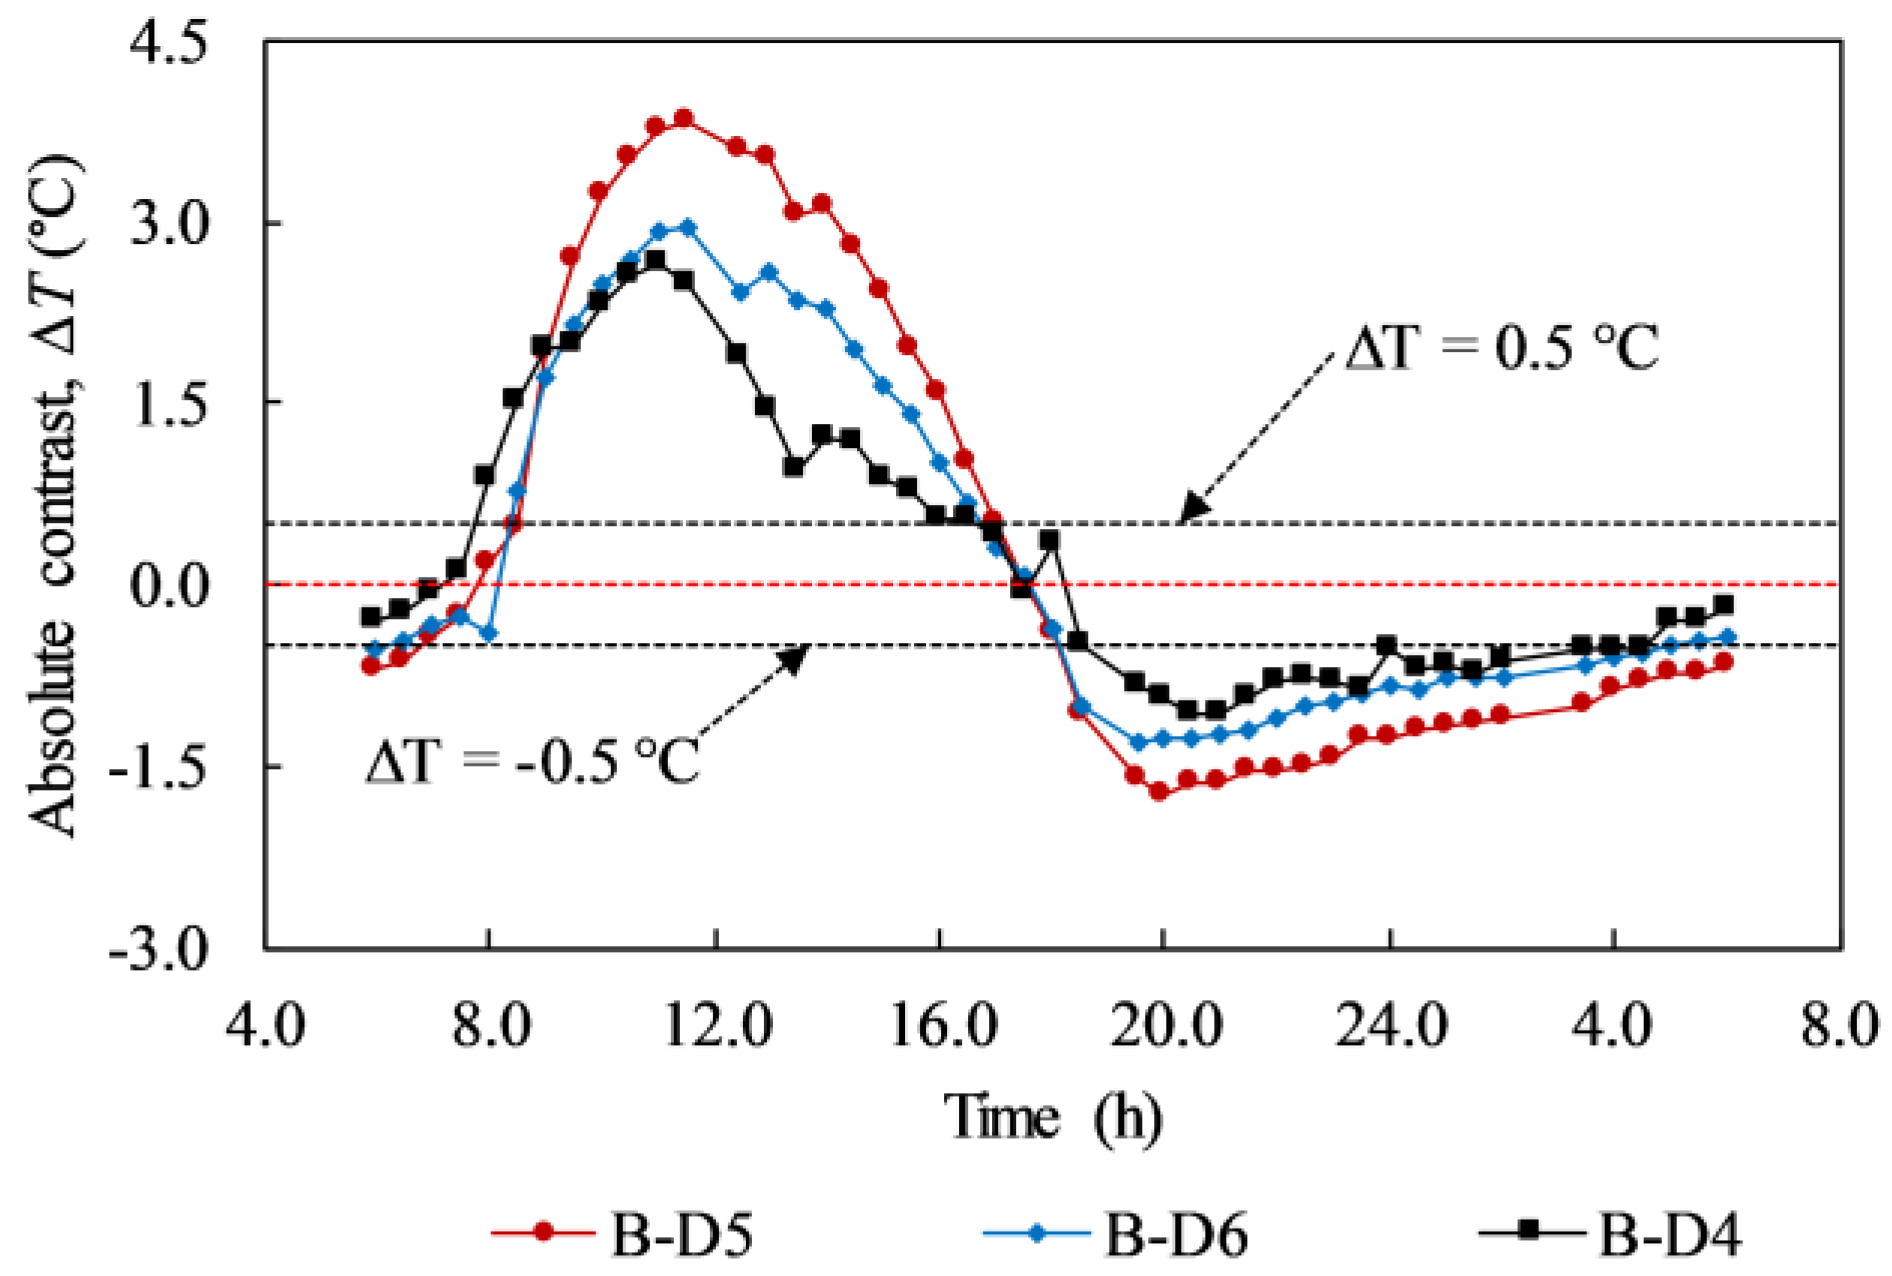
In terms of WTDR, it is indicated that a larger WTDR delamination can produce a higher temperature difference than a smaller WTDR one at the same depth. In addition, the conclusion can be given from the present study that a delamination, which has a larger WTDR, can produce a higher temperature difference even though it is located at greater depth than a smaller delamination as shown in
Figure 16. For example, in
Figure 16, delamination B-D5 and B-D6 obtained temperature differences of 3.84 °C and 2.94 °C whereas delamination B-D4 attained a temperature difference of 2.48 °C at 11:30. Moreover, the temperature differences are 1.73 °C, 1.28 °C, and 0.82 °C corresponding to delaminations B-D5, B-D6, and B-D4 at 20:00. Therefore, delamination B-D5 and B-D6 can appear more certainly than B-D4 during both the daytime and nighttime (
Figure 11 and
Figure 15). Furthermore, a delamination placed at a relatively greater depth experiences a time delay to obtain the maximum temperature difference than a delamination located at a relatively shallower depth from the surface as demonstrated in
Figure 16. In detail, delaminations B-D5 and B-D6 achieve the maximum temperature difference at 11:30 whereas delamination B-D4 obtains the maximum temperature difference at 11:00.
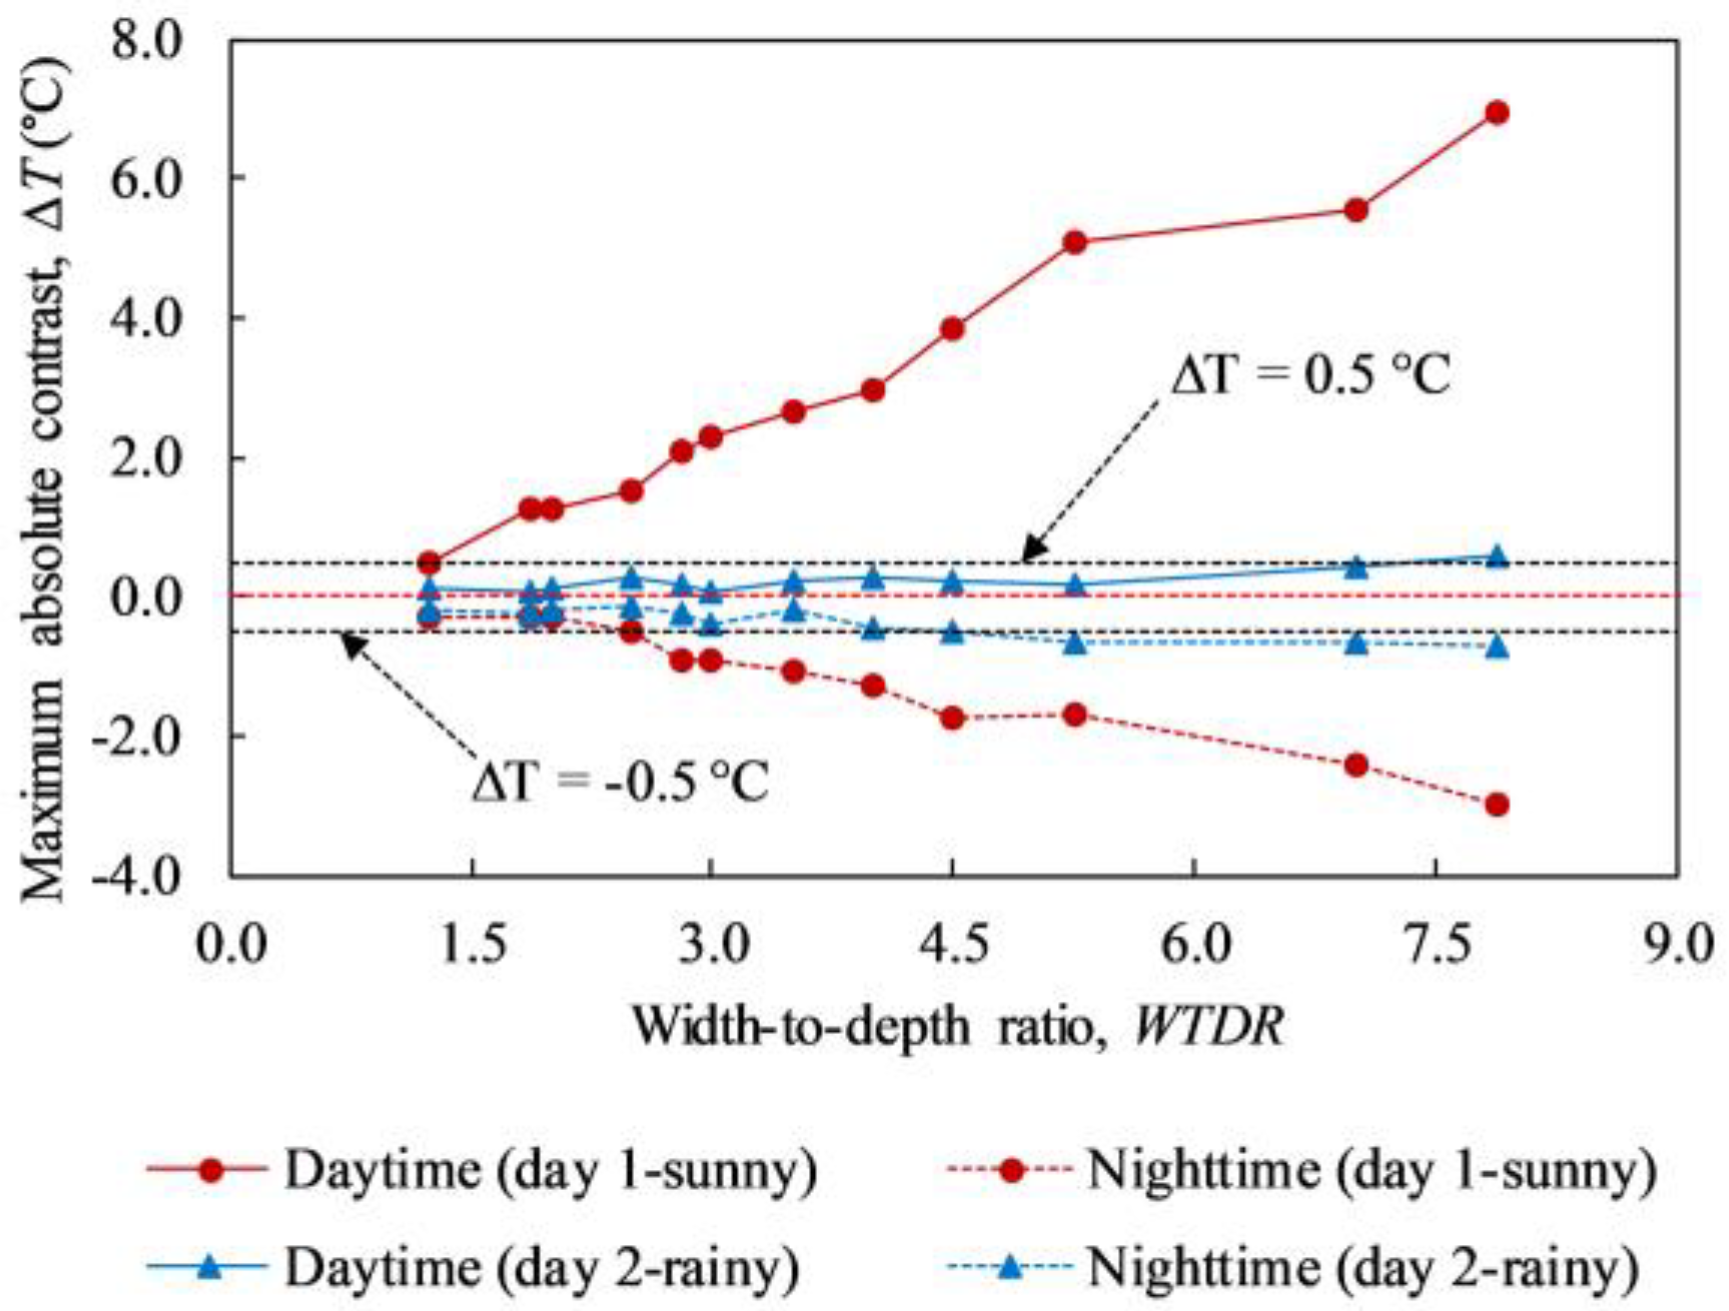
The maximum absolute contrasts of all delaminations composed in this study are graphically depicted in
Figure 17. The red solid and red dashed line represent the maximum absolute contrast during daytime and nighttime on a sunny day, respectively. It can be concluded that a higher WTDR delamination obtains a greater maximum temperature difference than a smaller WTDR delamination on a sunny day. The maximum temperature difference rises from 0.49 °C to 6.95 °C (positive value) and from 0.32 °C to 3.00 °C (negative value) corresponding to the daytime and nighttime when the WTDR increases from 1.25 to 7.9. However, under the effect of rain, the above-mentioned trend is not observed clearly although the maximum temperature difference may tend go up with the rise of WTDR, as indicated in
Figure 17. In addition, almost all delaminations obtain the maximum temperature difference smaller than 0.5 °C. Thus, it is recommended that the concrete bridge deck inspection must not be conducted while it is raining or after rain.
5.3. Detection of Delamination
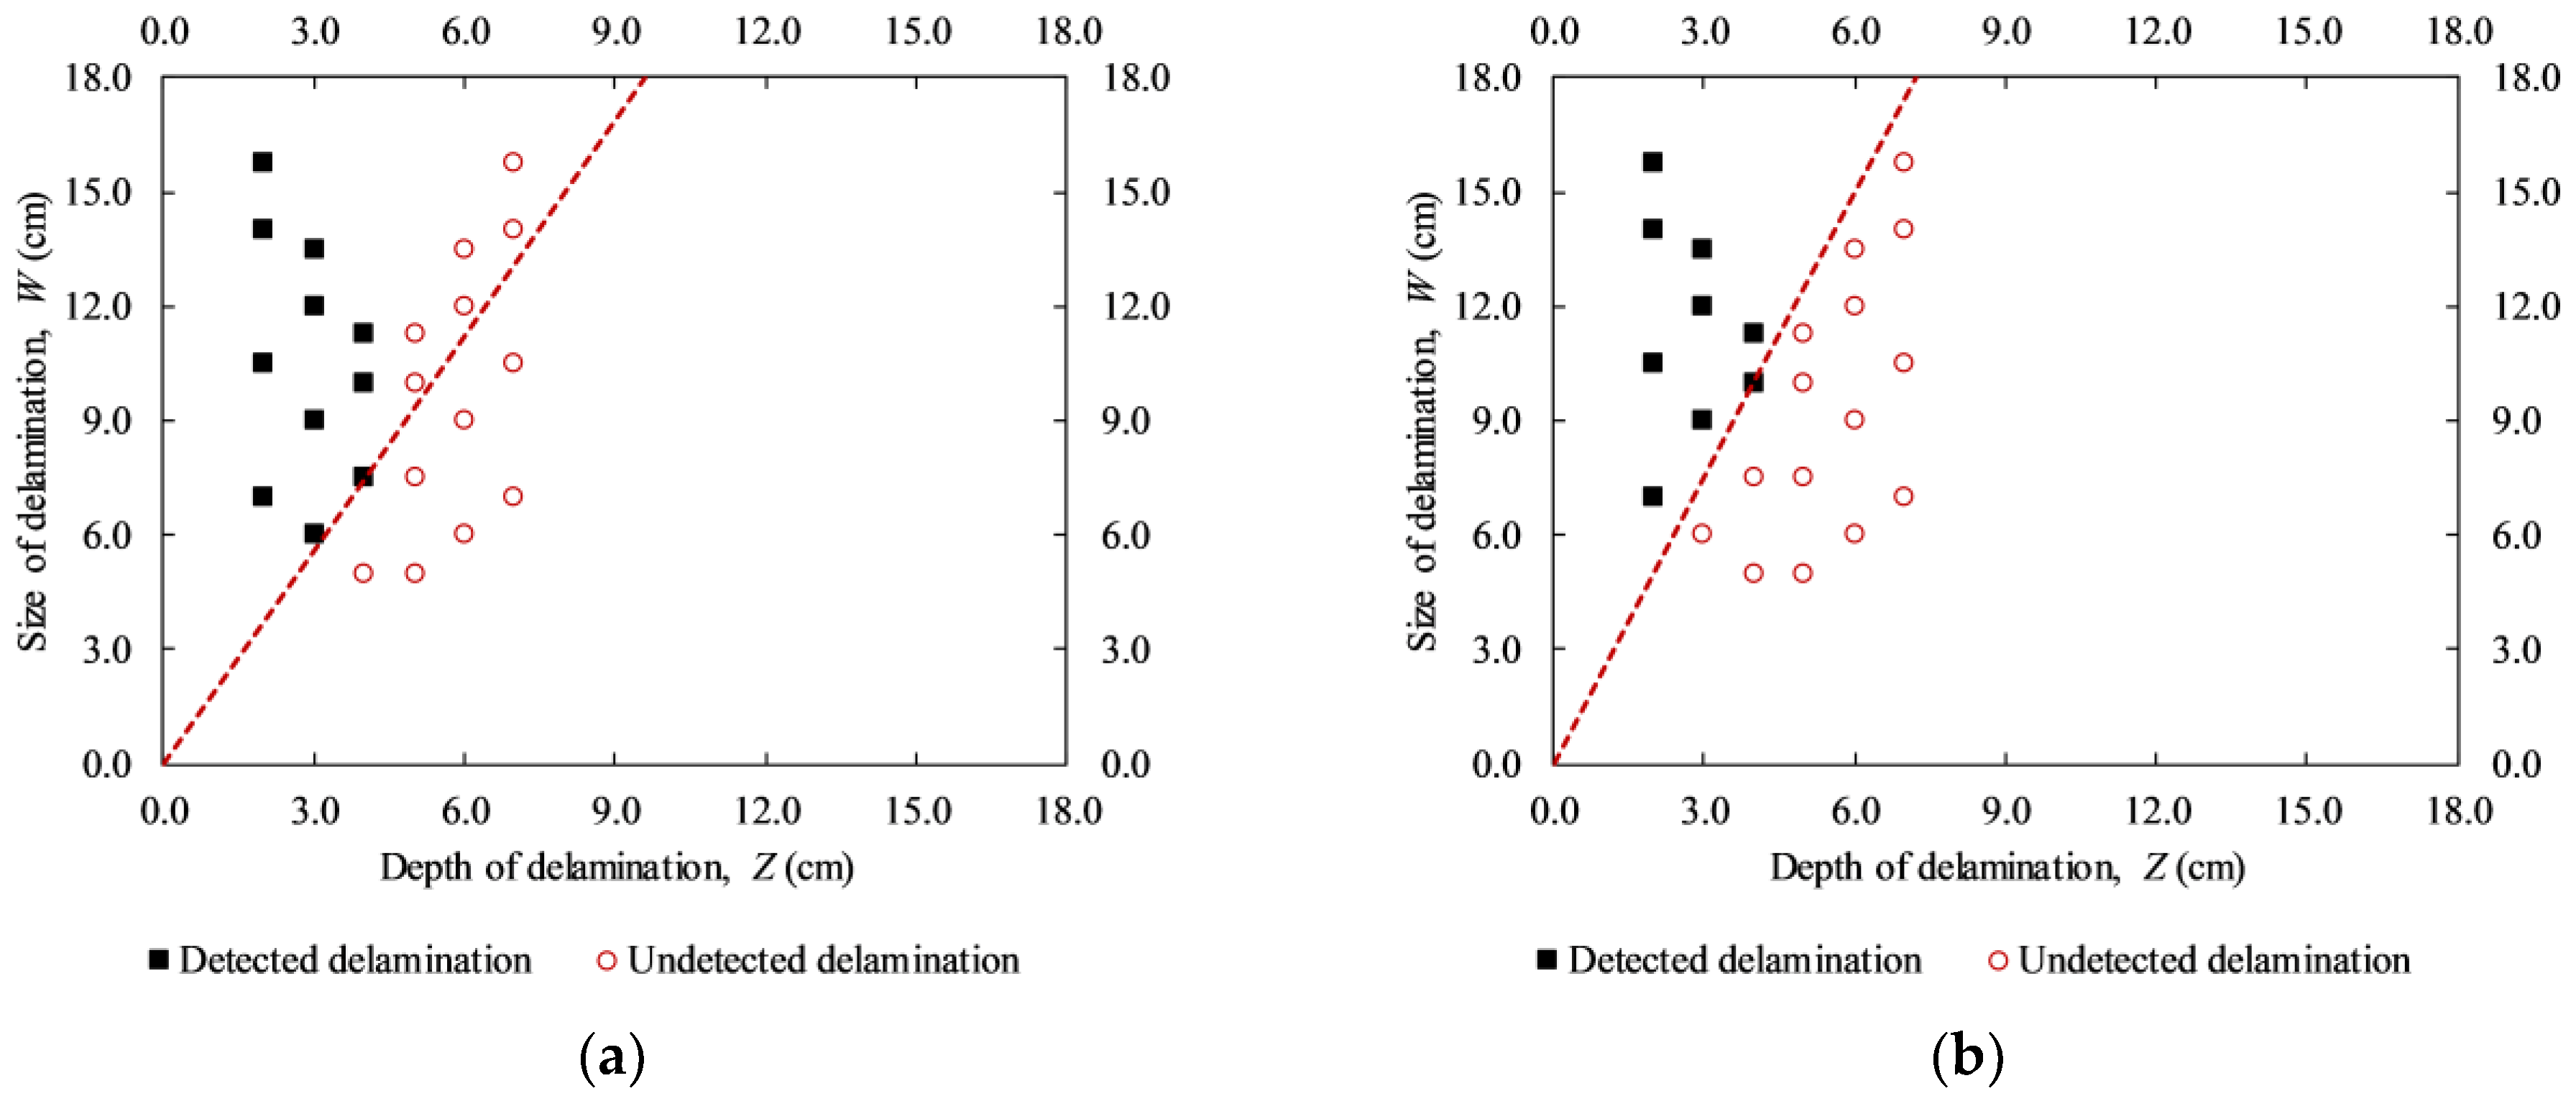
The detectability of delaminations during both daytime and nighttime on the sunny day are pointed out in
Figure 18. The black filled-in squares and red unfilled-in circles represent detected and undetected delaminations respectively. It should be noted that delaminations with depths equal to or higher than 5.0 cm and the given sizes in this study were not detected. Thus, the red dashed line is used to divide the graph into two regions: detectable and undetectable regions, considering delaminations with depths equal to or smaller than 4.0 cm.
In
Figure 18, the horizontal axis shows the delamination depth while the vertical axis is for the delamination size; hence the detectability of delaminations can be indicated in terms of WTDR. Certain conclusions can be given based on
Figure 18 and information presented under
Section 5.2 as follows.
For delaminations with depths higher than 4.0 cm (F-D1 to F-D12) on both sunny and cloudy days (day 3 and day 4): All delaminations could not be detected at any given time of the experiment period. This implies that it is impossible to identify delaminations with depths deeper than 4.0 cm and WTDRs equal to or smaller than 2.25 under the conditions of this study.
For delaminations with depths equal to or smaller than 4.0 cm (B-D1 to B-D12) on the sunny day (day 1): In the daytime, the dashed line has a slope of 1.9 that implies a delamination whose size is not smaller than 1.9 times its depth (WTDR ≥ 1.9) may be detected (
Figure 18a). However, a delamination with a WTDR of 1.9 could not be identified during the nighttime (
Figure 18b). The WTDR during the nighttime should be at least 2.5 for a delamination to become detectable (the dashed line with a slope of 2.5).
For delaminations with depths equal to or smaller than 4.0 cm (B-D1 to B-D12) on the rainy day (day 2), delamination could hardly be identified.
5.4. Effective Time for Delamination Detection
In passive IRT, the favorable time in capturing thermal images is a very important factor in order to be applied effectively to real structure inspections. On the rainy day (day 2), almost all delaminations could not be detected owing to the small temperature differences. Therefore, the concrete bridge deck inspection should be carried out on a sunny day.
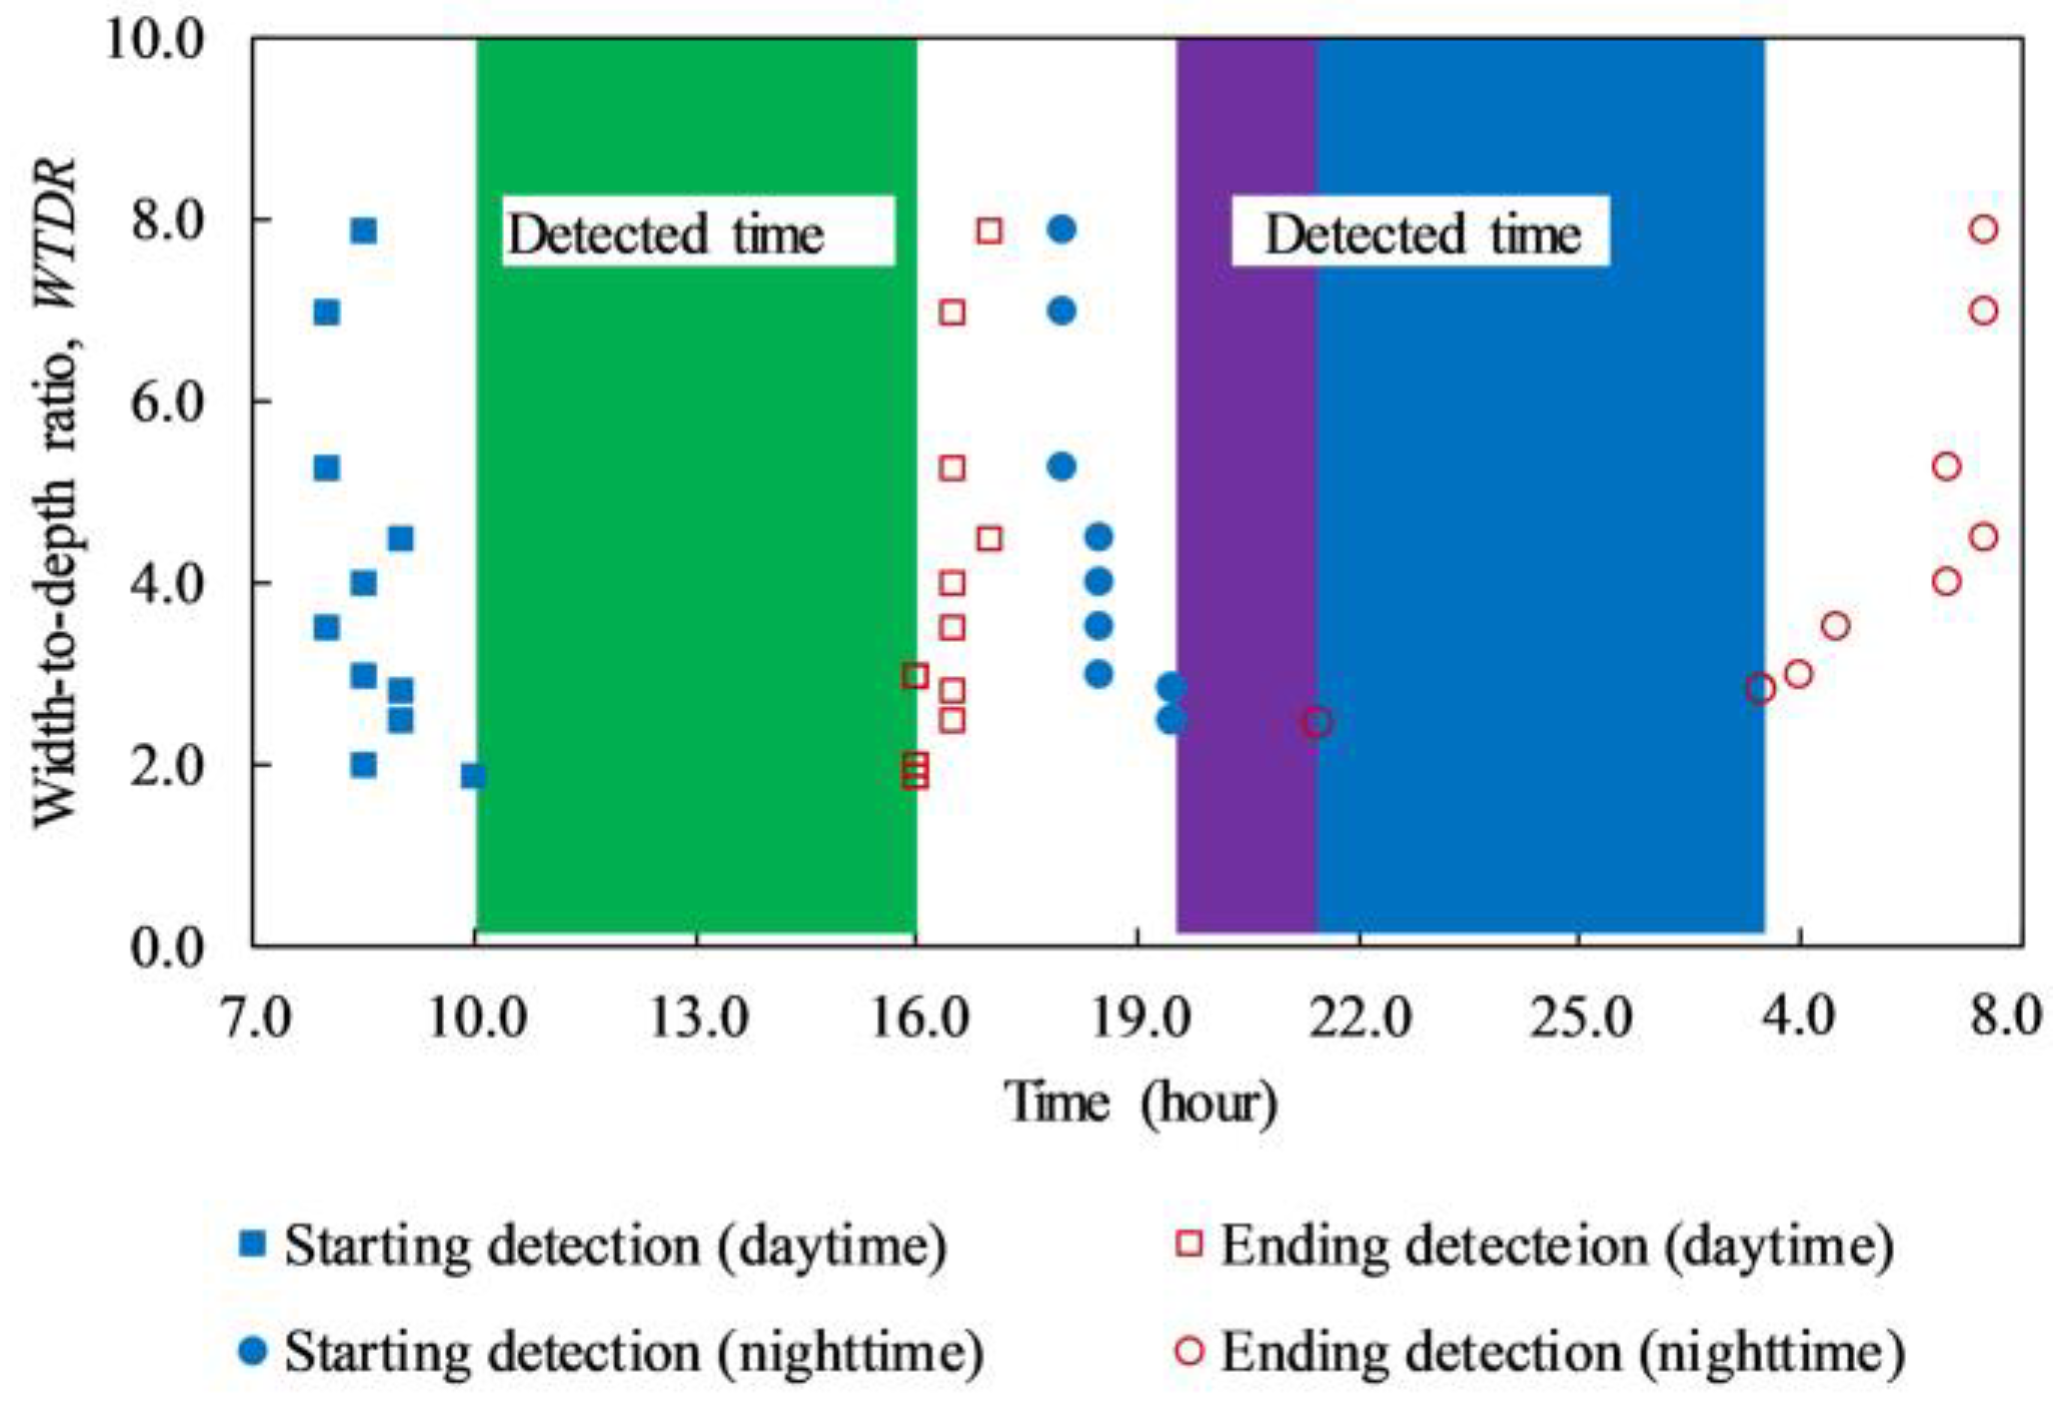
The detected time of delaminations from the back face on days 1 and 3 is graphically depicted in
Figure 19. The blue filled-in square, blue filled-in circle, red unfilled-in square, and red unfilled-in circle represent the first time during daytime, first time during nighttime, last time during daytime, and last time during nighttime when the delaminations can be detected respectively. Under the effect of the heating cycle during the daytime and cooling cycle during the nighttime, there are two ranges of detectable time when the defects with depths equal to or smaller than 4.0 cm may be detected.
Under the effect of the heating cycle (daytime): The structure inspection should be conducted from 10:00 until 16:00 (6 h) to detect delaminations with WTDRs equal to or higher than 1.9 as shown by the green rectangular in
Figure 19. If a delamination with a WTDR of 1.9 is eliminated, the feasible time is from 9:00 to 16:00 (7 h) to identify delamination with the WTDRs equal to or higher than 2.0. However, the inspection of the structure should be carried out from 10:00 to 15:00 (5 h) such that significantly high temperature difference can be obtained, and a clearer observation of delamination can be achieved as shown in
Figure 11 and
Figure 15.
Under the effect of the cooling cycle (nighttime): If the structure is inspected from 19:30 to 3:30 (8 h), delaminations with the WTDR equal to or higher than 2.8 can be identified. However, in the case of delaminations with WTDRs from 2.5 to 2.8, the suitable collection time is shortened as the period from 19:30 to 21:30 (2 h). In addition, the temperature difference of delaminations achieves a significantly high value from 19:30 to around 2:00 (6.5 h), the structure inspection therefore should be conducted during this time to achieve good results.
In fact, the detected time of the delaminations lasts significantly during both daytime and nighttime. Therefore, the concrete bridge deck inspection can be conducted effectively throughout the day. However, during the daytime, the WTDRs of delaminations that can be detected using the passive IRT technique are smaller in comparison with the nighttime. Thus, daytime is a better choice for concrete bridge inspection than nighttime even if the delaminations with small WTDRs (≤ 2.5) are considered in the inspection. In this case, the limitation of WTDR is approximately 1.9. Conversely, if the inspection focuses only on delamination with WTDRs of 2.8 or higher, the nighttime offers a more efficient selection because of its longer detected time compared to daytime.
6. Detectability of Delaminations Using UAV-IRC
In the case of using the UAV-IRC, the detectability of delamination is also evaluated by using the absolute contrast measurement that is calculated from Equation (3). The temperature difference is the amplitude of the absolute contrast.
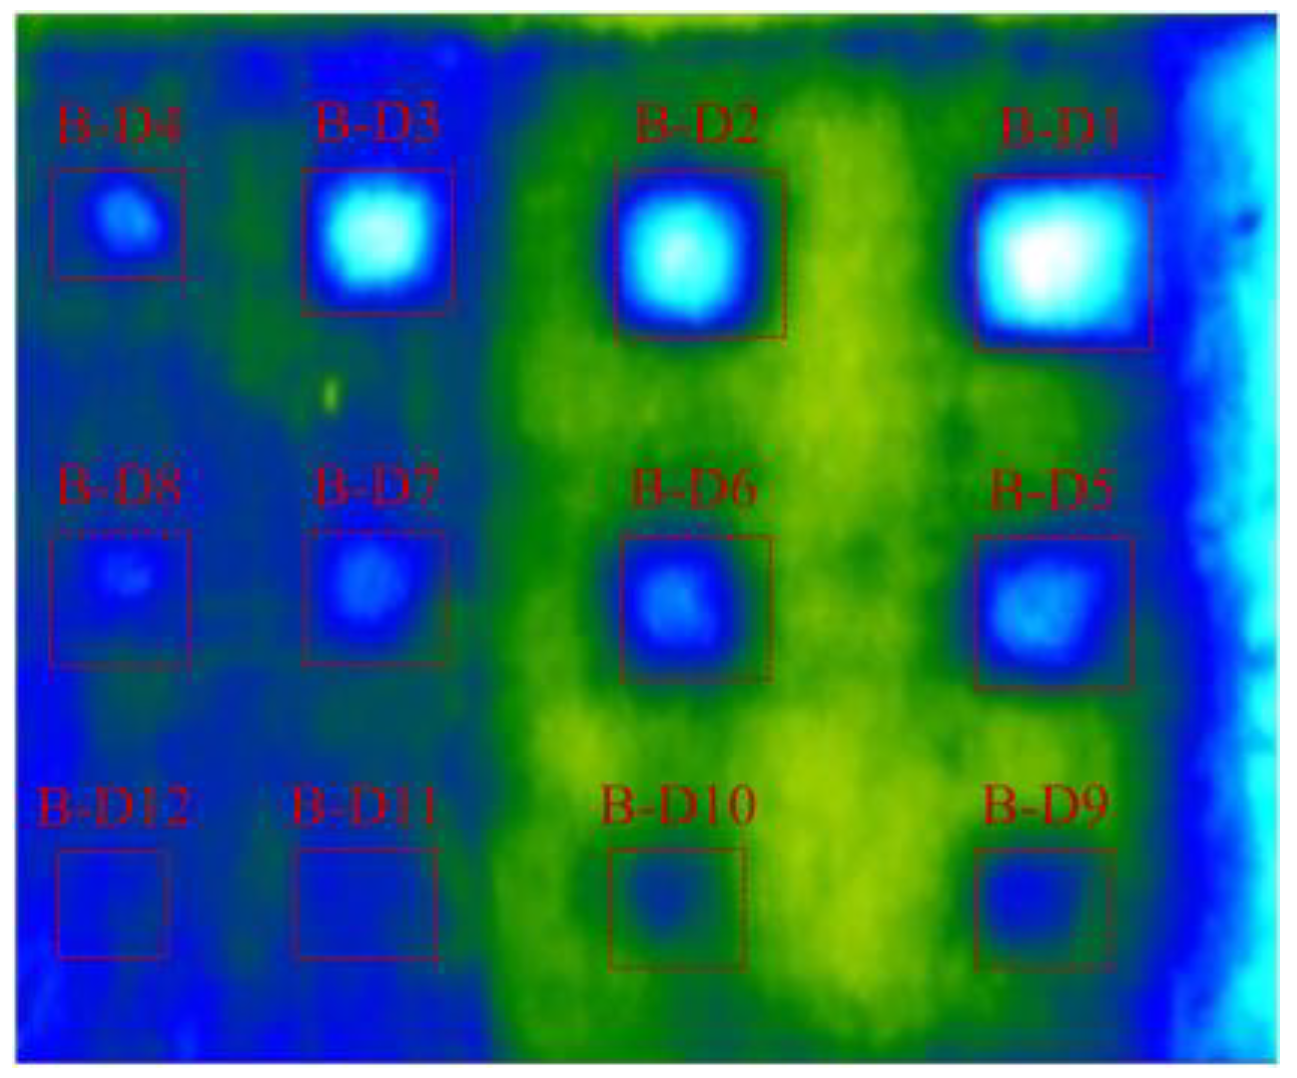
Figure 20 shows the thermal image at 11:30 by using UAV-IRC. The temperature difference of delaminations (B-D1 to B-D11) ranges from 5.73 to 0.54 °C that is higher than 0.5 °C, while it is 0.4 °C for the delamination B-D12. The largest WTDR delamination obtains the highest temperature difference (5.73 °C) whereas the smallest temperature difference is achieved in the case of the least WTDR delamination (0.4 °C). Therefore, all the given delaminations can be seen on the thermal images captured by using UAV-IRC except for delamination B-D12. Hence, it can be concluded that the UAV-IRC might detect delaminations at the depth equal to or lower than 4 cm and with WTDRs not smaller than 1.9 during daytime on the sunny day. However, it should be noted that delamination B-D11 (WTDR = 1.9) is still quite difficult to be recognized as shown in
Figure 20.
Figure 21 shows the absolute contrast of delaminations having different WTDRs on day 5. Particularly,
Figure 21a shows the case of defects at the same depth of 2 cm (B-D1, B-D2, B-D3, and B-D4) while
Figure 21b depicts defects at depths of 2 (B-D4) and 3 cm (B-D5 and B-D6). The WTDRs of delaminations B-D1, B-D2, B-D3, and B-D4 are 7.9, 7.0, 5.25, and 3.5, respectively, whereas the WTDR is 4.5 and 4.0 corresponding to delaminations B-D5 and B-D6. The same tendency can be observed in comparison with the results obtained from the H-IRC that a larger delamination WTDR achieves higher temperature difference than a smaller one, although it is located at the same depth or further from the surface of the structure. For example, in the case of different WTDRs at the same depth of 2 cm, at 10:30, the temperature differences are 5.22, 3.78, 3.30, and 1.55 °C corresponding to delaminations B-D1, B-D2, B-D3, and B-D4. On considering delaminations with different WTDRs and depths, delamination B-D5, B-D6, and B-D4 obtained the temperature difference of 2.70, 2.40, and 1.75 °C at 10:30, respectively. Consequently, delamination B-D5 and B-D6 can appear more clearly than B-D4.
The interchange period occurred in the period from 06:30 to 08:30 on day 5 that is very similar to the results from experiments using H-IRC on day 1. It should be noted that the experiments on both days 1 and 5 focus on the back face and the overall weather conditions are sunny during these days. There is only 30 min of the delay time of the interchange period between day 5 and day 1. It might be caused by the difference between the interval in capturing thermal images that are 30 min and 1 h in the case of day 1 and day 5, respectively.
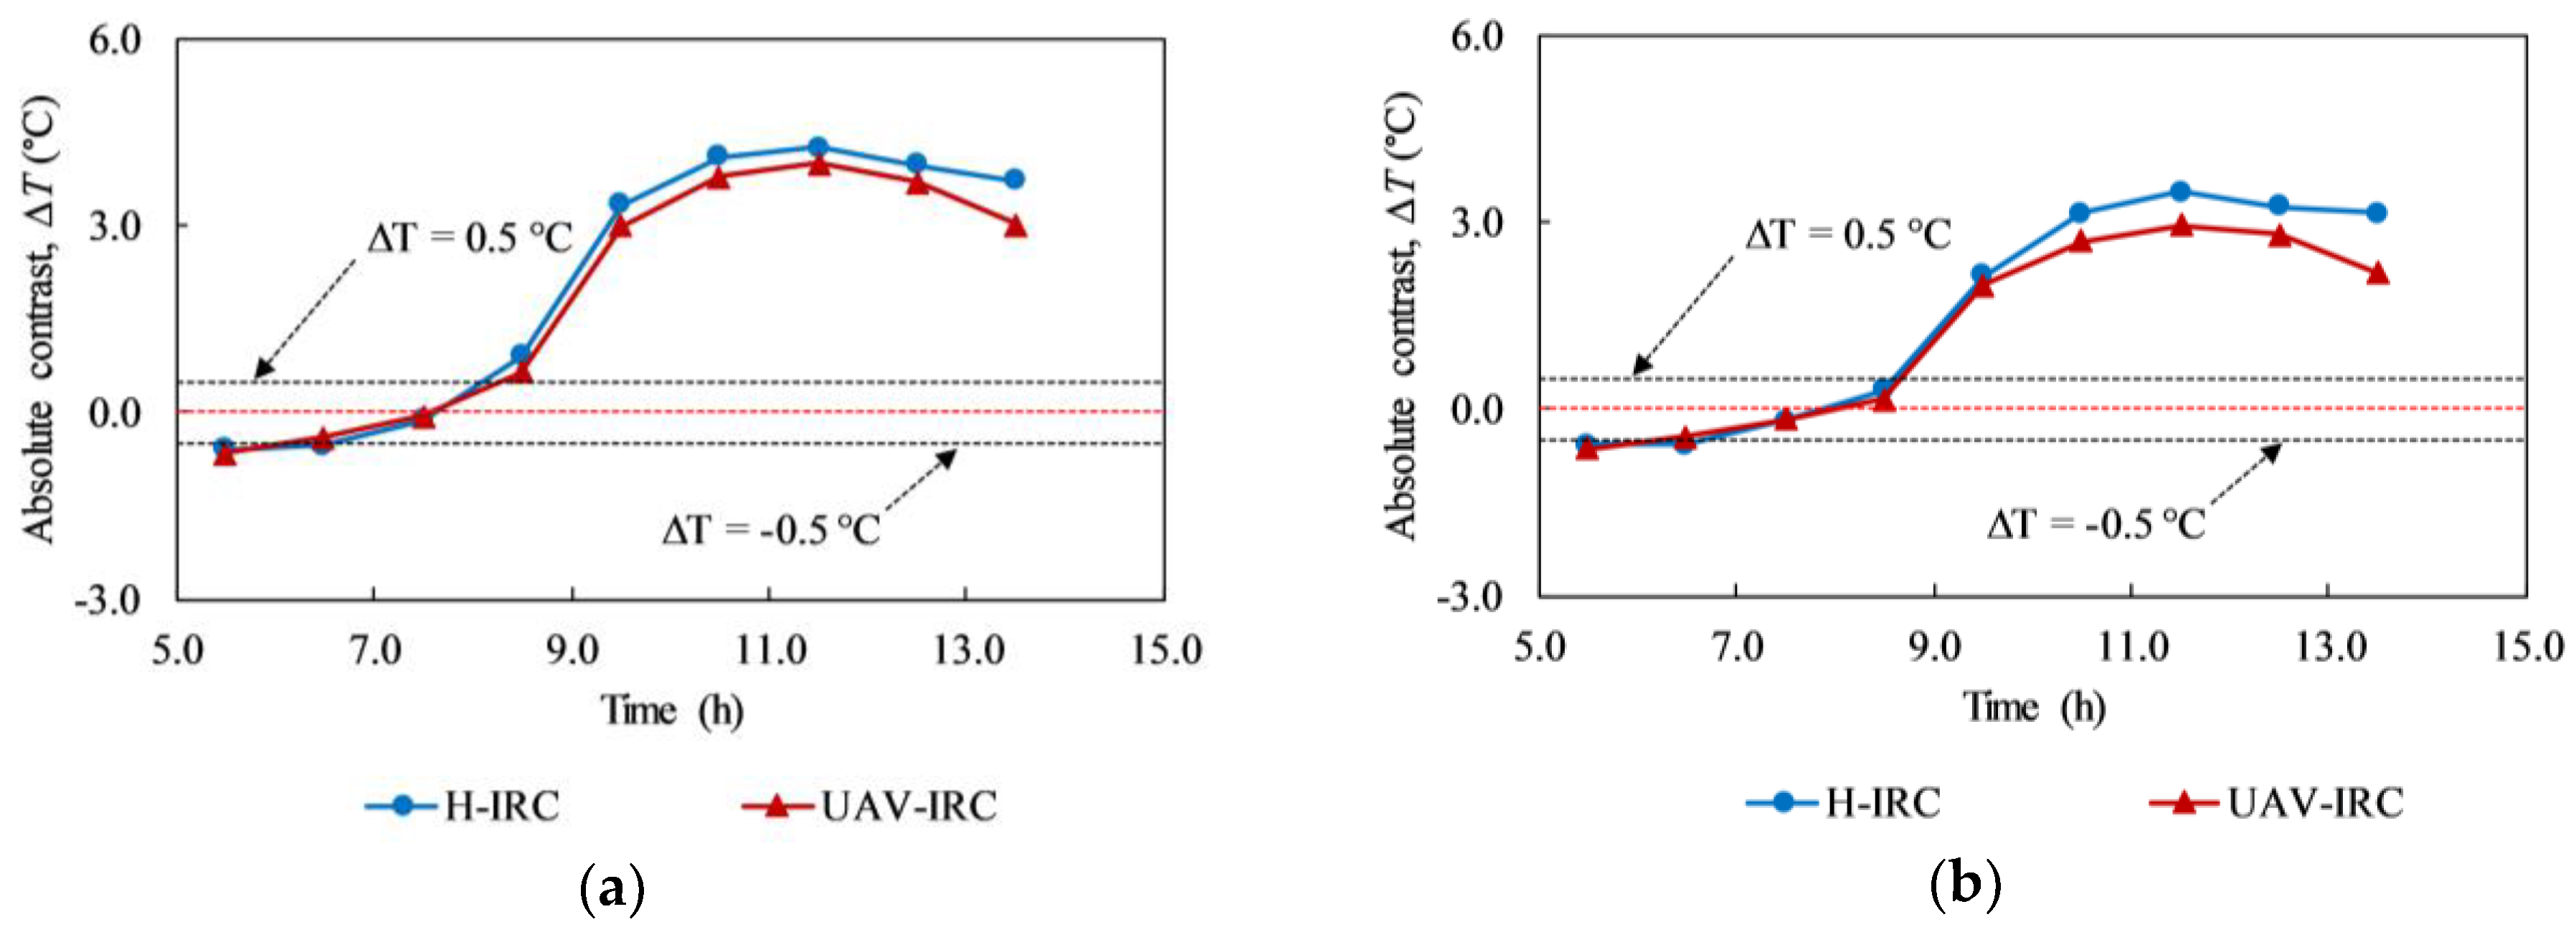
Figure 22 shows the absolute contrast of delamination B-D2 (depth of 2 cm) and B-D5 (depth of 3 cm) based on the results of experiments using UAV-IRC and H-IRC on day 5. In
Figure 22a,b, the blue line represents H-IRC while the red line stands for UAV-IRC. At early hours in the morning, the variance of temperature difference between UAV-IRC and H-IRC, known as DIF is much smaller than at other times because the surface temperature in the early morning is more stable than at noon as well as the afternoon, and that time is nearby the interchange period. For example, the DIF is 0.05 °C at 5:30 while it is 0.29 °C at 12:30 in the case of delamination B-D2. Furthermore, at 11:30, both H-IRC and UAV-IRC obtained the maximum temperature differences. These maximum values are 3.48 °C and 2.95 °C for B-D5 corresponding to the outcome from H-IRC and UAV-IRC. In addition, it is shown that larger the delamination depth, higher the DIF obtained except for the observation at 9:30 am. For instance, DIFs are 0.29 °C and 0.44 °C at 12:30 corresponding to delamination B-D2 and B-D5.
Moreover, as shown in
Figure 22a,b, both lines show the same tendency, but the red line is located more closely to zero axis compared to the blue line. This can be explained by the effect of the wind from the fans of UAV and the smaller thermal sensitivity of IR camera mounted on the UAV in comparison with H-IRC leading to the decrease in absolute contrast in case of UAV-IRC. However, the gap between the two lines is not significant, which implies that there is a good agreement between the results obtained from experiments using UAV-IRC and H-IRC. Consequently, it can be stated that under the given environmental conditions, using UAV-IRC can give appropriate results. The effective application of UAV-IRC in the defect detection of concrete bridge decks is confirmed.
7. Conclusions
In this study, an effort was made to consider the possibility of simultaneously using the results from the handheld IR camera (H-IRC) and the IR camera hanged on a UAV (UAV-IRC). From the results presented in this work under given experimental conditions and processing method, the following conclusions are obtained:
For delaminations at the depths of 4.0 cm or lesser, the larger the WTDRs of the delaminations, the higher is the temperature difference produced on the thermal image, which implies that there is a strong correlation between the size and detected depth of delamination.
The minimum WTDR of a delamination that can be detected by using H-IRC was determined in this study. Delaminations with WTDRs of 1.9 or larger located at depths of 4.0 cm or lesser from the structure surface may be identified during the daytime on a sunny day, whereas during the nighttime of a sunny day, only delaminations with WTDRs of 2.5 or larger can be discovered. However, if the delamination depth is 5.0 cm or higher and its WTDR is under 2.25, it may not be noticeable on the thermal images.
Passive IRT must be applied to scan the concrete bridge deck on a sunny day because adequate heat energy is provided that helps to extract accurately the delamination occurrence. Generally, the optimal time to inspect the concrete bridge deck is from 10:00 to 15:00 and from 19:30 to around 2:00, respectively, during the daytime and nighttime on a sunny day.
Although the absolute contrast produced in the case of UAV-IRC is slightly smaller than H-IRC, UAV-IRC also can be employed to detect delaminations with the depths equal to or less than 4.0 cm and WTDRs of 1.9 or larger during the daytime of a sunny day. Thus, it is proven that UAV-IRC in the passive IRT technique is a feasible solution that can be utilized separately or simultaneously with H-IRC to discover the delamination with a shorter inspection time compared to H-IRC in the concrete bridge deck.

 ,
, 


