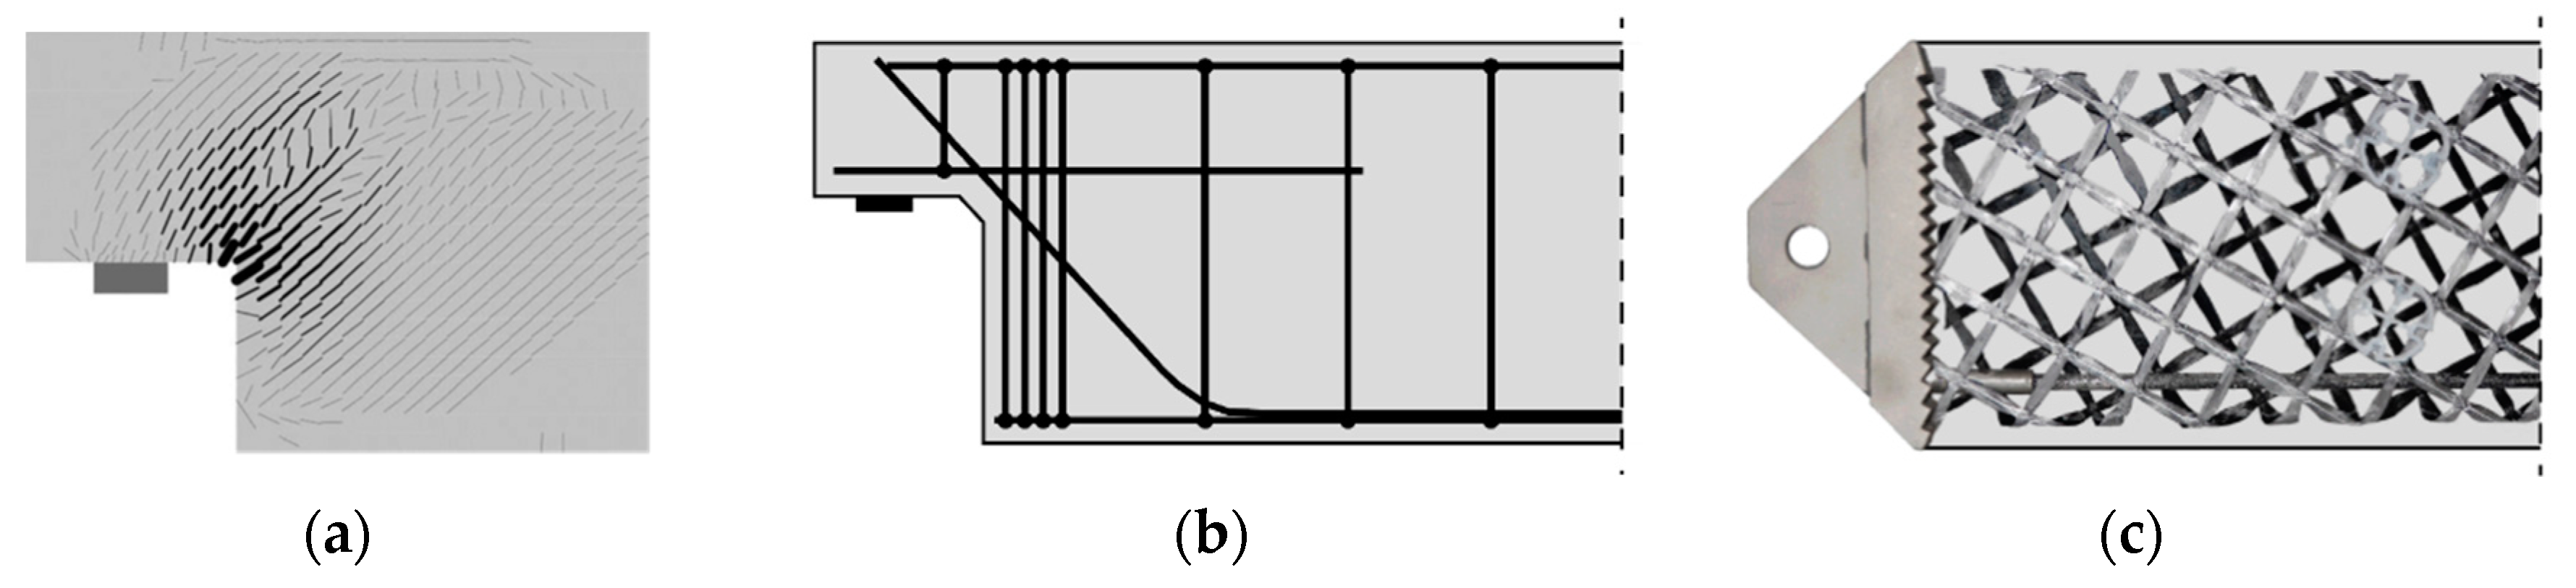
Figure 1.
(
a) Crack distribution of a dapped-end beam subjected to self-weight and uniformly distributed load; (
b) steel-reinforcement layout of a dapped-end beam [
2]; and (
c) implant for a discontinuity region with carbon textile reinforcement and carbon rod [
1].
Figure 1.
(
a) Crack distribution of a dapped-end beam subjected to self-weight and uniformly distributed load; (
b) steel-reinforcement layout of a dapped-end beam [
2]; and (
c) implant for a discontinuity region with carbon textile reinforcement and carbon rod [
1].
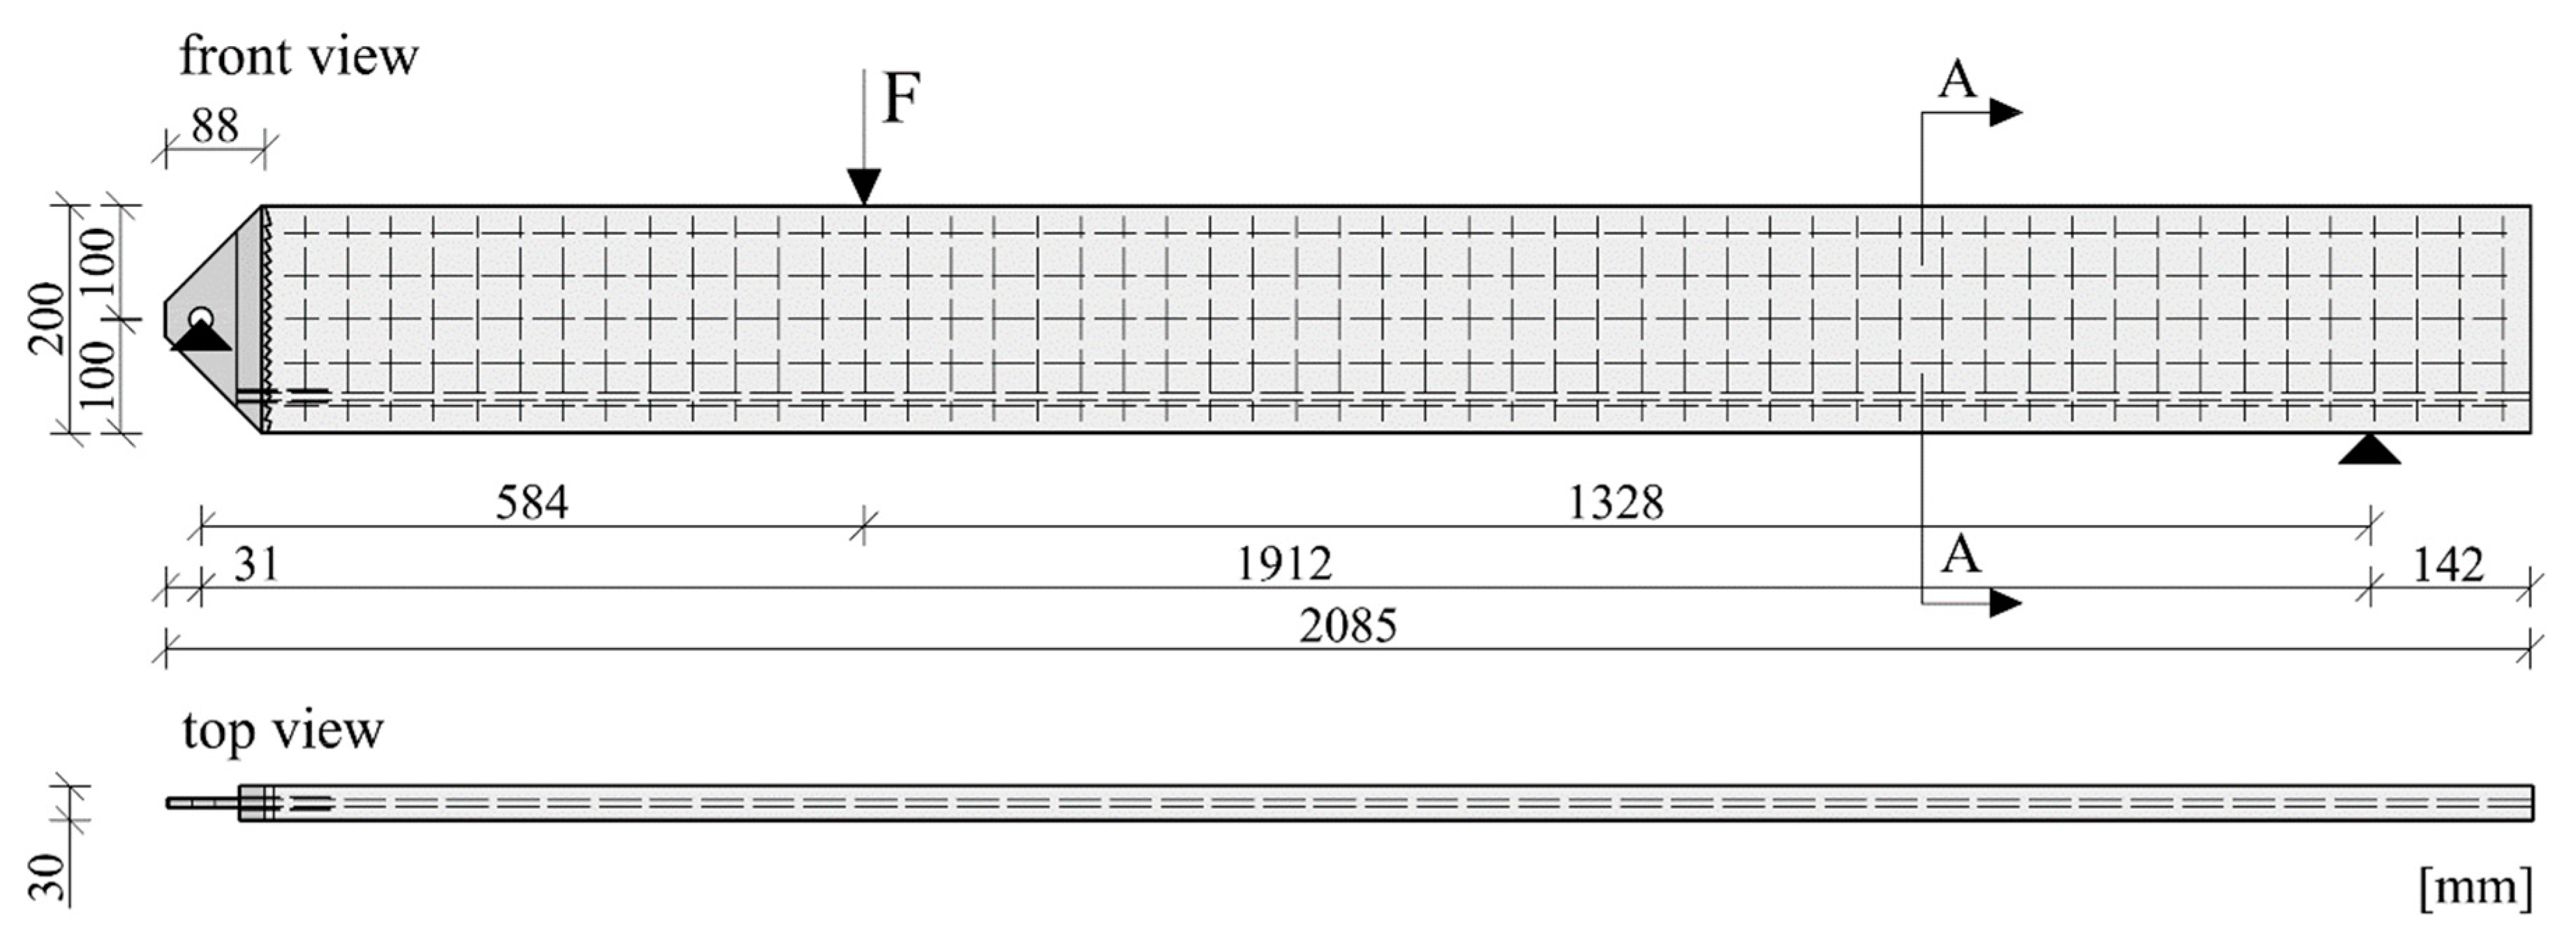
Figure 2.
Experimental setup for the tests of the first-generation implants [
1].
Figure 2.
Experimental setup for the tests of the first-generation implants [
1].
Figure 3.
First-generation implants [
1].
Figure 3.
First-generation implants [
1].
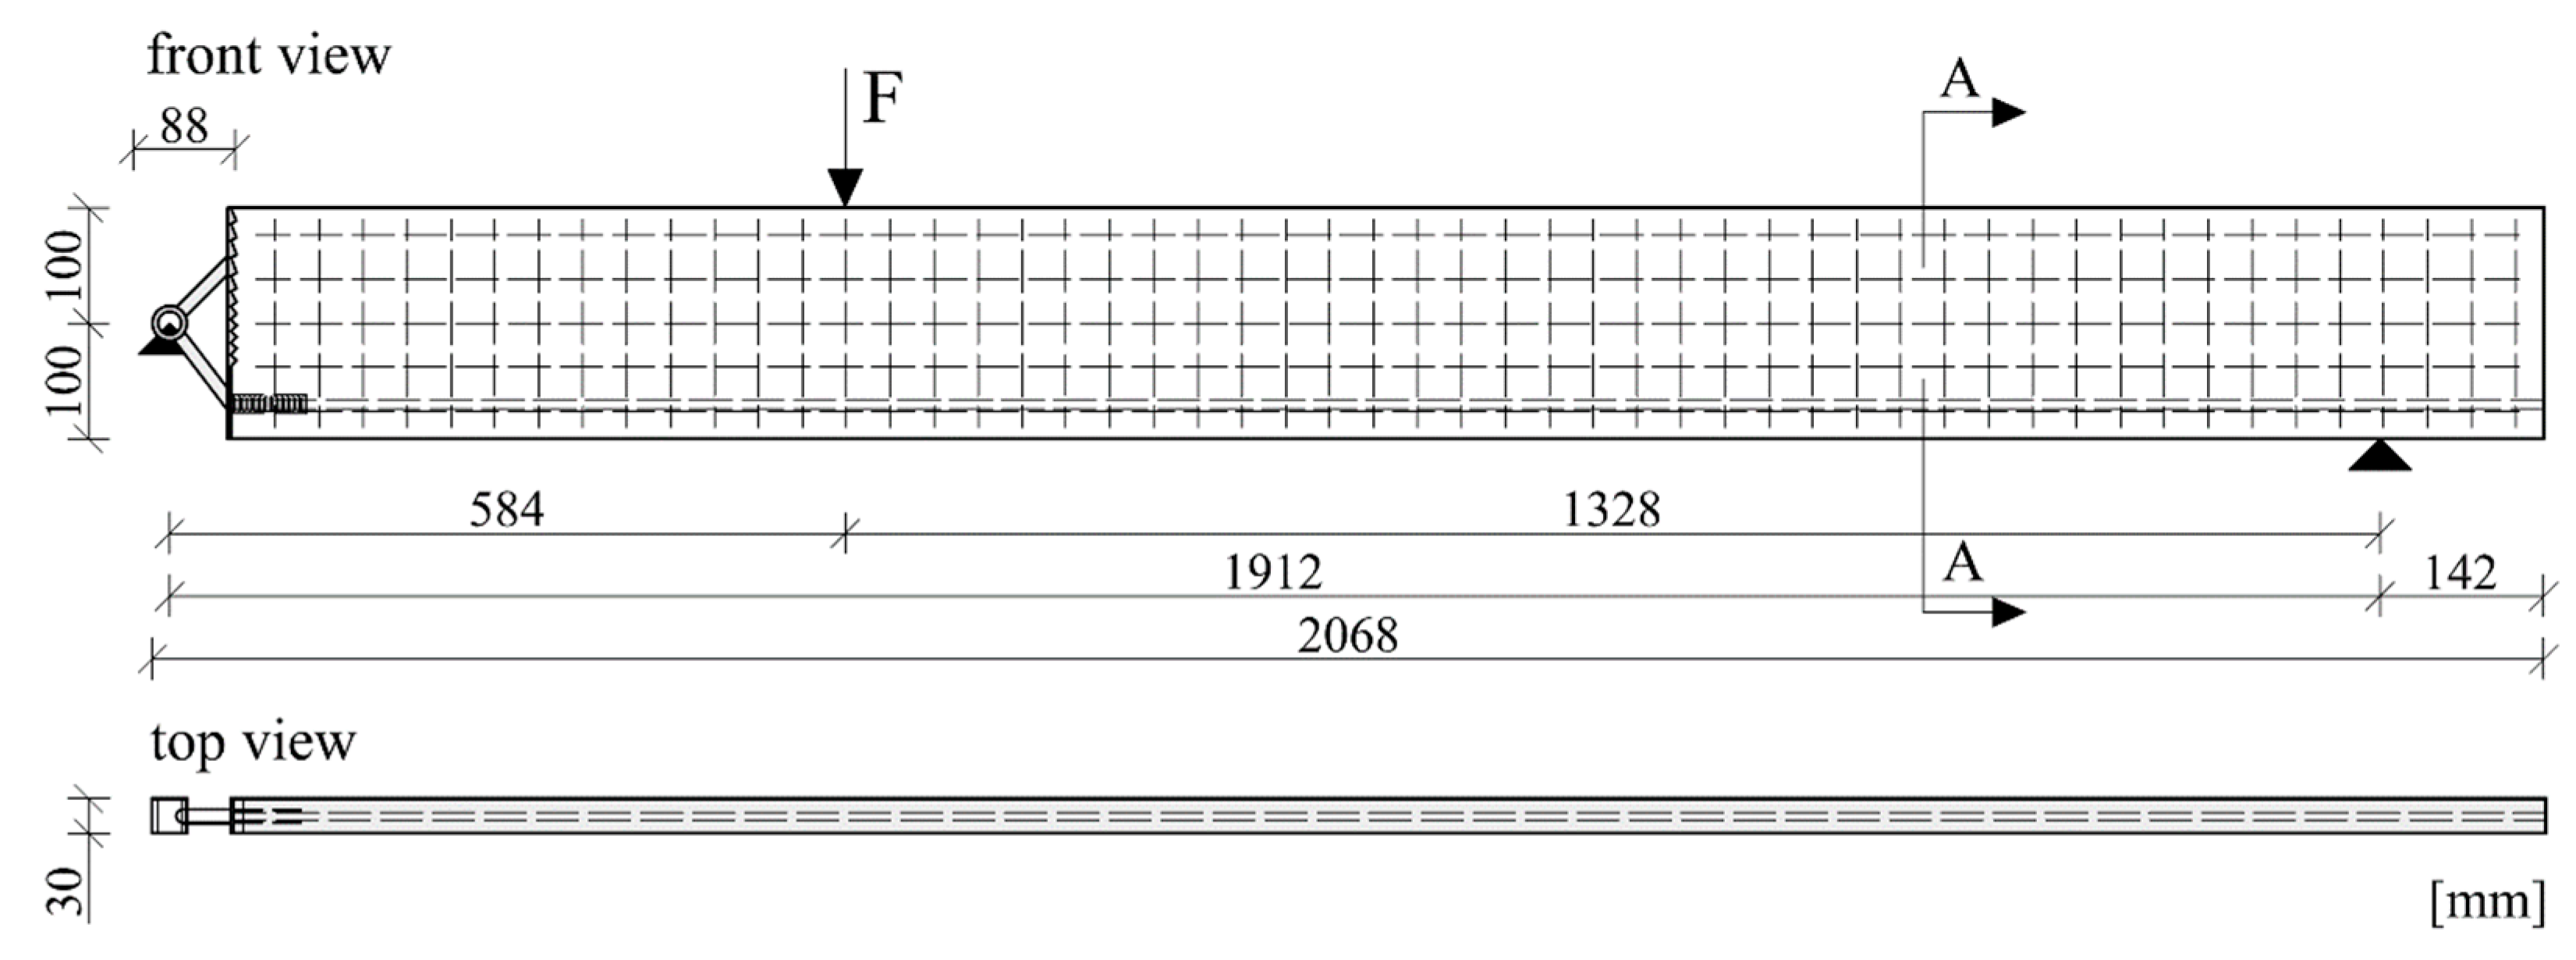
Figure 4.
Test setup for the load tests of the second generation of implants.
Figure 4.
Test setup for the load tests of the second generation of implants.
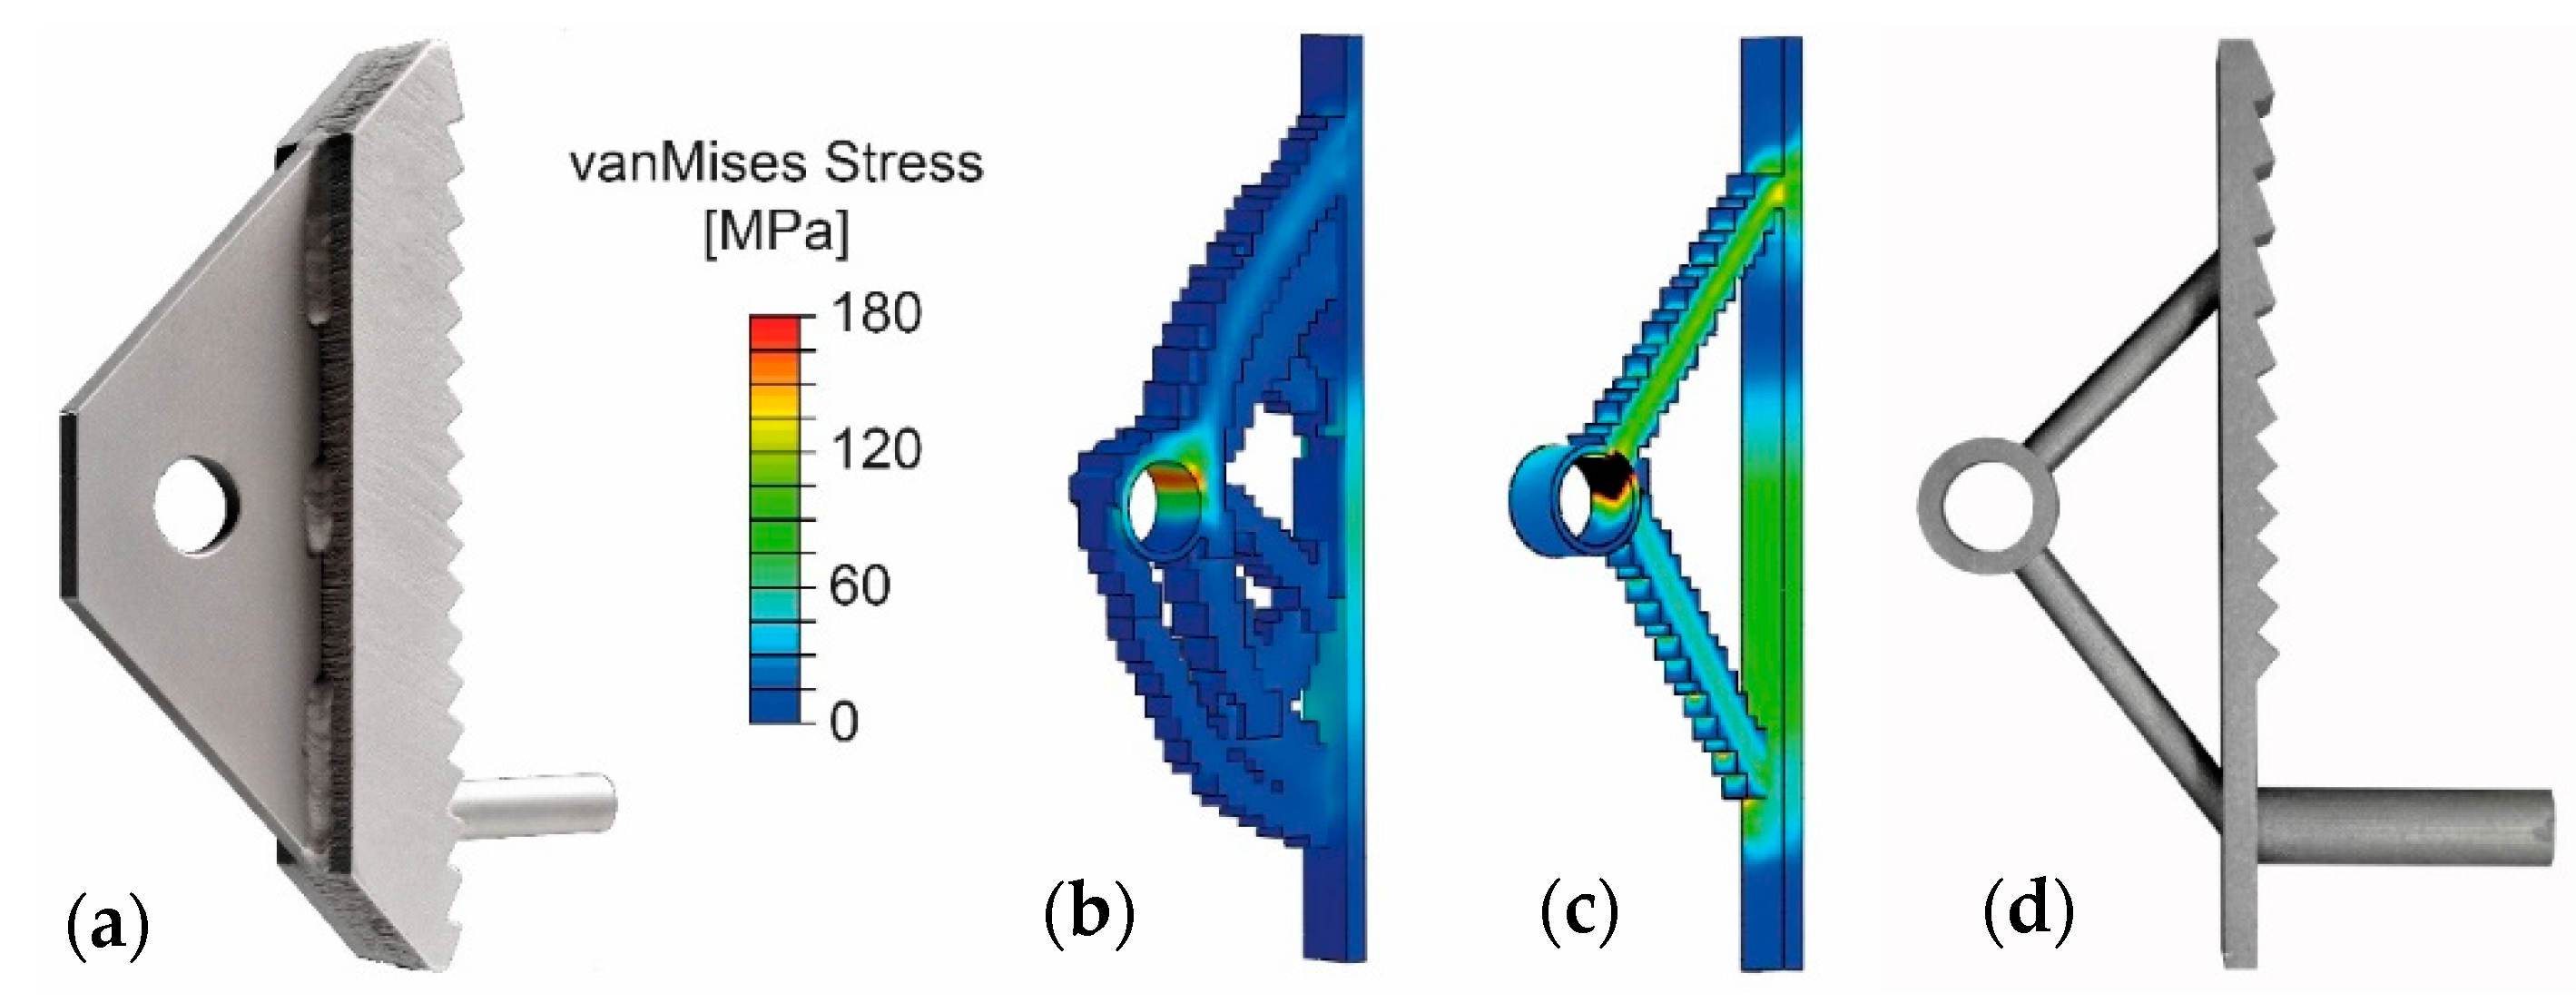
Figure 5.
(from left to right) (
a) First-generation implant with sleeve for reinforcement anchorage; (
b) intermediate result of topology optimisation; (
c) final result of topology optimisation (the colour gradient shows the von Mises stresses in MPa); and (
d) manufactured second-generation implant. The FEA-model used for the optimisation corresponds to the test-setup shown in
Figure 2 with a load of
.
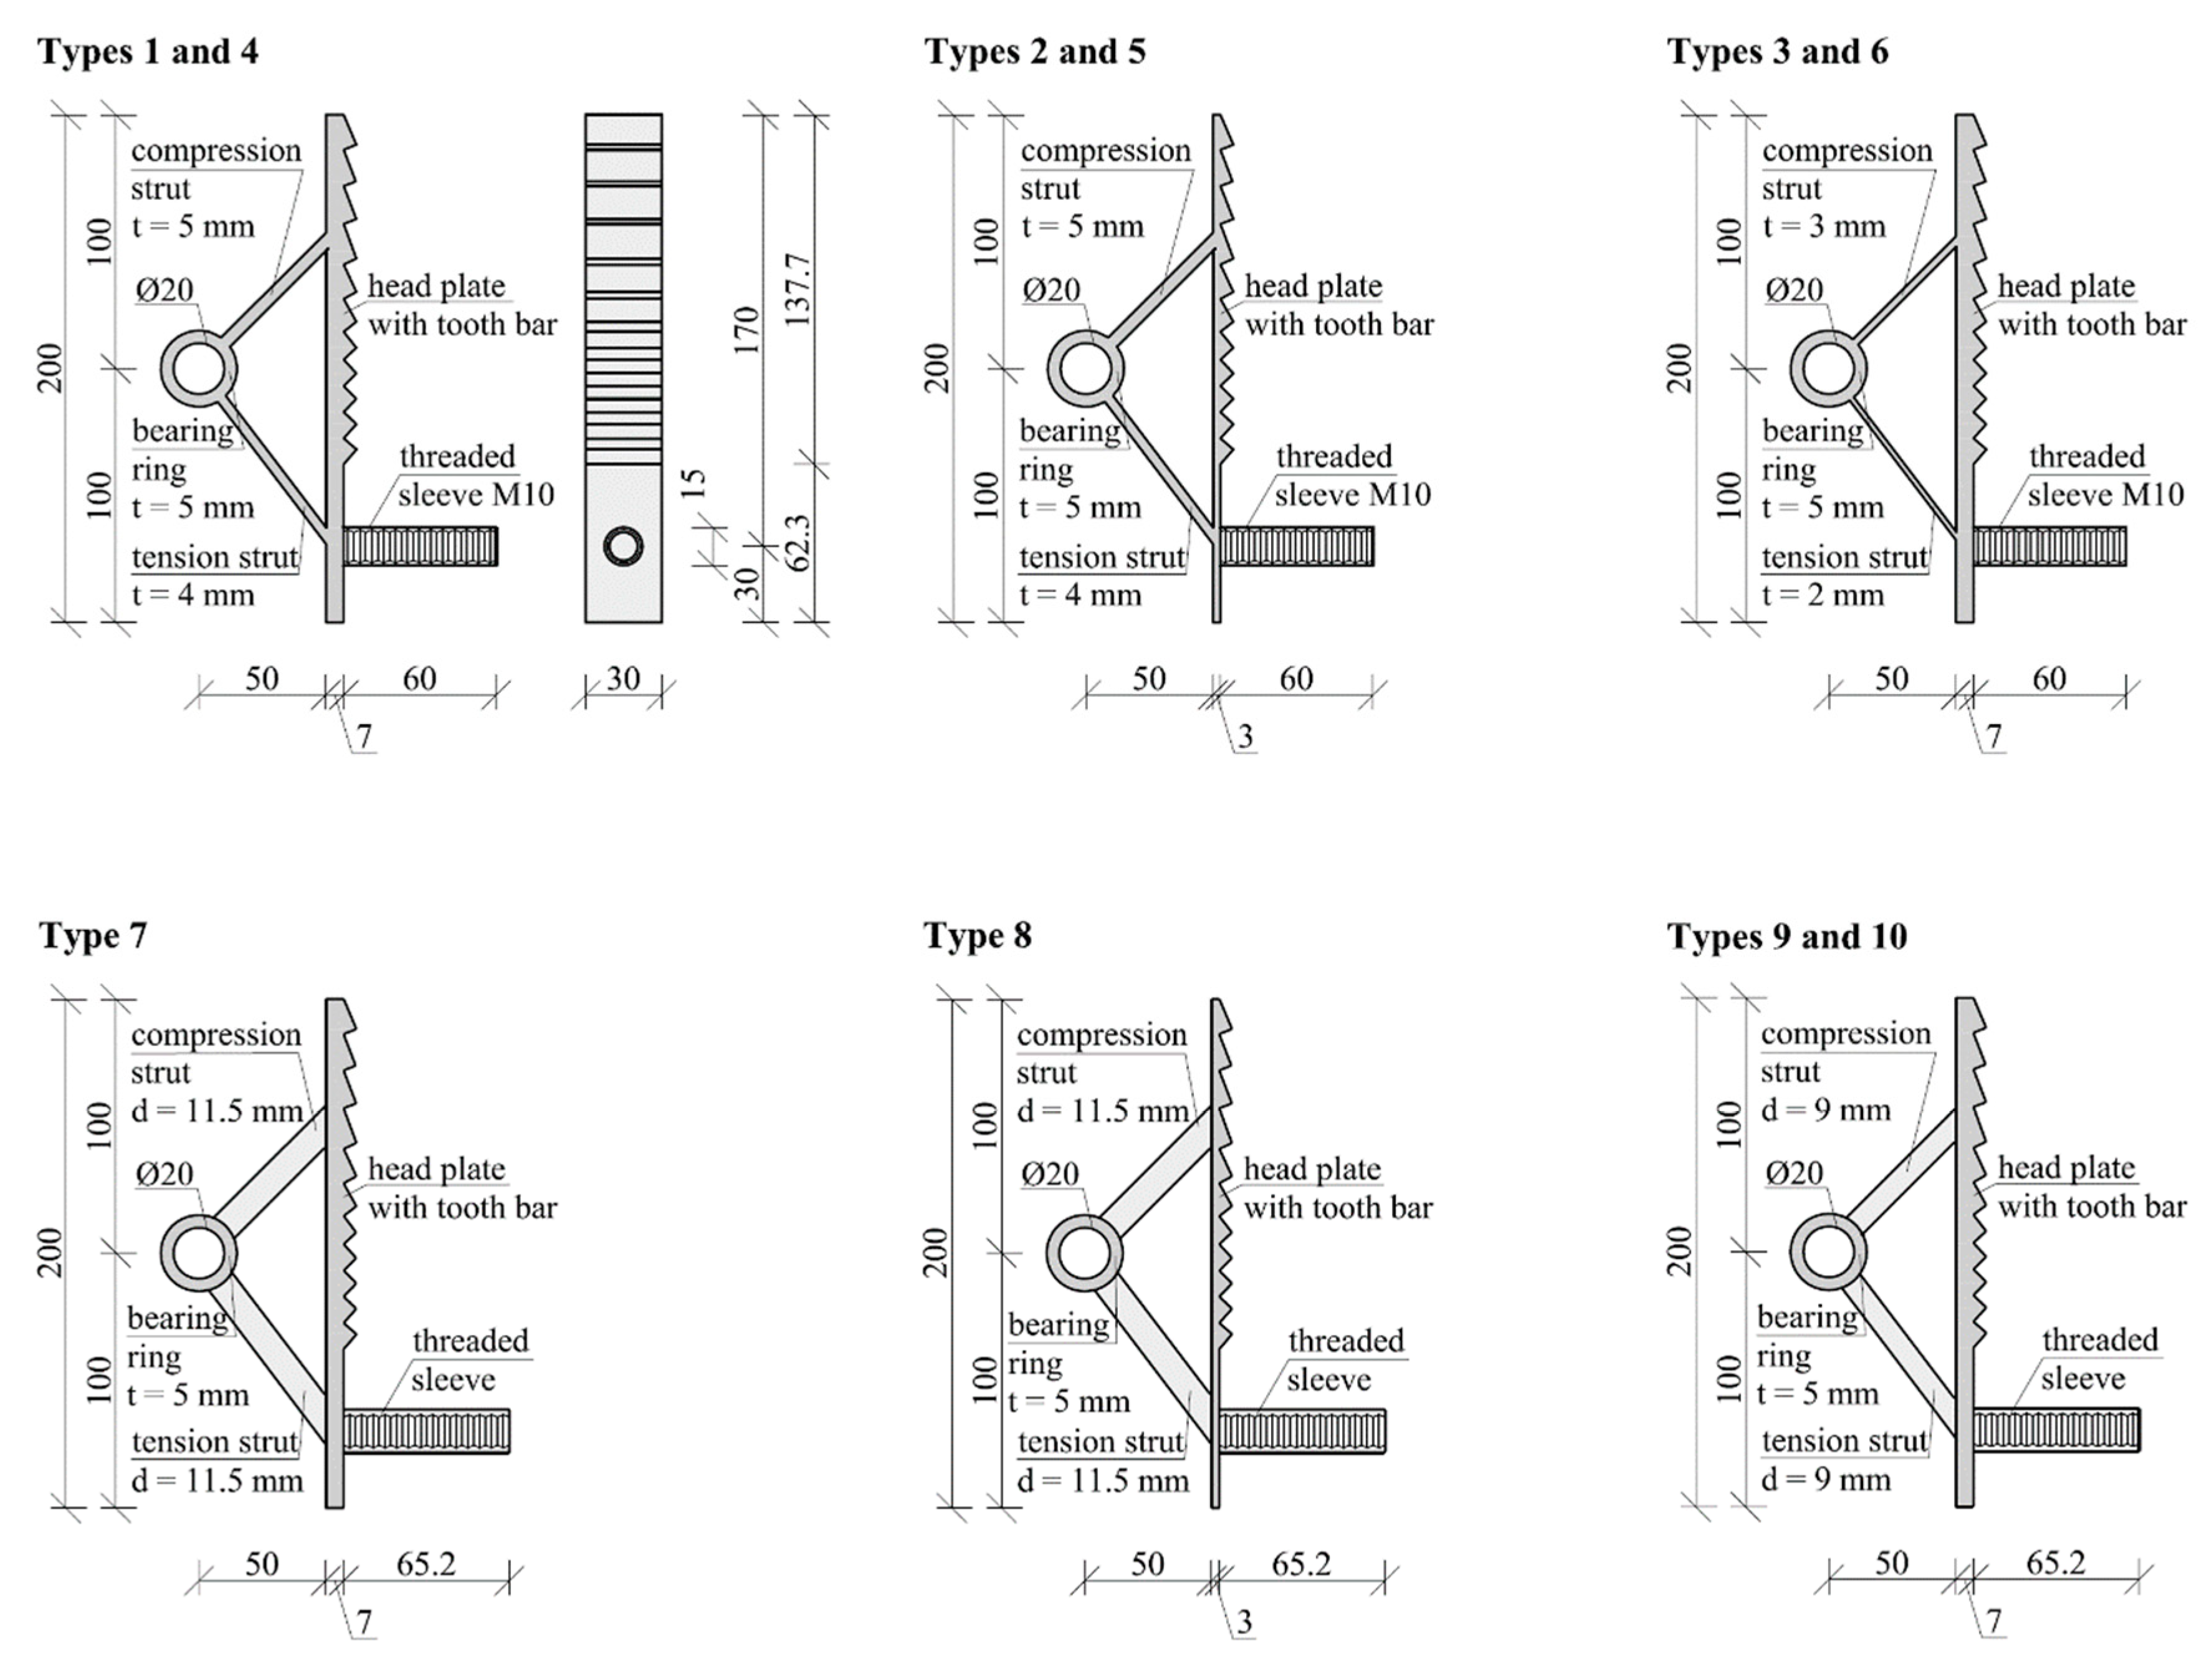
Figure 6.
Geometries of all the implant types.
Figure 6.
Geometries of all the implant types.
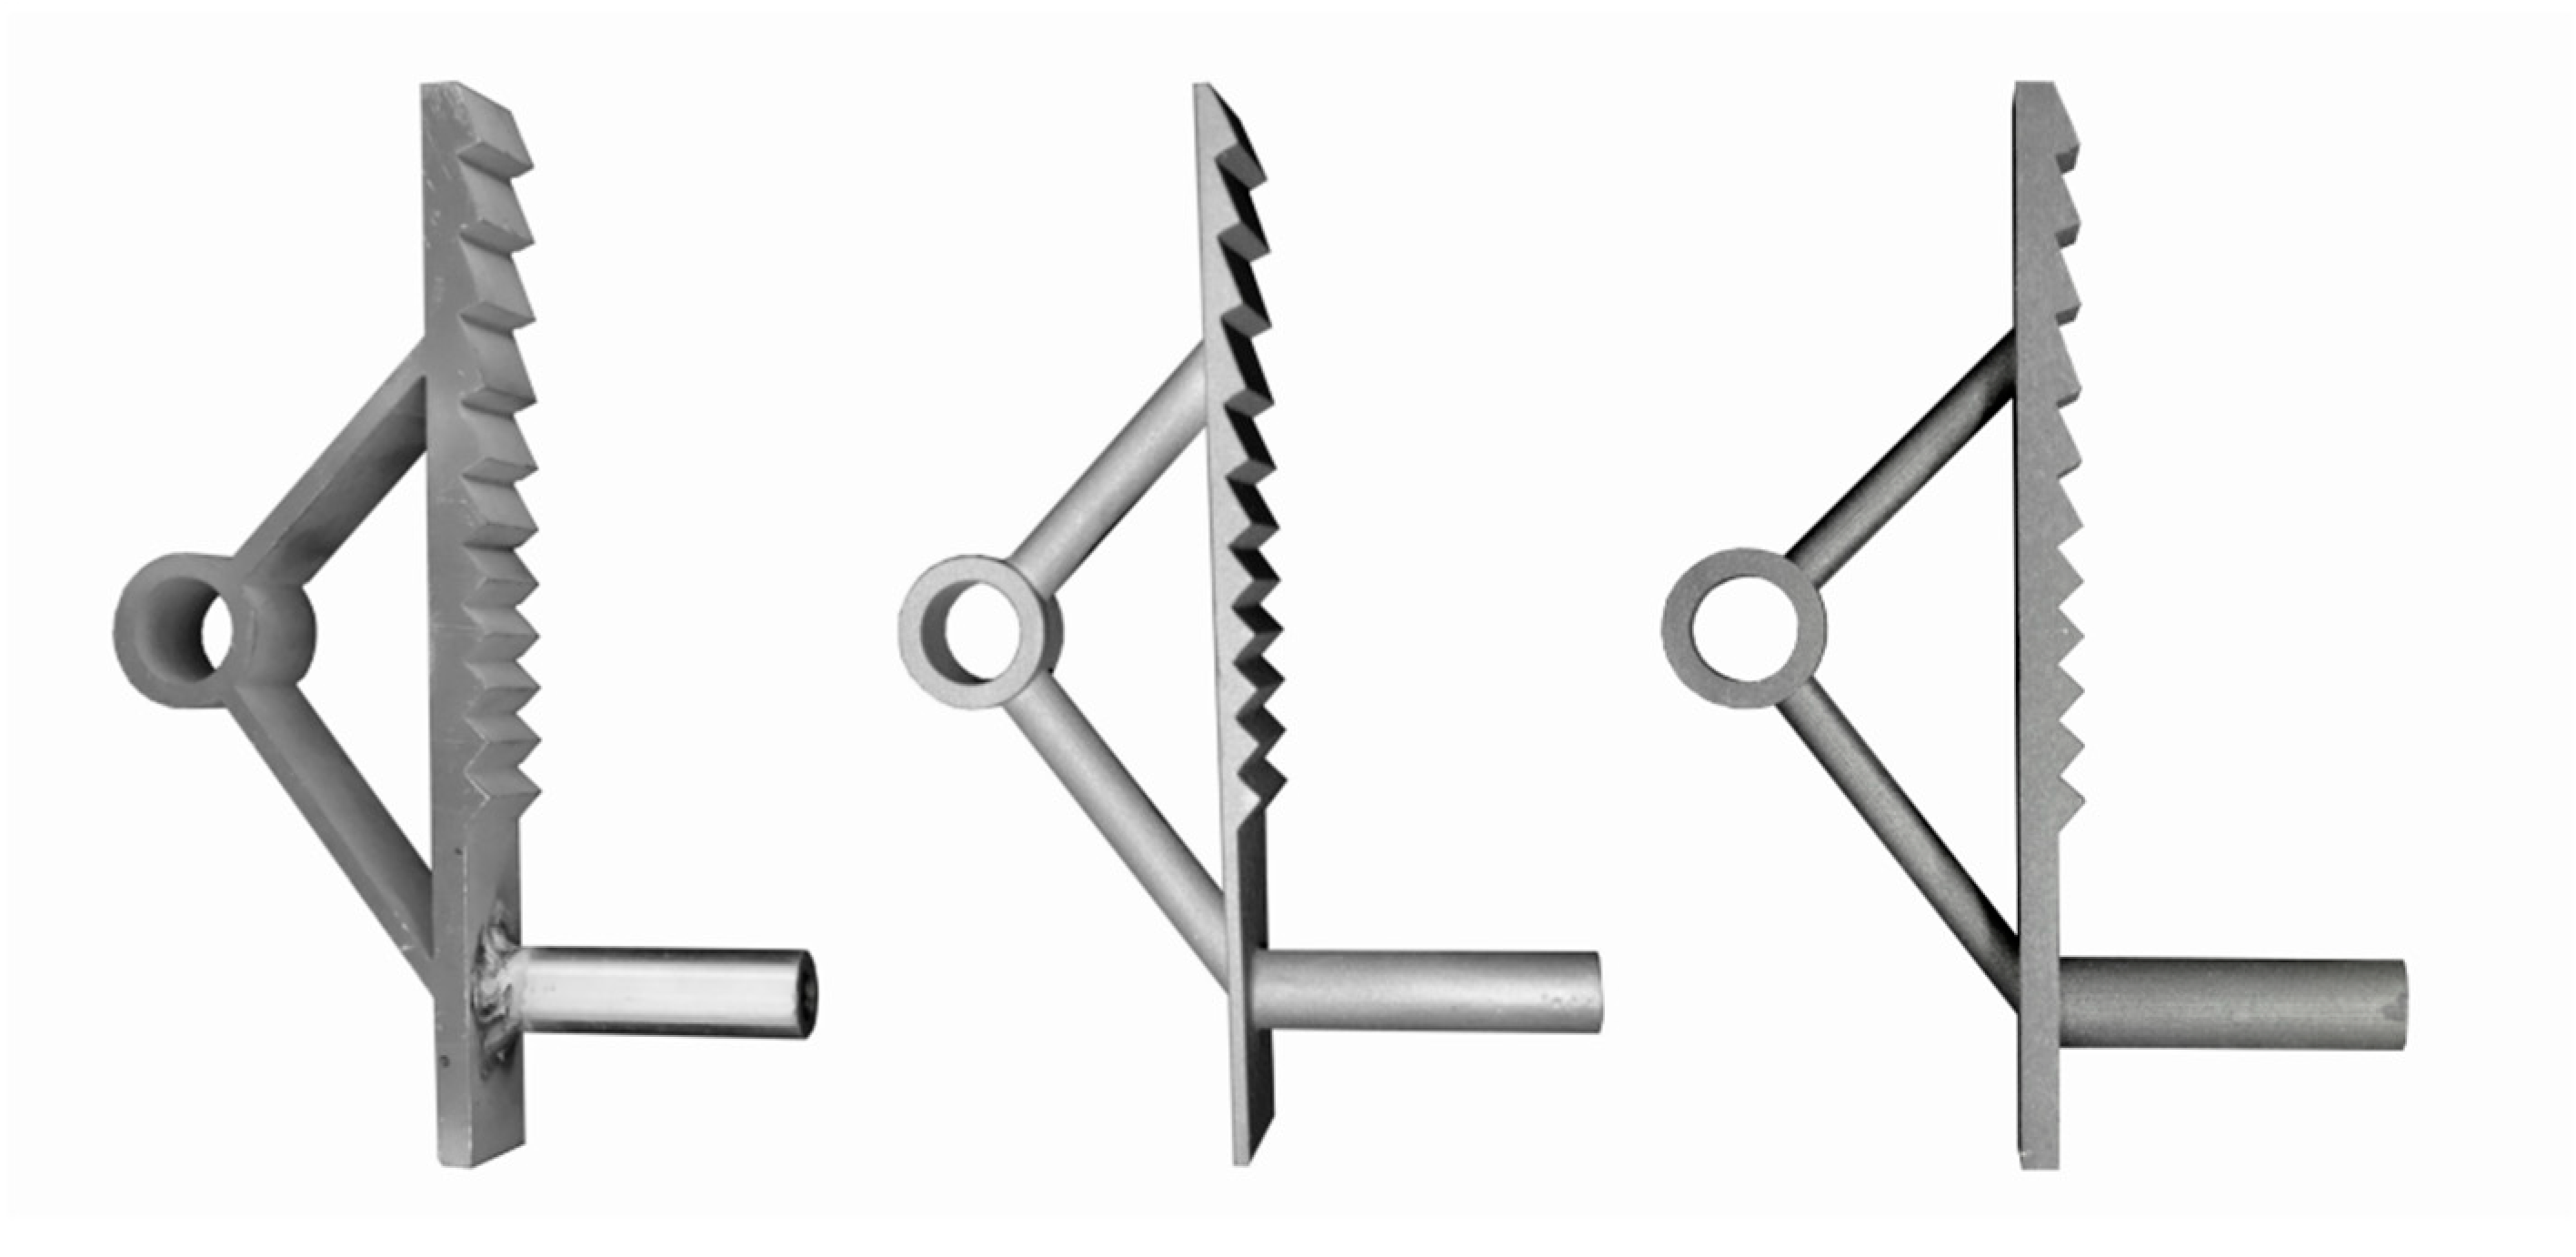
Figure 7.
Implant Type 2, water-jet-cut stainless steel (left); implant Type 8, steel cast into 3D-printed mould (centre); and implant Type 10, binder-jet-printed and subsequently cured steel (right).
Figure 7.
Implant Type 2, water-jet-cut stainless steel (left); implant Type 8, steel cast into 3D-printed mould (centre); and implant Type 10, binder-jet-printed and subsequently cured steel (right).
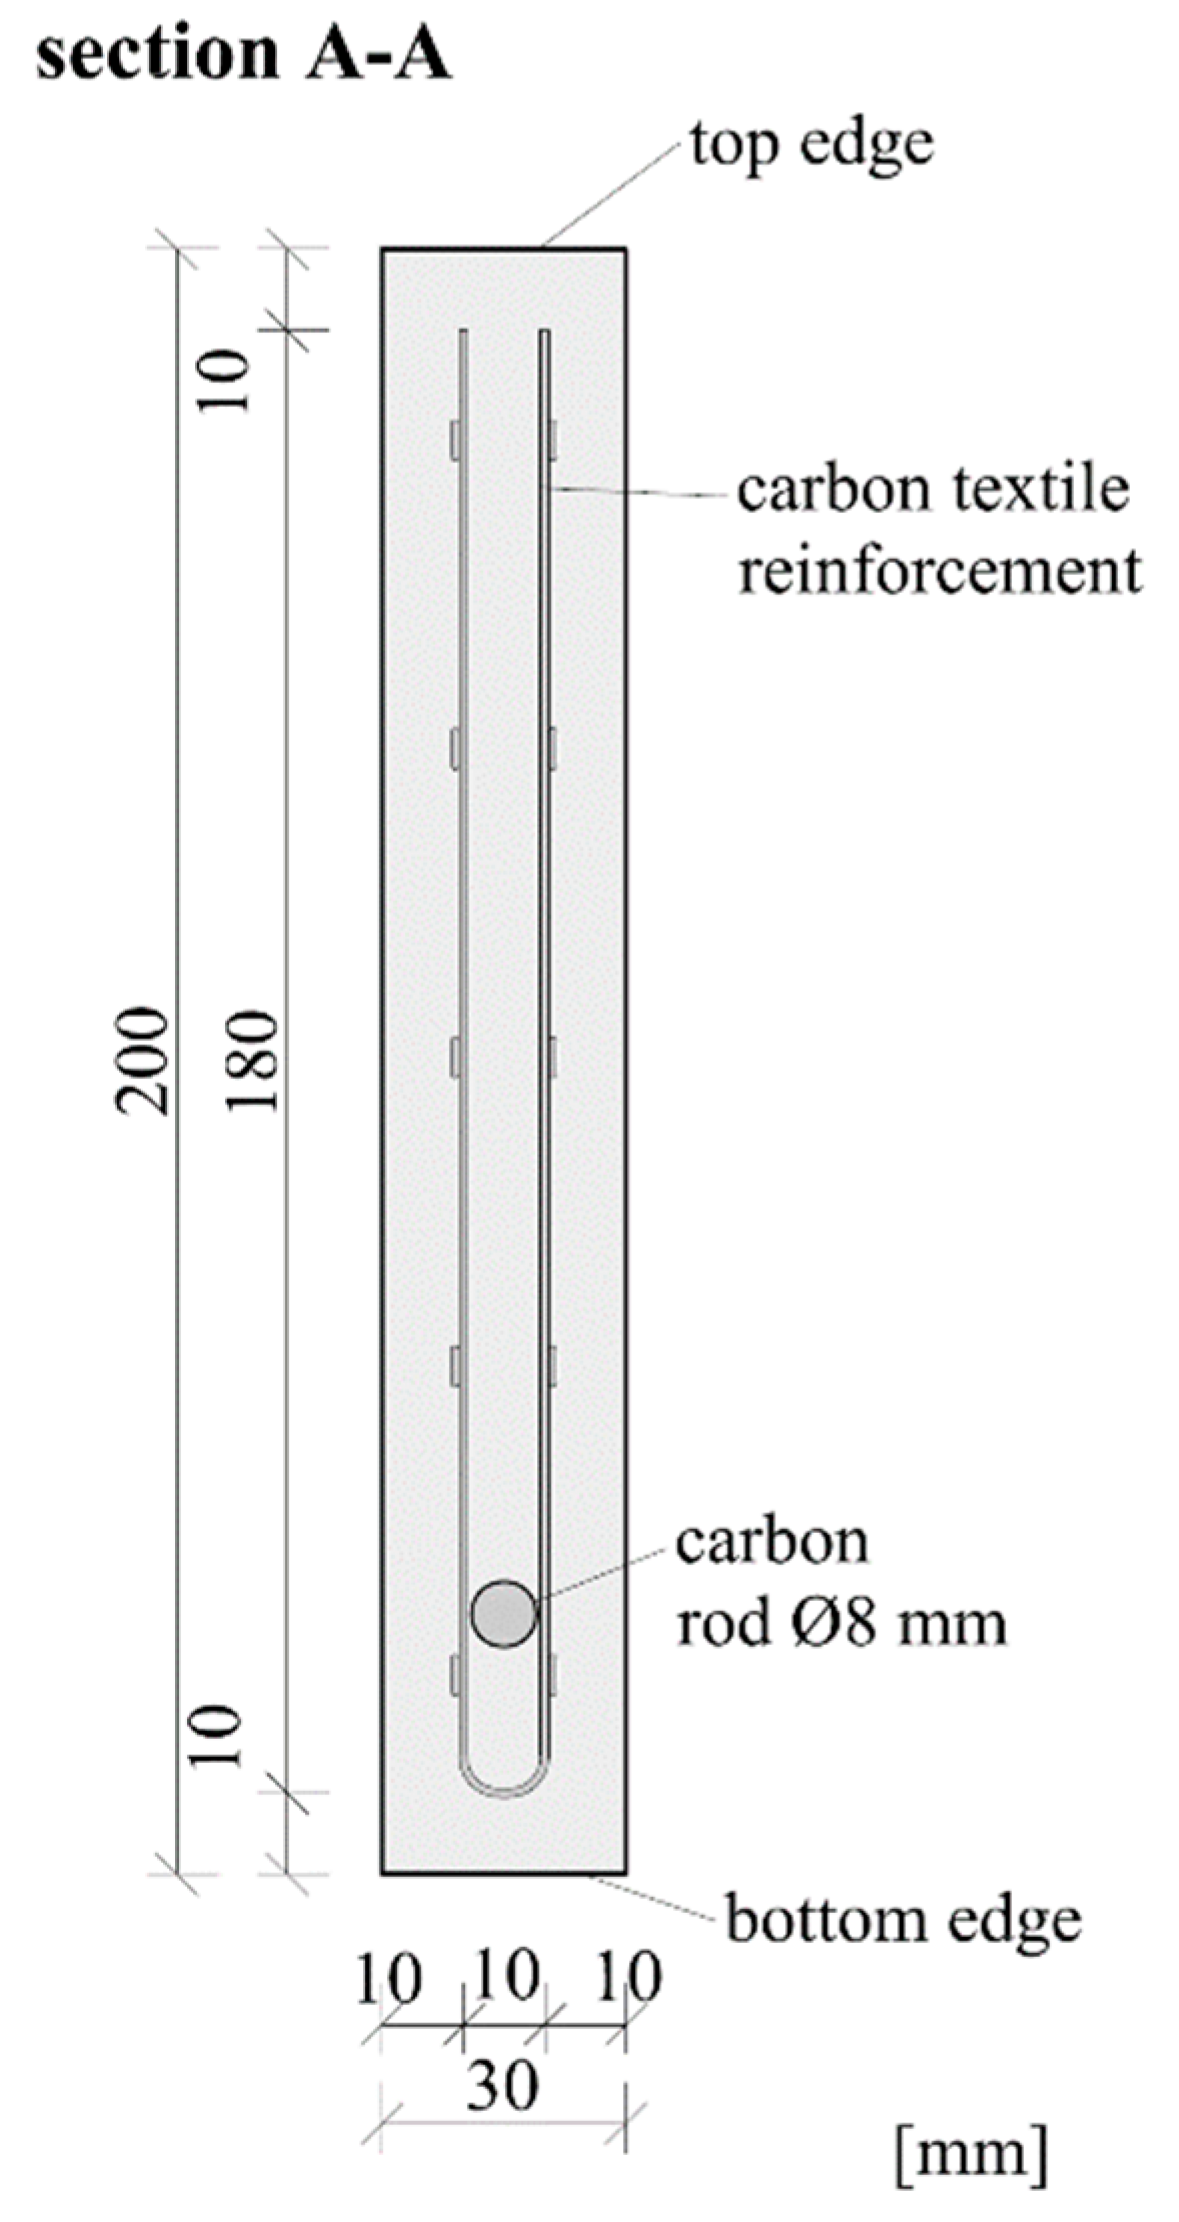
Figure 8.
Cross section of the test specimens.
Figure 8.
Cross section of the test specimens.
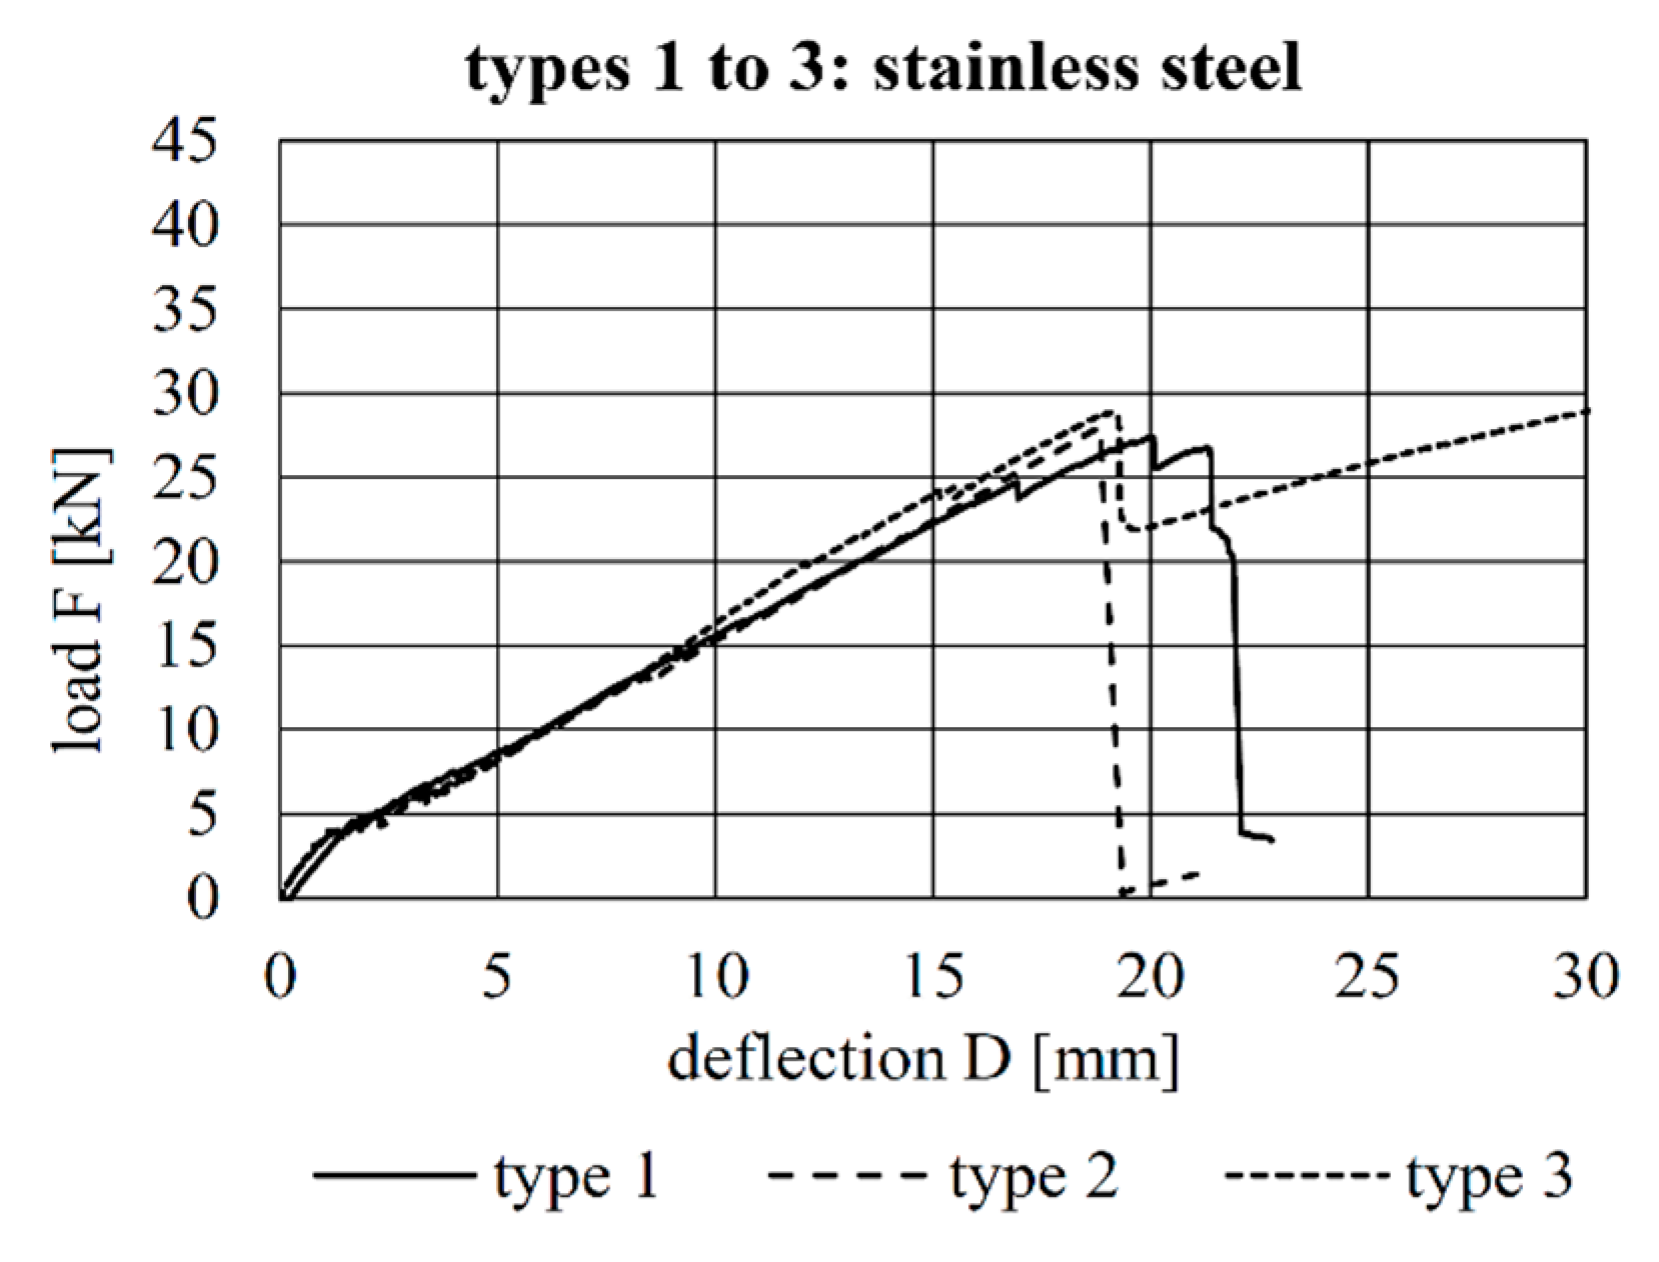
Figure 9.
Load–deflection behaviour of the specimens with implant Types 1–3.
Figure 9.
Load–deflection behaviour of the specimens with implant Types 1–3.
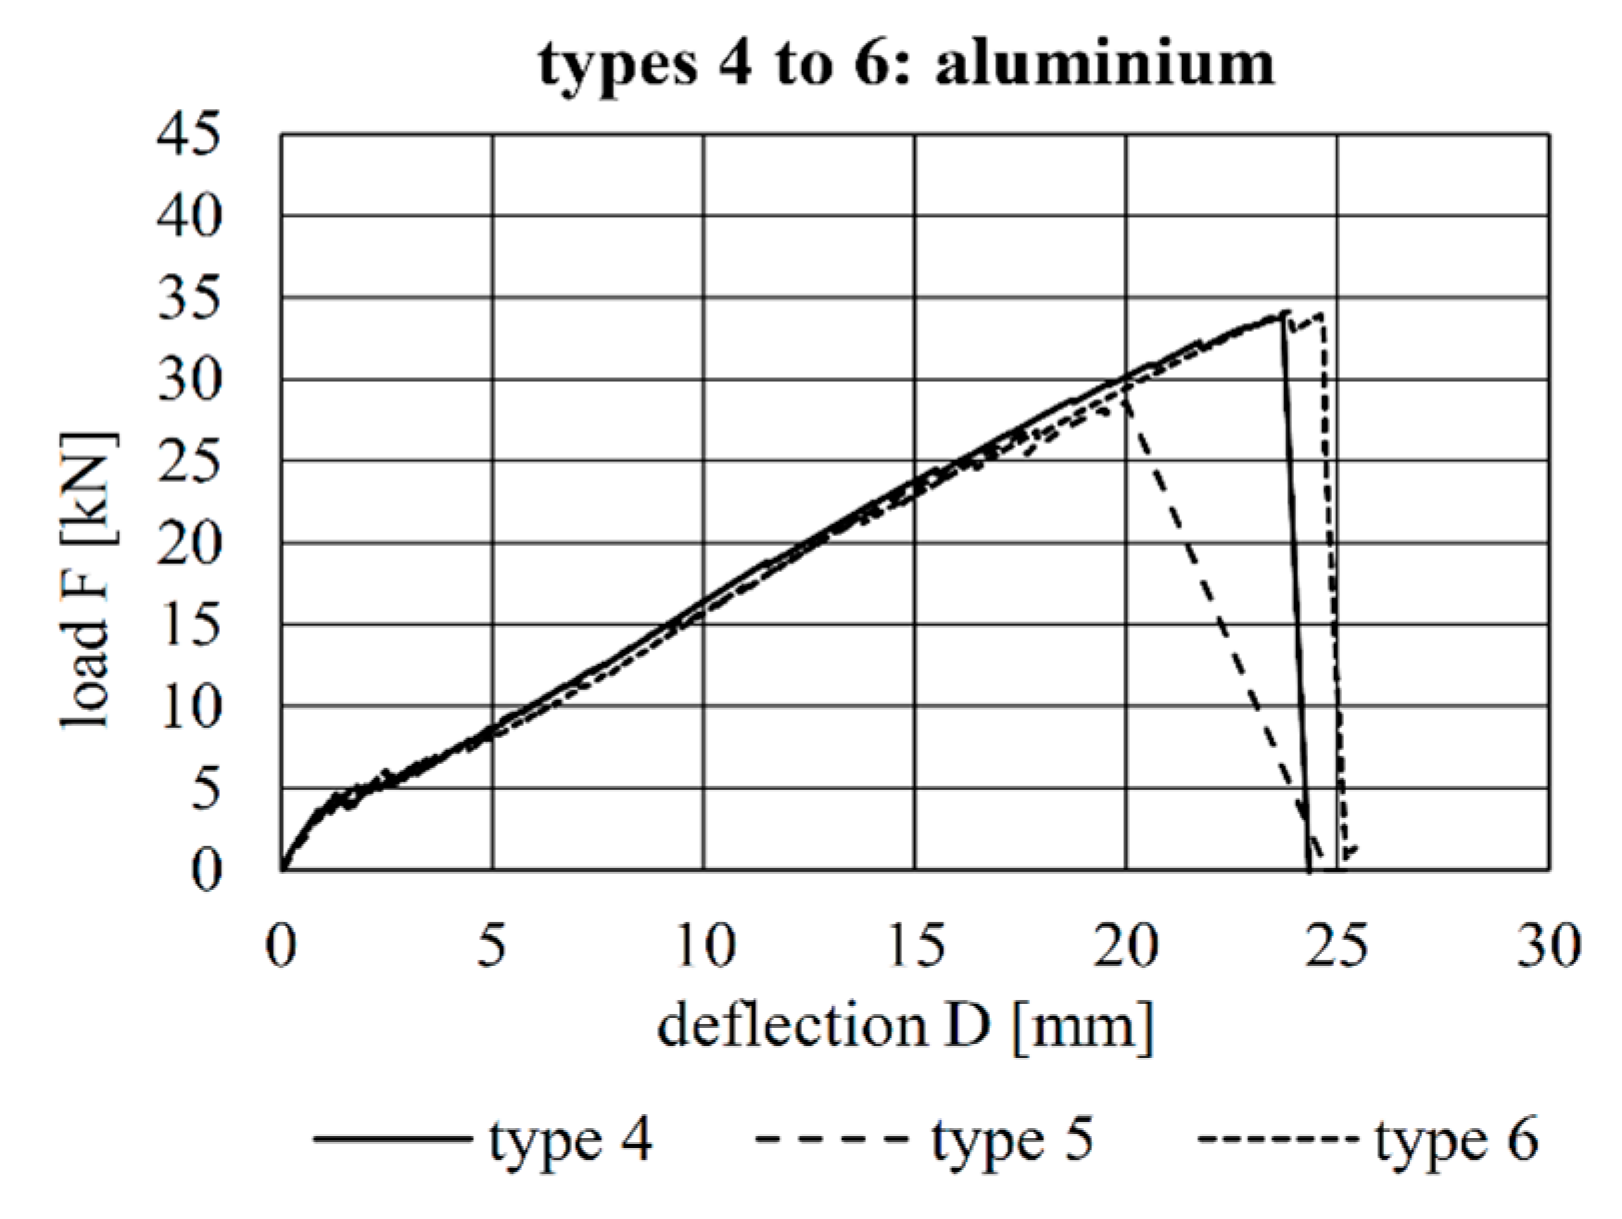
Figure 10.
Load–deflection behaviour of the specimens with implant Types 4–6.
Figure 10.
Load–deflection behaviour of the specimens with implant Types 4–6.
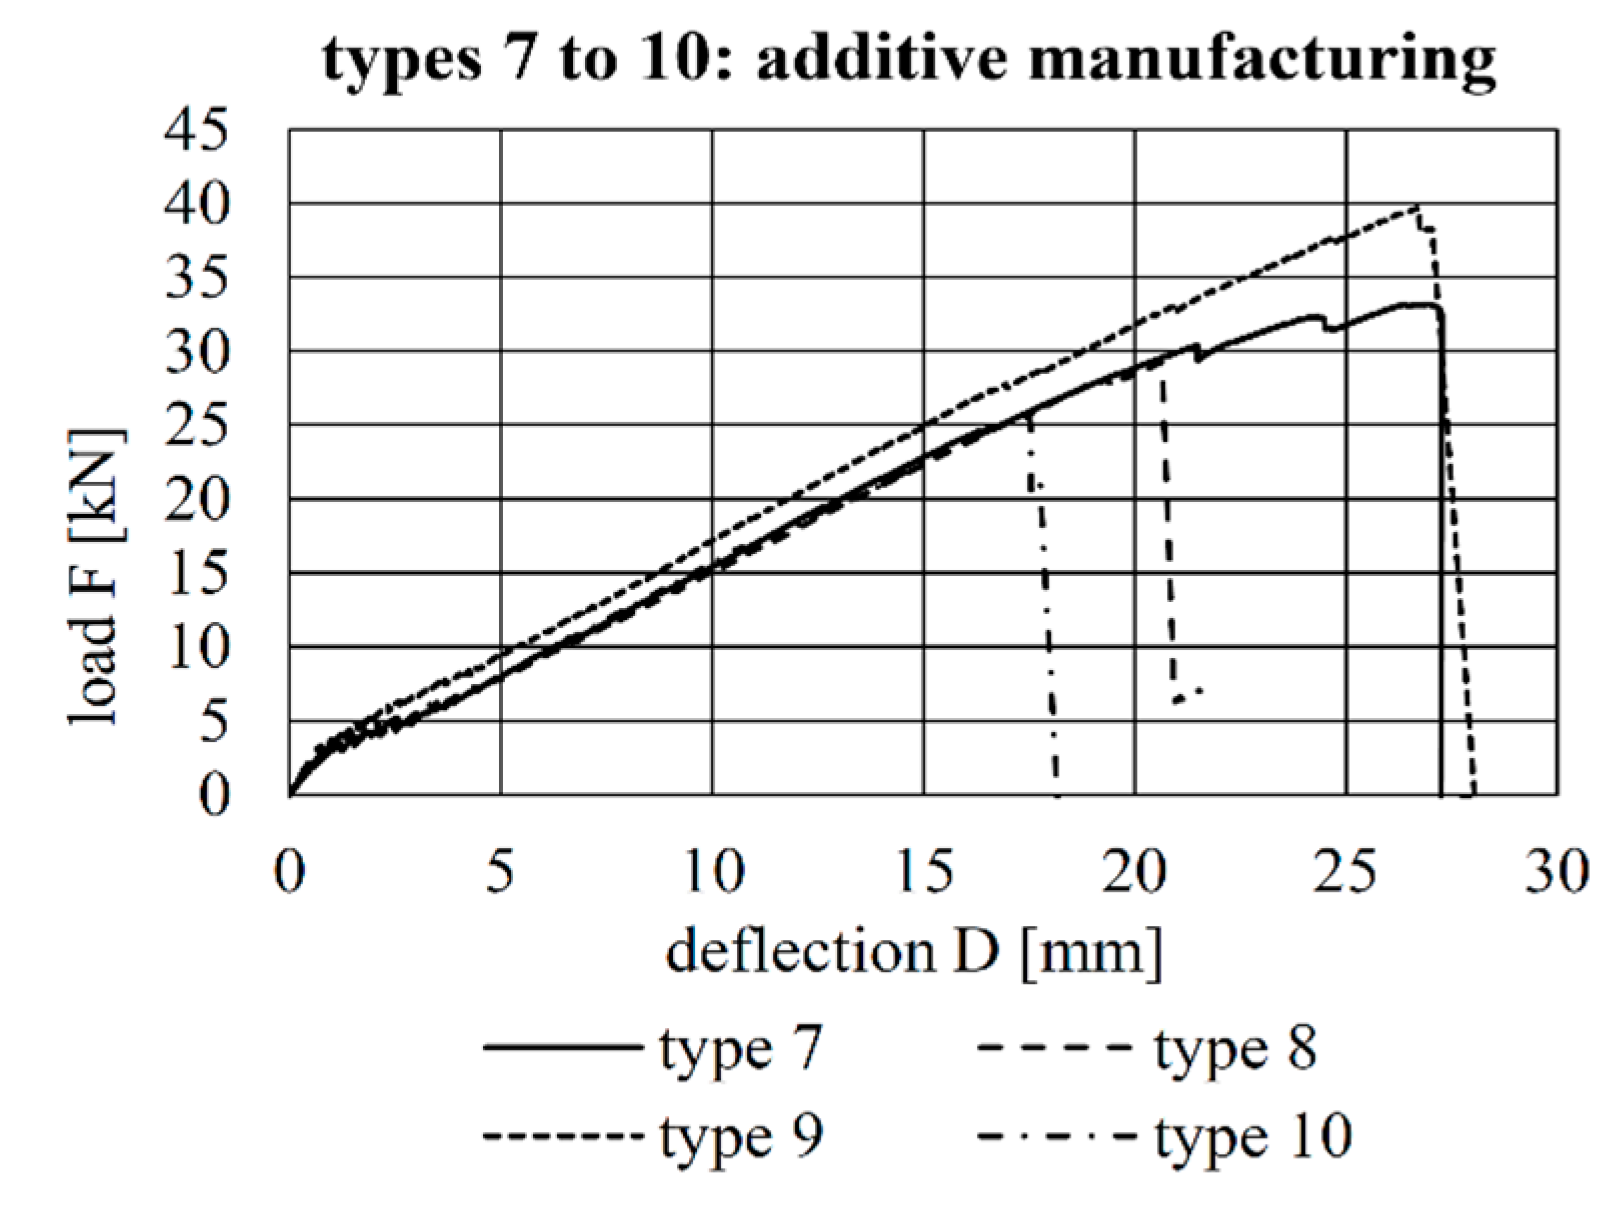
Figure 11.
Load–deflection behaviour of the specimens with implant Types 7–10.
Figure 11.
Load–deflection behaviour of the specimens with implant Types 7–10.
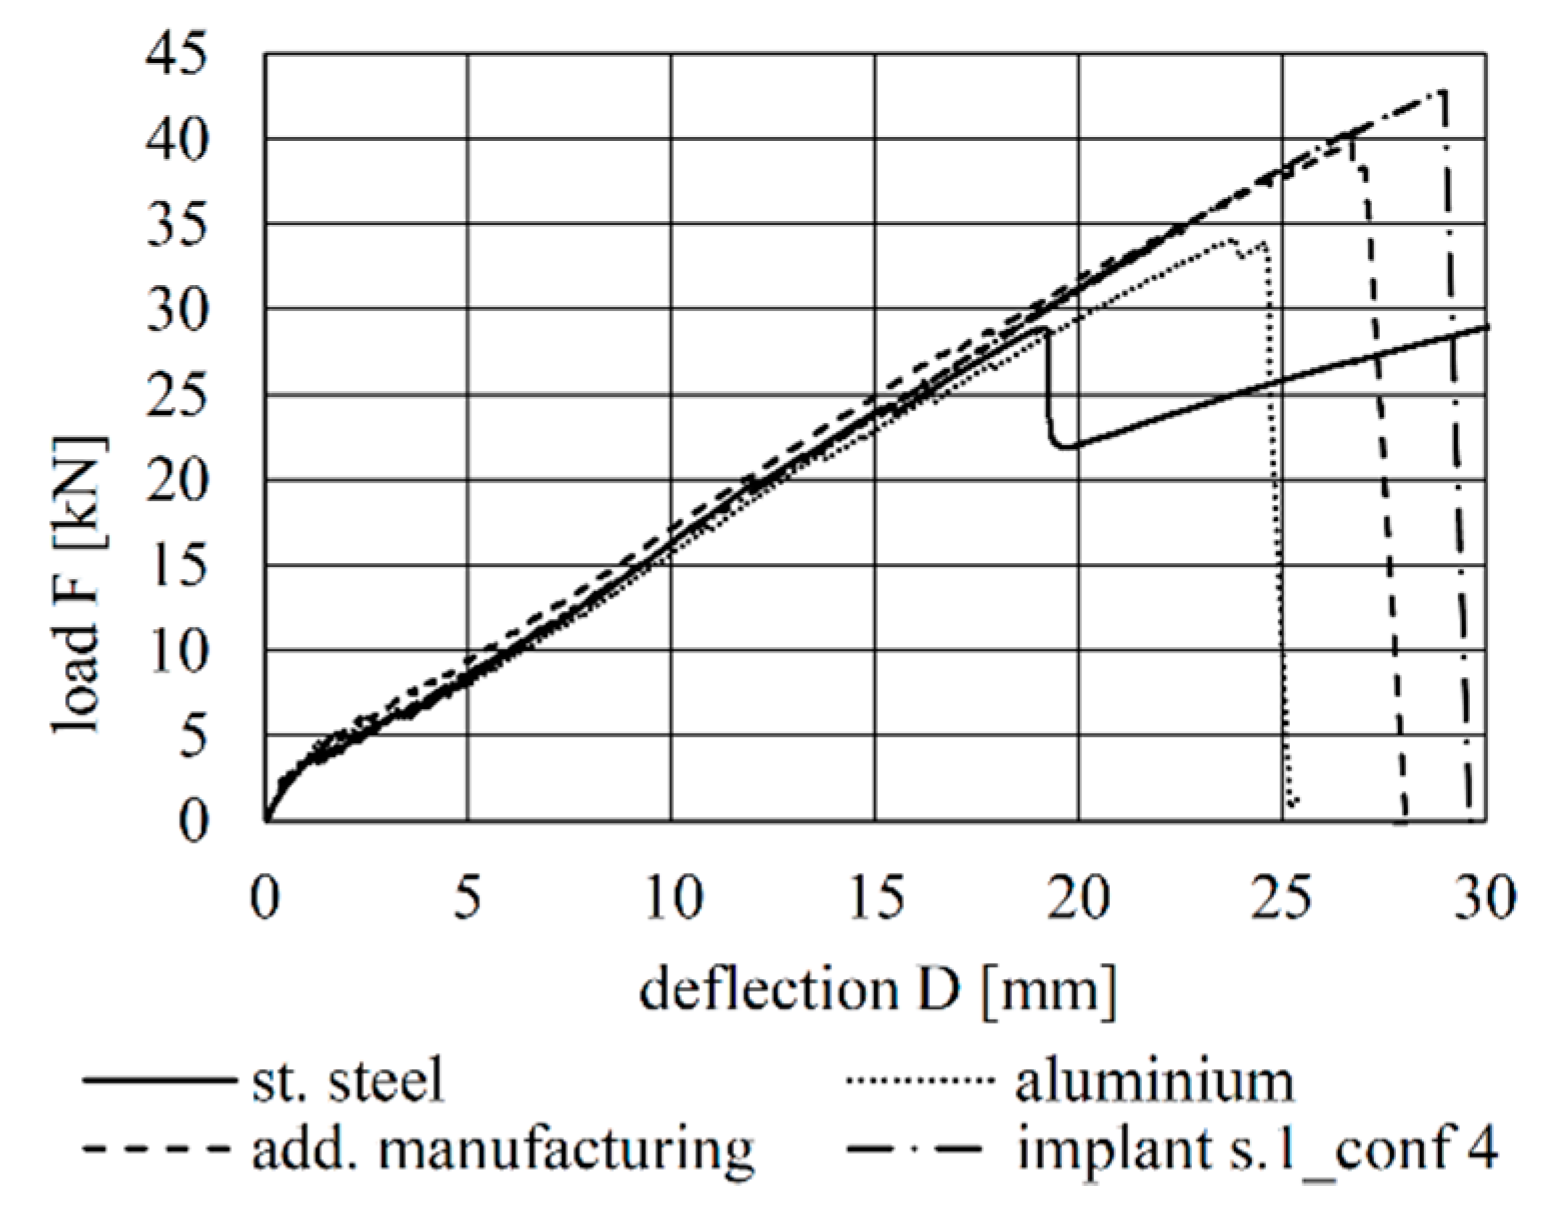
Figure 12.
Load–deflection behaviour of the best-performing specimens of the second-generation implants and of the best-performing specimen of the first-generation implants [
1].
Figure 12.
Load–deflection behaviour of the best-performing specimens of the second-generation implants and of the best-performing specimen of the first-generation implants [
1].
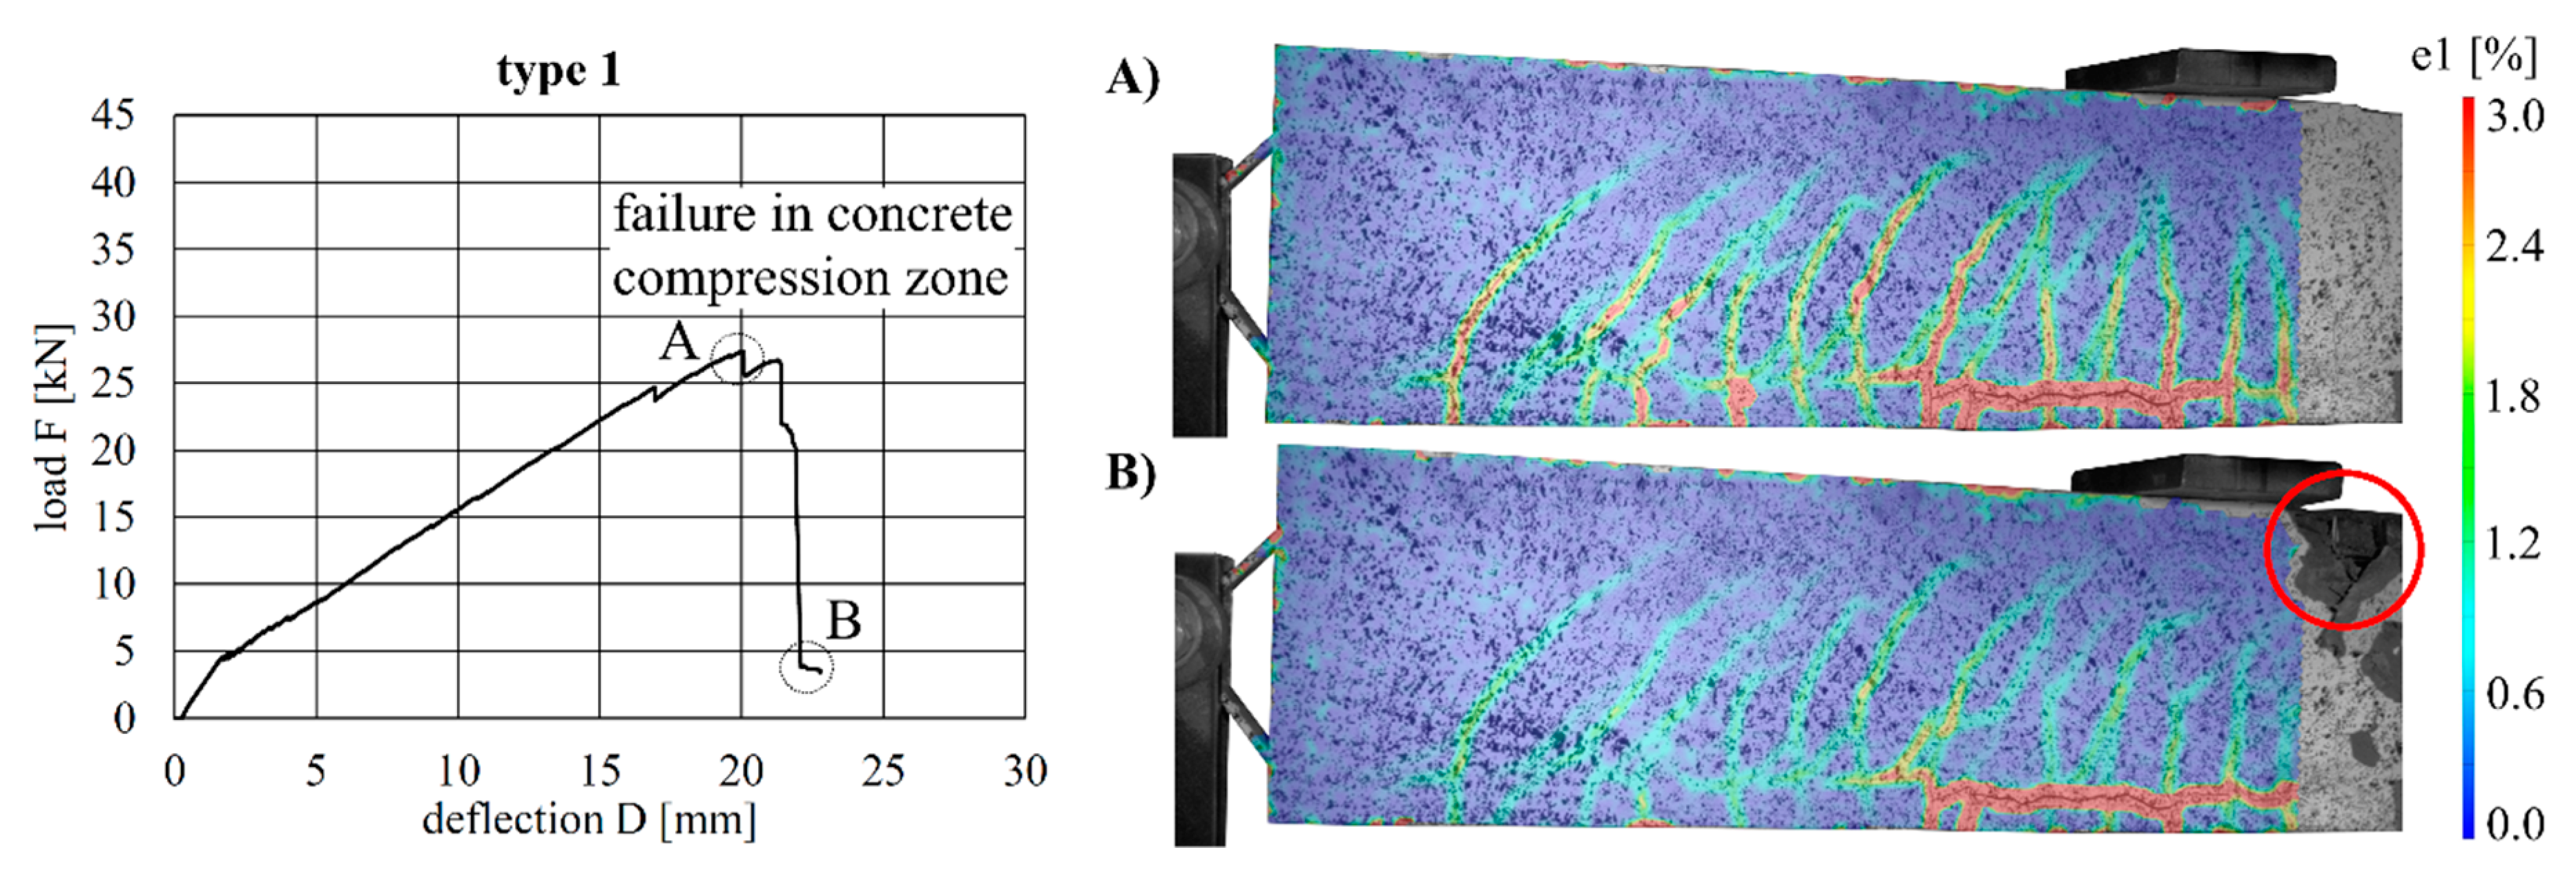
Figure 13.
Load–deflection curve of implant type 1 (left) and strains (at the beam surface) before (A) and after (B) failure.
Figure 13.
Load–deflection curve of implant type 1 (left) and strains (at the beam surface) before (A) and after (B) failure.
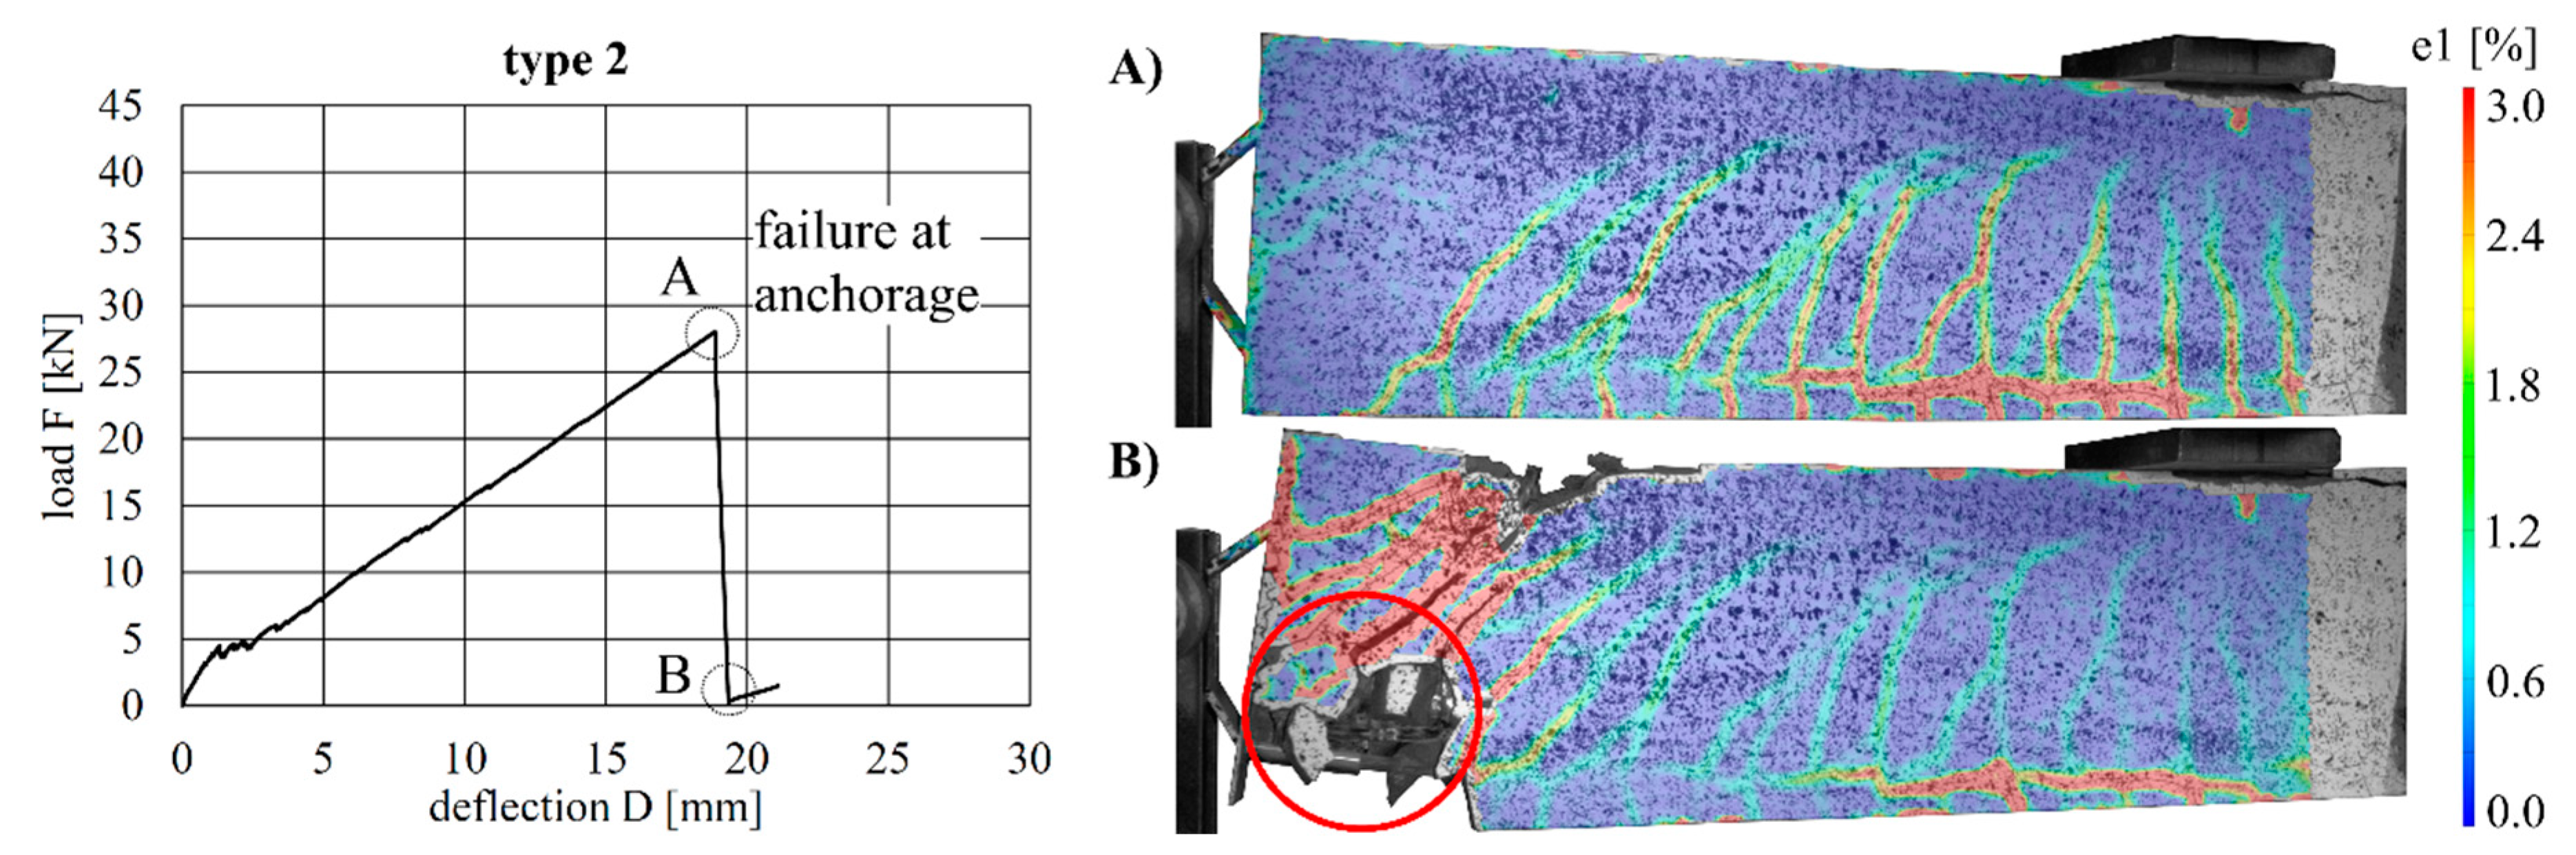
Figure 14.
Load–deflection curve of implant type 2 (left) and strains before (A) and after (B) failure.
Figure 14.
Load–deflection curve of implant type 2 (left) and strains before (A) and after (B) failure.
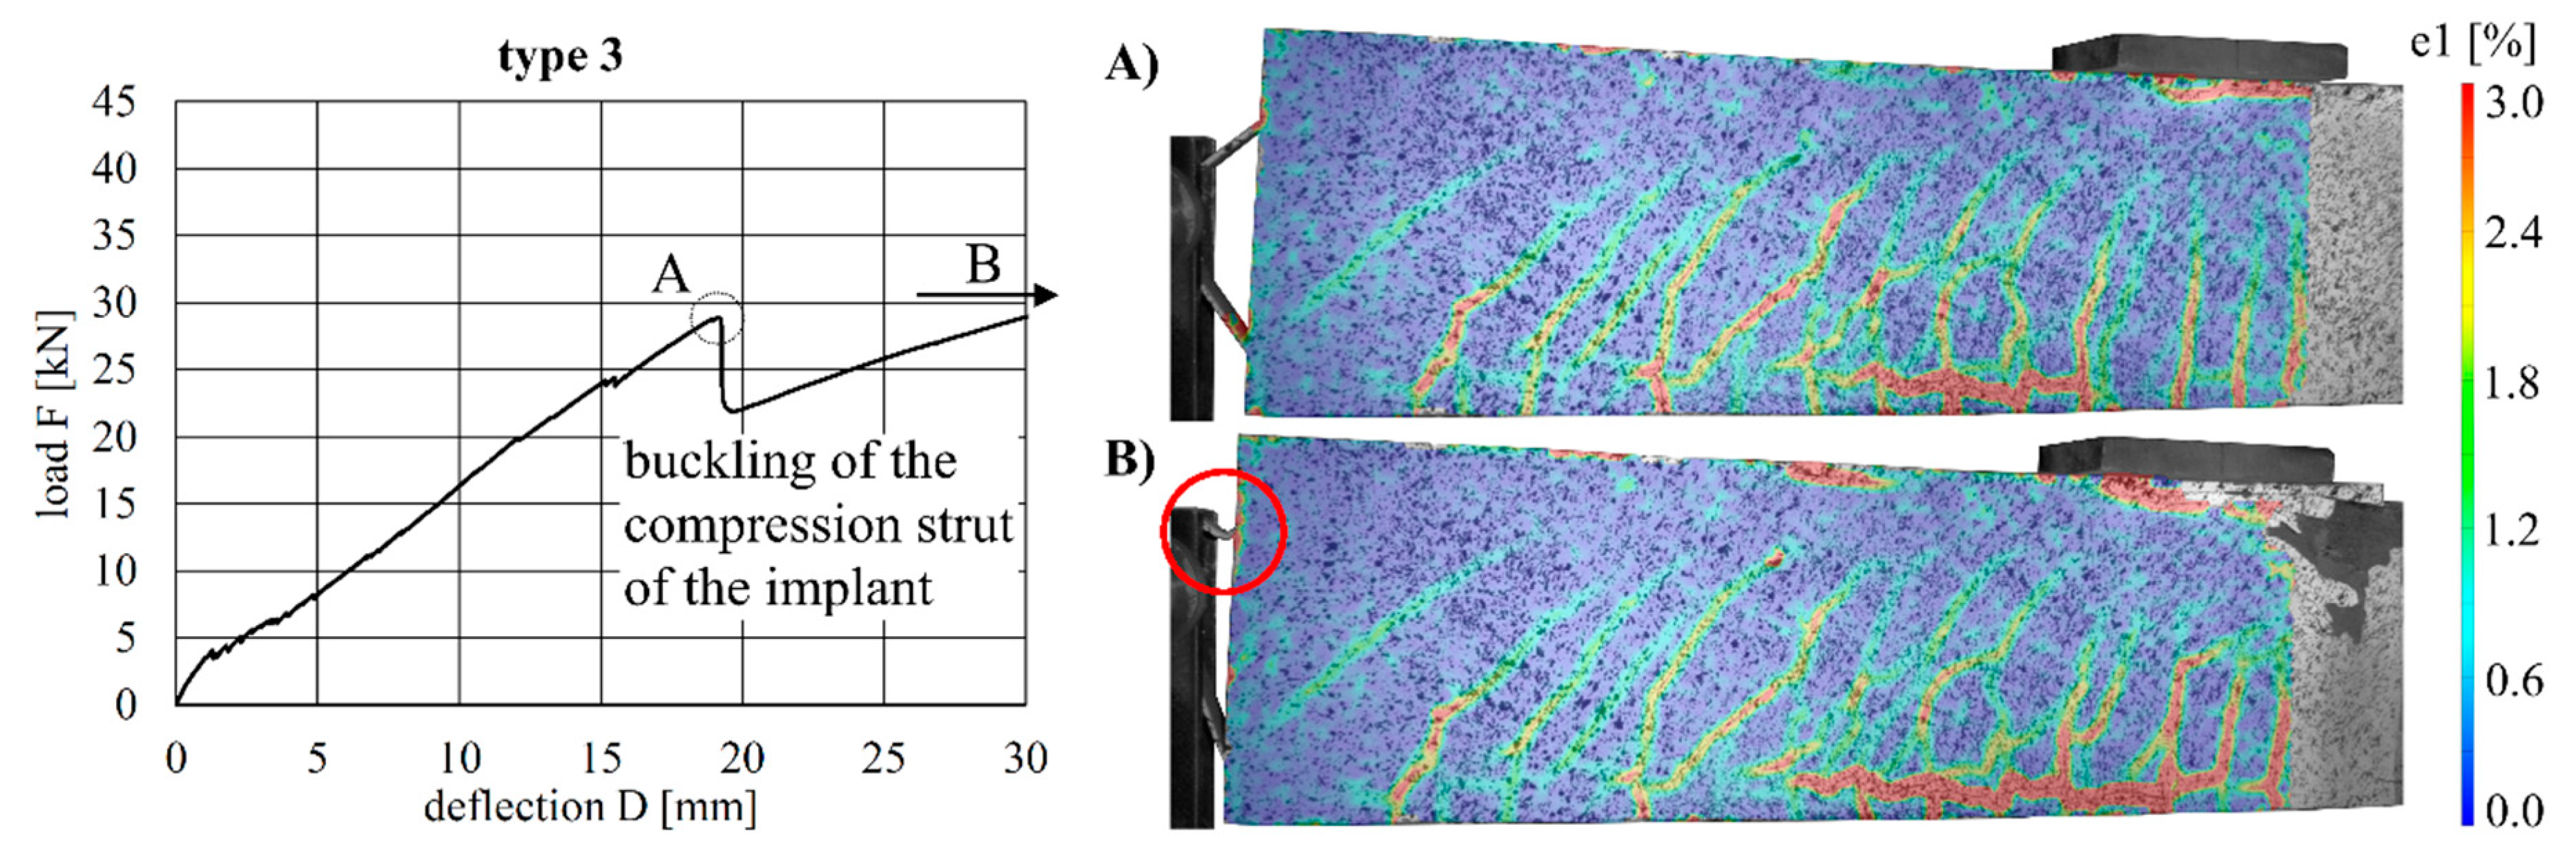
Figure 15.
Load–deflection curve of implant type 3 (left) and strains before (A) and after (B) failure.
Figure 15.
Load–deflection curve of implant type 3 (left) and strains before (A) and after (B) failure.
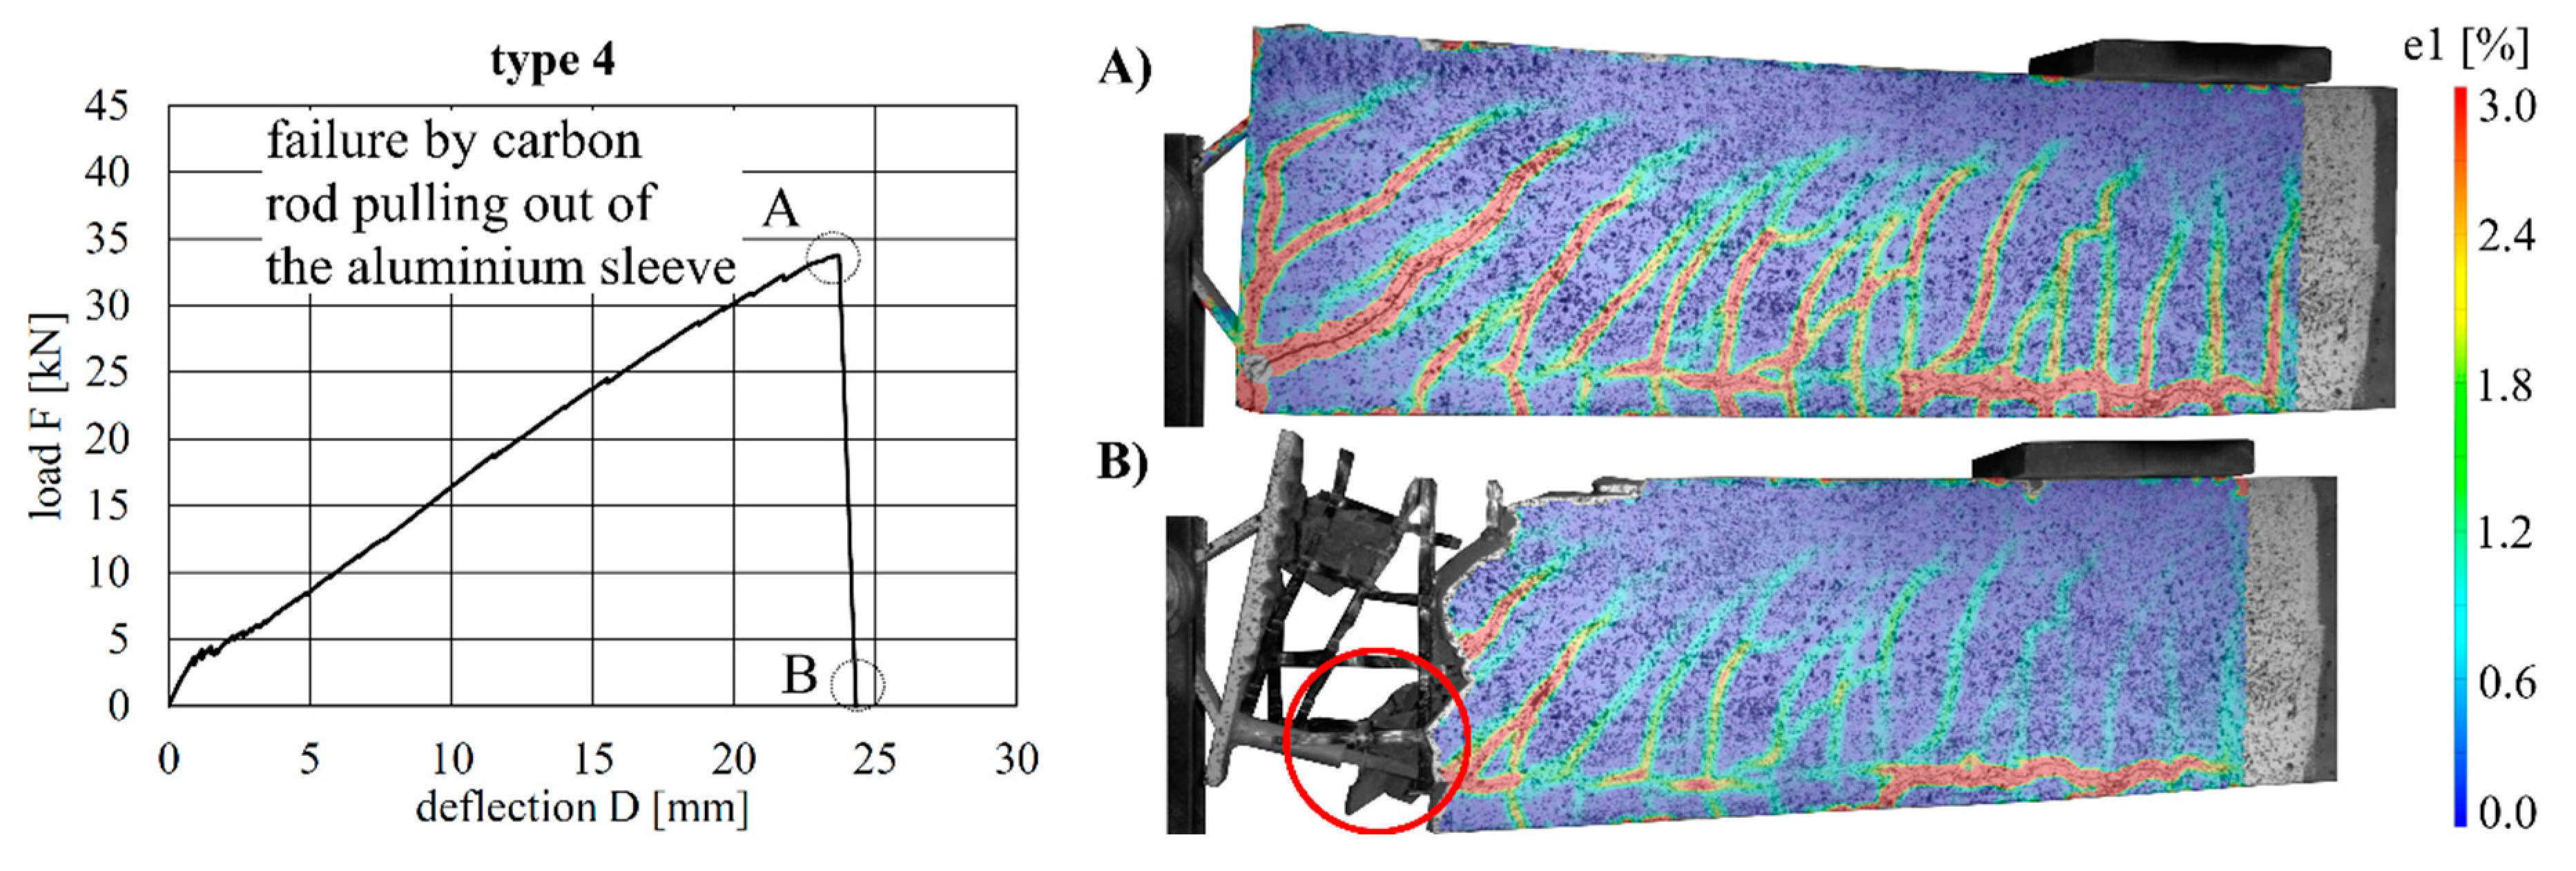
Figure 16.
Load–deflection curve of implant type 4 (left) and strains before (A) and after (B) failure.
Figure 16.
Load–deflection curve of implant type 4 (left) and strains before (A) and after (B) failure.
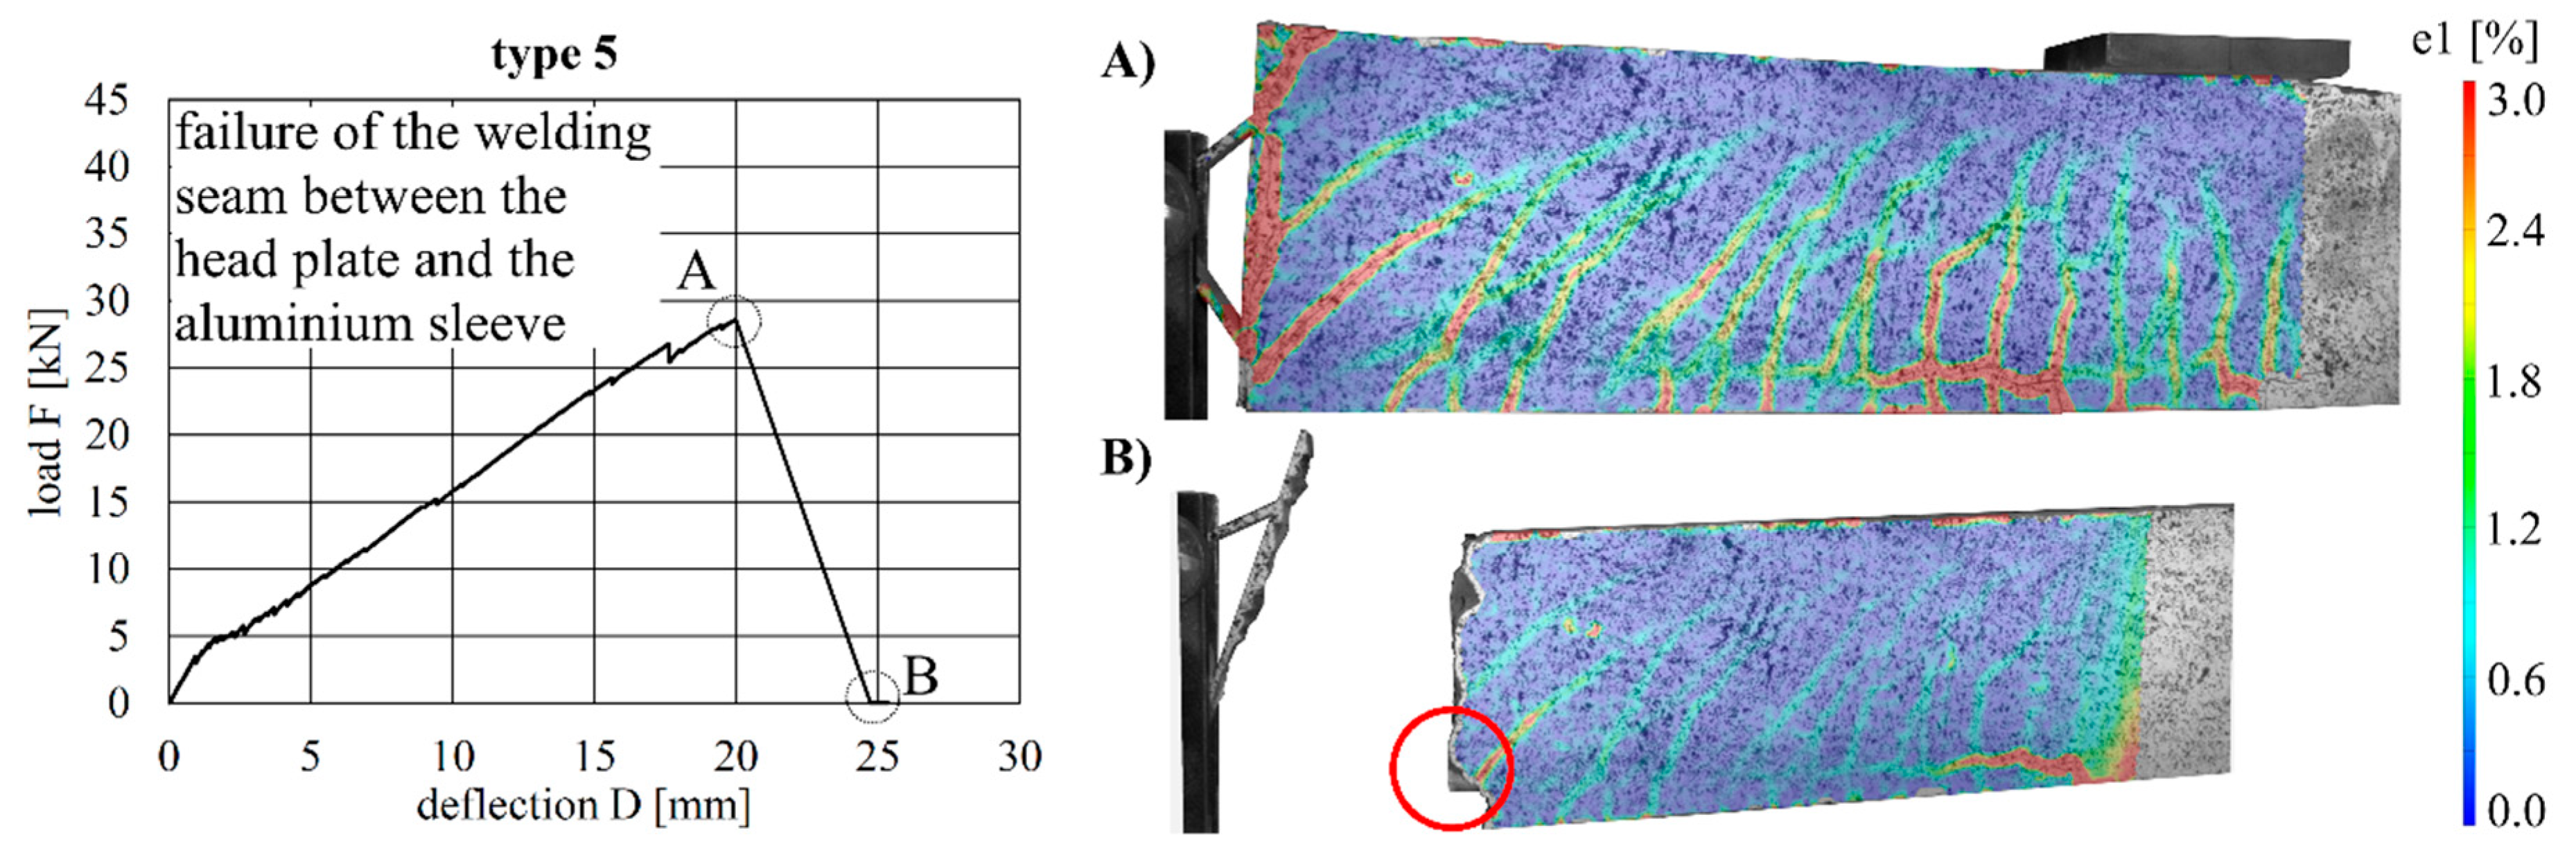
Figure 17.
Load–deflection curve of implant type 5 (left) and strains before (A) and after (B) failure.
Figure 17.
Load–deflection curve of implant type 5 (left) and strains before (A) and after (B) failure.
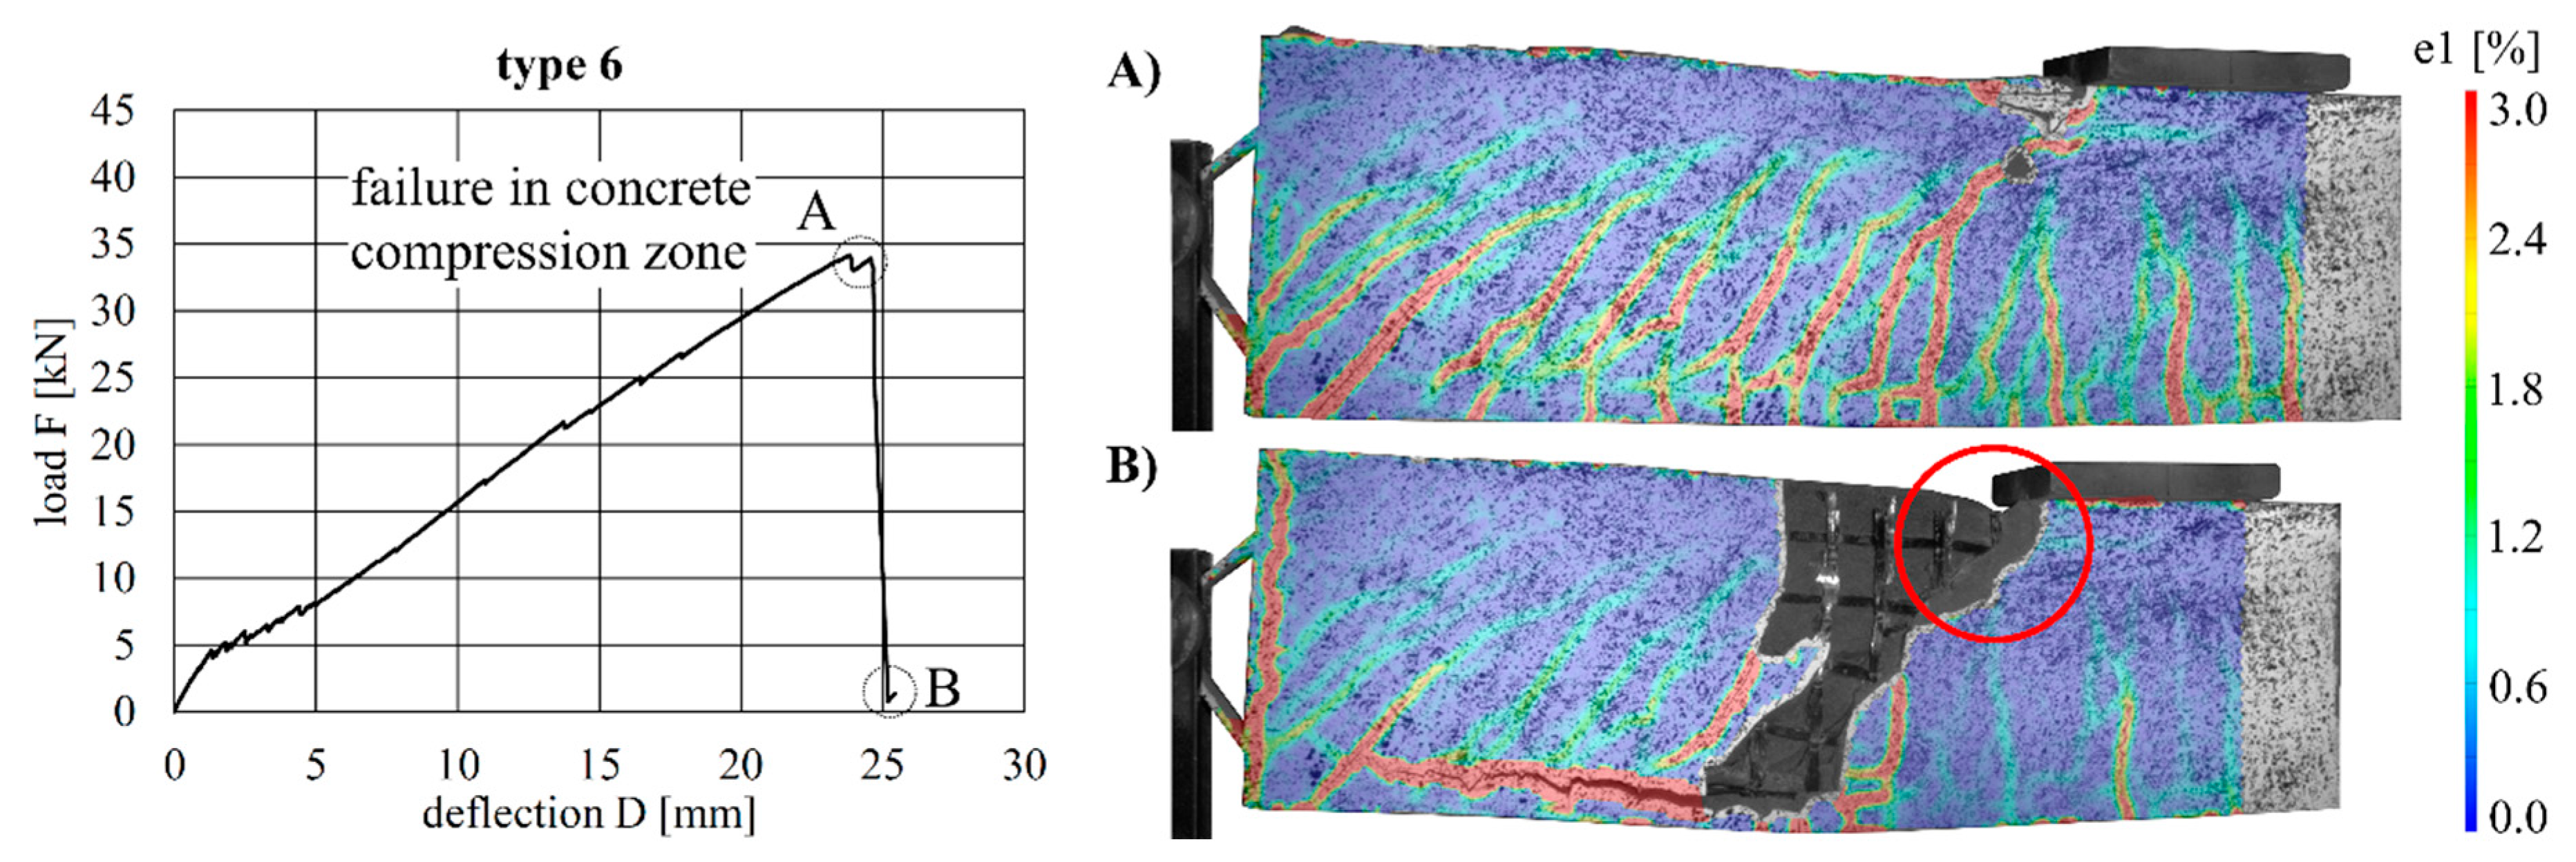
Figure 18.
Load–deflection curve of implant type 6 (left) and strains before (A) and after (B) failure.
Figure 18.
Load–deflection curve of implant type 6 (left) and strains before (A) and after (B) failure.
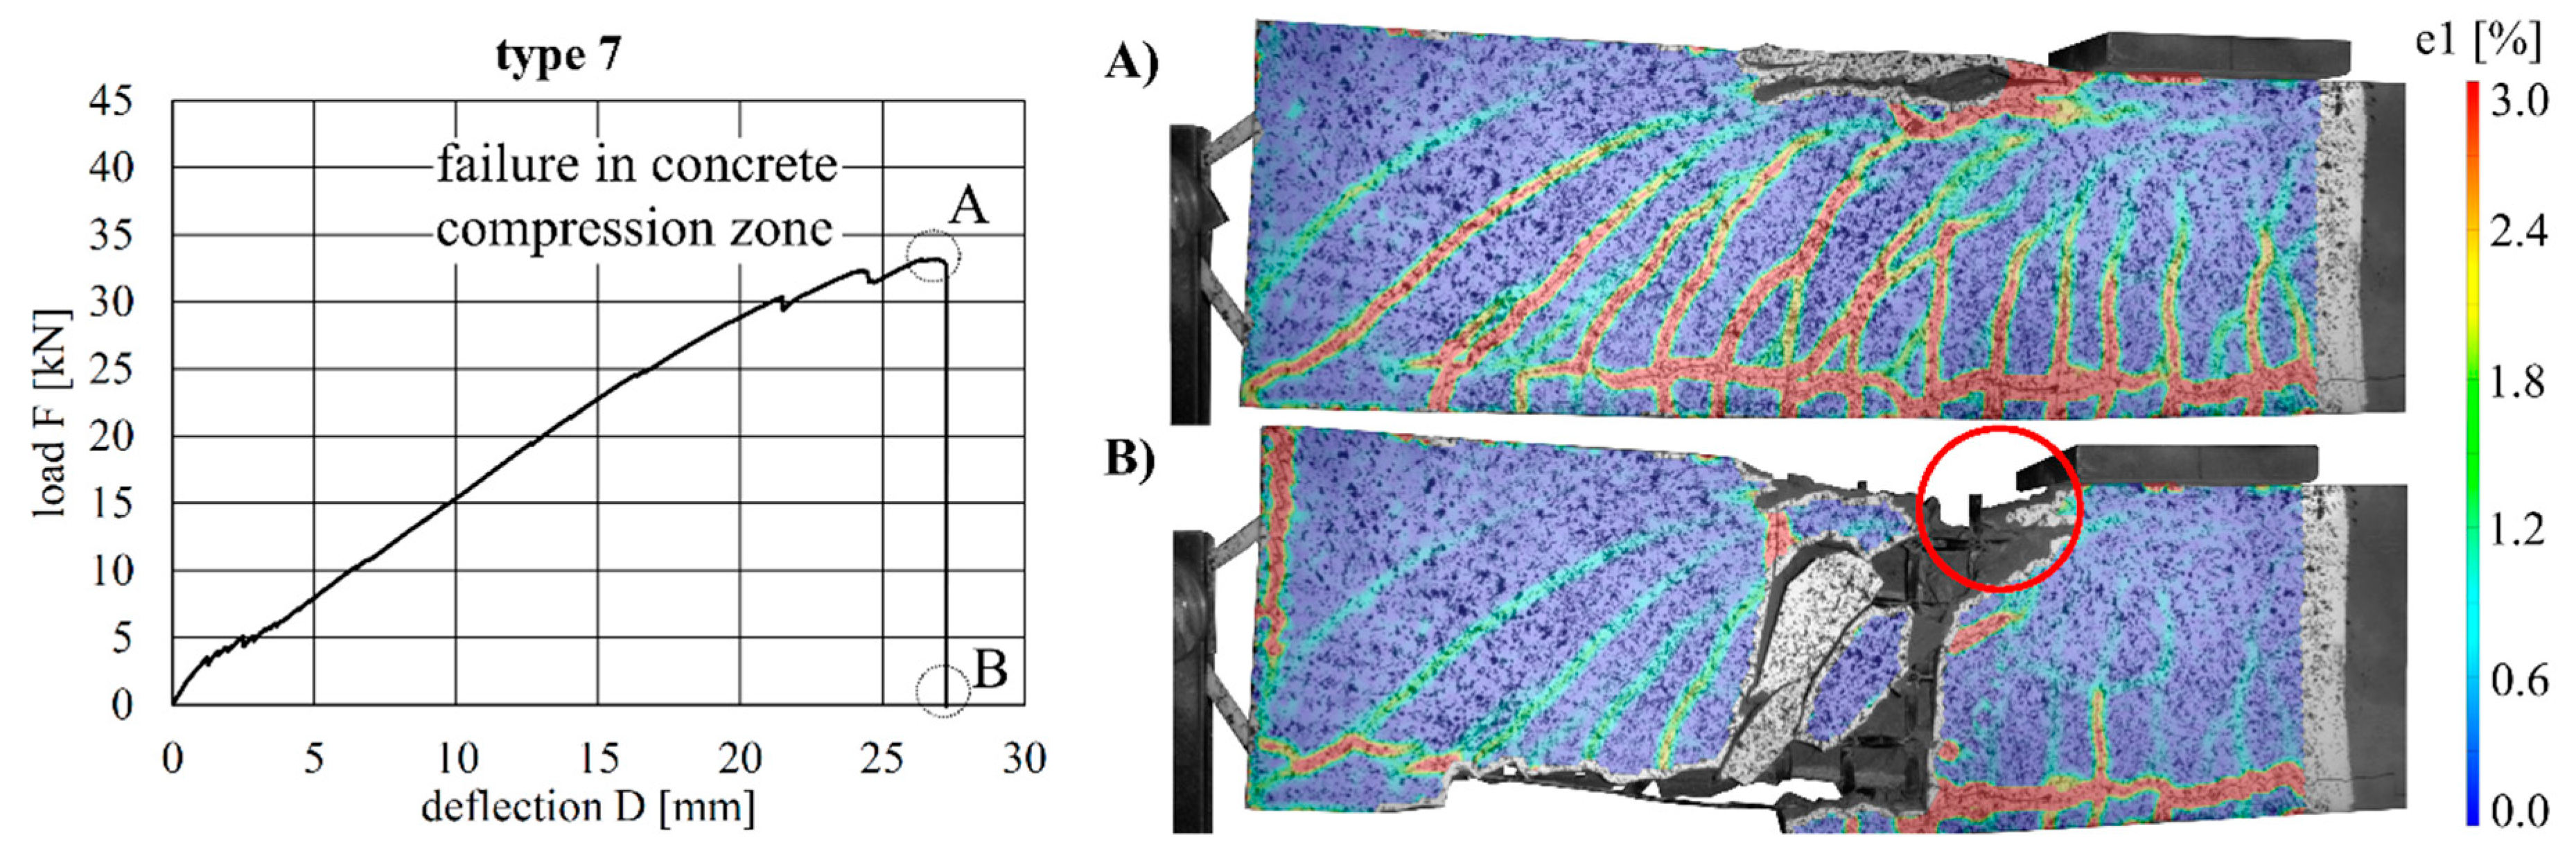
Figure 19.
Load–deflection curve of implant type 7 (left) and strains before (A) and after (B) failure.
Figure 19.
Load–deflection curve of implant type 7 (left) and strains before (A) and after (B) failure.
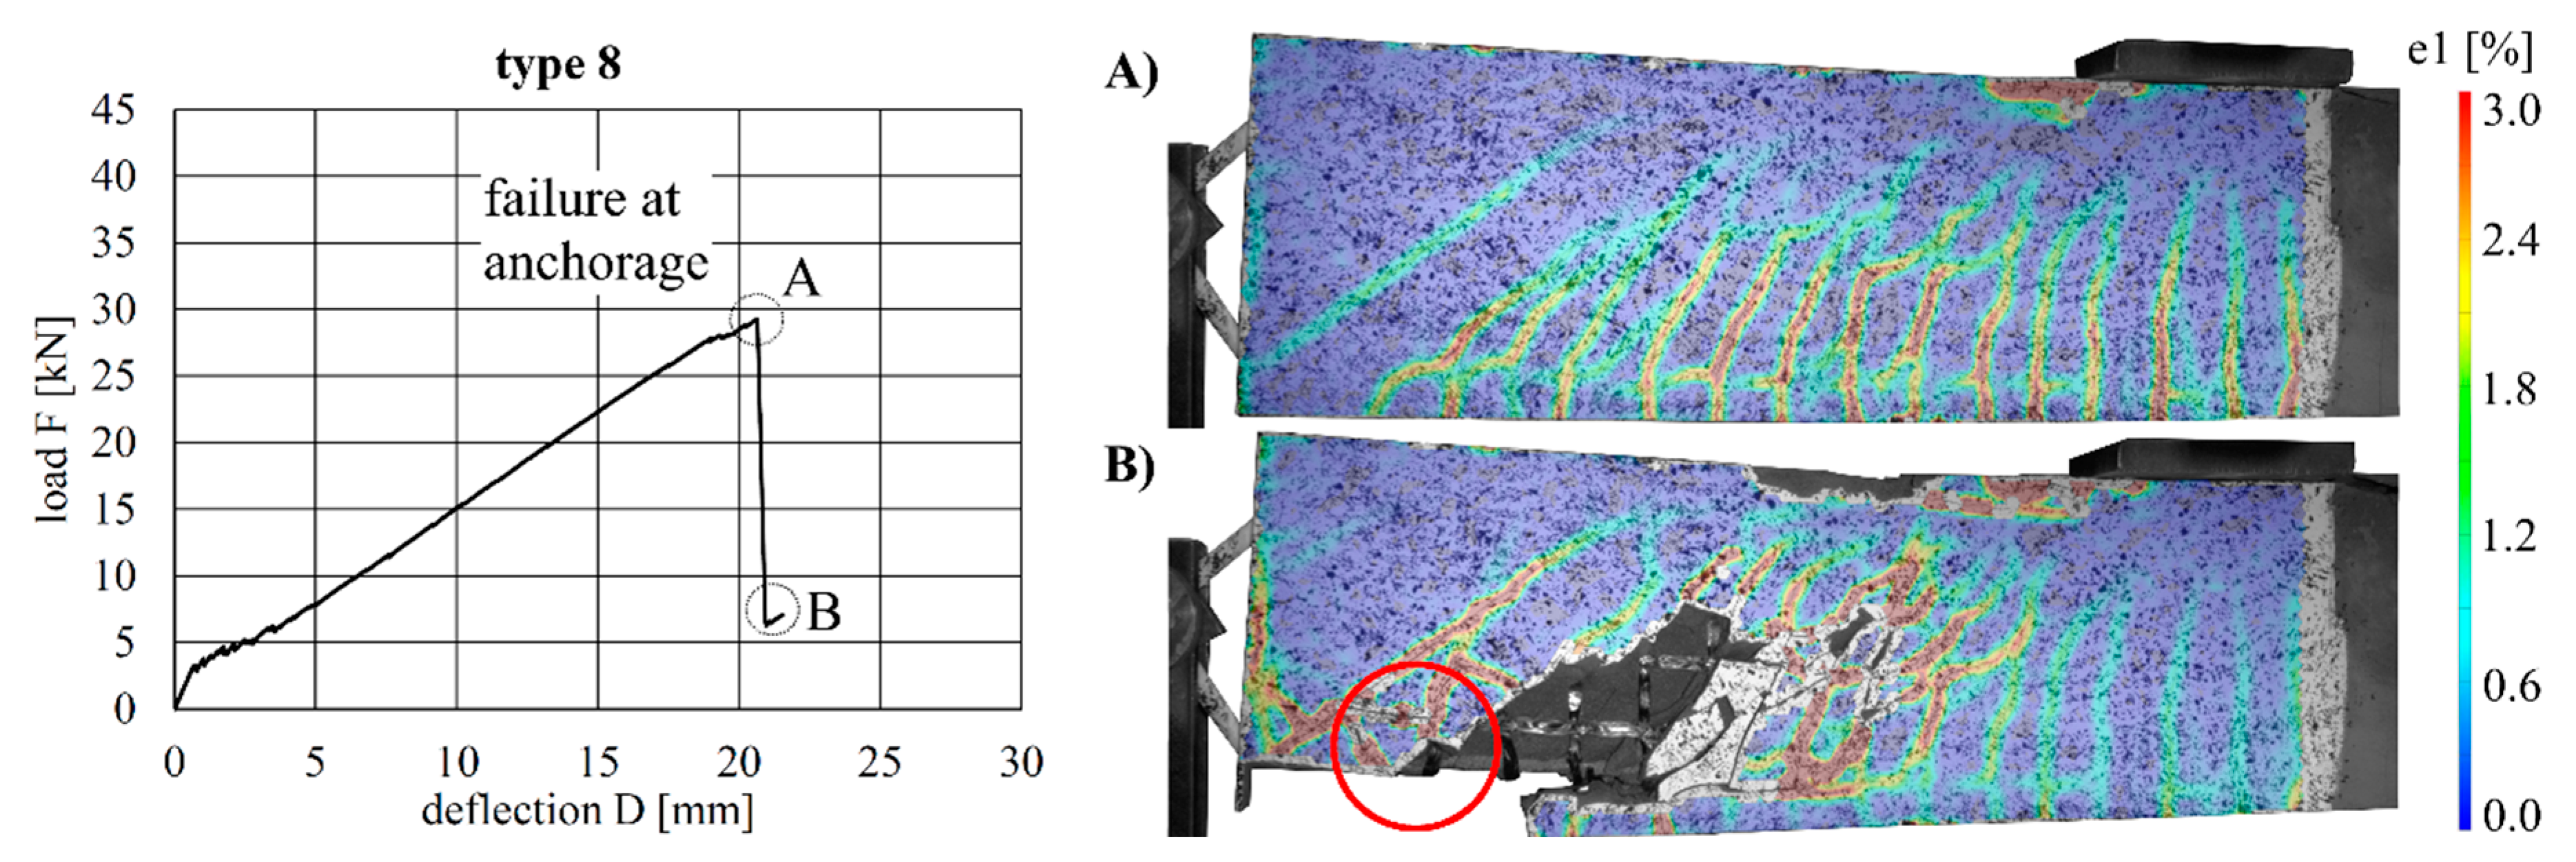
Figure 20.
Load–deflection curve of implant type 8 (left) and strains before (A) and after (B) failure.
Figure 20.
Load–deflection curve of implant type 8 (left) and strains before (A) and after (B) failure.
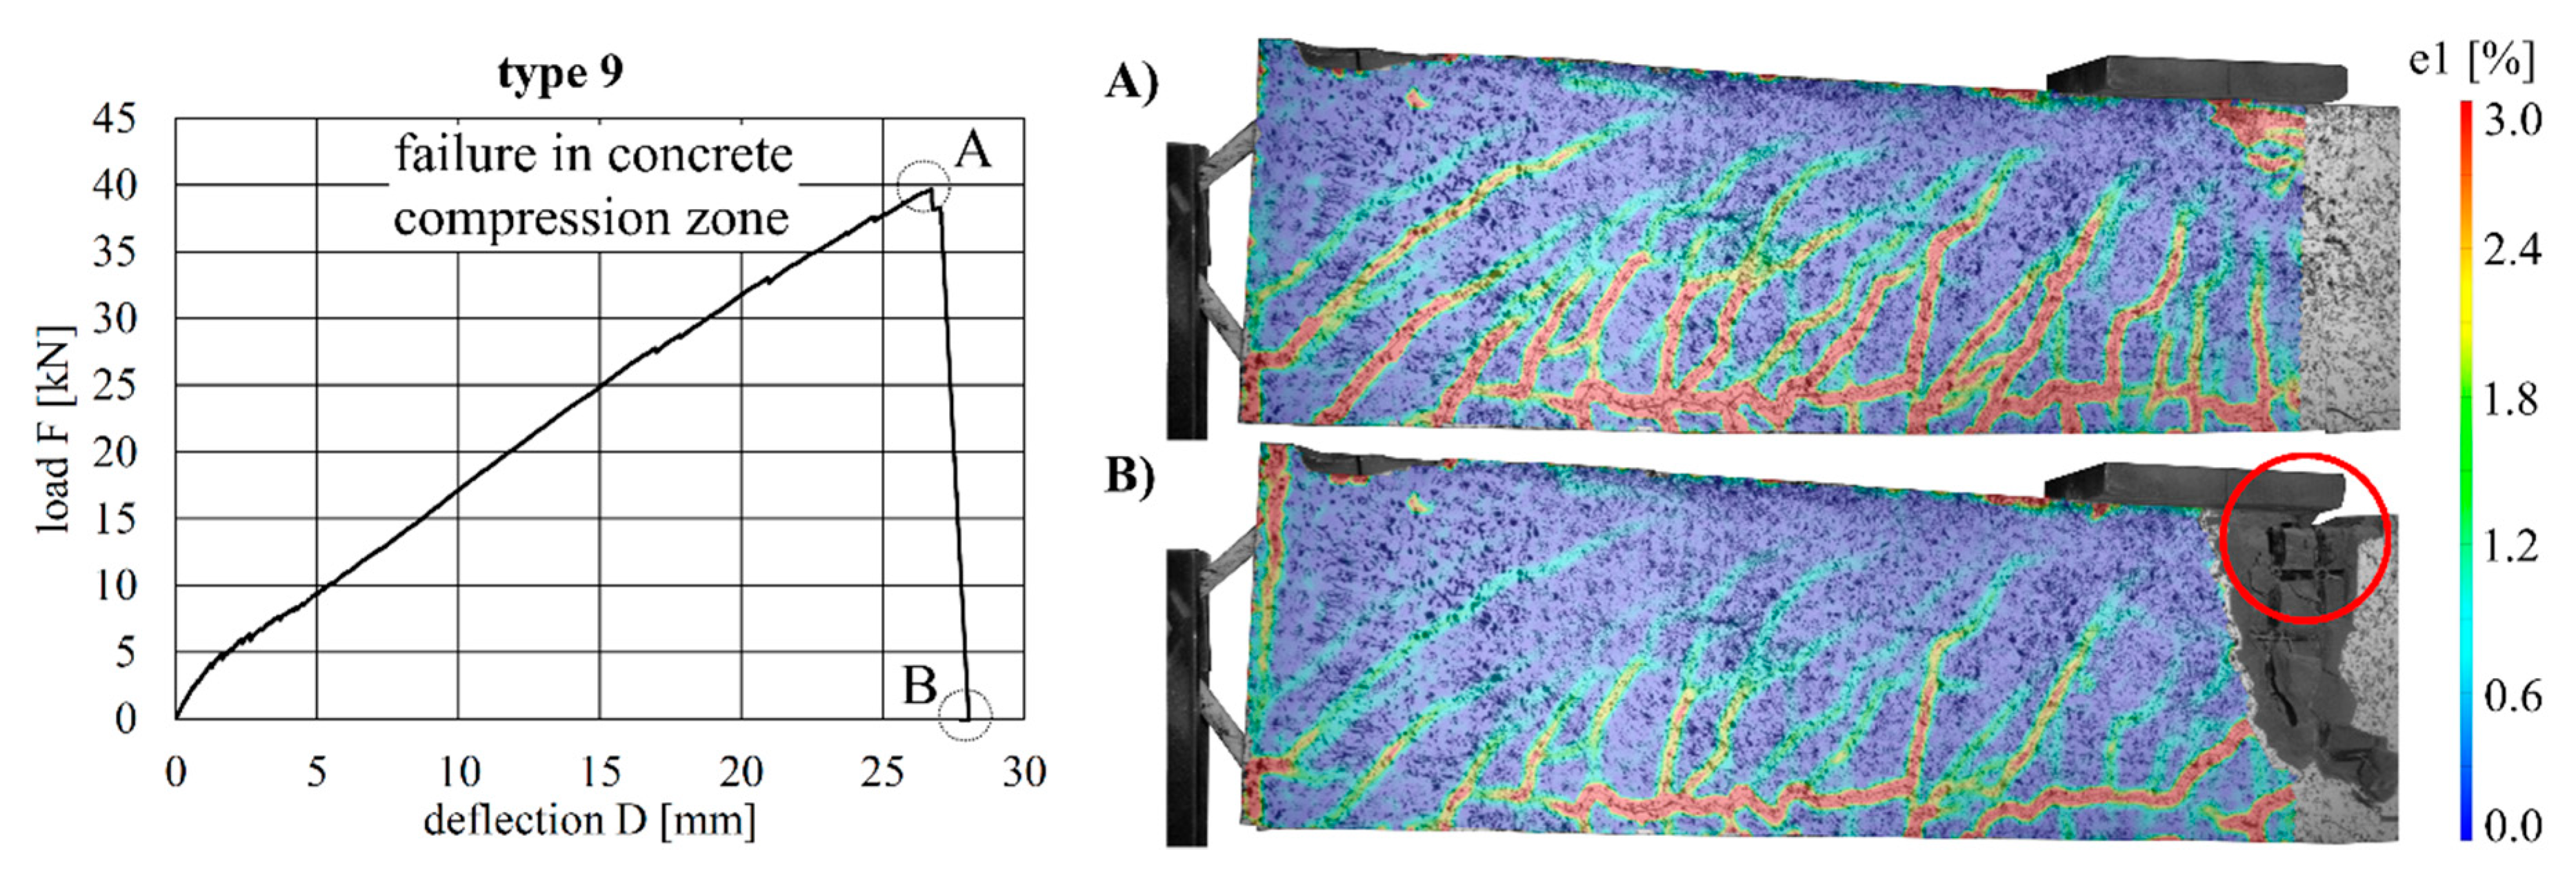
Figure 21.
Load–deflection curve of implant type 9 (left) and strains before (A) and after (B) failure.
Figure 21.
Load–deflection curve of implant type 9 (left) and strains before (A) and after (B) failure.
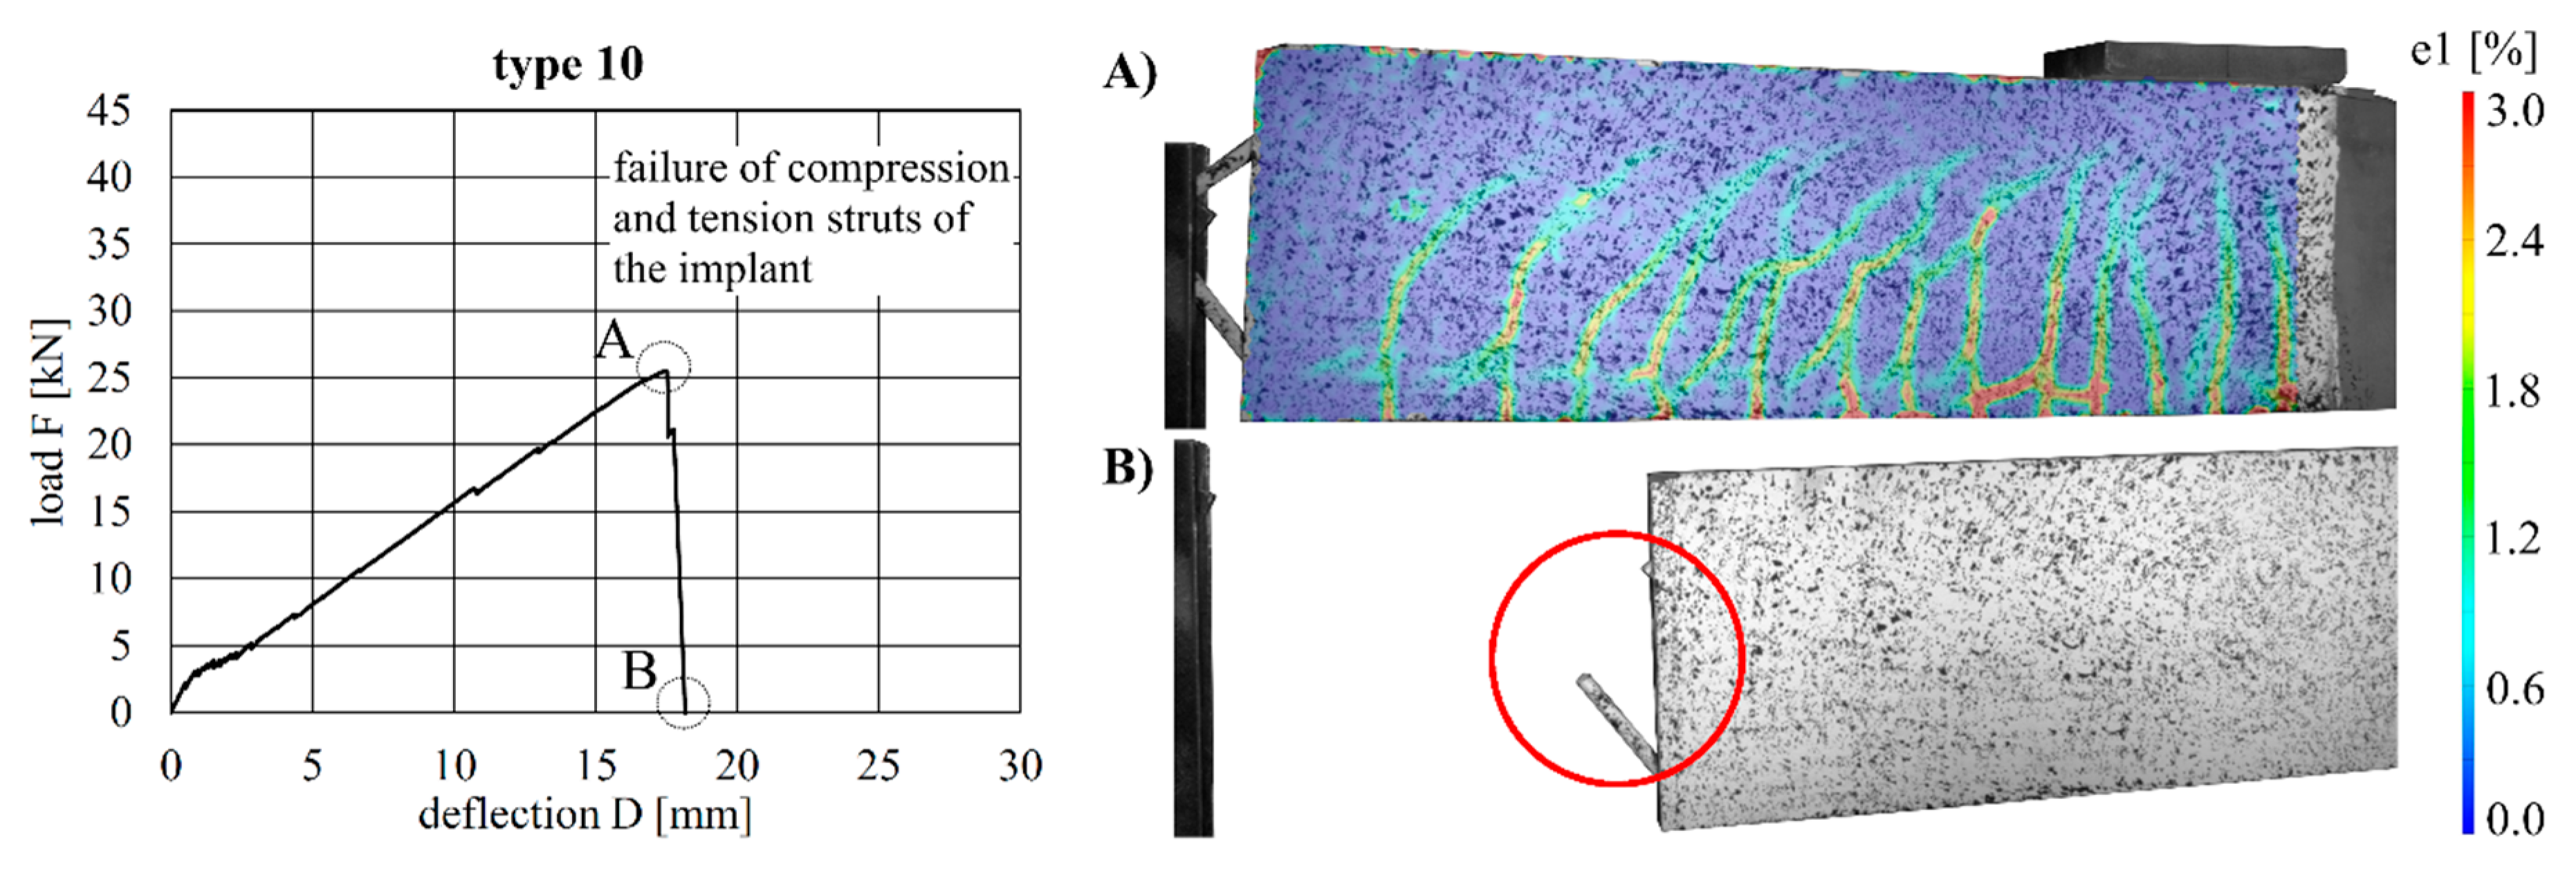
Figure 22.
Load–deflection curve of implant type 10 (left) and strains before (A) and after (B) failure.
Figure 22.
Load–deflection curve of implant type 10 (left) and strains before (A) and after (B) failure.
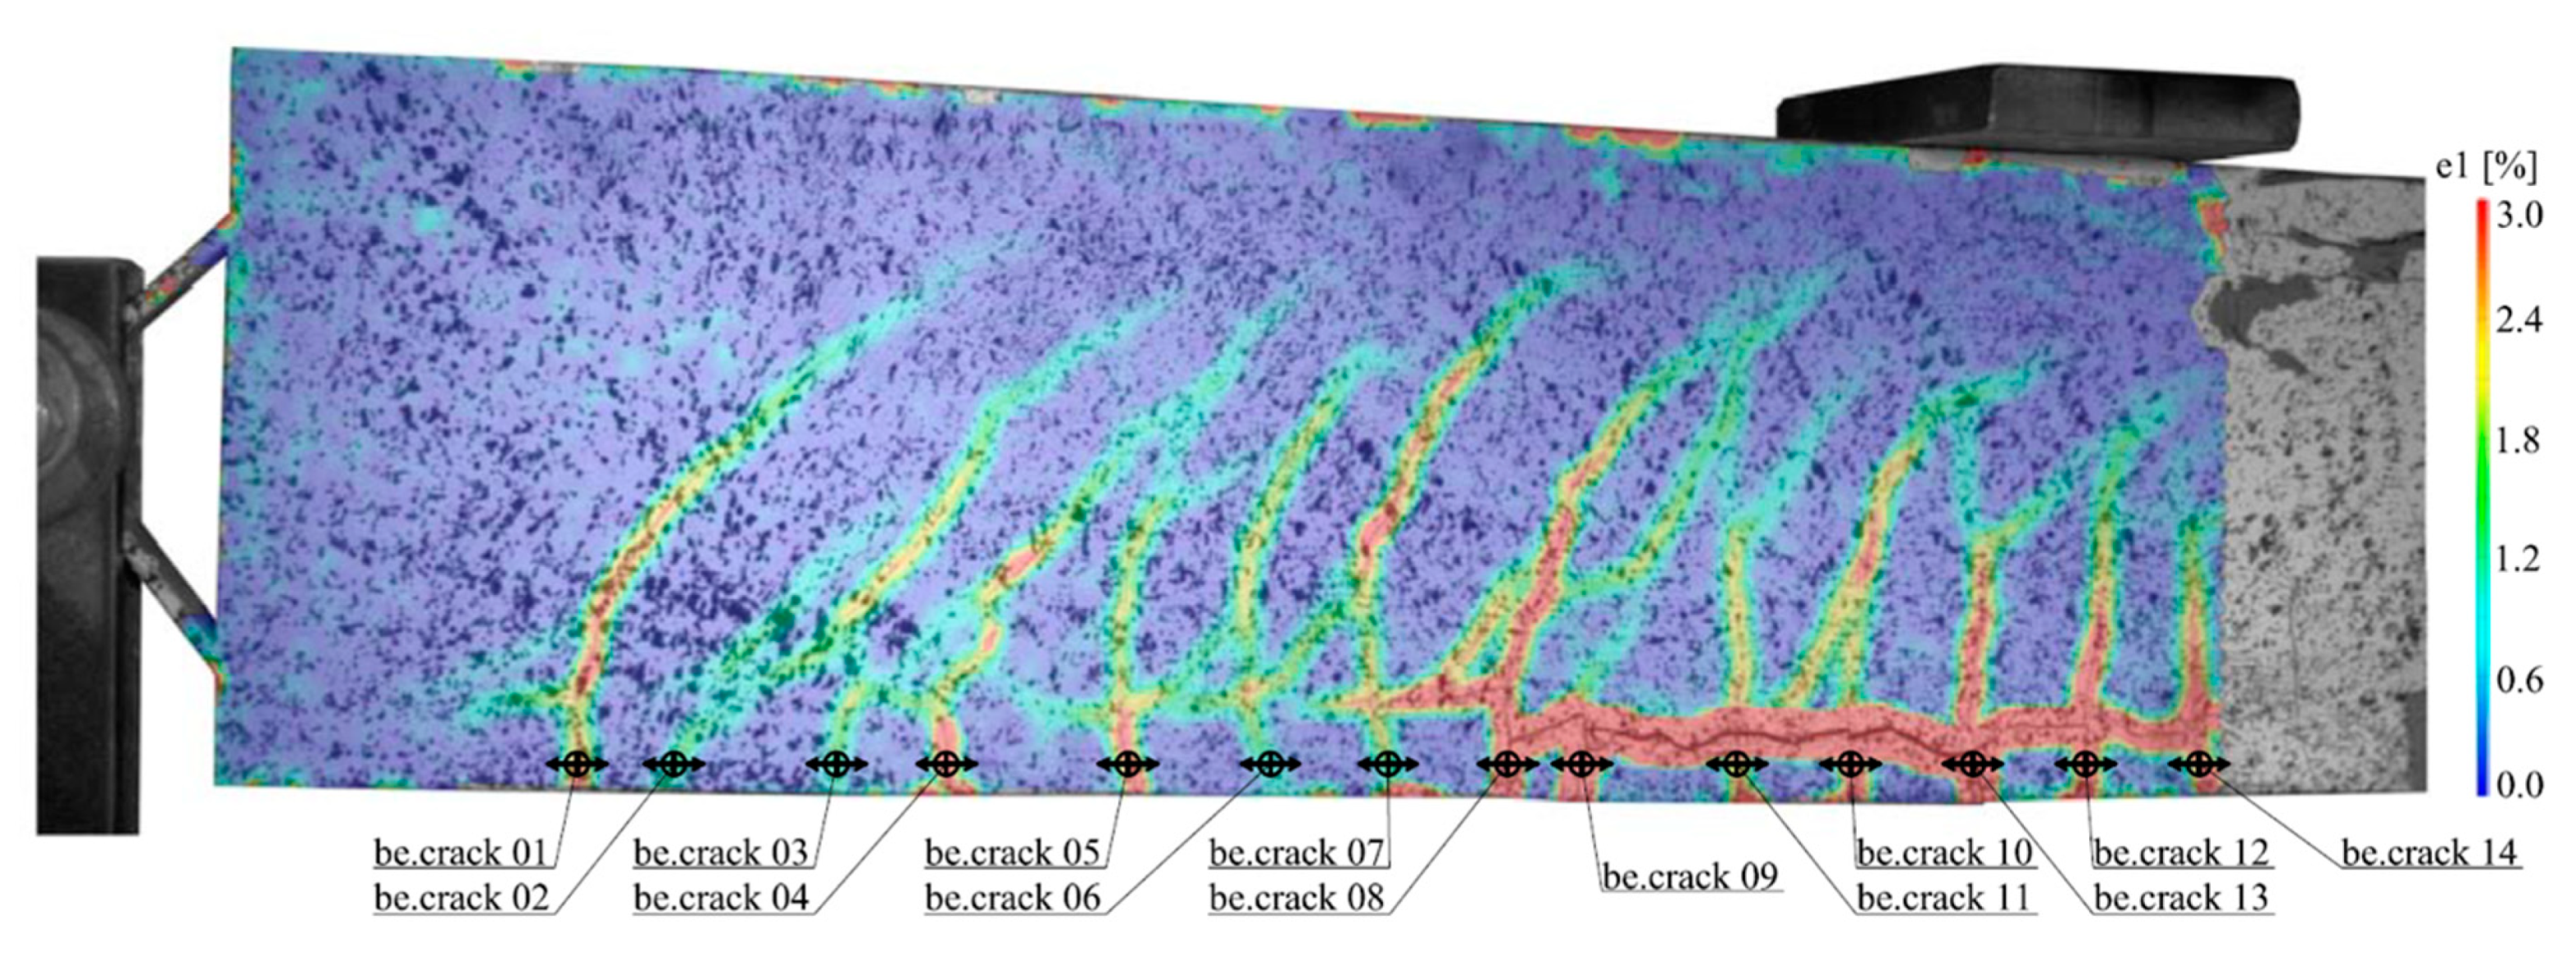
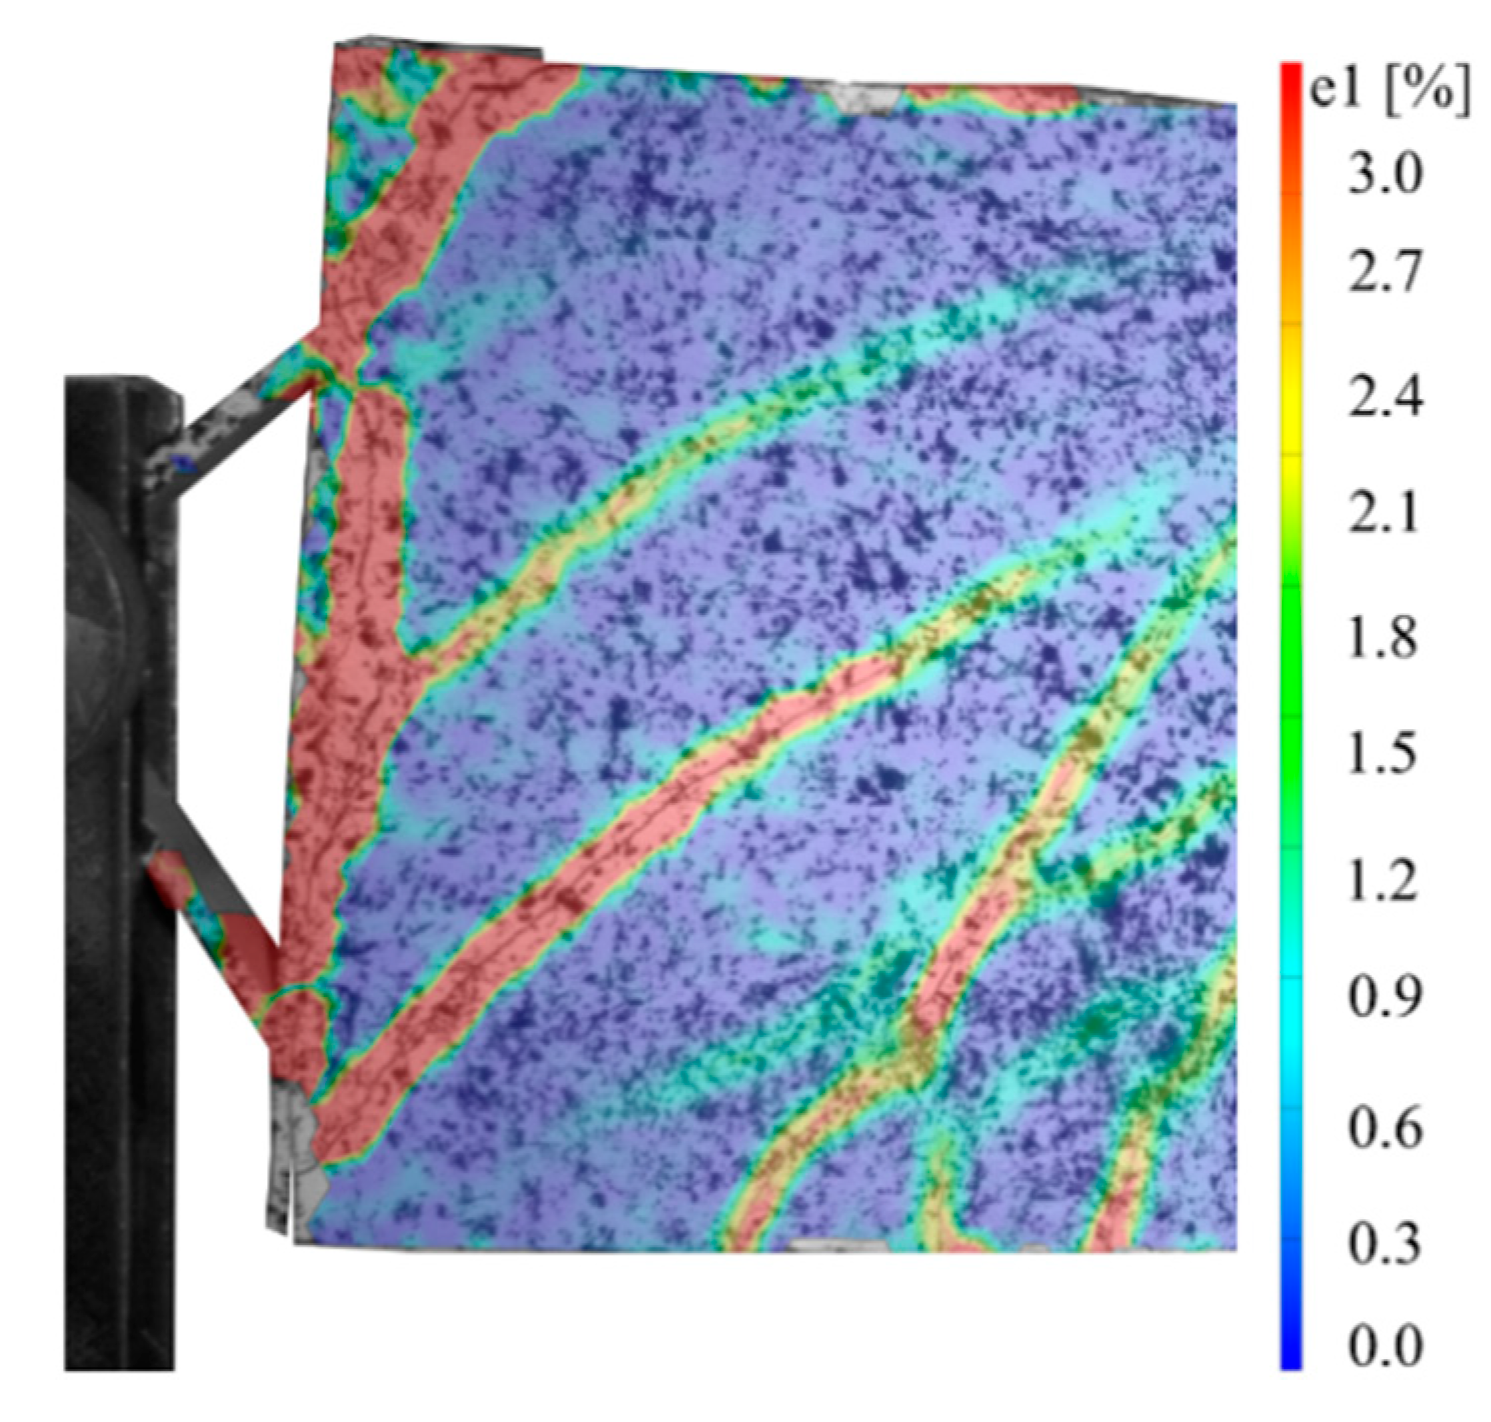
Figure 23.
Measurement of the strains and locations of the cracks in type 1 using digital image correlation.
Figure 23.
Measurement of the strains and locations of the cracks in type 1 using digital image correlation.
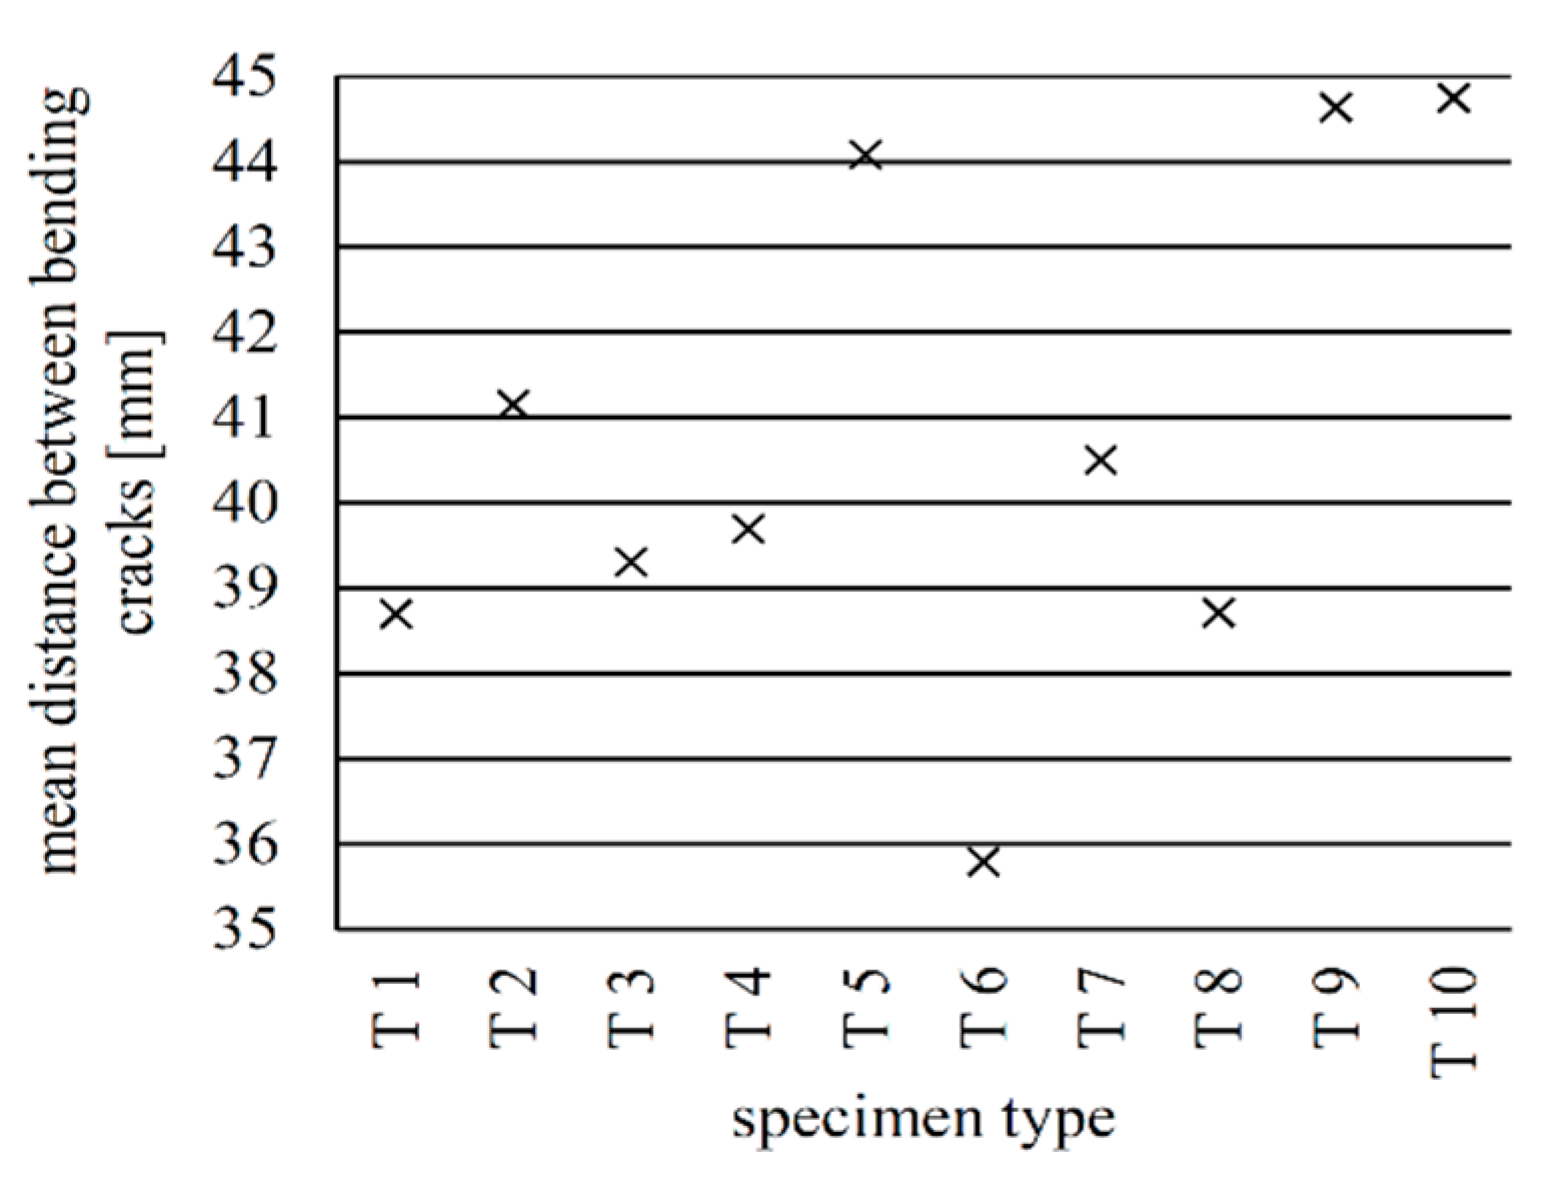
Figure 24.
Mean distances between bending cracks at maximum load for all implant types.
Figure 24.
Mean distances between bending cracks at maximum load for all implant types.
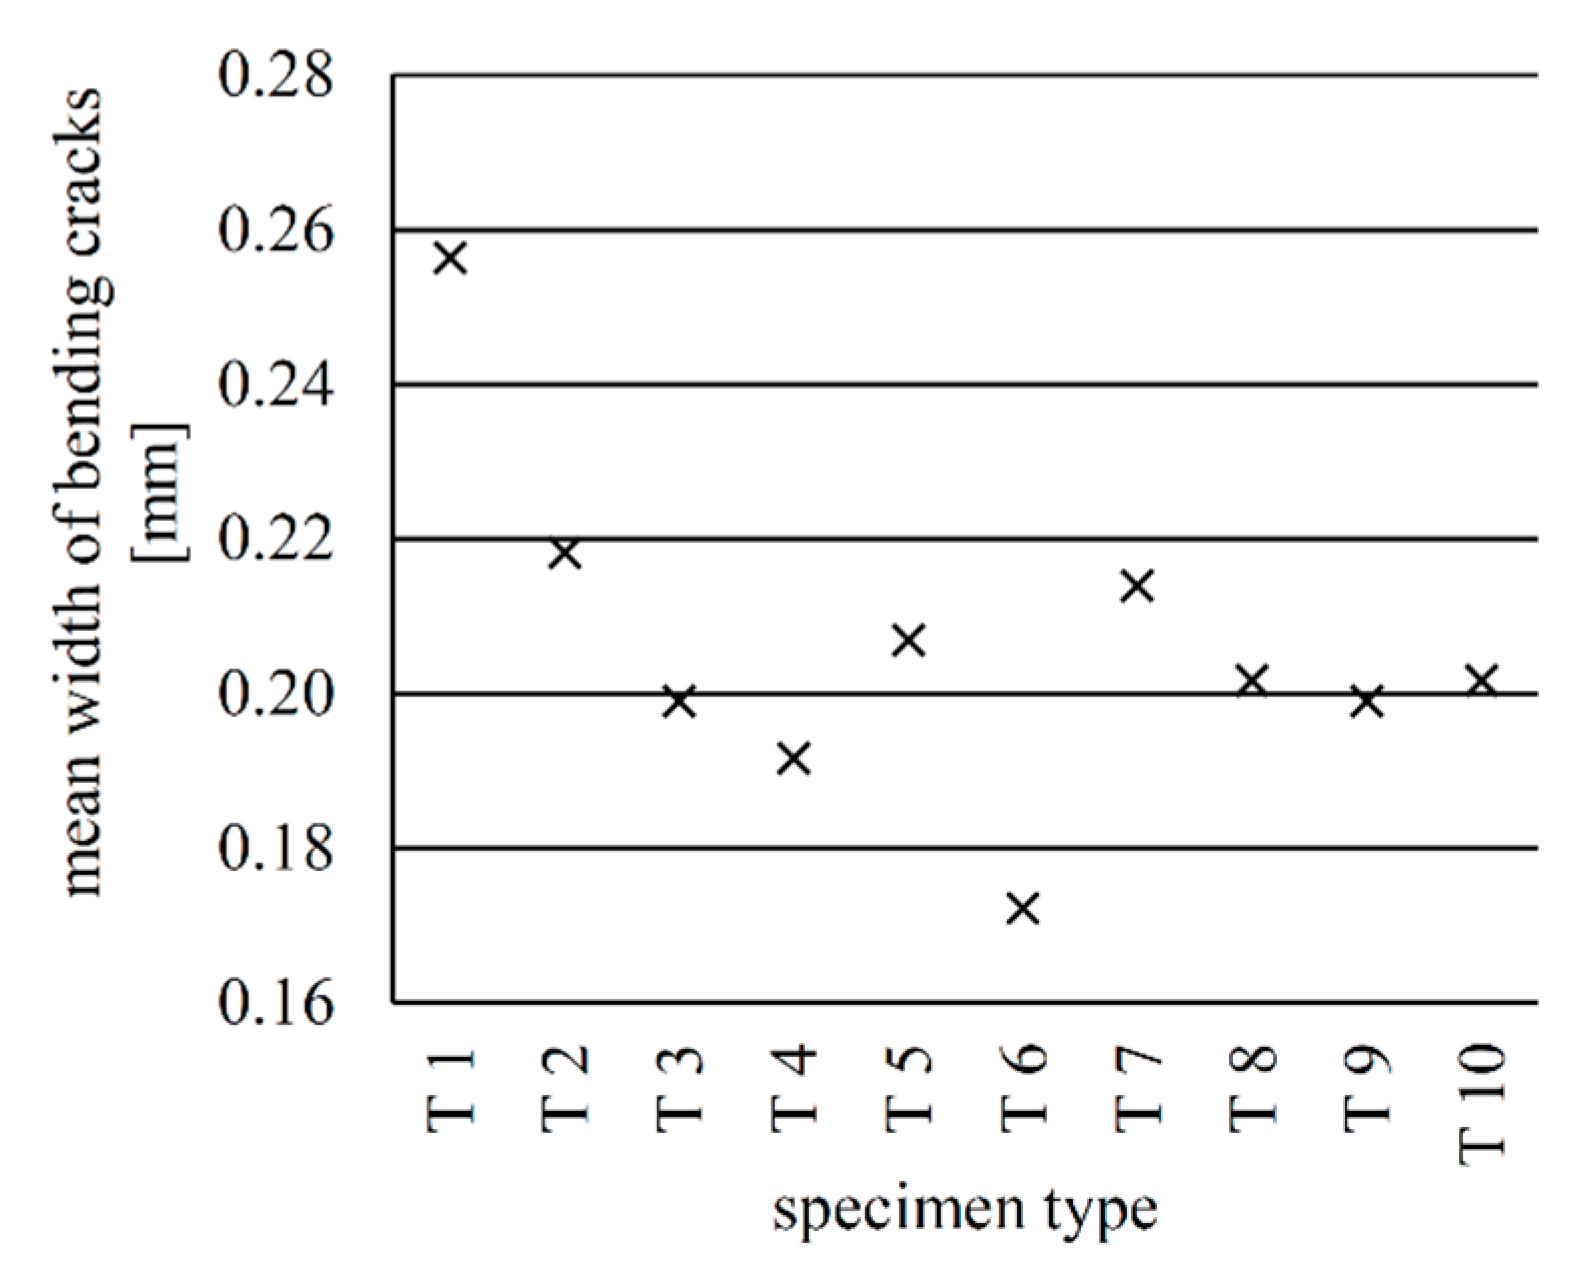
Figure 25.
Mean widths of the bending cracks at a load of 24 kN.
Figure 25.
Mean widths of the bending cracks at a load of 24 kN.
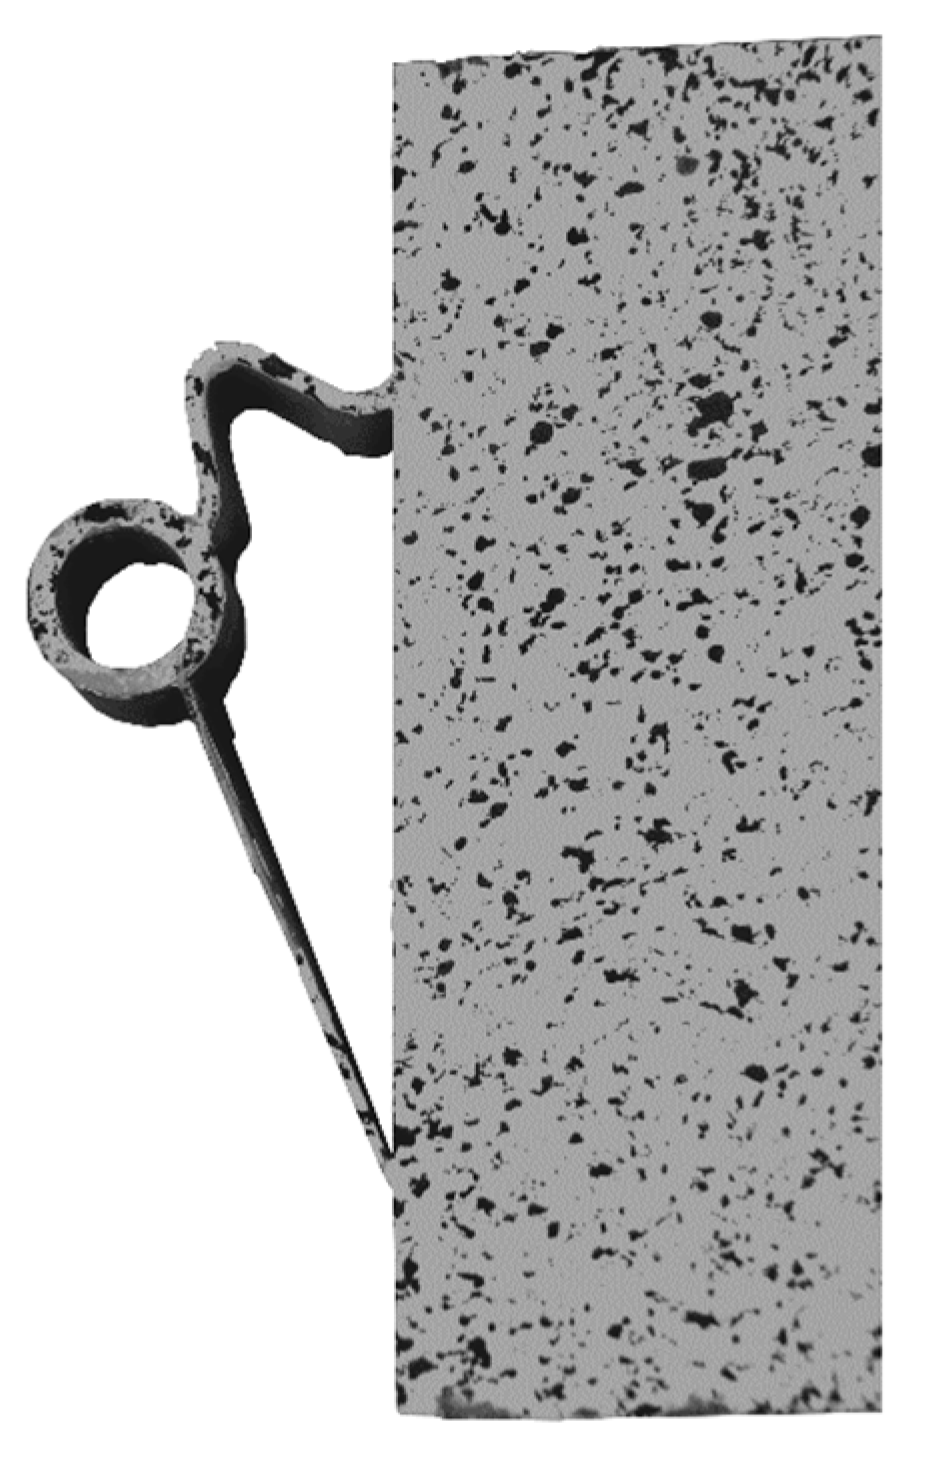
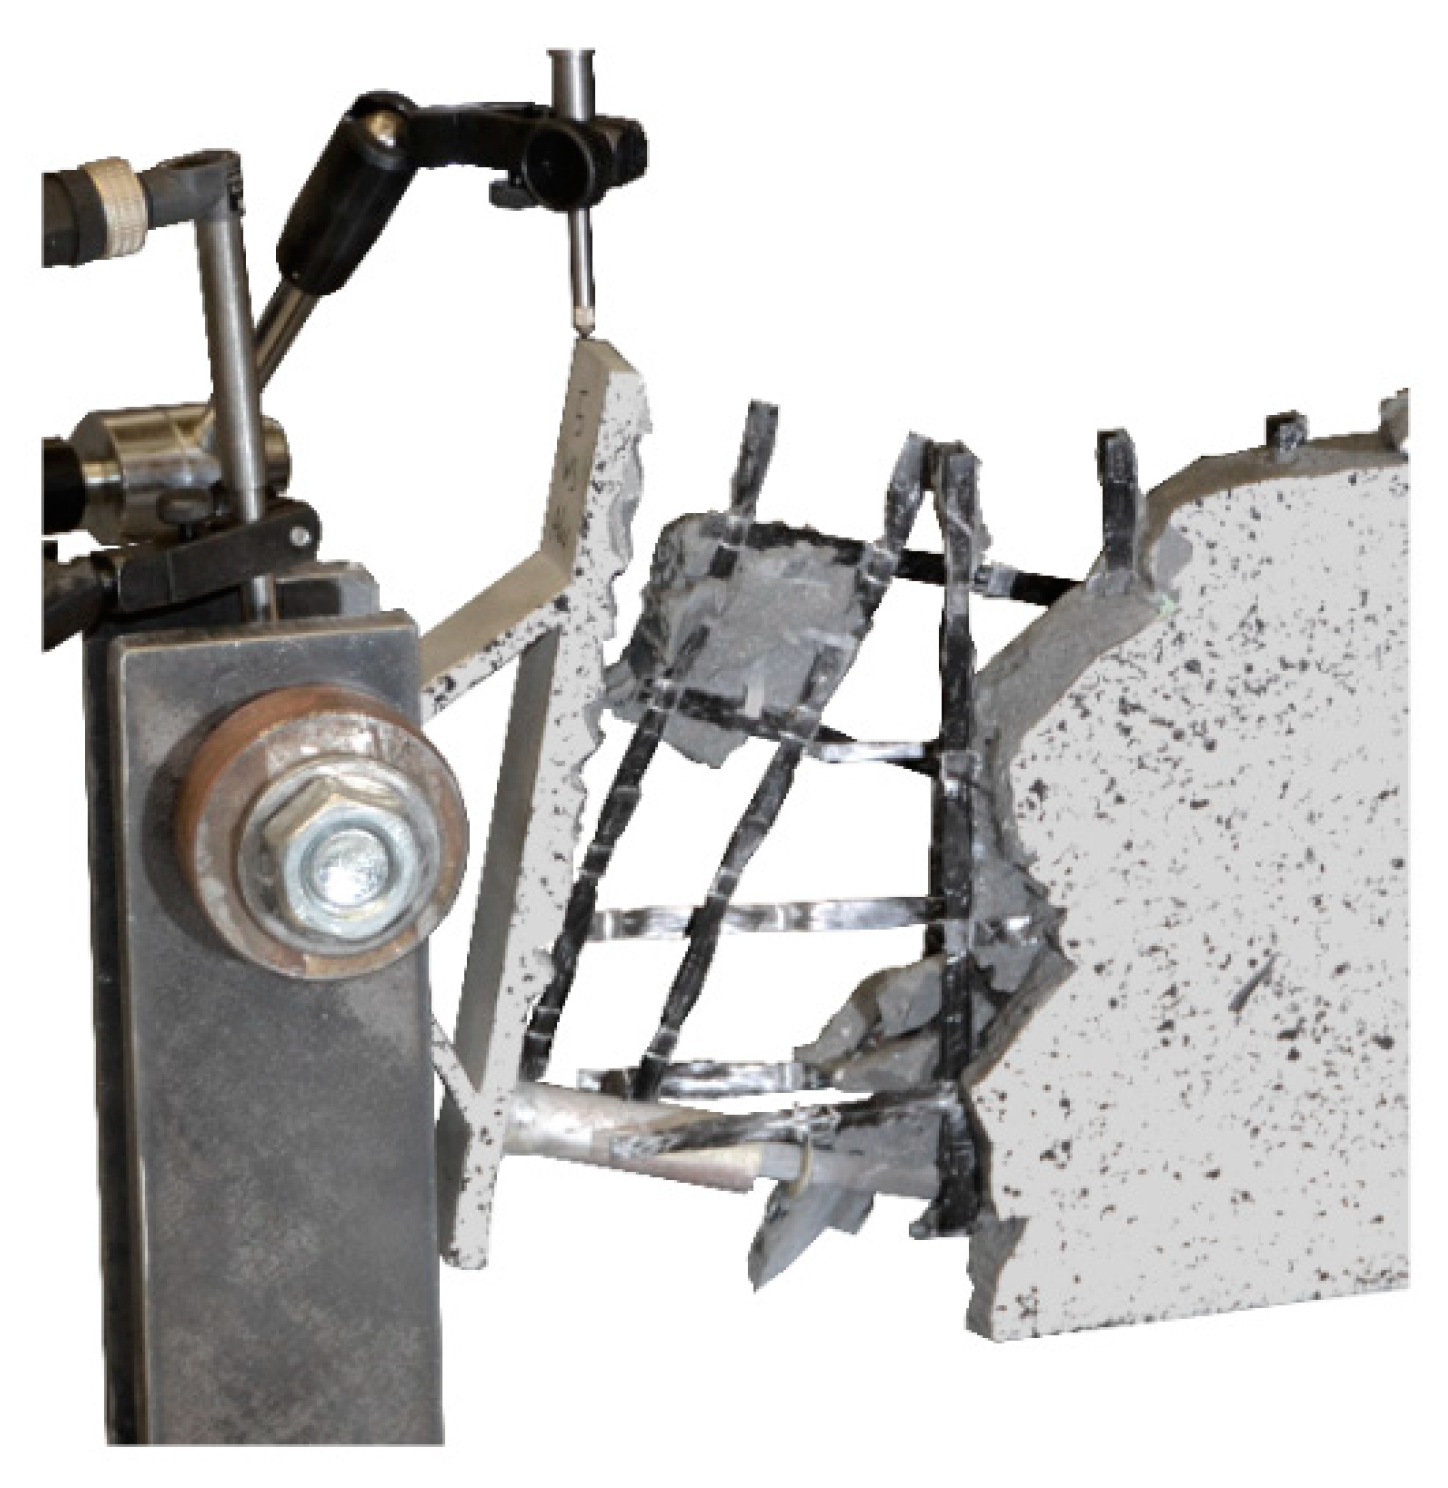
Figure 26.
Failure mode of implant type 2—pulling out of the carbon rod from the anchorage.
Figure 26.
Failure mode of implant type 2—pulling out of the carbon rod from the anchorage.
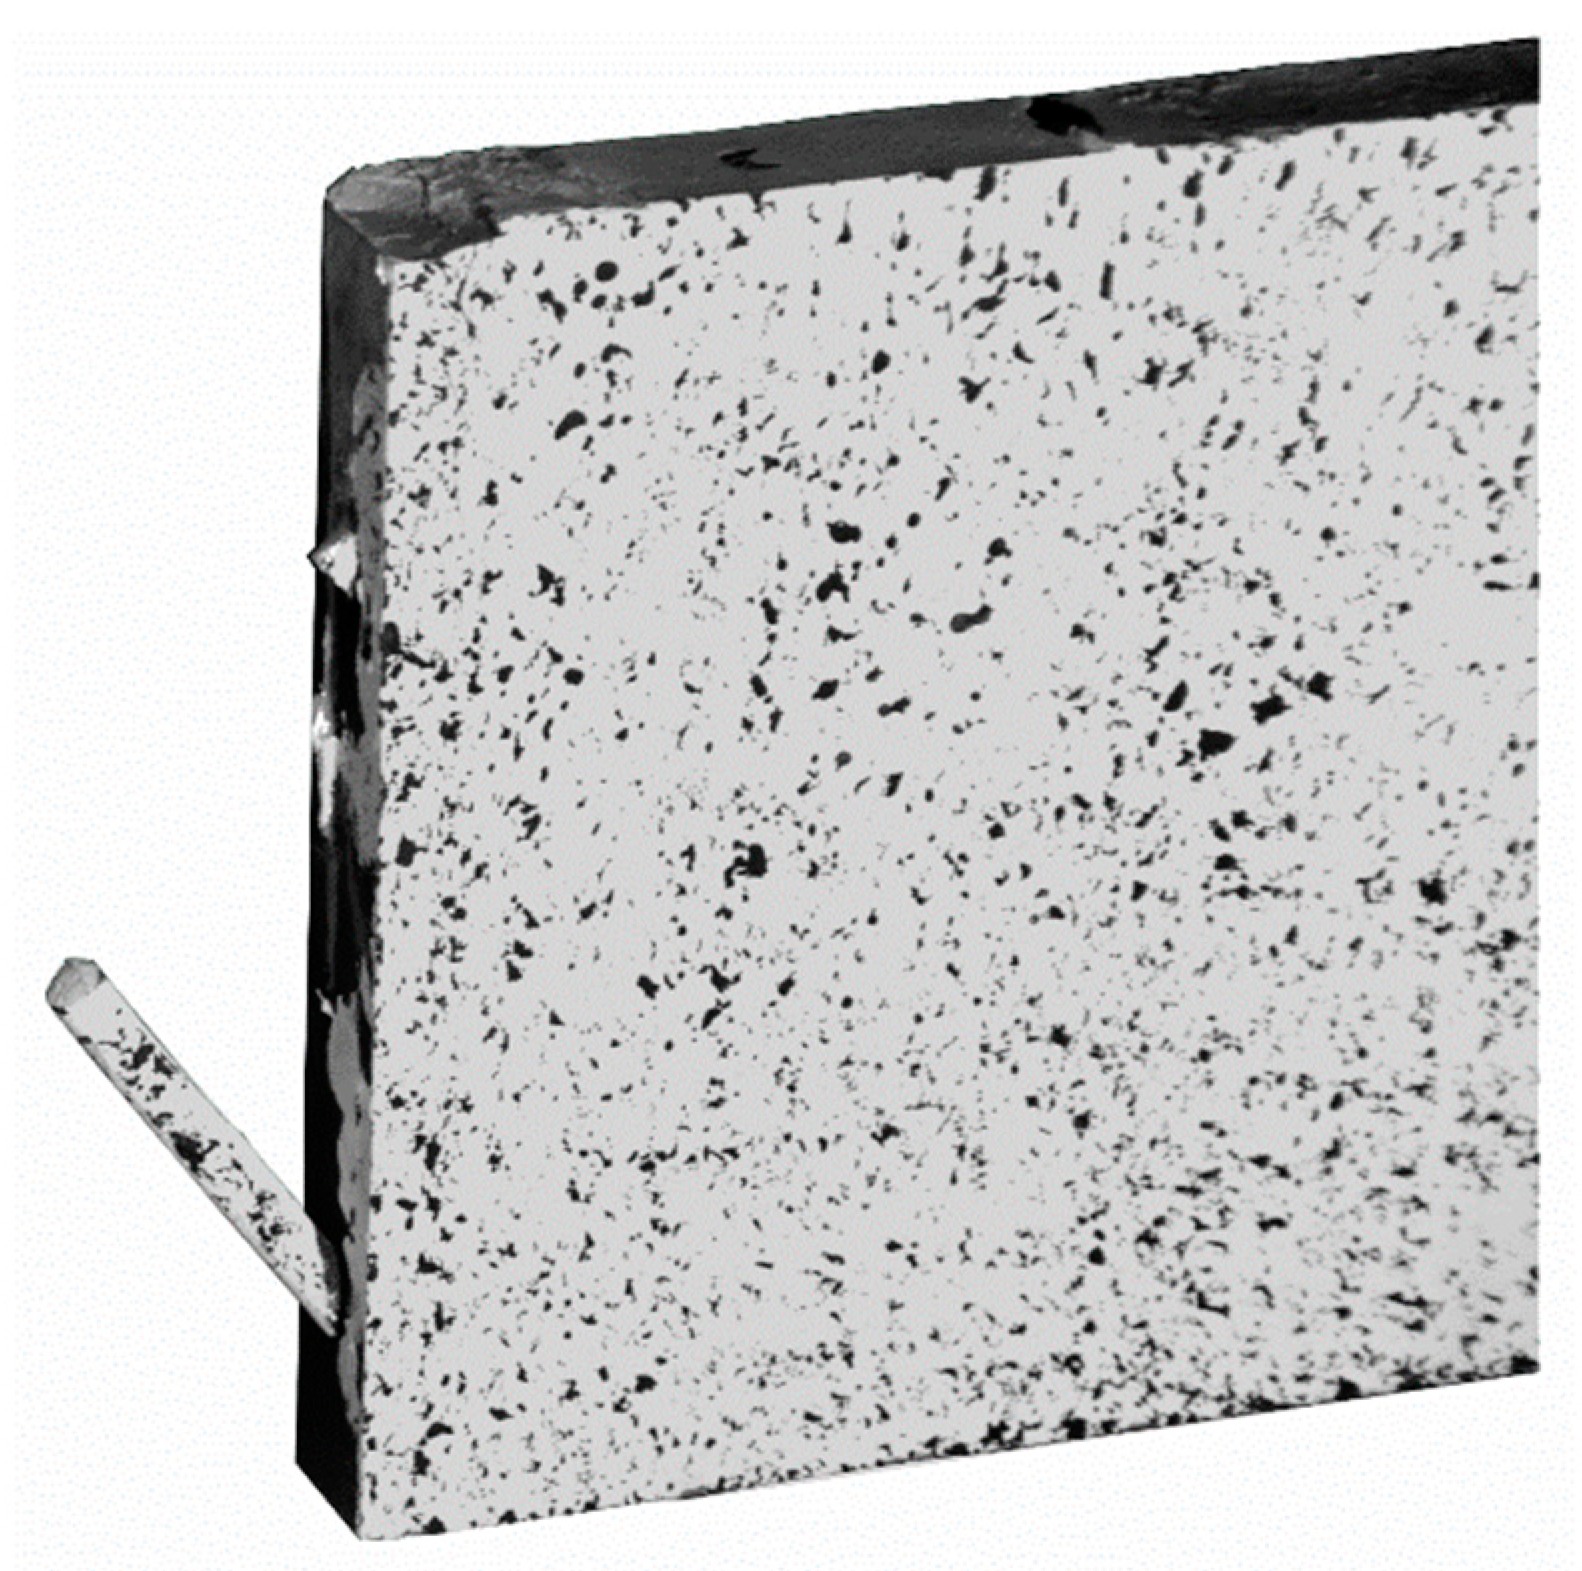
Figure 27.
Failure mode of implant type 4—pulling out of the carbon rod from the anchorage.
Figure 27.
Failure mode of implant type 4—pulling out of the carbon rod from the anchorage.
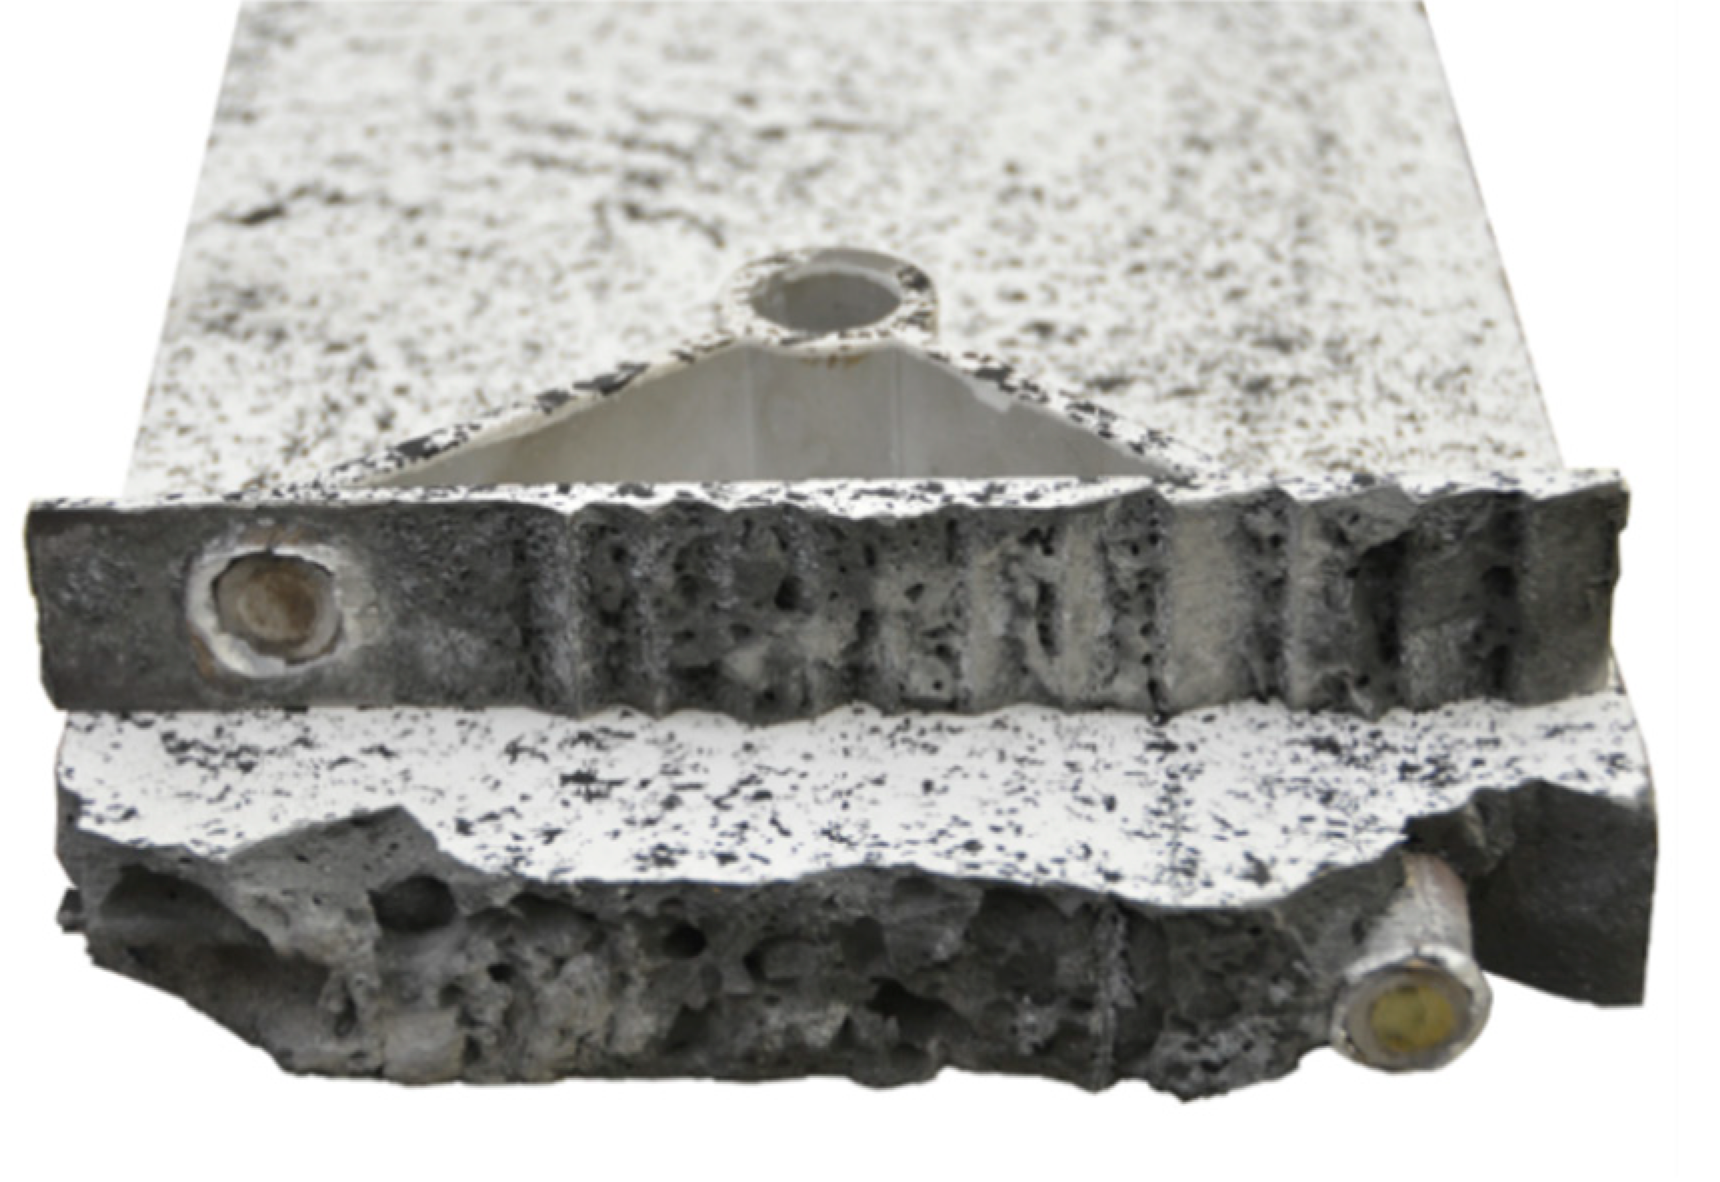
Figure 28.
Failure mode of implant type 3—buckling of the compression strut and yielding of the tensile strut.
Figure 28.
Failure mode of implant type 3—buckling of the compression strut and yielding of the tensile strut.
Figure 29.
Failure mode of implant type 5—failure of the weld seam.
Figure 29.
Failure mode of implant type 5—failure of the weld seam.
Figure 30.
Implant type 5—strain field at the surface of the beam just before failure occurred at a load of 28.6 kN.
Figure 30.
Implant type 5—strain field at the surface of the beam just before failure occurred at a load of 28.6 kN.
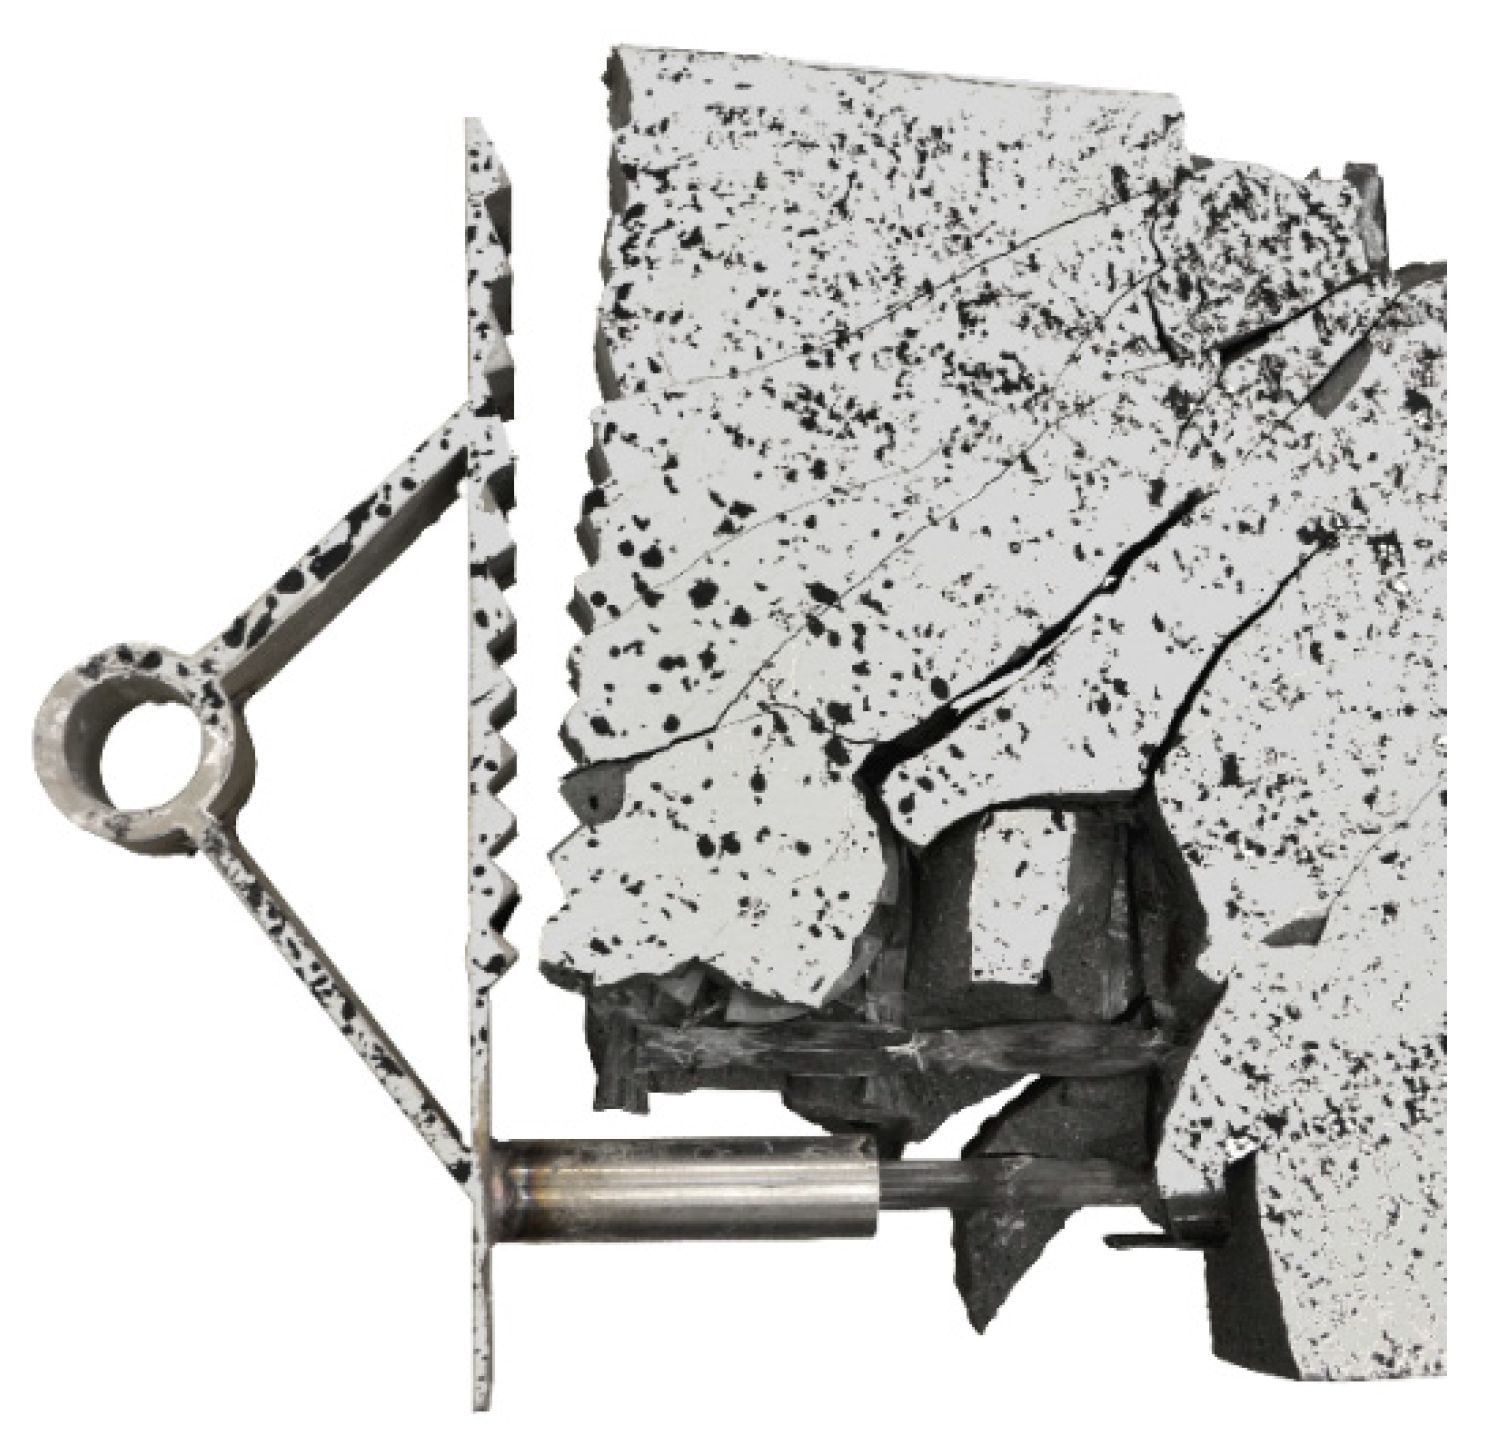
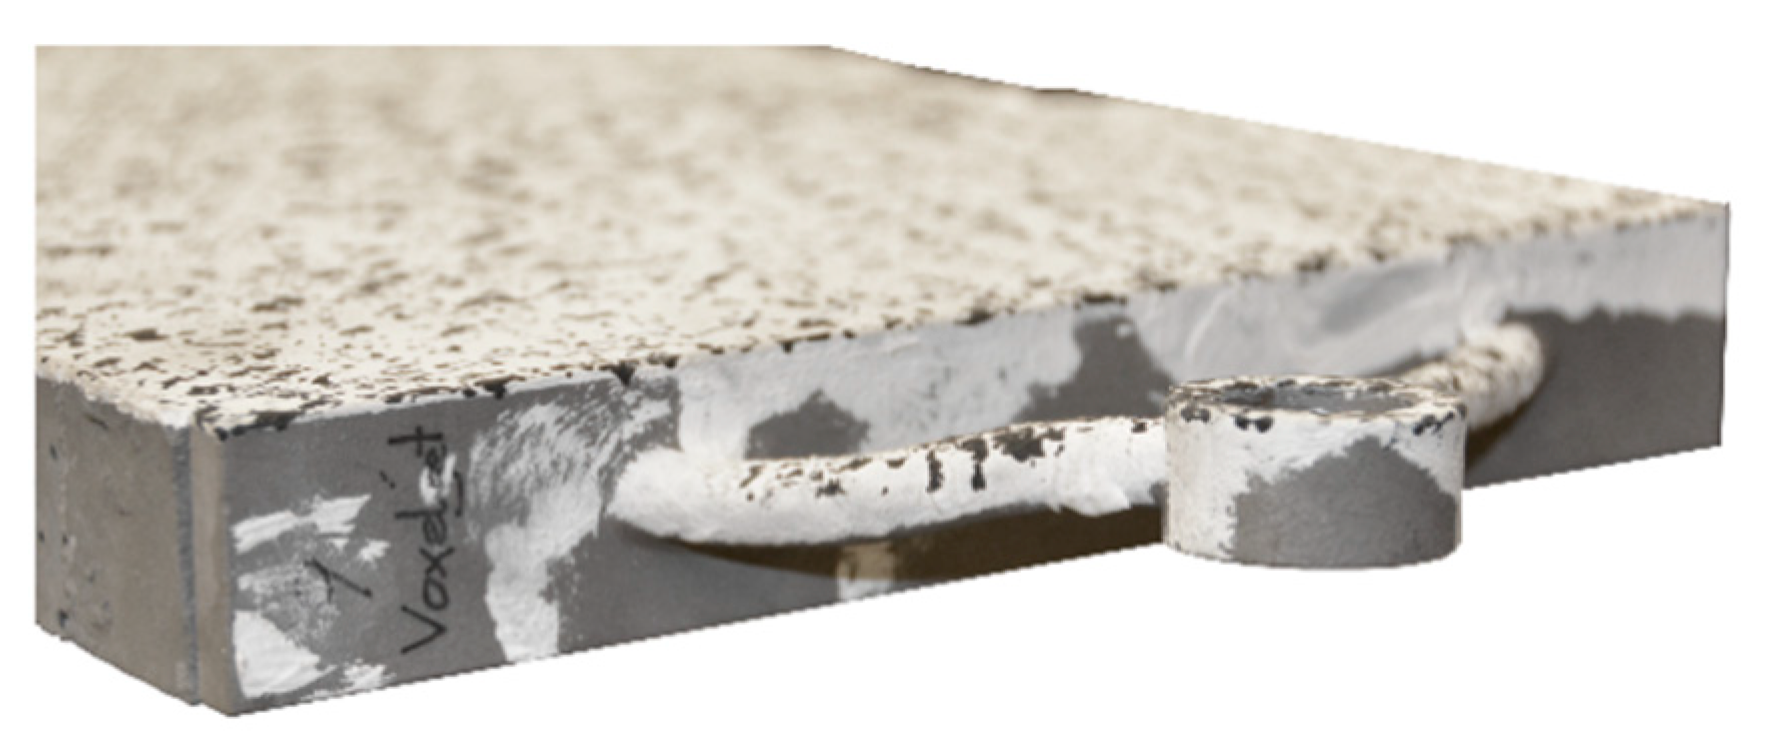
Figure 31.
Failure mode of implant type 7—deformed compression strut of the implant.
Figure 31.
Failure mode of implant type 7—deformed compression strut of the implant.
Figure 32.
Failure mode of implant type 10—brittle failure of the compression and tension struts of the implant.
Figure 32.
Failure mode of implant type 10—brittle failure of the compression and tension struts of the implant.
Table 1.
Production methods: used materials, geometric constraints and degree of automation.
Table 1.
Production methods: used materials, geometric constraints and degree of automation.
| Production Method | Material | Constraints | Degree of Automation |
|---|
| Water-jet cutting | Stainless steel 1.4301
Aluminium AlMgSi1 | Constant cross section over depth | Numerically controlled steering of the water-jet cutting process and subsequent welding of the threaded sleeve onto the cut metal |
| Casting in 3D-printed mould (powder-binder jetting of plastic) | Stainless steel 1.4308 investment casting | Minimum thickness 3 mm;
no blind holes;
rounded edges | Numerically controlled 3D printing of the mould; casting by hand; slight post-processing by hand |
| Binder jetting of steel components | Stainless steel alloy 420 (60%); bronze (90% Cu, 10% Sn) (40%) | Minimum thickness 1 mm;
no hollow cross sections | Numerically controlled 3D printing with slight post-processing by hand |
Table 2.
Dimensions of selected geometric features of the implants.
Table 2.
Dimensions of selected geometric features of the implants.
| Implant Type (See Figure 6) | 1, 4 | 2, 5 | 3, 6 | 7 | 8 | 9, 10 |
|---|
| Thickness of head plate (mm) | 7 | 3 | 7 | 7 | 3 | 7 |
| Thickness of compression strut (mm) | 5 | 5 | 3 | - | - | - |
| Thickness of tension strut (mm) | 4 | 4 | 2 | - | - | - |
| Diameter of compression strut (mm) | - | - | - | 11.5 | 11.5 | 9 |
| Diameter of tension strut (mm) | - | - | - | 11.5 | 11.5 | 9 |
| Cross-sectional area of compression strut (mm2) | 150 | 150 | 90 | 103.9 | 103.9 | 63.6 |
| Cross-sectional area of tension strut (mm2) | 120 | 120 | 60 | 103.9 | 103.9 | 63.6 |
Table 3.
Production methods: used materials, geometric constraints, and degree of automation.
Table 3.
Production methods: used materials, geometric constraints, and degree of automation.
| Base Material (Powder) | PMMA (55 µm) | PMMA (85 µm) |
|---|
| Binder type | Polypor B (PPB) | Polypor C (PPC) |
| Tensile strength | ≥2.0 MPa | ≥2.0 MPa |
| Yield strain | 1% | 1% |
| Firing temperature | 700 °C | 600 °C |
| Residual ash content | <0.01 weight % | <0.01 weight % |
| Especially suitable for | Investment casting, design models | Investment casting |
| Advantages | Sharp edges, high granularity and resolution, particle material reusable | Burns almost without residuals, particle material reusable |
| Disadvantages | Non-recyclable material, high production effort | Non-recyclable material, high production effort |
| Standard height of layer | 150 µm | 150 µm |
| Resolution | Up to 600 dpi | Up to 600 dpi |
| Dimensional accuracy | ±0.4% (min. ±0.3 mm) | ±0.4% (min. ±0.3 mm) |
| Curing with wax | Smooth, liquid-tight surface | Smooth, liquid-tight surface |
Table 4.
Properties of the steel–bronze components (implant Type 10), provided by the manufacturer [
13].
Table 4.
Properties of the steel–bronze components (implant Type 10), provided by the manufacturer [
13].
| Property | Test Method | Magnitude |
|---|
| Ultimate tensile strength | ASTM E8 | 682 MPa |
| 0.2% offset yield strength | ASTM E8 | 455 MPa |
| Young’s modulus | ASTM E8 | 147,000 MPa |
| Yield point elongation | ASTM E8 | 2.3% |
| Density | MPIF 42 | 7.86 g/cm3 |
| Coefficient of thermal expansion | ASTM E228 | 13.4 × 10⁻⁶ 1/K |
Table 5.
Geometry, production method, material and weight of the investigated types of implants. The information of the highest-performing implant from the first generation of implants [
1] is given as reference [
13].
Table 5.
Geometry, production method, material and weight of the investigated types of implants. The information of the highest-performing implant from the first generation of implants [
1] is given as reference [
13].
| Type | Geometry | Production Method | Material | Weight |
|---|
| Reference from [1], Figure 4 | Laser cutting | Stainless steel 1.4301 | 1519 g |
| 1–6 | Rectangular struts | | | |
| 1 | basic | Water jetting | Stainless steel 1.4301 | 670 g |
| 2 | Thinner head plate | 480 g |
| 3 | Reduced strut cross section | 611 g |
| 4 | basic | Water jetting | Aluminium AlMgSi1 | 230 g |
| 5 | Thinner head plate | 165 g |
| 6 | Reduced strut cross section | 210 g |
| 7–10 | Circular struts | | | |
| 7 | basic | Investment casting | Stainless steel 1.4308 | 652 g |
| 8 | Thinner head plate | 463 g |
| 9 | Reduced strut cross section | 613 g |
| 10 | Reduced strut cross section | Binder jetting | Stainless steel alloy 420
infiltrated with
bronze (90% Cu, 10% Cn) | 610 g |
Table 6.
Properties of the used epoxy adhesive (Epoxy Resin: RenLam© M-1 and Hardener: Ren© HY 956).
Table 6.
Properties of the used epoxy adhesive (Epoxy Resin: RenLam© M-1 and Hardener: Ren© HY 956).
| Property | Magnitude |
|---|
| Mixing ratio (Resin/Hardener) | 100/20 |
| Pot life | 30 min |
| Demoldable | 24 h |
| Density | 1.1 g/cm3 |
| Viscosity at 25 °C | 1200 mPas |
| Compressive strength | 50 N/mm2 |
| Flexural strength | 67 N/mm2 |
| Shore D hardness | 84 |
| Characteristics | Low shrinkage, high mechanical strength, high compatibility with glass fibre |
Table 7.
Dimensions of the concrete beams.
Table 7.
Dimensions of the concrete beams.
| Type | Geometry at Connection with Implant (mm) | Geometry at Load Introduction Point (mm) |
|---|
| Thickness Bottom Edge | Thickness Top Edge | Height | Thickness Bottom Edge | Thickness Top Edge | Height |
|---|
| Target | 30.0 | 30.0 | 200 | 30.0 | 30.0 | 200 |
| 1 | 30.3 | 30.2 | 199 | 29.3 | 28.1 | 200 |
| 2 | 30.5 | 30.2 | 200 | 29.2 | 28.8 | 199 |
| 3 | 30.2 | 30.4 | 199 | 30.1 | 30.0 | 201 |
| 4 | 30.5 | 30.5 | 200 | 30.7 | 30.8 | 200 |
| 5 | 31.0 | 30.5 | 200 | 31.1 | 30.2 | 200 |
| 6 | 30.4 | 30.8 | 199 | 30.1 | 30.7 | 201 |
| 7 | 30.0 | 30.0 | 200 | 27.7 | 30.8 | 200 |
| 8 | 30.1 | 30.0 | 200 | 29.6 | 29.0 | 200 |
| 9 | 30.3 | 30.6 | 201 | 31.1 | 32.2 | 201 |
| 10 | 30.0 | 30.0 | 200 | 30.1 | 29.3 | 200 |
Table 8.
Ingredients of the UHPC mixture (per m3).
Table 8.
Ingredients of the UHPC mixture (per m3).
| Constituent | Amount (kg) |
|---|
| (a) Water | 153.5 |
| (b) Superplasticiser (liquid/solid parts) | 31.0 (21.7/9.3) |
| (c) Slump retainer (l/s) | 13.8 (11/2.8) |
| (d) Shrinkage-reducing admixture (l/s) | 6.9 (6.83/0.07) |
| (e) Defoamer | 1.0 |
| (f) Cement (CEM I 52.5 N C3A-free) | 689.1 |
| (g) Silica fume | 172.3 |
| (h) Inert additive | 344.6 |
| (i) Quartz sand 0.1–0.5 mm | 927.5 |
Table 9.
Properties of the UHPC mixture.
Table 9.
Properties of the UHPC mixture.
| Property | Value |
|---|
| Water–cement ratio (a,b,c,d/f) | 0.28 |
| Sand, dry (dm3/m3) | 350 |
| Air content (vol%) | 2 |
| Water–binder ratio (a,b,c,d/f,g) | 0.22 |
Table 10.
Properties of the UHPC mixture.
Table 10.
Properties of the UHPC mixture.
| Property | Value |
|---|
| Compressive strength (prism) (MPa) | 167.5 |
| Compressive strength (cube) (MPa) | 176.3 |
| Flexural strength (MPa) | 12.1 |
| Young’s modulus (MPa) | 56,276 |
| Ultimate compressive strain (mm/m) | 4.2 |
| Age of concrete (days) | 35 |
Table 11.
Properties of the carbon rods (manufacturer’s specifications).
Table 11.
Properties of the carbon rods (manufacturer’s specifications).
| Property | Value |
|---|
| Fibre material | Carbon |
| Impregnation material | Epoxy resin |
| Diameter (mm) | 8 |
| Average breaking stress (N/mm2) | 2048 |
| Young’s modulus (N/mm2) | 161,000 |
| Density (kg/m3) | 1880 |
Table 12.
Properties of the textile reinforcement (Q95/95-CCE38).
Table 12.
Properties of the textile reinforcement (Q95/95-CCE38).
| Fibre Material | Carbon |
|---|
| Impregnation material | Epoxy resin |
| Roving axis distance (mm) | 38 |
| Cross section of the strand (mm2) | 3.62 |
| Cross section of the reinforcement (mm2/m) | 95 |
| Mean breaking stress (N/mm2) | 3112 |
| Young’s modulus (N/mm2) | 235,216 |
| Elongation at break (mm/m) | 13.24 |
Table 13.
Maximum applied loads, maximum deflections and calculated tensile loads at the anchorage of the test specimens.
Table 13.
Maximum applied loads, maximum deflections and calculated tensile loads at the anchorage of the test specimens.
| Type | 1 | 2 | 3 | 4 | 5 | 6 | 7 | 8 | 9 | 10 |
|---|
| Maximum load (kN) | 27.4 | 28.0 | 32.1 | 33.8 | 28.6 | 34.2 | 33.2 | 29.3 | 39.7 | 25.5 |
| Tensile load at anchorage (kN) | 8.4 | 8.6 | 9.9 | 10.4 | 8.8 | 10.5 | 10.2 | 9.0 | 12.2 | 7.8 |
| Maximum deflection (mm) | 20.0 | 18.8 | 35.1 | 23.7 | 20.0 | 23.8 | 26.4 | 20.6 | 26.7 | 17.5 |
Table 14.
Comparison of second- and first-generation implants: The maximum load and implant weight of each implant type are given as percentages of the maximum load and weight of the highest-performing first-generation implant.
Table 14.
Comparison of second- and first-generation implants: The maximum load and implant weight of each implant type are given as percentages of the maximum load and weight of the highest-performing first-generation implant.
| Type | 1 | 2 | 3 | 4 | 5 | 6 | 7 | 8 | 9 | 10 |
|---|
| Maximum load | 66.8% | 68.3% | 78.3% | 82.4% | 69.8% | 83.4% | 81.0% | 71.5% | 96.8% | 62.2% |
| Implant weight | 44.1% | 31.6% | 40.2% | 15.1% | 10.9% | 13.8% | 42.9% | 30.5% | 40.4% | 40.2% |


