Experimental Research on Electromechanical Properties of Multiple Contact Surfaces Copper Bulks under Normal Cyclic Loading and Variable Temperature

Abstract
:1. Introduction
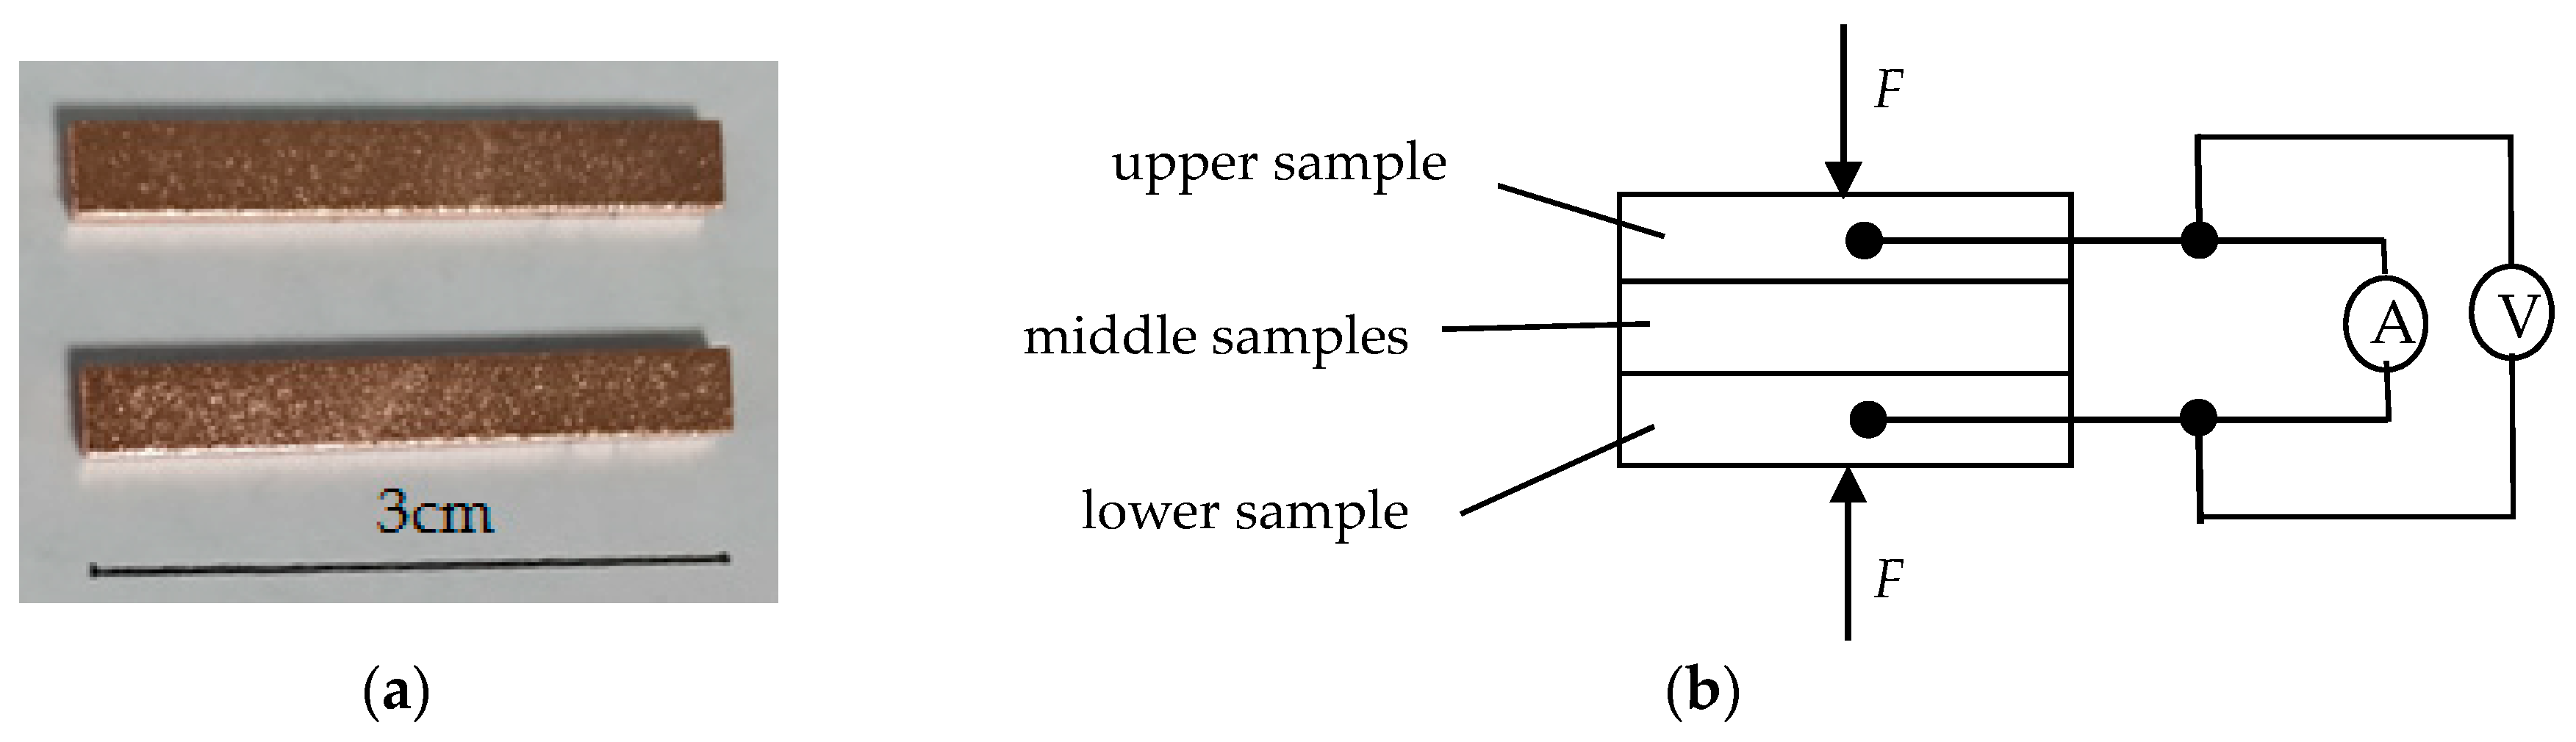
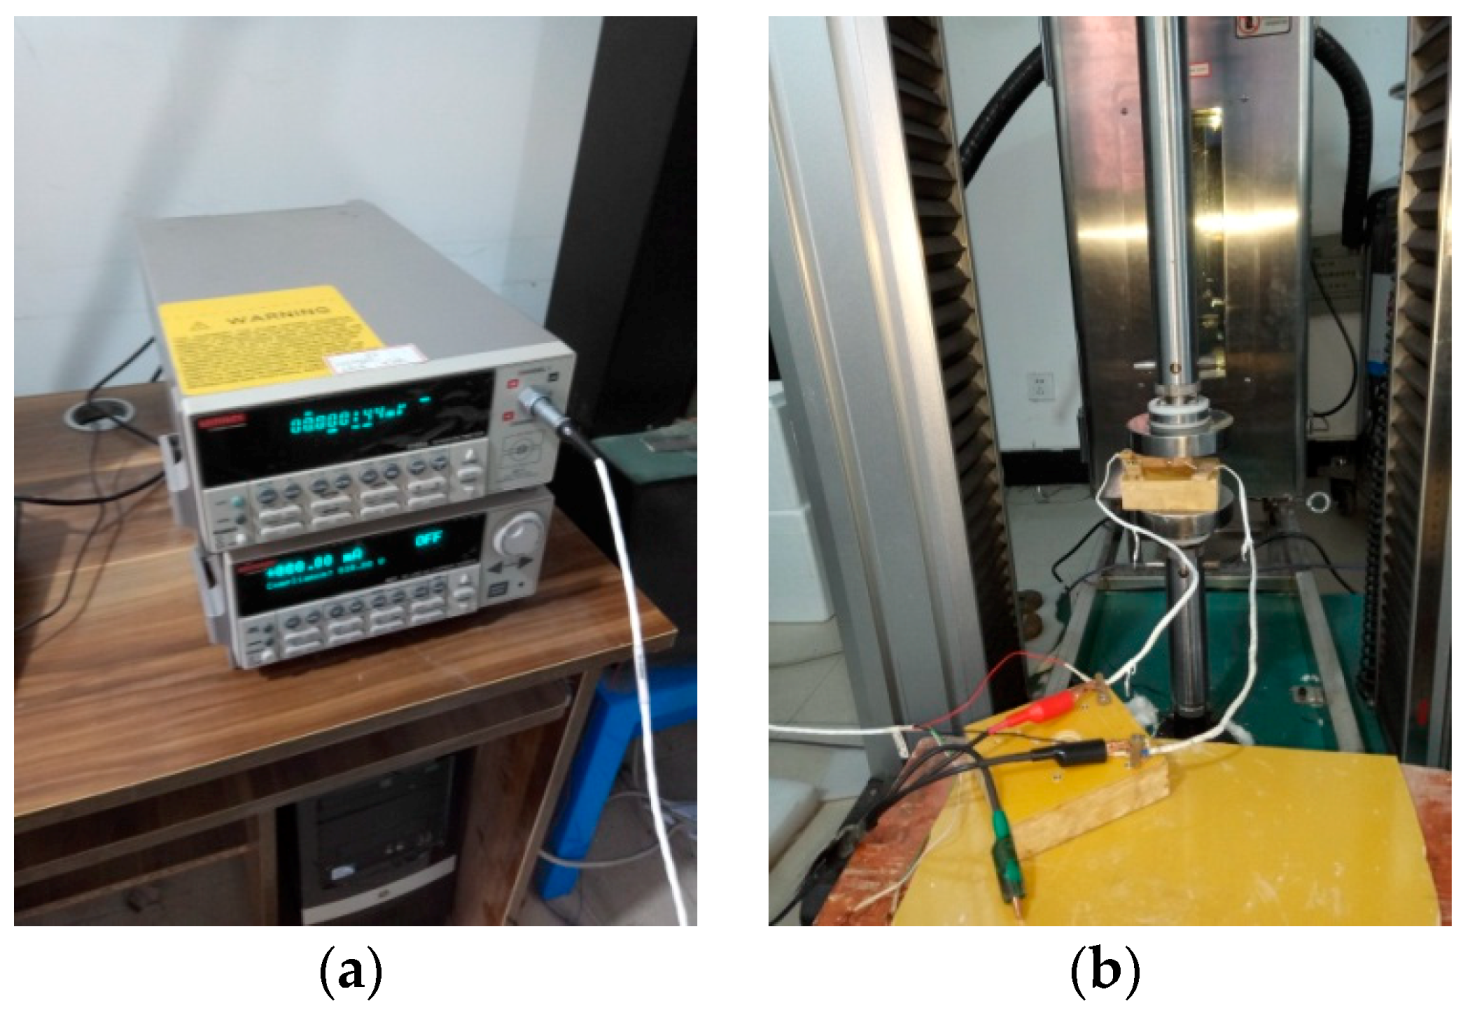
2. Experiment
3. Results
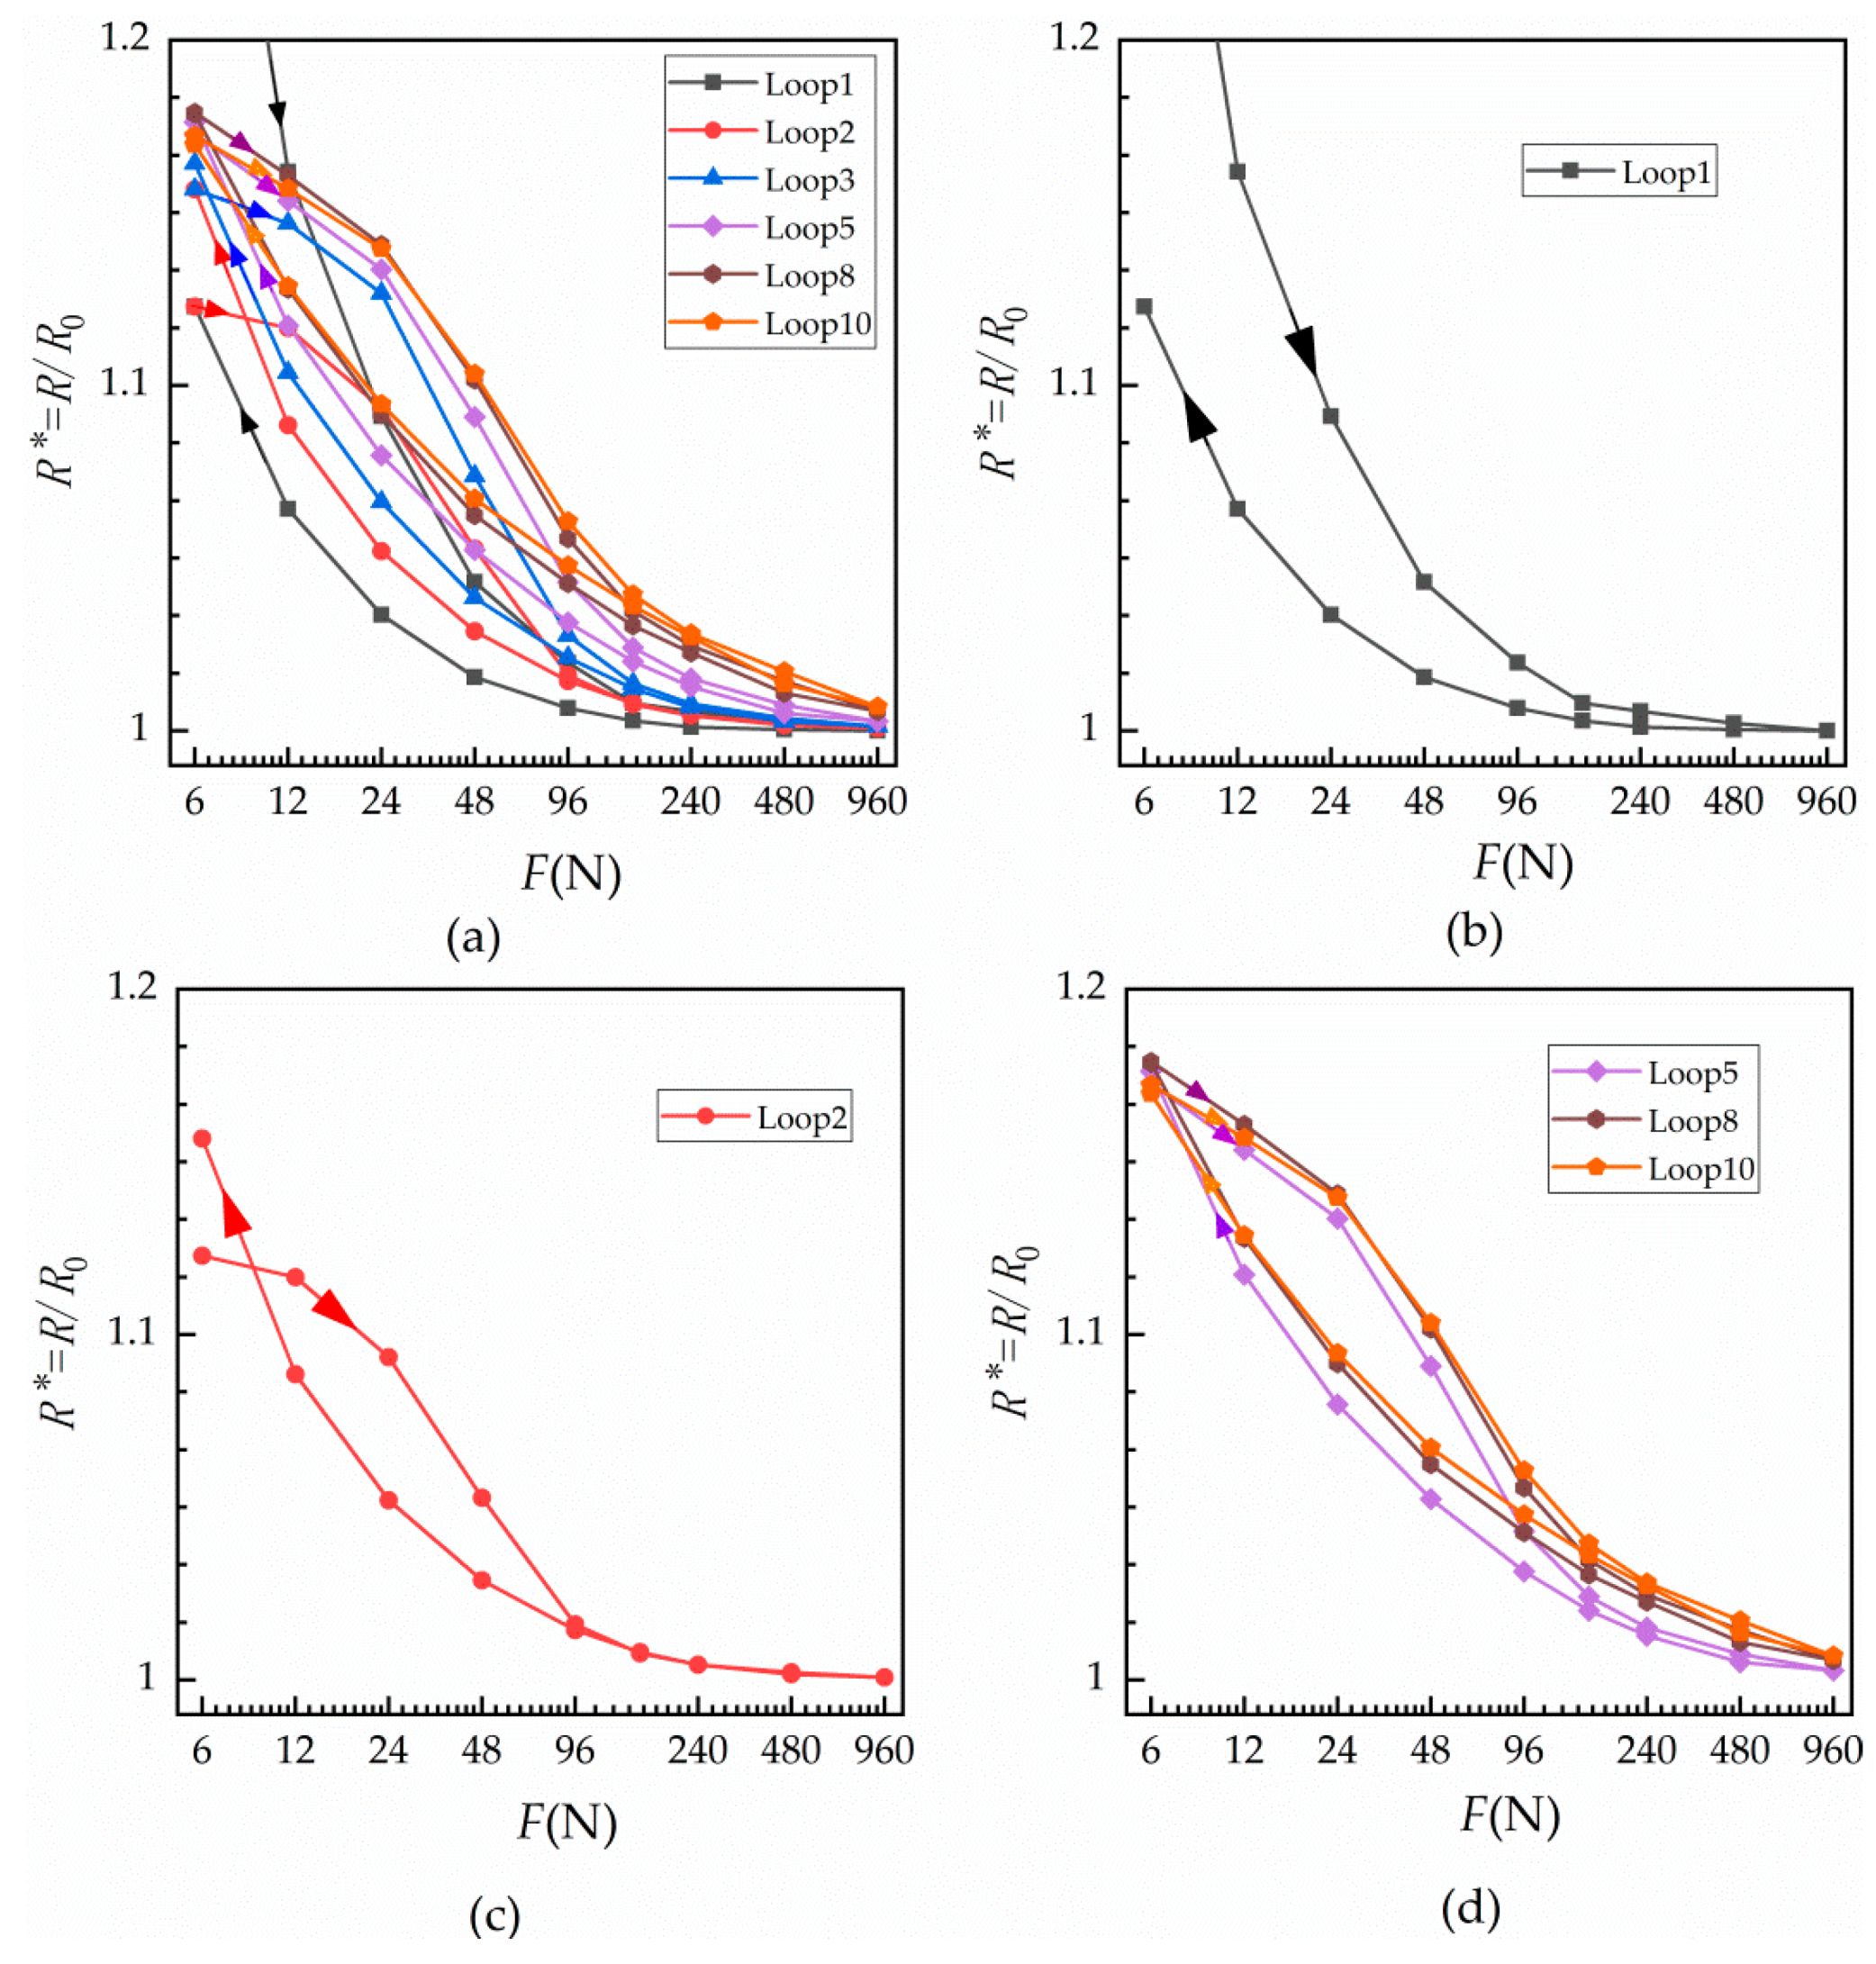
3.1. Results of Contact Resistance of a Single Contact Surface at Room Temperature
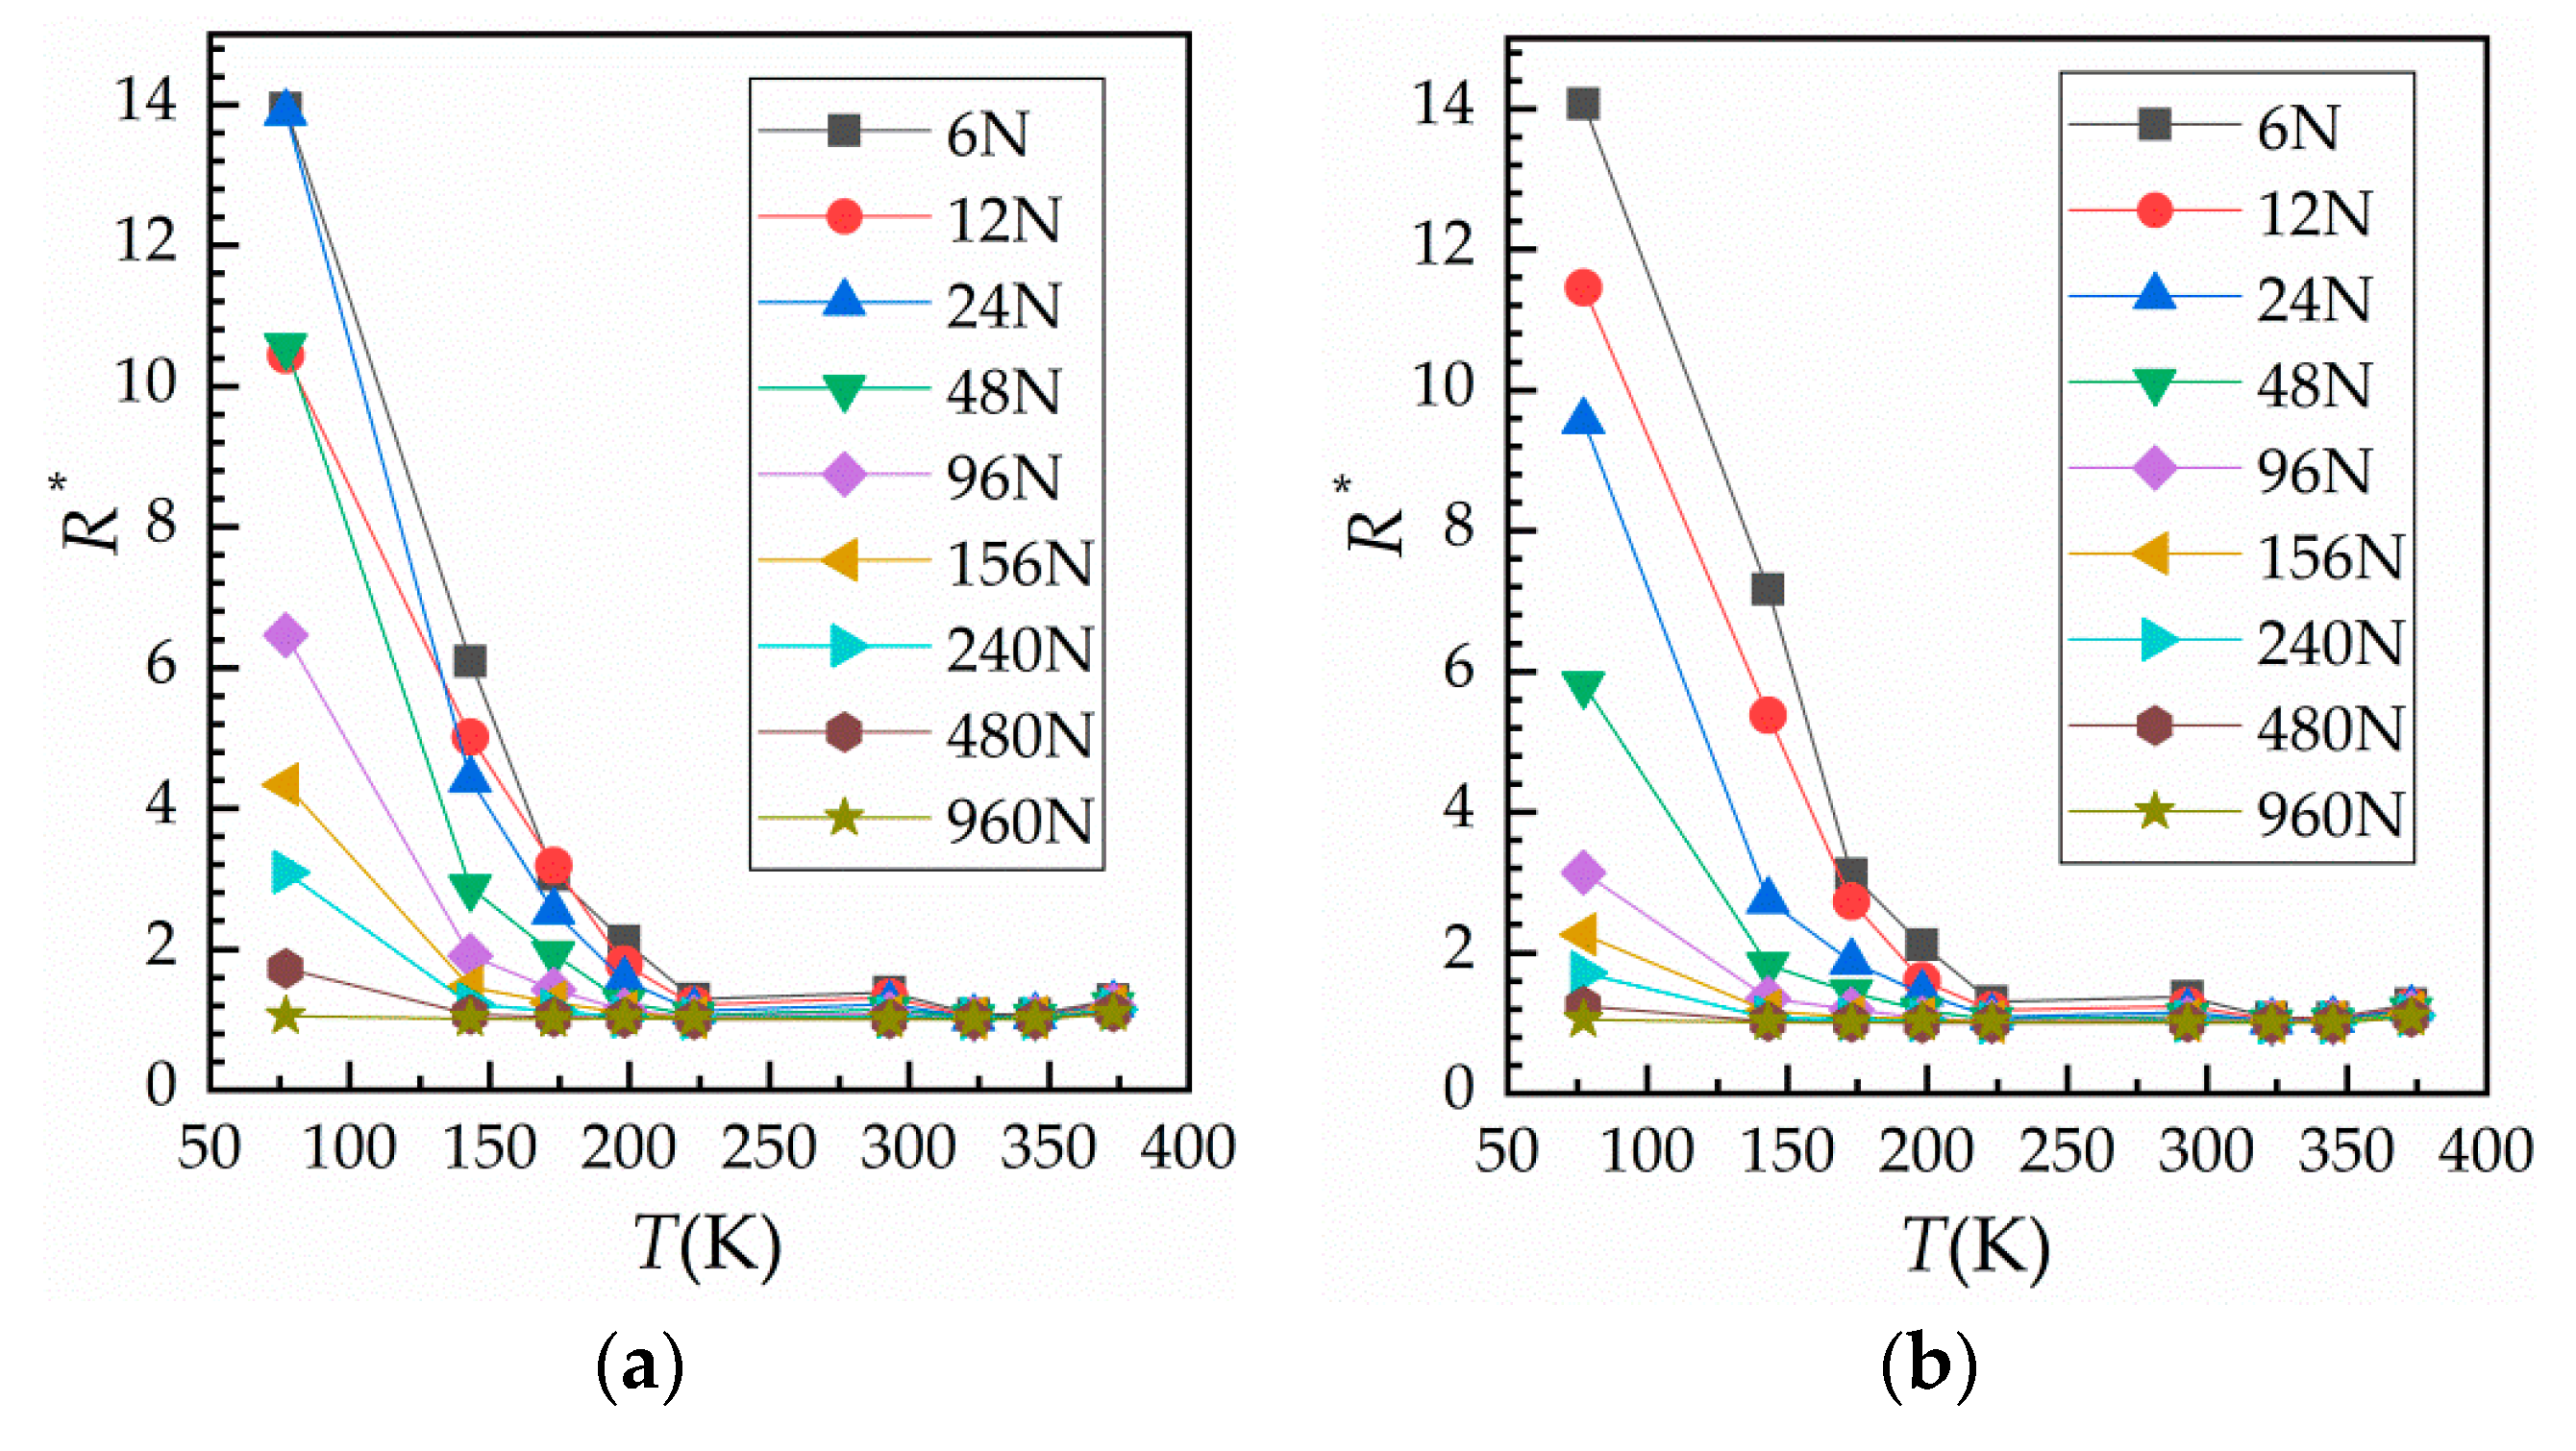
3.2. Results of Force–Relative Contact Resistance under Variable Temperature
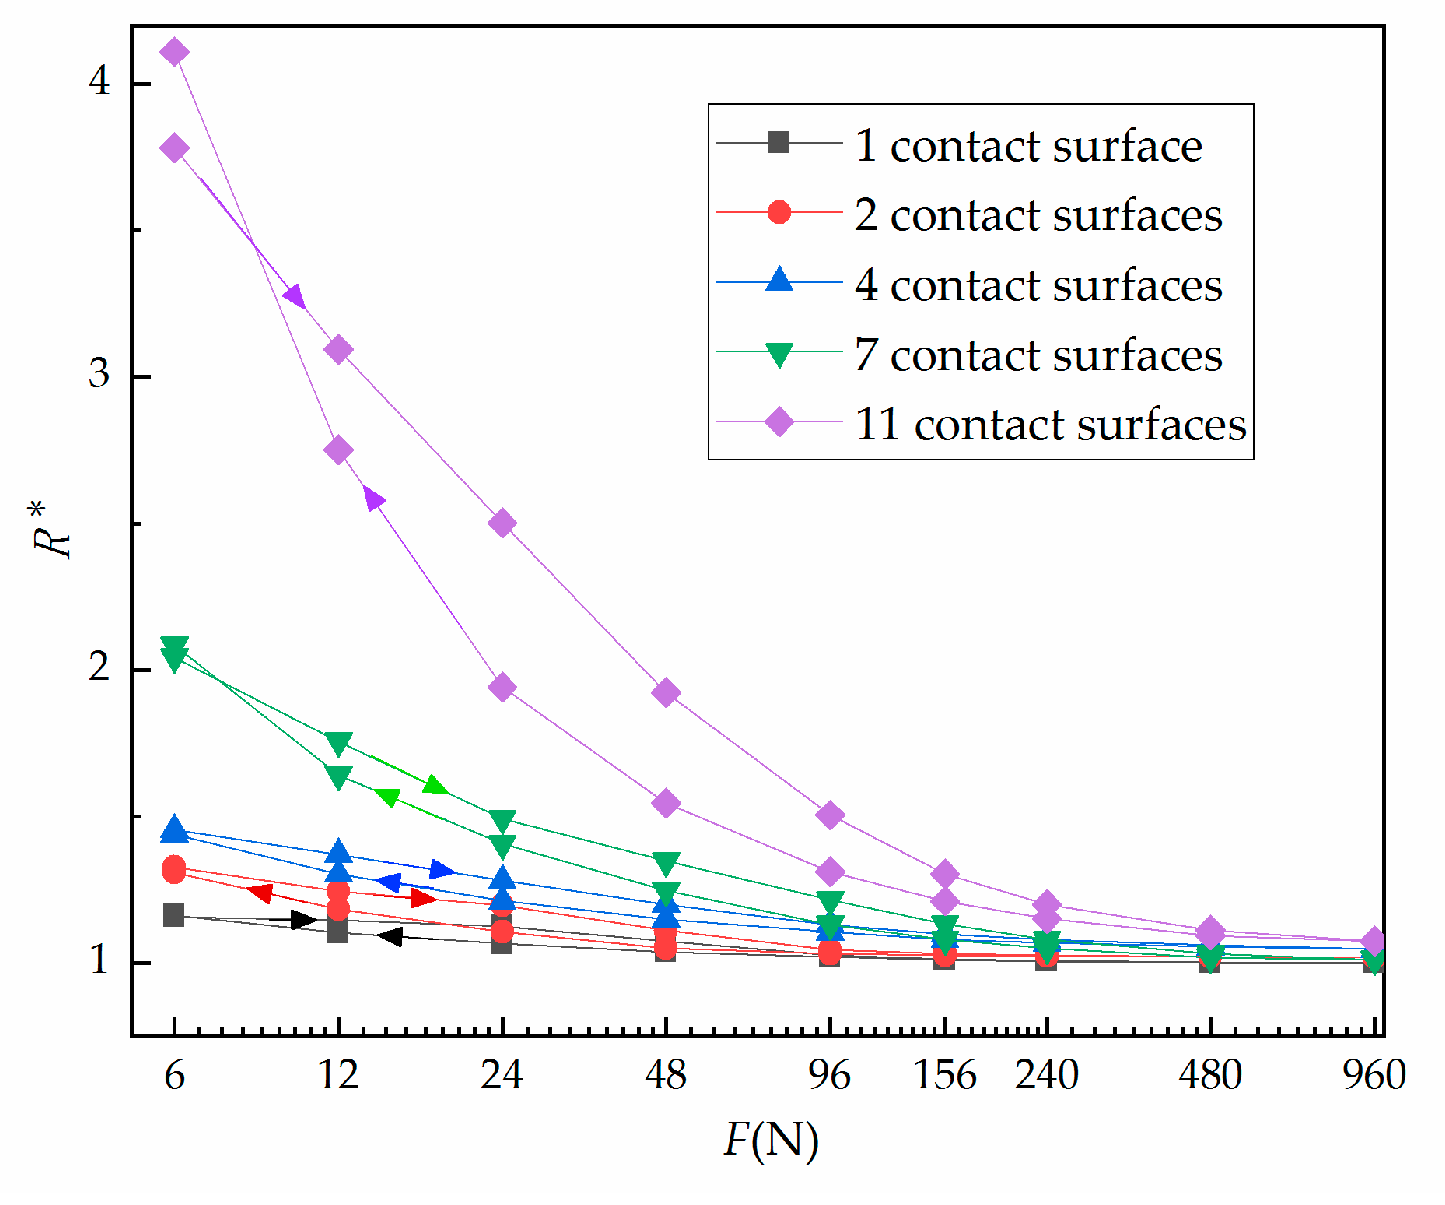
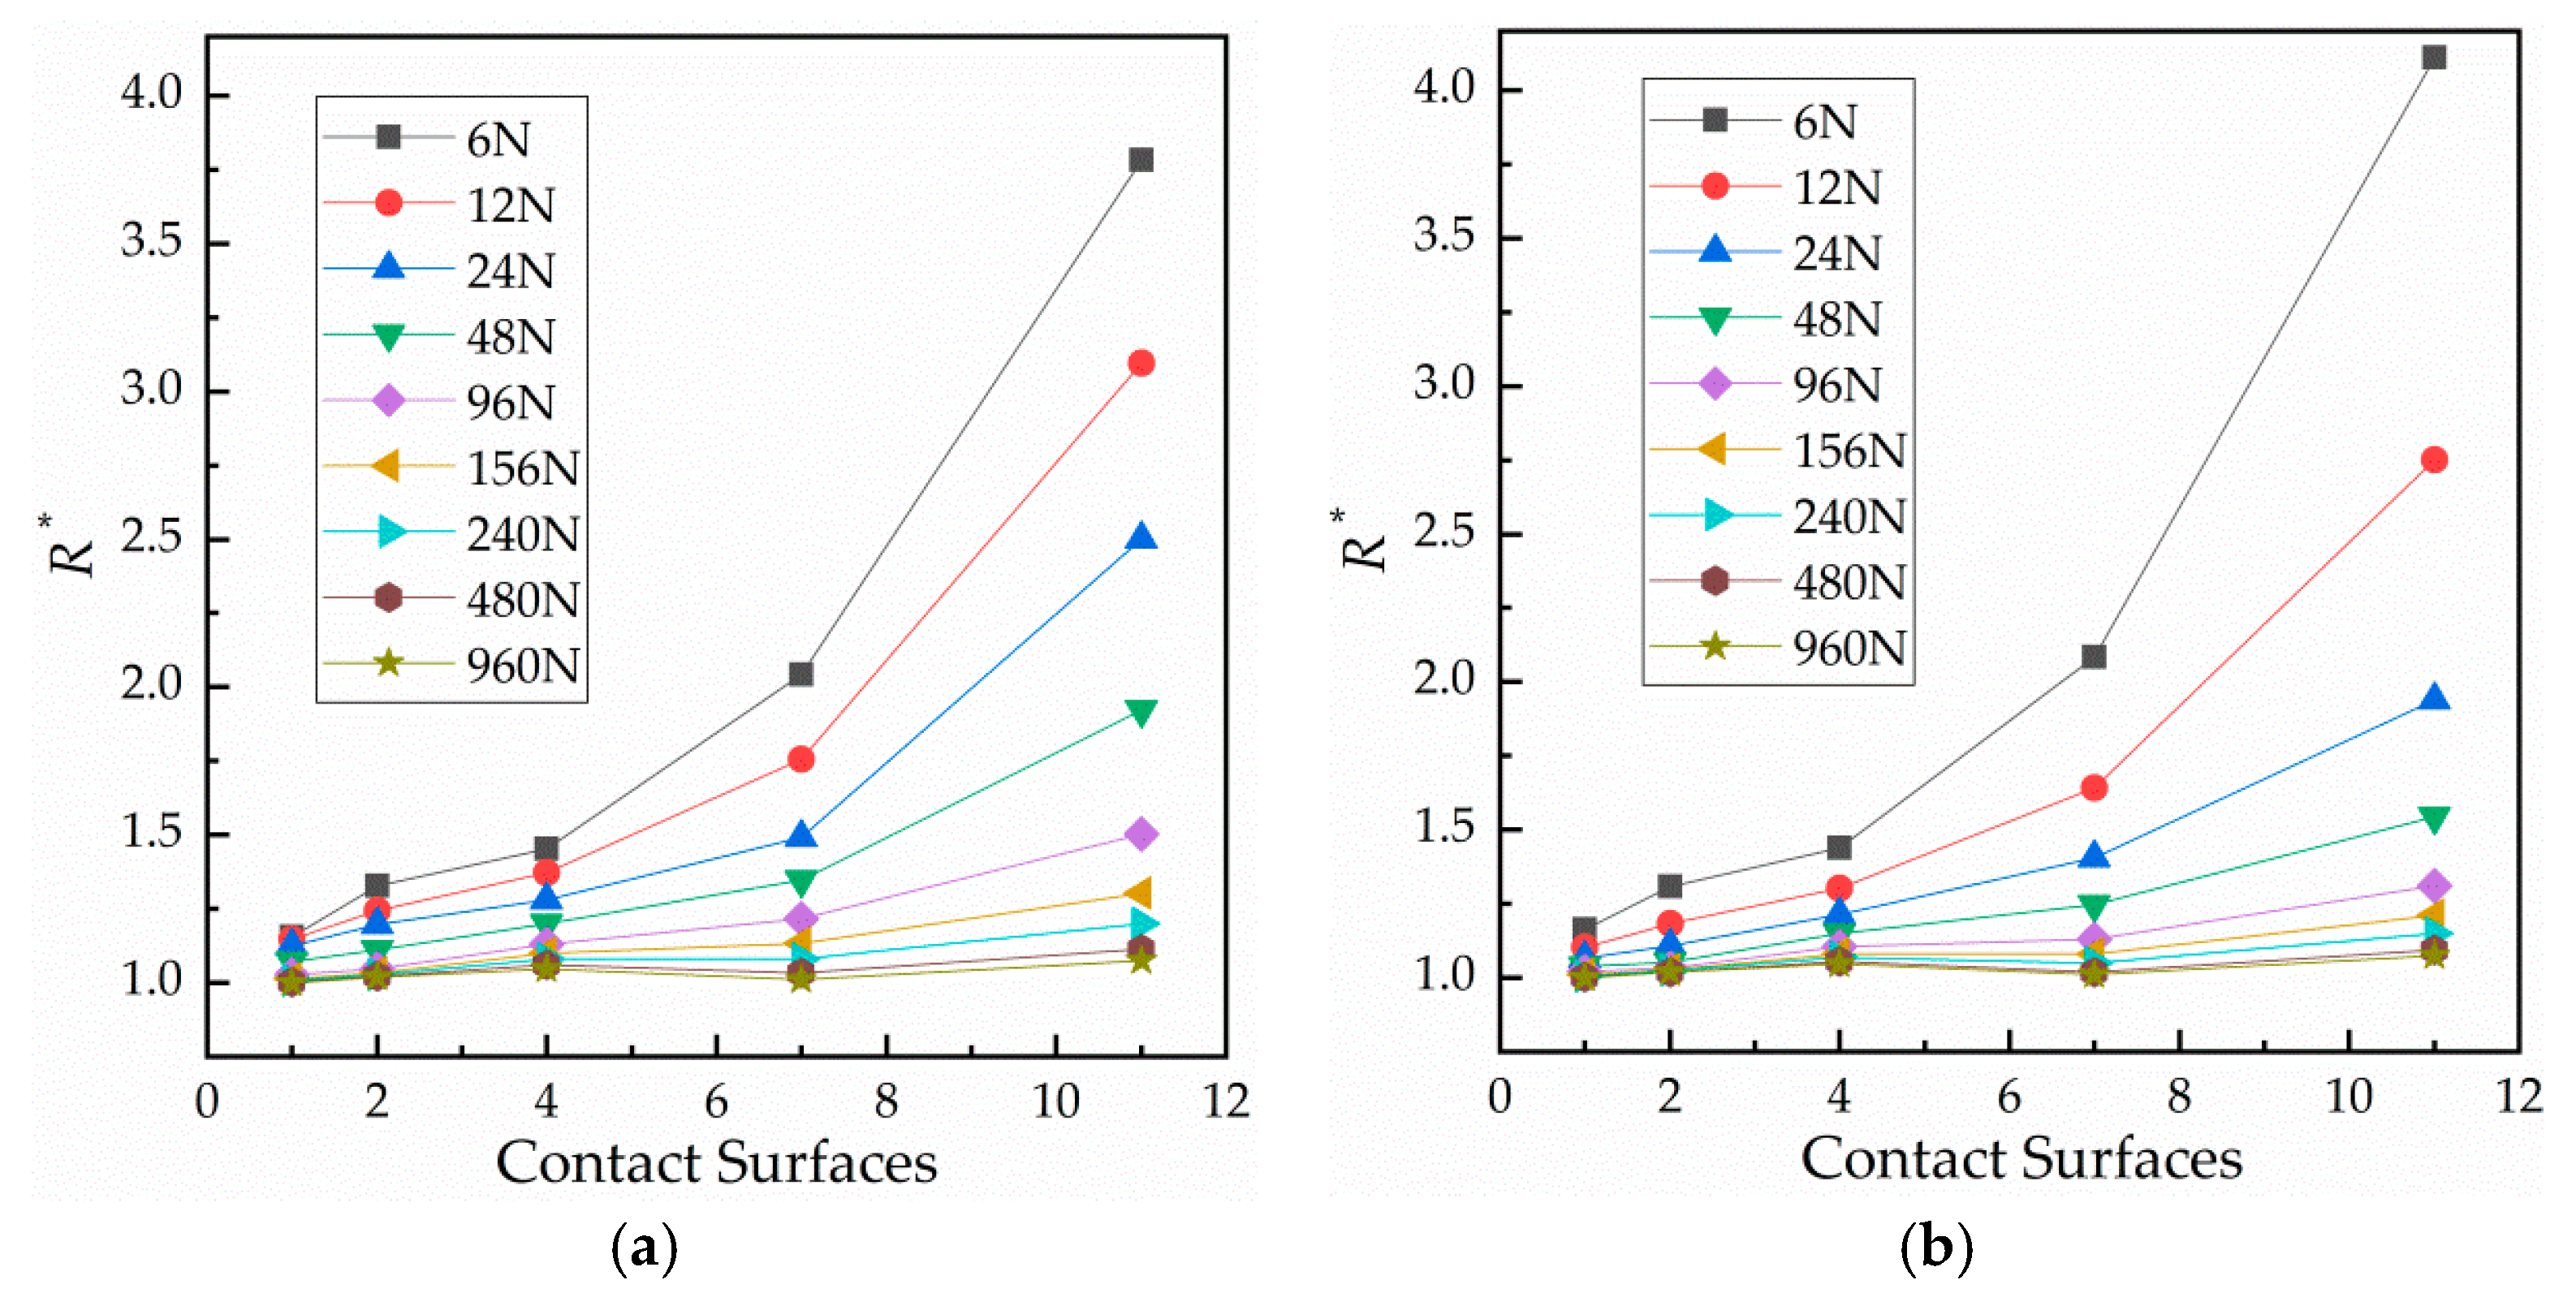
3.3. Results of Force–Relative Contact Resistance as the Number of Contact Surfaces Changes
4. Discussion
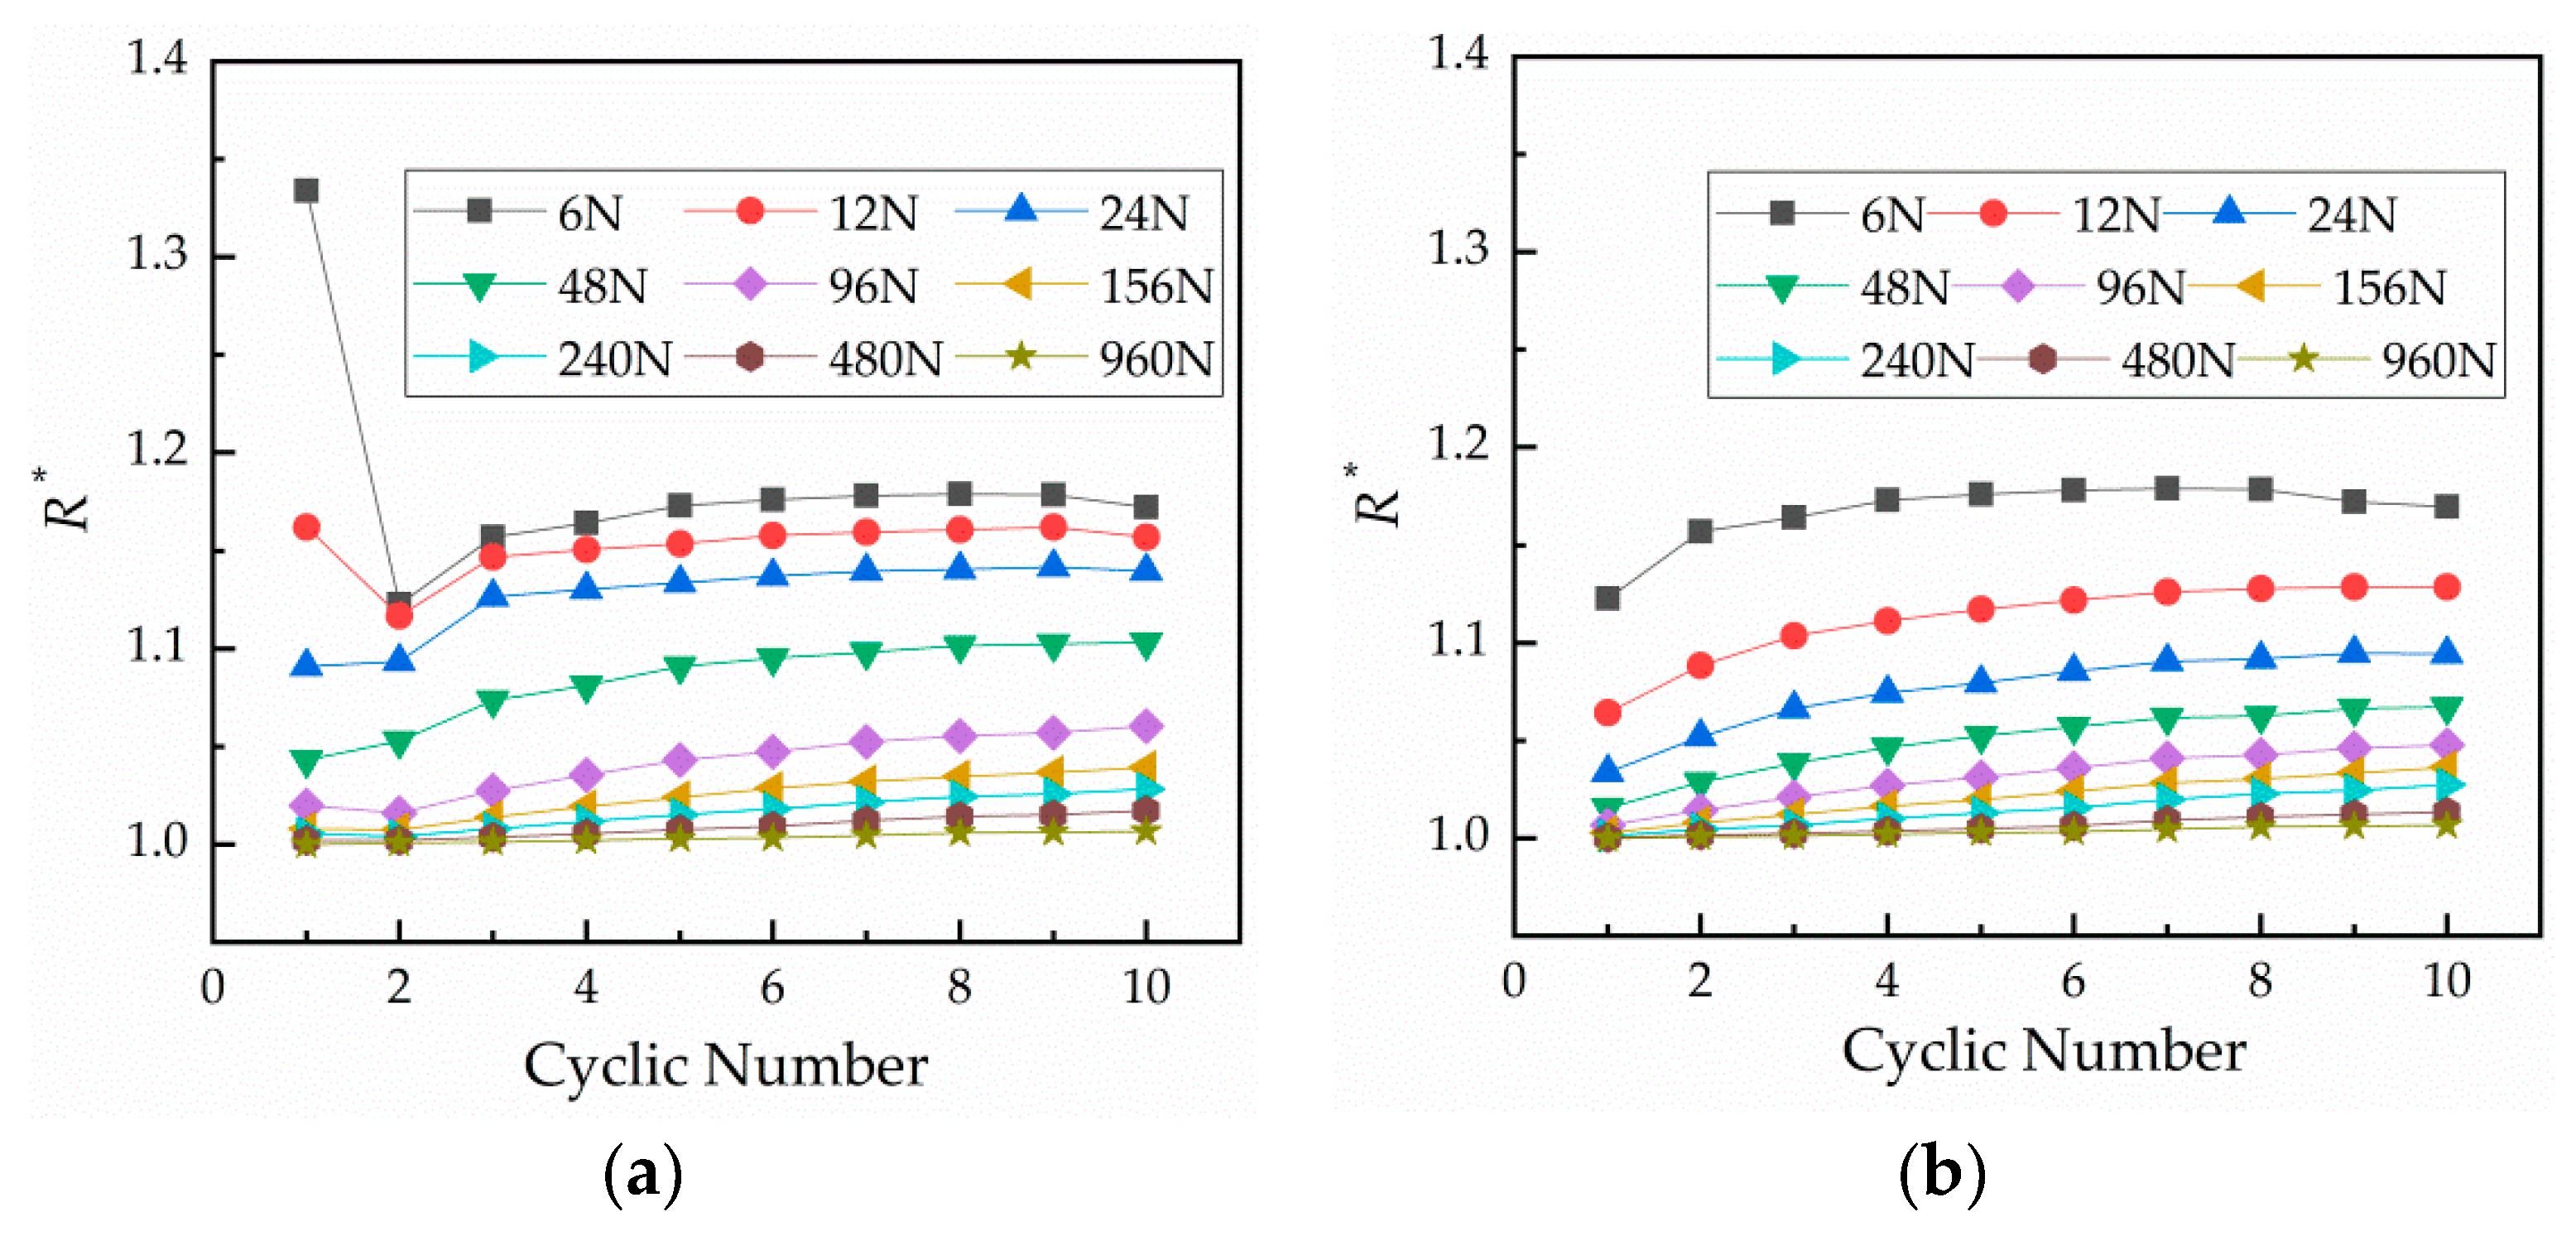
4.1. Fitting and Discussion of the Influence of Cyclic Number on Contact Resistance
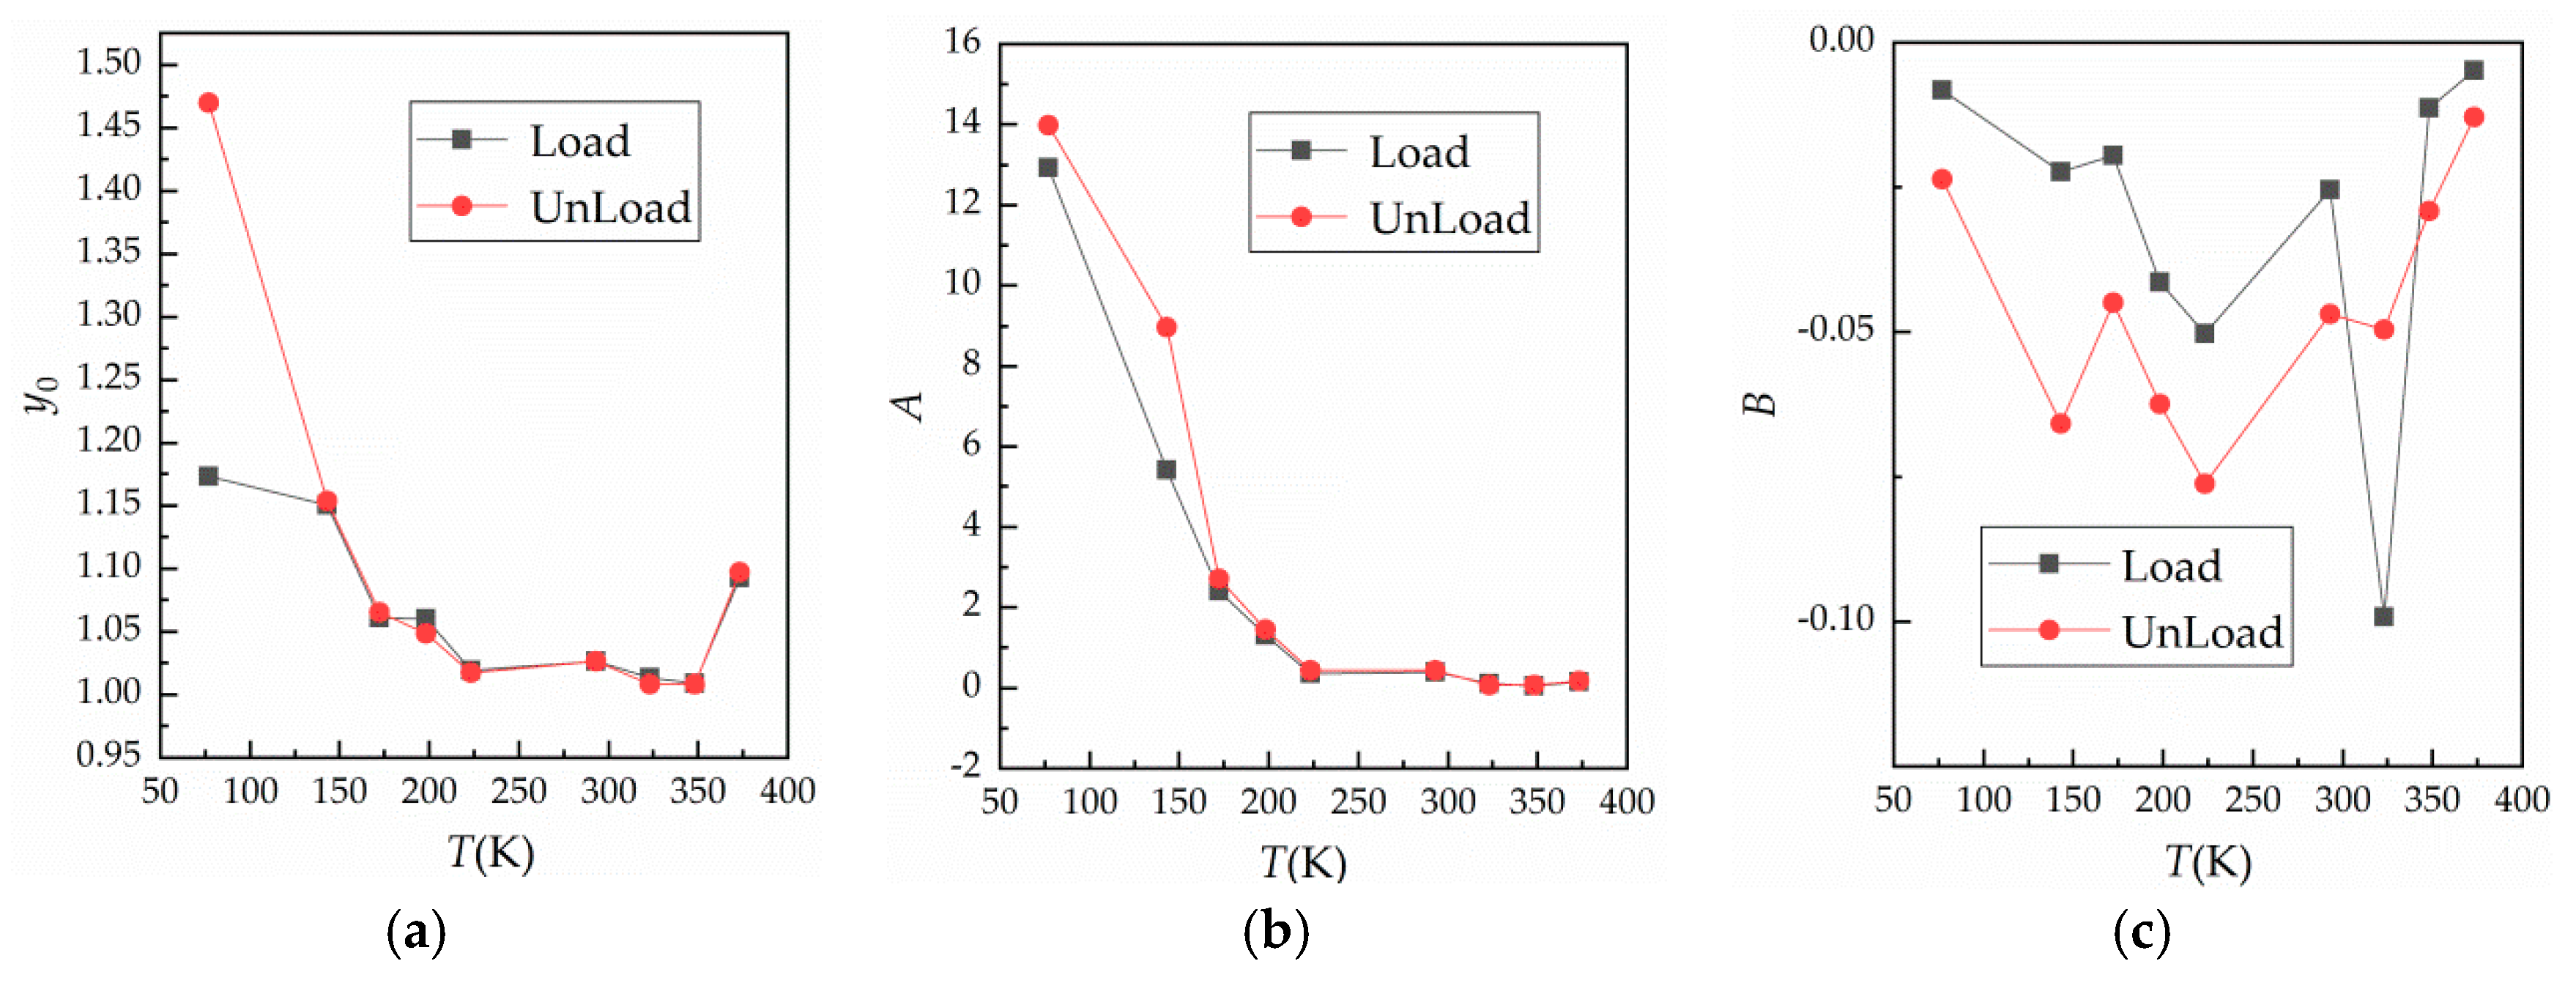
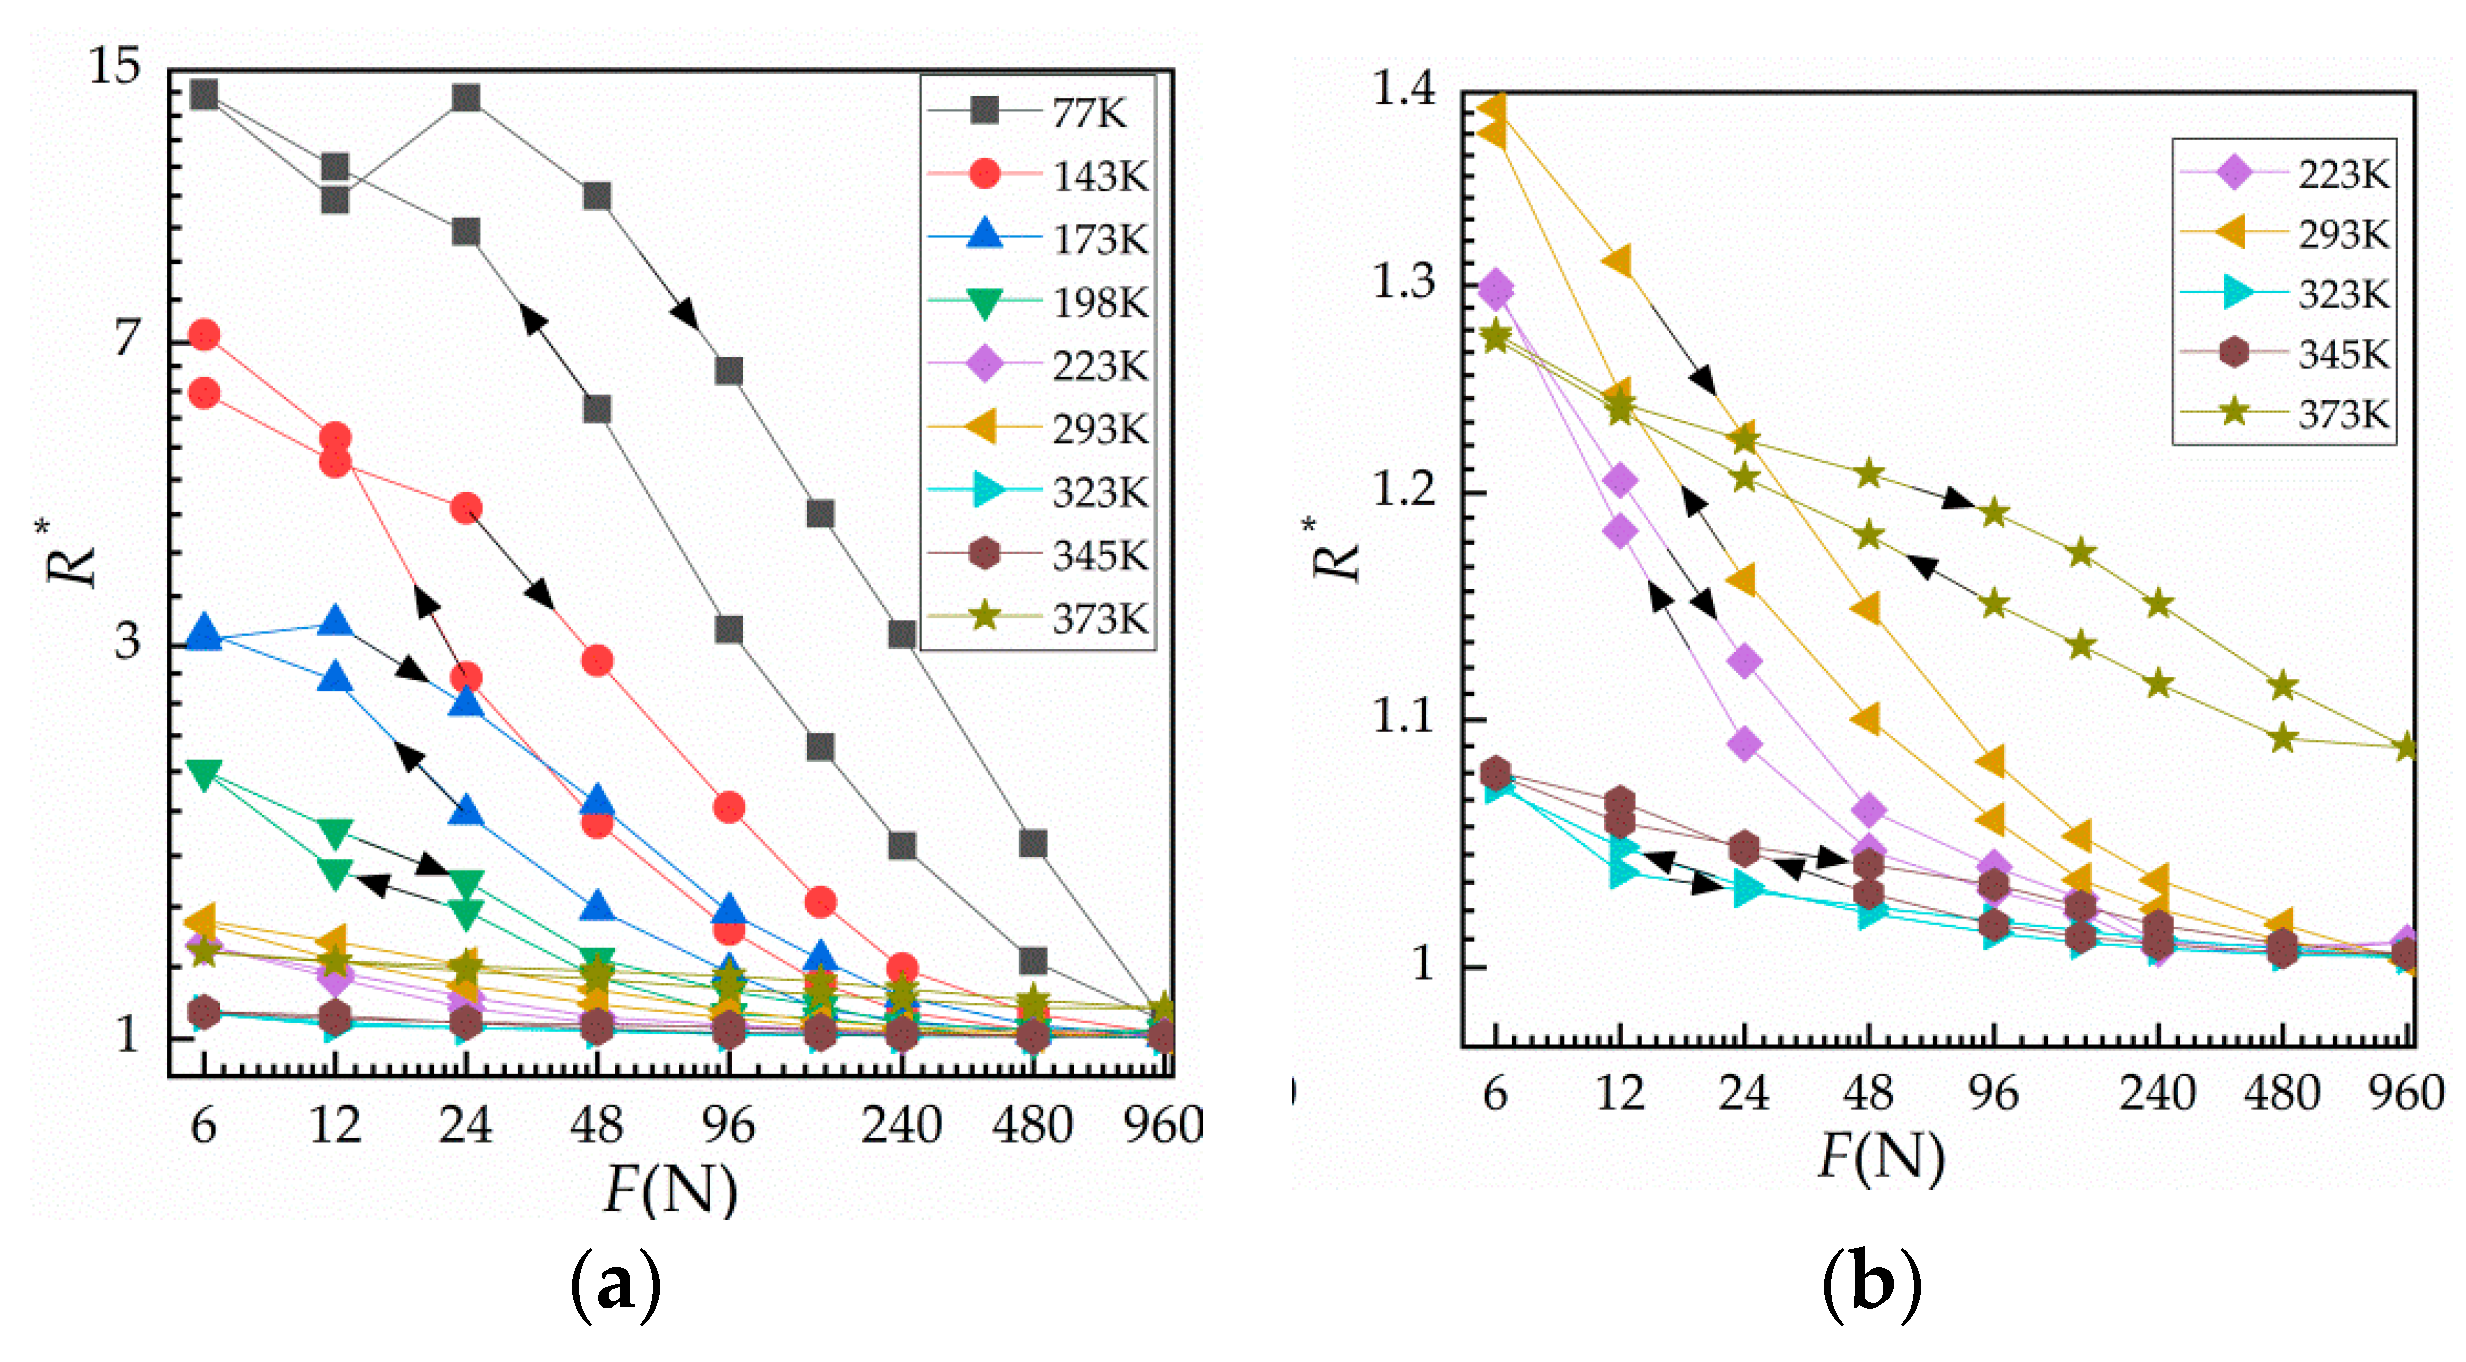
4.2. Fitting and Discussion of the Effect of Enviroment Temperature on Contact Resistance
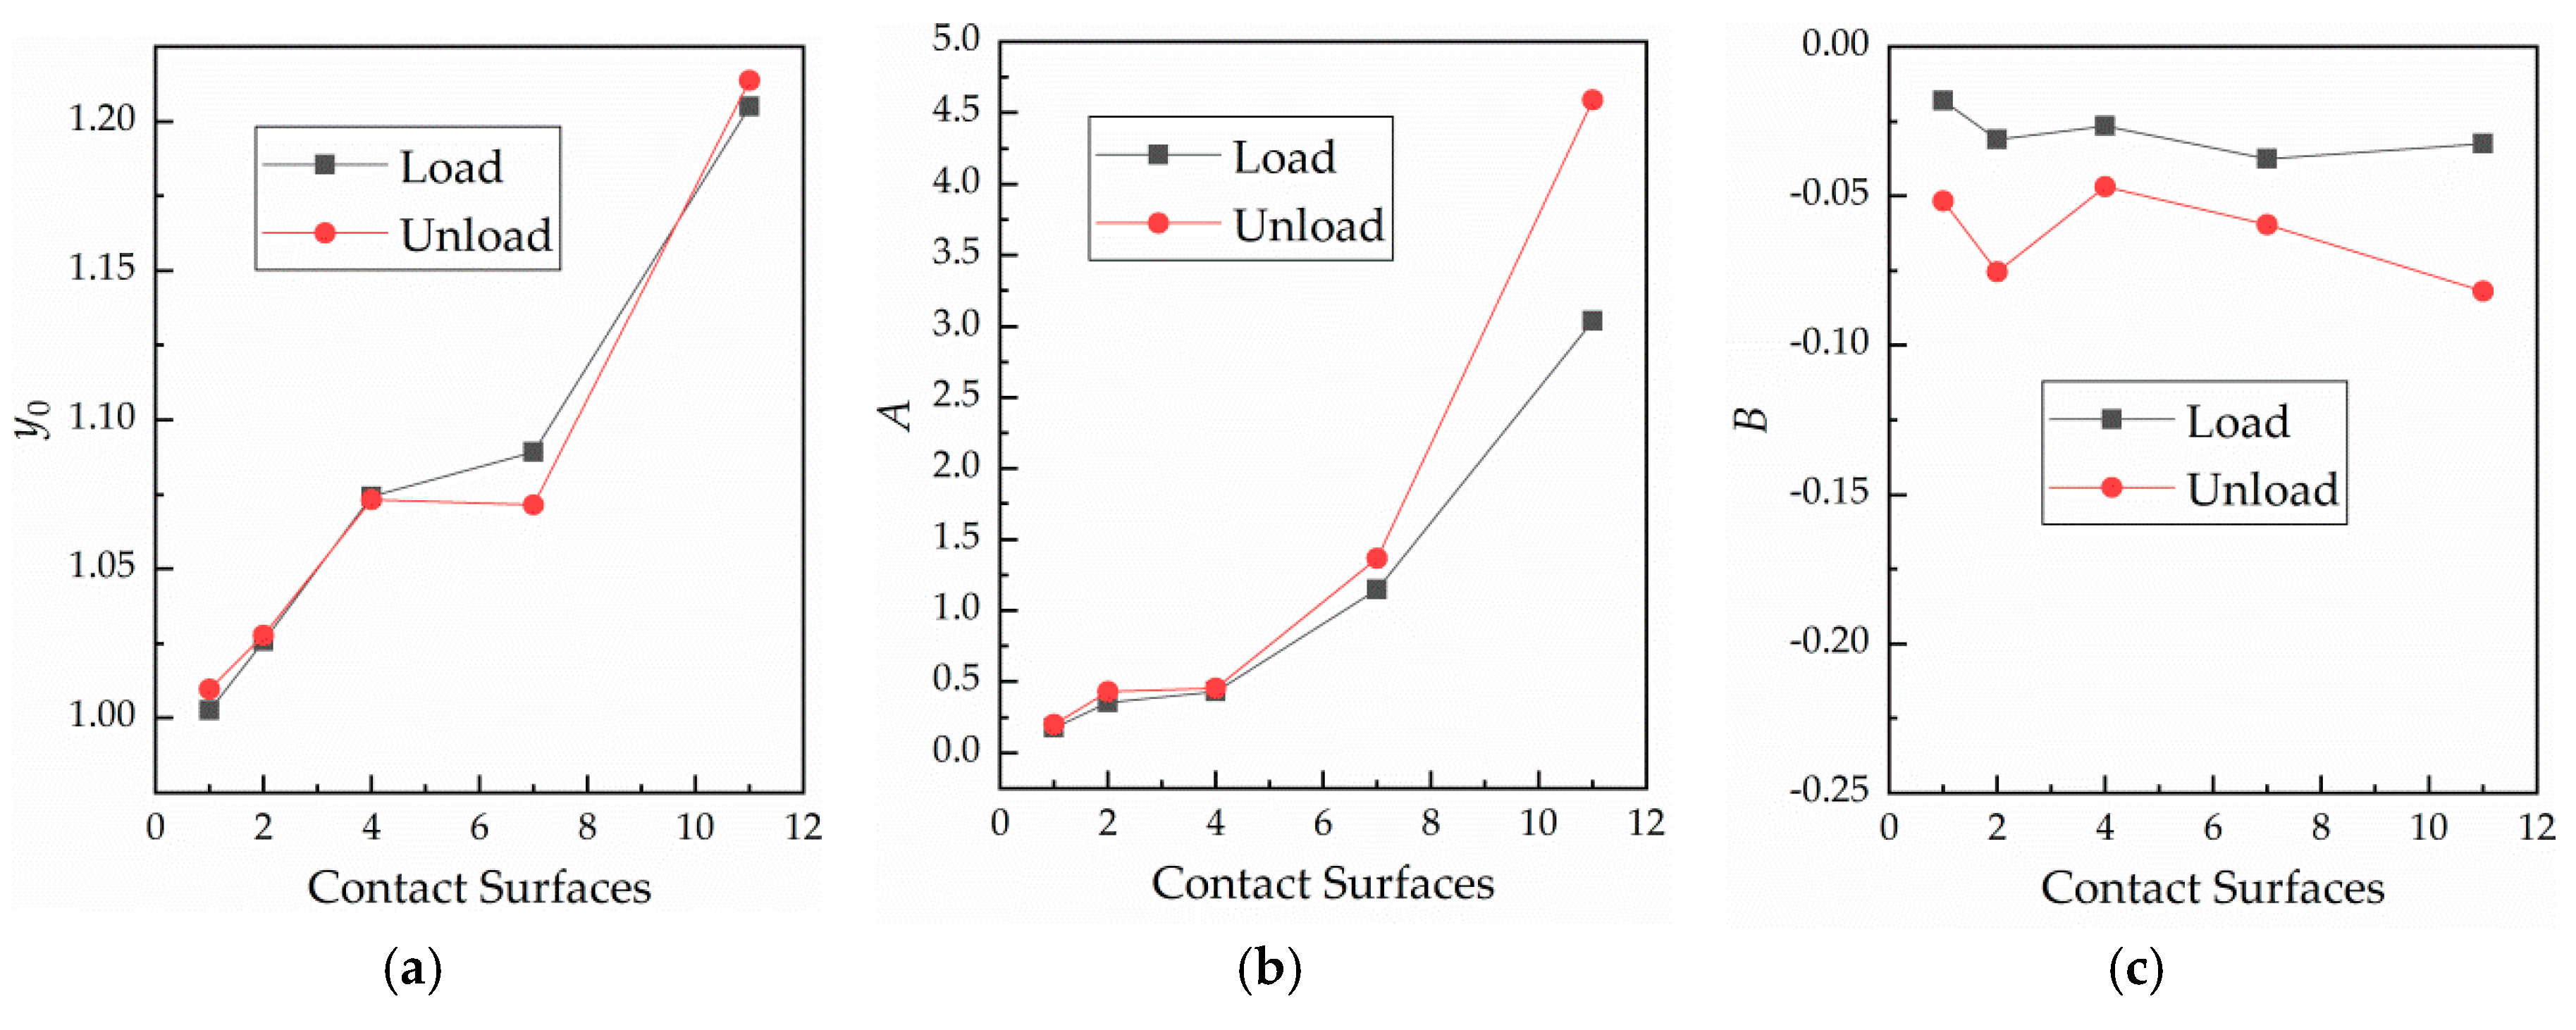
4.3. Fitting and Discussion of the Effect of the Number of the Contact Surfaces on Contact Resistance
5. Conclusions
Reference
Author Contributions
Funding
Acknowledgments
Conflicts of Interest
References
- James, P.S.; Chandler, H.W.; Evans, J.T.; Wen, J.; Browne, D.J.; Newton, C.J. The effect of mechanical loading on the contact resistance of coated aluminium. Mater. Sci. Eng. A 1997, 230, 194–201. [Google Scholar] [CrossRef]
- Crinon, E.; Evans, J.T. The effect of surface roughness, oxide film thickness and interfacial sliding on the electrical contact resistance of aluminium. Mater. Sci. Eng. A 1998, 242, 121–128. [Google Scholar] [CrossRef]
- Babu, S.S.; Santella, M.L.; Feng, Z.; Riemer, B.W.; Cohron, J.W. Empirical model of effects of pressure and temperature on electrical contact resistance of metals. Sci. Technol. Weld. Join. 2001, 6, 126–132. [Google Scholar] [CrossRef]
- Rauscher, S.G.; Bruck, H.A.; DeVoe, D.L. Electrical contact resistance force sensing in SOI-DRIE MEMS. Sens. Actuators A 2018, 269, 474–482. [Google Scholar] [CrossRef]
- Shirakawa, T.; Miyayama, M.; Nakamura, Y.; Yanagida, H. Effect of electric field on the surface electrical resistance of CuO-ZnO hetero-contact. J. Mater. Sci. Lett. 1991, 10, 381–383. [Google Scholar] [CrossRef]
- Farges, C.; Chevrie, M.; Sabatier, J.; Pradere, L.; Guillemard, F. Detection of electric contact resistance variations in automotive connectors. IEEE. Trans. Ind. Electron. 2017, 64, 9469–9476. [Google Scholar] [CrossRef]
- Clarke, A.; Weeks, I.J.J.; Evans, H.P.; Snidle, R.W. An investigation into mixed lubrication conditions using electrical contact resistance techniques. Tribol. Int. 2016, 93, 709–716. [Google Scholar] [CrossRef]
- Hahn, S.; Park, D.K.; Bascunan, J.; Iwasa, Y. HTS pancake coils without turn-to-turn insulation. IEEE Trans. Appl. Supercond. A 2011, 21, 1592–1595. [Google Scholar] [CrossRef]
- Wang, T.; Noguchi, S.; Wang, X.; Arakawa, I.; Minami, K.; Monma, K.; Ishiyama, A.; Hahn, S.; Iwasa, Y. Analyses of transient behaviors of no-insulation REBCO pancake coils during sudden discharging and overcurrent. IEEE Trans. Appl. Supercond. A 2015, 25, 4603409. [Google Scholar] [CrossRef]
- Lu, J.; Goddard, R.; Han, K.; Hahn, S. Contact resistance between two REBCO tapes under load and load cycles. Supercond. Sci. Technol. 2017, 30, 045005. [Google Scholar] [CrossRef]
- Bonura, M.; Barth, C.; Joudrier, A.; Troitino, J.F.; Fête, A.; Senatore, C. Systematic study of the contact resistance between REBCO tapes: Pressure dependence in the case of no-insulation, metal co-winding and metal-insulation. IEEE Trans. Appl. Supercond. A 2019, 29, 6600305. [Google Scholar] [CrossRef]
- Holm, R. Electric Contacs Theory and Appicationt, 4th ed.; Springer: Berlin/Heidelberg, Germany; GmbH: New York, NY, USA, 1981; p. 1. [Google Scholar]
- Kogut, L. Electrical performance of contaminated rough surfaces in contact. J. Appl. Phys. 2005, 97, 103723. [Google Scholar] [CrossRef]
- Liu, H.; Pons, P.; Colin, S.; Broué, A. Finite element based surface roughness study for ohmic contact of microswitches. In Proceedings of the IEEE 58th Holm Conference Electrical Contacts (Holm), Portland, OR, USA, 23–26 September 2012. [Google Scholar]
- Kondo, T.; Nakata, H.; Sekikawa, J.; Kubota, Y.; Hayakawa, K.; Nakamura, T. An analysis of relationship between contact resistance and fracture of oxide film for connector contacts using finite element method. In Proceedings of the Annual Holm Conference on Electrical Contacts, New Orleans, LA, USA, 12–15 October 2014. [Google Scholar]
- Barber, J.R. Bounds on the electrical resistance between contacting elastic rough bodies. In Mathematical, Physical and Engineering Sciences; Royal Society: London, UK, 2003. [Google Scholar]
- Greenwood, J.A. Constriction resistance and the real area of contact. Br. J. Appl. Phys. 1966, 17, 1621–1632. [Google Scholar] [CrossRef]
- Caven, R.W.; Jalali, J. Predicting the contact resistance distribution of electrical contacts by modeling the contact interface. In Proceedings of the Thirty-Seventh IEEE HOLM Conference on Electrical Contacts, Chicago, IL, USA, 6–9 October 1991. [Google Scholar]
- Lumbantobing, A.; Kogut, L.; Komvopoulos, K. Electrical contact resistance as a diagnostic tool for MEMS contact interfaces. J. Microelectromech. Syst. 2004, 13, 977–987. [Google Scholar] [CrossRef]
- Kawashima, A.; Hoh, S. Contact resistance in liquid nitrogen. Cryogenics 1974, 14, 381–383. [Google Scholar] [CrossRef]
- Tamai, T.; Tsuchiya, K. Contact resistance characteristics at low temperature. IEEE Trans. Compon. Hybrids Manuf. Technol. 1978, 1, 54–58. [Google Scholar] [CrossRef]
- Tamai, T. Singularity of contact resistance at very low temperature. IEEE Trans. Compon. Hybrids Manuf. Technol. 1986, 9, 40–45. [Google Scholar] [CrossRef]


| Number of Cycles | Loading | Unloading | ||||||
|---|---|---|---|---|---|---|---|---|
| Range | Range | |||||||
| 1 | 1.0132 | 0.5487 | −0.0951 | 0.969 | 1.0040 | 0.1934 | −0.0864 | 0.978 |
| 2 | 1.0014 | 0.1436 | −0.0209 | 0.994 | 1.0080 | 0.2167 | −0.0702 | 0.967 |
| 3 | 1.0028 | 0.1784 | −0.0185 | 0.993 | 1.0098 | 0.1986 | −0.0515 | 0.966 |
| 4 | 1.0052 | 0.1796 | −0.0173 | 0.996 | 1.0123 | 0.1972 | −0.0458 | 0.958 |
| 5 | 1.0070 | 0.1812 | −0.0159 | 0.997 | 1.0143 | 0.1930 | −0.0415 | 0.955 |
| 6 | 1.0087 | 0.1820 | −0.0152 | 0.997 | 1.0160 | 0.1869 | −0.0370 | 0.952 |
| 7 | 1.0110 | 0.1803 | −0.0147 | 0.996 | 1.0187 | 0.1805 | −0.0337 | 0.949 |
| 8 | 1.0127 | 0.1785 | −0.0142 | 0.996 | 1.0206 | 0.1791 | −0.0339 | 0.950 |
| 9 | 1.0135 | 0.1776 | −0.0139 | 0.995 | 1.0208 | 0.1646 | −0.0280 | 0.949 |
| 10 | 1.0144 | 0.1685 | −0.0128 | 0.995 | 1.0224 | 0.1595 | −0.0274 | 0.946 |
© 2019 by the authors. Licensee MDPI, Basel, Switzerland. This article is an open access article distributed under the terms and conditions of the Creative Commons Attribution (CC BY) license (http://creativecommons.org/licenses/by/4.0/).
Share and Cite
Liu, L.; Yan, J.; Wang, K.; Liu, Y.; Ta, W.; Gao, Y. Experimental Research on Electromechanical Properties of Multiple Contact Surfaces Copper Bulks under Normal Cyclic Loading and Variable Temperature. Materials 2019, 12, 3883. https://doi.org/10.3390/ma12233883
Liu L, Yan J, Wang K, Liu Y, Ta W, Gao Y. Experimental Research on Electromechanical Properties of Multiple Contact Surfaces Copper Bulks under Normal Cyclic Loading and Variable Temperature. Materials. 2019; 12(23):3883. https://doi.org/10.3390/ma12233883
Chicago/Turabian StyleLiu, Limei, Jiangtao Yan, Keyang Wang, Yang Liu, Wurui Ta, and Yuanwen Gao. 2019. "Experimental Research on Electromechanical Properties of Multiple Contact Surfaces Copper Bulks under Normal Cyclic Loading and Variable Temperature" Materials 12, no. 23: 3883. https://doi.org/10.3390/ma12233883
APA StyleLiu, L., Yan, J., Wang, K., Liu, Y., Ta, W., & Gao, Y. (2019). Experimental Research on Electromechanical Properties of Multiple Contact Surfaces Copper Bulks under Normal Cyclic Loading and Variable Temperature. Materials, 12(23), 3883. https://doi.org/10.3390/ma12233883