Waste-Based Pigments for Application in Ceramic Glazes and Stoneware Bodies

 ,
,  , and
, and
Abstract
1. Introduction
2. Experimental Details
2.1. Materials
2.2. Pigments Preparation
2.3. Coloring Potential and Stability
2.4. Sample Characterization
3. Results and Discussion
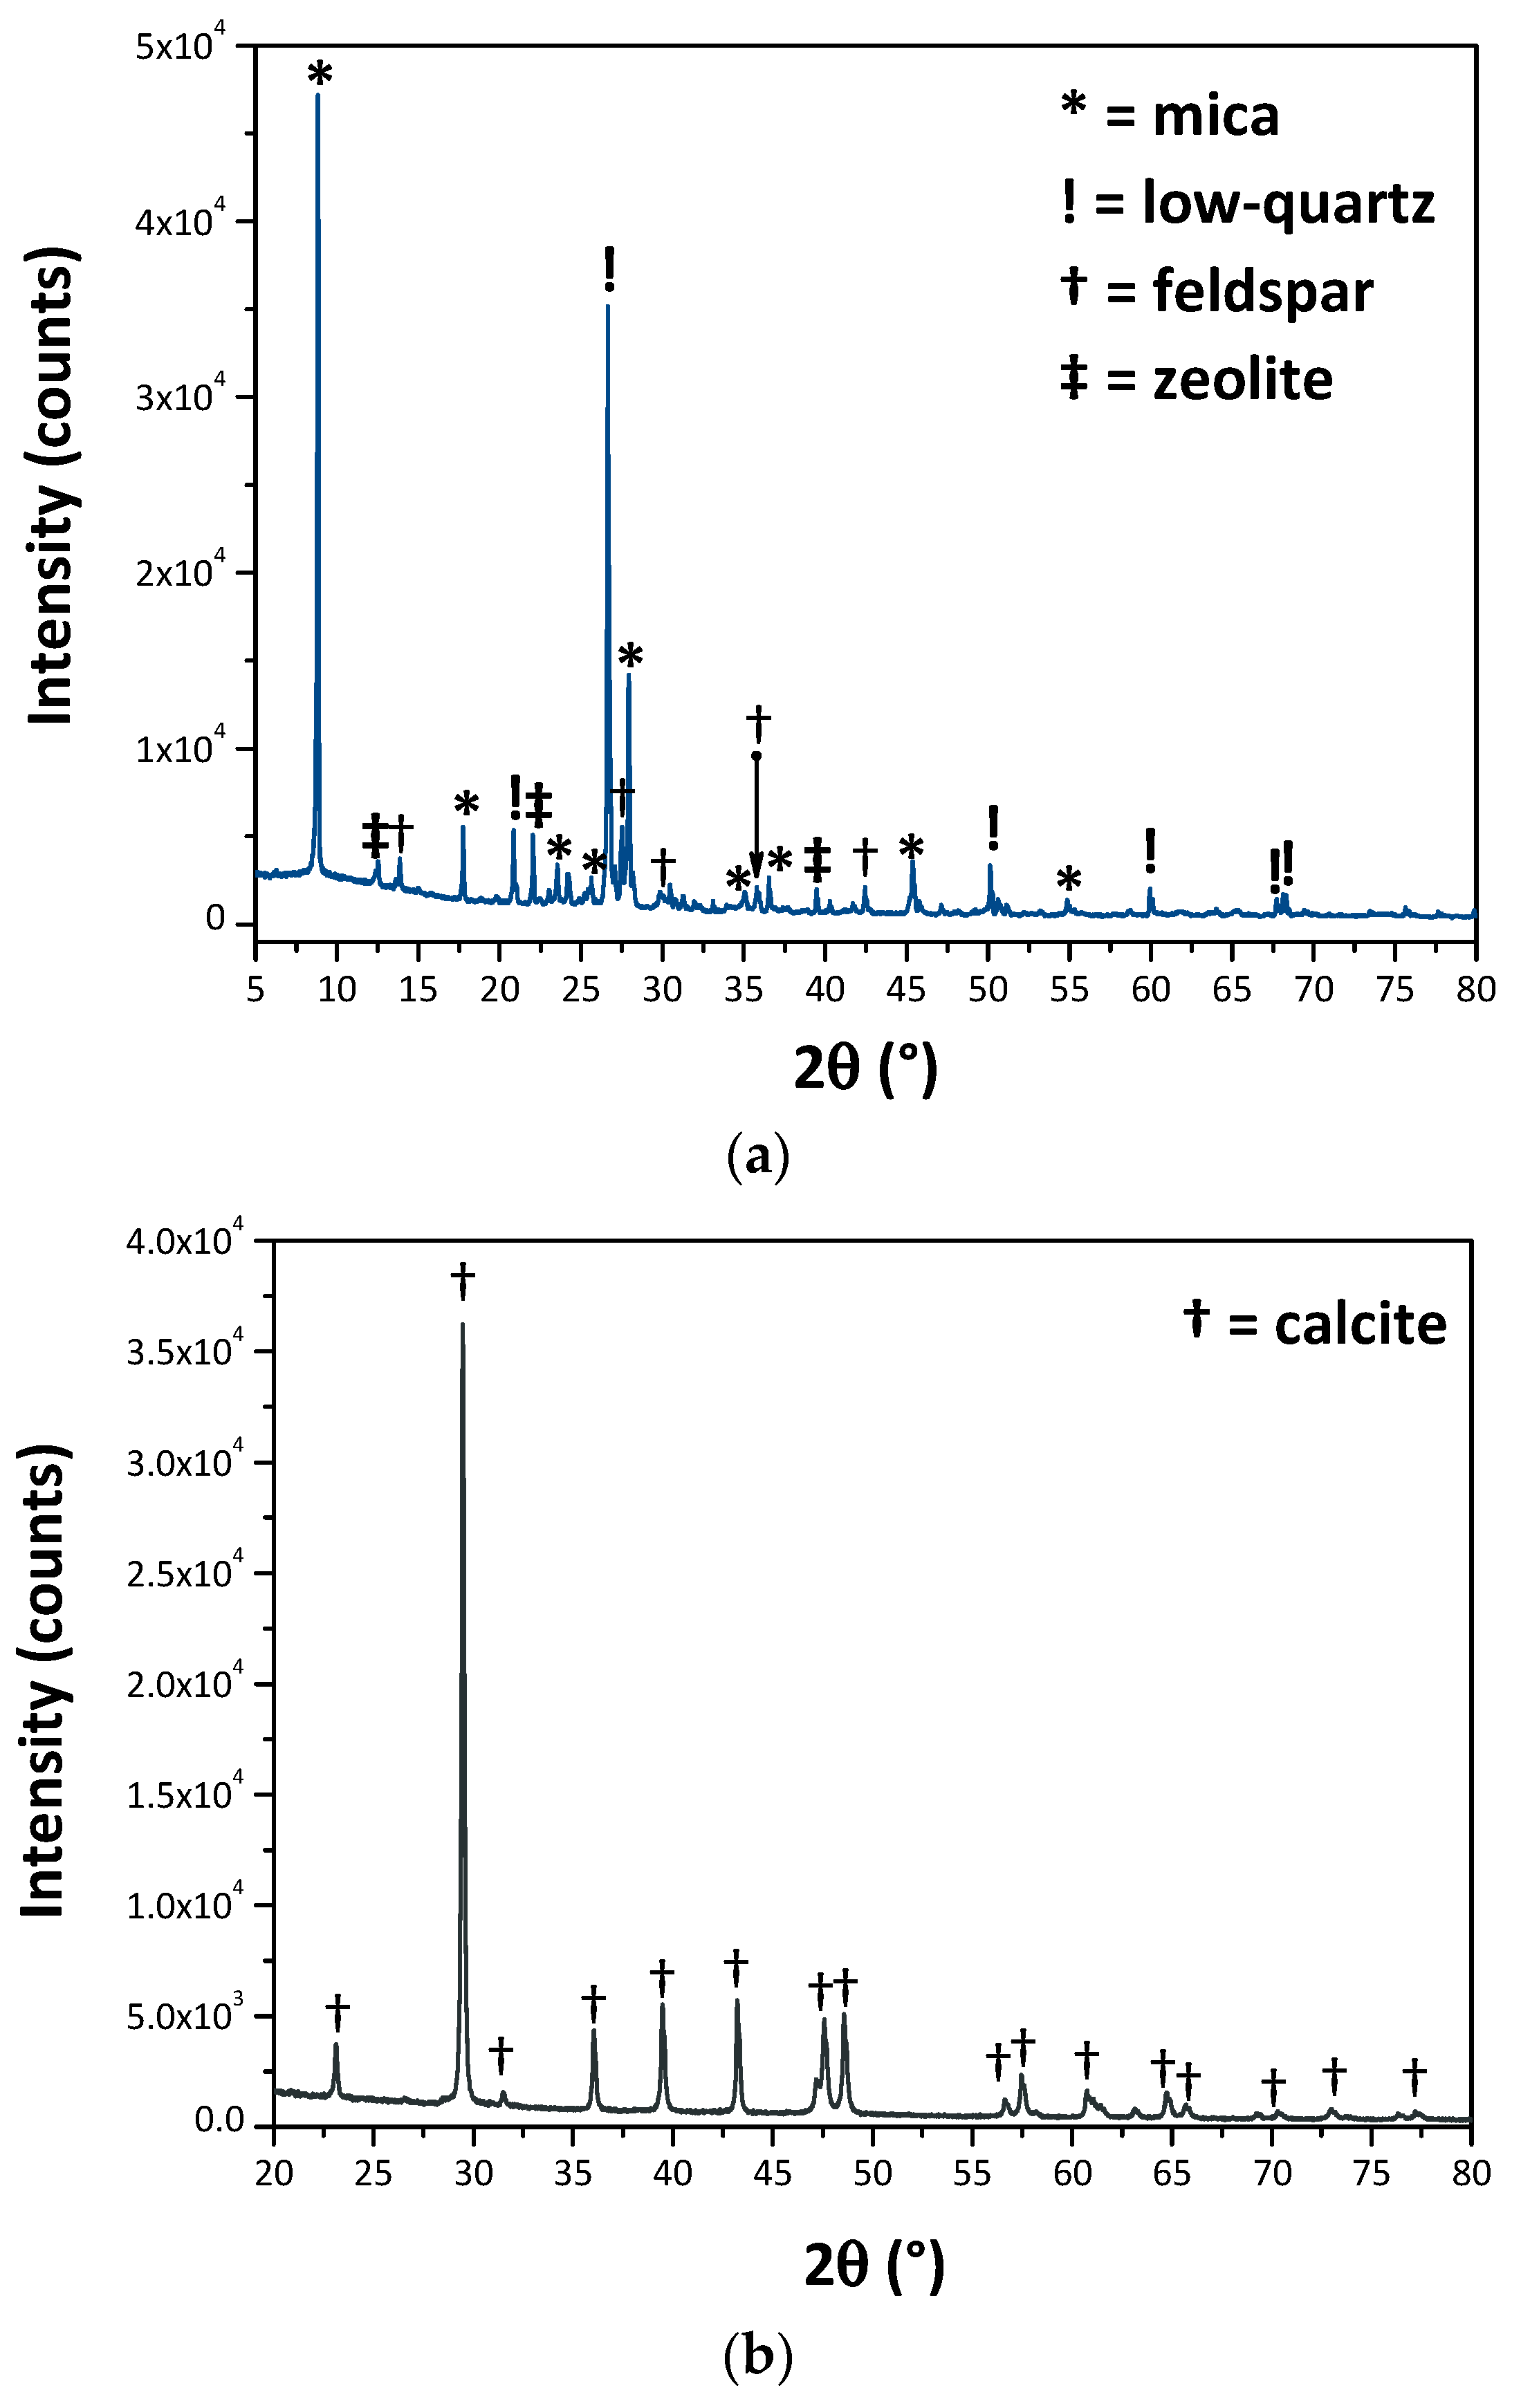
3.1. Wastes Characterization
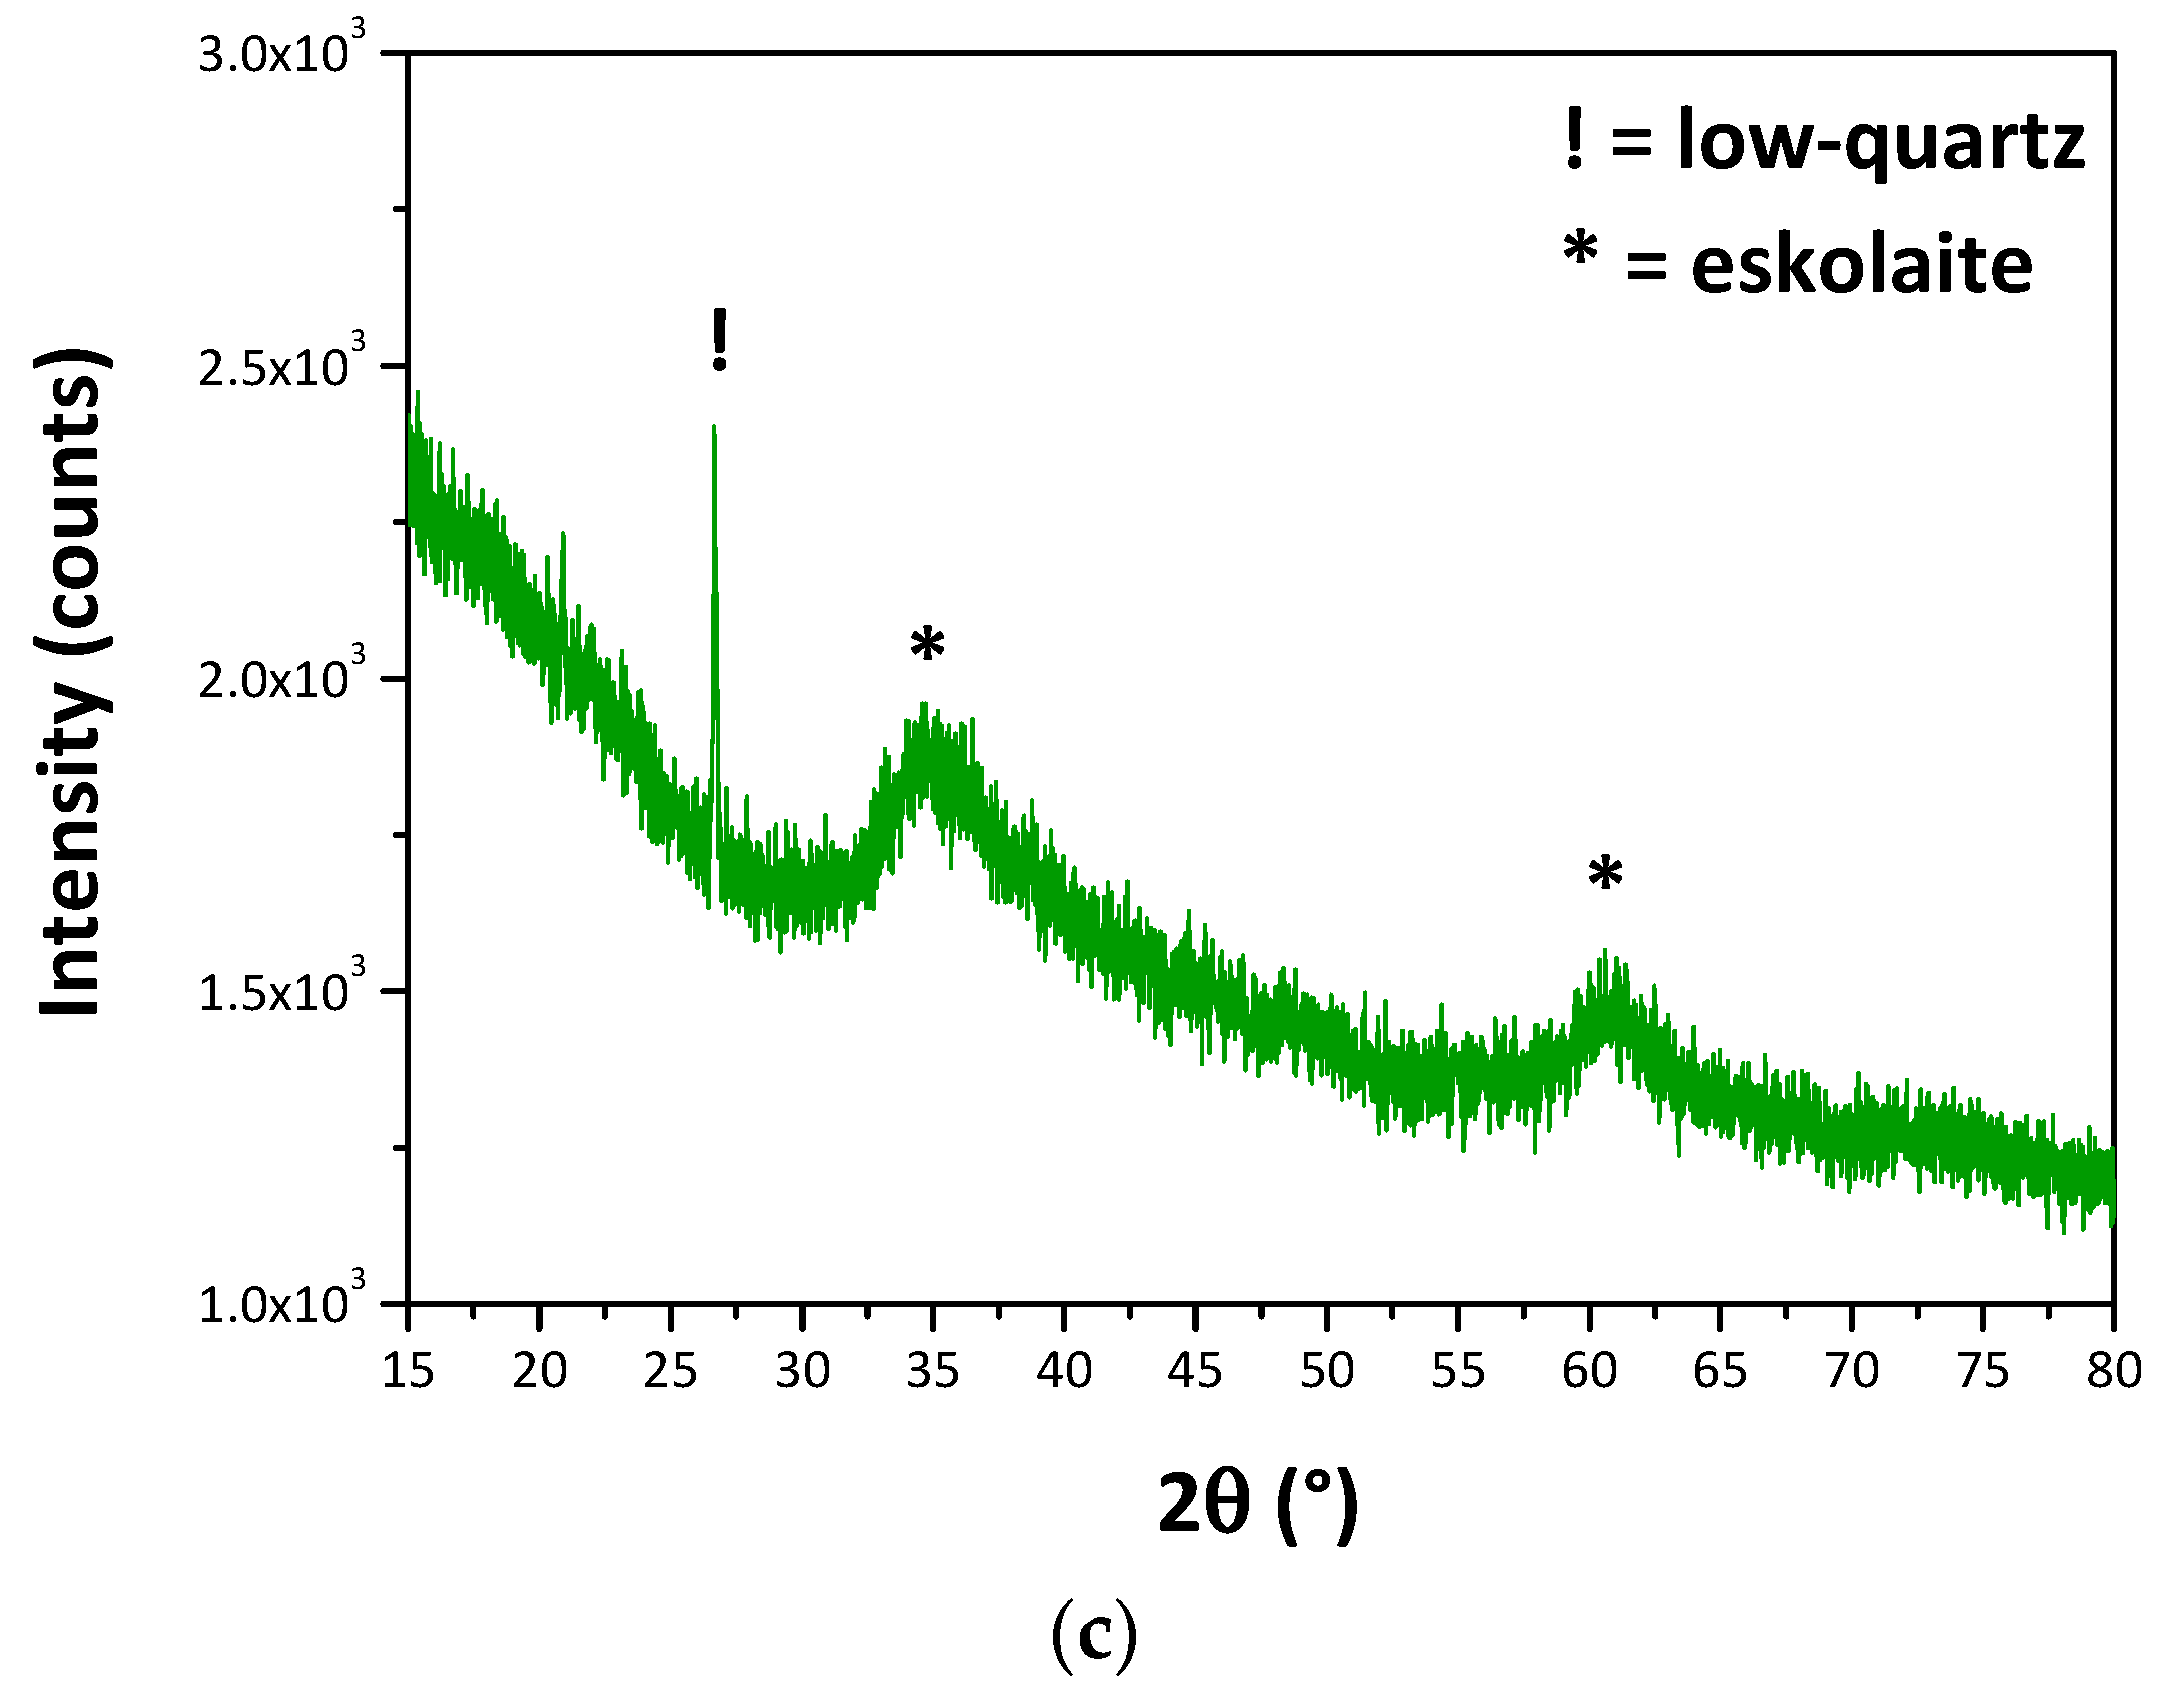
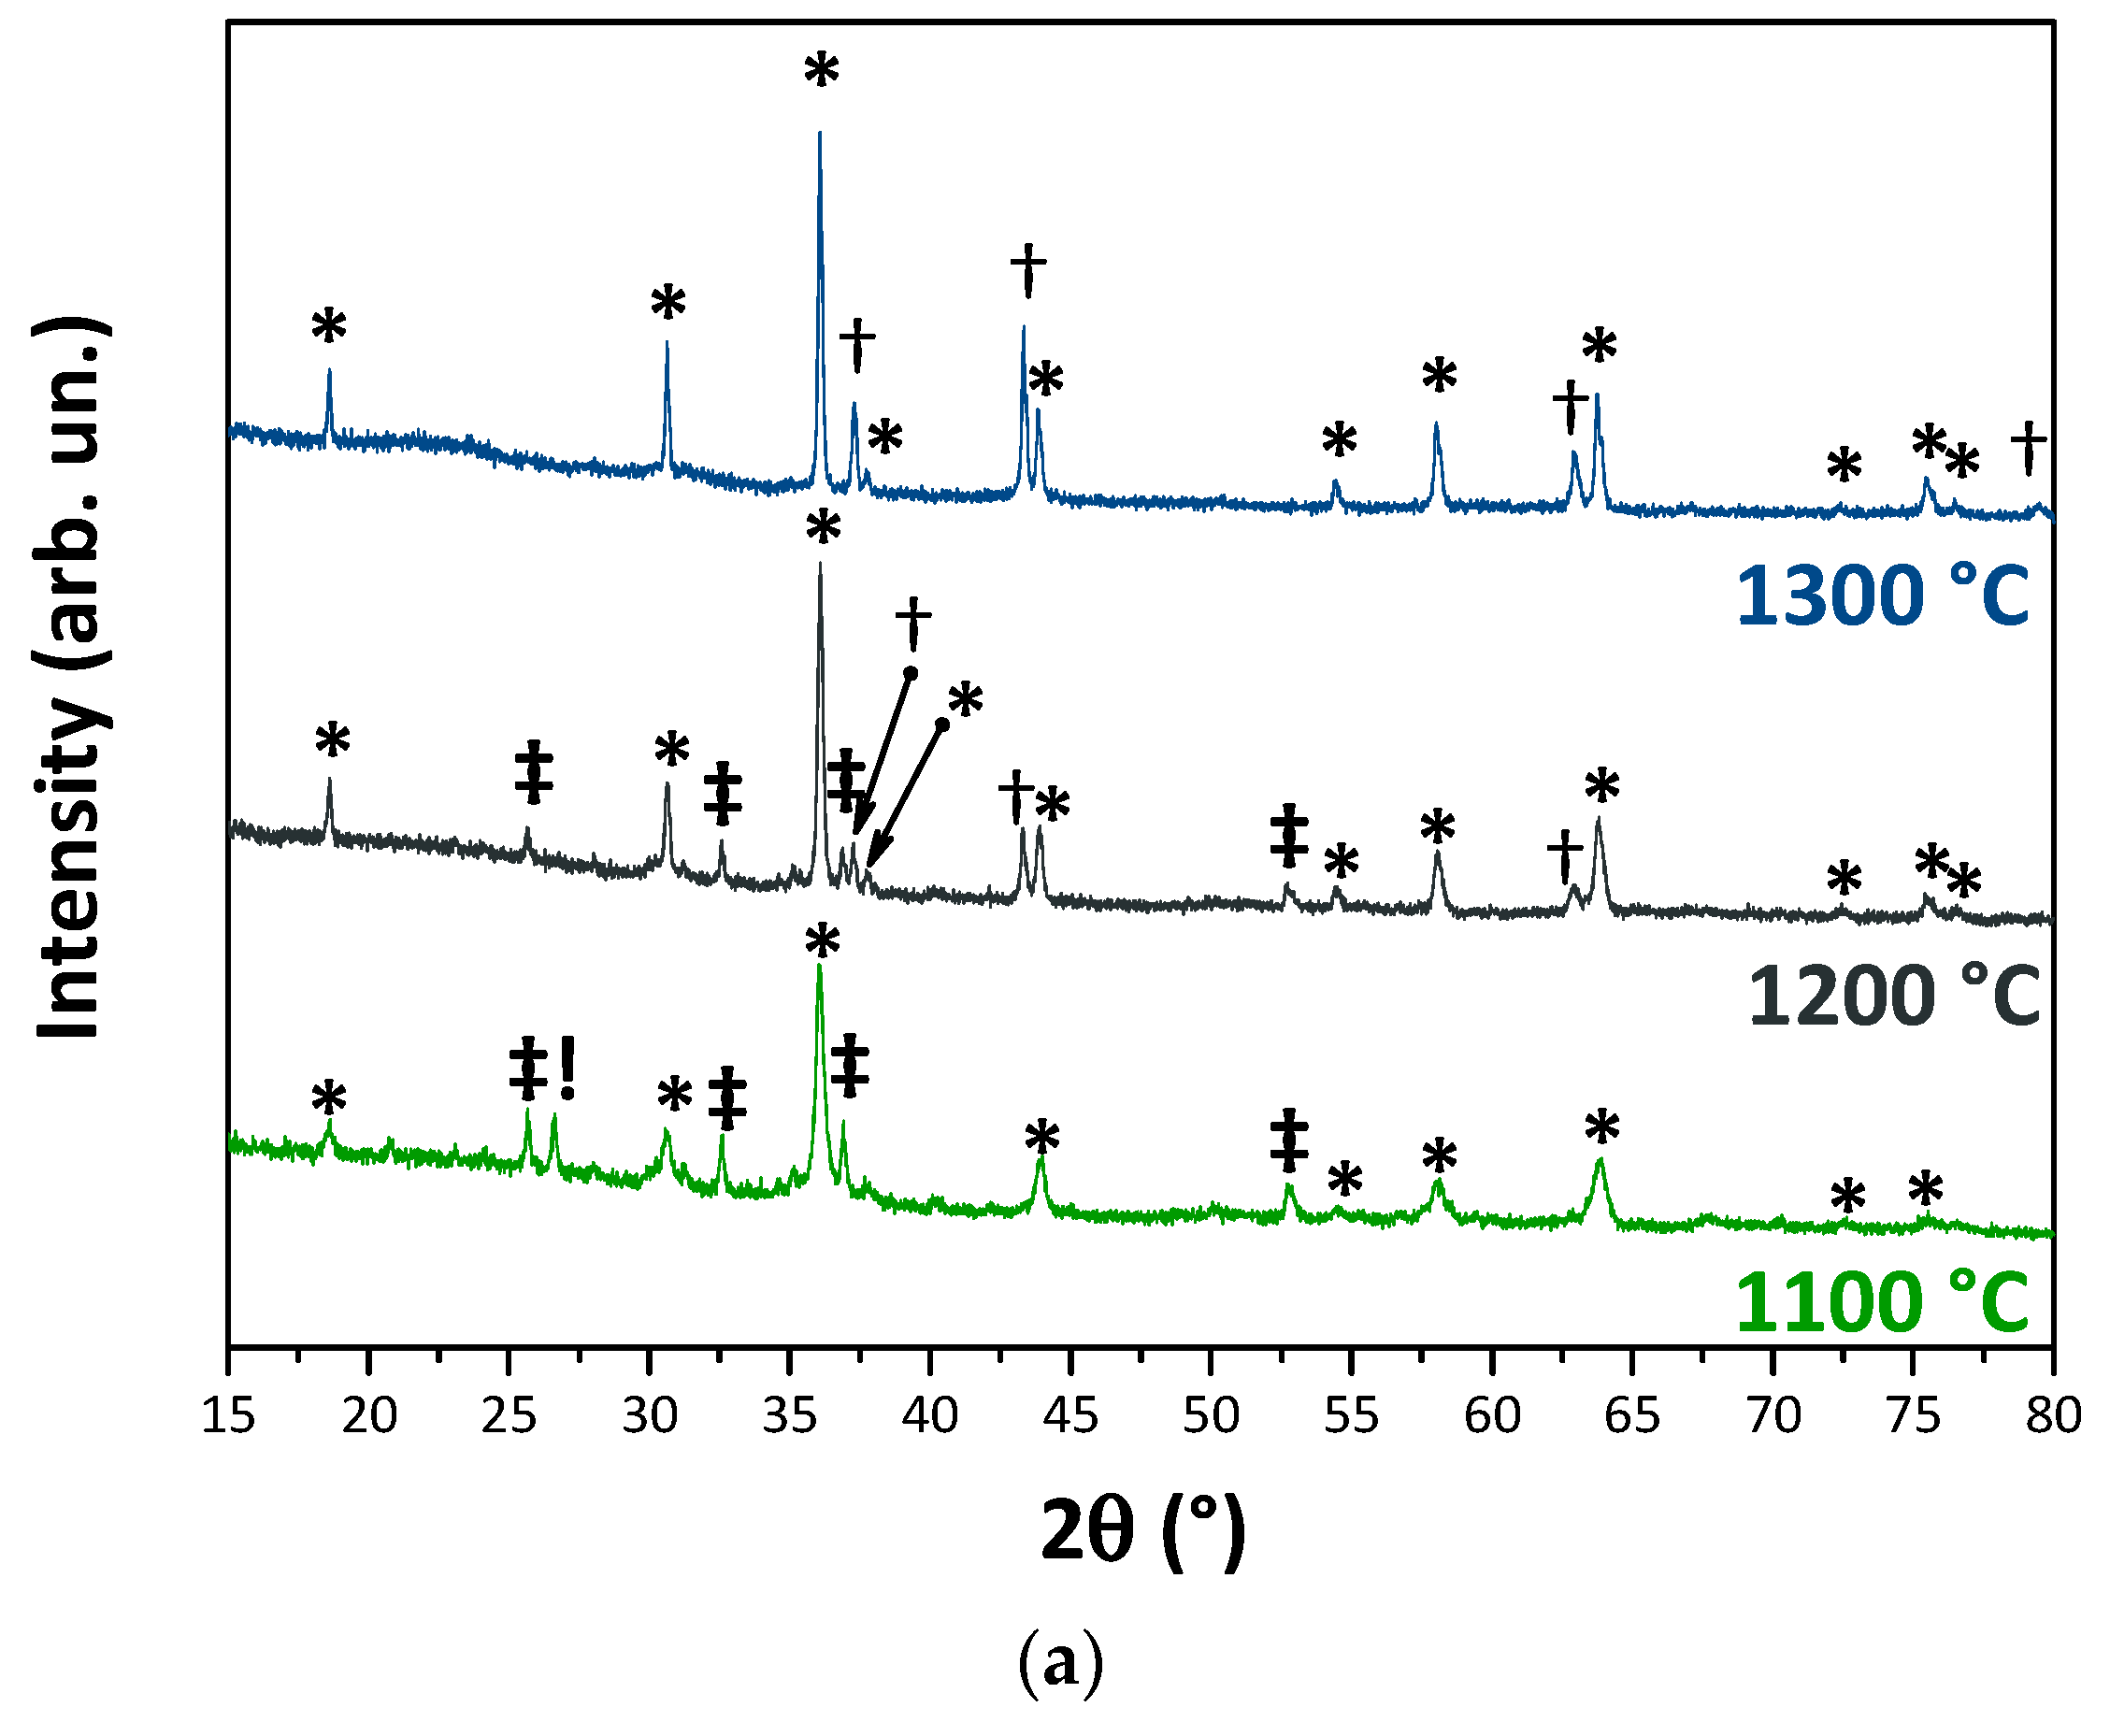
3.2. Pigments Characterization
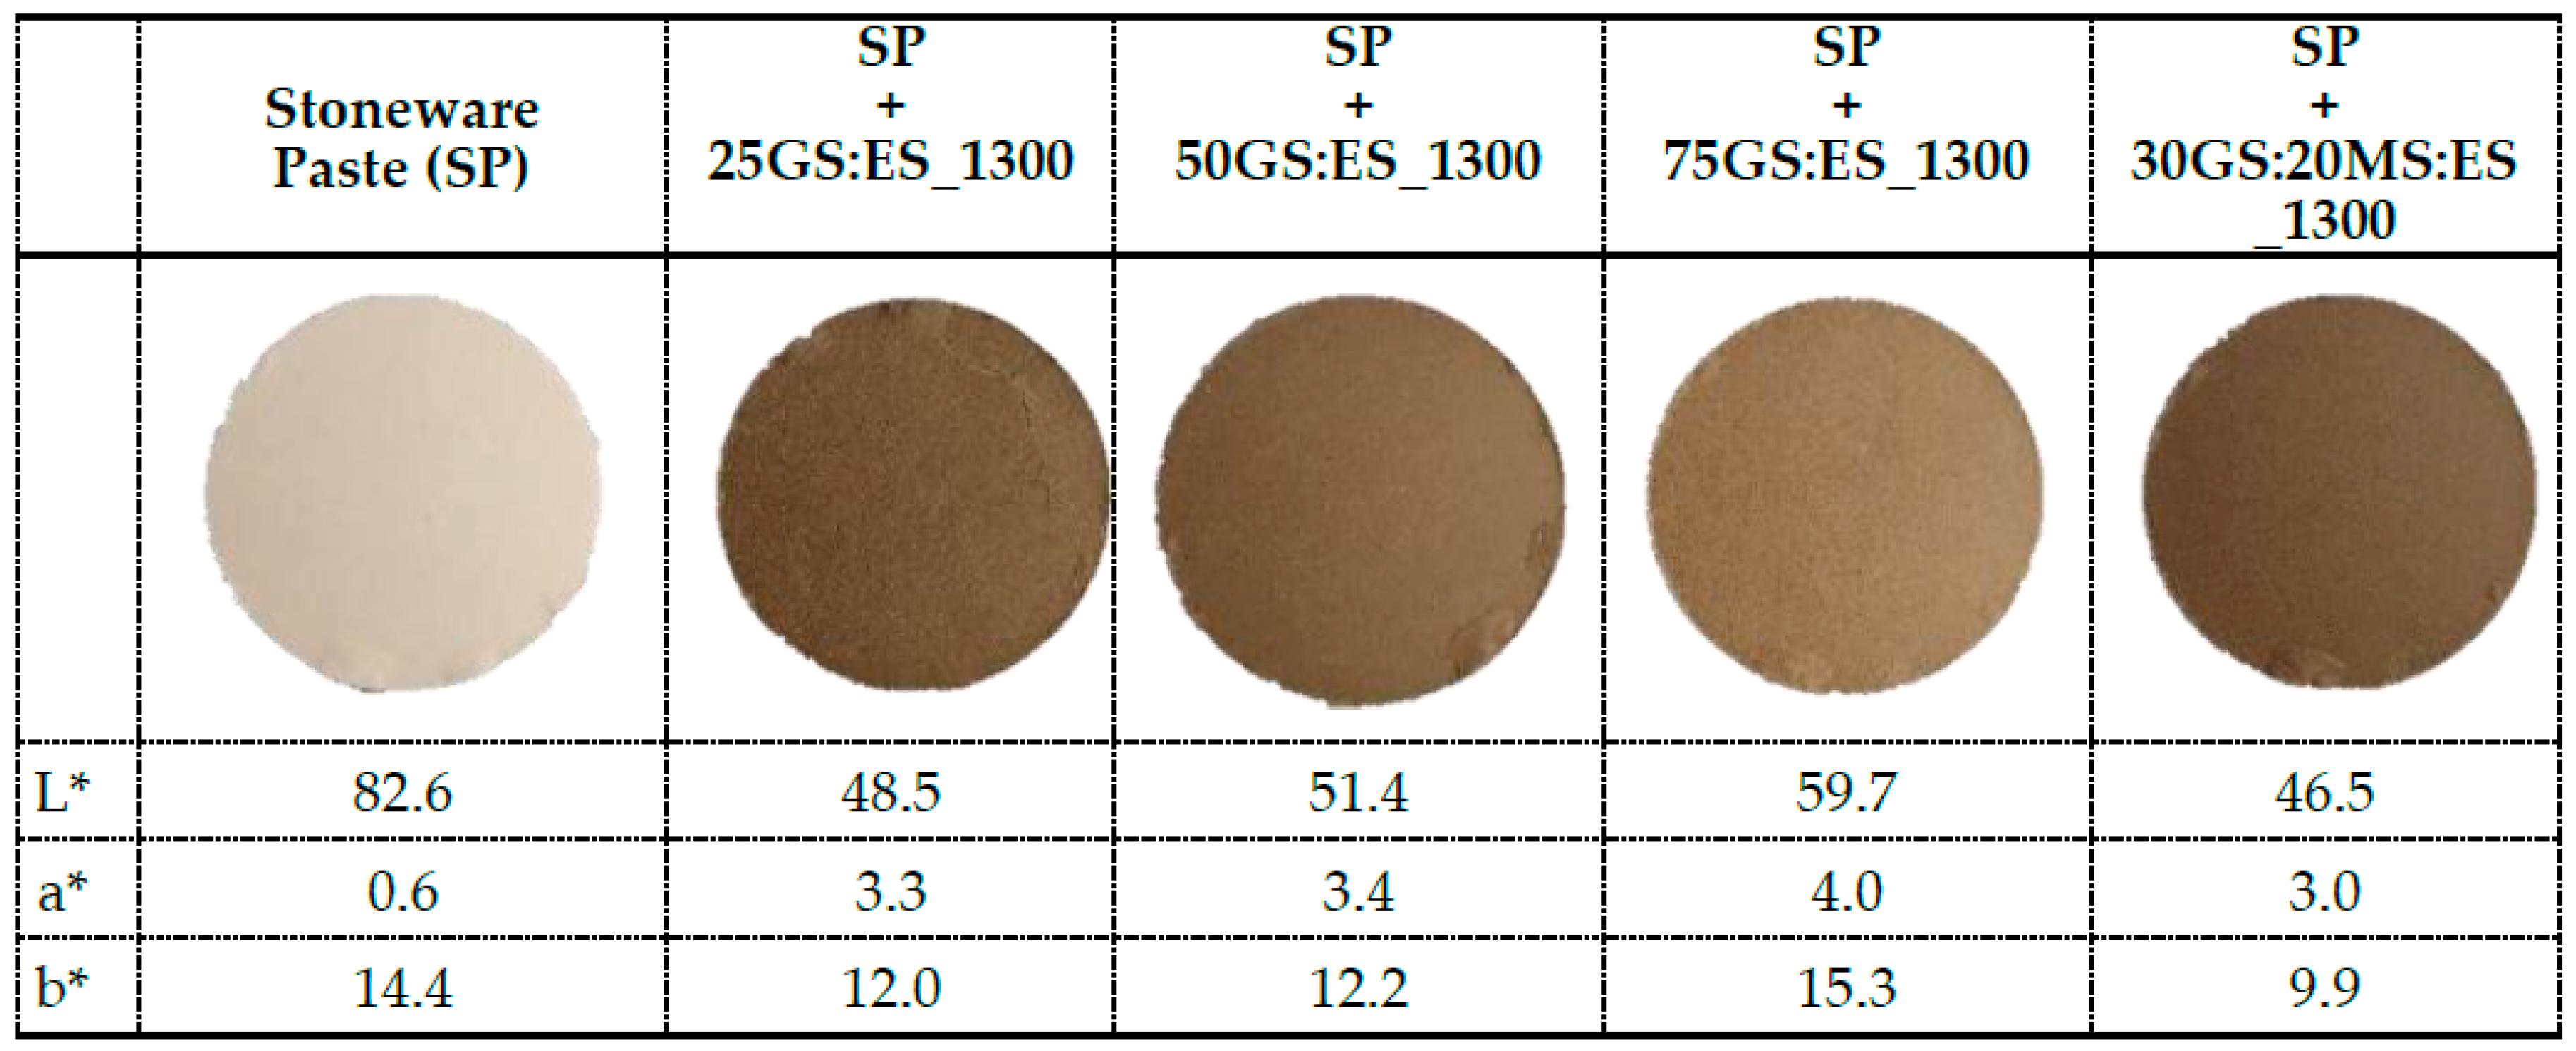
3.3. Color Development in Ceramic Bodies
4. Conclusions
Author Contributions
Funding
Acknowledgments
Conflicts of Interest
References
- Geissdoerfer, M.; Savaget, P.; Bocken, N.M.P.; Hultink, E.J. The Circular Economy—A new sustainability paradigm? J. Clean. Prod. 2017, 143, 757–768. [Google Scholar] [CrossRef]
- Monrós, G. Pigment, ceramic. In Encyclopedia of Color Science and Technology; Luo, R., Ed.; Springer: New York, NY, USA, 2014; pp. 1–15. [Google Scholar]
- Ren, G.; Wang, X.; Zhang, Z.; Zhong, B.; Yang, L.; Yang, X. Characterization and synthesis of nanometer magnetite black pigment from titanium slag by microwave-assisted reduction method. Dyes Pigm. 2017, 147, 24–30. [Google Scholar] [CrossRef]
- Fiuza, T.E.R.; Borges, J.F.M.; da Cunha, J.B.M.; Antunes, S.R.M.; de Andrade, A.V.C.; Antunes, A.C.; de Souza, E.C.F. Iron-based inorganic pigments from residue: Preparation and application in ceramic, polymer, and paint. Dyes Pigm. 2017, 148, 319–328. [Google Scholar] [CrossRef]
- Gargori, C.; Prim, S.R.; Llusar, M.; Folgueras, M.V.; Monrós, G. Recycling of Cr/Ni/Cu plating wastes as black ceramic pigments. Mater. Lett. 2018, 218, 341–345. [Google Scholar] [CrossRef]
- Un, U.T.; Onpeker, S.E.; Ozel, E. The treatment of chromium containing wastewater using electrocoagulation and the production of ceramic pigments from the resulting sludge. J. Environ. Manag. 2017, 200, 196–203. [Google Scholar]
- Carneiro, J.; Tobaldi, D.M.; Capela, M.N.; Novais, R.M.; Seabra, M.P.; Labrincha, J.A. Synthesis of ceramic pigments from industrial wastes: Red mud and electroplating sludge. Waste Manag. 2018, 80, 371–378. [Google Scholar] [CrossRef] [PubMed]
- Mitiu, M.A.; Marcus, I.; Vlad, M.; Balaceanu, C.M. Stability of Ceramic Glazes Obtained by Valorification of Anorganic Pigments Extracted from Electroplating Sludge. Rev. Chim. 2018, 69, 571–574. [Google Scholar]
- Li, Y.; Zhang, H.; Shao, L.M.; He, P.J. Preparation of a metal-phosphate/chromium oxide nanocomposite from Cr(III)-containing electroplating sludge and its optical properties as a nanopigment. Process Saf. Environ. 2015, 98, 261–267. [Google Scholar] [CrossRef]
- Chen, Z.; Du, Y.; Li, Z.; Sun, D.; Zhu, C. Synthesis of black pigments containing chromium from leather sludge. Ceram. Int. 2015, 41, 9455–9460. [Google Scholar] [CrossRef]
- Abreu, M.A.; Toffoli, S.M. Characterization of a chromium-rich tannery waste and its potential use in ceramics. Ceram Int. 2009, 35, 2225–2234. [Google Scholar] [CrossRef]
- Carneiro, J.; Tobaldi, D.M.; Hajjaji, W.; Capela, M.N.; Novais, R.M.; Seabra, M.P.; Labrincha, J.A. Red mud as a substitute coloring agent for the hematite pigment. Ceram Int. 2018, 44, 4211–4219. [Google Scholar] [CrossRef]
- Wang, Z.; Chen, H.; Xu, L.; Xu, S.Q.; Gao, C.F.; Oliphant, A.J.; Liu, J.; Lu, Y.; Wang, W.; Sun, L. Synthesis and colour prediction of stable pigments from rice husk biomass. Green Mater. 2015, 3, 10–14. [Google Scholar] [CrossRef]
- Rietveld, H.M. A profile refinement method for nuclear and magnetic structures. J. Appl. Crystallogr. 1969, 2, 65–71. [Google Scholar] [CrossRef]
- Toby, B. EXPGUI, a graphical user interface for GSAS. J. Appl. Crystallogr. 2001, 34, 210–213. [Google Scholar] [CrossRef]
- CIE. Recommendations on Uniform Colour Spaces, Colour Difference Equations, Psychometrics Colour Terms; Supplement no 2 of CIE Publ No 15. Bureau Central de la CIE; CIE Publications: Paris, France, 1978. [Google Scholar]
- Schanda, J. Colorimetry: Understanding the CIE; Wiley: Hoboken, NJ, USA, 2007. [Google Scholar]
- Matteucci, F.; Cruciani, G.; Dondi, M.; Gasparotto, G.; Tobaldi, D.M. Crystal structure, optical properties and colouring performance of karrooite MgTi2O5 ceramic pigments. J. Solid State Chem. 2007, 180, 3196–3210. [Google Scholar] [CrossRef]
- Zhang, Y.; Xu, Q.; Sun, M. Crystal Structure and Optical Properties of CoCr2O4–NiCr2O4 Solid Solutions Prepared by Low-Temperature Combustion Synthesis Method. Adv. Mat. Res. 2013, 616–618, 1877–1881. [Google Scholar]
- Burns, R.G. Mineralogical Applications of Crystal Field Theory; Cambridge University Press: Cambridge, UK, 1993. [Google Scholar]


| Sample ID | Compositions (wt.%) | Max. Processing Temperature (°C) |
|---|---|---|
| GS:ES | ||
| 25GS:ES_1300 | 25:75 | 1300 |
| 50GS:ES_1100 | 50:50 | 1100 |
| 50GS:ES_1200 | 1200 | |
| 50GS:ES_1300 | 1300 | |
| 75GS:ES_1300 | 75:25 | 1300 |
| MS:GS:ES | ||
| 30MS:20GS:ES_1100 | 30:20:50 | 1100 |
| 30MS:20GS:ES_1200 | 1200 | |
| 30MS:20GS:ES_1300 | 1300 |
| Component (wt.%) | GS | MS | ES |
|---|---|---|---|
| Na2O | 3.10 | 0.03 | - |
| MgO | 0.65 | 0.34 | 0.16 |
| Al2O3 | 17.94 | 0.19 | 1.66 |
| SiO2 | 64.12 | 0.34 | 5.63 |
| P2O5 | 0.76 | 0.02 | 4.45 |
| SO3 | 0.36 | 0.21 | 5.84 |
| K2O | 6.10 | 0.02 | 0.07 |
| CaO | 1.12 | 56.56 | 1.09 |
| Fe2O3 | 3.38 | 0.07 | 0.65 |
| Cr | – | – | 15.29 |
| Ni | – | – | 25.86 |
| Cu | – | – | 2.23 |
| Zn | 0.01 | – | 1.58 |
| LOl | 1.50 | 41.95 | 34.30 |
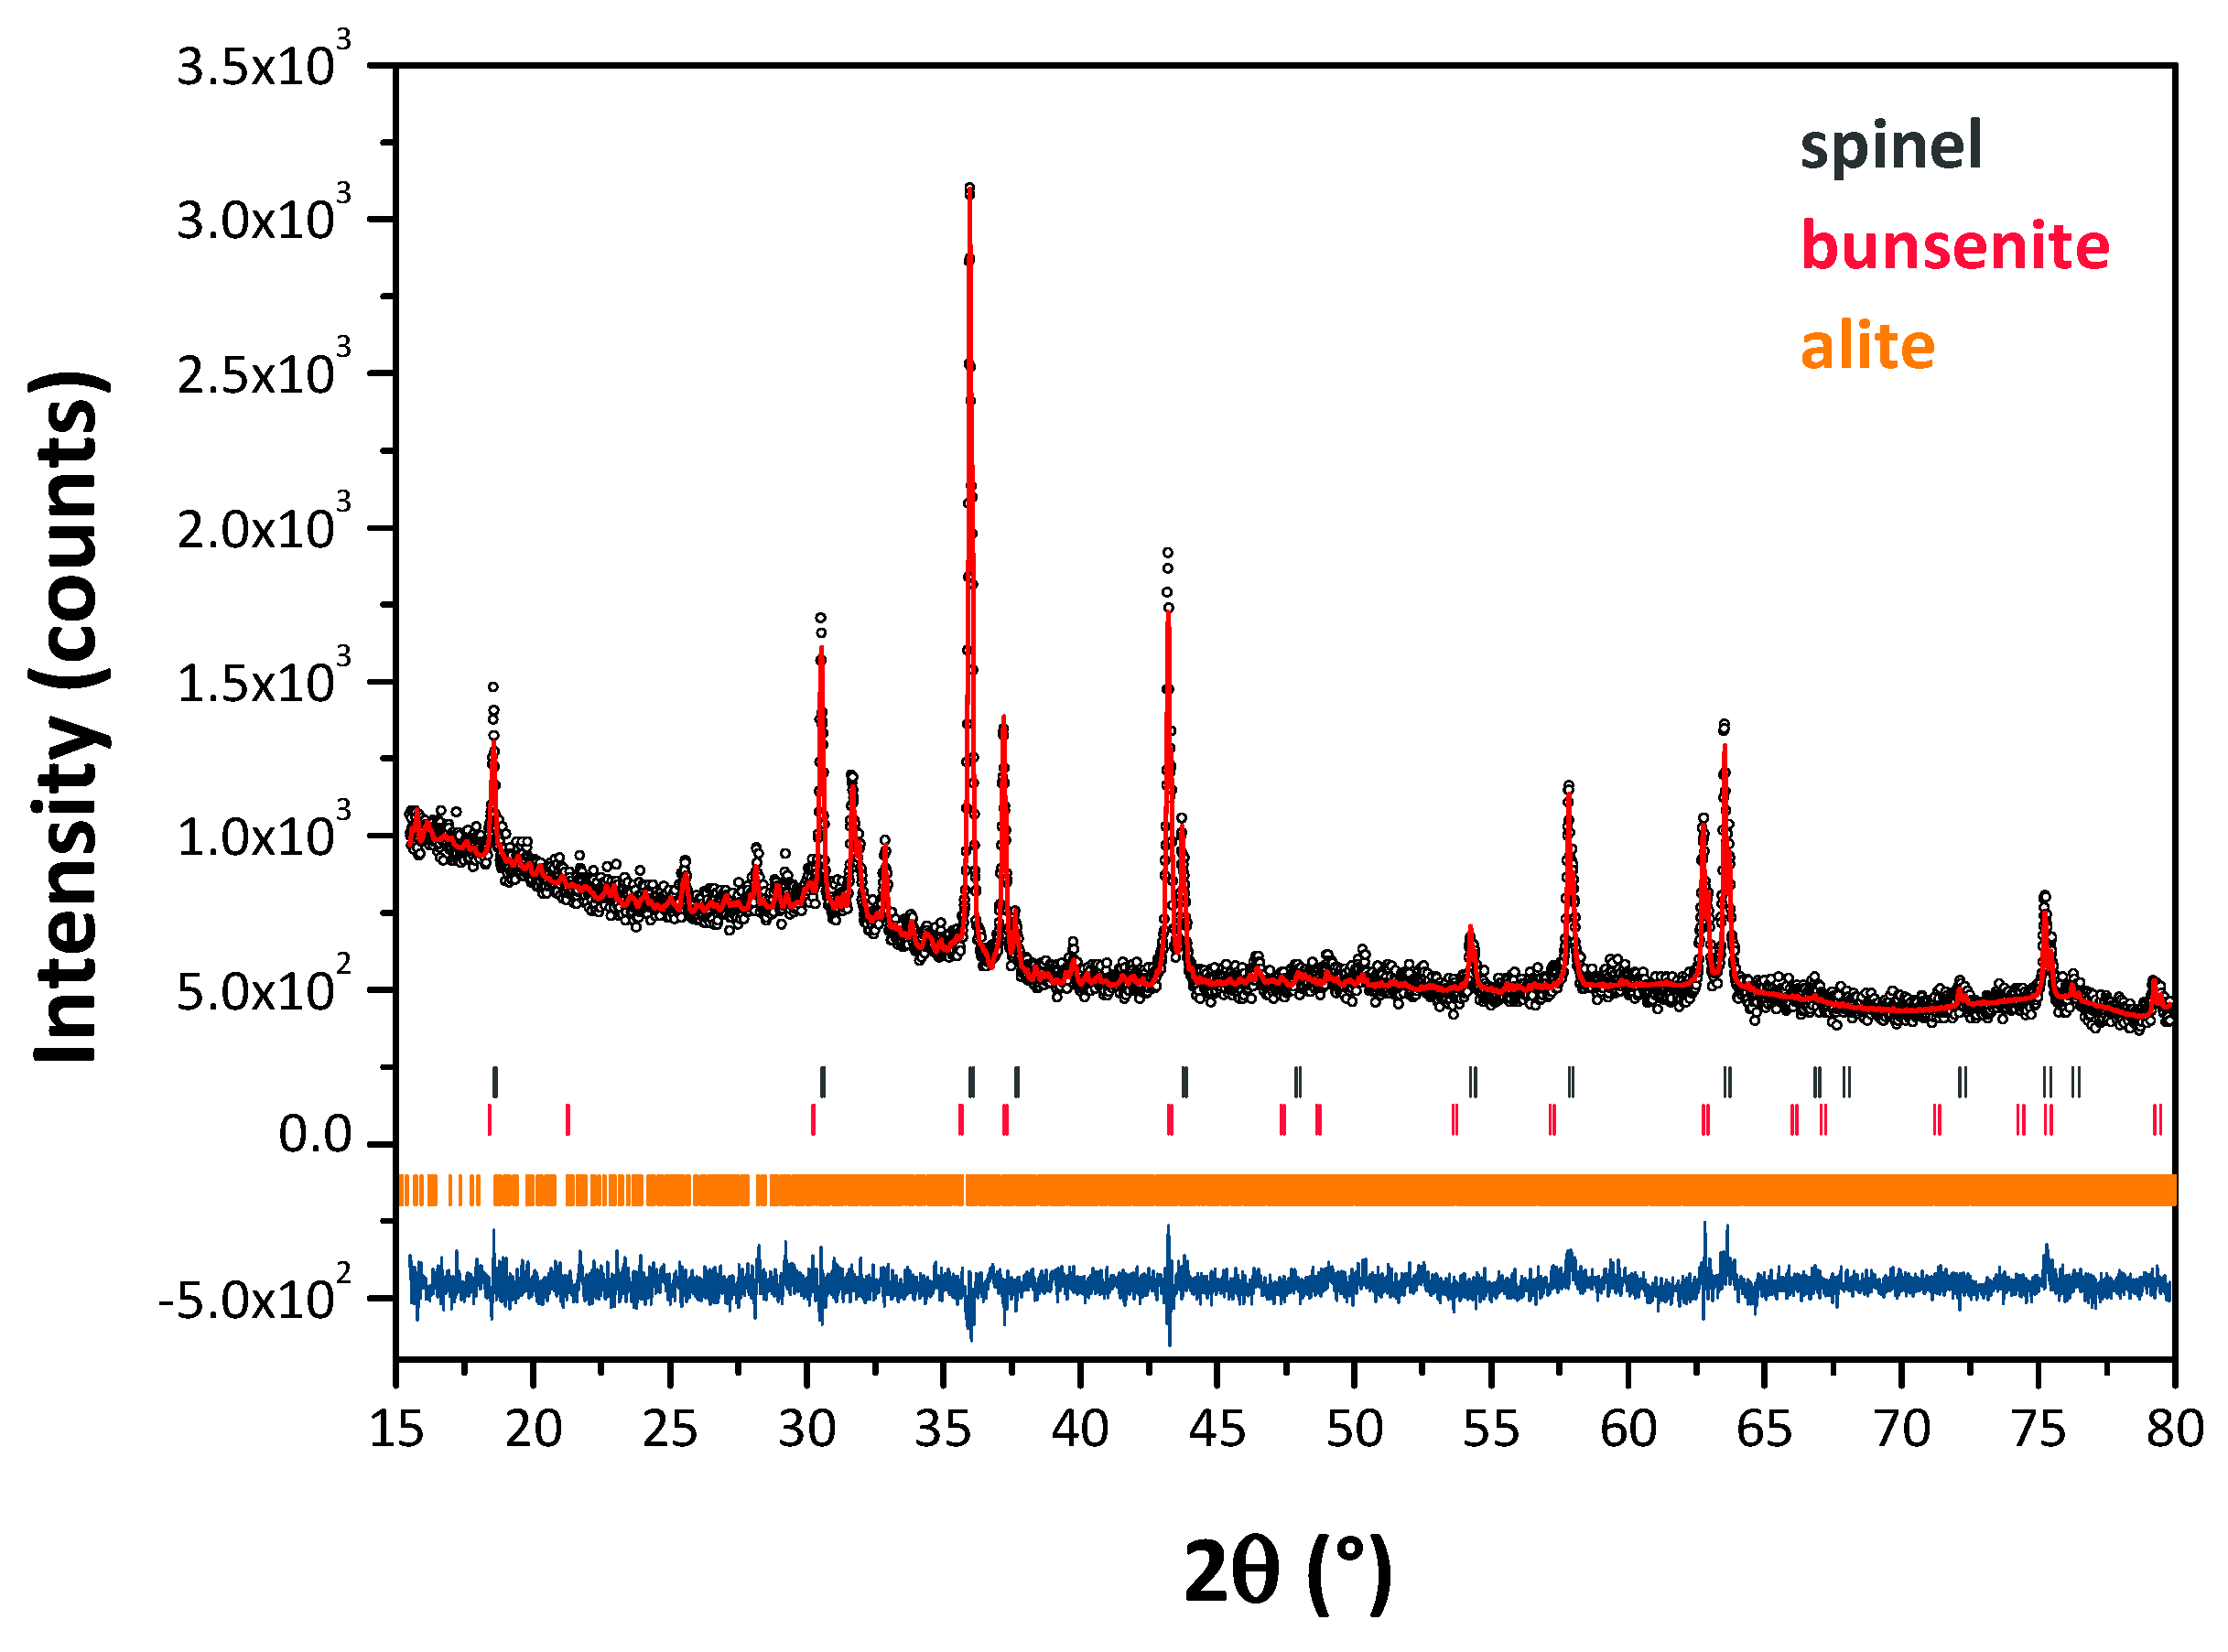
| Sample ID | Phase Composition (wt.%)* | |||
|---|---|---|---|---|
| Spinel | NiO | Ca3SiO5 | α-Fe2O3 | |
| 50GS:ES_1300 | 68.7 ± 0.1 | 31.3 ± 0.2 | – | – |
| 30MS:20GS:ES_1300 | 35.3 ± 0.2 | 18.0 ± 0.2 | 46.7±0.5 | – |
| 75GS:ES_1300 | 62.7 ± 0.1 | 34.4 ± 0.2 | – | 2.9±0.2 |
| 25GS:ES_1300 | 93.7 ± 0.1 | 6.3 ± 0.5 | – | – |
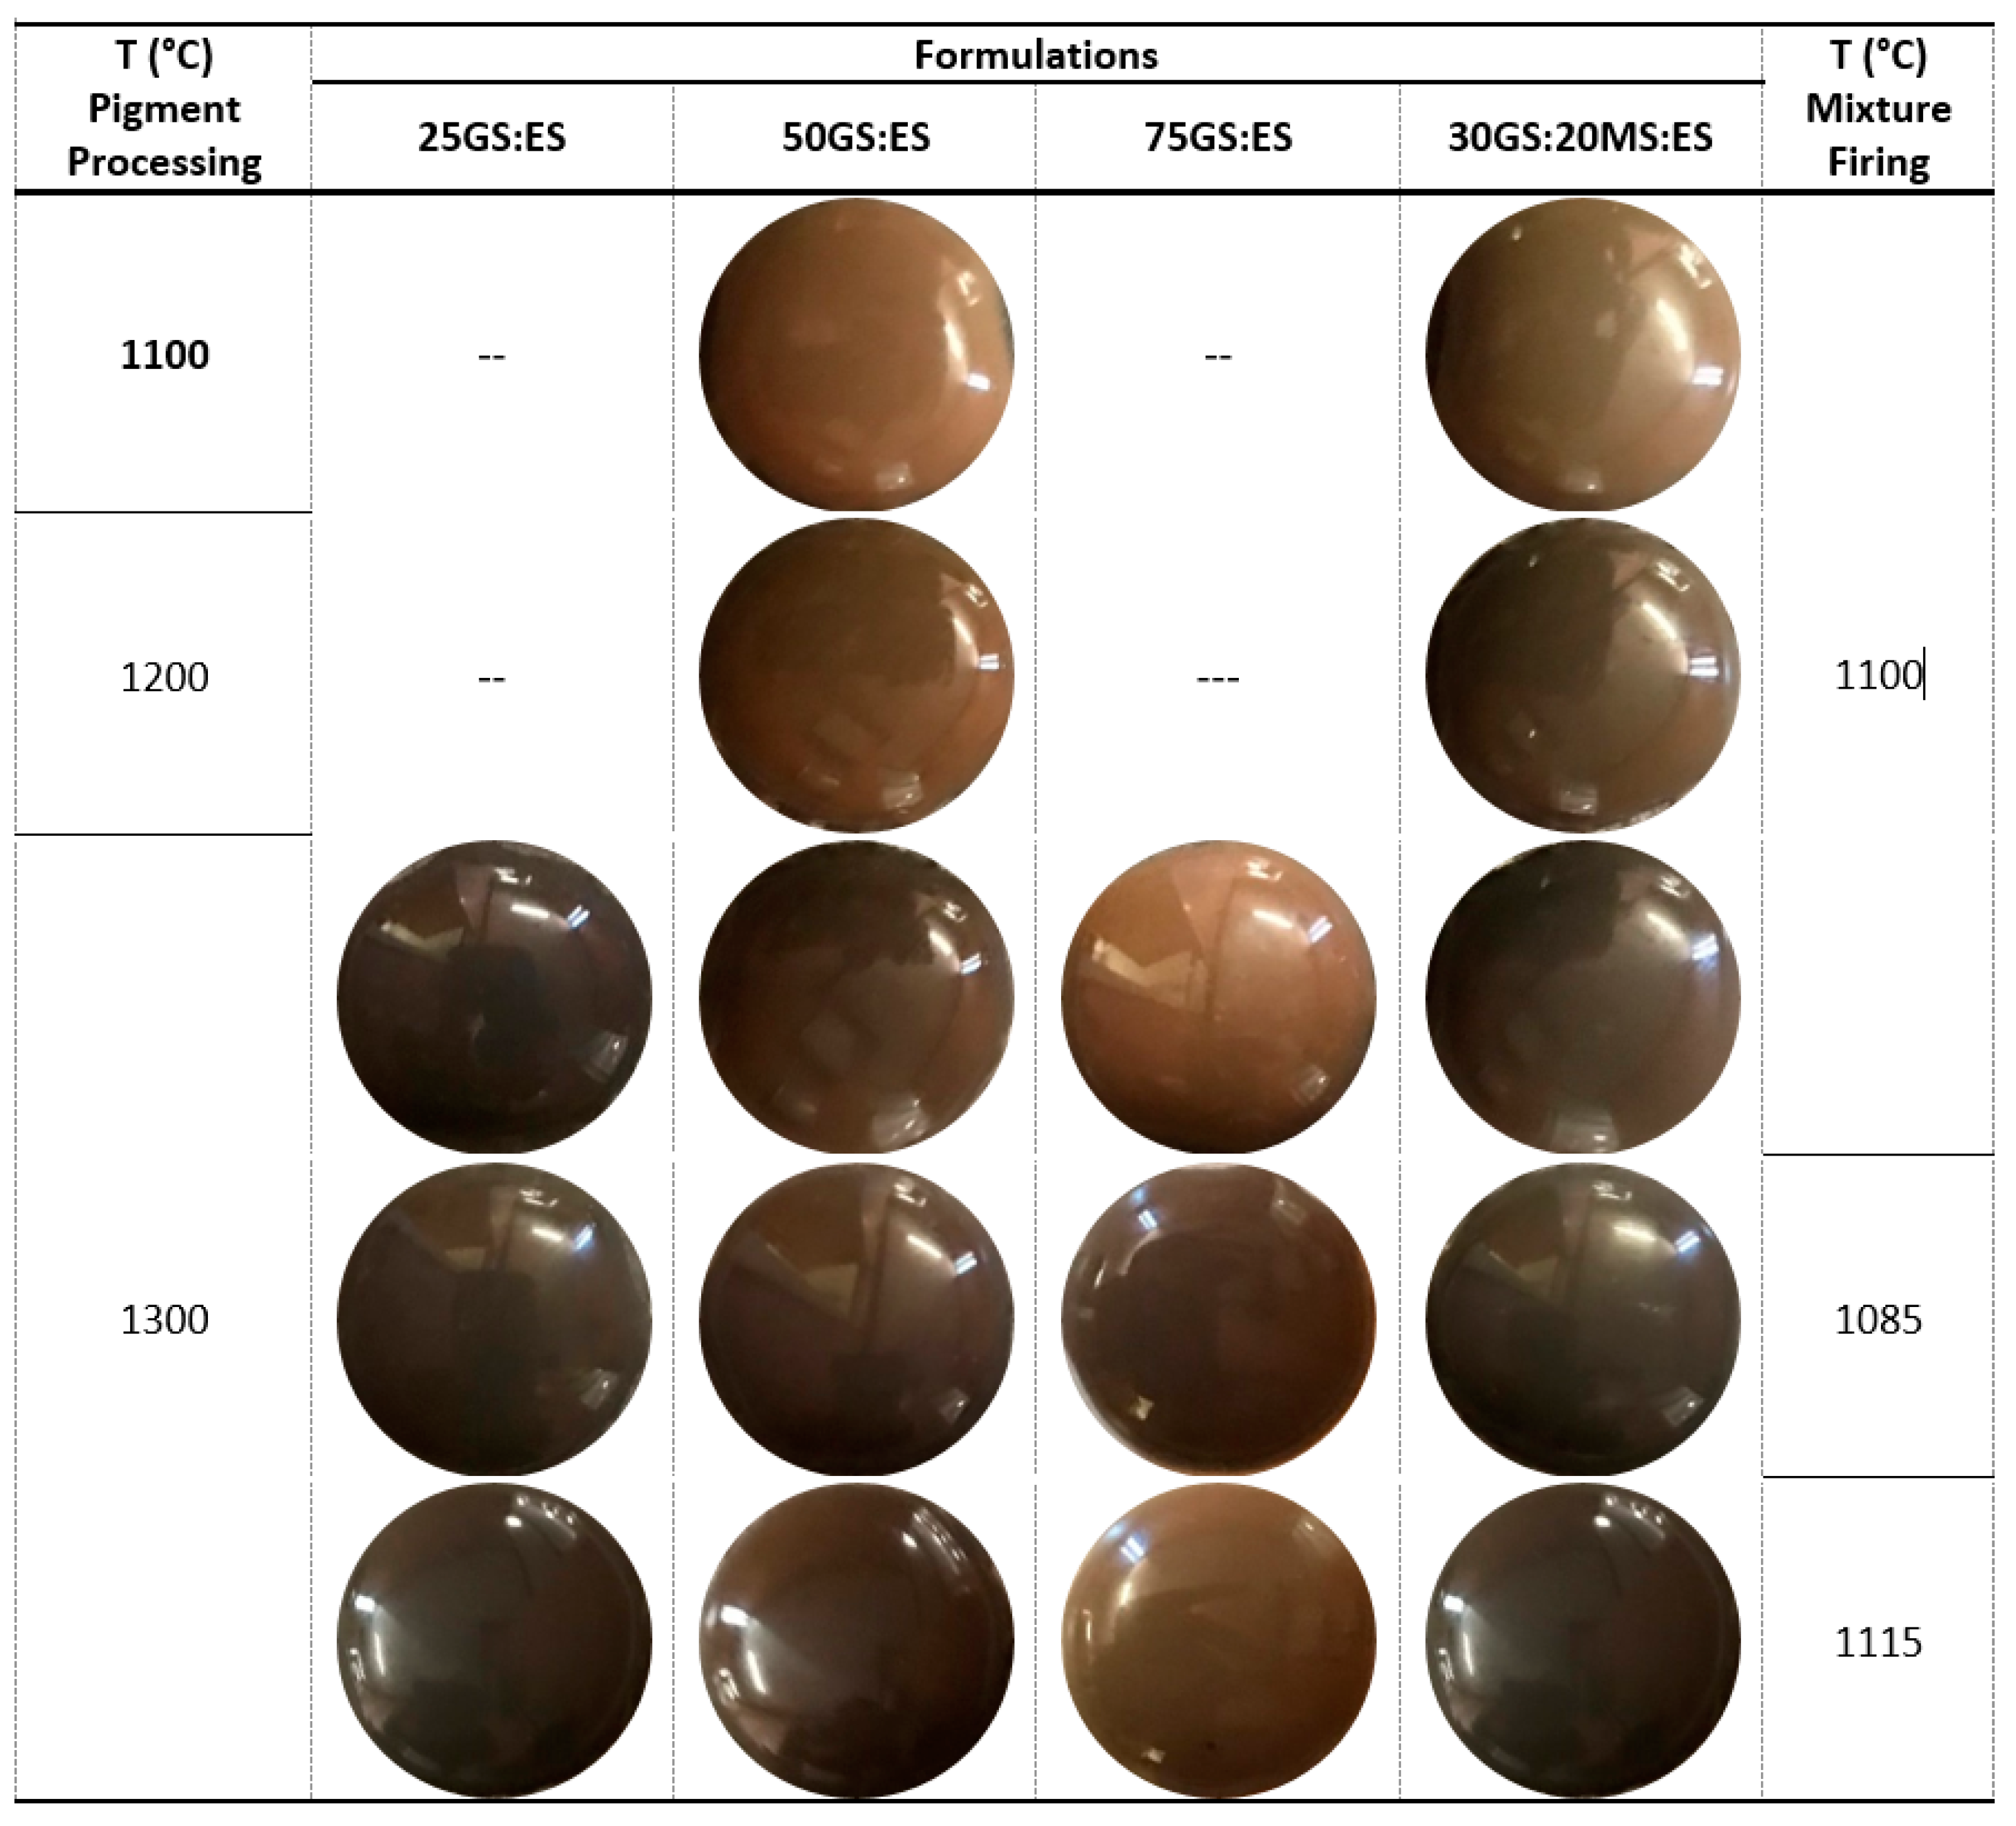
| Pigment ID | Firing Temperature(°C) | L* 0 (Black) to 100 (White) | a* (+Red, −Green) | b* (+Yellow, −Blue) | ∆E |
|---|---|---|---|---|---|
| 25GS:ES_1300 | 1085 | 44.2 | 4.0 | 12.0 | 1.1 |
| 1100 | 45.0 | 3.9 | 12.7 | -- | |
| 1115 | 45.3 | 4.0 | 13.6 | 1.0 | |
| 50GS:ES_1100 | 1100 | 47.2 | 3.7 | 14.3 | -- |
| 50GS:ES_1200 | 41.0 | 3.5 | 11.0 | -- | |
| 50GS:ES_1300 | 1085 | 36.4 | 2.1 | 4.5 | 1.0 |
| 1100 | 36.8 | 2.3 | 5.5 | -- | |
| 1115 | 35.8 | 2.4 | 3.4 | 0.8 | |
| 75GS:ES_1300 | 1085 | 36.7 | 1.0 | 4.3 | 1.4 |
| 1100 | 35.6 | 1.2 | 3.4 | -- | |
| 1115 | 35.2 | 1.5 | 1.8 | 1.7 | |
| 30MS:20GS:ES_1100 | 1100 | 45.7 | 1.3 | 11.1 | -- |
| 30MS:20GS:ES_1200 | 39.0 | 0.9 | 6.6 | -- | |
| 30MS:20GS:ES_1300 | 1085 | 38.2 | 0.4 | 3.3 | 0.8 |
| 1100 | 37.3 | 0.5 | 3.2 | -- | |
| 1115 | 36.6 | 0.7 | 2.6 | 1.0 |
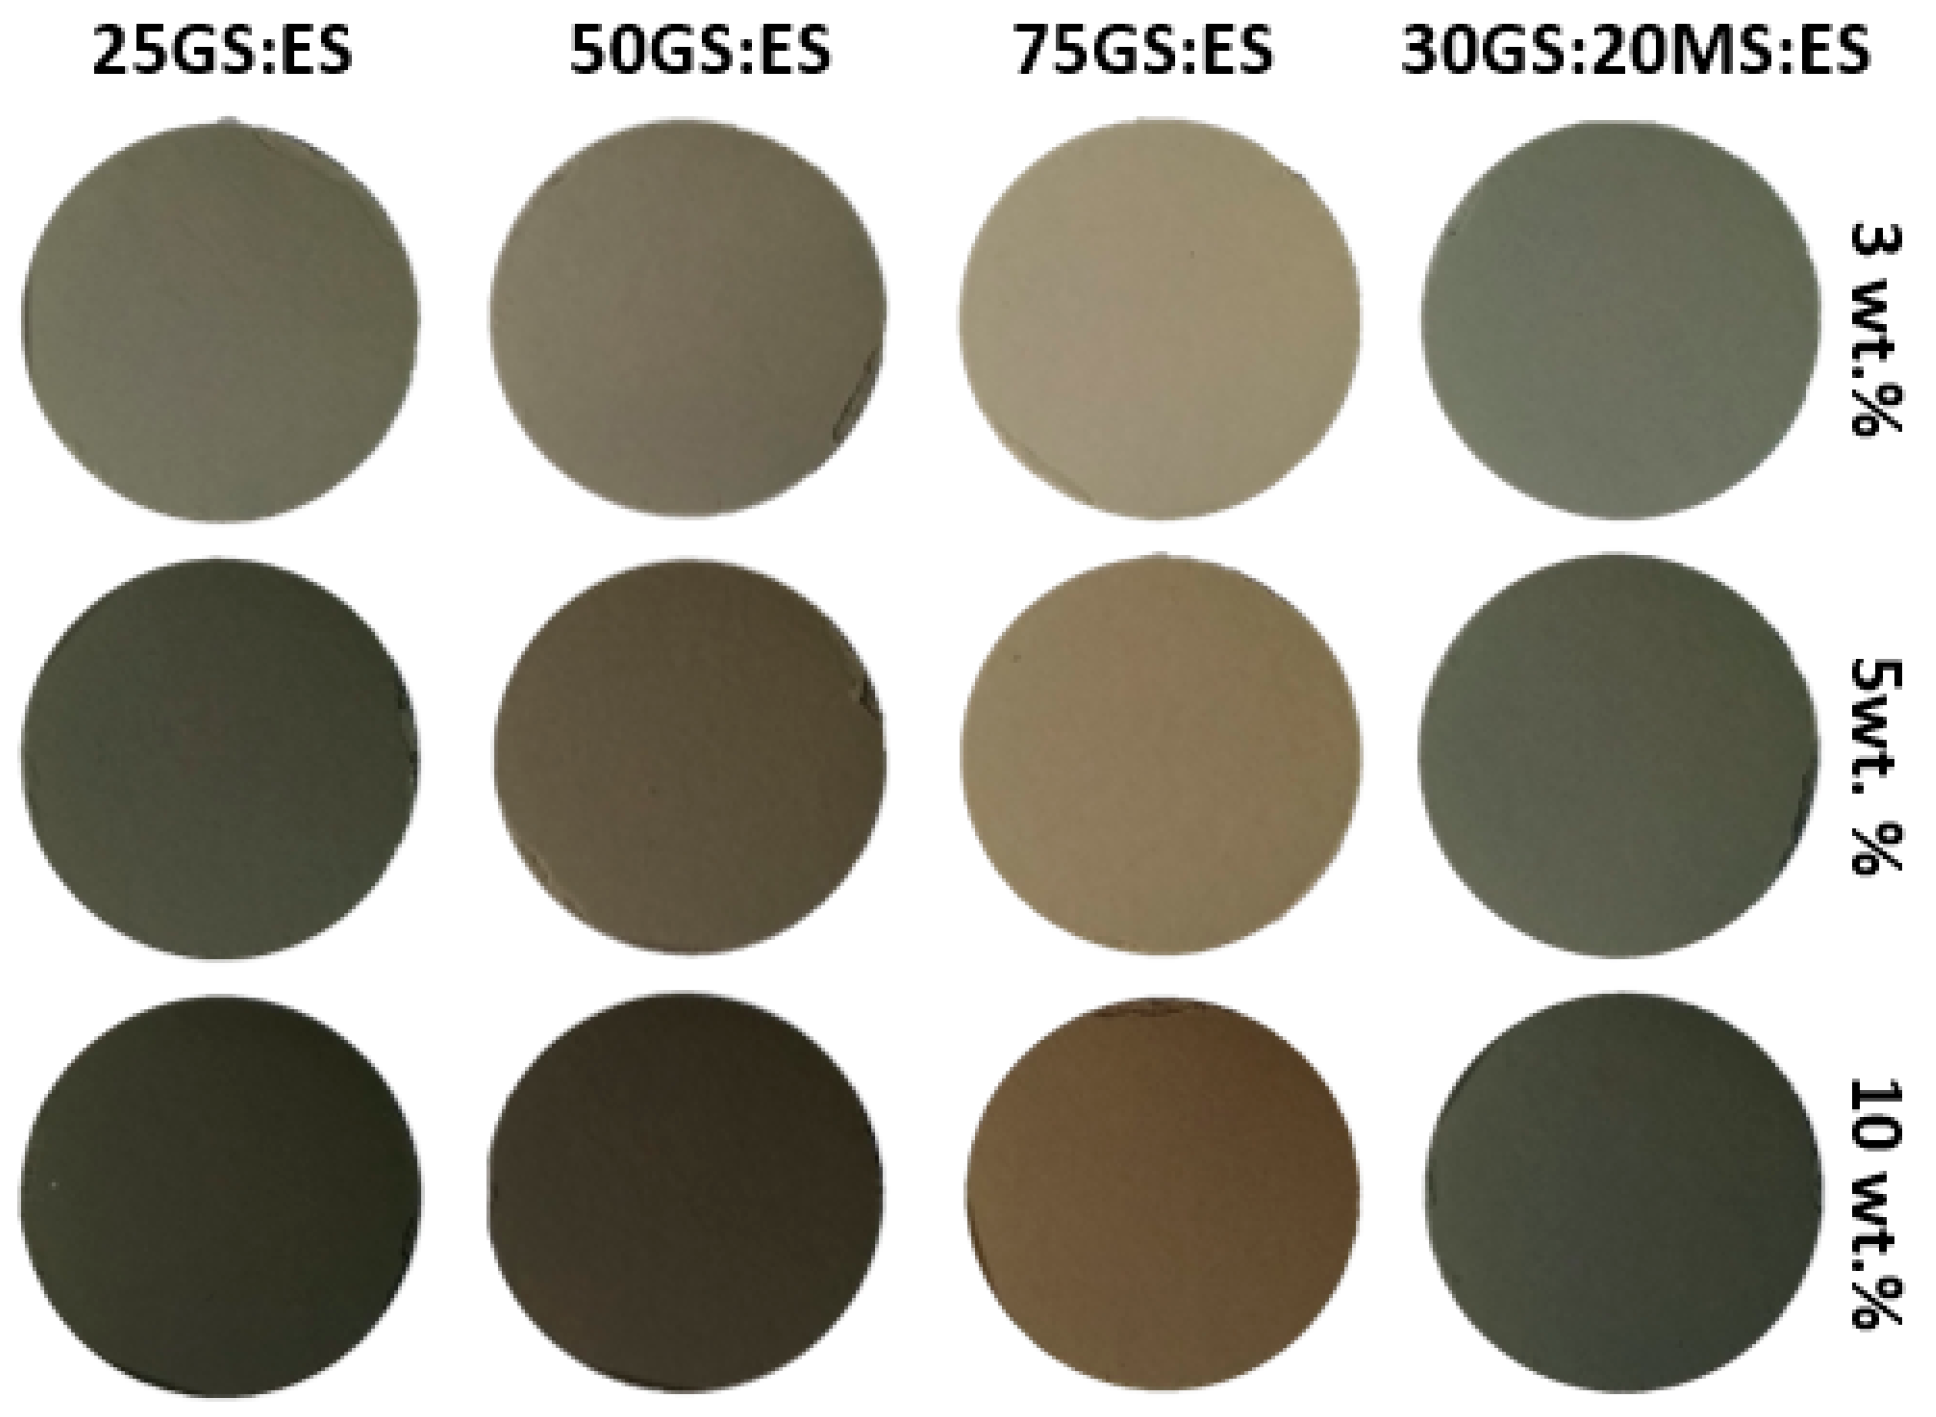
| Pigment ID | Pigment Content (wt.%) | L* 0 (Black) to 100 (White) | a* (+Red, −Green) | b* (+Yellow, −Blue) |
|---|---|---|---|---|
| 25GS:ES_1300 | 3 | 68.4 | 0.5 | 10.3 |
| 5 | 60.9 | 1.4 | 10.8 | |
| 10 | 49.9 | 2.5 | 10.6 | |
| 50GS:ES_1300 | 3 | 58.5 | 0.4 | 7.5 |
| 5 | 51.3 | 0.6 | 6.9 | |
| 10 | 41.9 | 0.8 | 5.9 | |
| 75GS:ES_1300 | 3 | 55.4 | −1.4 | 6.6 |
| 5 | 47.9 | −1.2 | 5.8 | |
| 10 | 39.2 | −0.9 | 4.5 | |
| 30MS:20GS:ES_1300 | 3 | 59.3 | −1.9 | 5.4 |
| 5 | 51.3 | −1.8 | 5.1 | |
| 10 | 41.9 | −1.6 | 4.1 |
© 2019 by the authors. Licensee MDPI, Basel, Switzerland. This article is an open access article distributed under the terms and conditions of the Creative Commons Attribution (CC BY) license (http://creativecommons.org/licenses/by/4.0/).
Share and Cite
Carneiro, J.; Tobaldi, D.M.; Capela, M.N.; Seabra, M.P.; Labrincha, J.A. Waste-Based Pigments for Application in Ceramic Glazes and Stoneware Bodies. Materials 2019, 12, 3396. https://doi.org/10.3390/ma12203396
Carneiro J, Tobaldi DM, Capela MN, Seabra MP, Labrincha JA. Waste-Based Pigments for Application in Ceramic Glazes and Stoneware Bodies. Materials. 2019; 12(20):3396. https://doi.org/10.3390/ma12203396
Chicago/Turabian StyleCarneiro, Jorge, David Maria Tobaldi, Marinélia Neto Capela, Maria Paula Seabra, and João António Labrincha. 2019. "Waste-Based Pigments for Application in Ceramic Glazes and Stoneware Bodies" Materials 12, no. 20: 3396. https://doi.org/10.3390/ma12203396
APA StyleCarneiro, J., Tobaldi, D. M., Capela, M. N., Seabra, M. P., & Labrincha, J. A. (2019). Waste-Based Pigments for Application in Ceramic Glazes and Stoneware Bodies. Materials, 12(20), 3396. https://doi.org/10.3390/ma12203396