Article

Mechanism Understanding of the Role of Rare Earth Inclusions in the Initial Marine Corrosion Process of Microalloyed Steels

1
The State Key Laboratory of Refractories and Metallurgy, Hubei Province Key Laboratory of Systems Science in Metallurgical Process, Wuhan University of Science and Technology, Wuhan 430081, China
2
Shanghai Aerospace Equipment Manufacturer, Shanghai 200245, China
*
Authors to whom correspondence should be addressed.
Materials 2019, 12(20), 3359; https://doi.org/10.3390/ma12203359
Submission received: 25 September 2019 / Revised: 12 October 2019 / Accepted: 13 October 2019 / Published: 15 October 2019

Abstract

:
In this study, the corrosion behavior of rare earth (RE) microalloyed steels was first evaluated through potentiodynamic polarization tests and corrosion weight loss experiments, and then the corrosion morphologies were observed by scanning electron microscope (SEM). After immersion in a NaCl solution, the sulfides (or oxygen sulfides) dissolved preferentially, followed by corrosion at the boundary between the Fe matrix and oxides. Afterwards, the inclusions fell off as a whole, which promoted pitting nucleation. The first principle modeling demonstrated that the work functions of various kinds of inclusions descended in the following order: La2Zr2O7 > LaAlO3 > (La2O3 ≈ Fe ≈ La2O2S) > La2S3, which provided a theoretical explanation to the dissolution behaviors of inclusions. That is, inclusions containing sulfur tend to dissolve preferentially, whereas the oxides do not dissolve easily. Subsequently, the surface current distributions were detected by the scanning vibrating electrode technique (SVET), which provided more microscopic insight into the role of inclusions in the corrosion propagation. Results showed that the active sites of pitting nucleation accelerated the transverse propagation of corrosion. Finally, local corrosion spread to the whole surface as uniform corrosion.

1. Introduction

Corrosion in steels normally originates from local corrosion, and then propagates to the whole surface. The heterogeneous microstructural features, such as grain boundaries, second phases, dislocations, and inclusions, particularly sulfide inclusions, are the origin of local corrosion [1,2,3,4,5,6,7,8,9,10,11,12,13]. Therefore, many researchers have conducted research to elucidate the effects of inclusions on local corrosion to minimize their negative impacts [3,4,5,6,7,8,9,10,11,12,13].
For the past few years, research on rare earth (RE) microalloyed steel has attracted much attention [14,15,16]. First of all, the doping of RE elements can improve the comprehensive mechanical properties of microalloyed steels due to their effects on the purification of steel liquid, improvement of phase transformation, and modification of second phases, which has been investigated extensively [16,17,18,19,20,21,22,23,24,25,26]. Secondly, the addition of RE elements has an effect on corrosion properties of microalloyed steels by promoting the formation of passive corrosion product films [22,27,28,29], and modifying inclusions [25,30]. However, only a few studies have investigated the effect of RE microalloying on the corrosion behavior. RE elements, acting as microalloyed elements, can modify the type and property of inclusions due to their great affinity for oxygen and sulfur [8,30,31,32,33,34,35]. It has been reported that, with the doping of RE elements, the main types of inclusions change into RE sulfides, RE oxides, and RE oxygen sulfides [14,24,34,35,36,37,38]. Moreover, the sizes of RE-doped inclusions are much smaller than those of normal inclusions [23,24,35], and inclusions change from irregular shapes to spherical or spheroid [35,39,40]. However, these studies provided only superficial descriptions and lacked in-depth analyses. Relatively few researches have elaborately studied the effects of RE-doped inclusions on the corrosion behavior of steels [35,36,37,41].
Ha et al. [36] engaged in the study of the corrosion behavior of 25% Cr duplex stainless steel after the doping of RE elements. According to the statistical results, pitting originated at the matrix (Cr, Mn, RE)–oxides interface, and the quantity rather than the size of inclusions had a great effect on the corrosion resistance of this stainless steel. Jeon et al. [35] also reported that the pitting nucleation originated at the boundary between the matrix and RE oxides, and the micro crevices around inclusions spread into the matrix with no change in the RE oxides. However, the behavior was not the same for microalloyed steel compared with stainless steels. Liu et al. [37] recently revealed that the pitting corrosion of RE microalloyed steel was originated from the (RE)2O2S-(RE)xSy inclusion for its lower potential relative to the matrix. However, the conclusions about the corrosion behaviors of the inclusions are not comprehensive from a statistical viewpoint. Moreover, the effect of RE-doped inclusions on the entire corrosion process, from pitting initiation to propagation, has not been clearly illuminated. Hence, it is worth investigating the effect of RE inclusions on the corrosion process of RE microalloyed steels.
Therefore, in this present work, the role of RE inclusions in the initial corrosion process of microalloyed steels was investigated elaborately. By using first principle modeling and the scanning vibrating electrode technique (SVET), a more in-depth mechanism understanding about the role of RE inclusions in the corrosion process was established theoretically and experimentally. Furthermore, the corrosion resistance of microalloyed steels with different deoxidized methods was comparatively studied.

2. Experimental Procedure

2.1. Materials Preparation

RE microalloyed steels employed in this study were smelted in a 50 kg vacuum induction furnace (KZG-50, Henan Cooler Instrument Technology Limited Company, Zhengzhou, China) by adding the alloys (Wuhan Iron and Steel Group Corporation, Wuhan, China) to the metal stream during tapping [42], and subsequently hot rolled to a thickness of 20 mm, followed by room temperature cooling. In the smelting process, different deoxidization methods (i.e., Al deoxidization and Ti/Zr deoxidization) were adopted for comparative study, and mischmetal (La and Ce) was added as microalloyed elements. The chemical compositions of the steels were analyzed by an inductive coupled plasma-mass spectrometer (ICP-MS, Thermo X Series II, Thermo Fisher Scientific, Waltham, Mass, America), and results are shown in Table 1.
The steel plates were cut into coupons of 20 × 20 × 5 mm3 along the rolling direction to meet the test requirements. For electrochemical tests, the specimens were embedded in epoxy resin (E-44, Solid Adhesive Electronic Technology Limited Company, Shenzhen, China) leaving an area of 4 cm2 as a working electrode surface, while the other end of the specimens was connected to copper wire for electrical connection. Afterwards, specimens were gradually wet ground to a 2000 grit finish by abrasive paper. Furthermore, the specimens were polished to a 0.5 µm finish for SEM (Evo, MA10, Zeiss, Germany) observations and SVET (Versascan, Ametek Limited Company, Polly, Pennsylvania, America) measurements. Finally, all the specimens were degreased with acetone (Sinopharm Chemical Reagent Limited Company, Ningbo, China), rinsed with deionized water, and dried by a compressed hot air flow.

2.2. Corrosion Rate Measurements

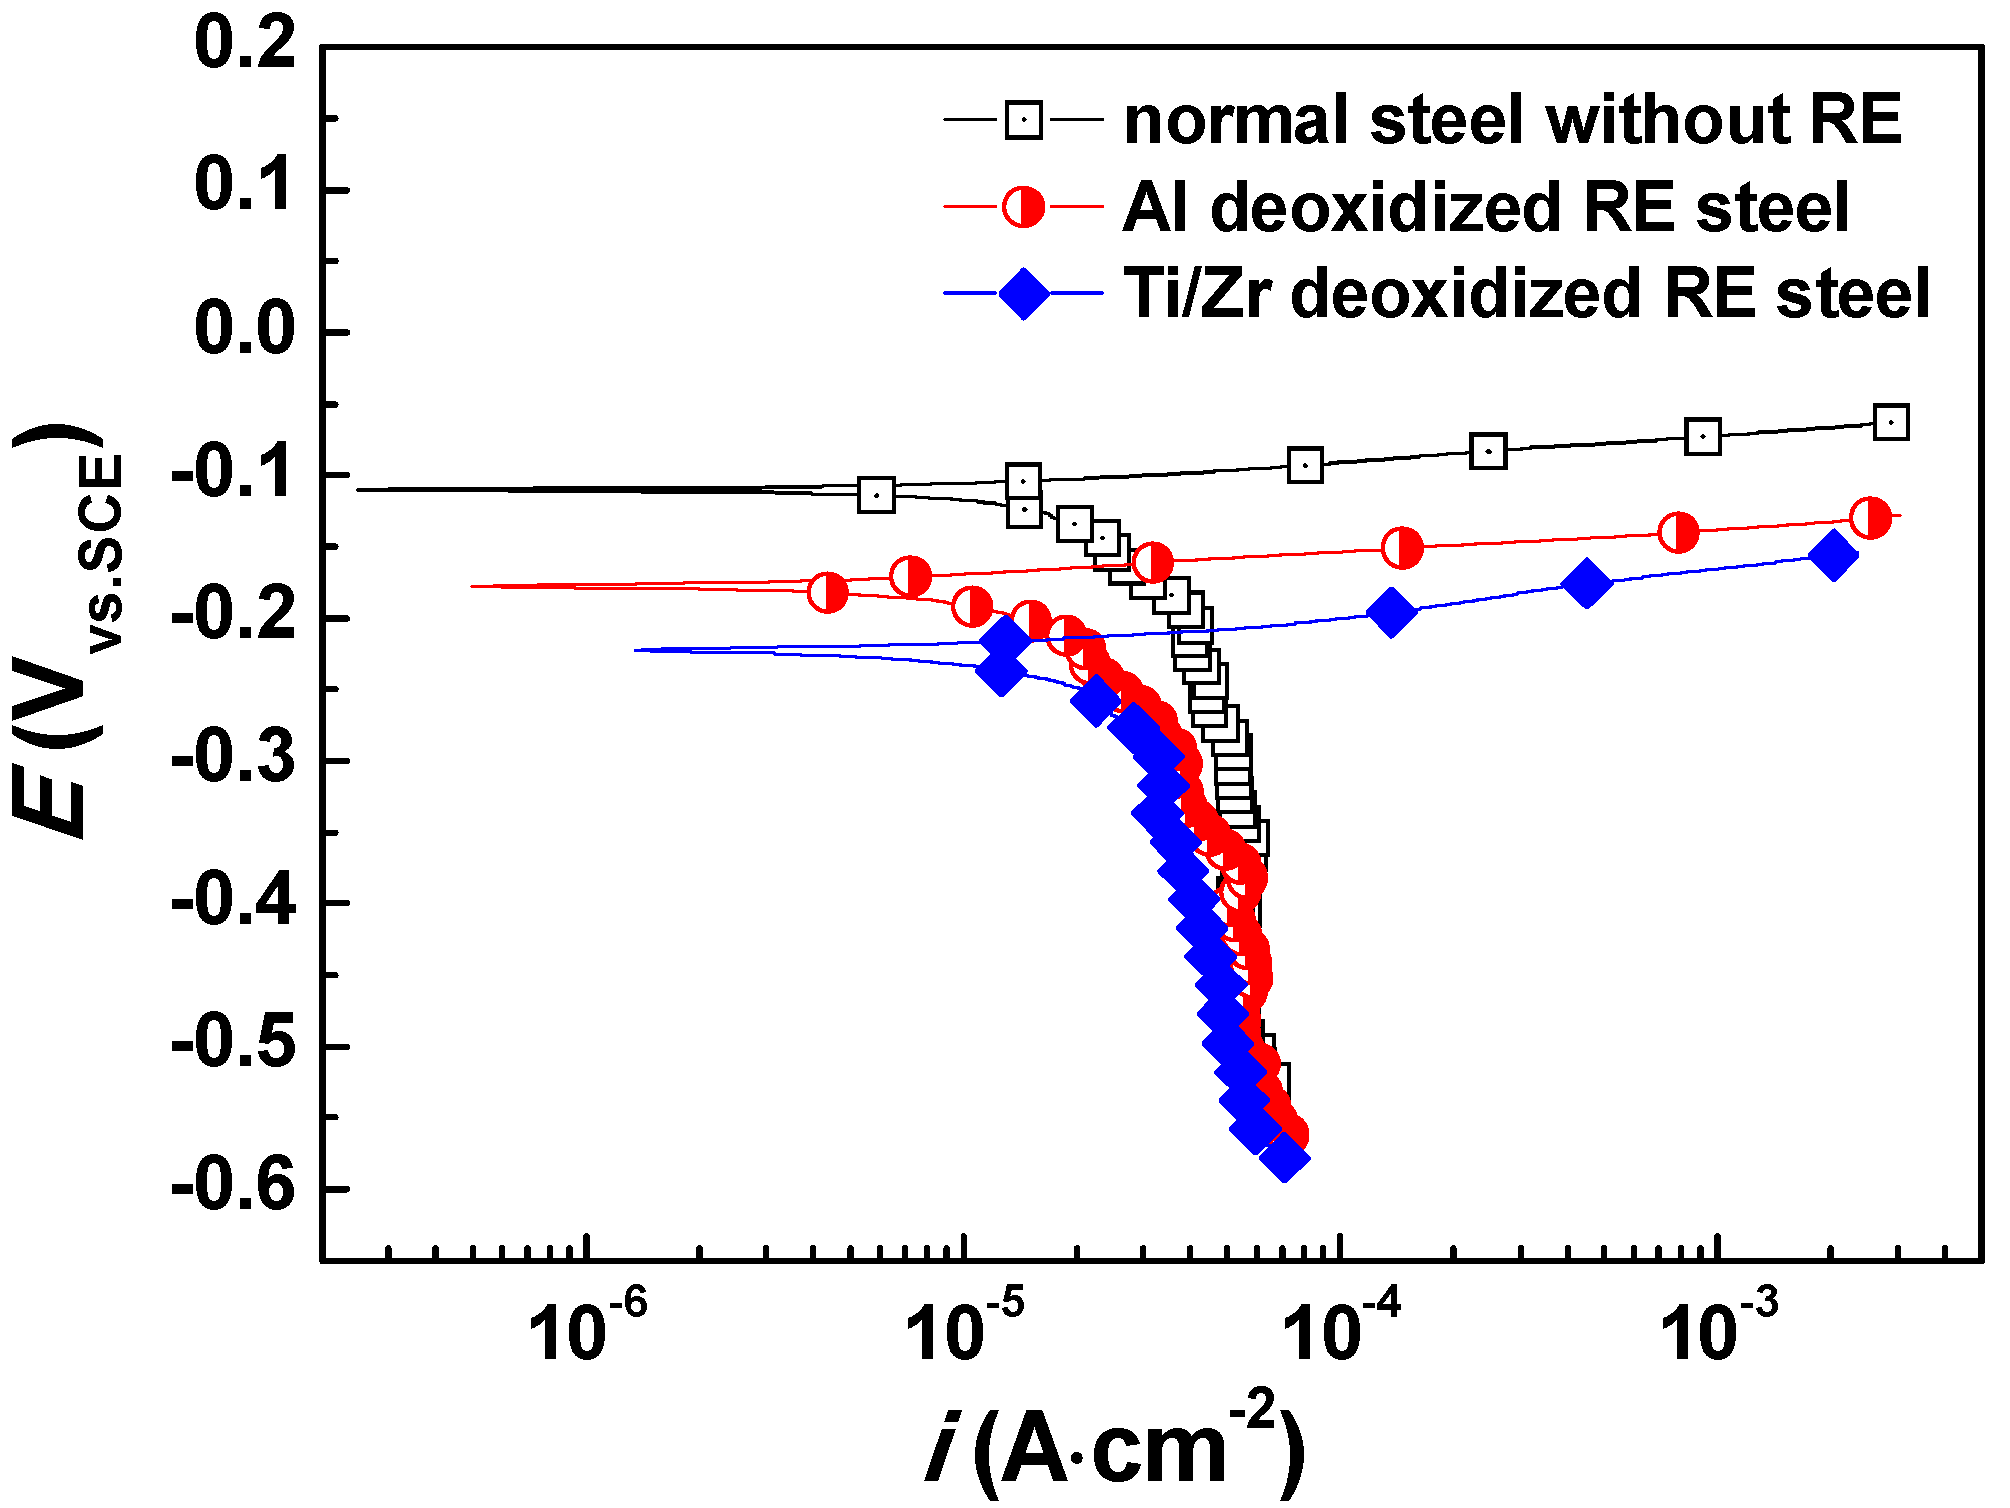
2.2.1. Potentiodynamic Polarization Tests

A Zahner Zennium electrochemical workstation (E4, Zahner Company, Kronach, Germany) was used to perform the potentiodynamic polarization tests. A three-electrode cell was used, which includes a saturated calomel (SCE) reference electrode, a counter electrode of platinum plate with a dimension of 4 mm2, and a specimen as the working electrode. The test solution was 3.5 wt.% NaCl (Sinopharm Chemical Reagent Limited Company, Shanghai, China) with a volume of 500 mL, which stayed at 25 ± 1 °C during the tests. Potentiodynamic scans started at −300 mVvs.OCP until the current density increased to 1 mA·cm−2. The scan rate was 0.333 mV s−1. For better reproducibility, all electrochemical measurements were repeated more than three times.

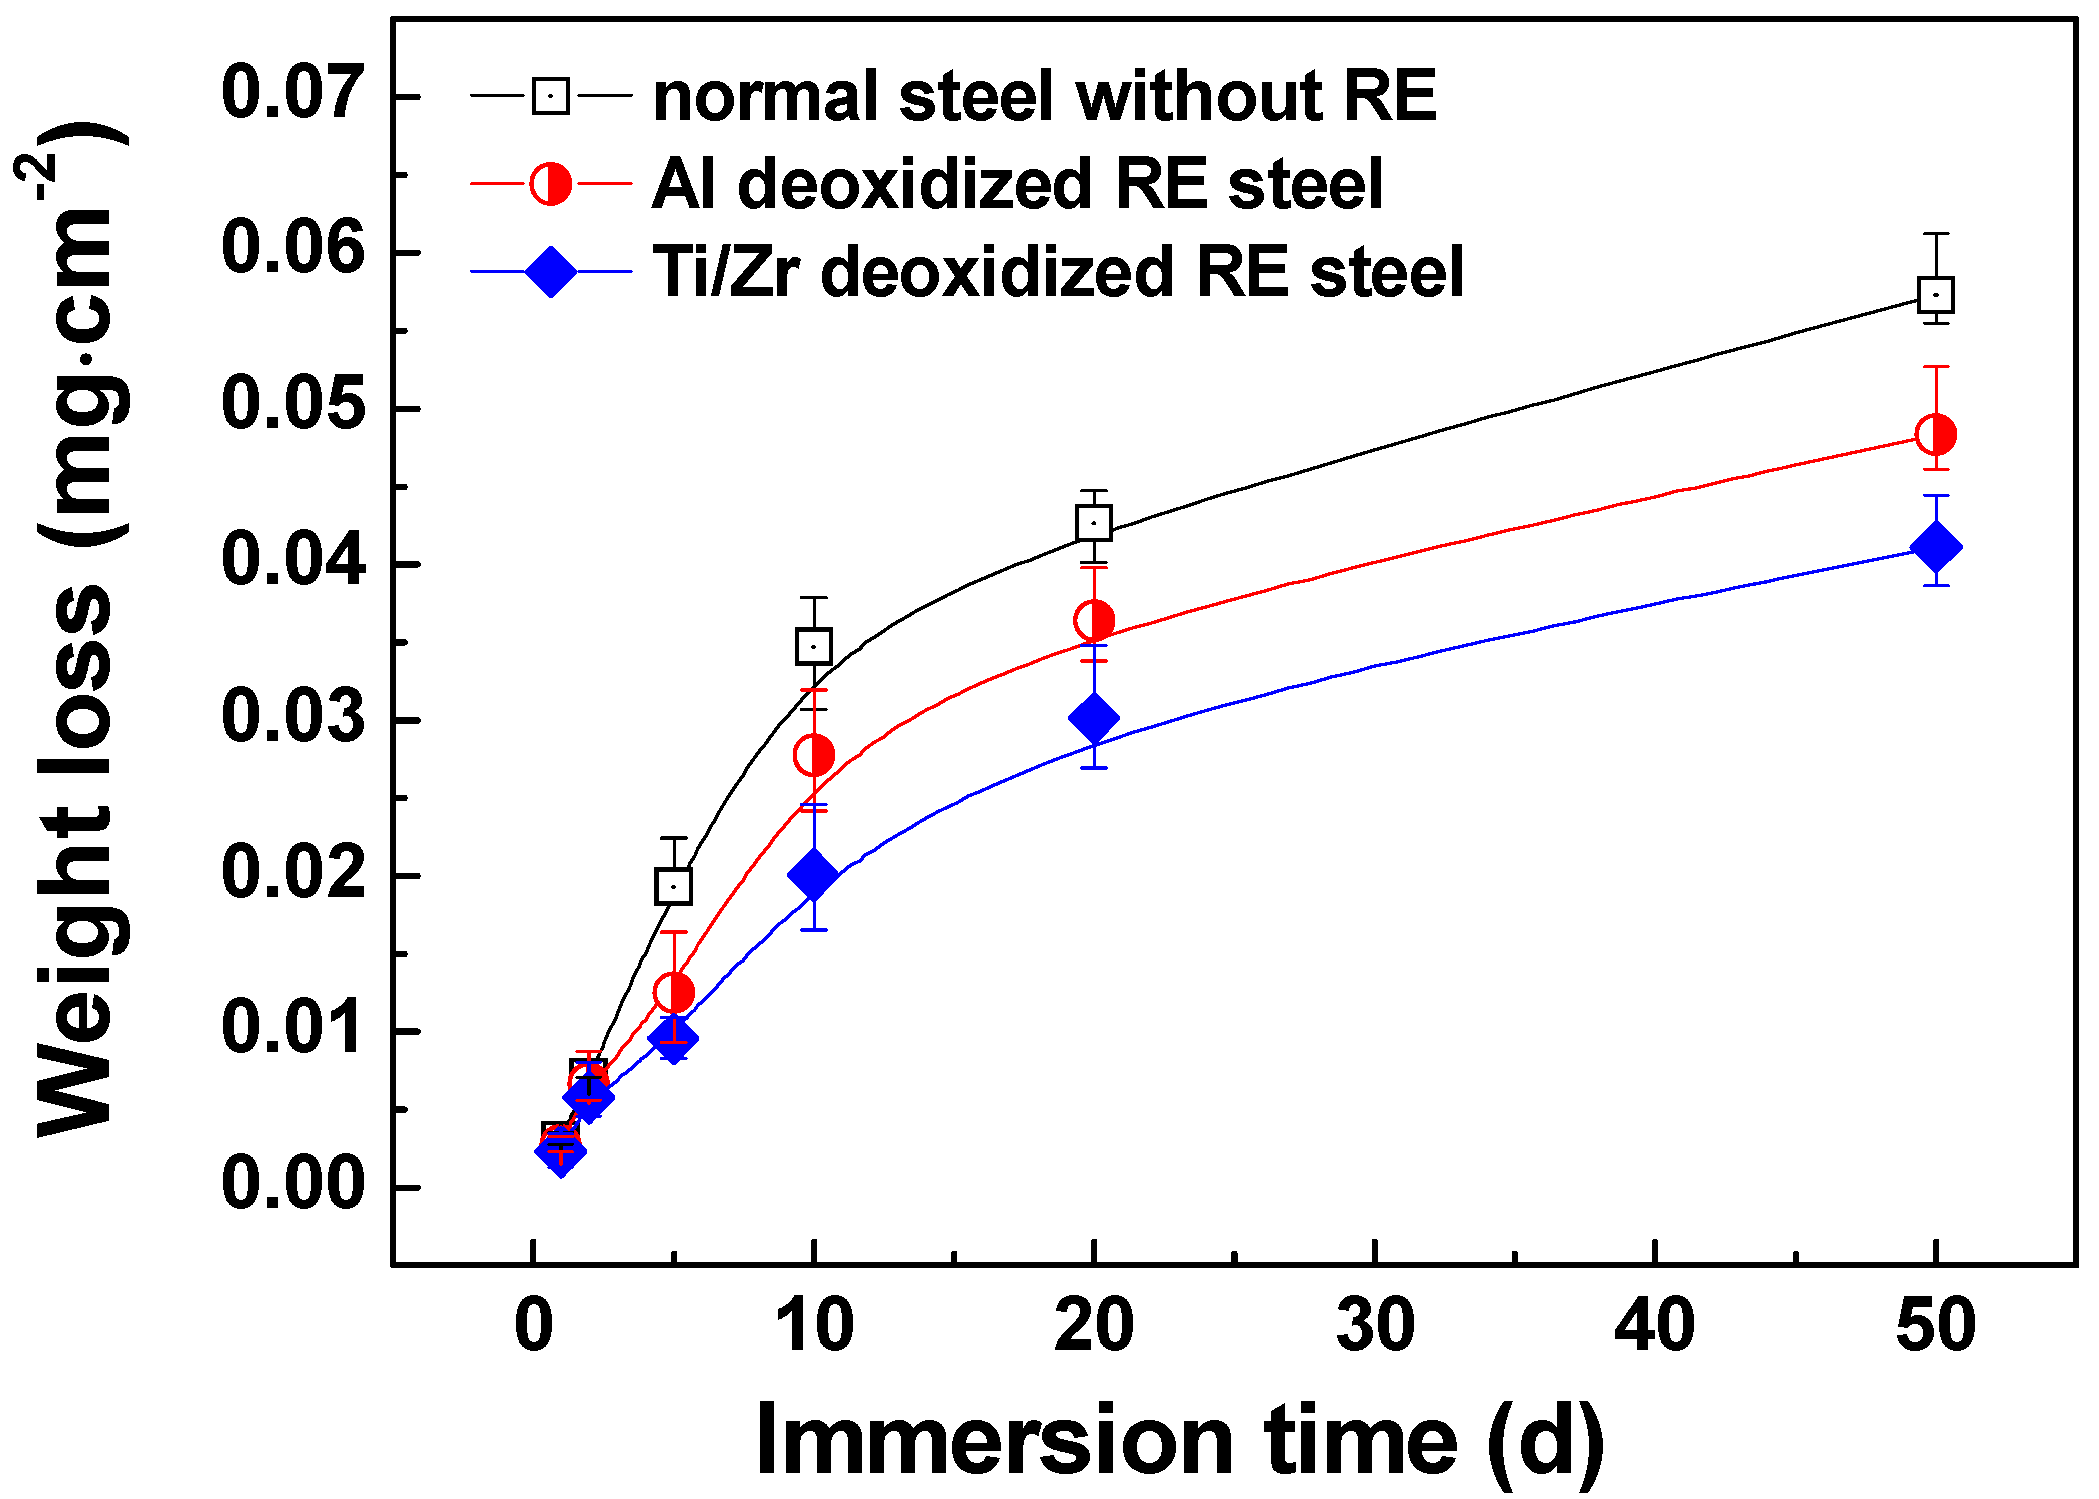
2.2.2. Weight Loss Experiments

To ensure the reproducibility of the results, more than three specimens were prepared in the immersion tests. The specimens were weighed with a digital balance (SQP, Sartorius Scientific Instrument Limited company, Göttingen, German) with an accuracy of 0.0001 g before immersion. Then, the specimens were immersed in a 3.5 wt.% NaCl solution with a volume of 1 L at a bath temperature of 25 ± 1 °C for 1, 2, 5, 10, 20, and 50 days, to evaluate the corrosion rate for a prolonged period. At each interval, the corroded specimens were extracted and the corrosion products were removed with an HCl solution of specific composition (500 mL HCl + 500 mL H2O + 10 g C6H12N4) for approximately 3 min to remove the corrosion products. Afterwards, the specimens were ultrasonically rinsed (KQ-300DE, Kunshan Ultrasonic Instrument Limited Company, Kunshan, China) in ethanol, dried by hot air flow, and reweighed to evaluate the weight loss.

2.3. Microstructure Characterization

The statistical characteristics of the inclusions were identified using a scanning electron microscope (SEM, Evo, MA10, Zeiss, Germany), equipped with an energy dispersive spectrometer (EDS, Genesis 2000, Zeiss, Germany). Additionally, the micro-morphologies of inclusions were observed by a Zeiss-Auriga SEM.

2.4. First Principle Modeling

A commercial software (version 5.4, University of Vienna, Vienna, Austria) named Vienna ab initio simulation package (VASP) was used for the first principle calculation [43,44]. The modeling method was the projector augmented wave (PAW) method [45] and generalized gradient approximation (GGA) within the Perdew–Burke–Ernzerhof (PBE) exchange-correlation function [46]. Based on experimental results, the cut-off energy was set at 400 eV, and the parameter, ISIF, when modelling in VASP software, was set to 3 to obtain the optimized lattice constants of all inclusions. A slab model without relaxation with a vacuum layer of about 15 angstroms in thickness was utilized to calculate the averaged vacuum static potential and Fermi energy of different low-indexed crystallographic planes of the inclusions to acquire their work functions and surface energies. The Brillouin zone for all the slab models of approximately 30 angstroms in total thickness was sampled by a 7 × 7 × 1 k-mesh grid generated by the Monkhorst–Pack scheme.

2.5. SVET Measurements

To analyze the microelectrochemical activity on the surface, a scanning vibrating electrode technique (SVET, Versascan, Ametek, Polly, Pennsylvania, America) was utilized to detect the localized distribution of the current density on the metal surface [1,47,48,49]. The sealed electrochemical specimen was fixed in the sample holder in the direction normal to the Pt-Ir microelectrode, which has a diameter of approximately 5 μm. The vibrating amplitude (d) and frequency (f) of the microelectrode was 30 μm and 80 Hz in the normal direction, respectively. The test solution was a 0.5 wt.% NaCl with a volume of about 250 mL. During the experiments, the potential differences between the vibration peak and valley, ΔE, were detected by an electrometer incorporated in this equipment. Therefore, the local distribution of current density could be acquired through the equation I = −ΔE/R, where R represents the solution resistance and equals the ratio of d/k (k is the solution conductivity, 8.42 mS/cm for a 0.5% NaCl solution) [1,41]. The ΔE values of a region of 400 × 400 μm were recorded at the beginning of corrosion and after corrosion for 1 h, respectively. Therefore, the in-site distribution of the current density with corrosion time was obtained.

3. Results and Discussion

3.1. Corrosion Rate

In order to evaluate the corrosion rate of the microalloyed steels, potentiodynamic polarization tests were first carried out and the result is displayed in Figure 1 (in which, normal steel without a RE doping is also displayed for comparison). Moreover, the corresponding fitted corrosion current density (icorr) and corrosion potential (Ecorr) are shown in Table 2. The icorr of Ti/Zr deoxidized steel is lower than that of the Al deoxidized steel, and both of the RE microalloyed steels present lower corrosion rates than the normal steel without RE doping. In the long term corrosion experiment, as exhibited in Figure 2, the corrosion weight loss follows the same trend as those of potentiodynamic and potentiostatic polarizations. The corrosion weight loss decreases in the following order: Ti/Zr deoxidized steel < Al deoxidized steel < normal steel without RE doping. The weight loss increases with the immersion time, but the corrosion rate decreases as the immersion time prolongs.

3.2. Effect of RE Inclusions on Corrosion Nucleation Process

Figure 3 shows the corrosion morphologies of RE microalloyed steels after immersion in 0.5 wt.% NaCl solution for a few minutes. It could be observed from Figure 3a,d that corrosion originated from local corrosion, and then propagated to the whole surface for the two different deoxidized steels. Further observation showed that the local areas of corrosion origin were in the positions of inclusions, confirming that inclusions were the root of corrosion in microalloyed steels [8,9,10]. Therefore, it is necessary to identify the characteristic of inclusions to elucidate the original corrosion mechanism.

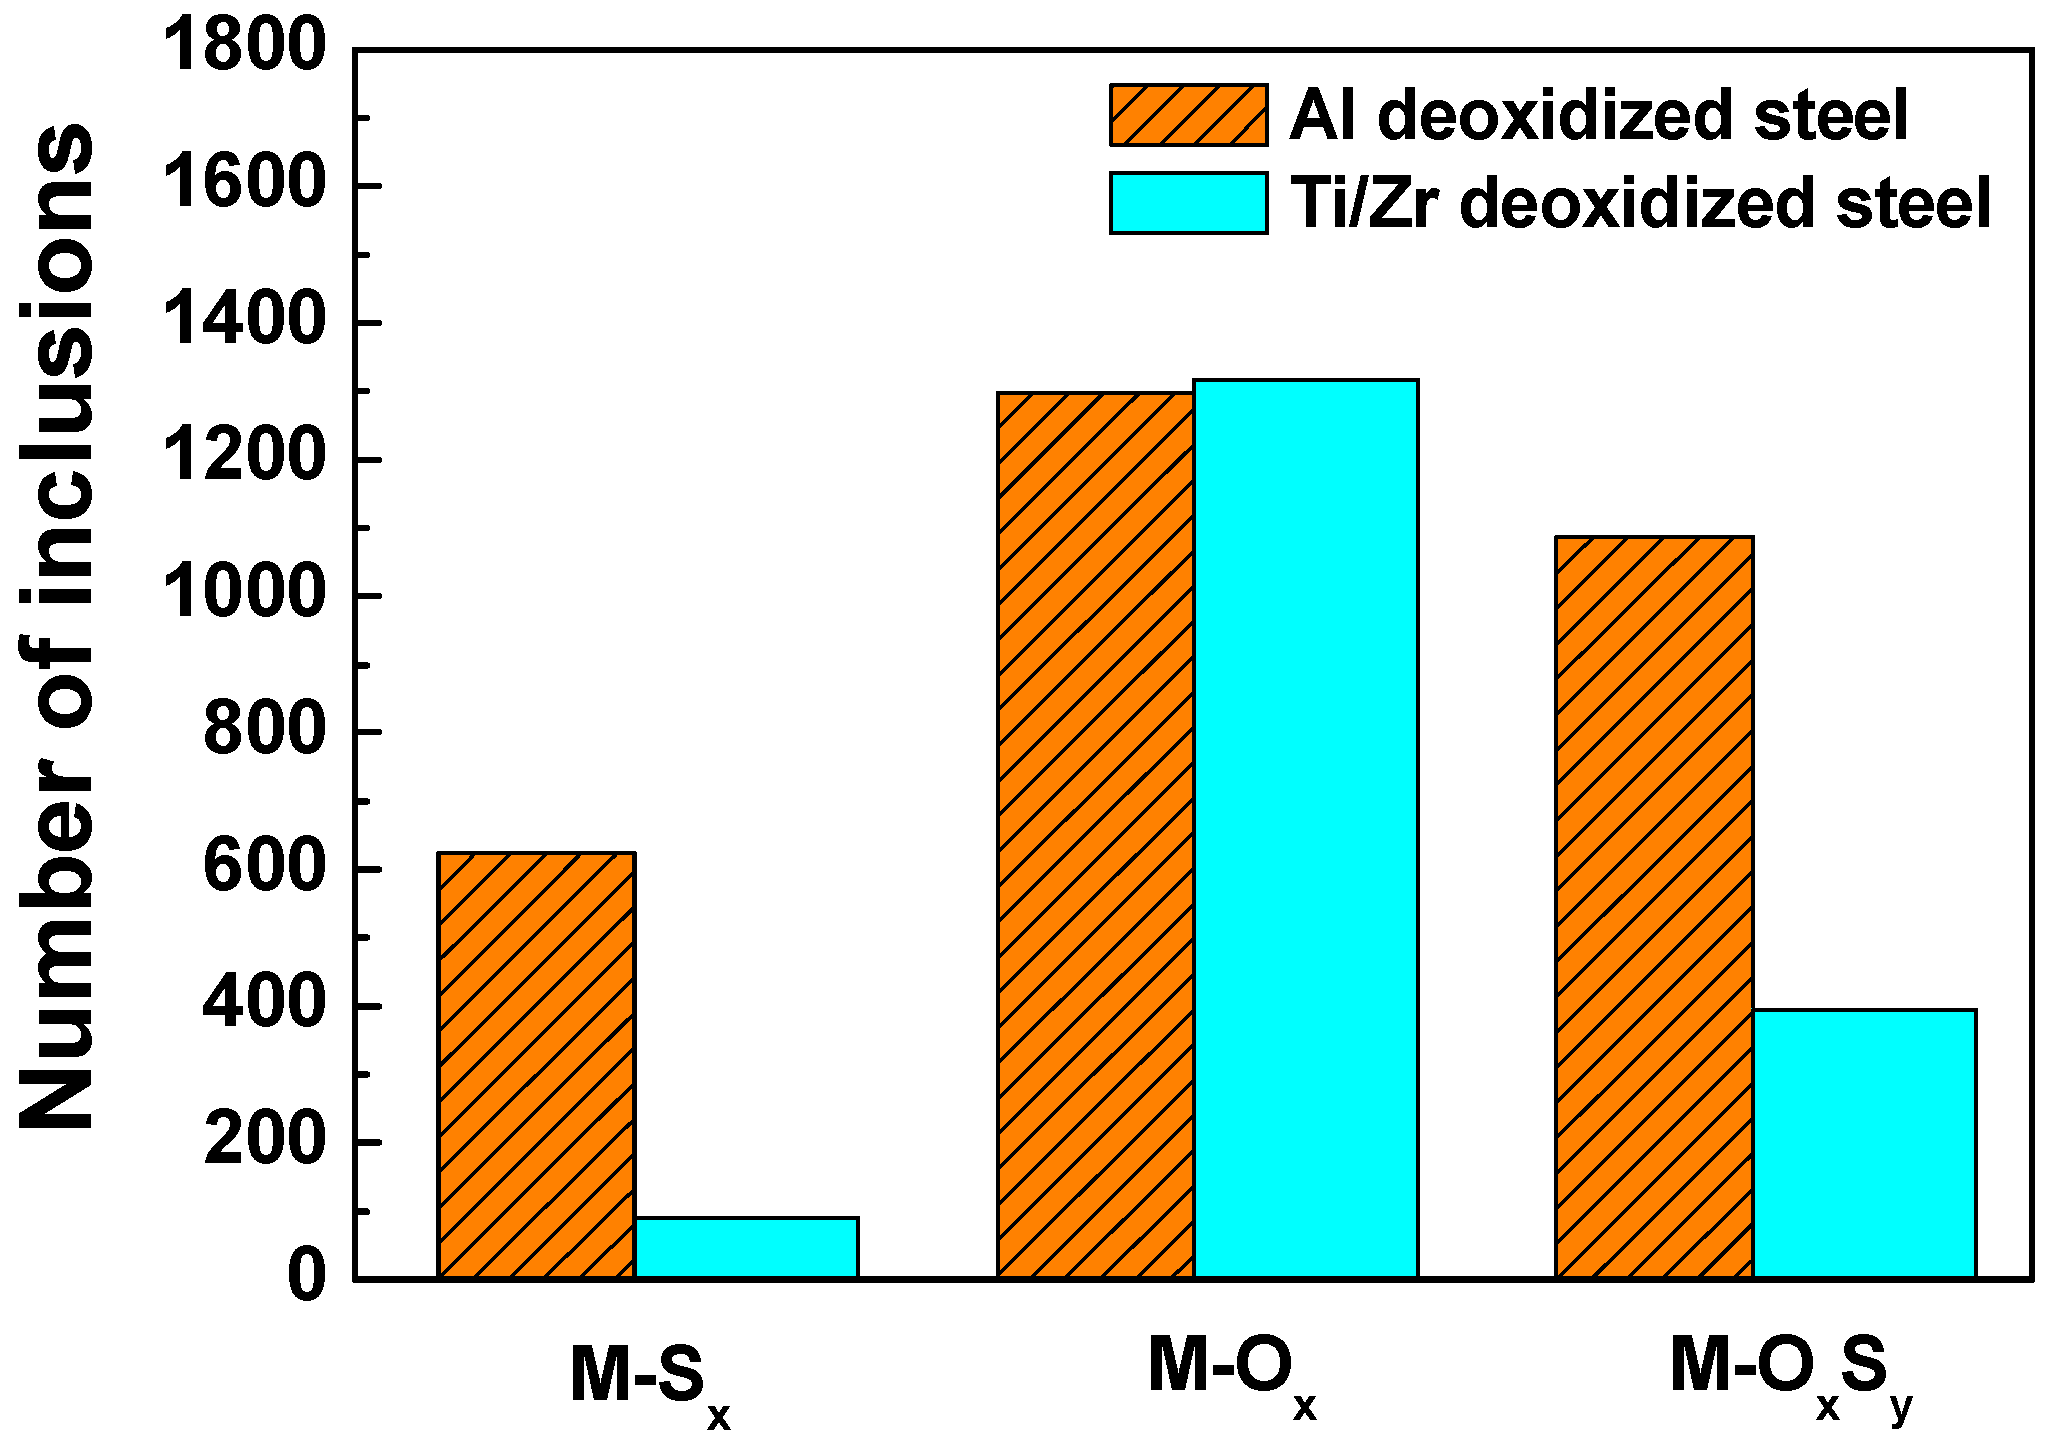
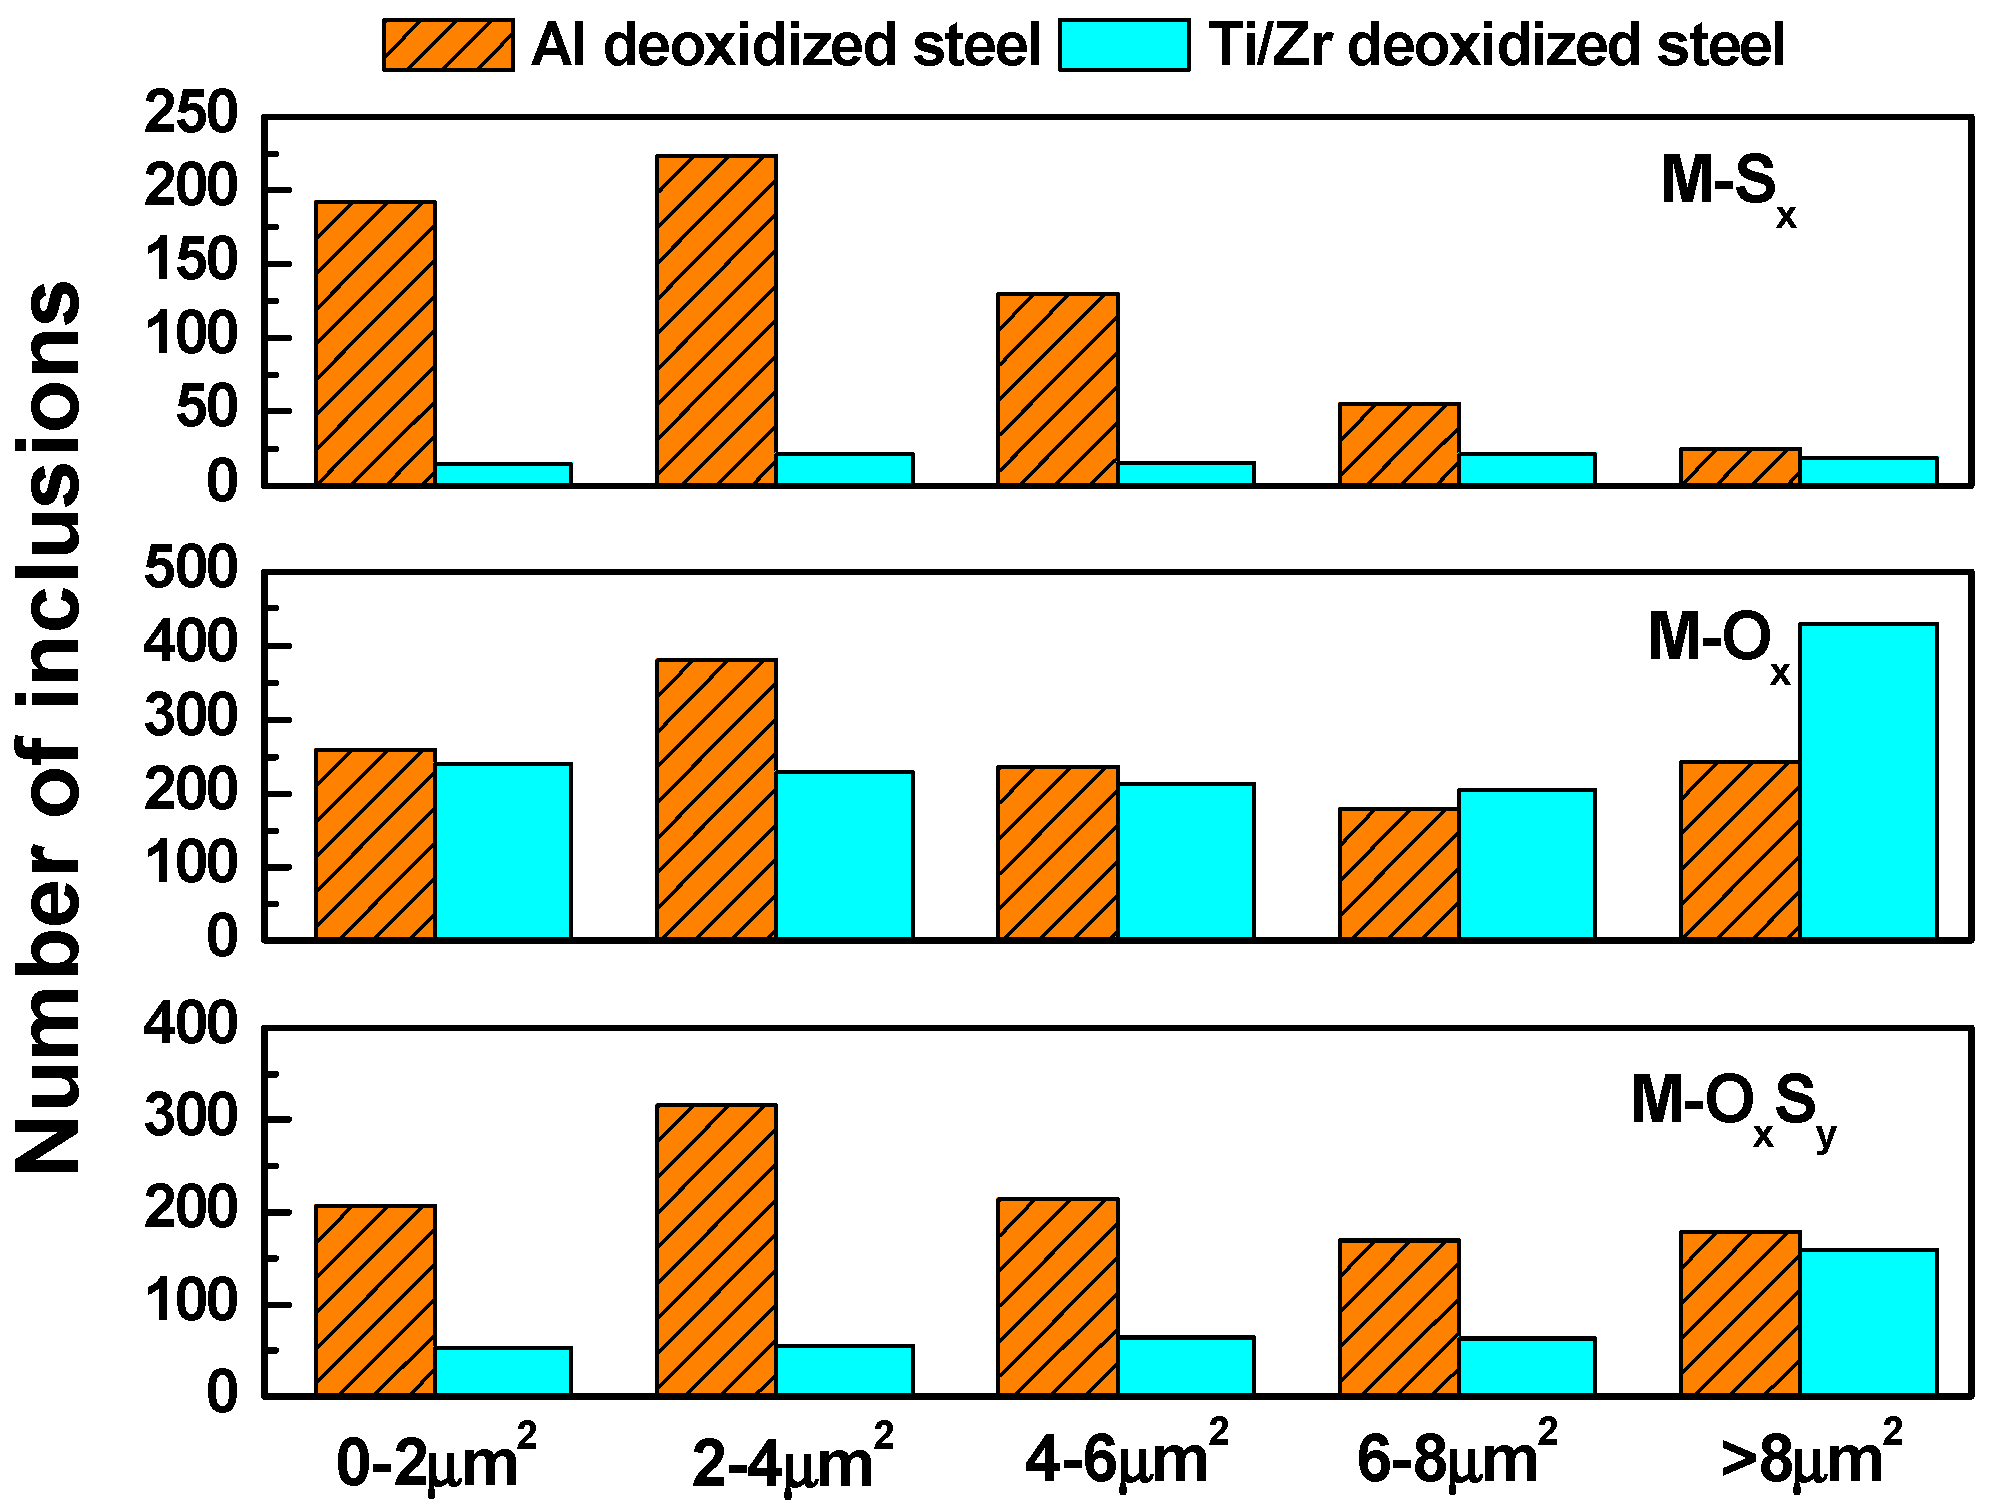
3.2.1. Statistical Identification of Inclusions

SEM and EDS were employed to analyze the statistical characteristics of inclusions in a region of 30 mm2. The average distribution result is shown in Table 3. Several different types of sulfides, oxides, and oxygen sulfides have been reported to form in steels with the doping of RE elements [15,18,31,36,37,38,39,50,51,52]. Based on the experimental data, there are RE sulfides (RE-Sx), RE oxides (RE-Ox), Al mixed with RE oxides ((Al,RE)-Ox), RE oxygen sulfides (RE-OxSy), and Al mixed with RE oxygen sulfides ((Al,RE)-OxSy) in Al deoxidized steel. For Ti/Zr deoxidized steel, there are RE-Sx, RE-Ox, Zr mixed with RE oxides ((Zr,RE)-Ox), RE-OxSy, and Zr mixed with RE oxygen sulfides ((Zr,RE)-OxSy). It should be mentioned that the sulfides presented as RE-Sx exclusively, which could be ascribed to the more negative formation energy of RE-Sx than those of MnS and other metal sulfides [34,36,53]. Additionally, due to the strong affinity of RE with oxygen [37], a small quantity of Ti predominantly existed as TiC and TiN, but not as an oxide. Similarly, due to the low standard free energy for the formation of RE-Ox [25,34], the volume fractions of solitary Al2O3 and ZrO2 were less than 1%. Therefore, the aforementioned inclusions could be neglected in statistical analysis. In conclusion, the three main types of inclusions to be considered are metal sulfides (M-Sx, referred to RE-Sx), metal oxides (M-Ox, referred to RE-Ox, (Al,RE)-Ox, and (Zr,RE)-Ox), and metal oxygen sulfides (M-OxSy, referred to RE-OxSy, (Al,RE)-OxSy, and (Zr,RE)-OxSy), respectively.
It has been commonly recognized that not only the types of inclusions but also the size of inclusions has a great impact on the corrosion behavior [37]. Therefore, the number of distributions of different kinds of inclusions as well as the size of distributions in a 30 mm2 scanning region are depicted in Figure 4 and Figure 5, respectively. The overall numbers of inclusions are 3009 and 1801 for Al deoxidized steel and Ti/Zr deoxidized steel, respectively. The metal oxide (M-Ox) inclusions are the majority in both steels. However, the amount of metal sulfides (M-Sx) and metal oxygen sulfides (M-OxSy) in Al deoxidized steel is obviously higher than that in Ti/Zr deoxidized steel (Figure 4). Additionally, according to the size distributions in Figure 5, regardless of the type of inclusions, the amount of inclusions in Al deoxidized steels is higher than that in Ti/Zr deoxidized steels at almost each size range, except for the metal oxides (M-Ox) with a particle size larger than 6 µm. In general, the Al deoxidized steels contain more inclusions with larger particle sizes.

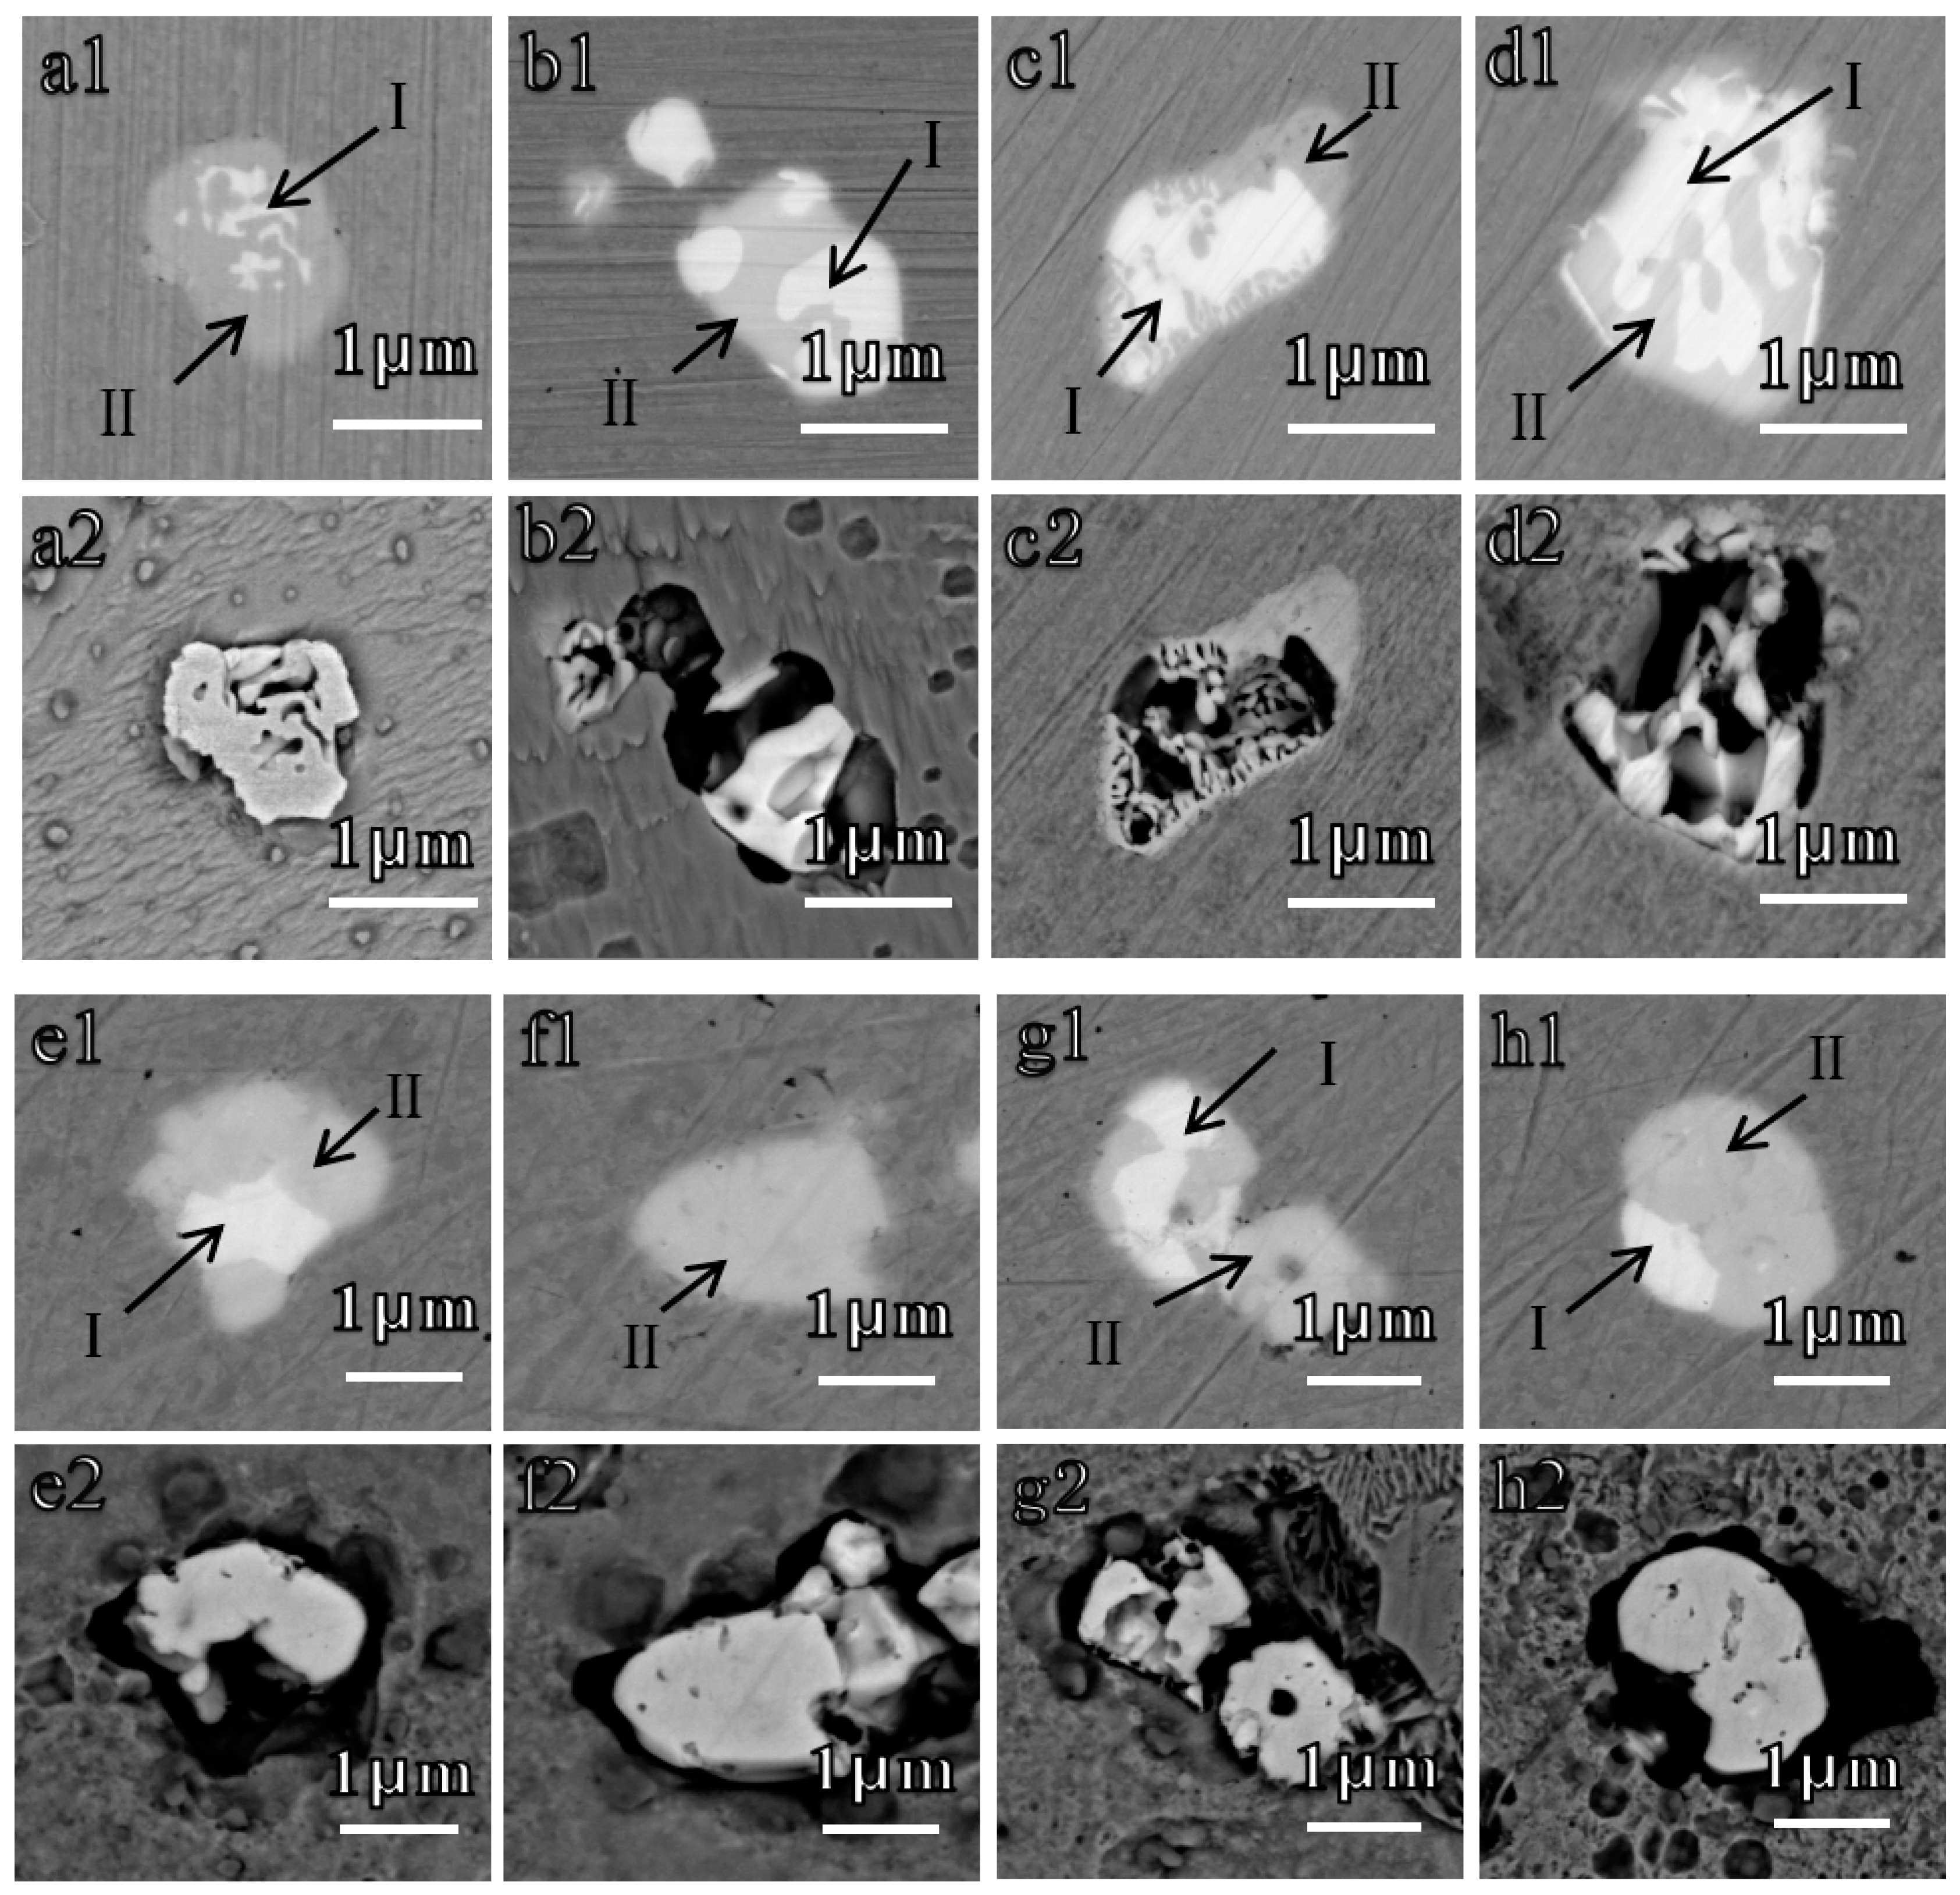
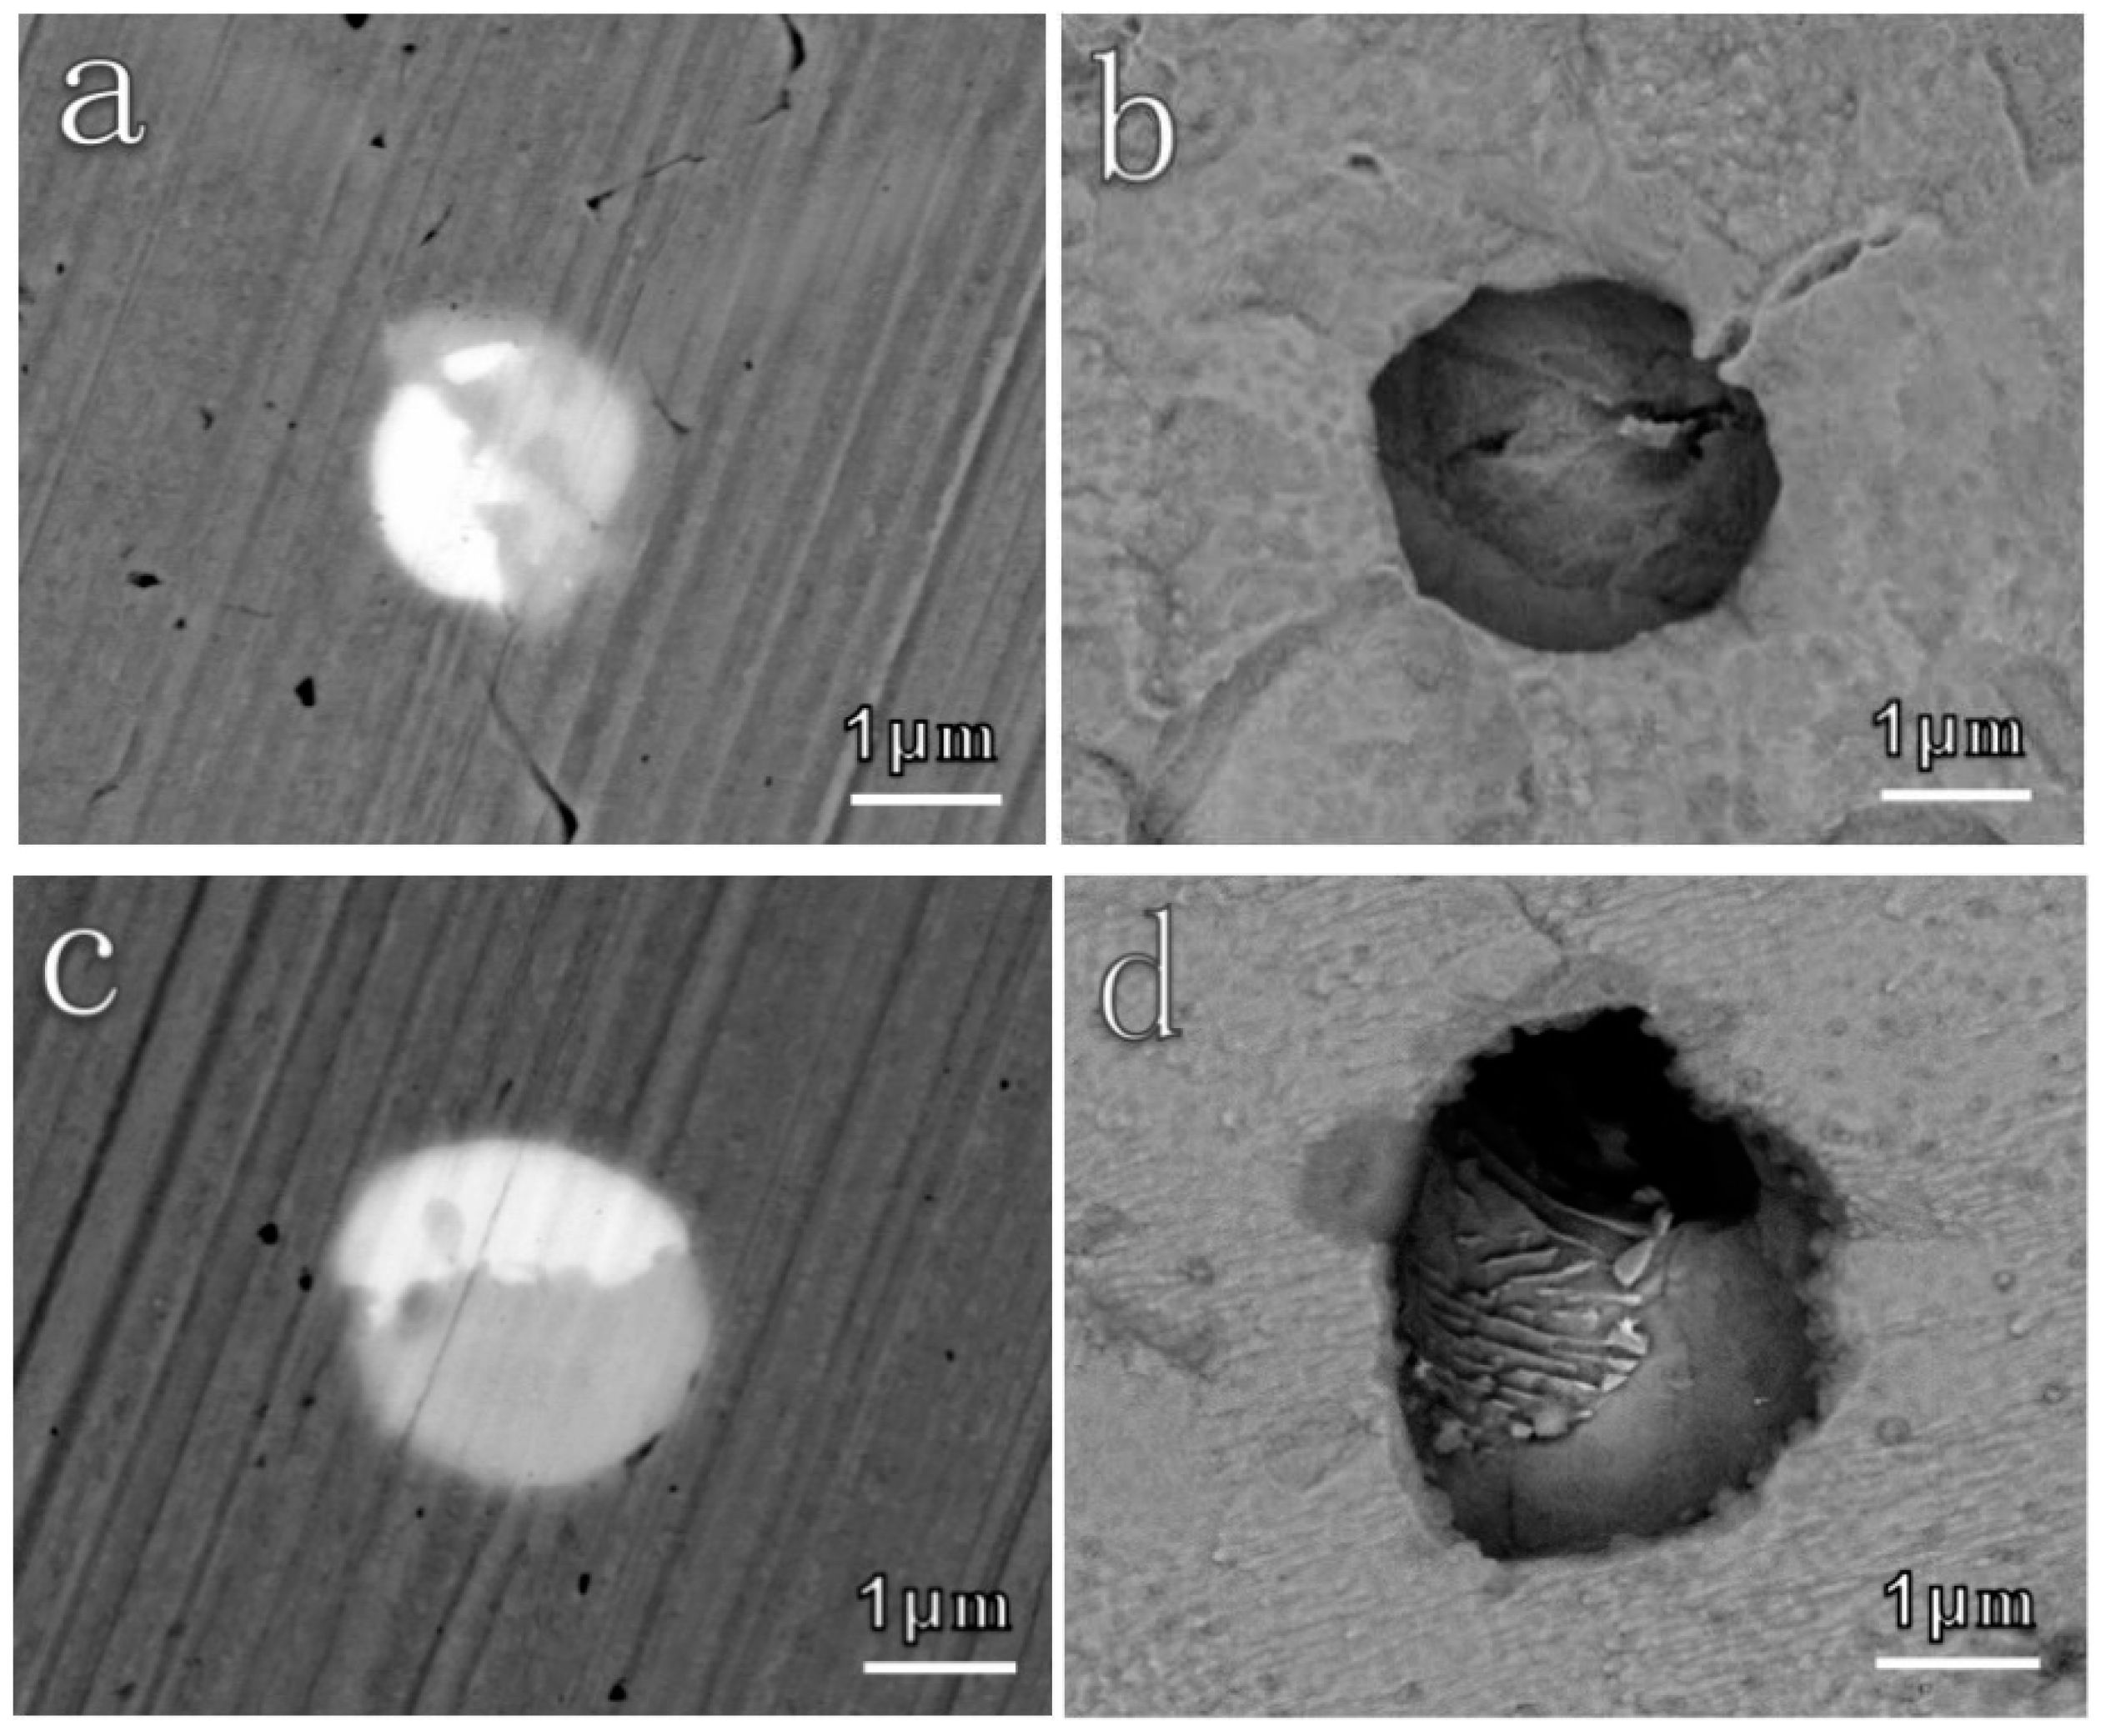
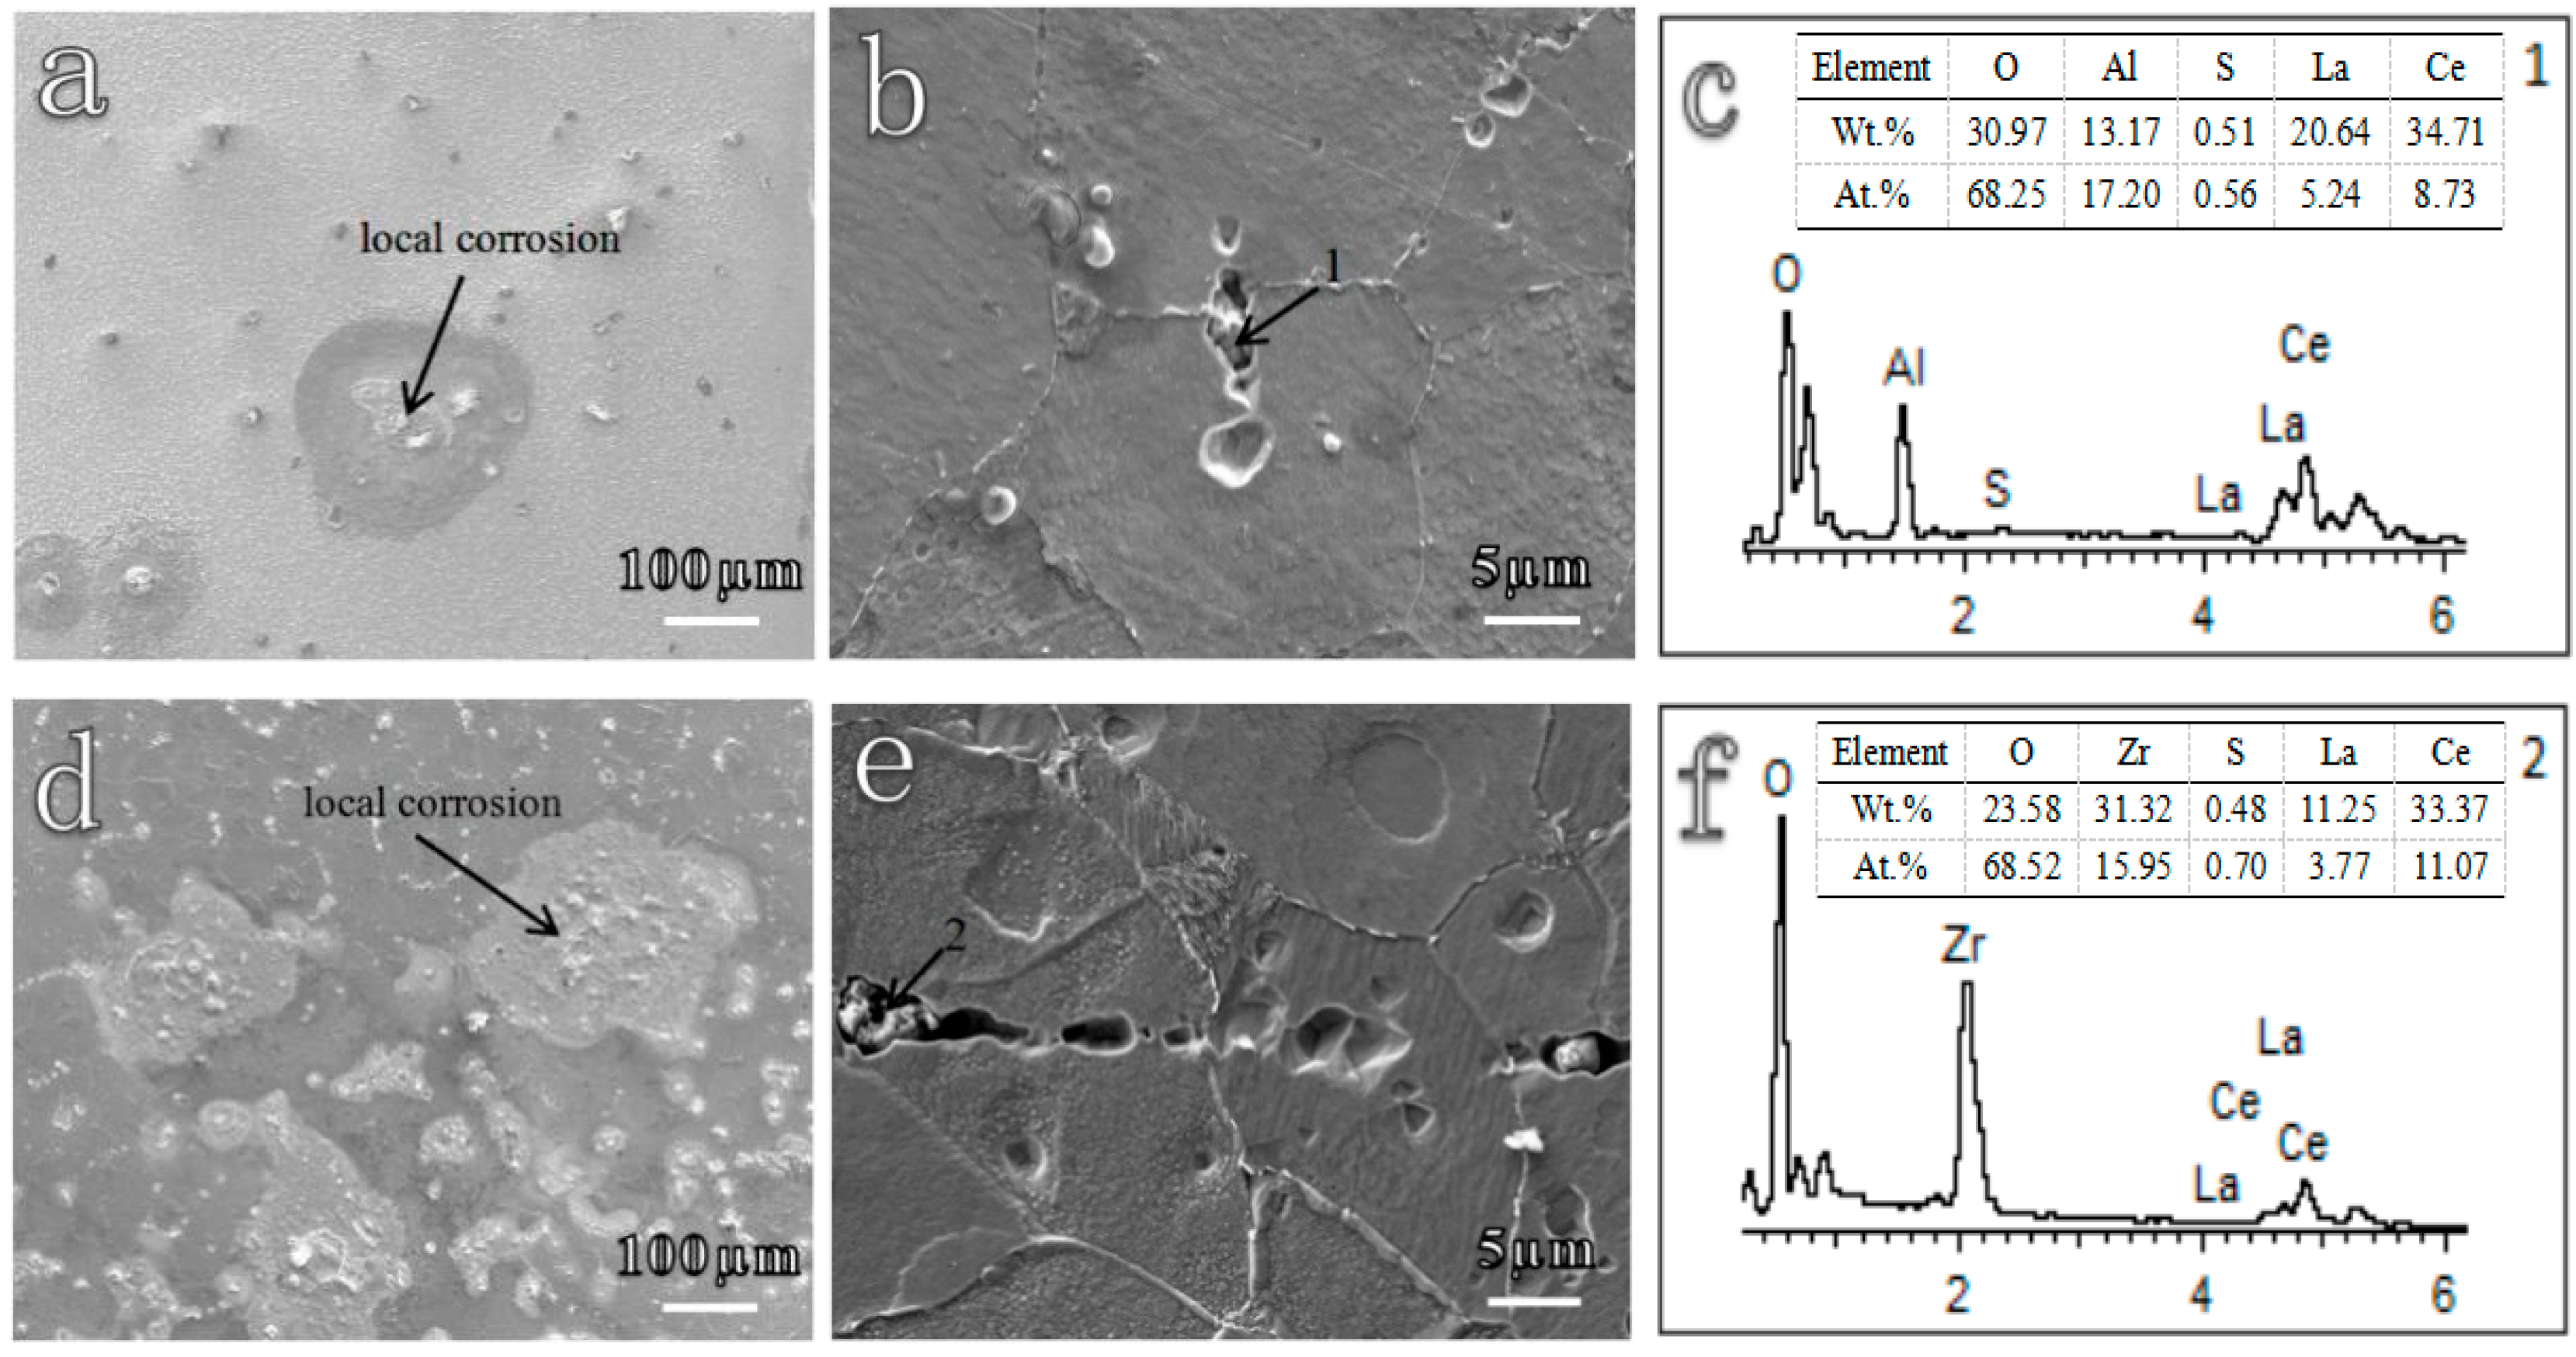
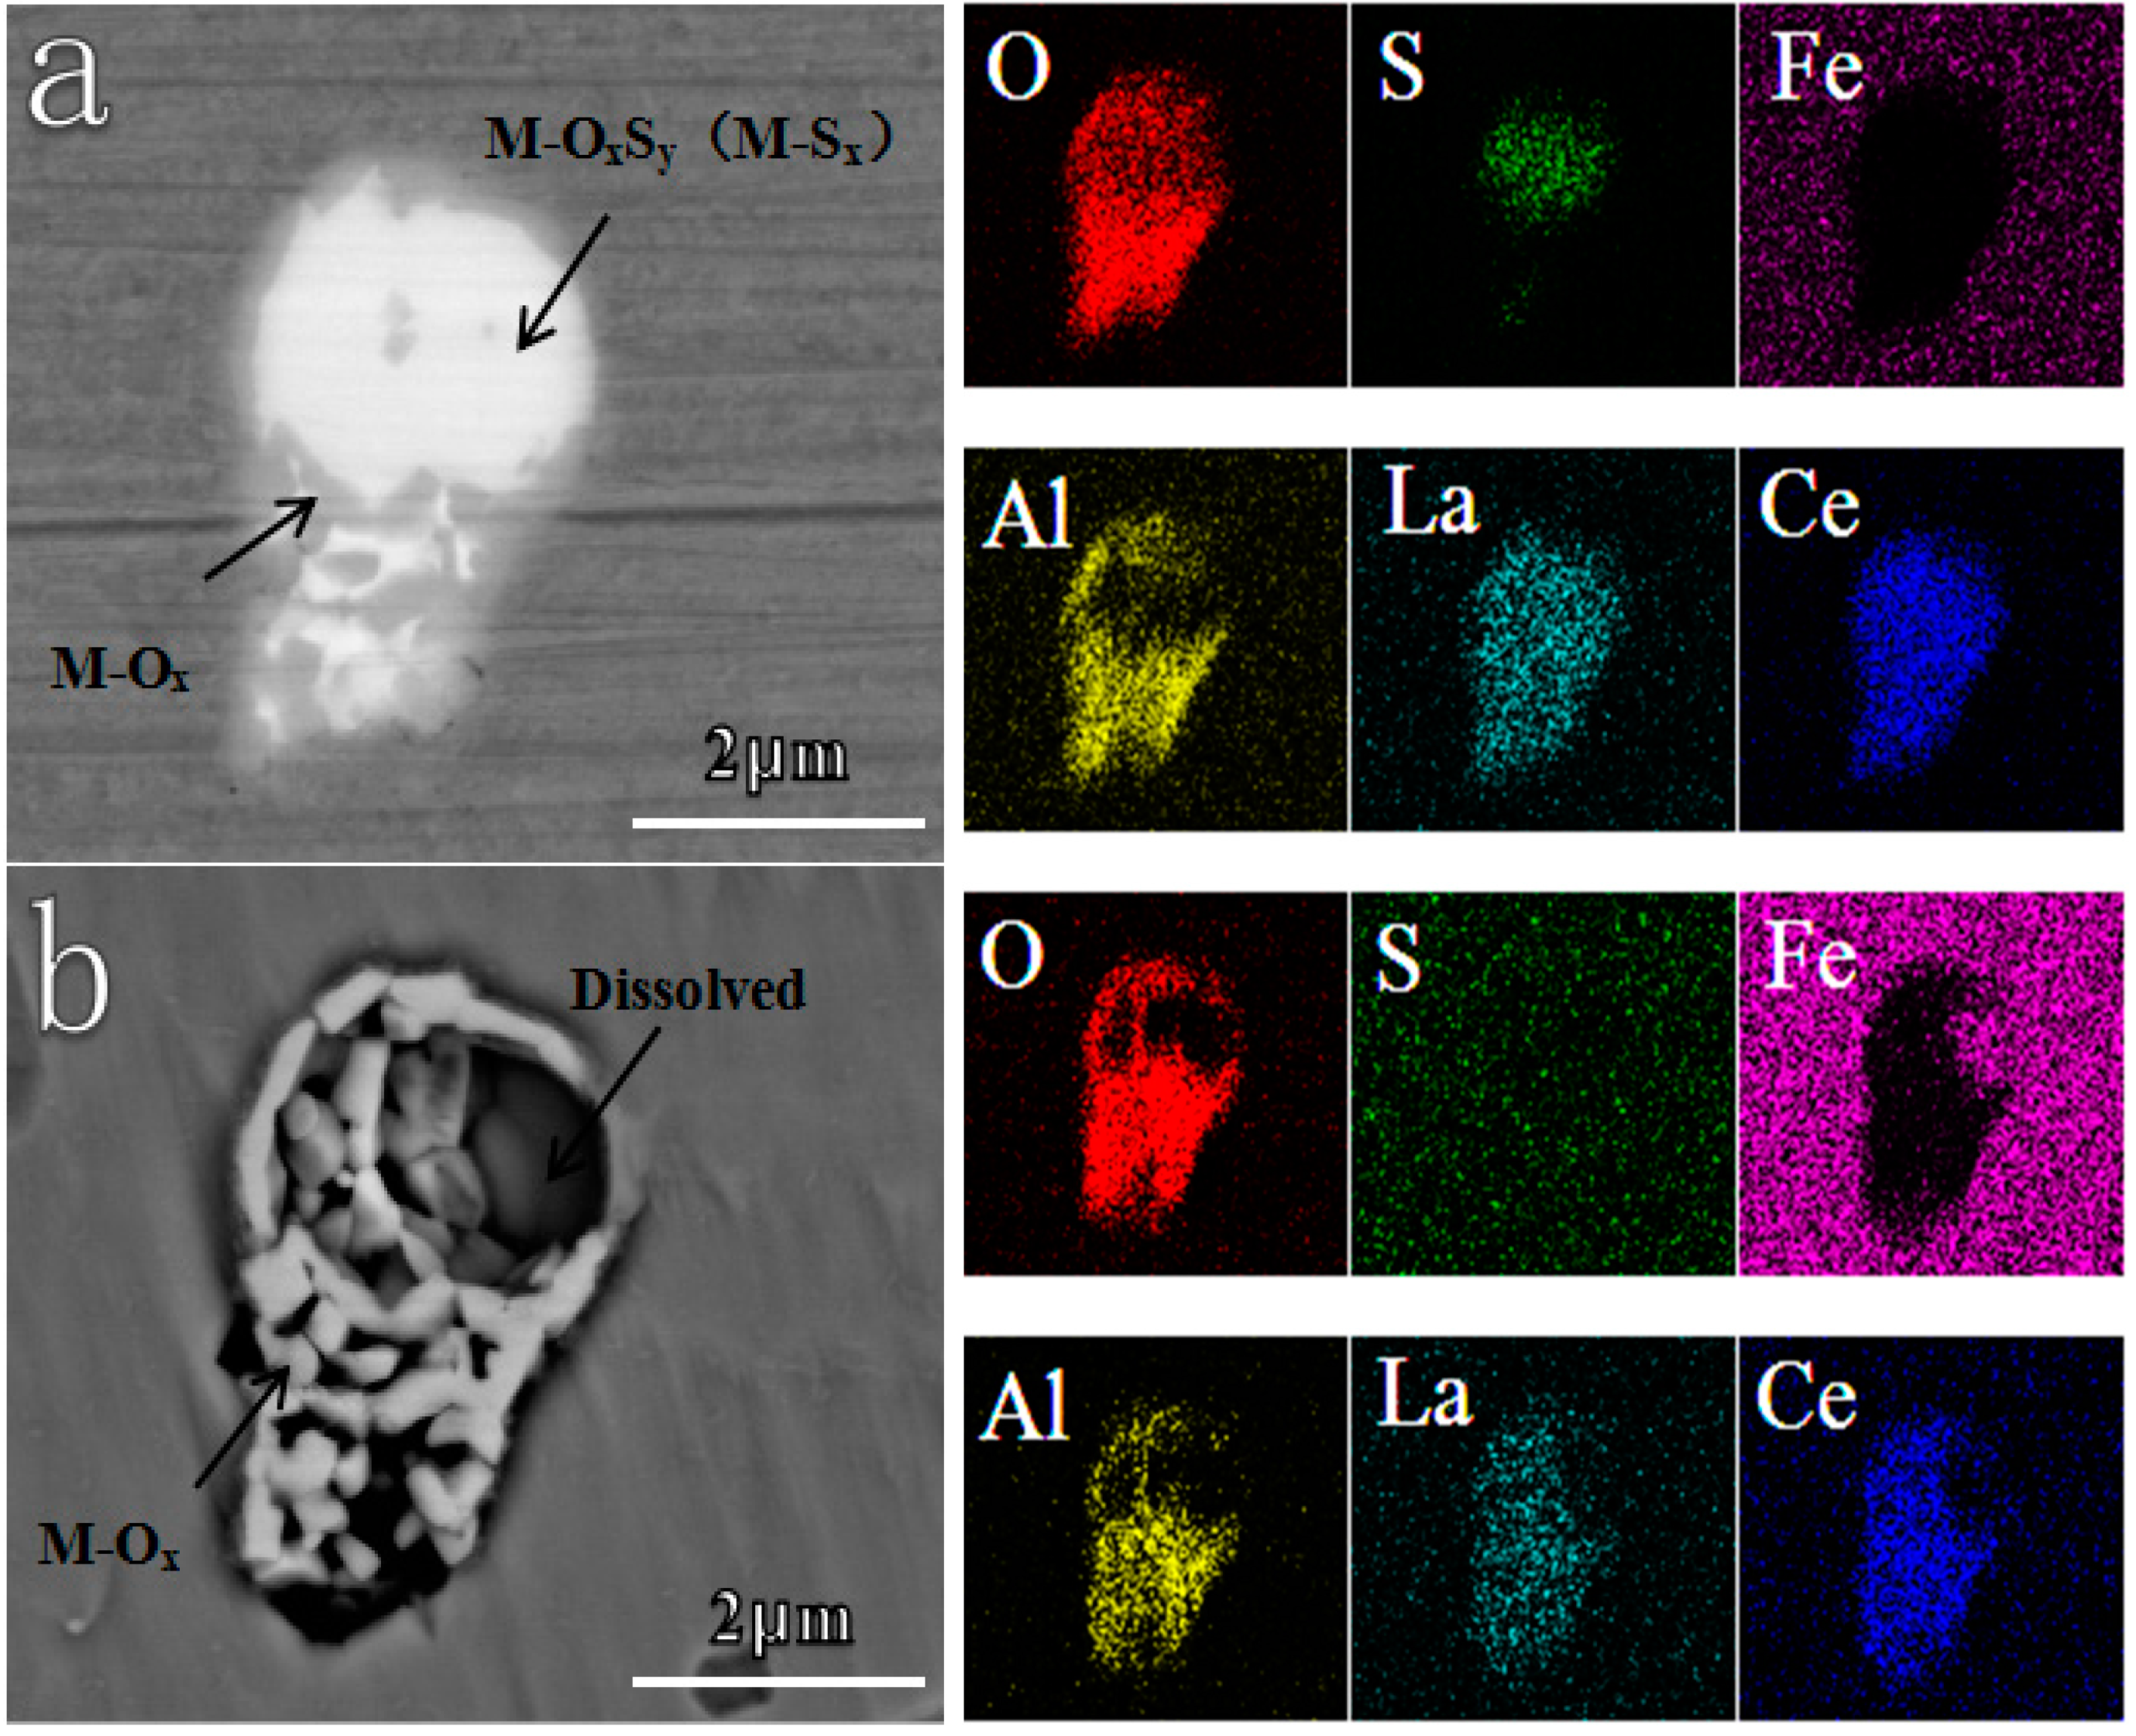
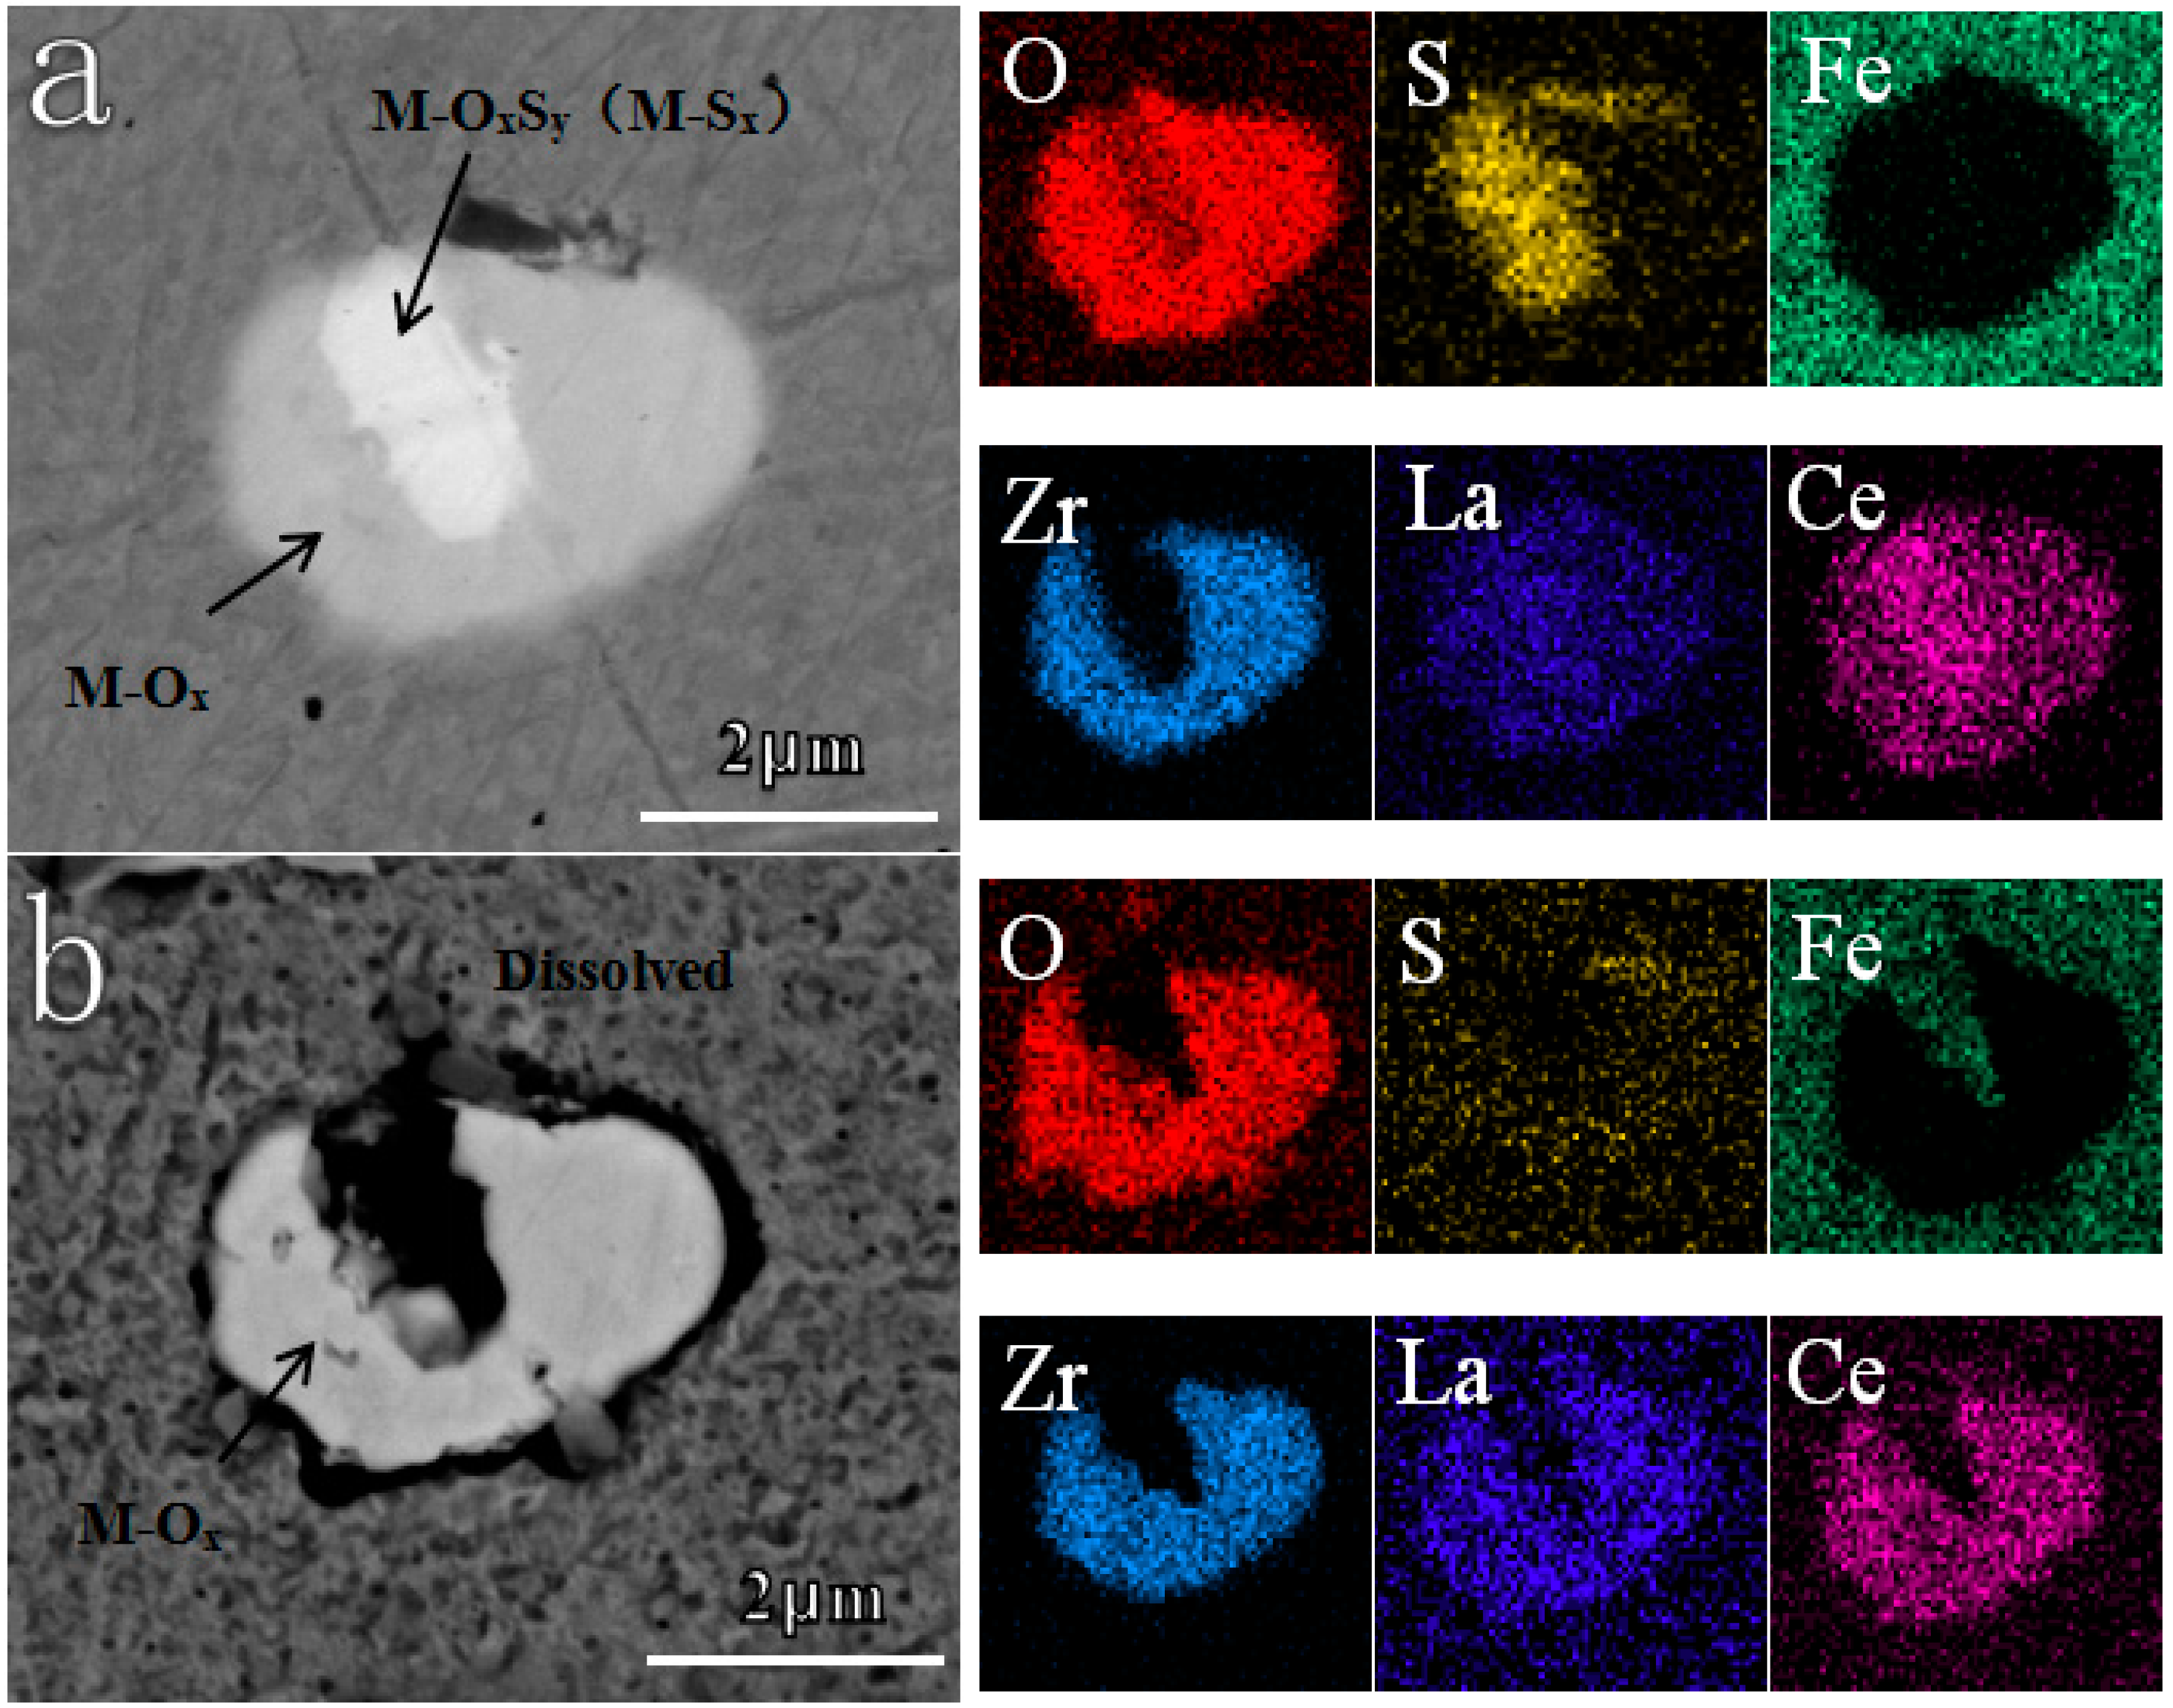
3.2.2. Corrosion Behavior of Inclusions

Subsequently, the corrosion behaviors of inclusions in different deoxidized steels were characterized. For most cases, two or more components coexisted in one inclusion, which has been reported in previous studies [37,53,54,55]. As seen in Figure 6, the light part in Al deoxidized steel is denoted as metal oxygen sulfides and/or metal sulfides, M-OxSy (M-Sx), while, the dark part is metal oxides, M-Ox, which could be verified by the EDS results. After immersion in a 0.5 wt.% NaCl solution for 10 min, parts of M-OxSy (M-Sx) became voids. Correspondingly, the concentration of O, S, and RE elements reduced, while the Fe content increased in that original region, indicating the complete dissolution of M-OxSy (M-Sx). In contrast, there was no change in the state of M-Ox.
With respect to Ti/Zr deoxidized steel, two or more components also coexisted in one inclusion for most cases (Figure 7). One is M-OxSy (M-Sx), and the other is M-Ox. After immersion for 10 min, EDS mapping revealed that O and S, as well as some RE elements, disappeared in part of M-OxSy (M-Sx). Correspondingly, the Fe matrix became bare. The M-OxSy (M-Sx) dissolved completely. However, the M-Ox did not dissolve at all. Additionally, there was slight corrosion at the boundary between the Fe matrix and oxides.
There were many other similar examples manifesting this dissolution phenomenon, as shown in Figure 8. The inclusions exhibited the same dissolution behavior as aforementioned. M-OxSy and/or M-Sx dissolved entirely after immersion in NaCl solution for 10 min, whereas, M-Ox remained. The corrosion also occurred at the boundary between the Fe matrix and oxides for both steels.
In conclusion, the dissolution behaviors of the inclusions can be summarized as follows: First, M-OxSy (M-Sx) dissolved preferentially, while M-Ox did not undergo any dissolution [21,35,36]. Afterwards, slight corrosion occurred at the boundary between the Fe matrix and M-Ox [36,37,56], which finally led to the complete fall off of the inclusions [37]. Figure 9 shows the dissolution morphologies of the inclusions after immersion in a NaCl solution for 30 min, exhibiting obvious voids in the locations of the original inclusions. The voids due to the overall fall off of the inclusion, acting as the active sites, promoted pitting nucleation [37]. Considering the high amount and large size of M-Sx and M-OxSy in Al deoxidized steel, there were more active sites on its surface. Therefore, the Al deoxidized steel presented a higher corrosion rate than Ti/Zr deoxidized steels.

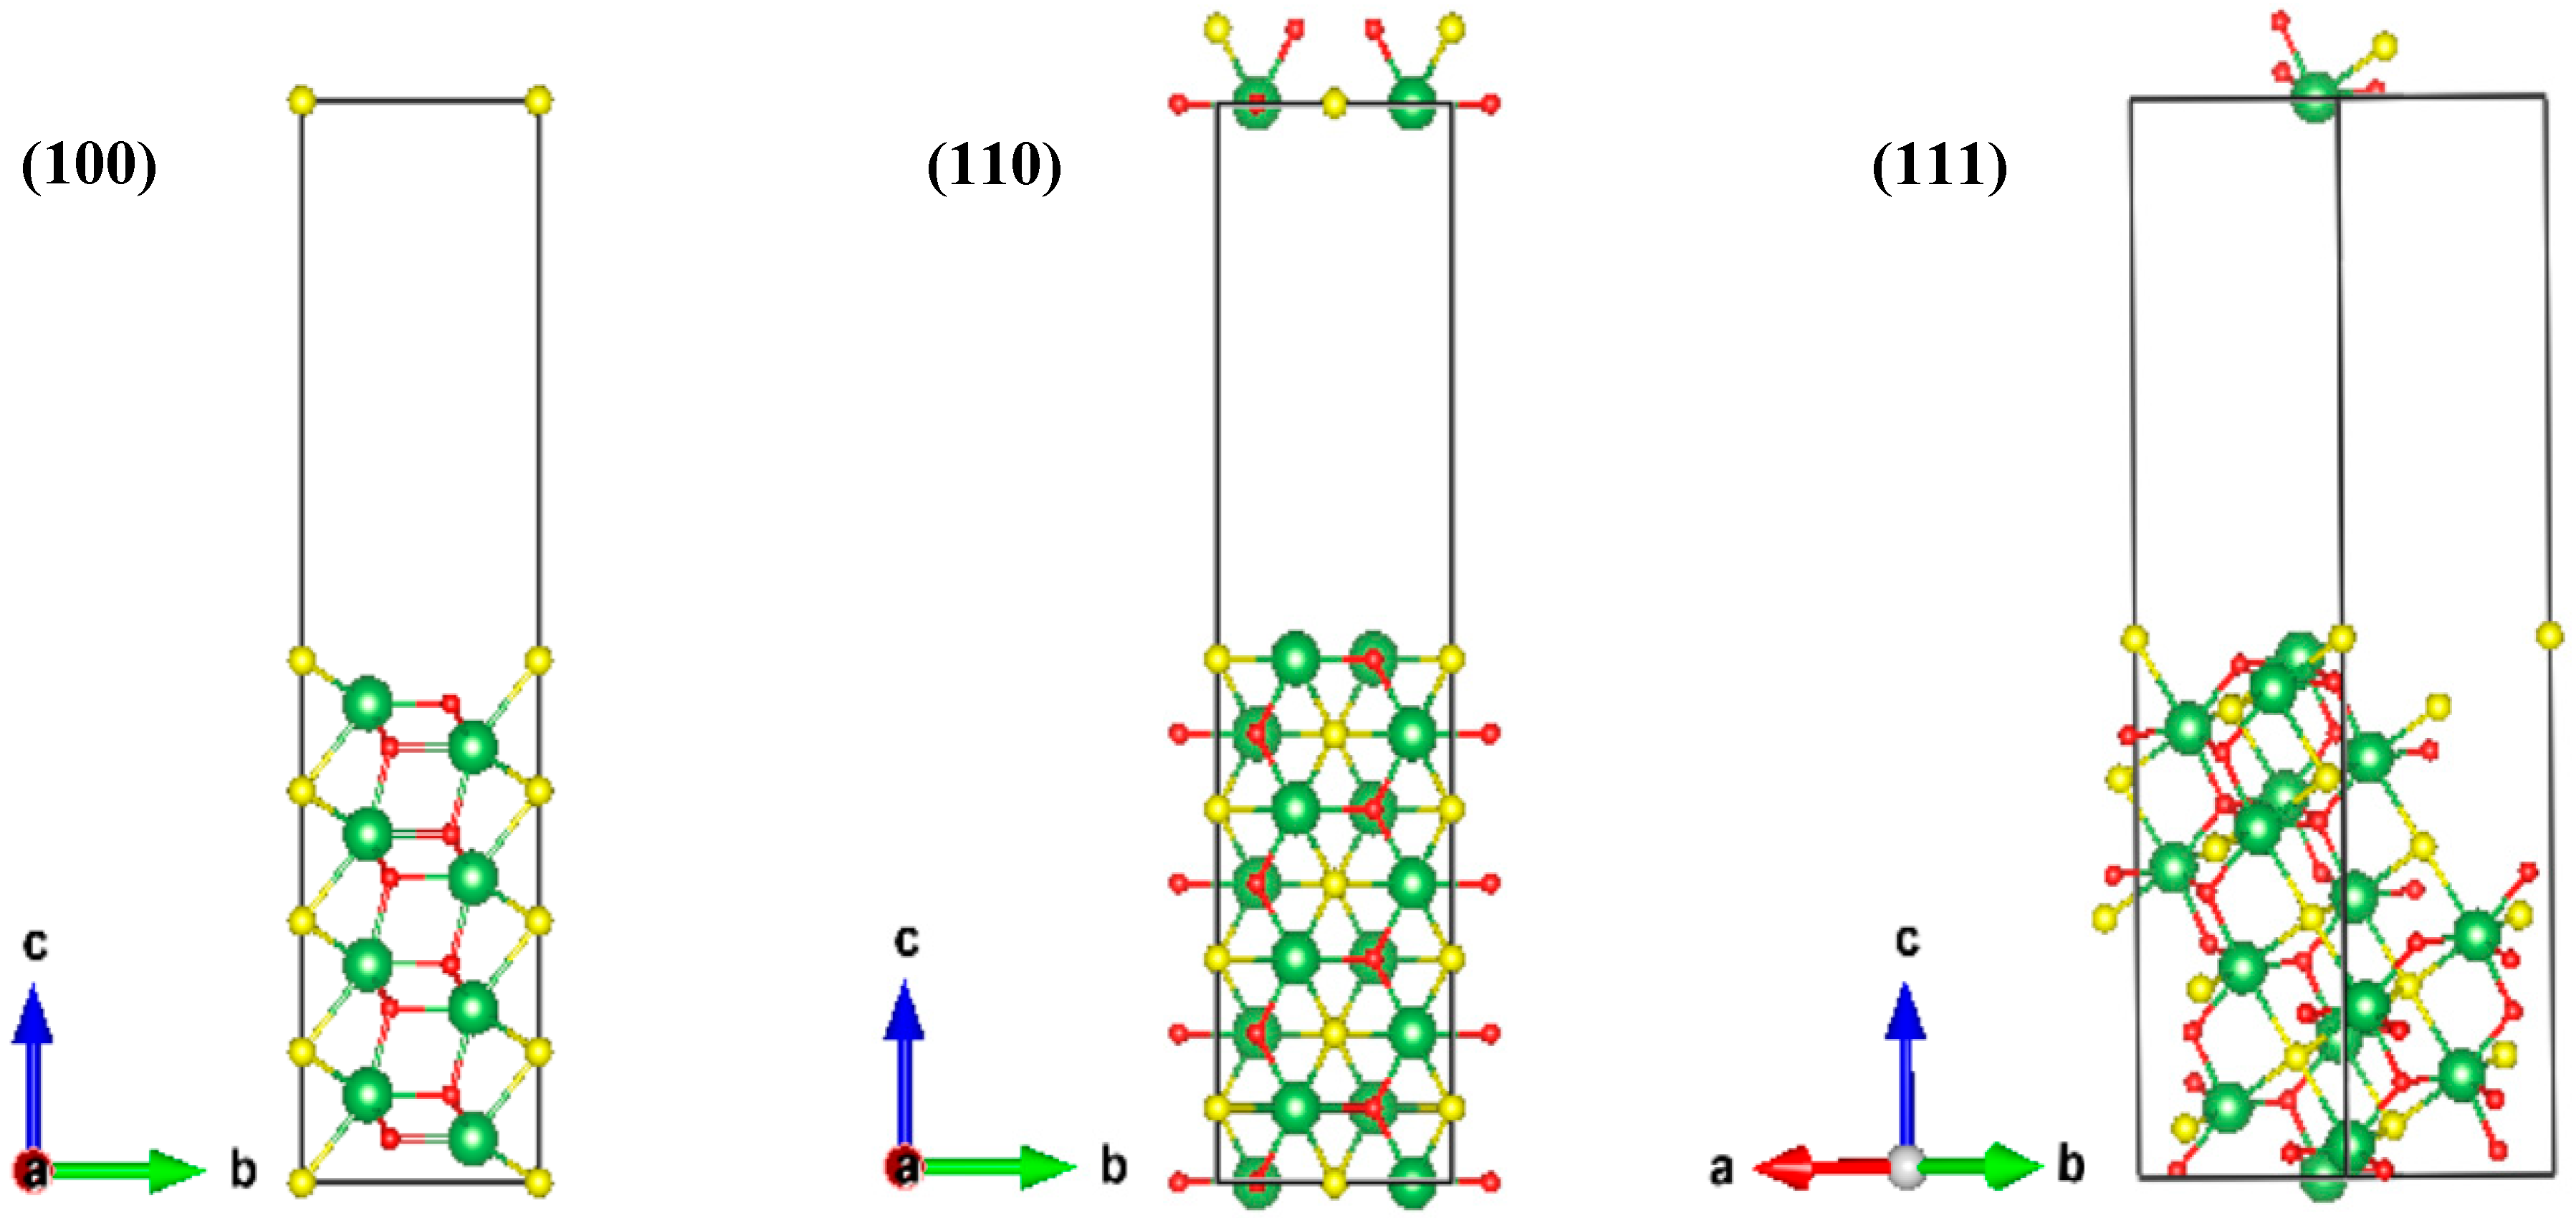
3.2.3. Theoretical Explanation for the Corrosion Behavior of Inclusions

Based on the above experimental results, first principle modeling was used to calculate work functions to theoretically explain the dissolution behavior of inclusions. Work function equals the difference between the vacuum static potential and Fermi energy, which is the lowest energy needed for an electron to escape from a material surface, and reflects the corrosion tendency of the material itself. In general, low-indexed crystallographic planes with relatively lower surface energy have a higher probability of becoming the exposed surface, which easily participates in the electrochemical corrosion process [41]. Therefore, the vacuum static potentials, Fermi energies, and work functions of the low-indexed crystallographic planes, such as the (100), (110), and (111) planes of the various inclusions, were calculated to evaluate the corrosion potential of these inclusions [41,56].
According to the statistical results of inclusions (Table 3), the inclusions can be divided into three groups, that is, metal sulfides M-Sx, metal oxides M-Ox, and metal oxygen sulfides M-OxSy, respectively. Considering the complexity for Ce to achieve the convergence during the characteristic calculation of Ce inclusions, La was chosen as the representation of the RE element for its stability [36]. Therefore, the existing form of M-Sx is represented by La2S3, and M-OxSy refers to La2O2S according to previous studies [33,37,41]. With respect to M-Ox, there are La2O3, LaAlO3, and La2Zr2O7 as the commonly existing forms for (Al,RE)-Ox and (Zr,RE)-Ox [33,36]. The slab models of three low-indexed crystallographic planes of the aforementioned inclusions were set up, for example, La2O2S was set to show the establishment of the model and presented in Figure 10. Finally, the results of vacuum static potentials, Fermi energies, and work functions of the aforementioned inclusions are displayed in Table 4, Table 5 and Table 6, respectively. The descending order of work functions were followed by: La2Zr2O7 > LaAlO3 > (La2O3 ≈ Fe ≈ La2O2S) > La2S3. This result explains the experimental results theoretically, suggesting that sulfides (oxygen sulfides) tend to dissolve preferentially in contrast to the Fe matrix, while oxides are not easy to dissolve, which is consistent with previous experimental studies [21,25,35,36,37].

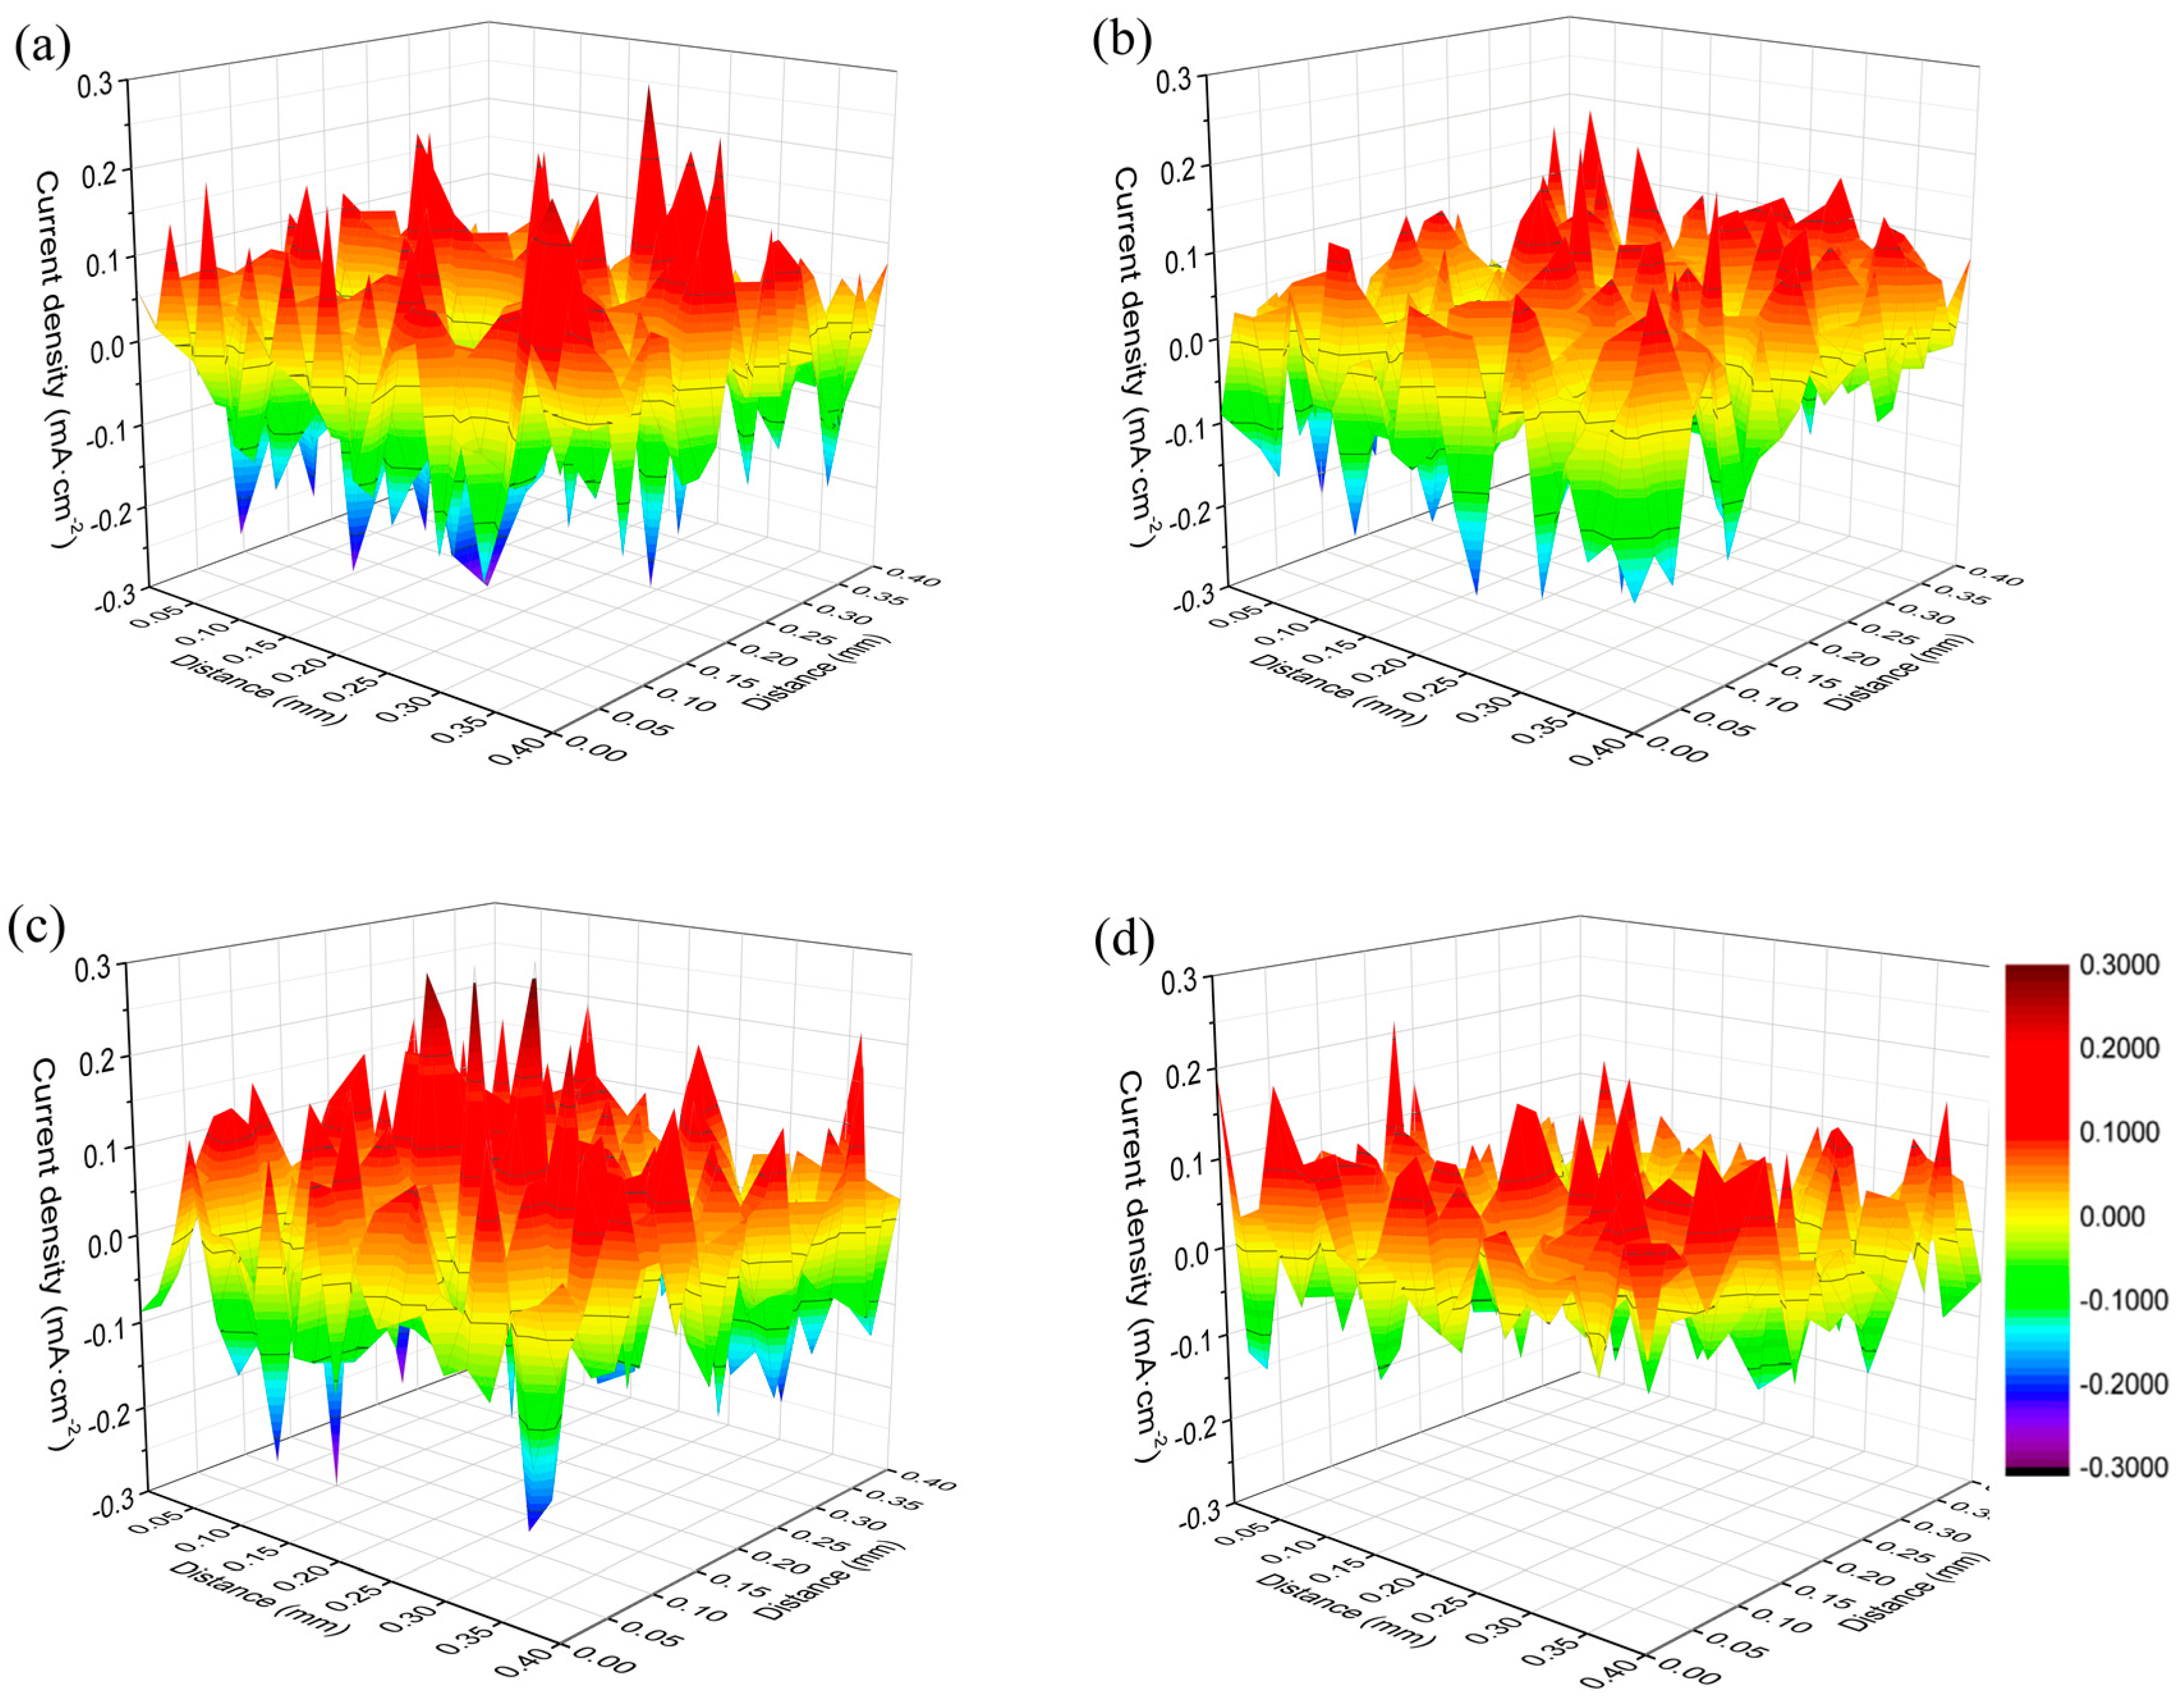
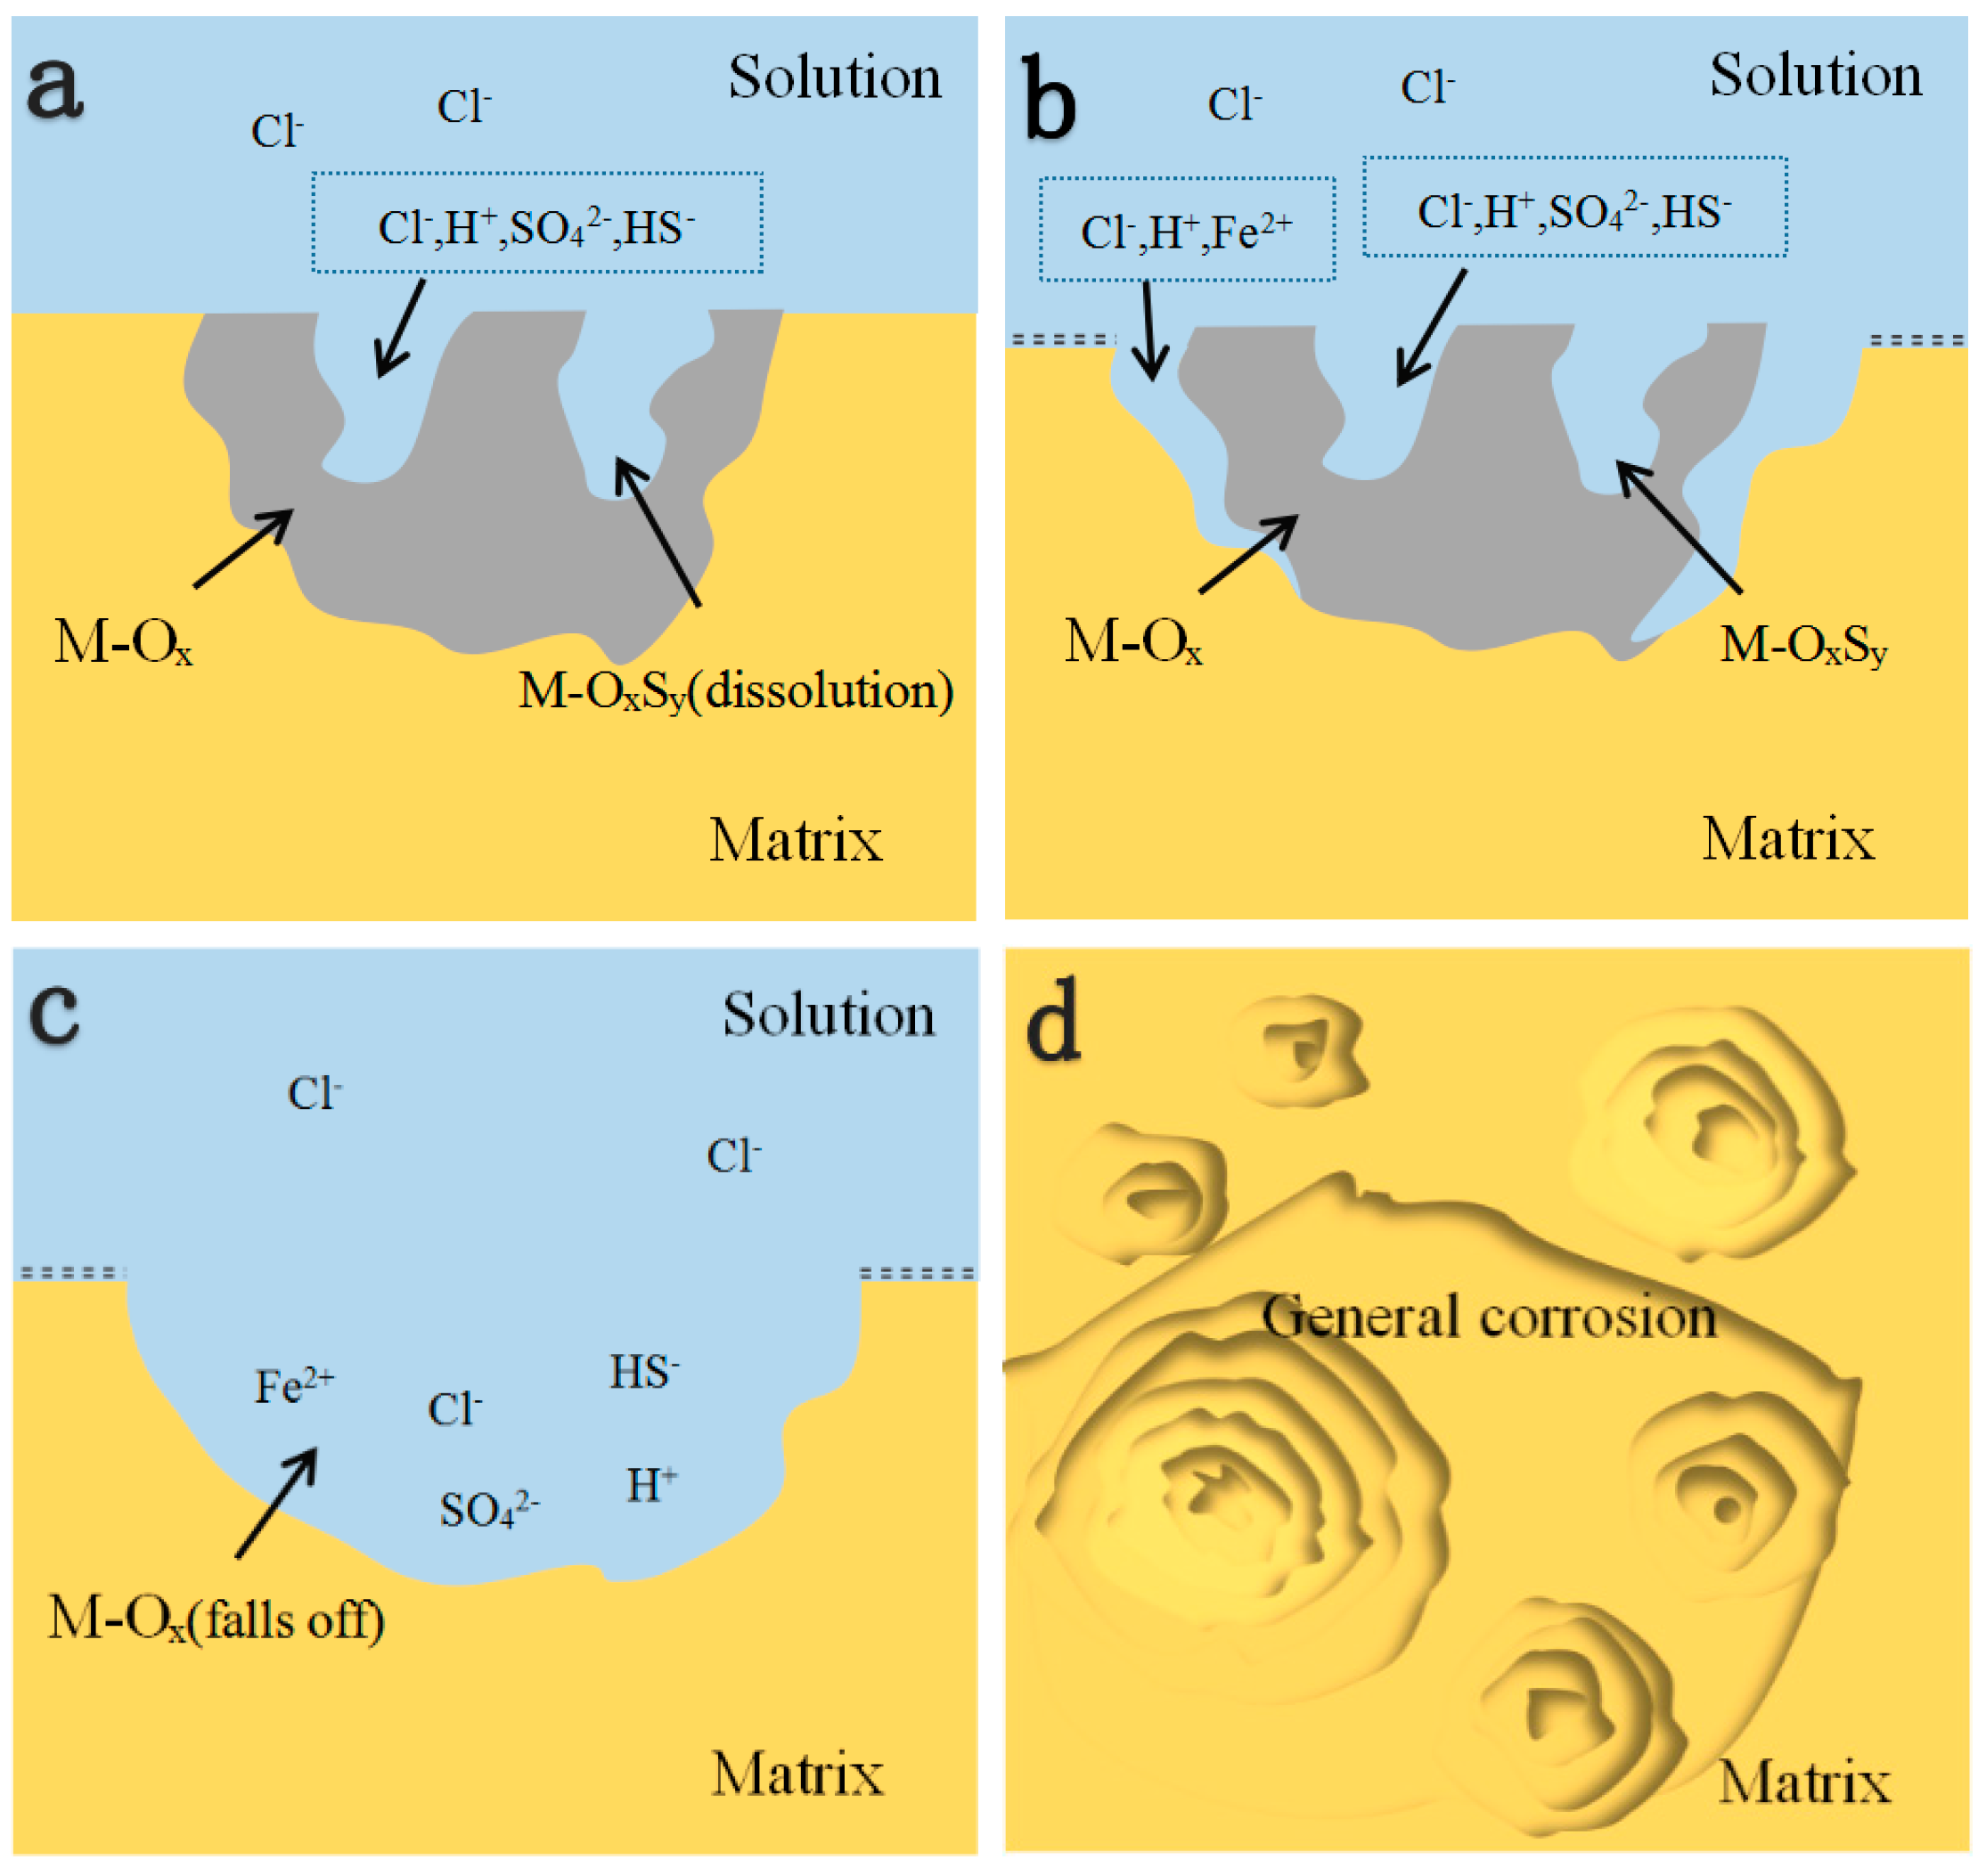
3.3. Effect of RE Inclusions on the Corrosion Propagation

SVET provides a more microscopic insight to characterize the in-situ microelectrochemical activities on the metal surface, which will establish an in-depth mechanistic understanding of the pitting propagation process [1]. In present work, SVET was employed to analyze the distribution of the current density for the two different deoxidized RE steels at the beginning of exposure (10 min) and after 1 h exposure in a 0.5 wt.% NaCl solution. The SVET mappings are shown in Figure 11. It can be seen that these maps show clear differences between the anodic and cathodic sites at the surface [47]. The more severe the current fluctuation, the greater the intensity of local corrosion. For the initial exposed specimens in Figure 11a,c, there were lots of ups and downs in the current on the metal surface, illustrating that the pitting of inclusions on the surface brought out great nonuniformity of the electrochemical activity. After corrosion for 1 h, the fluctuation tendency of the current evened out (Figure 11b,d), which suggested that the difference in the electrochemical activity among local sites was reduced. Therefore, it can be inferred that active sites of pitting nucleation accelerated the transverse propagation of corrosion, as illustrated in the SVET results that the electrochemical activity tended to be uniform. As a result, local corrosion spread to the whole surface as uniform corrosion in the later corrosion process.
A simple schematic diagram for the role of inclusions in the corrosion process is depicted in Figure 12. The corrosion process consists of a successive series of pitting nucleation (dissolution of sulfides, Figure 12a), pitting growth (fall off of inclusions as a whole, Figure 12b,c), and propagation of general corrosion (transverse spread of the active sites, Figure 12d). The corrosion process can be understood as follows. In the initial stage, the inclusions containing sulfur dissolved preferentially due to the lower values of work functions of M-Sx and M-OxSy. As the sulfides dissolved, the acid solution accumulated in the pit nucleus, promoting further dissolution of the surrounding metals or oxides [37]. Subsequently, the inclusion fell off as a whole due to the dissolution of the boundary between the Fe matrix and oxides [37]. Finally, with the propagation and transverse spread of pitting nuclei, the local corrosion tended to become uniform corrosion. From the theoretical and experimental perspective, the modeling of the first principle and the measurement of SVET provided more microscopic and more in-depth insight into the role of inclusions in the initial marine corrosion process of microalloyed steels.

4. Conclusions

The role of rare earth inclusions in the initial marine corrosion process of microalloyed steels could be summarized as follows:
(1) The corrosion of RE microalloyed steels originated from inclusions, which contained metal sulfides, metal oxides, and metal oxygen sulfides. The metal sulfides and/or metal oxygen sulfides tended to dissolve preferentially, whereas the metal oxides remained the same. With the dissolution of the Fe matrix–oxides interface, the inclusions fell off as a whole, which promoted pitting nucleation.
(2) The work functions of various kinds of inclusions were calculated by first principle modeling. The descending order of work functions were followed by: La2Zr2O7 > LaAlO3 > (La2O3 ≈ Fe ≈ La2O2S) > La2S3, which provided a qualitative explanation to the dissolution behaviors of inclusions. That is, inclusions containing sulfur tended to dissolve preferentially, whereas the oxides were not easy to dissolve.
(3) SVET provided a promising method to characterize the micro-electrochemical activities on the surface. The surface current distributions illustrated that the transverse propagation of corrosion promoted the formation of uniform corrosion throughout the surface.
(4) With respect to the effect of different deoxidization methods, the Ti/Zr deoxidized RE microalloyed steel presented better corrosion resistance than Al deoxidized steel, which could be ascribed to the lower size and quantity of RE sulfides in Ti/Zr deoxidized steel.

Author Contributions

Data curation and investigation, M.T.; resources, K.W.; conceptualization, supervision, and writing—original draft, J.L.; formal analysis and software, L.C.; methodology, X.Z.; writing—review and editing, Y.C.

Funding

The authors are grateful for the financial support from the National Natural Science Foundation of China (NO. 51601137 and 51601138) and the Excellent Young and Middle-Aged Science and Technology Innovation Team in Colleges and Universities of Hubei Province (NO. T201903)

Conflicts of Interest

The authors declare no conflict of interest.

References

  1. Liu, Z.; Li, X.; Cheng, Y. In-situ characterization of the electrochemistry of grain and grain boundary of an X70 steel in a near-neutral pH solution. Electrochem. Commun. 2010, 12, 936–938. [Google Scholar] [CrossRef]
  2. Kong, D.C.; Dong, C.F.; Ni, X.Q.; Zhang, L.; Yao, J.Z.; Man, C.; Cheng, X.Q.; Xiao, K.; Li, X.G. Mechanical properties and corrosion behavior of selective lasermelted 316L stainless steel after different heat treatment processes. J. Mater. Sci. Tech. 2019, 35, 1499–1507. [Google Scholar] [CrossRef]
  3. Zheng, S.; Wang, Y.; Zhang, B.; Zhu, Y.; Liu, C.; Hu, P.; Ma, X. Identification of MnCr2O4 nano-octahedron in catalysing pitting corrosion of austenitic stainless steels. Acta Mater. 2010, 58, 5070–5085. [Google Scholar] [CrossRef]
  4. Zheng, S.; Li, C.; Qi, Y.; Chen, L.; Chen, C. Mechanism of (Mg,Al,Ca)-oxide inclusion-induced pitting corrosion in 316L stainless steel exposed to sulphur environments containing chloride ion. Corros. Sci. 2013, 67, 20–31. [Google Scholar] [CrossRef]
  5. Liu, J.; Zhang, T.; Meng, G.; Shao, Y.; Wang, F. Effect of pitting nucleation on critical pitting temperature of 316L stainless steel by nitric acid passivation. Corros. Sci. 2015, 91, 232–244. [Google Scholar] [CrossRef]
  6. Liu, J.; Zhang, T.; Li, H.; Zhao, Y.; Wang, F.; Zhang, X.; Cheng, L.; Wu, K. Modeling of the Critical Pitting Temperature between the Laboratory-Scale Specimen and the Large-Scale Specimen. J. Electrochem. Soc. 2018, 165, C328–C333. [Google Scholar] [CrossRef] [Green Version]
  7. Ha, H.Y.; Park, C.J.; Kwon, H.S. Effects of non-metallic inclusions on the initiation of pitting corrosion in 11% Cr ferritic stainless steel examined by micro-droplet cell. Corros. Sci. 2007, 49, 1266–1275. [Google Scholar] [CrossRef]
  8. Wang, Y.; Cheng, G.; Wu, W.; Li, Y. Role of inclusions in the pitting initiation of pipeline steel and the effect of electron irradiation in SEM. Corros. Sci. 2018, 130, 252–260. [Google Scholar] [CrossRef]
  9. Avci, R.; Davis, B.; Wolfenden, M.; Beech, I.; Lucas, K.; Paul, D. Mechanism of MnS-mediated pit initiation and propagation in carbon steel in an anaerobic sulfidogenic media. Corros. Sci. 2013, 76, 267–274. [Google Scholar] [CrossRef]
  10. Liu, C.; Revilla, R.I.; Zhang, D.; Liu, Z.; Lutz, A.; Zhang, F.; Zhao, T.; Ma, H.; Li, X.; Terryn, H. Role of Al2O3 inclusions on the localized corrosion of Q460NH weathering steel in marine environment. Corros. Sci. 2018, 138, 96–104. [Google Scholar] [CrossRef]
  11. Wranglen, G. Pitting and sulphide inclusions in steel. Corros. Sci. 1974, 14, 331–349. [Google Scholar] [CrossRef]
  12. Stewart, J.; Williams, D. The initiation of pitting corrosion on austenitic stainless steel: On the role and importance of sulphide inclusions. Corros. Sci. 1992, 33, 457–474. [Google Scholar] [CrossRef]
  13. Suter, T.; Böhni, H. A new microelectrochemical method to study pit initiation on stainless steels. Electrochim. Acta 1997, 42, 3275–3280. [Google Scholar] [CrossRef]
  14. Wang, L.; Lin, Q.; Ji, J.; Lan, D. New study concerning development of application of rare earth metals in steels. J. Alloy. Compd. 2006, 408, 384–386. [Google Scholar] [CrossRef]
  15. Adabavazeh, Z.; Hwang, W.S.; Su, Y.H. Effect of adding cerium on microstructure and morphology of Ce-based inclusions formed in low-carbon steel. Sci. Rep. 2017, 7, 1–10. [Google Scholar] [CrossRef]
  16. Wang, L.M.; Lin, Q.; Yue, L.J.; Liu, L.; Guo, F.; Wang, F.M. Study of application of rare earth elements in advanced low alloy steels. J. Alloy. Compd. 2008, 451, 534–537. [Google Scholar] [CrossRef]
  17. Zhao, Y.Y.; Wang, J.F.; Zhou, S.Z.; Wang, X.D. Effects of rare earth addition on microstructure and mechanical properties of a Fe–15Mn–1.5Al–0.6C TWIP steel. Mater. Sci. Eng. A 2014, 608, 106–113. [Google Scholar] [CrossRef]
  18. Liu, X.; Yang, J.C.; Yang, L.; Gao, X.Z. Effect of Ce on inclusions and impact property of 2Cr13 stainless steel. J. Iron Steel Res. Int. 2010, 17, 59–64. [Google Scholar] [CrossRef]
  19. Jeon, S.H.; Hur, D.H.; Kim, H.J.; Park, Y.S. Effect of Ce addition on the precipitation of deleterious phases and the associated intergranular corrosion resistance of 27Cr–7Ni hyper duplex stainless steels. Corros. Sci. 2015, 90, 313–322. [Google Scholar] [CrossRef]
  20. Li, N.; Wang, Y.; Qiu, S.; Xiang, L. Effect of Ce on the Evolution of Recrystallization Texture in a 1.2%Si-0.4%Al Non-oriented Electrical Steel. ISIJ Int. 2016, 56, 1256–1261. [Google Scholar] [CrossRef] [Green Version]
  21. Kim, S.T.; Jeon, S.H.; Lee, I.S.; Park, Y.S. Effects of rare earth metals addition on the resistance to pitting corrosion of super duplex stainless steel—Part 1. Corros. Sci. 2010, 52, 1897–1904. [Google Scholar] [CrossRef]
  22. Yang, J.; Yu, H.; Wang, X. Effect of the Ce on behavior of corrosion resistance and mechanical properties of A36 plate steel for shipbuilding. In Recent Advances in Structural Integrity Analysis of the International Congress (APCF/SIF-2014); Elsevier BV: Baotou, China, 2014; pp. 380–385. [Google Scholar]
  23. Jeon, S.H.; Kim, S.T.; Lee, I.S.; Park, Y.S. Effects of sulfur addition on pitting corrosion and machinability behavior of super duplex stainless steel containing rare earth metals: Part 2. Corros. Sci. 2010, 52, 3537–3547. [Google Scholar] [CrossRef]
  24. Yang, C.Y.; Luan, Y.K.; Li, D.Z.; Li, Y.Y. Effects of rare earth elements on inclusions and impact toughness of high-carbon chromium bearing steel. J. Mater. Sci. Tech. 2019, 35, 1298–1308. [Google Scholar] [CrossRef]
  25. Yue, L.; Wang, L.; Han, J. Effects of rare earth on inclusions and corrosion resistance of 10PCuRE weathering steel. J. Rare Earths 2010, 28, 952–956. [Google Scholar] [CrossRef]
  26. Beranoagirre, A.; Urbikain, G.; Marticorena, R.; Bustillo, A.; De Lacalle, L.L. Sensitivity Analysis of Tool Wear in Drilling of Titanium Aluminides. Metals 2019, 9, 297. [Google Scholar] [CrossRef]
  27. Yoo, Y.H.; Choi, Y.S.; Kim, J.G.; Park, Y.S. Effects of Ce, La and Ba addition on the electrochemical behavior of super duplex stainless steels. Corros. Sci. 2010, 52, 1123–1129. [Google Scholar] [CrossRef]
  28. Li, T.; Qin, M. Effect of rare earth on the characterization of corrosion of low carbon steel in CSP. In Recent Advances in Structural Integrity Analysis of the International Congress (APCF/SIF-2014); Elsevier BV: Baotou, China, 2014; pp. 375–379. [Google Scholar]
  29. Rodríguez, J.S.; Hernández, F.S.; González, J.G. XRD and SEM studies of the layer of corrosion products for carbon steel in various different environments in the province of Las Palmas (The Canary Islands, Spain). Corros. Sci. 2002, 44, 2425–2438. [Google Scholar] [CrossRef]
  30. Yang, H.; Yang, K.; Zhang, B. Pitting corrosion resistance of La added 316L stainless steel in simulated body fluids. Mater. Lett. 2007, 61, 1154–1157. [Google Scholar] [CrossRef]
  31. Opiela, M.; Grajcar, A. Modification of Non-Metallic Inclusions by Rare-Earth Elements in Microalloyed Steels. Arch. Foundry Eng. 2012, 12, 129–134. [Google Scholar] [CrossRef]
  32. Zhu, T.; Huang, F.; Liu, J.; Hu, Q.; Li, W. Effects of inclusion on corrosion resistance of weathering steel in simulated industrial atmosphere. Anti-Corros. Methods Mater. 2016, 63, 490–498. [Google Scholar] [CrossRef]
  33. Ma, Q.; Wu, C.; Cheng, G.; Li, F. Characteristic and Formation Mechanism of Inclusions in 2205 Duplex Stainless Steel Containing Rare Earth Elements. Mater. Today: Proc. 2015, 2, S300–S305. [Google Scholar] [CrossRef]
  34. Wilson, W.G.; Kay, D.A.R.; Vahed, A. The use of thermodynamics and phase equilibria to predict the behavior of the rare earth elements in steel. JOM 1974, 26, 14–23. [Google Scholar] [CrossRef]
  35. Jeon, S.H.; Kim, S.T.; Choi, M.S.; Kim, J.S.; Kim, K.T.; Park, Y.S. Effects of cerium on the compositional variations in and around inclusions and the initiation and propagation of pitting corrosion in hyperduplex stainless steels. Corros. Sci. 2013, 75, 367–375. [Google Scholar] [CrossRef]
  36. Ha, H.; Park, C.; Kwon, H. Effects of misch metal on the formation of non-metallic inclusions and the associated resistance to pitting corrosion in 25% Cr duplex stainless steels. Scr. Mater. 2006, 55, 991–994. [Google Scholar] [CrossRef]
  37. Liu, C.; Revilla, R.I.; Liu, Z.; Zhang, D.; Li, X.; Terryn, H. Effect of inclusions modified by rare earth elements (Ce, La) on localized marine corrosion in Q460NH weathering steel. Corros. Sci. 2017, 129, 82–90. [Google Scholar] [CrossRef]
  38. Fruehan, R.J. The free energy of formation of Ce2O2S and the nonstoichiometry of cerium oxides. Met. Mater. Trans. A 1979, 10, 143–148. [Google Scholar] [CrossRef]
  39. Gao, J.; Fu, P.; Liu, H.; Li, D. Effects of Rare Earth on the Microstructure and Impact Toughness of H13 Steel. Metals 2015, 5, 383–394. [Google Scholar] [CrossRef] [Green Version]
  40. Liu, Y.; Wang, L.; Chou, K. Effect of cerium on the cleanliness of spring steel used in fastener of high-speed railway. J. Rare Earths 2014, 32, 759–766. [Google Scholar] [CrossRef]
  41. Zhang, X.; Wei, W.; Cheng, L.; Liu, J.; Wu, K.; Liu, M. Effects of niobium and rare earth elements on microstructure and initial marine corrosion behavior of low-alloy steels. Appl. Surf. Sci. 2019, 475, 83–93. [Google Scholar] [CrossRef]
  42. Waudby, P.E. Rare earth additions to steel. Int. Met. Rev. 1978, 2, 74–98. [Google Scholar]
  43. Kresse, G.; Hafner, J. Ab initio molecular dynamics for liquid metals. Phys. Rev. B 1993, 47, 558–561. [Google Scholar] [CrossRef] [PubMed]
  44. Kresse, G.; Furthmüller, J. Efficient iterative schemes for ab initio total-energy calculations using a plane-wave basis set. Phys. Rev. B 1996, 54, 11169–11186. [Google Scholar] [CrossRef] [PubMed]
  45. BlÖchl, P.E. Projector augmented-wave method. Phys. Rev. B 1994, 50, 17953–17979. [Google Scholar] [CrossRef] [PubMed] [Green Version]
  46. Perdew, J.P.; Burke, K.; Ernzerhof, M. Generalized Gradient Approximation Made Simple. Phys. Rev. Lett. 1996, 77, 3865–3868. [Google Scholar] [CrossRef] [PubMed] [Green Version]
  47. Moreto, J.; Marino, C.; Filho, W.B.; Rocha, L.; Fernandes, J.; Fernandes, J.C.S. SVET, SKP and EIS study of the corrosion behaviour of high strength Al and Al–Li alloys used in aircraft fabrication. Corros. Sci. 2014, 84, 30–41. [Google Scholar] [CrossRef]
  48. Tedim, J.; Bastos, A.; Kallip, S.; Zheludkevich, M.; Ferreira, M.; Zheludkevich, M. Corrosion protection of AA2024-T3 by LDH conversion films. Analysis of SVET results. Electrochim. Acta 2016, 210, 215–224. [Google Scholar] [CrossRef] [Green Version]
  49. Marques, A.; Simões, A. EIS and SVET assessment of corrosion resistance of thin Zn-55% Al-rich primers: Effect of immersion and of controlled deformation. Electrochim. Acta 2014, 148, 153–163. [Google Scholar] [CrossRef]
  50. Marques, A.G.; Simões, A.M. Influence of the rare-earth elements on the morphology of non-metallic inclusions in microalloyed steels. J. Achiev. Mater. Manuf. Eng. 2011, 47, 149–156. [Google Scholar]
  51. Ånmark, N.; Karasev, A.; Jönsson, P.G. The Effect of Different Non-Metallic Inclusions on the Machinability of Steels. Materials 2015, 8, 751–783. [Google Scholar] [CrossRef]
  52. Bin, W.; Bo, S. In Situ Observation of the Evolution of Intragranular Acicular Ferrite at Ce-Containing Inclusions in 16Mn Steel. Steel Res. Int. 2012, 83, 487–495. [Google Scholar] [CrossRef]
  53. Wilson, W.; Wells, R. Identifying inclusions in rare earth treated steels. Met. Prog. 1973, 107, 75–77. [Google Scholar]
  54. Wilson, W.G.; Heaslip, L.J.; Sommerville, I.D. Rare Earth Additions in Continuously Cast Steel. JOM 1985, 37, 36–41. [Google Scholar] [CrossRef]
  55. Liu, Q.; Yang, S.; Zhao, M.; Zhu, L.; Li, J. Pitting Corrosion of Steel Induced by Al2O3 Inclusions. Metals 2017, 7, 347. [Google Scholar] [CrossRef]
  56. Ma, H.; Chen, X.Q.; Li, R.; Wang, S.; Dong, J.; Ke, W. First-principles modeling of anisotropic anodic dissolution of metals and alloys in corrosive environments. Acta Mater. 2017, 130, 137–146. [Google Scholar] [CrossRef]
Figure 1. Potentiodynamic polarization curves of steels in a 3.5 wt.% NaCl solution.
Materials 12 03359 g001
Figure 2. Corrosion weight loss of steels in a 3.5 wt.% NaCl solution.
Materials 12 03359 g002
Figure 3. Corrosion morphologies of (a,b) Al deoxidized steel and (d,e) Ti/Zr deoxidized steel after immersion in 0.5 wt.% NaCl solution for a few minutes. (a,d) One hour, (b,e) 10 min, (c,f) EDS results of inclusions marked in b and e.
Materials 12 03359 g003
Figure 4. Number distributions of different kinds of inclusions in Al deoxidized steel and Ti/Zr deoxidized steel in a 30 mm2 scanning region.
Materials 12 03359 g004
Figure 5. Size distributions of different kinds of inclusions in Al deoxidized steel and Ti/Zr deoxidized steel in a 30 mm2 scanning region.
Materials 12 03359 g005
Figure 6. In-situ dissolution behavior of the inclusion in Al deoxidized steel after immersion in 0.5 wt.% NaCl for 10 min. (a) Before corrosion, (b) after corrosion.
Materials 12 03359 g006
Figure 7. In-situ dissolution behavior of the inclusion in Ti/Zr deoxidized steel after immersion in 0.5 wt.% NaCl for 10 min. (a) Before corrosion, (b) after corrosion.
Materials 12 03359 g007
Figure 8. In-situ dissolution behaviors of inclusions in (ad) Al deoxidized steel and (eh) Ti/Zr deoxidized steel after immersion in 0.5 wt.% NaCl for 10 min. (a1h1) Before corrosion, (a2h2) after corrosion. The inclusions marked Ι are M-OxSy (M-Sx) and ΙΙ are M-Ox, which are the same as those in Figure 6 and Figure 7.
Materials 12 03359 g008
Figure 9. In-situ dissolution morphologies of inclusions in (a,b) Al deoxidized steel and (c,d) Ti/Zr deoxidized steel after immersion in 0.5 wt.% NaCl solution for 30 min. The left is before corrosion, and the right is after corrosion.
Materials 12 03359 g009
Figure 10. Slab models of the three low-indexed crystallographic planes of La2O2S. Green balls refer to La elements, yellow balls refer to S elements, and red balls refer to O elements. The left is (100) crystallographic planes, the middle is (110) crystallographic planes and the right is (111) crystallographic planes of La2O2S. The arrows of a, b, and c refer to the three directions in rectangular coordinates.
Materials 12 03359 g010
Figure 11. SVET images of the local current distributions on the metal surface of (a,b) Al deoxidized steels and (c,d) Ti/Zr deoxidized steels after immersion in 0.5 wt.% NaCl solution for different times. (a,c) Immersed for 10 min, (b,d) immersed for 1 h.
Materials 12 03359 g011
Figure 12. Schematic diagram of the corrosion process of RE microalloyed steels from pitting nucleation (a), to pitting growth (b,c), further to the propagation of general corrosion (d).
Materials 12 03359 g012
Table 1. Chemical compositions of the RE microalloyed steels (wt.%).
SampleCSiMnPSOCuCrNiAlTiZrLaCeFe
Al deoxidized0.0530.230.130.0050.0030.0500.391.210.310.03--0.0020.003balance
Ti/Zr deoxidized0.0500.220.130.0050.0030.0650.431.220.33-0.0080.0080.0020.003
Table 2. Corrosion current density and corrosion potential obtained from potentiodynamic polarization curves in Figure 1.
Sampleicorr (×10−5 A·cm−2)Ecorr (V)
MeanDeviationMeanDeviation
Normal steel without RE5.31±0.46−0.122±0.013
Al deoxidized RE steel4.60±0.33−0.137±0.010
Ti/Zr deoxidized RE steel2.93±0.60−0.237±0.023
Table 3. Statistical distributions of inclusions in RE microalloyed steels.
SampleTypesDensity (mm−2)Average Size (µm2)
IndividualOverallIndividualOverall
Al deoxidizedRE-Sx20.81100.293.364.02
RE-Ox14.953.81
(Al,RE)-Ox28.314.15
RE-OxSy18.343.98
(Al,RE)-OxSy17.884.78
Ti/Zr deoxidizedRE-Sx2.9760.045.856.11
RE-Ox3.525.13
(Zr,RE)-Ox40.385.83
RE-OxSy3.756.17
(Zr,RE)-OxSy9.427.57
Table 4. Vacuum static potentials of inclusions and the Fe matrix at three different low-indexed crystallographic planes (eV).
Crystallographic PlaneLa2S3La2O3LaAlO3La2Zr2O7La2O2SFe
(100)5.207.327.066.706.145.64
(110)5.207.877.376.075.556.79
(111)5.485.775.966.065.594.02
Table 5. Fermi energies of inclusions and the Fe matrix at three different low-indexed crystallographic planes (eV).
Crystallographic PlaneLa2S3La2O3LaAlO3La2Zr2O7La2O2SFe
(100)2.072.462.550.12−0.211.10
(110)1.502.911.820.381.801.85
(111)1.272.172.23−0.631.87−0.30
Table 6. Work functions of inclusions and the Fe matrix at three different low-indexed crystallographic planes (eV).
Crystallographic PlaneLa2S3La2O3LaAlO3La2Zr2O7La2O2SFe
(100)3.134.864.516.586.354.54
(110)3.704.965.325.693.755.12
(111)4.213.603.736.703.724.32
Average3.684.474.526.324.614.66

