2. Materials and Methods
A series of Rb
2Bi(PO
4)(MoO
4):Eu
3+ samples of (where Eu
3+ concentration was 0%, 1%, 5%, 10%, 25%, 50%, 75%, and 100% with respect to Bi
3+) was synthesized by solid-state reaction method. The reagents, namely, MoO
3 (99+%), Rb
2CO
3 (99+%) and Bi
2O
3 (99.9%) were purchased from Acros Organics (Geel, Belgium); Eu
2O
3 (99.99%) was purchased from Tailorlux (Münster, Germany), and NH
4H
2PO
4 (99%) was purchased from Reachem Slovakia, (Bratislava, Slovakia). These reagents were weighed and mixed in stoichiometric amounts (accurate weight of reagents are given in
Table S1). The powders were homogenized in an agate mortar with small amount of acetone as a grinding media. The mixture of reagents was poured to the porcelain crucible and sintered at 600 °C for 12 h in air three times with intermediate grinding of the product.
0.36, 0.53, and 0.80 mm thick ceramic disks were prepared by applying 30 kN force (ø 8 mm disk) on the Rb2Eu(PO4)(MoO4) phosphor powder for 3 min and the obtained pellets were additionally annealed in air at 600 °C for 4 h.
The powder XRD patterns were collected in the range of 5° ≤ 2θ ≤ 80° employing Cu Kα radiation from 9 kW rotating anode X-ray tube on a Rigaku SmartLab diffractometer (Rigaku, Tokyo, Japan) working in Bragg-Brentano focusing geometry. The step width was 0.01° and scan speed was 1°/min. Scintillation detector SC-70 (Rigaku, Tokyo, Japan) together with bent graphite monochromator (Rigaku, Tokyo, Japan) for diffracted beam was used for the measurements.
SEM images of the prepared phosphors and ceramics were taken by a field-emission scanning electron microscope Hitachi SU-70 (Hitachi, Tokyo, Japan).
IR measurements were performed on a Bruker Alpha ATR FTIR spectrometer (Bruker, Ettlingen, Germany). Data were recorded in the range from 3000 to 400 cm−1. The spectral resolution was 4 cm−1.
Edinburgh Instruments FLS980 spectrometer (Edinburgh Instruments, Livingston, UK) was used to measure reflection spectra. The spectrometer possessed a 450 W ozone free xenon arc lamp, a cooled (−20 °C) SPC photomultiplier (Hamamatsu R928P, Hamamatsu Photonics K.K., Hamamatsu, Japan) and Teflon coated integration sphere. The reflectance standard was BaSO4.
Edinburgh Instruments FLS980 spectrometer was used to record excitation and emission spectra of the synthesized samples. This spectrometer was equipped with double grating Czerny-Turner excitation and emission monochromators, a 450 W ozone-free xenon arc lamp, and cooled (−20 °C) SPC photomultiplier (Hamamatsu R928P). The recorded PL emission spectra were corrected for instrument response by a correction file provided by Edinburgh Instruments (Livingston, UK). A reference detector (Edinburgh Instruments, Livingston, UK) was used to correct the excitation spectra.
For thermal quenching (TQ) measurements a cryostat “MicrostatN” (Oxford Instruments, Abingdon, UK) was used with above-described spectrometer. The sample was cooled by liquid nitrogen. The temperature-dependent emission spectra were measured at 77 K and at 100–500 K in 50 K intervals. The stabilization time for each temperature was 120 s and temperature tolerance was ±5 K. Dried nitrogen was flushed over the cryostat window during the measurements in order to prevent water condensation at low temperatures.
μ-flash lamp was used as an excitation source for PL decay investigation. Samples were excited at 265, 393.5, and 464.5 nm while emission was monitored at 615 nm. The pulse repetition rate was 25 Hz.
Quantum efficiency (QE) values were obtained by measuring emission spectrum of BaSO
4 sample (99% Sigma-Aldrich) in integration sphere coated with Teflon. Samples were excited at 260, 393.5, and 464.5 nm. The step width and integration time was 0.5 nm and 0.4 s, respectively. Measurements were repeated three times for each phosphor sample. The QE values were calculated from equation 1 [
17]:
Here is integrated emission intensity of the phosphor sample and is integrated emission intensity of BaSO4. and is integrated reflectance of the phosphor sample and BaSO4, respectively. Nem is the number of emitted photons and Nabs—absorbed photons.
All measurements were performed at room temperature and ambient pressure in air unless mentioned otherwise.
3. Results and Discussion
The Rb
2Bi(PO
4)(MoO
4) compound (a = 7.0671 Å, b = 12.5150 Å, c = 20.441 Å) [
23] is isostructural with its potassium counterpart (K
2Bi(PO
4)(MoO
4)) (a = 7.0296 Å, b = 12.4845 Å, c = 19.7146 Å) [
17] and adopts a body centered orthorhombic Bravais lattice with the space group of
Ibca (#73) (Z = 8). The crystal structure of Rb
2Bi(PO
4)(MoO
4) compound possesses a layered structure, which is built from [Bi(PO
4)(MoO
4)]
2- layers, which and are interconnected by Rb
+ cations similar as in K
2Bi(PO
4)(MoO
4) compound reported by Zatovsky et al. [
24]. The graphical representation of Rb
2Bi(PO
4)(MoO
4) unit cell is given in
Figure S1.
It turned out that three annealing steps were necessary in order to obtain single phase Rb
2Bi(PO
4)(MoO
4):Eu
3+ compounds. The powder XRD patterns of Rb
2Eu(PO
4)(MoO
4) specimen after each annealing step are given in
Figure S2. It is obvious that the peaks belonging to the phases other than Rb
2Bi(PO
4)(MoO
4) disappear only after the third heat treatment. Moreover,
Figure S2 also demonstrates that single phase compounds are obtained despite the increasing Eu
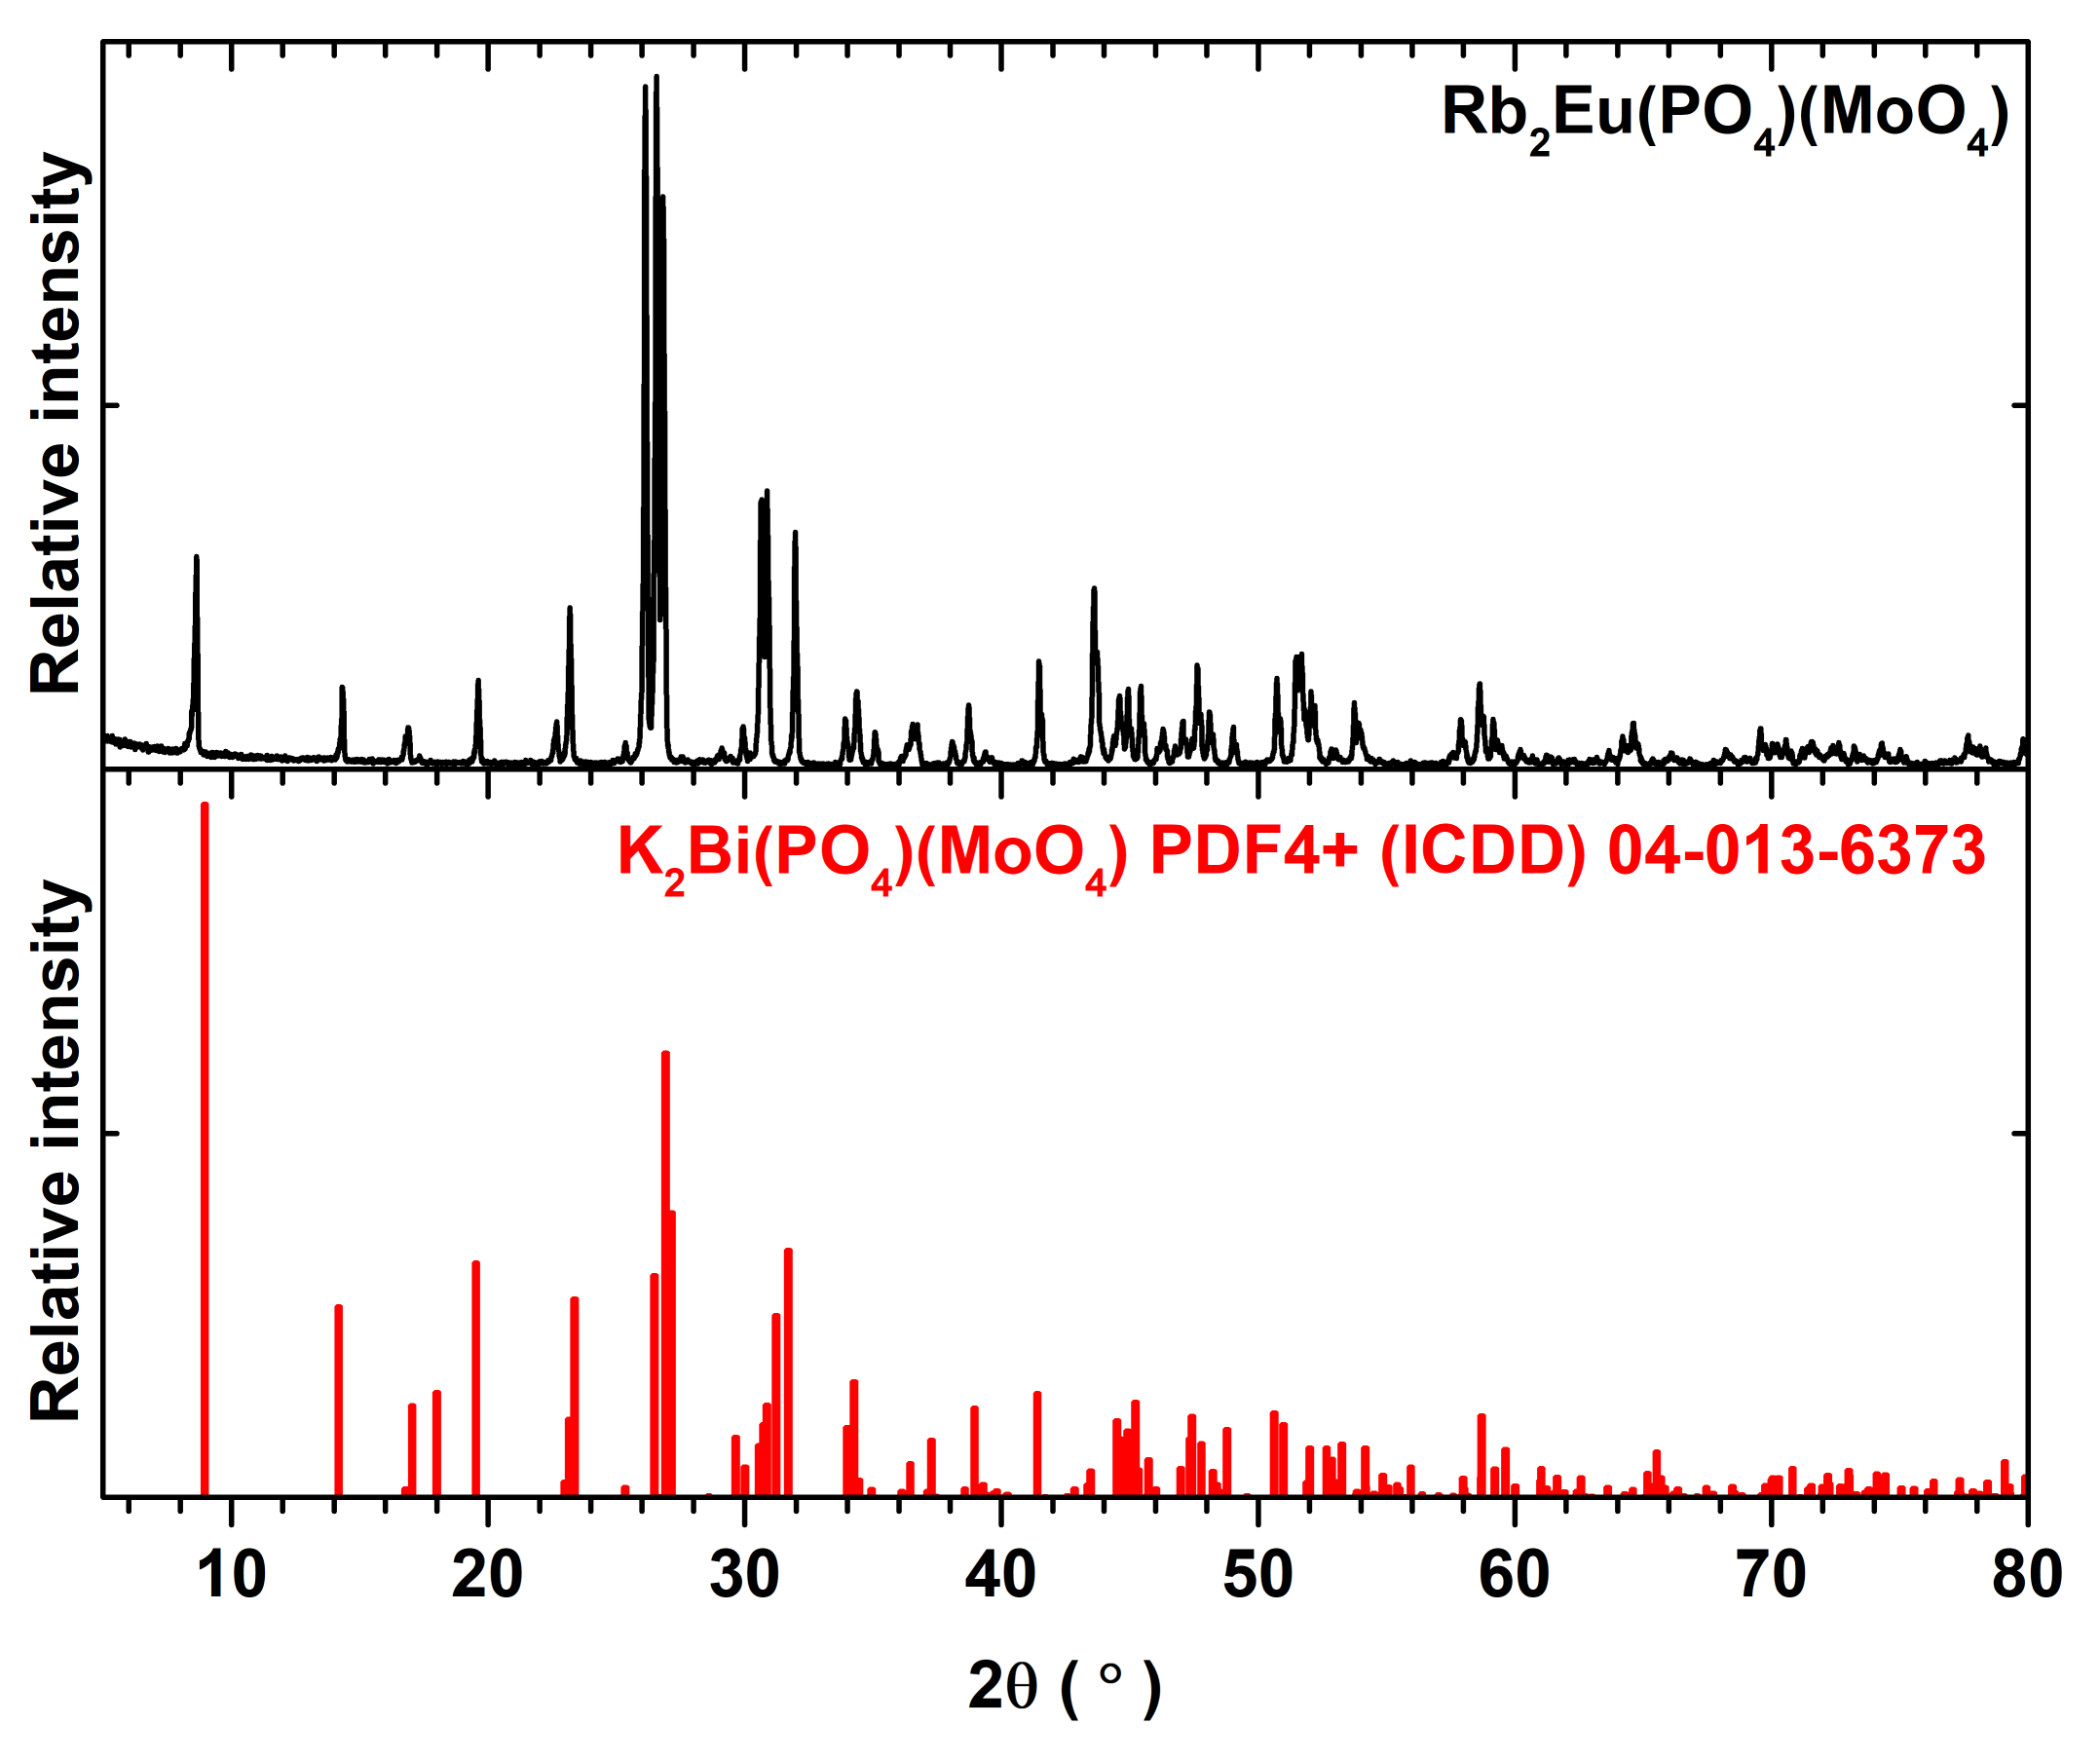
3+ amount in the synthesized materials. The representative powder XRD pattern of Rb
2Eu(PO
4)(MoO
4) compound is given in
Figure 1. All the peaks match well with the reference pattern of K
2Bi(PO
4)(MoO
4). The only difference in these XRD patterns is the slight shift of peaks for Rb
2Eu(PO
4)(MoO
4) compound to the lower 2θ values. On the other hand, this can be expected since the ionic radius of potassium ions is slightly smaller than for rubidium ions, 1.51 and 1.61 Å for CN = 8, respectively [
25].
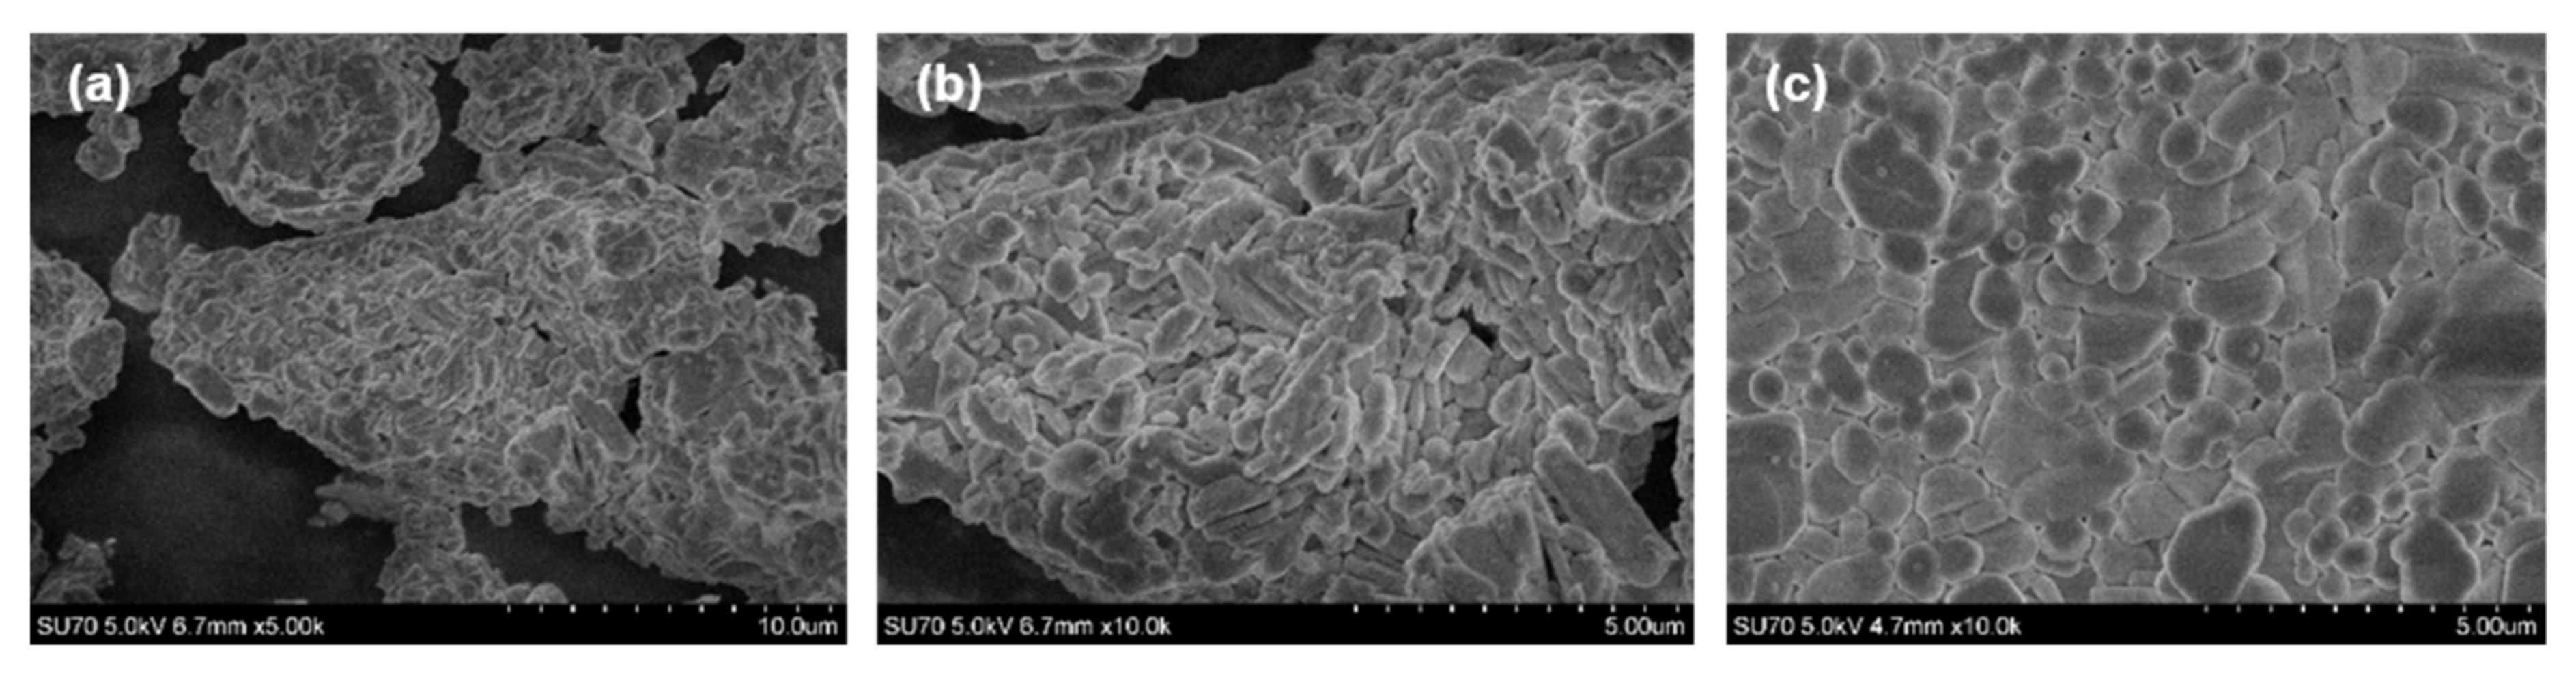
The morphological features of all prepared materials were investigated by taking SEM images. No differences neither in particle size nor shape were observed with the increase of Eu
3+ concentration in synthesized compounds. The representative SEM images of Rb
2Bi(PO
4)(MoO
4):50%Eu
3+ specimen are given in
Figure 2a,b. The figure demonstrates that powder consists of agglomerates, which are formed from smaller crystallites with broad size range. The shape of these crystallites is mostly rod-like.
Figure 2c depicts the SEM image of the surface of Rb
2Eu(PO
4)(MoO
4) ceramic disk. The ceramic disk surface is formed from crystallites of various sizes. These crystallites are well grown together and form an even surface of the ceramic disk.
The IR spectra of undoped Rb
2Bi(PO
4)(MoO
4) sample and specimens doped with 25%, 50%, 75% and 100% Eu
3+ are shown in
Figure S3. The given IR spectra contain several absorption bands in the range of 400–1100 cm
−1. The three sharp absorption bands in the range of 650–450 cm
−1 can be assigned to the PO
4 bending vibrations. Strong absorption band at 900–700 cm
−1 originates from the Mo-O stretching vibrations in MoO
4 tetrahedrons, whereas strong absorption bands at 950 and 1050 cm
−1 can be assigned to symmetric and asymmetric vibrations of PO
4 tetrahedrons, respectively [
24].
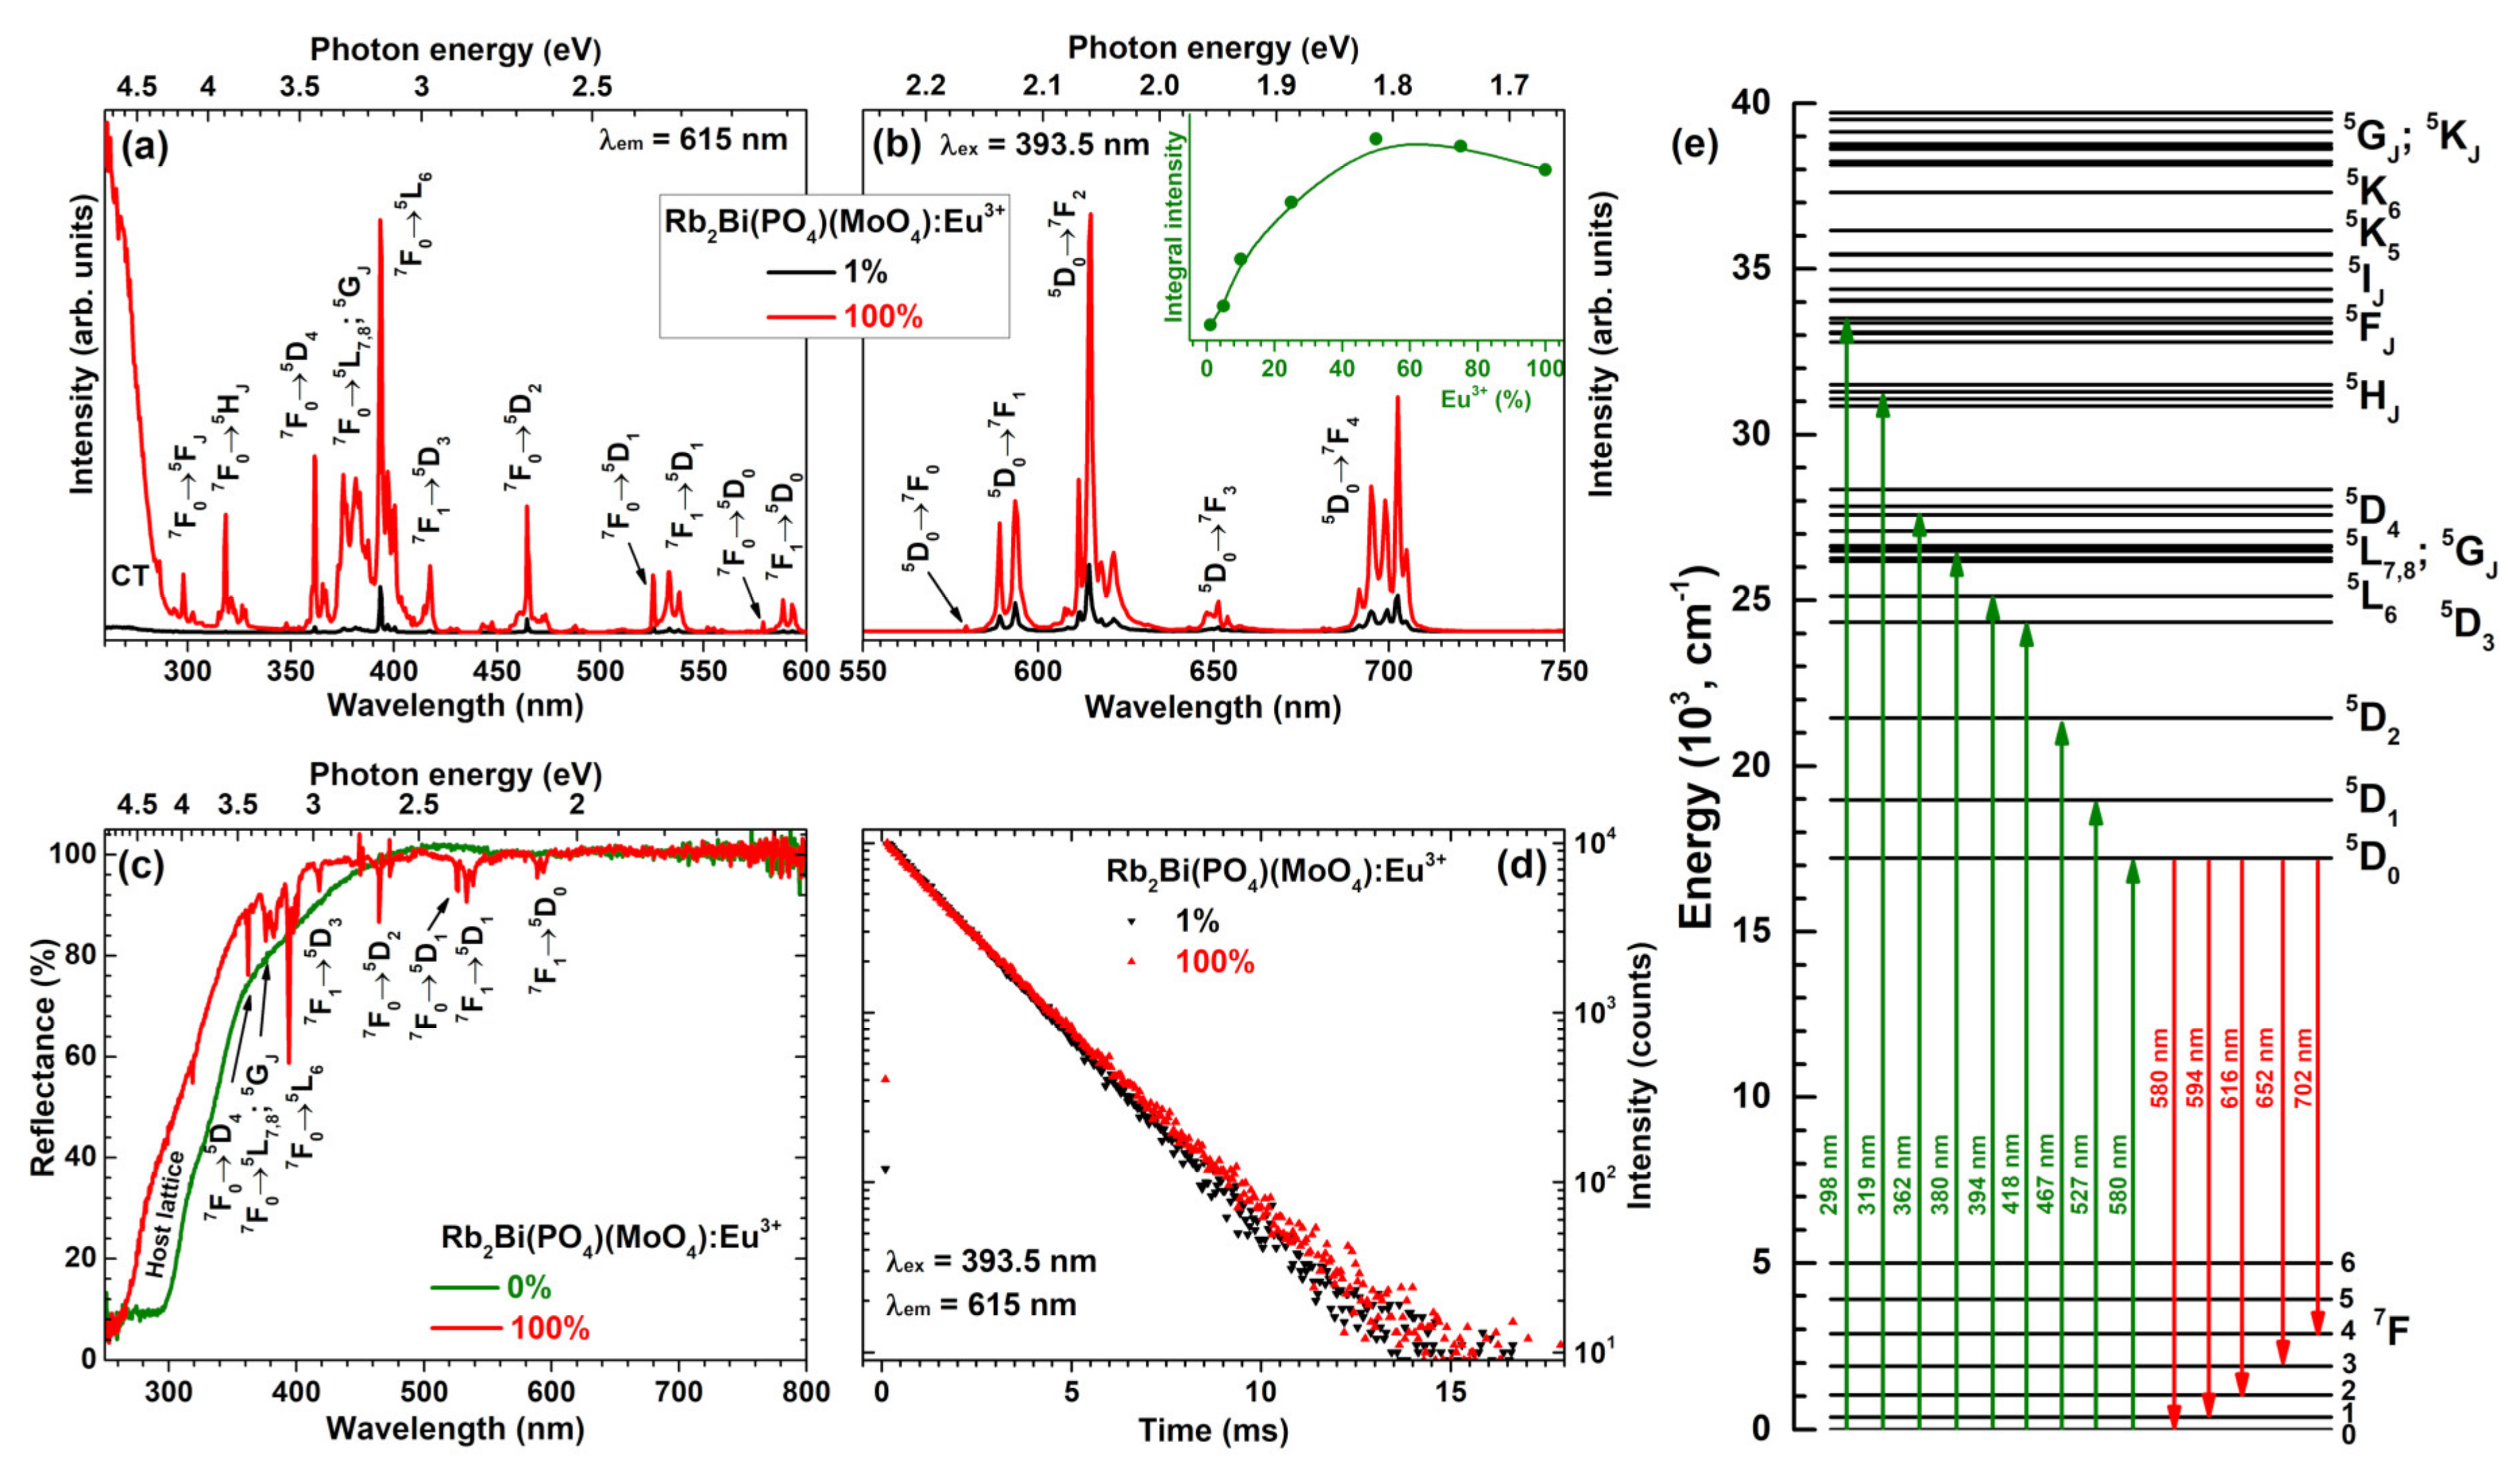
Figure 3a depicts excitation spectra of Rb
2Bi(PO
4)(MoO
4) samples doped with 1% and 100% Eu
3+ ions. The spectra consist of a broad band in the range of 250–290 nm and several sets of lines in the range of 290–600 nm. The former can be assigned to the charge transfer transition from O
2− ions to Eu
3+ ions, whereas the latter is assigned to the intraconfigurational transitions within Eu
3+ f orbital ([Xe]4f
6 → [Xe]4f
6). Each set of lines in excitation spectra can be attributed to the specific transition, i.e.,
7F
0 →
5F
J (~298 nm),
7F
0 →
5H
J (~319 nm),
7F
0 →
5D
4 (~362 nm),
7F
0 →
5L
7,8;
5G
J (~380 nm),
7F
0 →
5L
6 (~394 nm),
7F
1 →
5D
3 (~418 nm),
7F
0 →
5D
2 (~467 nm),
7F
0 →
5D
1 (~527 nm),
7F
1 →
5D
1 (~534 nm),
7F
0 →
5D
0 (~580 nm), and
7F
1 →
5D
0 (~590 nm) [
26,
27]. The lines in excitation spectra lying in the range of 360–400 nm are of great interest, since they overlap well with the emission spectra of the most efficient near-UV LEDs [
15].
Emission spectra of Rb
2Bi(PO
4)(MoO
4) specimens doped with 1% and 100% Eu
3+ ions are given in
Figure 3b. These spectra contain five sets of emission lines, which can be assigned to Eu
3+ electronic transitions from the lowest excited
5D
0 level to
7F
0 (~580 nm),
7F
1 (~594 nm),
7F
2 (~615 nm),
7F
3 (~652 nm), and
7F
4 (~702 nm) [
27]. The weakest emission was observed for the
5D
0 →
7F
0 transition since the
J = 0 ↔
J′ = 0 transitions are always forbidden [
28,
29,
30]. This transition can be observed because the local site of Eu
3+ ions possesses C
2 symmetry. The strongest emission of the prepared samples was observed for the electric dipole (ED)
5D
0 →
7F
2 transition at around 615 nm. The emission lines originating from the magnetic dipole (MD)
5D
0 →
7F
1 transition was more than twice less intensive. This observation indicates that Eu
3+ ions occupy non-centrosymmetric lattice site in the Rb
2Bi(PO
4)(MoO
4) host matrix. On the other hand, the intensity difference between MD and ED transitions is rather low if compared to some other molybdate host matrices doped with Eu
3+ ions, for instance, Li
3Ba
2La
3(MoO
4):Eu
3+ [
31], Tb
2Mo
3O
12:Eu
3+ [
18], La
2MoO
6:Eu
3+ [
32], LiEuMo
2O
8 [
33], La
2Mo
2O
9:Eu
3+ [
34] and so on. The rather small difference between ED and MD transitions of Eu
3+ ions in Rb
2Bi(PO
4)(MoO
4) host matrix can be assigned to relatively symmetric dodecahedral BiO
8 site, which is occupied by Eu
3+. Another interesting feature of the Rb
2Bi(PO
4)(MoO
4):Eu
3+ emission spectra is very intensive and finely split
5D
0 →
7F
4 transition. The intensity of
5D
0 →
7F
4 transition usually is very low in Eu
3+ doped phosphors and there are very few examples reported in the literature where this transition dominates the emission spectra. Some of these matrices are garnet structure compounds: Y
3(Al,Ga)
5O
12:Eu
3+ [
35]; orthophosphates: (Lu,Y,Gd,La)PO
4:Eu
3+ [
35], BiPO
4:Eu
3+ [
36]; borates: GdB
5O
9:Eu
3+ [
37]; molybdates: Eu
2Mo
4O
15 [
38], silicates: Na
2ZnSiO
4:Eu
3+ [
39], Ca
2Ga
2SiO
7:Eu
3+ [
40]; aluminates: GdSr
2AlO
5:Eu
3+ [
41]; niobates: K
2LaNb
5O
15:Eu
3+ [
42]; and even exotic uranyl phosphates: (Y,Eu,La)(UO
2)
3(PO
4)
2O(OH)·6H
2O [
43]. The inset in
Figure 3b shows integrated emission intensity as a function of Eu
3+ concentration. It can be concluded, that the strongest emission is obtained for sample doped with 50% Eu
3+.
The reflection spectra of undoped Rb
2Bi(PO
4)(MoO
4) and its fully Eu
3+ substituted counterpart Rb
2Eu(PO
4)(MoO
4) are given in
Figure 3c. The powder colour of undoped Rb
2Bi(PO
4)(MoO
4) was yellowish what is in good agreement with reflection spectra. The host material slightly absorbs the violet-blue radiation, hence, the yellowish tint of the powder. The fully Eu
3+ substituted compound, in turn, was white. There are also several sets of absorption lines originating from the intraconfigurational transitions of Eu
3+ ions that very well match the lines observed in excitation spectra (
Figure 3b). The simplified energy level diagram of Eu
3+ ions is given in
Figure 3e with the most intensive transitions marked.
Figure 3d displays PL decay curves of Rb
2Bi(PO
4)(MoO
4) specimens doped with 1% and 100% Eu
3+. Samples were excited at 393.5 nm whereas the emission was monitored at 615 nm. Both PL decay curves are linear, indicating that there is only one mechanism of the excited
5D
0 level depopulation. Besides, both PL decay curves are also nearly the same indicating similar PL lifetime values. This turned out to be true when the single exponential decay function was used to extract the PL lifetime values from the experimental data:
Here
I(t) is PL intensity at time
t,
A is background,
B is constant, and
τ is PL lifetime. The fitting results are given in
Table S2. The PL lifetime values increased from 1827 μs (for 1% Eu
3+) to 2044 μs (for 50% Eu
3+) and then again decreased to 1932 μs (for 100% Eu
3+). This goes hand in hand with the emission integral data, which showed highest intensity for 50% Eu
3+ doped sample. Therefore, it can be concluded that concentration quenching in this host matrix starts when Eu
3+ concentration exceeds 50%.
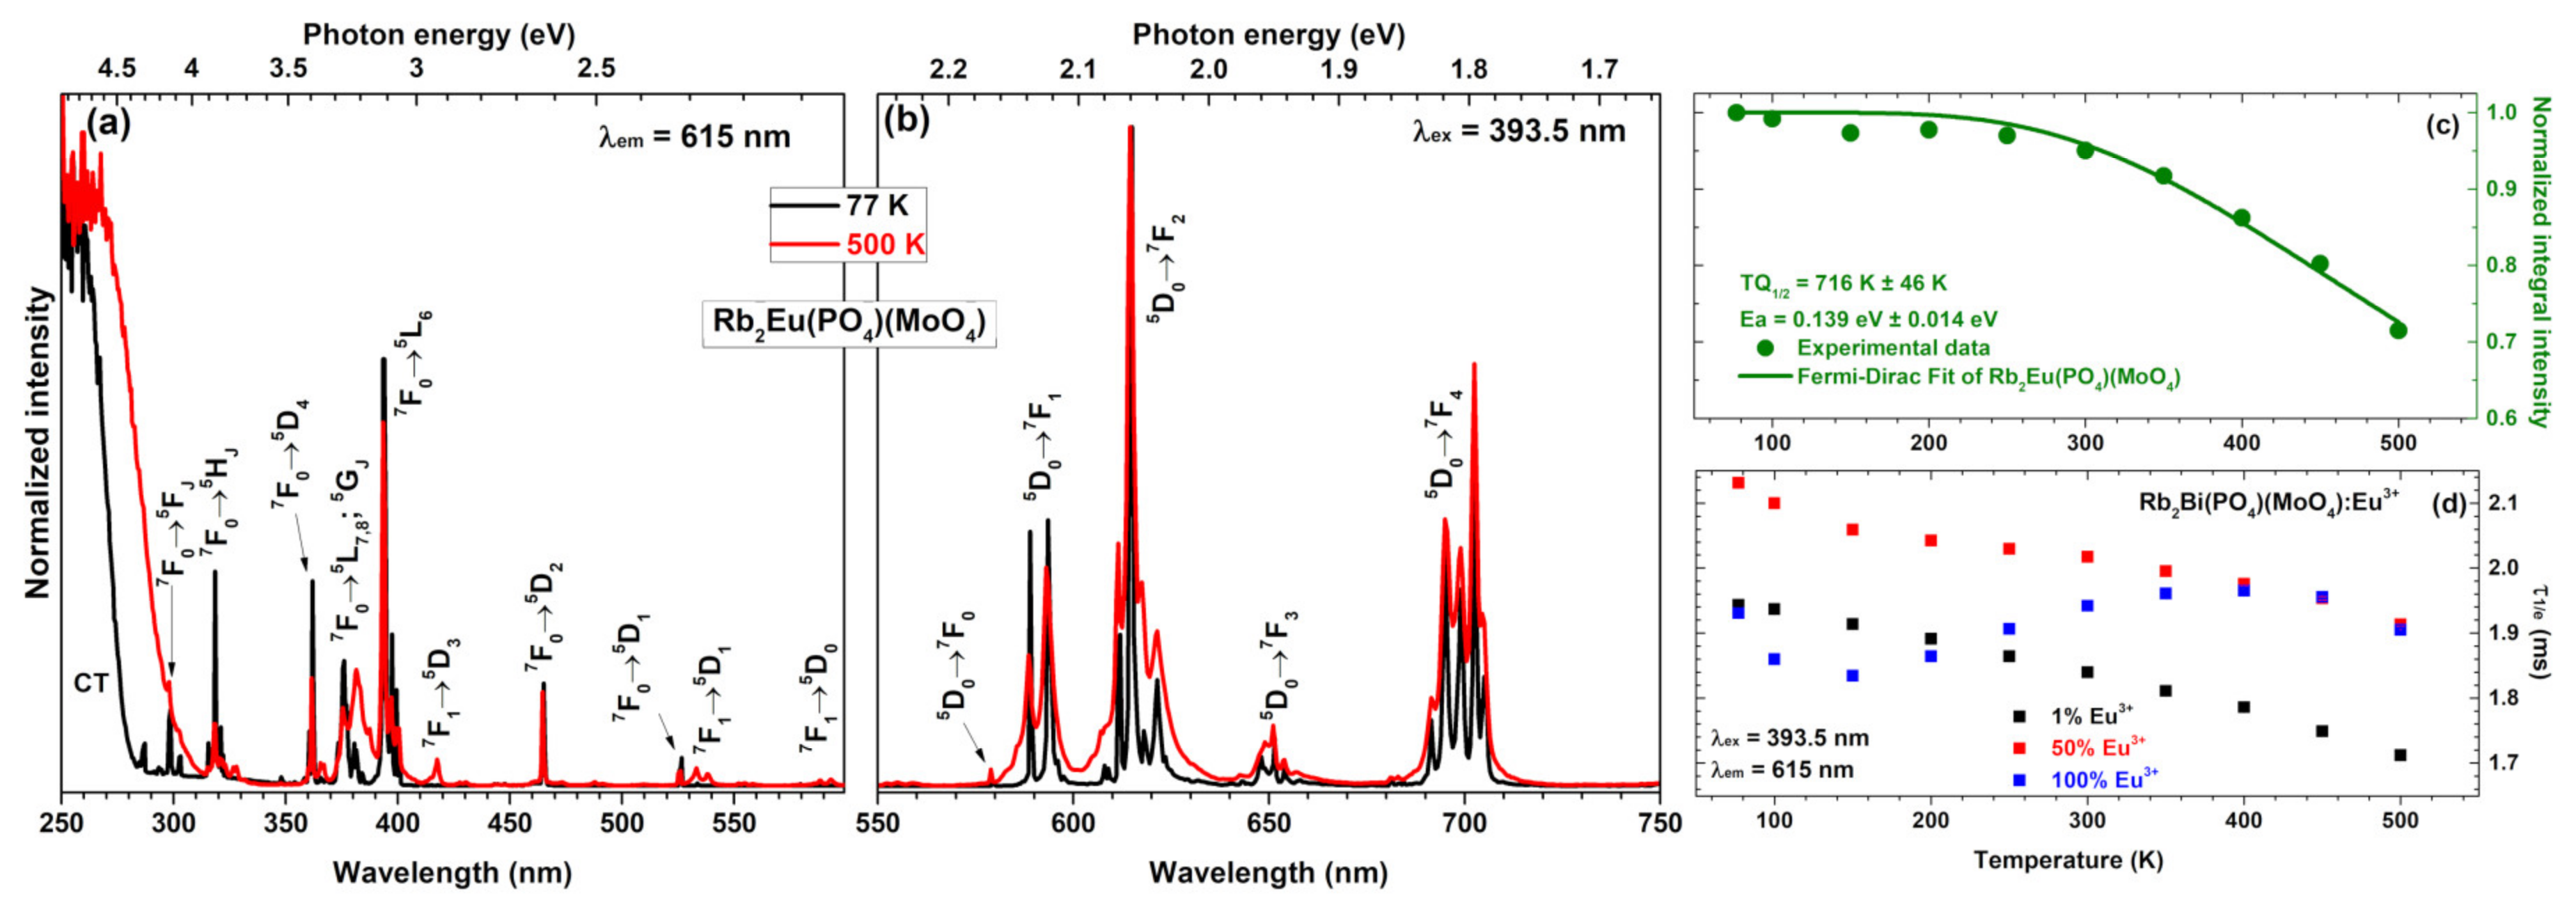
The temperature-dependent excitation spectra (λ
em = 615 nm) of Rb
2Eu(PO
4)(MoO
4) sample recorded at 77 and 500 K are given in
Figure 4a. These spectra show some considerable differences. First of all, the charge transfer band becomes much broader at elevated temperatures, meaning that electron from O
2− ions is transferred to Eu
3+ ions much easier at high temperatures. Besides that, some lines in excitation spectra also disappear at low temperatures. For instance, lines that originate from thermally populated
7F
1 level are not observed in excitation spectra recorded at 77 K. These include
7F
1 →
5D
3,
7F
1 →
5D
1 and
7F
1 →
5D
0 transitions occurring at around 415, 534 and 590 nm, respectively. The absence of excitation lines from
7F
1 level indicates that thermal population of
7F
1 level at low temperatures is very limited.
The normalized emission spectra (λ
ex = 393.5 nm) of Rb
2Eu(PO
4)(MoO
4) sample recorded at 77 and 500 K are given in
Figure 4b. These spectra consist of the same five sets of emission lines as spectra recorded at room temperature (see
Figure 3b). The only difference between emission spectra recorded at 77 and 500 K is increased broadening of the lines at higher temperatures. This phenomenon can be attributed to the increased lattice vibrations at elevated temperatures which leads to distortion of Eu
3+ local surrounding. This results in Eu
3+ emission at slightly different wavelengths; hence, the broader emission lines.
The emission stability of the phosphor at elevated temperatures is an important factor determining the phosphors suitability for practical applications. The high power near-UV or blue LEDs can heat up to temperatures as high as 150 °C; therefore, the phosphor considered for such application should emit at this temperature efficiently. Besides, the temperature-dependent integrated emission spectra can also be used to determine the thermal quenching
TQ1/2 (this value shows the temperature at which phosphor loses half of its efficiency) and thermal quenching activation energy
Ea values. This is usually done by applying Fermi-Dirac model [
18,
44]:
Here
I(T) and
I0 are the temperature-dependent emission integral and the highest value of emission integral, respectively.
B is quenching frequency factor.
Ea is thermal quenching activation energy.
T is absolute temperature and
k is Boltzmann constant (8.617342·10
−5 eV/K) [
45]. The
TQ1/2 values, in turn, can be derived by slight changes of equation 3 [
42]:
The calculated
TQ1/2 and
Ea values for Rb
2Eu(PO
4)(MoO
4) specimen are 716 K ±46 K and 0.1391 eV ±0.0142 eV, respectively (see
Figure 4c). These results demonstrate that Rb
2Eu(PO
4)(MoO
4) sample would lose half efficiency at temperatures well above of the typical high power LED; therefore, it could be applied as a red component in near-UV based white LEDs. Besides, the
TQ1/2 values of Rb
2Eu(PO
4)(MoO
4) sample are also higher than those reported for its potassium counterpart K
2Eu(PO
4)(MoO
4) reported earlier in the literature (
TQ1/2 = 578 K ± 11 K) [
17]. In this sense, the Rb
2Eu(PO
4)(MoO
4) is superior if compared to K
2Eu(PO
4)(MoO
4).
The temperature-dependent PL decay curves were also recorded for Rb
2Bi(PO
4)(MoO
4) samples doped with 1%, 50%, and 100% Eu
3+. The PL decay profile was single exponential and the PL lifetime values were calculated employing equation 2. The obtained temperature-dependent PL lifetime values for those three specimens are depicted in
Figure 4d. The exact PL lifetime values together with standard deviations are summarized in
Table S3. It is interesting to note that PL lifetime values of samples doped with 1% and 50% Eu
3+ decreases with increasing temperature. However, the PL lifetime values of specimen doped with 100% Eu
3+ increases up to 400 K and only then start to decrease. This shows, that the internal quantum efficiency of this phosphor is the highest at 400 K.
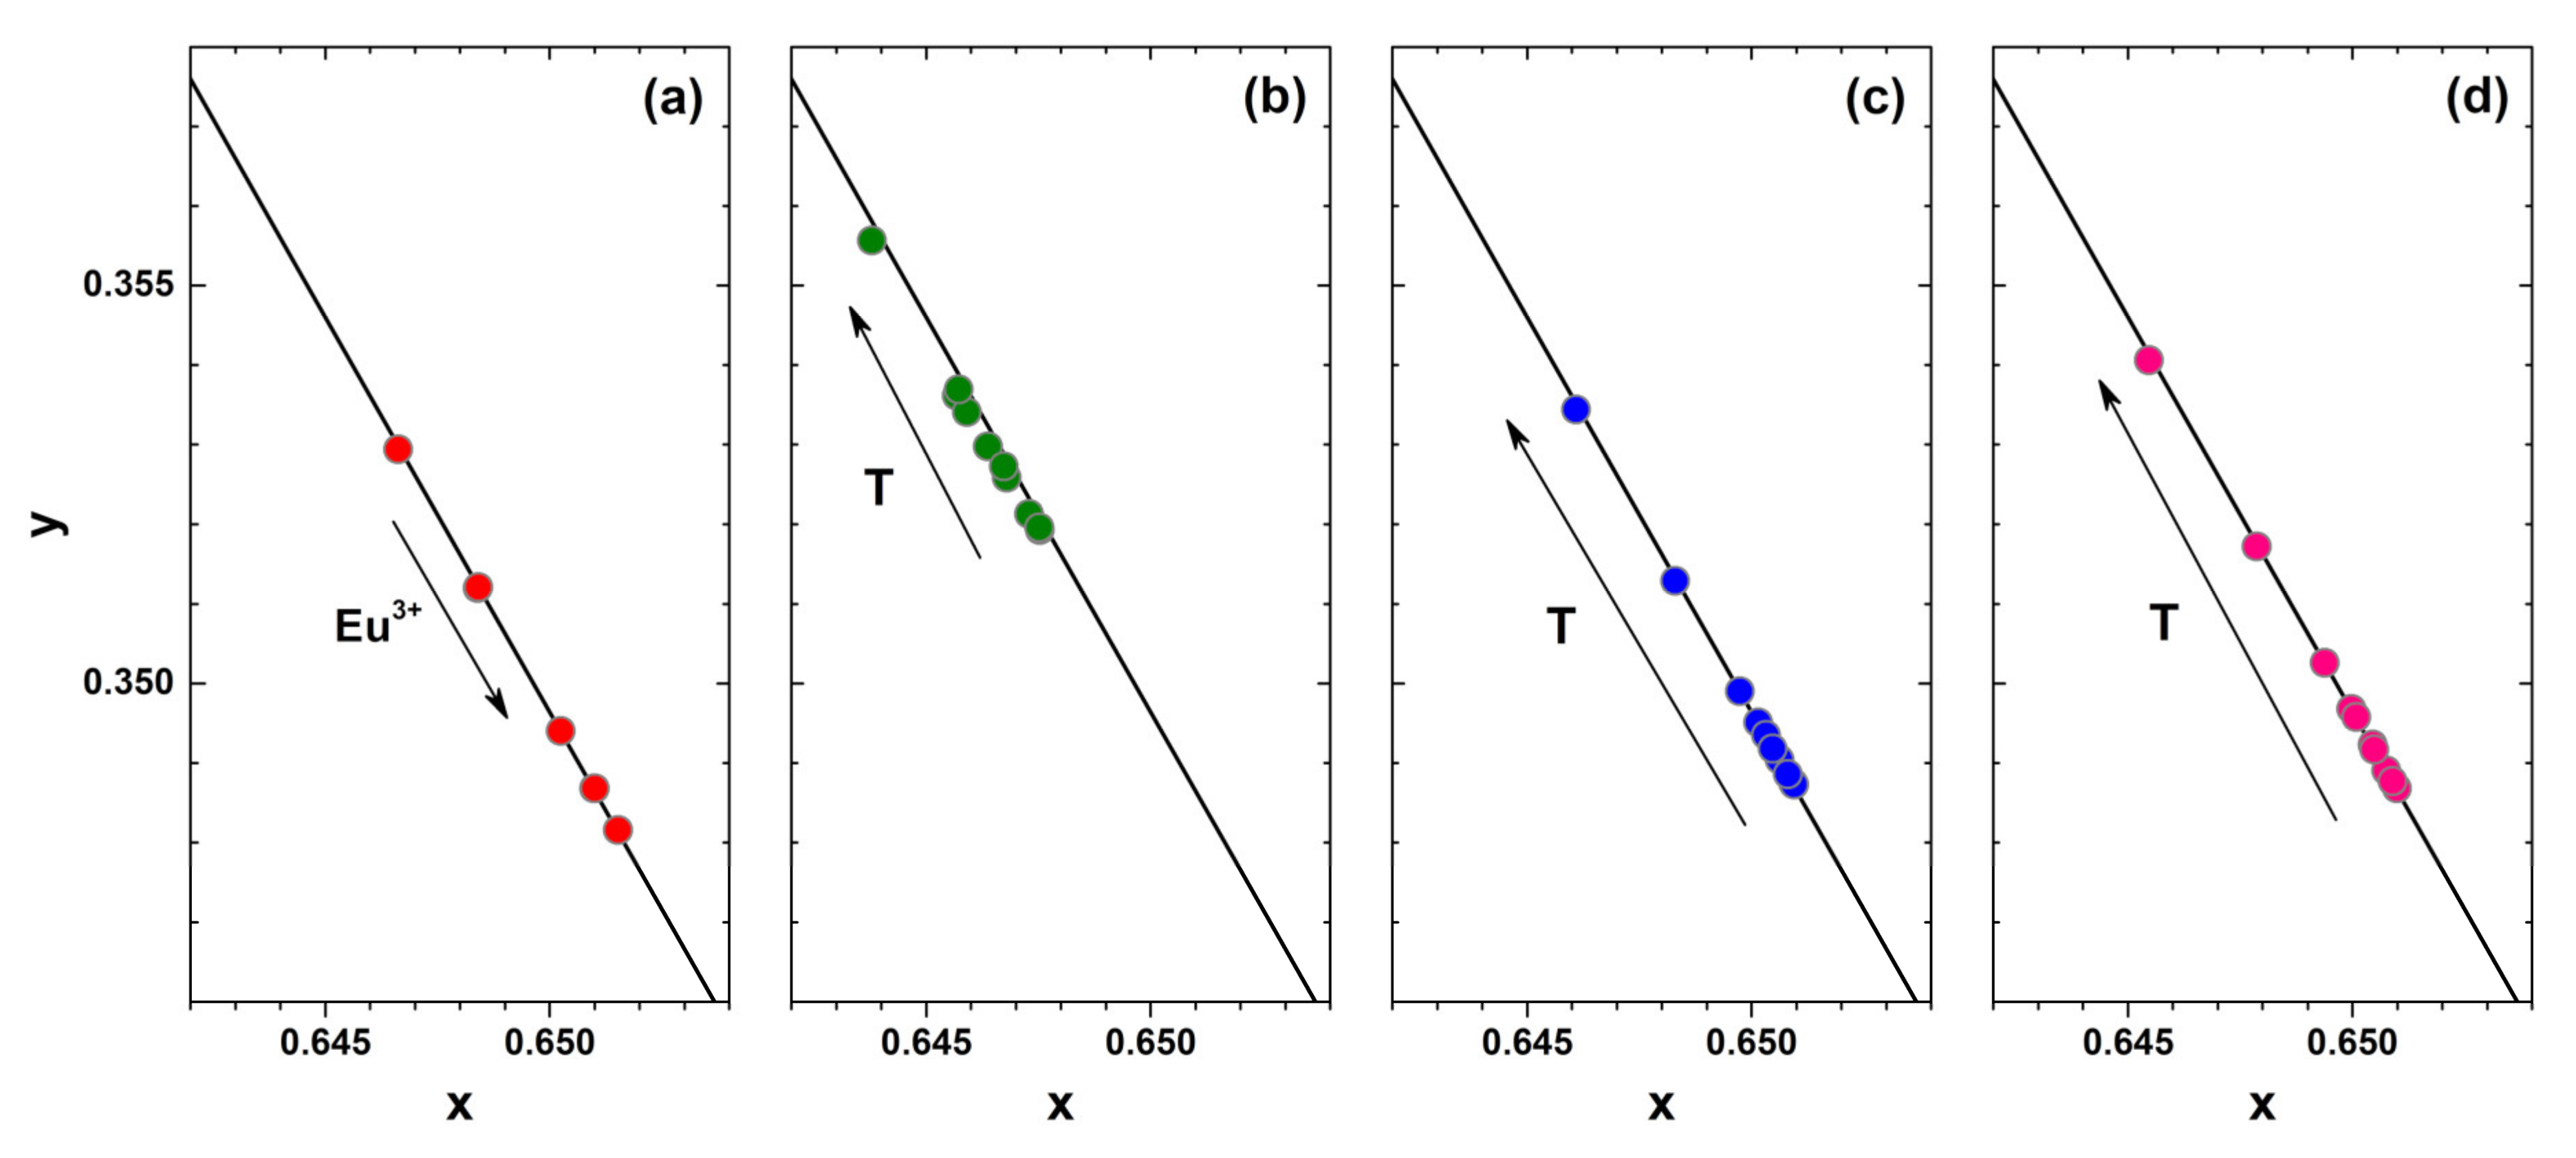
Another important specification of the phosphor considered for application in white LEDs is the colour purity. This can be evaluated by calculating the colour coordinates from the respective emission spectra. The fragments of CIE 1931 colour space diagram together with Eu
3+ concentration-dependent colour coordinates at room temperature and temperature-dependent colour coordinates of 1%, 50%, and 100% Eu
3+ doped samples are depicted in
Figure 5a–d, respectively. All the colour coordinates are located directly on the edge of the CIE 1931 colour space diagram showing high colour purity of all synthesized materials. It is also evident that colour coordinates for samples doped with higher Eu
3+ concentration shift downward the edge of the CIE 1931 colour space diagram. This shows that heavier doping leads to slightly more red emission of the samples. It turned out, that temperature also influences the colour coordinates slightly. They shift upwards the edge of the CIE 1931 colour space diagram indicating that phosphors give slightly more intensity in the orange spectral region at increased temperatures. On the other hand, the shift is relatively small and the colour coordinates can be considered stable within the 77–500 K range. The exact colour coordinate values in CIE 1931 colour space as a function of Eu
3+ concentration and temperature are tabulated in
Table S4 and
Table S5, respectively. The colour coordinates of the prepared samples are virtually the same regardless of the excitation wavelength (265, 393.5 or 465 nm) as shown in
Table S4.
The brightness of emission of the prepared samples to human eye can be evaluated by calculating the luminous efficacy (LE) values from the emission spectra. These values were obtained by employing the following equation [
46]:
Here,
I(λ) is emission spectrum of the sample and
V(λ) is the human eye sensitivity curve. The human eye is the most sensitive to the 555 nm electromagnetic radiation; therefore, the highest possible luminous efficacy value of 683 lm/W
opt is obtained for monochromatic green light at 555 nm. The obtained LE values for the synthesized samples as a function of Eu
3+ concentration and excitation wavelength (265, 393.5, and 465 nm) are tabulated in
Table S4 whereas the temperature-dependent LE values for samples doped with 1%, 50%, and 100% Eu
3+ are given in
Table S5. The LE values of all prepared samples were virtually the same regardless the Eu
3+ concentration, excitation wavelength or temperature and varied around 200 lm/W
opt. The luminous efficacy values of the synthesized phosphors are relatively high and are close to or even superior than those reported for well-known broad band emitting Eu
2+ phosphors, for instance, CaS:Eu
2+ (LE = 85 lm/W
opt, λ
em = 650 nm), Sr
2Si
5N
8:Eu
2+ (LE = 240 lm/W
opt, λ
em = 620 nm), CaAlSiN
3:Eu
2+ (LE = 150 lm/W
opt, λ
em = 650 nm) [
47]. On the other hand, the synthesized phosphors as was already mentioned show strong
5D
0 →
7F
4 emission at around 702 nm and this reduces the LE values since human eye is insensitive in this range. This leads to lower LE values if compared to other Eu
3+ doped phosphors where
5D
0 →
7F
4 emission is not so strong, for example, Li
3Ba
2Eu
3(MoO
4)
8 (LE = 312 lm/W
opt, λ
em = 615.5 nm) [
31] or Y
2Mo
4O
15:75%Eu
3+ (LE = 242 lm/W
opt, λ
em = 613 nm) [
15].
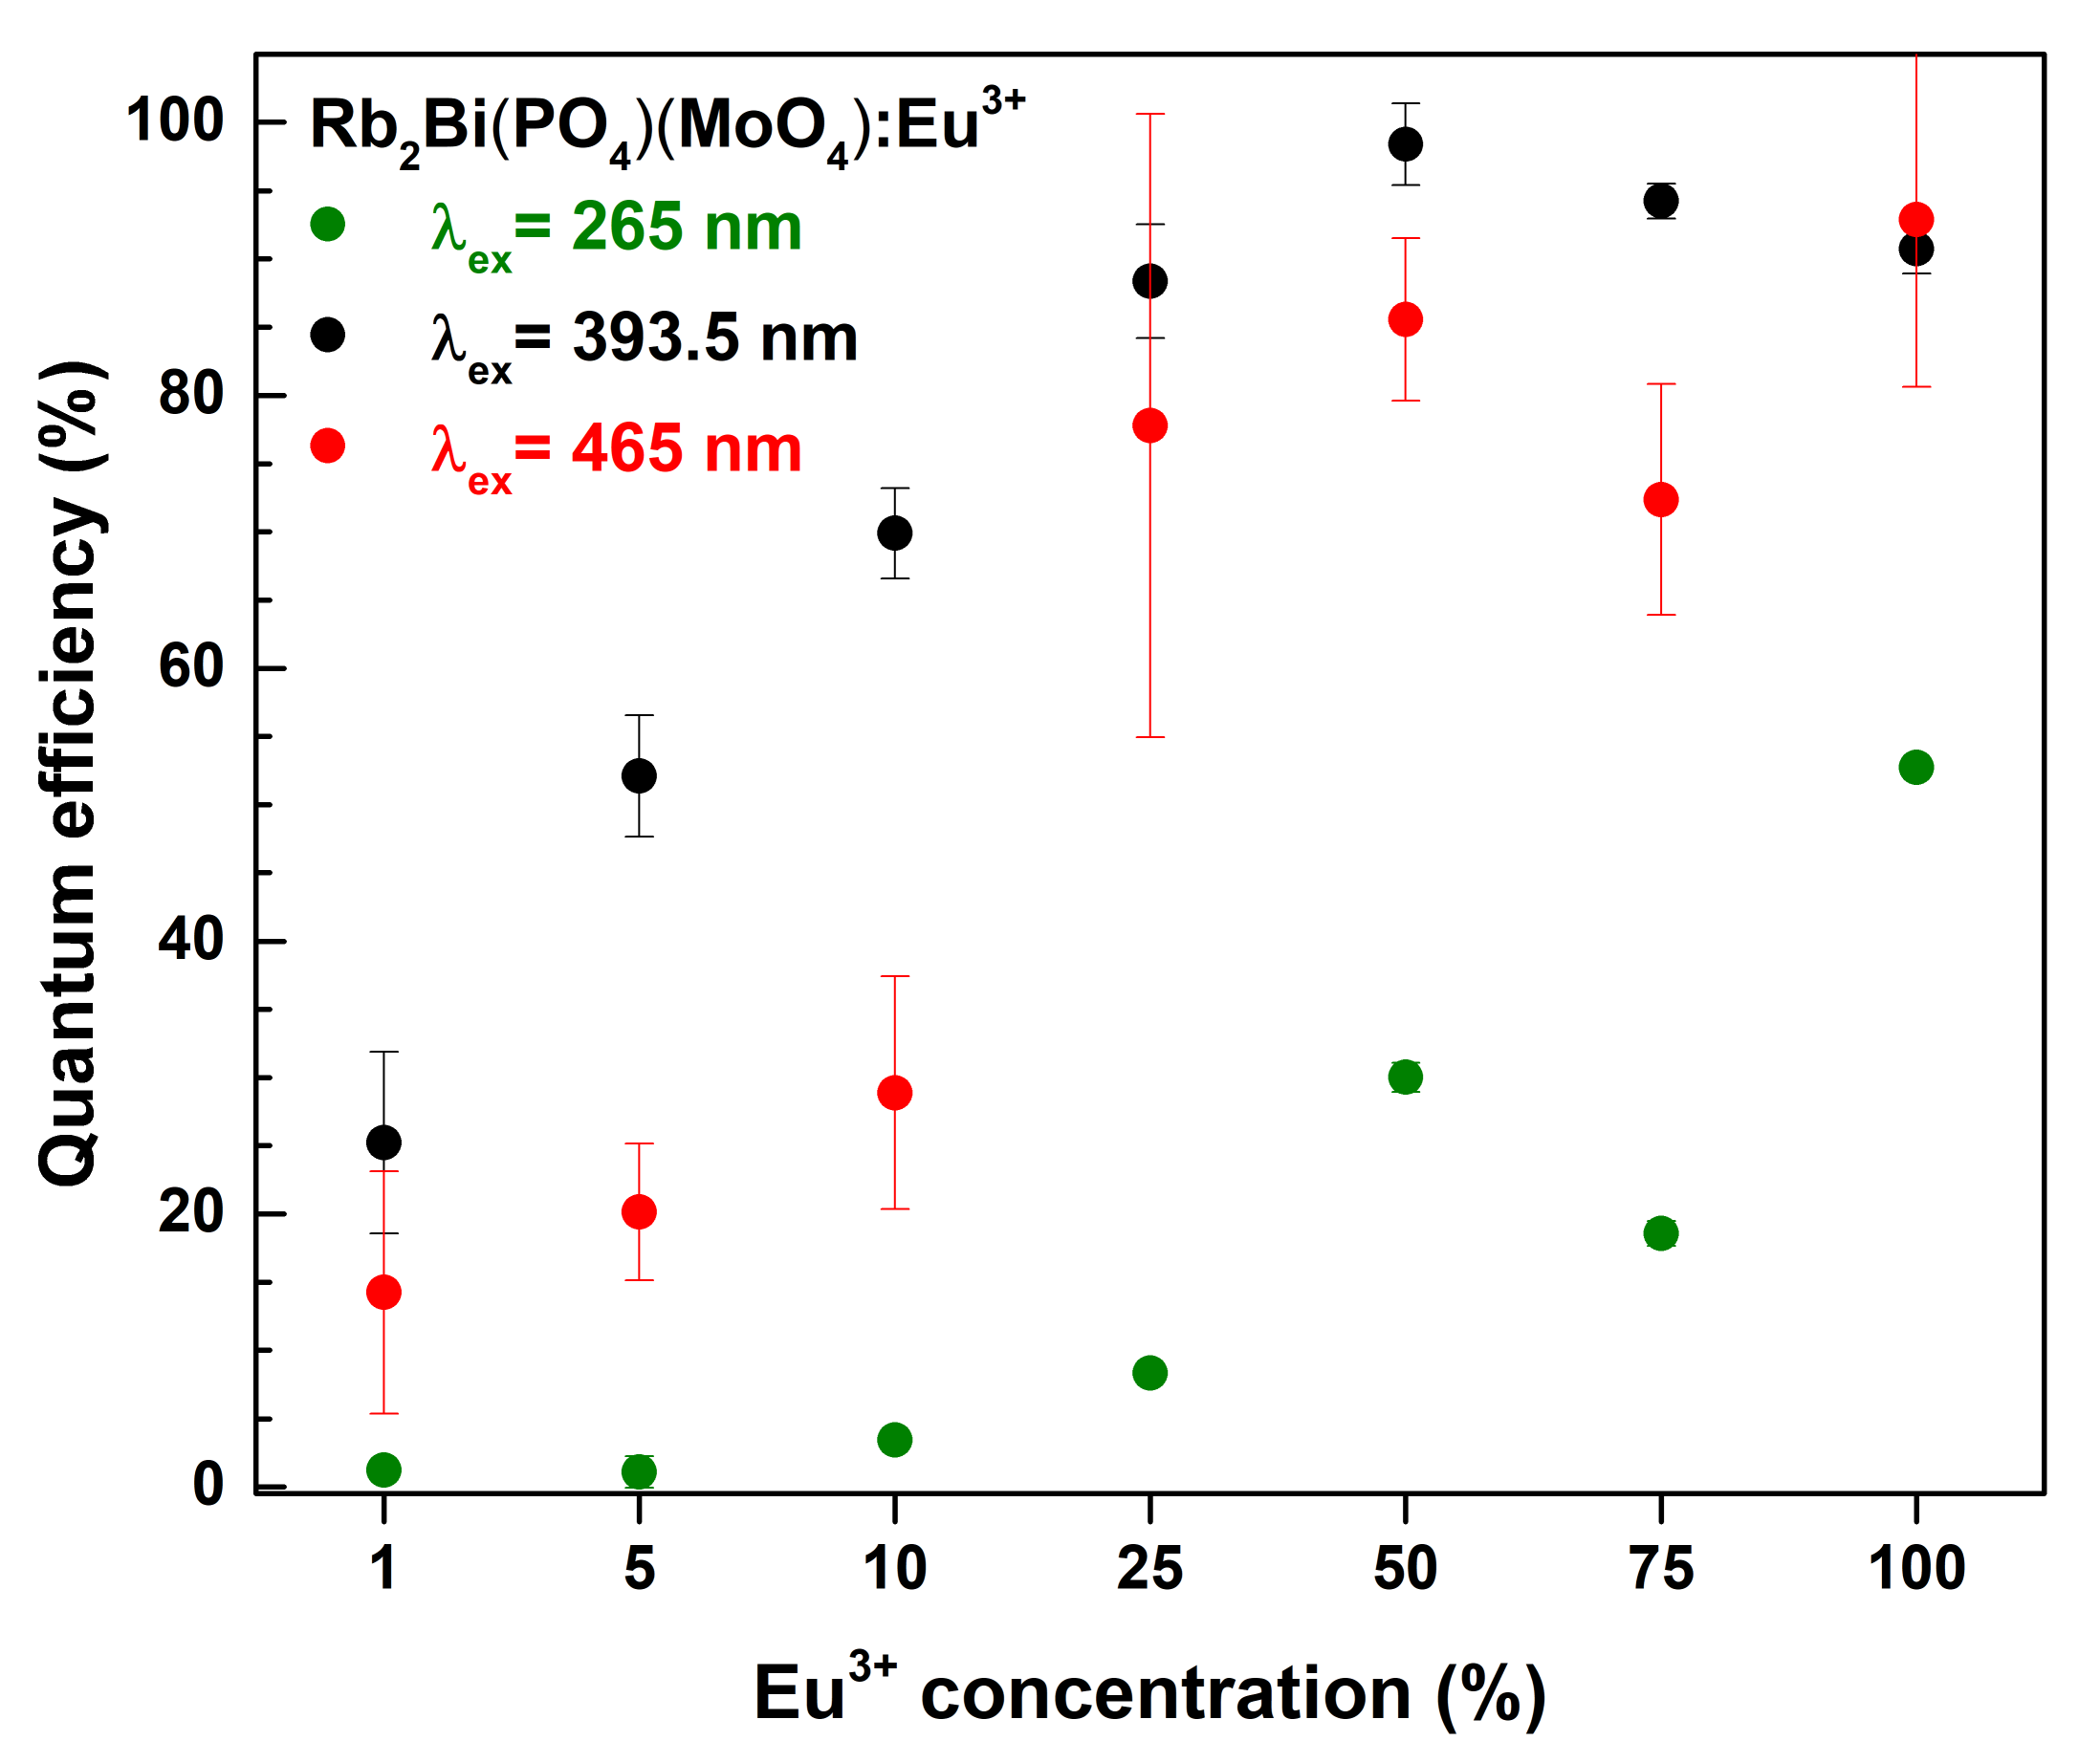
The quantum efficiencies (
QE) of all prepared samples as a function of excitation wavelength and Eu
3+ concentrations are depicted in
Figure 6. The
QE value for the 50% Eu
3+ doped sample is close to unity under 393.5 nm excitation. Such high
QE value is very favourable for practical application. Further increase of the Eu
3+ concentration resulted in decreased
QE values under the same excitation wavelength. Moreover, excitation at 265 and 465 nm has also resulted in somewhat lower
QE values. This leads to a conclusion that the synthesized phosphors in practical application should be used with near-UV emitting LEDs.
Due to forbidden nature of the intraconfigurational Eu
3+ [Xe]4f
6 ↔ [Xe]4f
6 transitions the absorption of Eu
3+ ions in inorganic matrices are relatively low [
48]. One of the ways to deal with this problem is using ceramics prepared from phosphor powder instead of phosphor powder itself. In ceramics the scattering of the incident excitation light is suppressed; therefore, the light can penetrate deeper in the phosphor and thus excite more dopant ions. In order to test this concept, we have prepared three ceramic disks with thicknesses of 0.36, 0.53, and 0.80 mm from Rb
2Eu(PO
4)(MoO
4) sample. The quantum efficiency of this sample is 10% lower if compared to sample doped with 50% Eu
3+. However, the powder of fully Eu
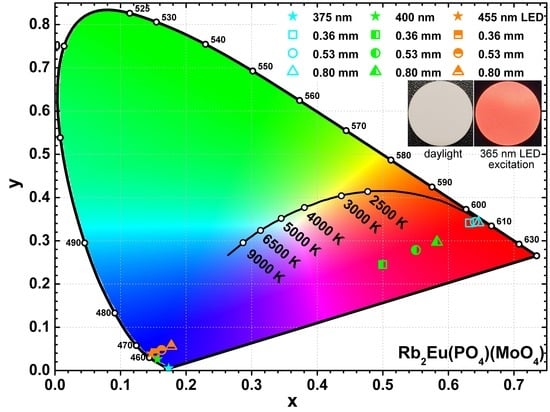
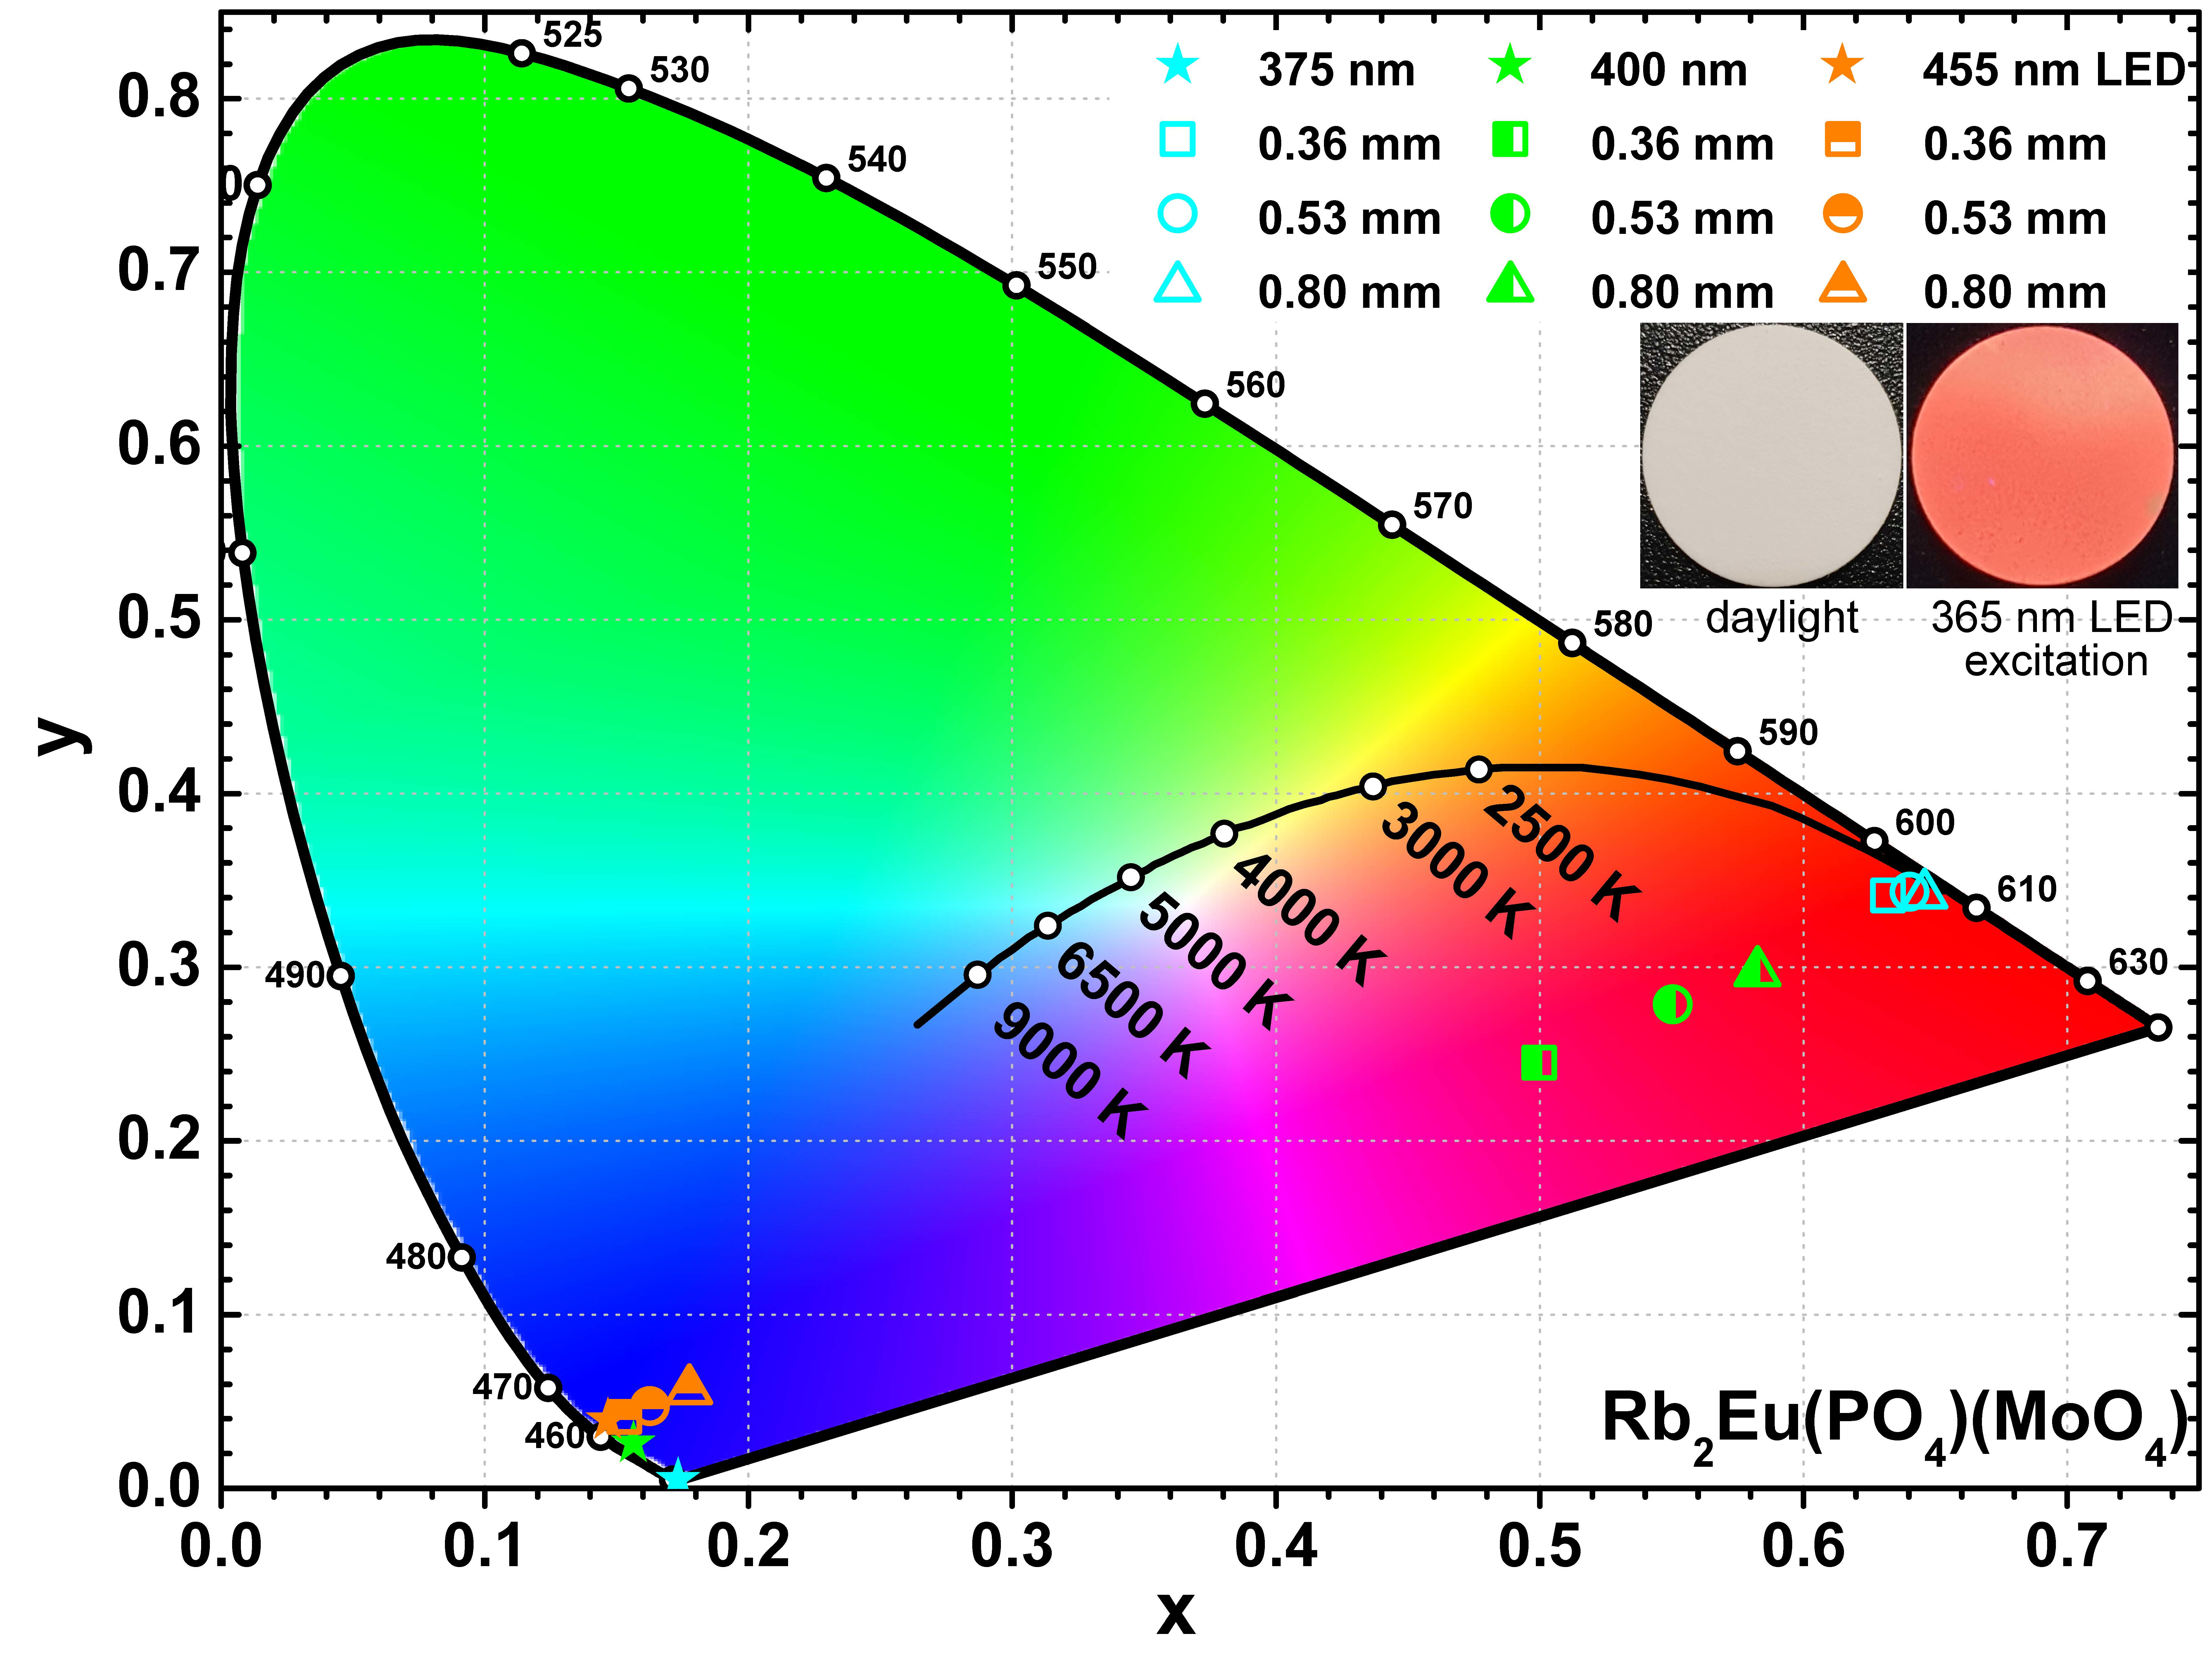
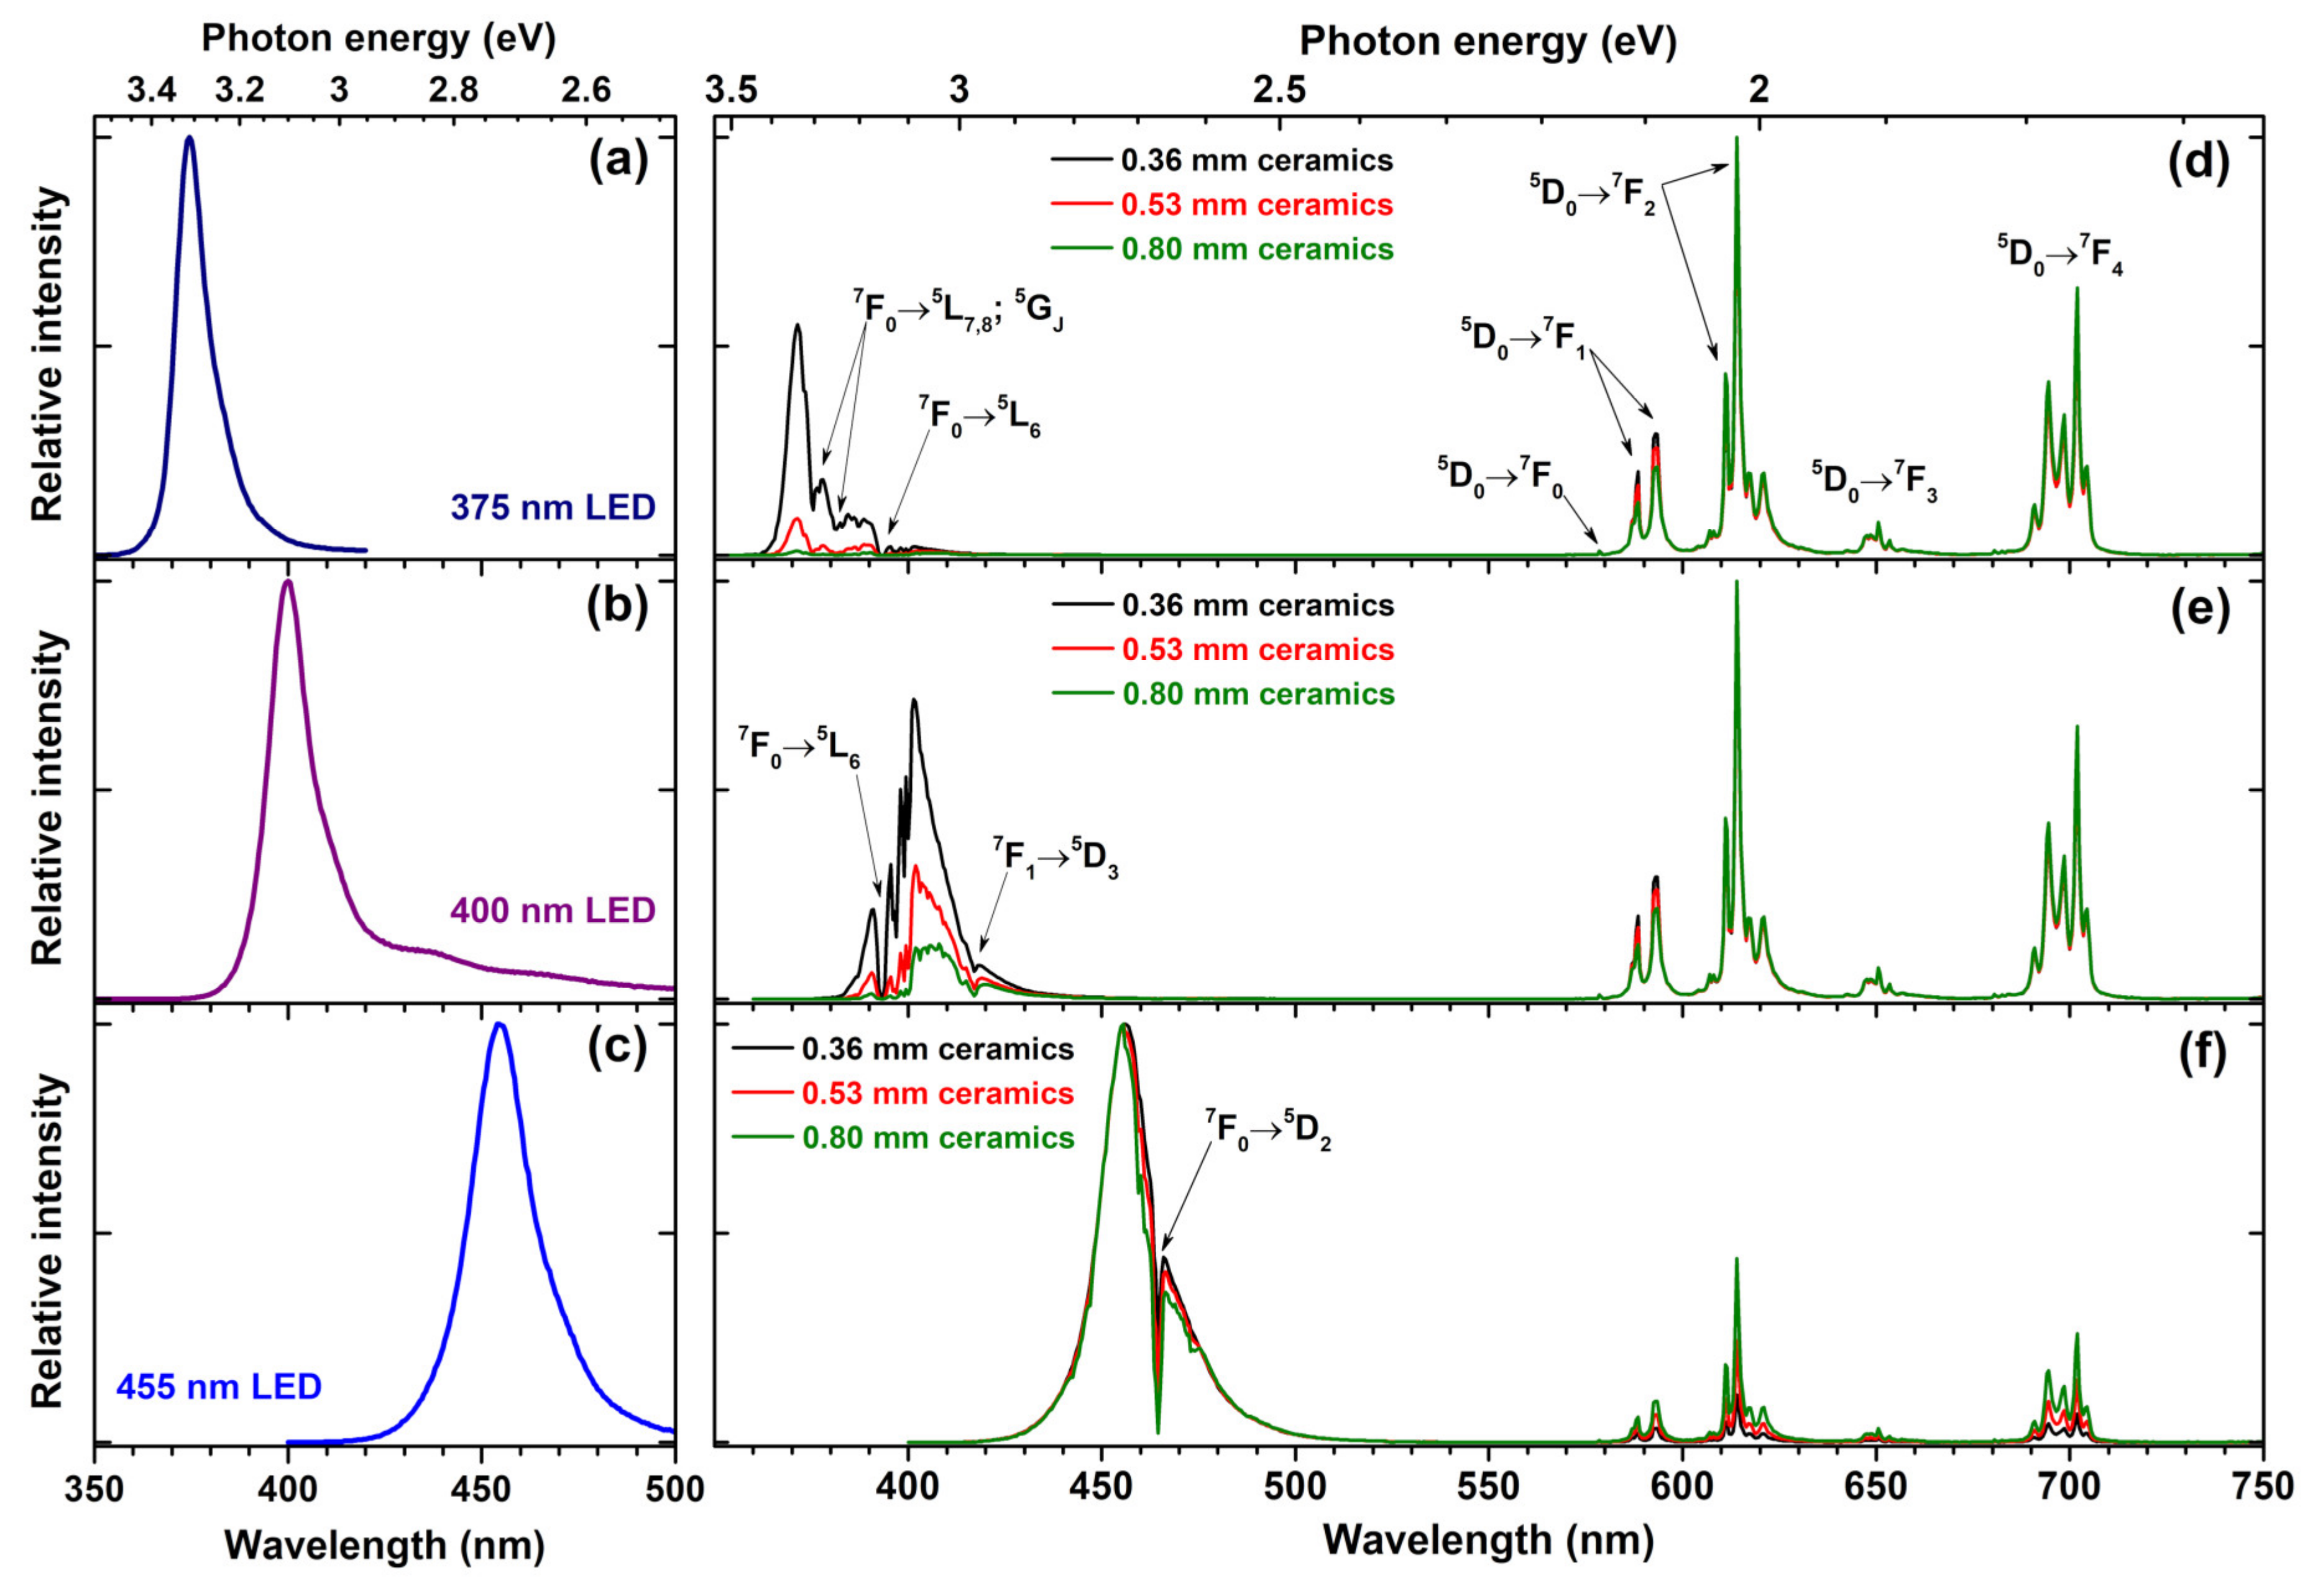
3+ substituted phosphor possesses stronger absorption; thus, in our opinion, this trade of is very reasonable. The prepared ceramic disks were placed on three different LEDs, emitting at 375, 400, and 455 nm, and the emission spectra of the resulting light sources were measured. The obtained results are summarized in
Figure 7. For comparison, the emission spectra of 375, 400, and 455 nm LEDs are given in
Figure 7a–c, respectively.
Figure 7d demonstrates that the absorption of electromagnetic radiation emitted by 375 nm LED increases with increasing thickness of the Rb
2Eu(PO
4)(MoO
4) ceramic disc. The ceramic disc thickness of 0.36 mm is not sufficient to absorb all the light emitted by 375 nm LED; however, it is virtually all absorbed when the thickness of ceramic disk reached 0.80 mm. The Eu
3+ 7F
0 →
5L
7,8;
5G
J and
7F
0 →
5L
6 absorption lines are clearly visible in the emission spectra of the obtained light source where 375 nm LED emits. Similar behaviour was observed for light sources prepared from 400 nm emitting LED and ceramic disks. The only difference is that 0.80 mm thickness ceramic disk is still not enough to absorb all the incident radiation; therefore, for complete absorption of 400 nm LED emission a thicker ceramic disk would be required. Here, Eu
3+ absorption lines originating from Eu
3+ 7F
0 →
5L
6 and
7F
1 →
5D
3 transitions are visible in emission spectra of 400 nm LED. The lowest absorption of ceramic disks was observed if 455 LED was used for excitation. This, however, is not surprising since in this spectral range only one absorption line (namely,
7F
0 →
5D
2) of Eu
3+ ions is present. Moreover, this line is very narrow and even though nearly all LED emission at around 465 nm is absorbed, the rest of LED emission passes through the disk unabsorbed. The relatively low absorption of 375 and 465 nm LED emission by prepared ceramic disks is, of course, a disadvantage for the practical application. However, on the positive side, the unabsorbed LED emission remains available for exiting phosphors emitting in other spectral regions.
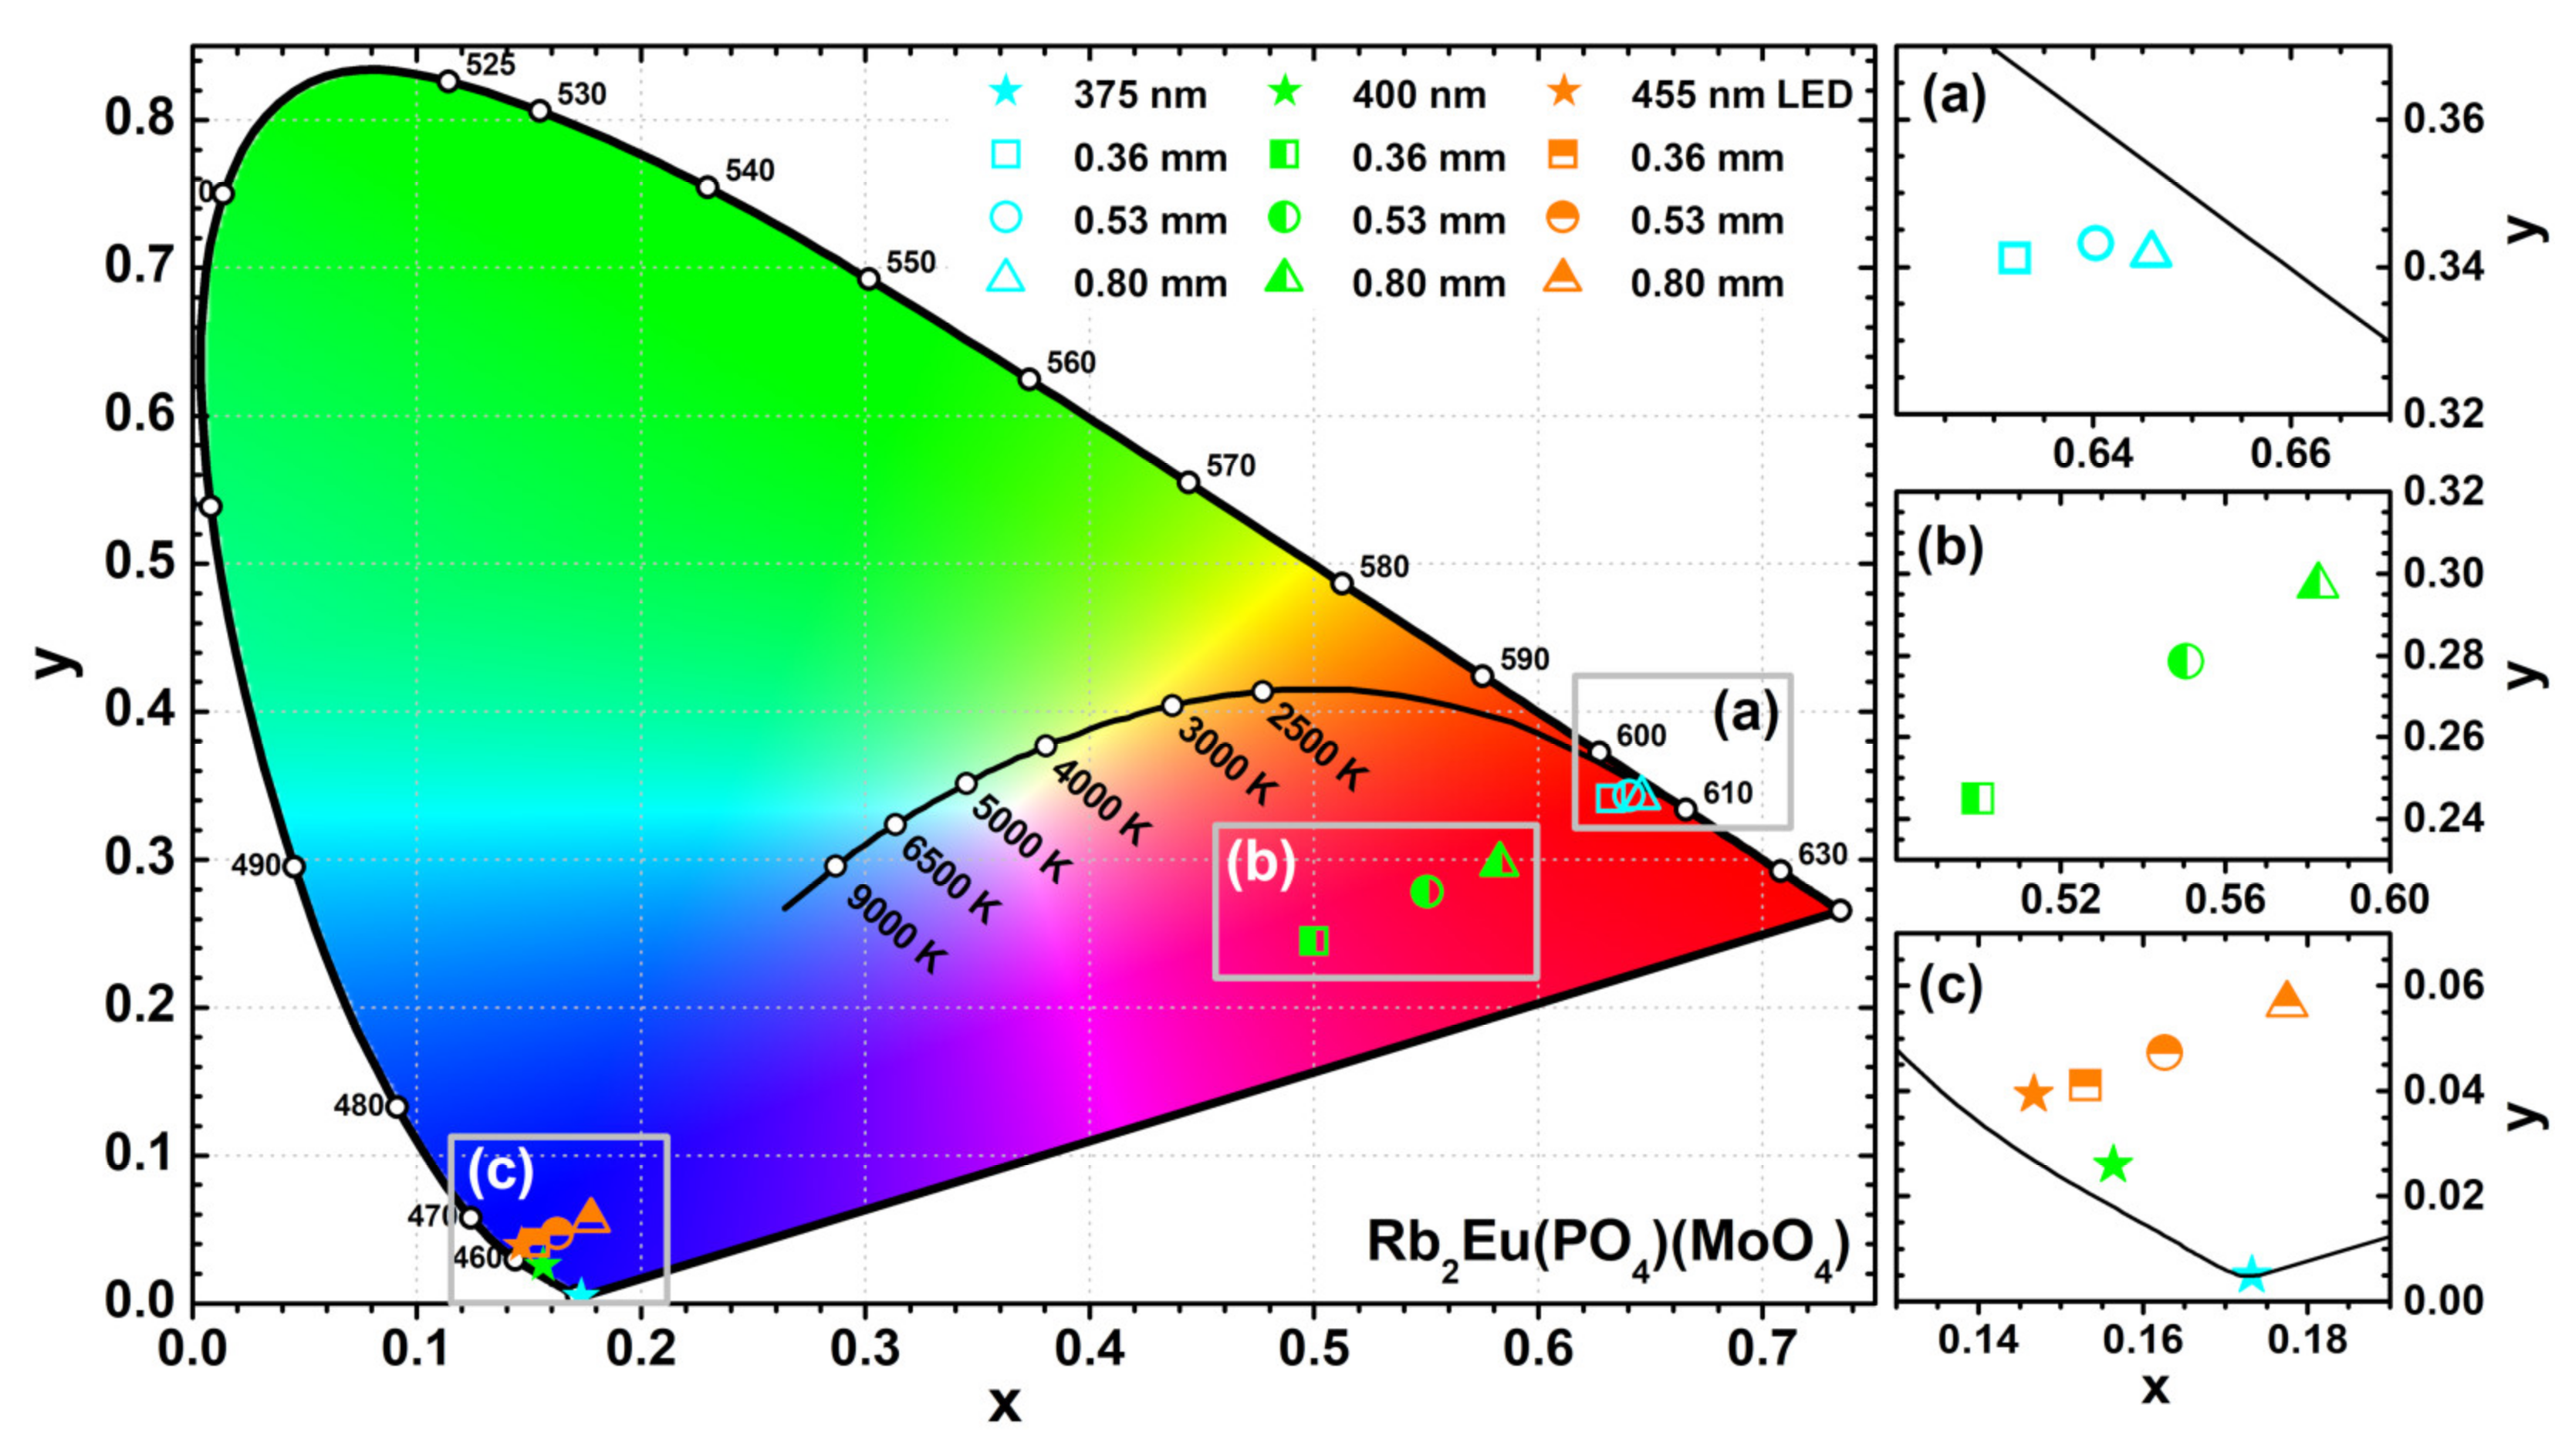
The colour coordinates and LE values of the obtained light sources were also calculated. The exact values are tabulated in
Table S6 whereas the graphical representation is shown in
Figure 8. The colour coordinates of the light sources obtained from Rb
2Eu(PO
4)(MoO
4) ceramic discs and 375 nm emitting LED shift closer to the edge of CIE 1931 colour space diagram if ceramics thickness is increased (see
Figure 8a). This shows high colour purity of the emitted red light. Such result also goes hand in hand with emission spectra depicted in
Figure 7d, where emission from LED is completely absorbed by the thickest ceramic disk. Different results, however, were obtained when 400 nm emitting LED was used as an excitation source. The colour coordinates of these light sources lied in the purplish red spectral region of the CIE 1931 colour space diagram and shifted towards red region with increasing ceramics thickness (see
Figure 8b). These results correlate well with emission spectra given in
Figure 7e. The blend of Eu
3+ emission in ceramic disks and unabsorbed emission from LED yields the purplish red emission colour. The fraction of LED emission decreases with increasing ceramics thickness; hence, the red shift of colour coordinate. It turned out that no red light source can be obtained by combining Rb
2Eu(PO
4)(MoO
4) ceramic discs and 455 nm emitting LED. The absorption lines in this region by Eu
3+ ions are just too narrow. Therefore, the major part of 455 nm LED emission passes through the ceramic disks unabsorbed regardless their thickness and all the colour coordinates of such light sources lie in the blue region of the CIE 1931 colour space diagram as shown in
Figure 8c.
The highest LE values were obtained for light sources obtained from Rb2Eu(PO4)(MoO4) ceramic discs and 375 nm emitting LED. The LE values increased from 130 to 186 lm/Wopt with increasing ceramic thickness from 0.36 to 0.80 mm. This is associated with decreasing fraction of 375 nm LED emission for which human eye is extremely insensitive. Similar results were observed for the light sources obtained using 400 nm emitting LED. Here the LE values increased from 98 to 156 lm/Wopt. The lower LE values, if compared to devices with 375 nm emitting LED, are obtained because a larger fraction of LED emission remains unabsorbed. Finally, the lowest luminous efficacy values were calculated for light sources using 455 nm emitting LED. In this case the LE values were only 55 and 73 lm/Wopt for devices with the thinnest and the thickest ceramic disks, respectively. This is due to emission of such light sources in the blue and red spectral regions were the human eye sensitivity is low.

 ,
, 


