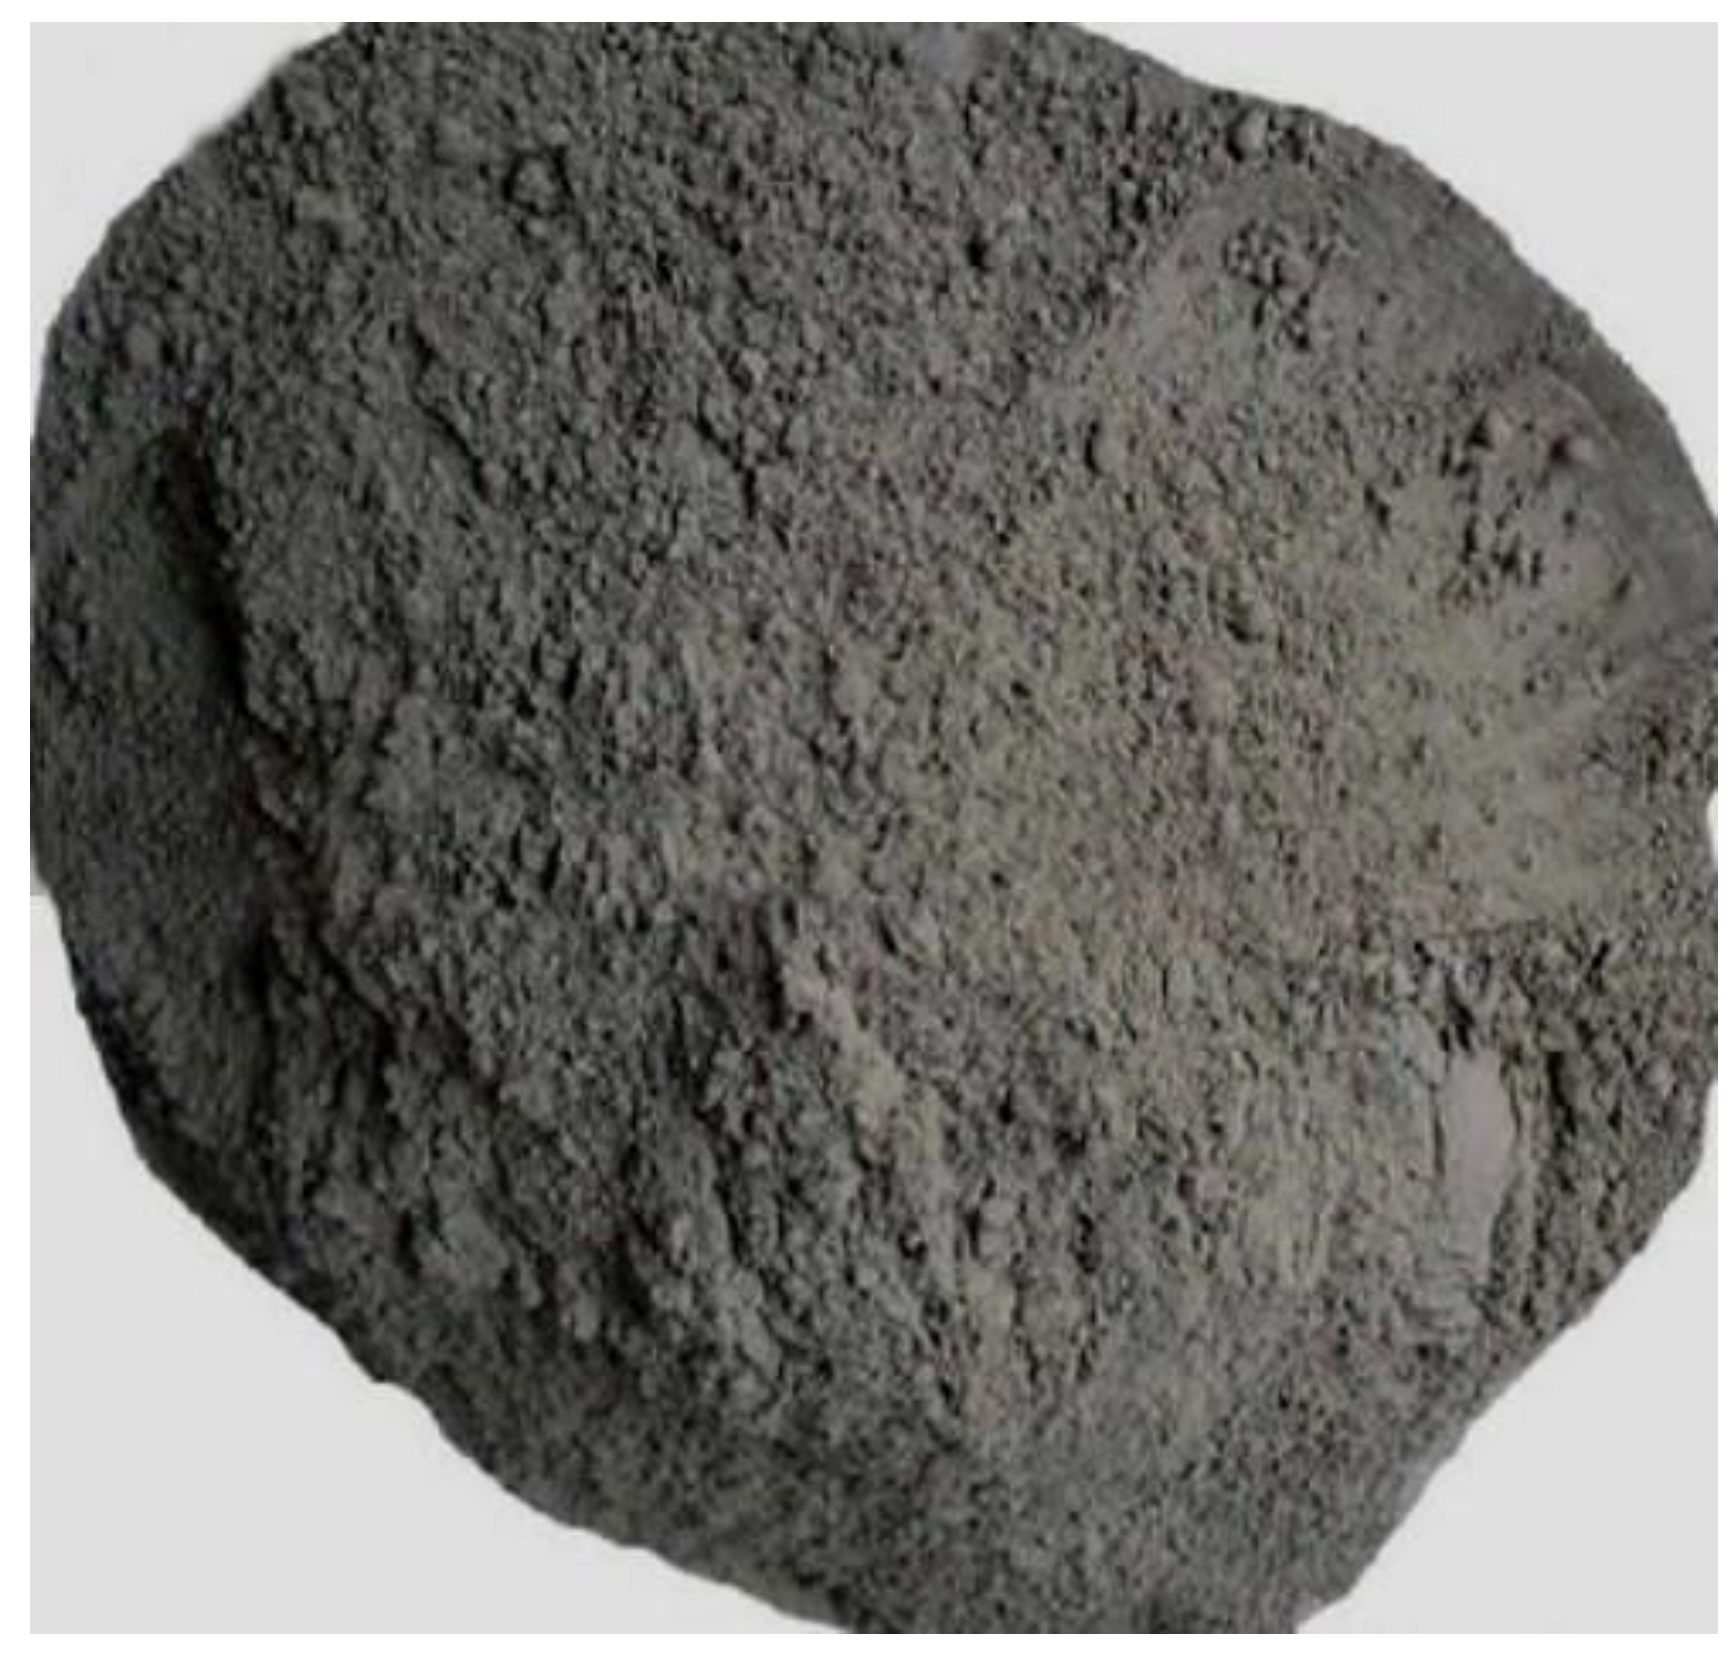
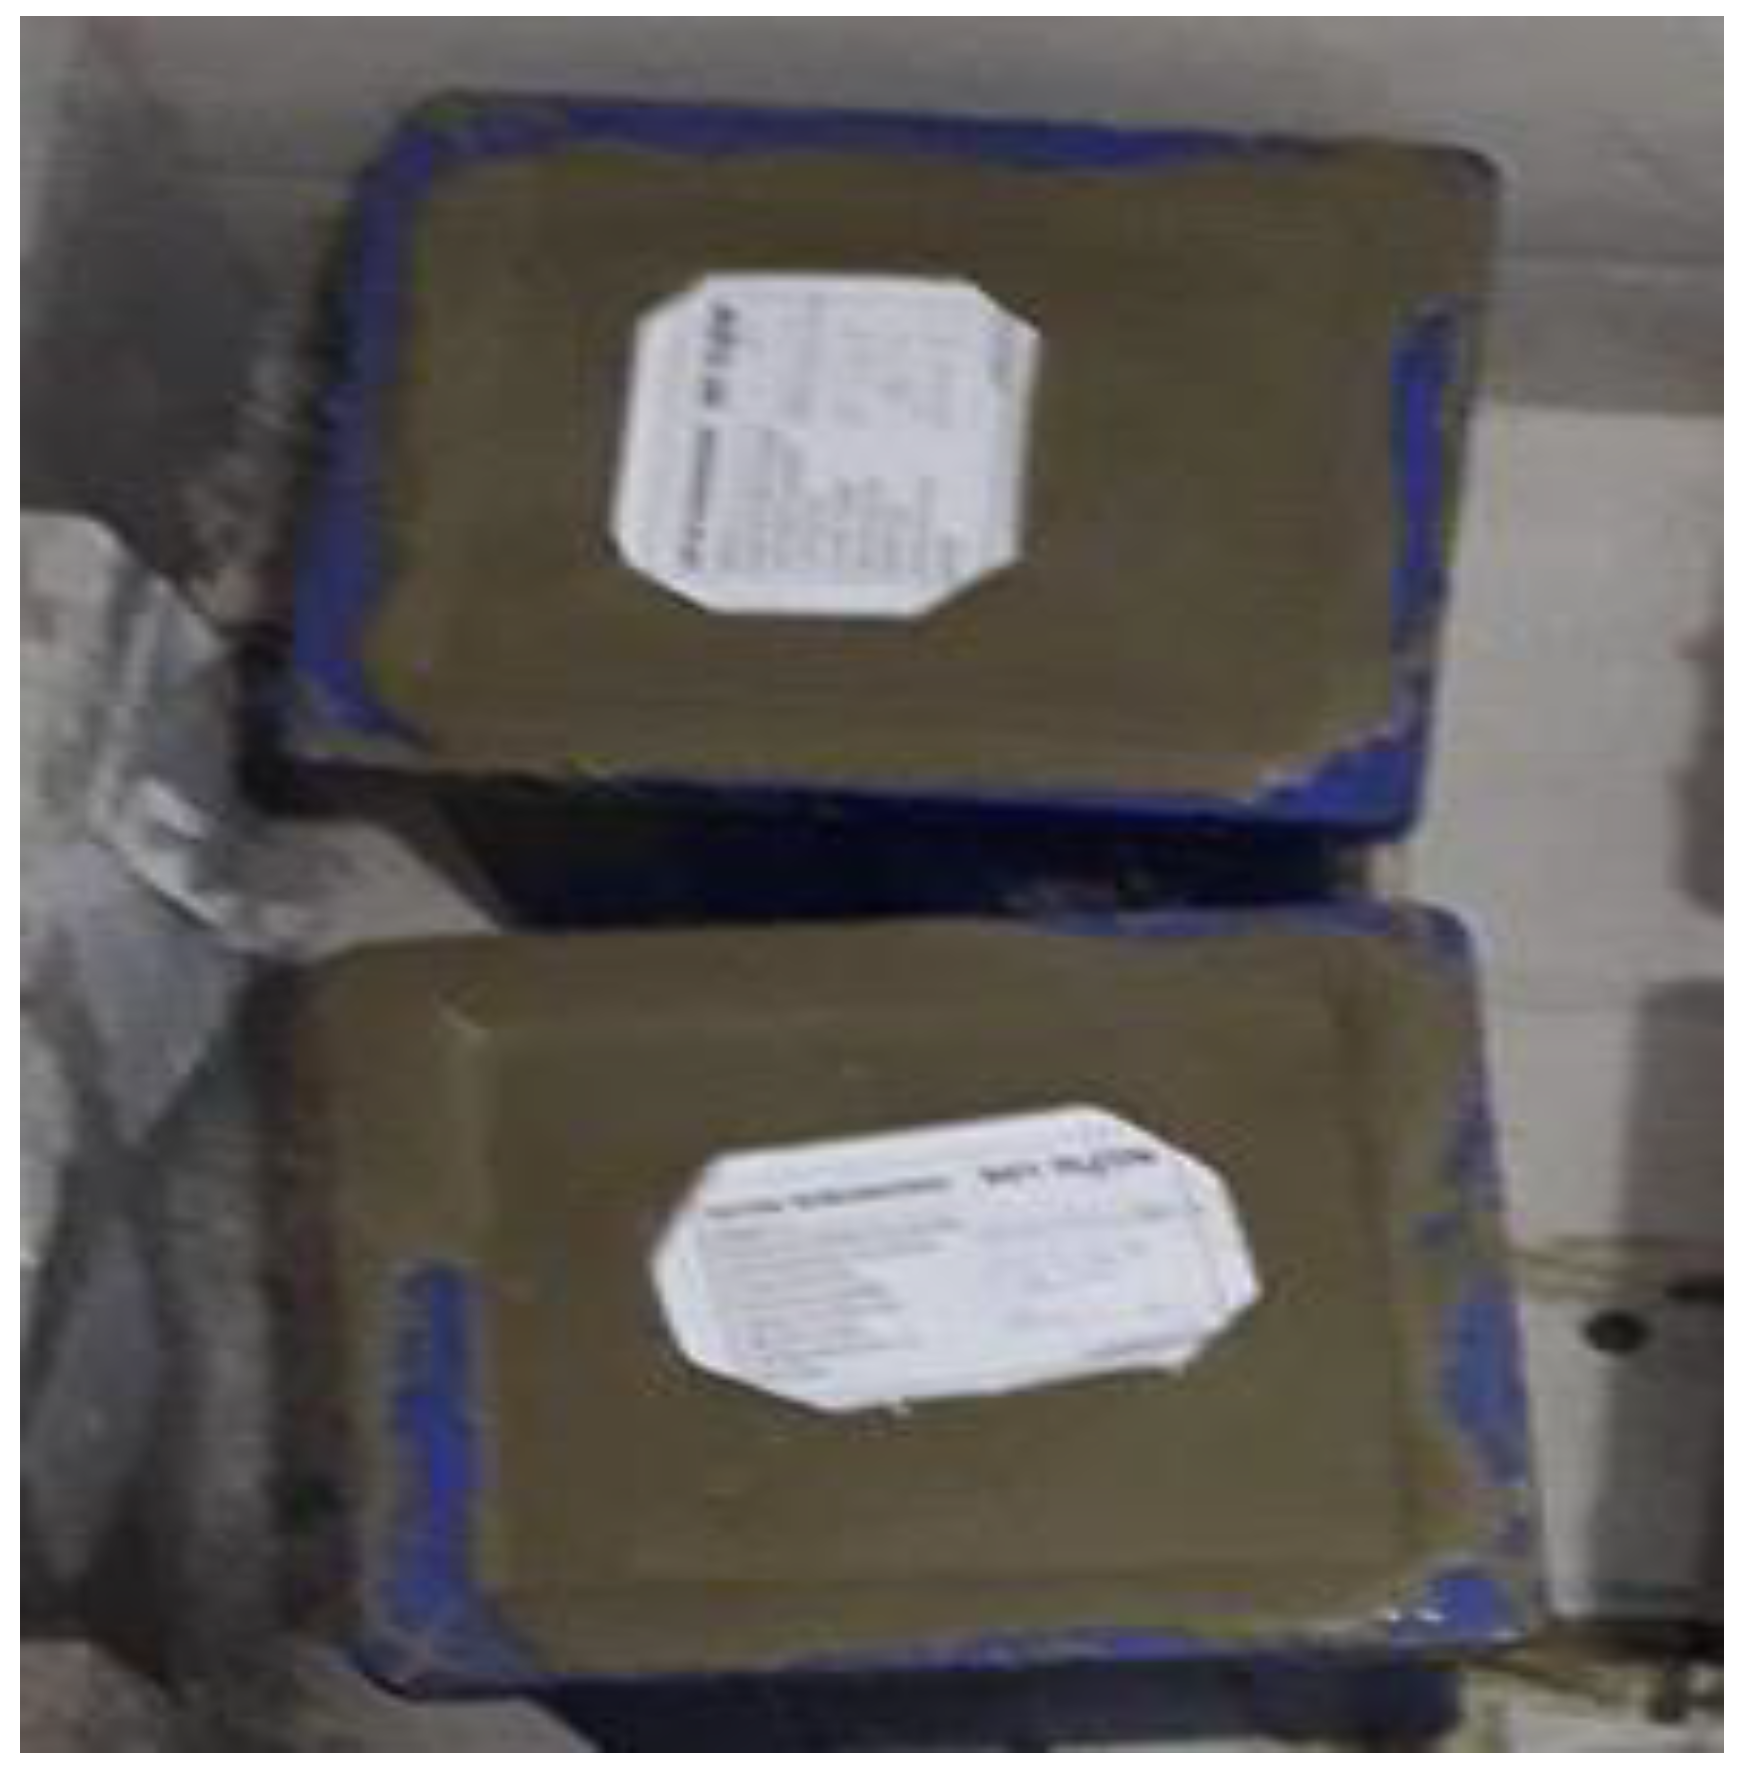
Figure 1.
CEM I 42.5 R cement appearance.
Figure 1.
CEM I 42.5 R cement appearance.
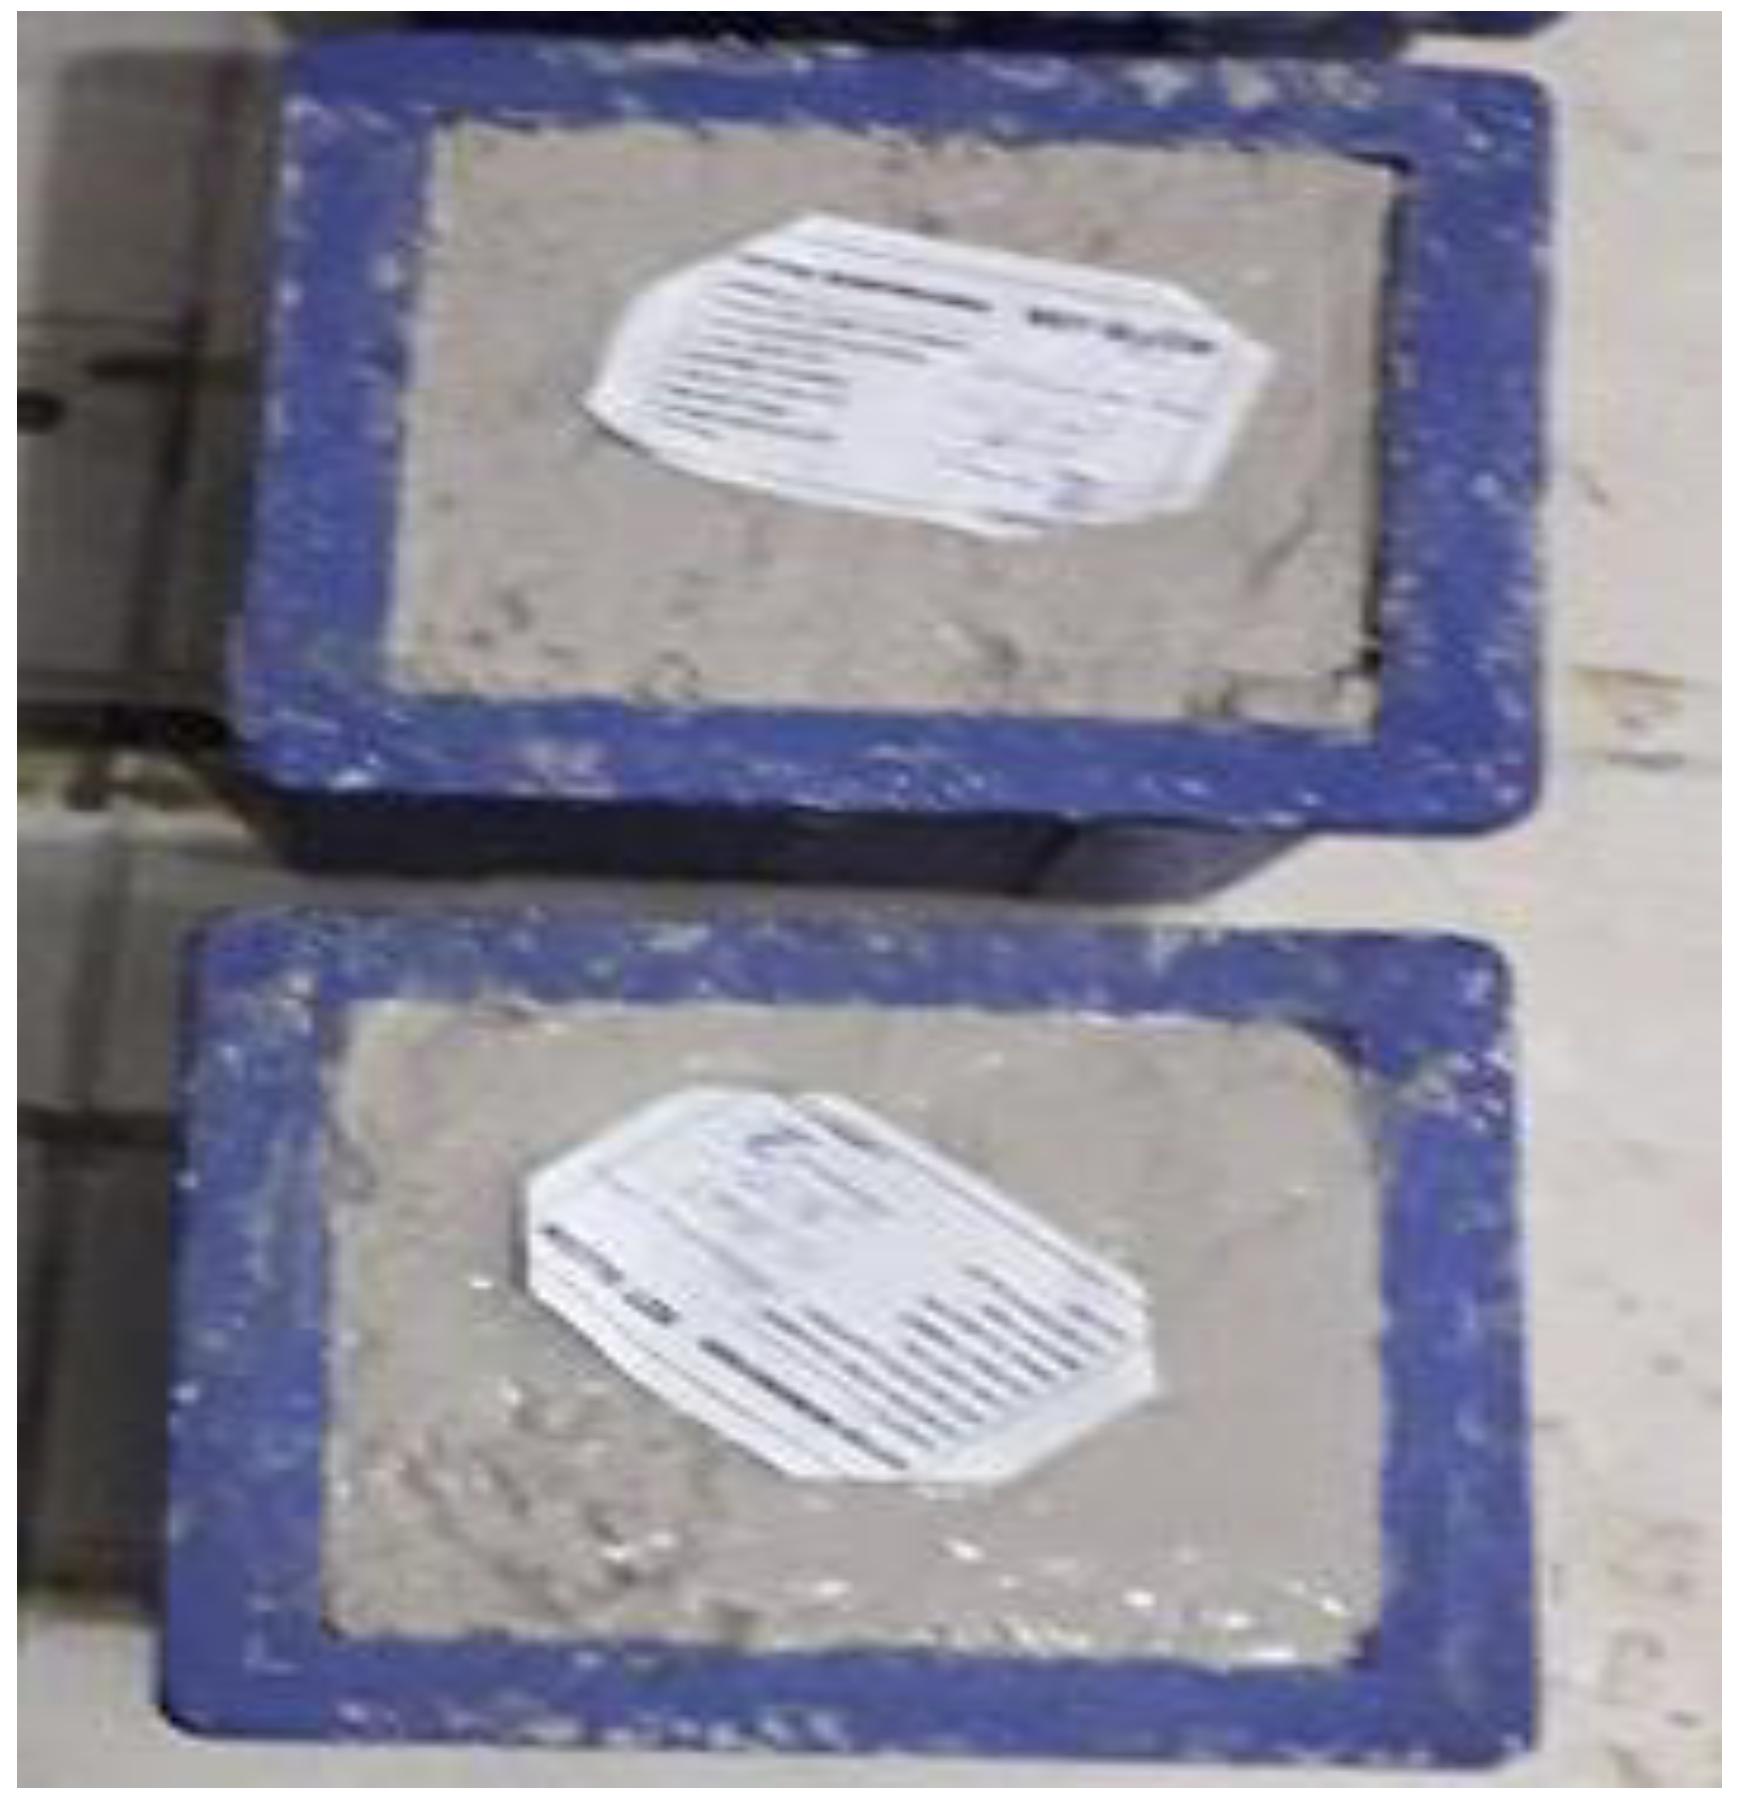
Figure 4.
Mixtures prepared for optimum binding.
Figure 4.
Mixtures prepared for optimum binding.
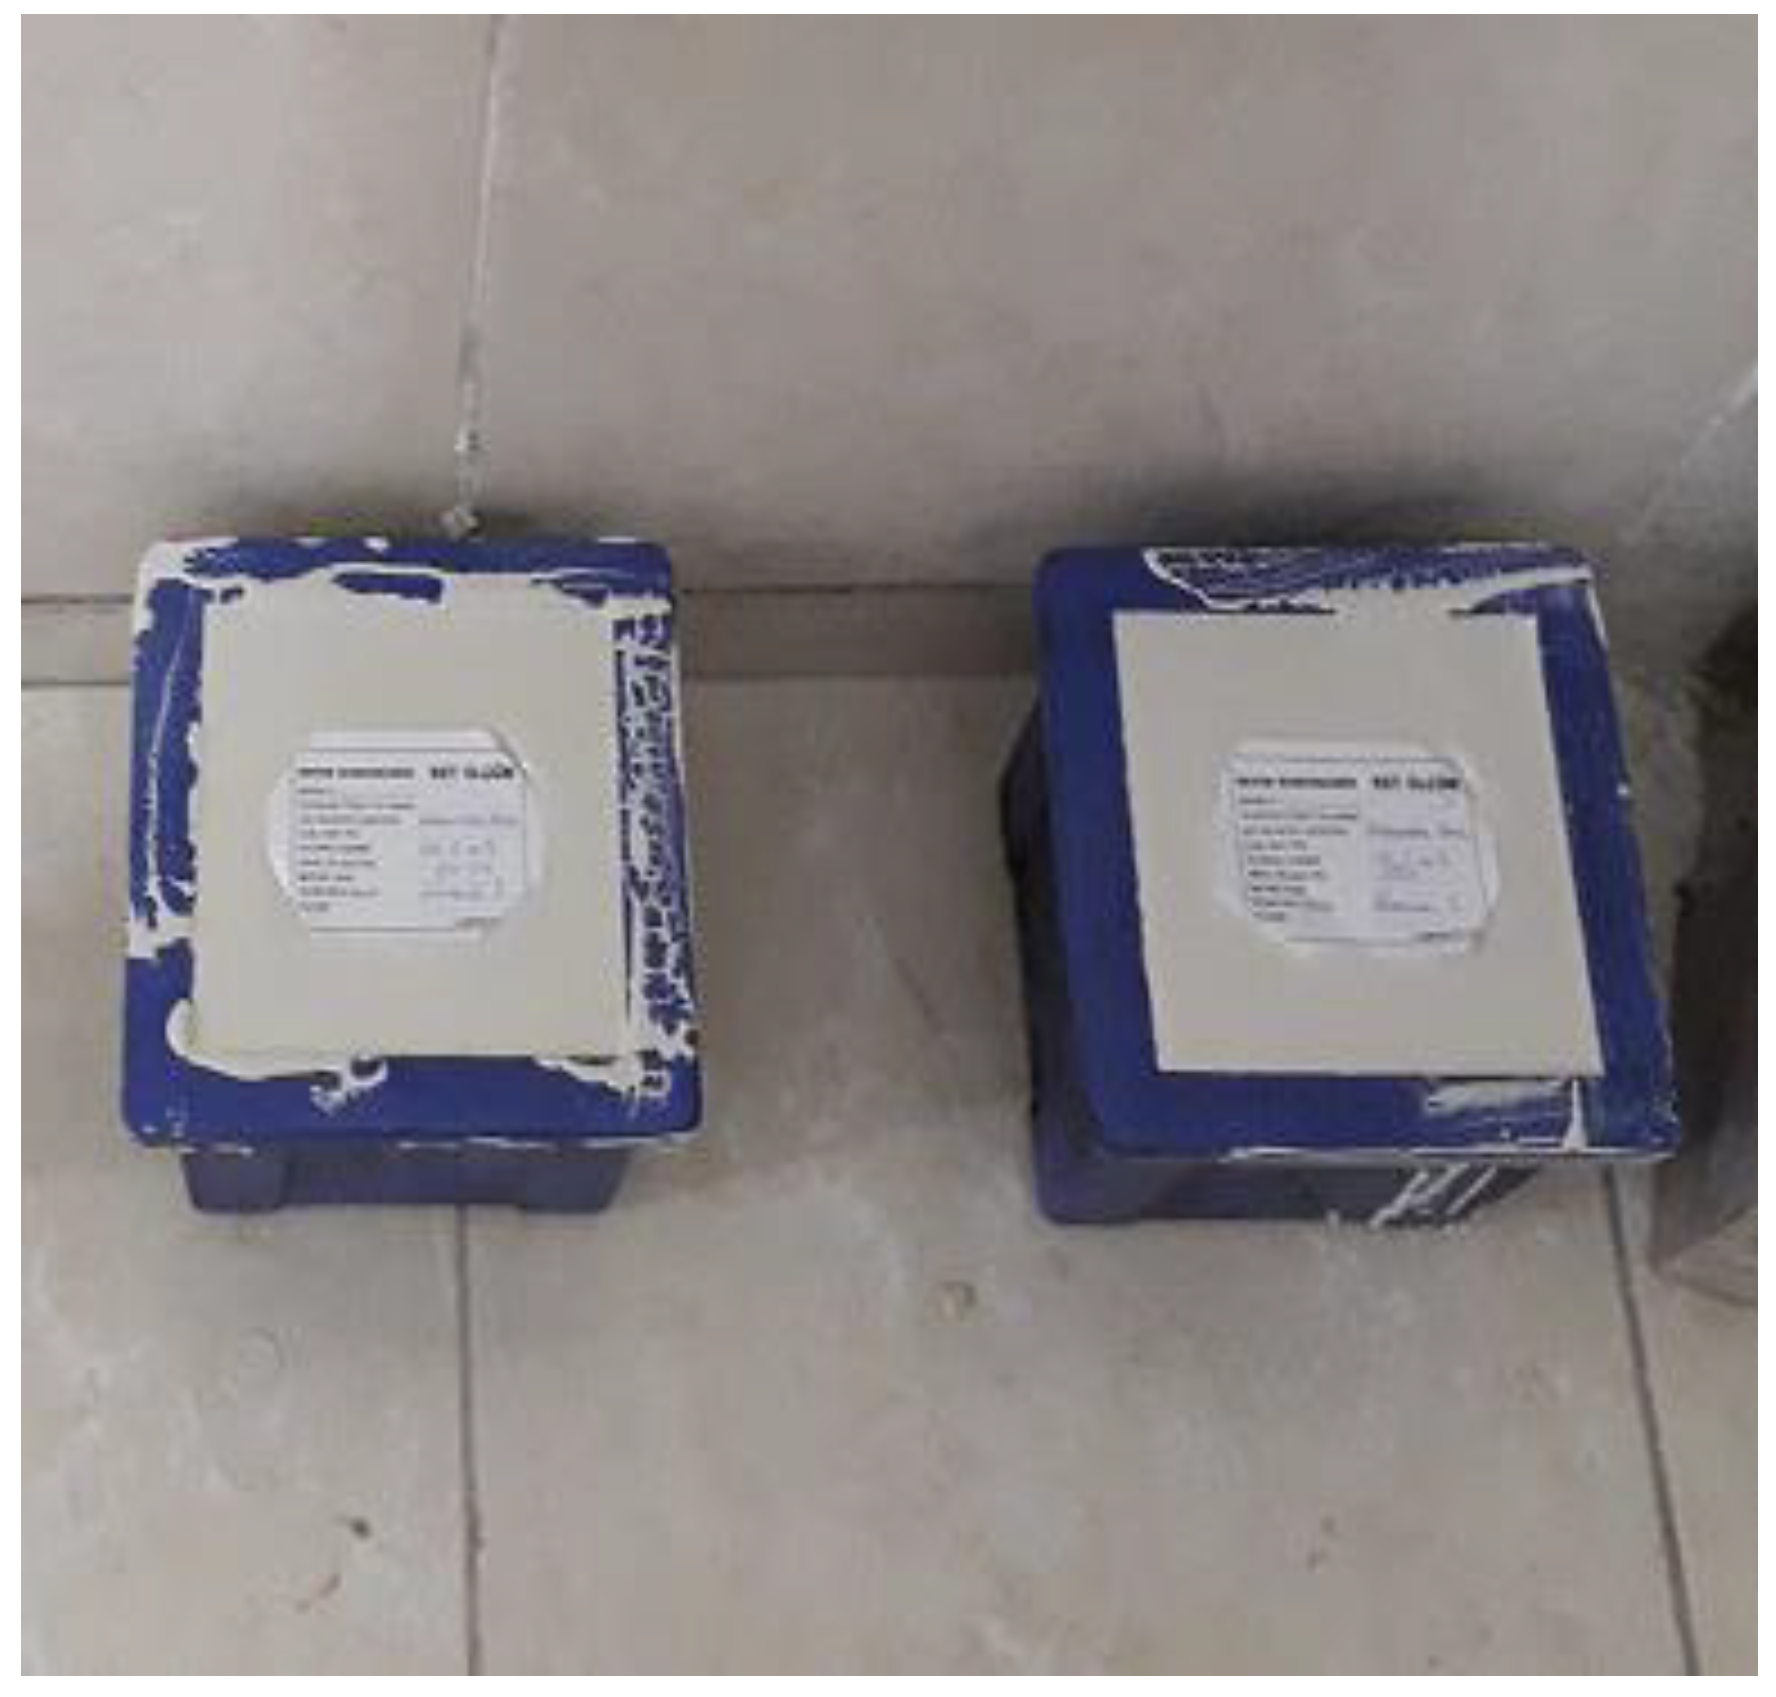
Figure 5.
Binder reference mortar for optimum binder fixation.
Figure 5.
Binder reference mortar for optimum binder fixation.
Figure 6.
Pumice binder mortar for optimum binder fixation.
Figure 6.
Pumice binder mortar for optimum binder fixation.
Figure 7.
Lime binder mortar for optimum binder fixation.
Figure 7.
Lime binder mortar for optimum binder fixation.
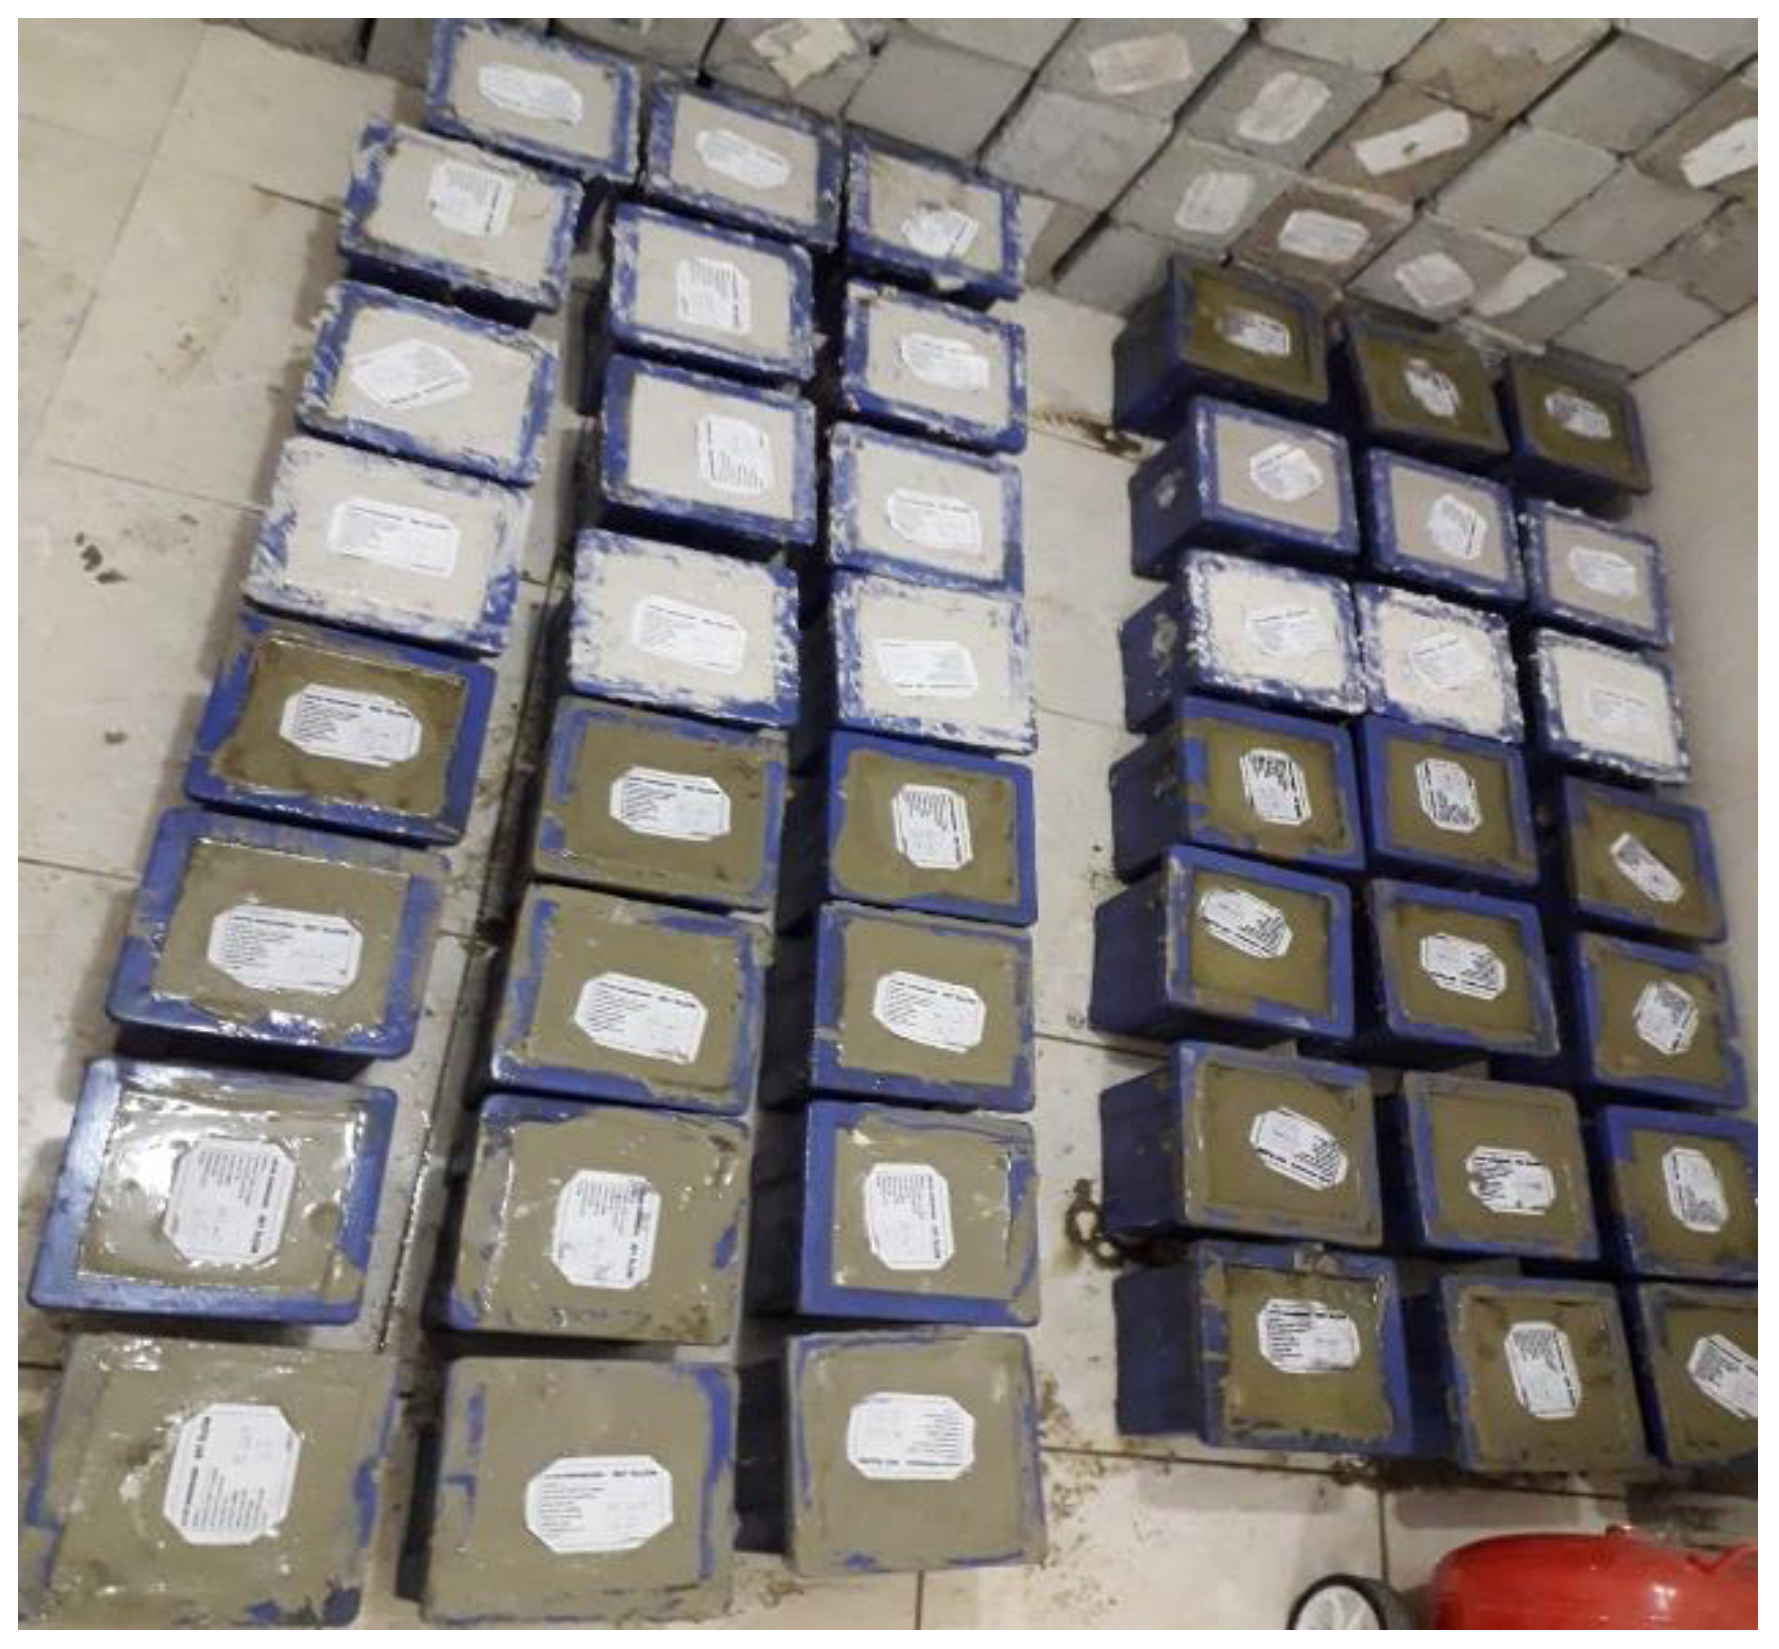
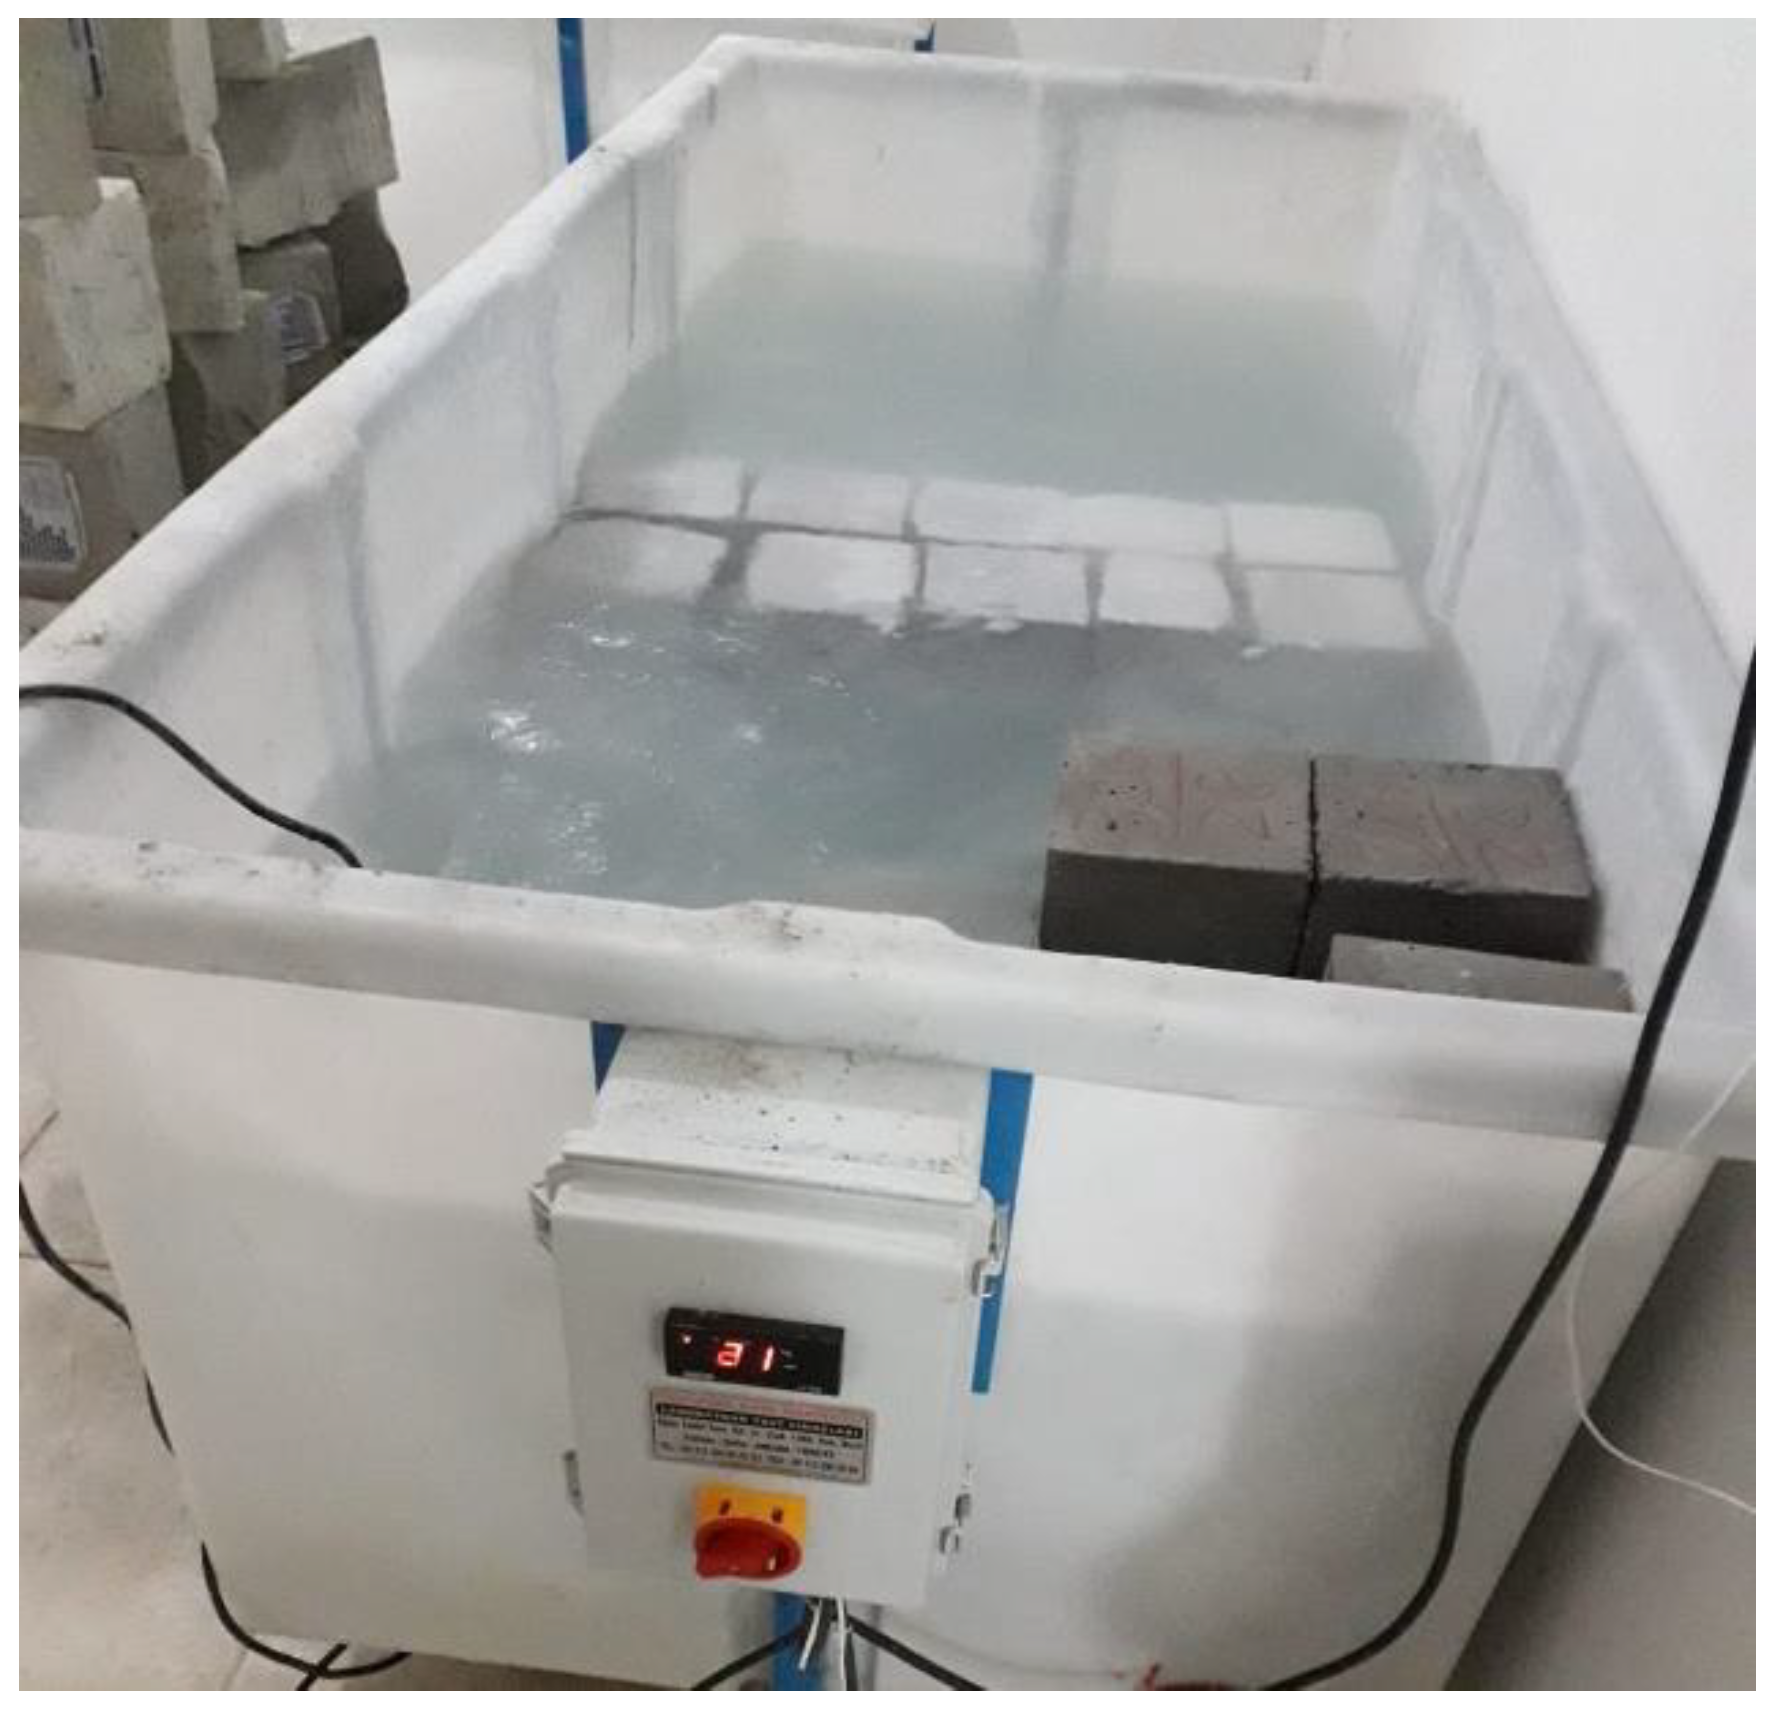
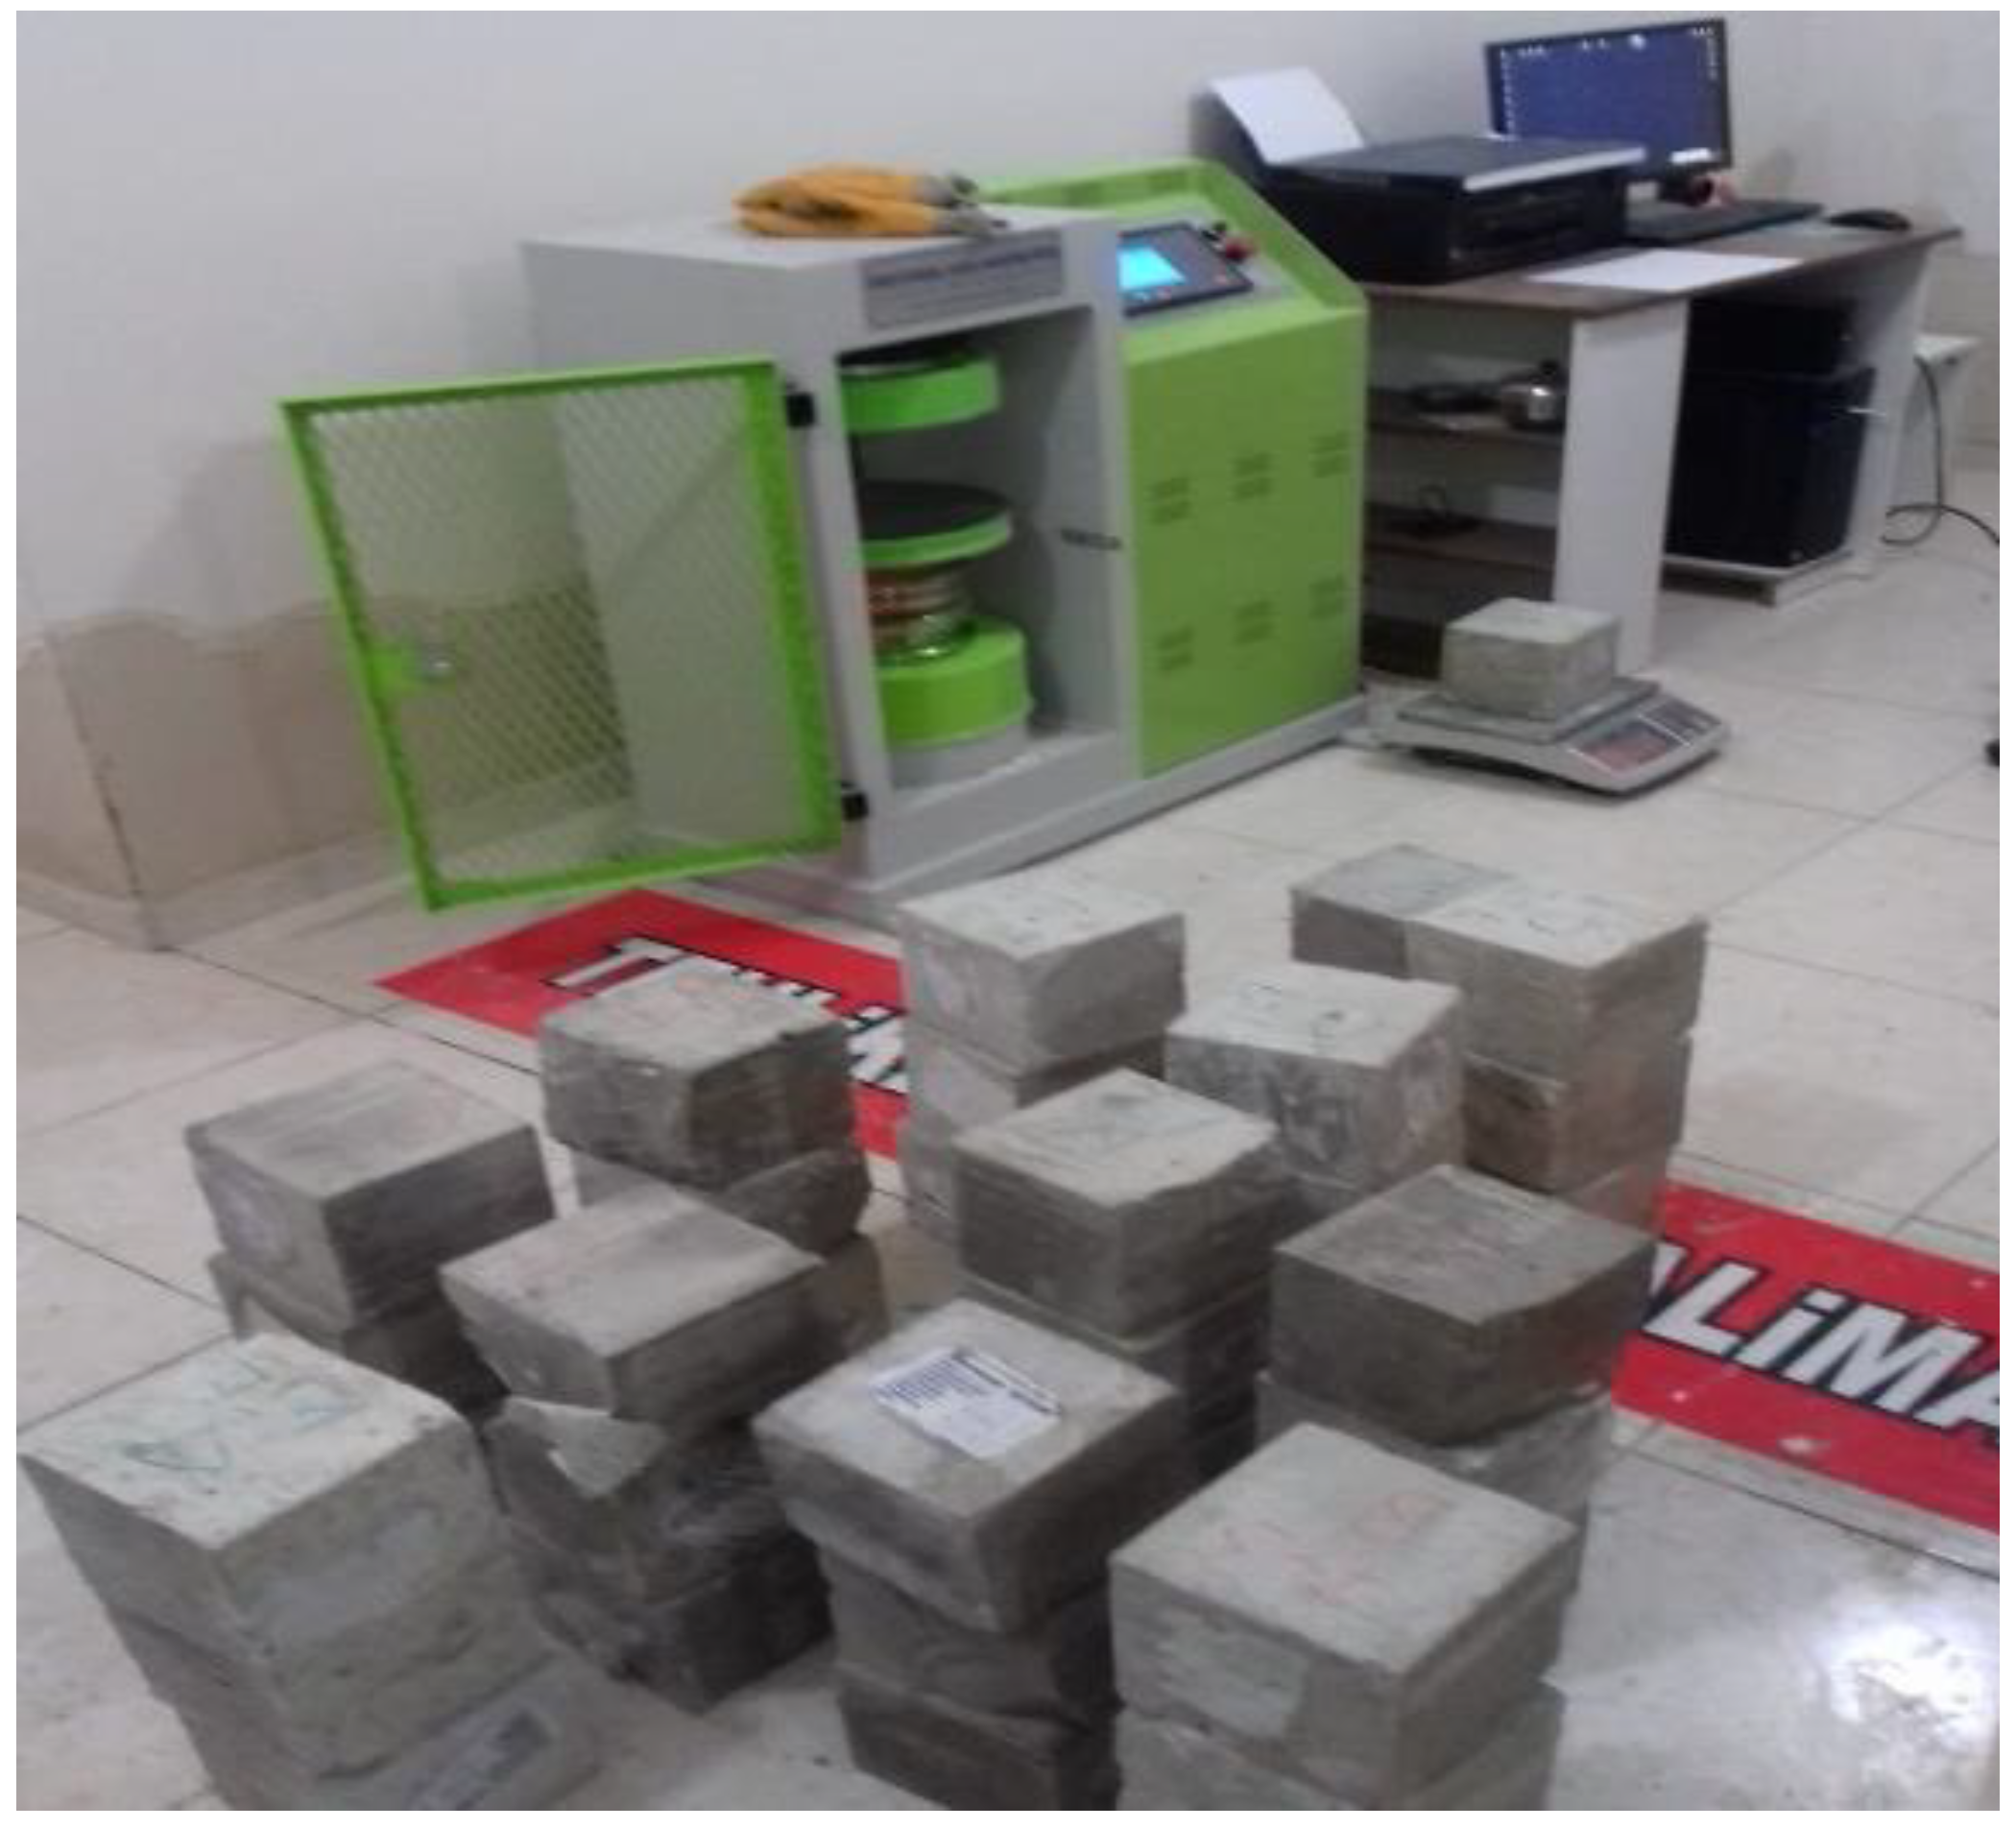
Figure 9.
Samples prepared for compressive strength tests.
Figure 9.
Samples prepared for compressive strength tests.
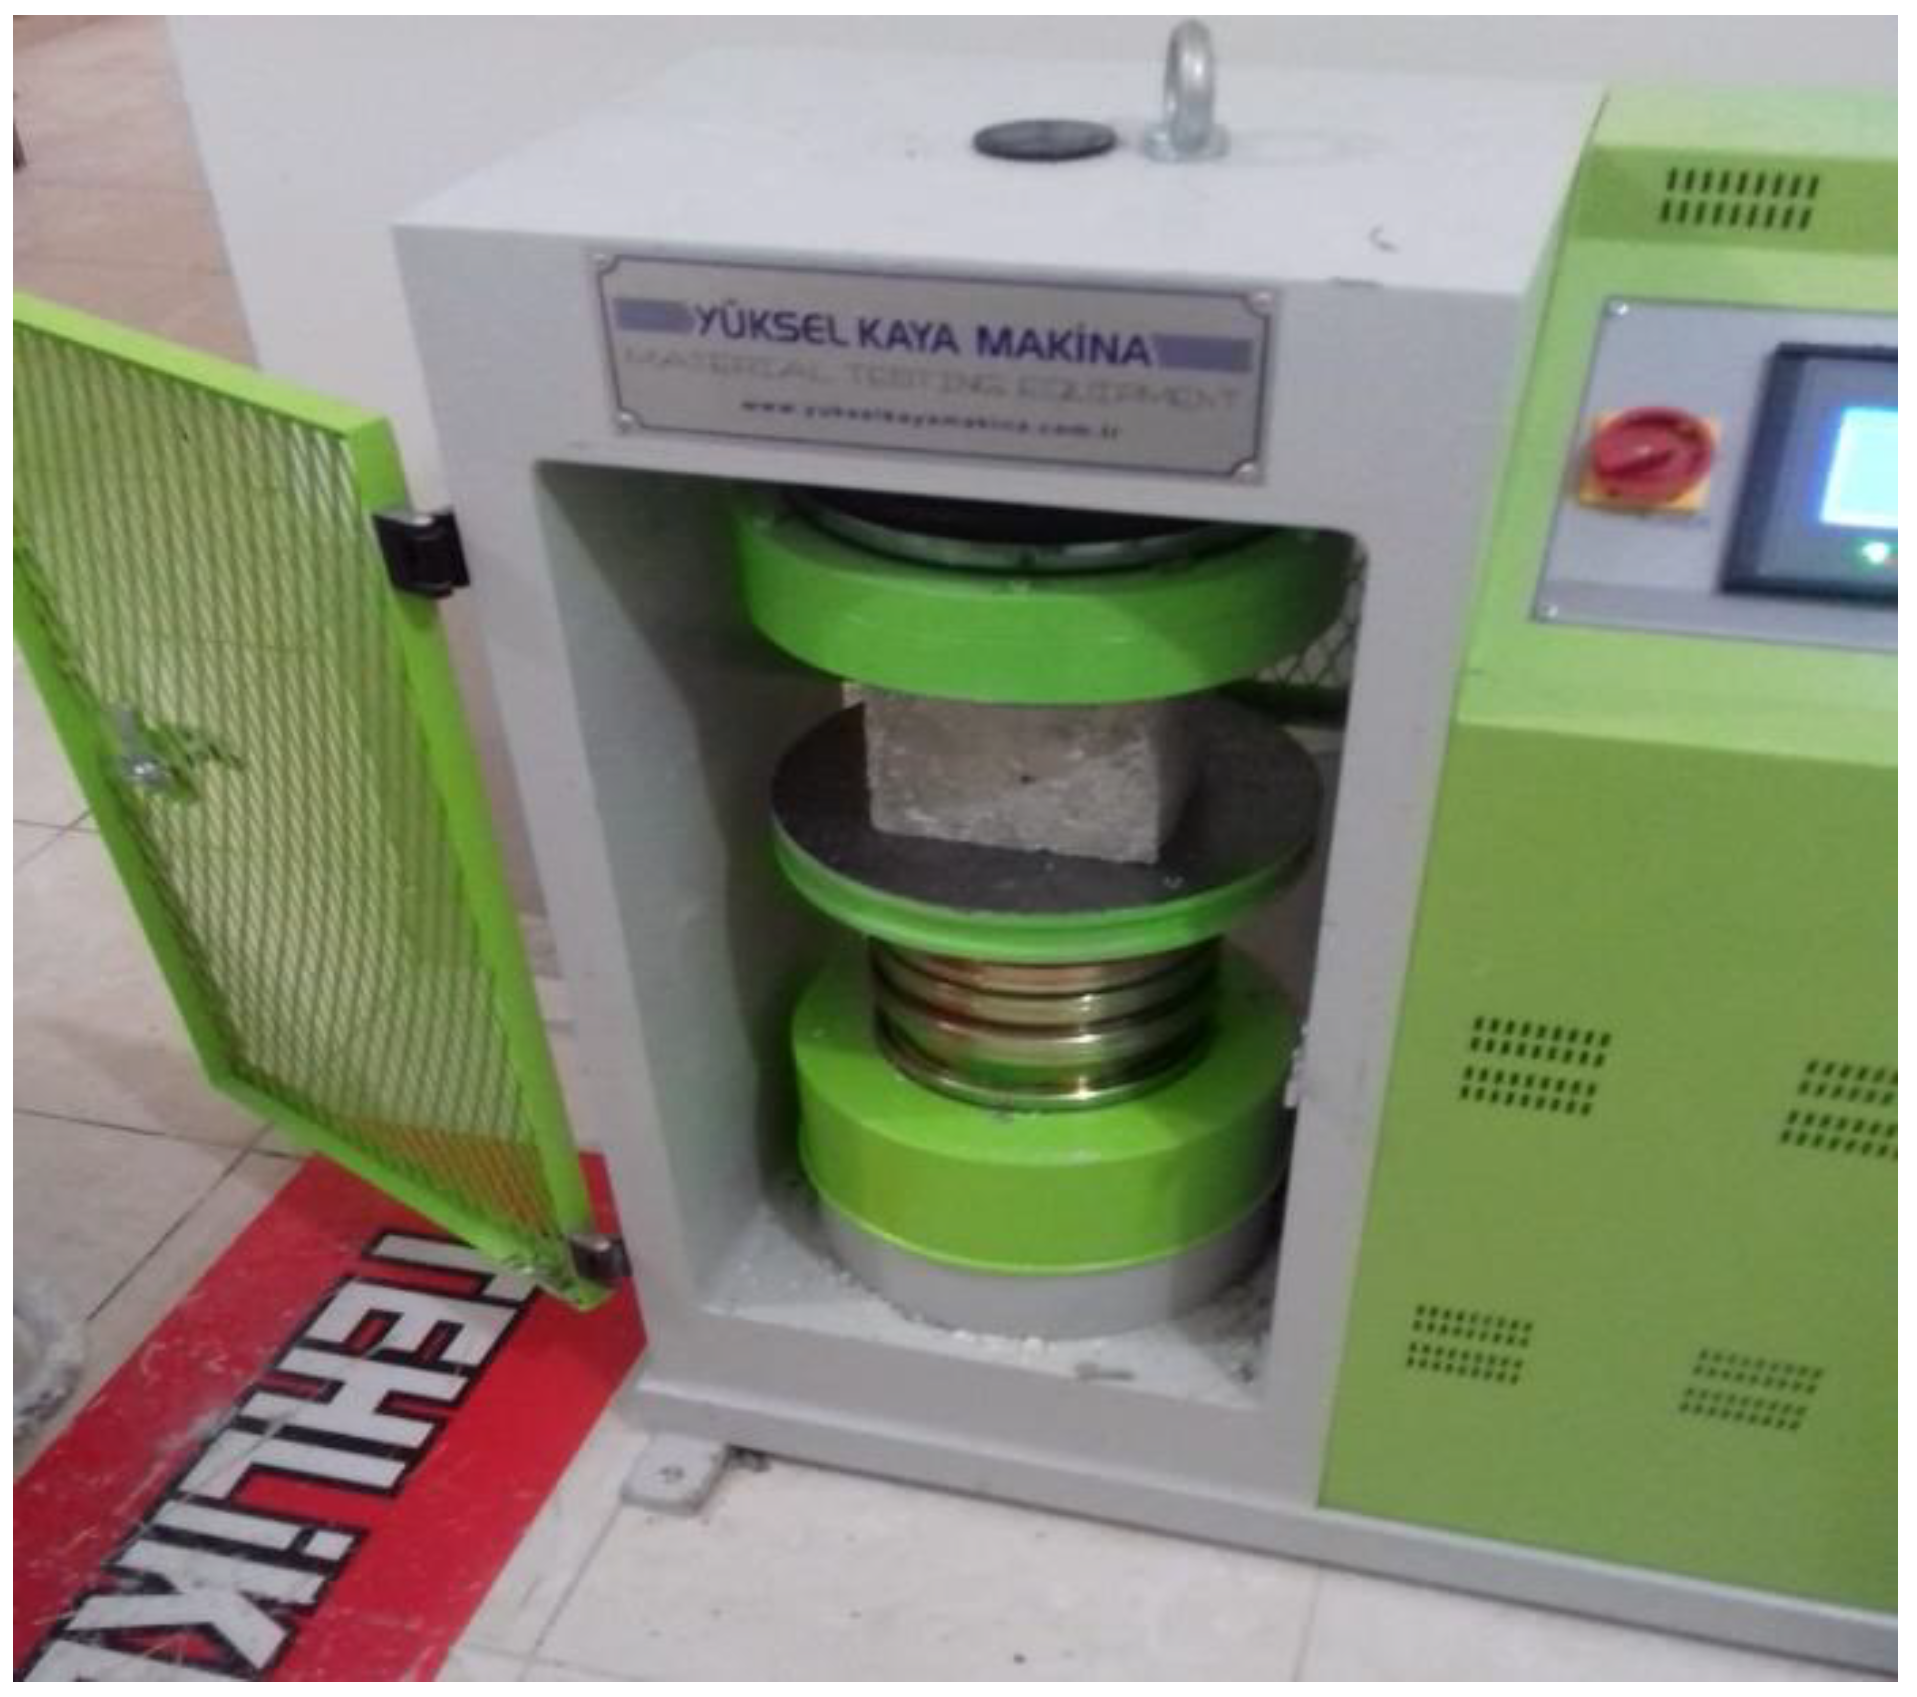
Figure 10.
Appearance of samples in compressive strength tester.
Figure 10.
Appearance of samples in compressive strength tester.
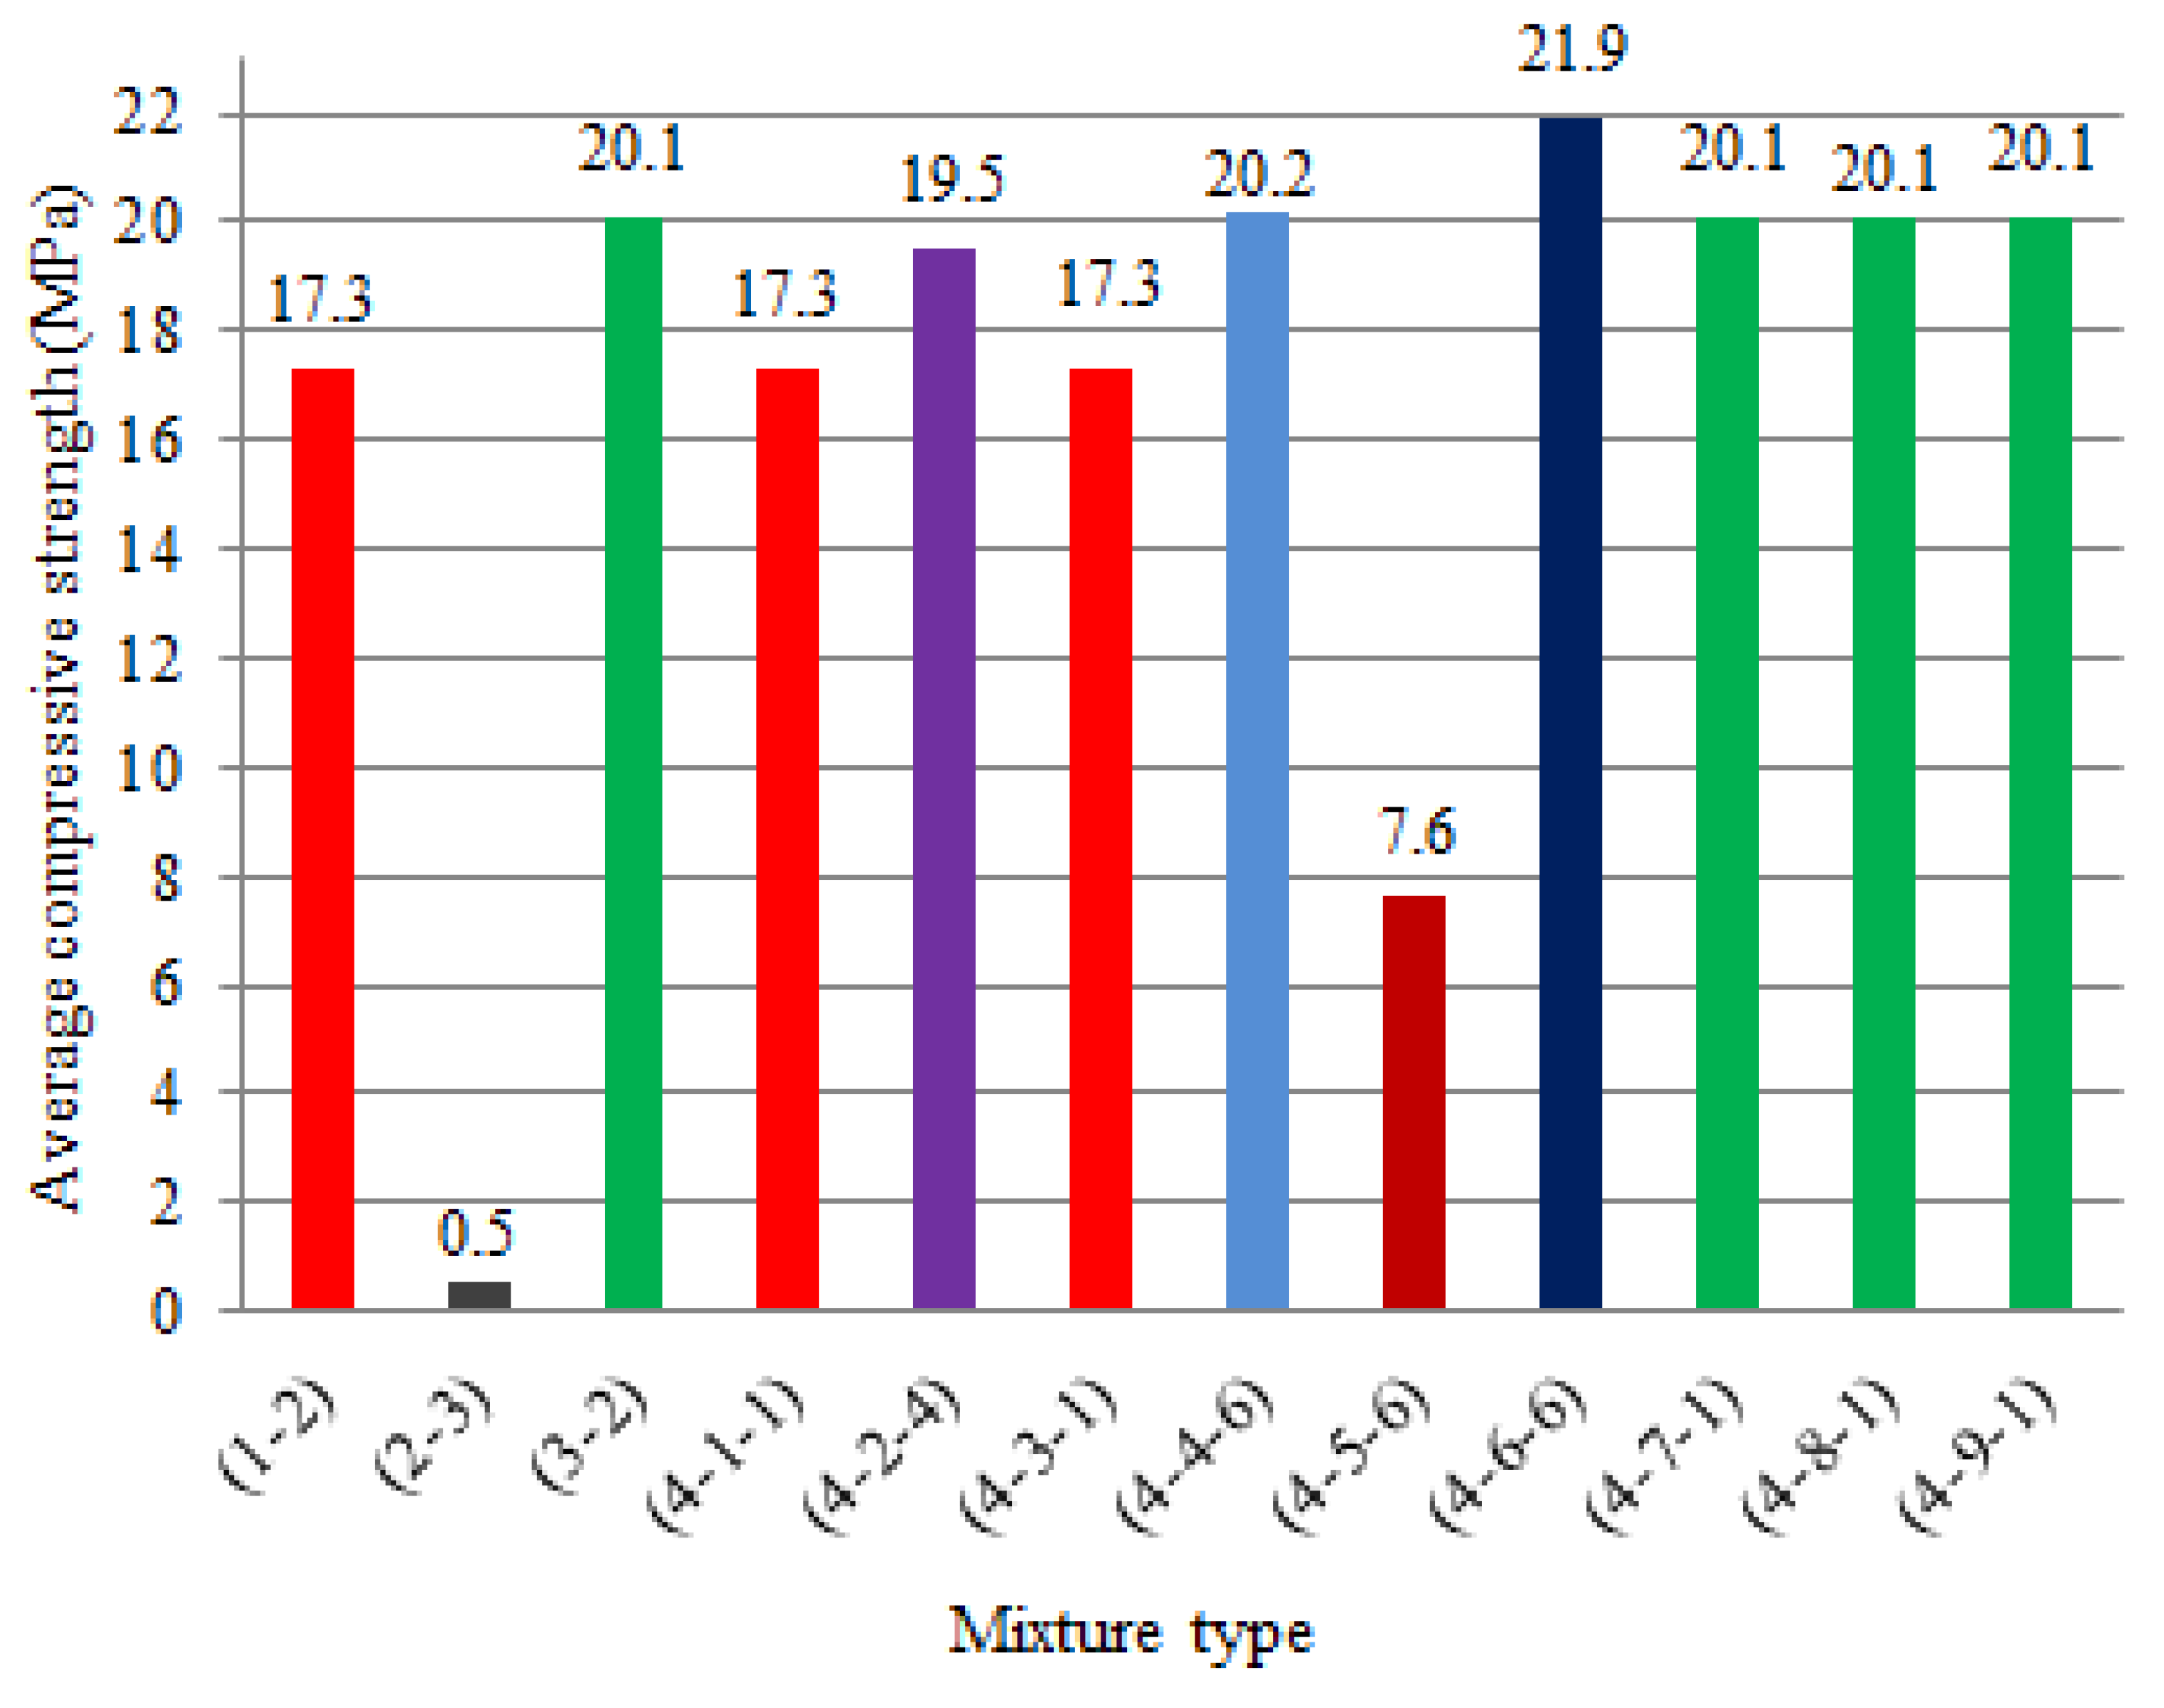
Figure 11.
The average compressive strength test results of all mixture type.
Figure 11.
The average compressive strength test results of all mixture type.
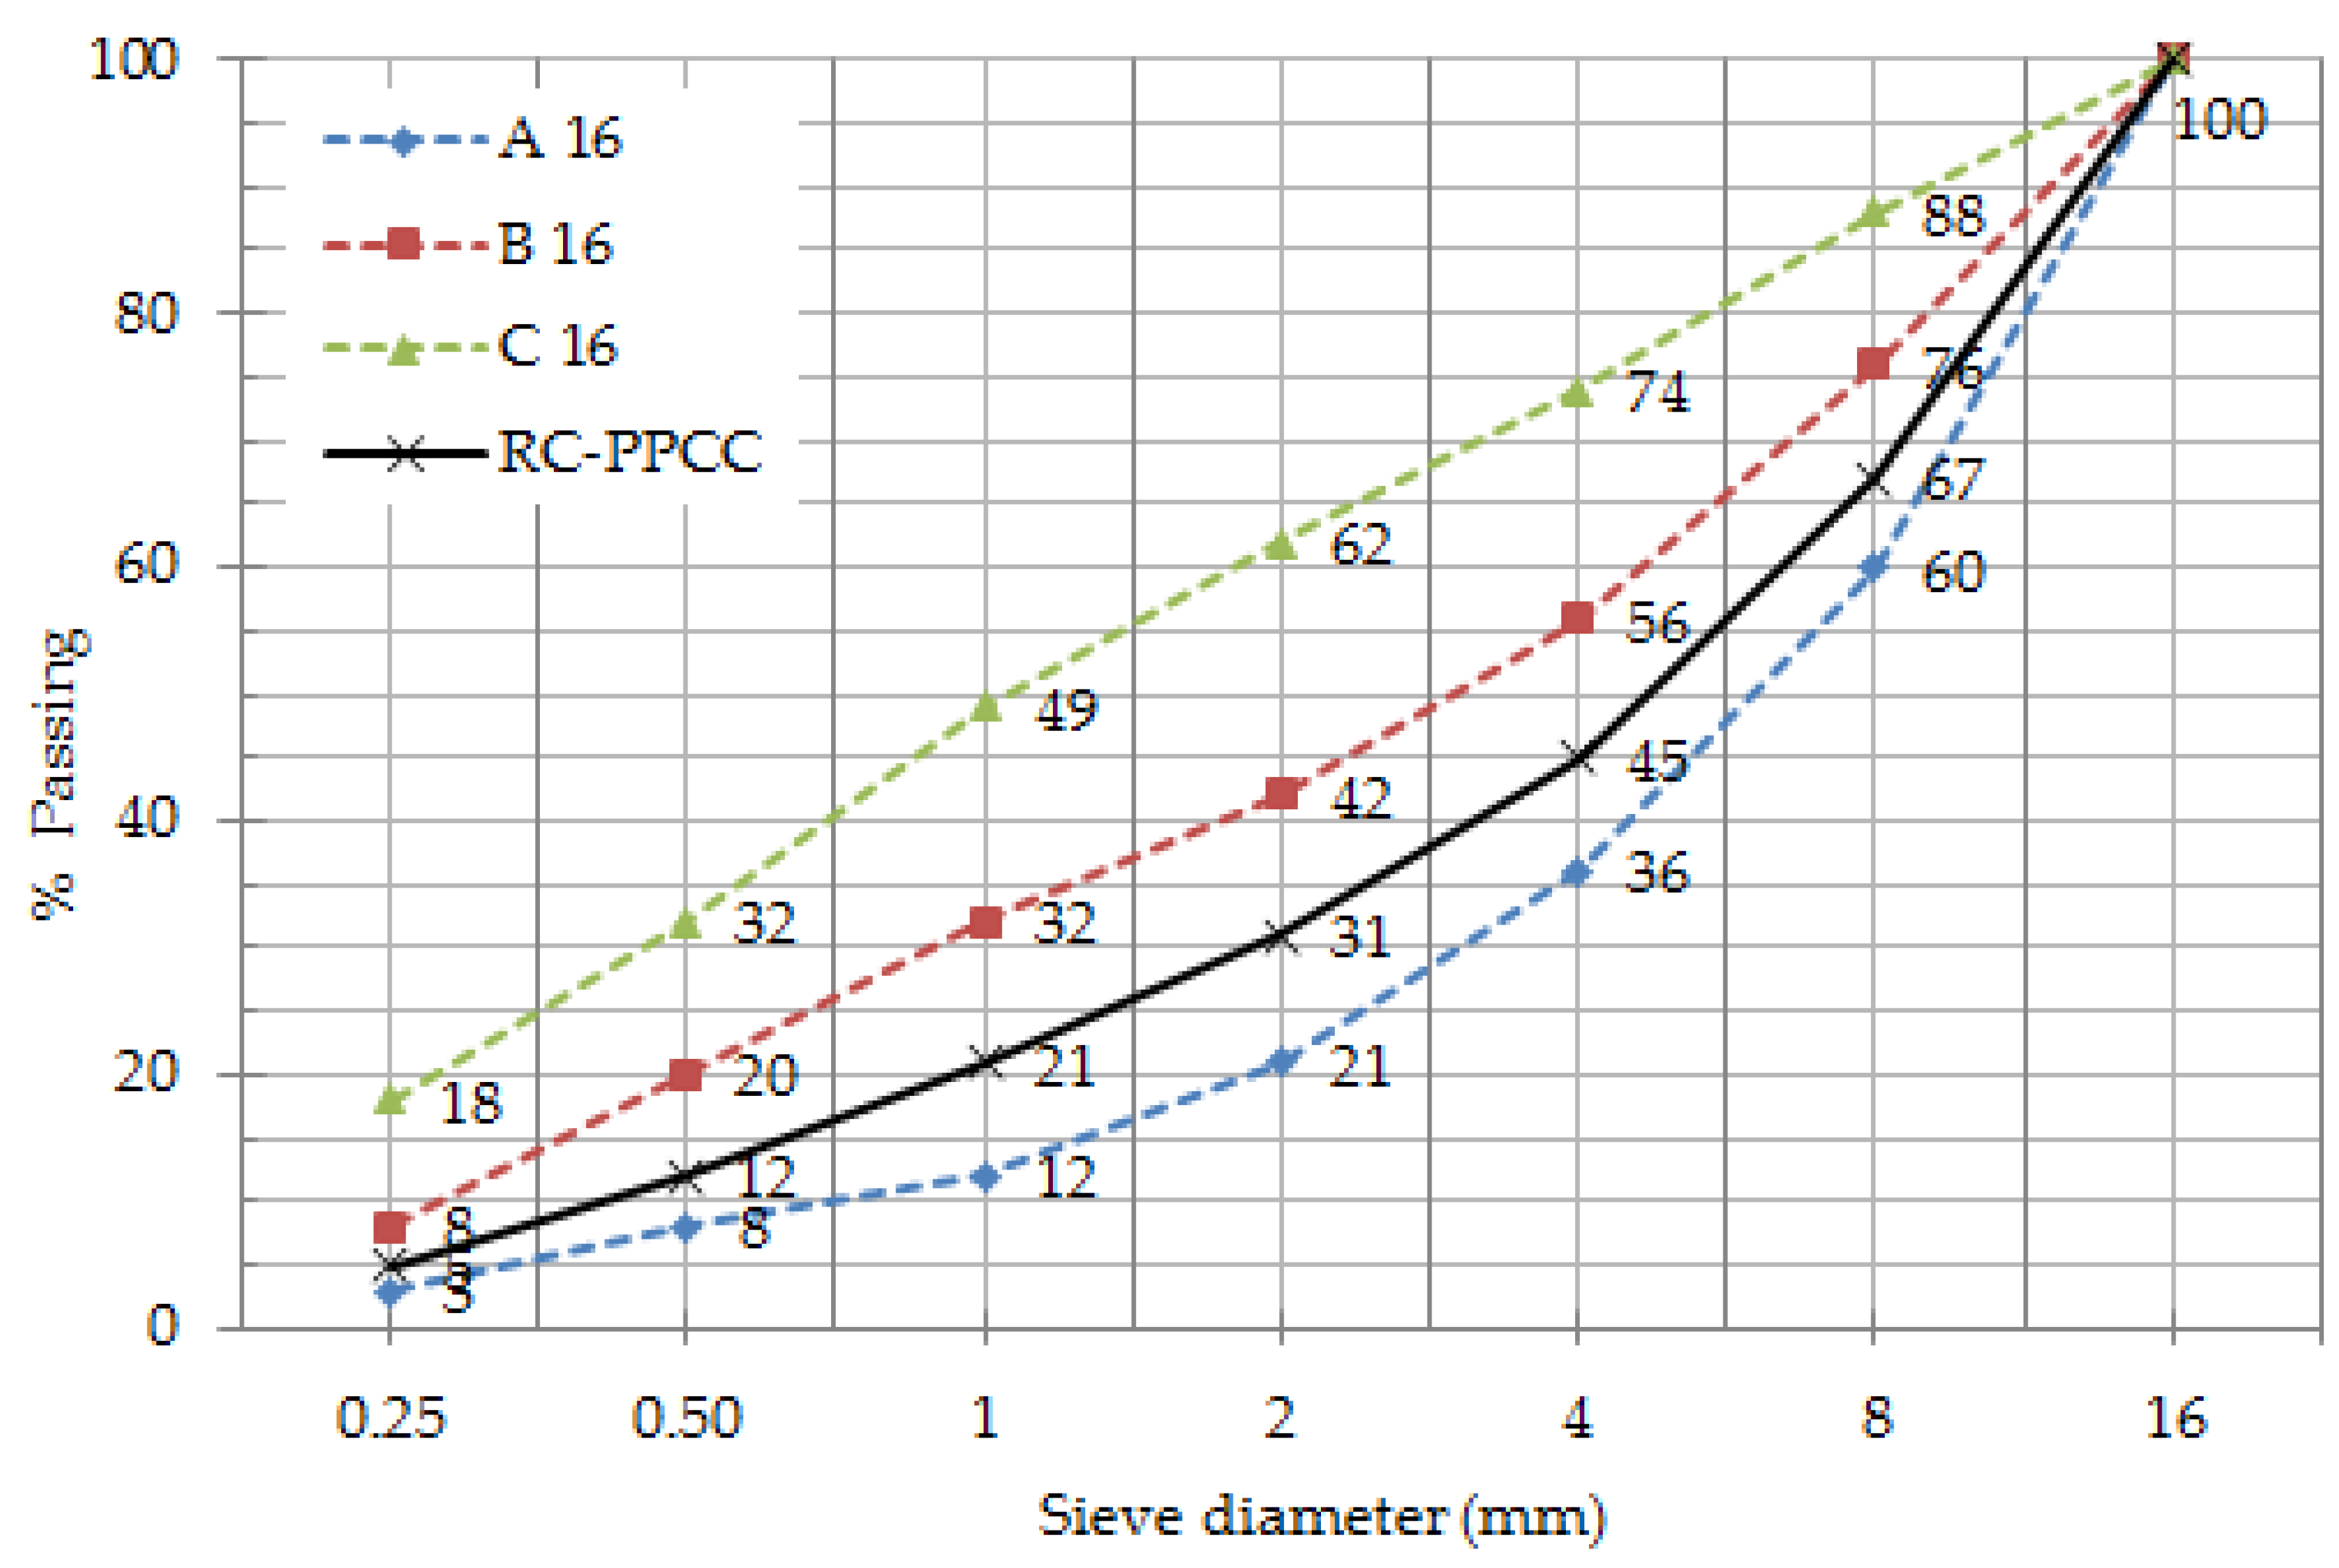
Figure 12.
Reference concrete (RC) and optimum binder concrete (PPCC) sieve analysis chart.
Figure 12.
Reference concrete (RC) and optimum binder concrete (PPCC) sieve analysis chart.
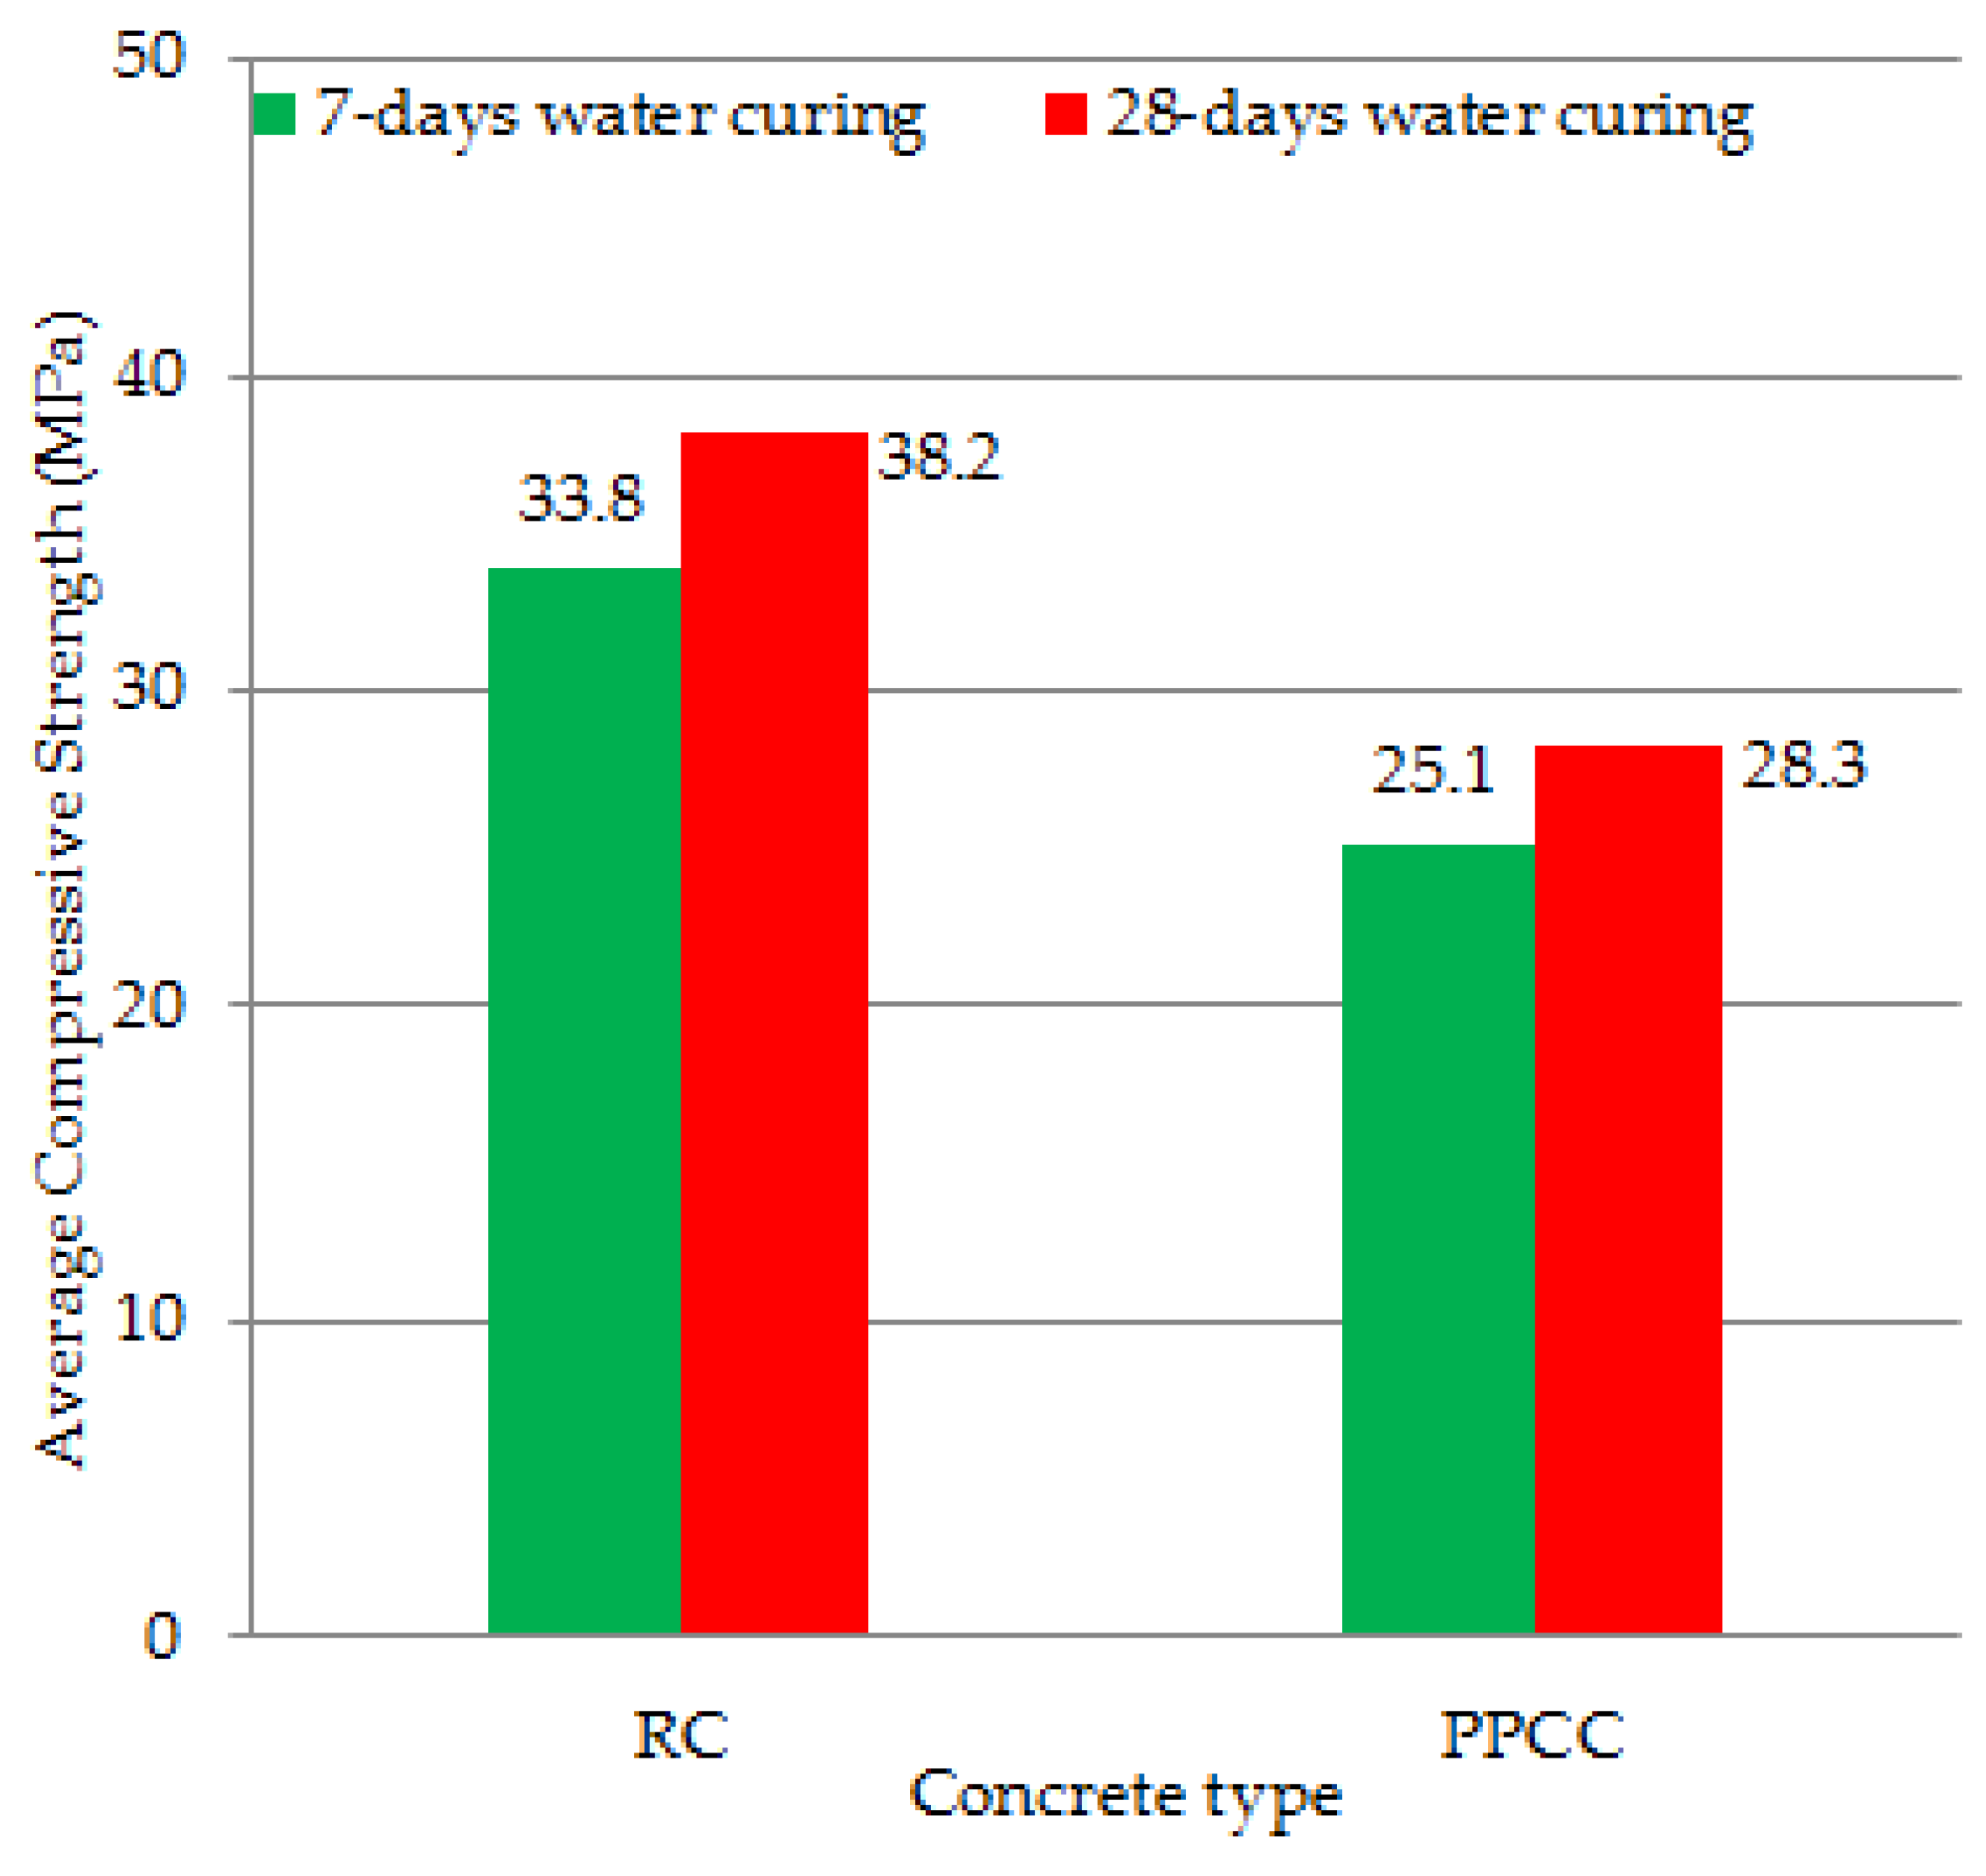
Figure 13.
The average compressive strength results of RC and PPCC concrete.
Figure 13.
The average compressive strength results of RC and PPCC concrete.
Figure 14.
The average bending strength results of RC and PPCC concrete.
Figure 14.
The average bending strength results of RC and PPCC concrete.
Table 1.
CEM I 42.5 R cement chemical properties.
Table 1.
CEM I 42.5 R cement chemical properties.
| Chemical Properties % |
|---|
| SiO2 | 18.90 |
| Al2O3 | 5.15 |
| Fe2O3 | 3.36 |
| CaO | 63.59 |
| MgO | 1.57 |
| SO3 | 2.65 |
| Loss of Ignition | 3.59 |
| K2O | 0.77 |
| Na2O | 0.40 |
| Cl | 0.02 |
Table 2.
Chemical properties of pumice and lime.
Table 2.
Chemical properties of pumice and lime.
| Sample | Loss of Ignition (%) | MgO (%) | Al2O3 (%) | SiO2 (%) | Na2O + K2O (%) | CaO (%) | Fe2O3 (%) | Ca (OH)2 (%) |
|---|
| Pumice | 3 | 0.6 | 14 | 70 | 9 | 0.9 | 2.5 | - |
| Lime | 7 | 3 | - | - | - | 85 | - | 80 |
Table 3.
Physical and mechanical properties of pumice, cement, and lime.
Table 3.
Physical and mechanical properties of pumice, cement, and lime.
| Property | Pumice | Cement | Lime |
|---|
| Specific gravity (g/cm3) | 2.415 | 3.130 | 1.800 |
| Water absorption by weight (%) | 22.59 | - | - |
| Los Angeles abrasion (%) | 73 | - | - |
Table 4.
Type-1 Mixing Ratios.
Table 4.
Type-1 Mixing Ratios.
| Mixture Type | Cement (C) (%) | Pumice Powder (%) | Lime (%) |
|---|
| 1-1 | 100 | 0 | 0 |
| 1-2 | 80 | 20 | 0 |
| 1-3 | 60 | 40 | 0 |
| 1-4 | 40 | 60 | 0 |
| 1-5 | 20 | 80 | 0 |
| 1-6 | 0 | 100 | 0 |
Table 5.
Type-2 mixing ratios.
Table 5.
Type-2 mixing ratios.
| Mixture Type | Cement (C) (%) | Pumice Powder (%) | Lime (%) |
|---|
| 2-1 | 0 | 100 | 0 |
| 2-2 | 0 | 80 | 20 |
| 2-3 | 0 | 60 | 40 |
| 2-4 | 0 | 40 | 60 |
| 2-5 | 0 | 20 | 80 |
| 2-6 | 0 | 0 | 100 |
Table 6.
Type-3 mixing ratios.
Table 6.
Type-3 mixing ratios.
| Mixture Type | Cement (C) (%) | Pumice Powder (%) | Lime (%) |
|---|
| 3-1 | 100 | 0 | 0 |
| 3-2 | 80 | 0 | 20 |
| 3-3 | 60 | 0 | 40 |
| 3-4 | 40 | 0 | 60 |
| 3-5 | 20 | 0 | 80 |
| 3-6 | 0 | 0 | 100 |
Table 7.
Type-4-1 mixing ratios.
Table 7.
Type-4-1 mixing ratios.
| Mixture Type | Cement (C) (%) | Pumice Powder (%) | Lime (%) |
|---|
| 4-1-1 | 80 | 20 | 0 |
| 4-1-2 | 64 | 20 | 16 |
| 4-1-3 | 48 | 20 | 32 |
| 4-1-4 | 32 | 20 | 48 |
| 4-1-5 | 16 | 20 | 64 |
| 4-1-6 | 0 | 20 | 80 |
Table 8.
Type-4-2 mixing ratios.
Table 8.
Type-4-2 mixing ratios.
| Mixture Type | Cement (C) (%) | Pumice Powder (%) | Lime (%) |
|---|
| 4-2-1 | 80 | 20 | 0 |
| 4-2-2 | 80 | 16 | 4 |
| 4-2-3 | 80 | 12 | 8 |
| 4-2-4 | 80 | 8 | 12 |
| 4-2-5 | 80 | 4 | 16 |
| 4-2-6 | 80 | 0 | 20 |
Table 9.
Type 4-3 mixing ratios.
Table 9.
Type 4-3 mixing ratios.
| Mixture Type | Cement (C) (%) | Pumice Powder (%) | Lime (%) |
|---|
| 4-3-1 | 80 | 20 | 0 |
| 4-3-2 | 66.6 | 16.7 | 16.7 |
| 4-3-3 | 57.1 | 14.3 | 28.6 |
| 4-3-4 | 50.0 | 12.5 | 37.5 |
| 4-3-5 | 44.4 | 11.2 | 44.4 |
| 4-3-6 | 40.0 | 10.0 | 50 |
Table 10.
Type 4-4 mixing ratios.
Table 10.
Type 4-4 mixing ratios.
| Mixture Type | Cement (C) (%) | Pumice Powder (%) | Lime (%) |
|---|
| 4-4-1 | 0 | 60 | 40 |
| 4-4-2 | 10 | 50 | 40 |
| 4-4-3 | 17 | 43 | 40 |
| 4-4-4 | 22.5 | 37.5 | 40 |
| 4-4-5 | 26.7 | 33.3 | 40 |
| 4-4-6 | 30 | 30 | 40 |
Table 11.
Type 4-5 Mixing Ratios.
Table 11.
Type 4-5 Mixing Ratios.
| Mixture Type | Cement (C) (%) | Pumice Powder (%) | Lime (%) |
|---|
| 4-5-1 | 0 | 60 | 40 |
| 4-5-2 | 6.7 | 60 | 33.3 |
| 4-5-3 | 11.4 | 60 | 28.6 |
| 4-5-4 | 15 | 60 | 25 |
| 4-5-5 | 17.8 | 60 | 22.2 |
| 4-5-6 | 20 | 60 | 20 |
Table 12.
Type 4-6 mixing ratios.
Table 12.
Type 4-6 mixing ratios.
| Mixture Type | Cement (C) (%) | Pumice Powder (%) | Lime (%) |
|---|
| 4-6-1 | 0 | 60 | 40 |
| 4-6-2 | 16.7 | 50 | 33.3 |
| 4-6-3 | 28.6 | 42.8 | 28.6 |
| 4-6-4 | 37.5 | 37.5 | 25 |
| 4-6-5 | 44.4 | 33.4 | 22.2 |
| 4-6-6 | 50 | 30 | 20 |
Table 13.
Type 4-7 mixing ratios.
Table 13.
Type 4-7 mixing ratios.
| Mixture Type | Cement (C) (%) | Pumice Powder (%) | Lime (%) |
|---|
| 4-7-1 | 80 | 0 | 20 |
| 4-7-2 | 64 | 16 | 20 |
| 4-7-3 | 48 | 32 | 20 |
| 4-7-4 | 32 | 48 | 20 |
| 4-7-5 | 16 | 64 | 20 |
| 4-7-6 | 0 | 80 | 20 |
| 4-8-1 | 80 | 0 | 20 |
Table 14.
Type 4-8 mixing ratios.
Table 14.
Type 4-8 mixing ratios.
| Mixture Type | Cement (C) (%) | Pumice Powder (%) | Lime (%) |
|---|
| 4-8-1 | 80 | 0 | 20 |
| 4-8-2 | 80 | 4 | 16 |
| 4-8-3 | 80 | 8 | 12 |
| 4-8-4 | 80 | 12 | 8 |
| 4-8-5 | 80 | 16 | 4 |
| 4-8-6 | 80 | 20 | 0 |
Table 15.
Type 4-9 mixing ratios.
Table 15.
Type 4-9 mixing ratios.
| Mixture Type | Cement (C) (%) | Pumice Powder (%) | Lime (%) |
|---|
| 4-9-1 | 80 | 0 | 20 |
| 4-9-2 | 66.6 | 16.7 | 16.7 |
| 4-9-3 | 57.1 | 28.6 | 14.3 |
| 4-9-4 | 50.0 | 37.5 | 12.5 |
| 4-9-5 | 44.4 | 44.4 | 11.2 |
| 4-9-6 | 40.0 | 50.0 | 10.0 |
Table 16.
Reference concrete material quantities.
Table 16.
Reference concrete material quantities.
| Materials | Quantity (kg/m3) |
|---|
| Portland Cement | 450 |
| Crushed Stone (0–4 mm) | 792 |
| Crushed Stone (4–8 mm) | 388 |
| Crushed Stone (8–16 mm) | 581 |
| Water | 189 |
| Total | 2400 |
Table 17.
Amounts of concrete material at optimum binder ratio.
Table 17.
Amounts of concrete material at optimum binder ratio.
| Materials | Quantity (kg/m3) |
|---|
| Portland Cement | 225 |
| Pumice powder (0–0.04 mm) | 135 |
| Lime | 90 |
| Crushed Stone (0–4 mm) | 792 |
| Crushed Stone (4–8 mm) | 388 |
| Crushed Stone (8–16 mm) | 581 |
| Water | 189 |
| Total | 2400 |
Table 18.
Coating concrete slump values.
Table 18.
Coating concrete slump values.
| Type of Concrete | Slump, cm |
|---|
| Minimum | Maximum |
|---|
| Coating, Precast, Roller Compacted Concrete | 1–2 | 3–4 |
| Mass Concrete | 2.5 | 5.0 |
| Reinforced Concrete (Very Equipped) | 2.5 | 10 |
| Reinforced Concrete (Less Equipped) | 2.5 | 7.5 |
Table 19.
Approximate water/cement ratios according to concrete compressive strengths.
Table 19.
Approximate water/cement ratios according to concrete compressive strengths.
| Compressive Strength (28 Days) 150 × 300 mm Cylinder (MPa) | Water/Cement Ratio |
|---|
| Non-Air Entrained Concrete | Air Entrained Concrete |
|---|
| 15 | 0.79 | 0.70 |
| 20 | 0.69 | 0.60 |
| 25 | 0.61 | 0.52 |
| 30 | 0.54 | 0.45 |
| 35 | 0.47 | 0.39 |
| 40 | 0.42 | 0.33 |
| 45 | 0.37 | 0.29 |
| 50 | 0.33 | 0.25 |
Table 20.
Average compressive strengths according to concrete classes.
Table 20.
Average compressive strengths according to concrete classes.
| Concrete Category | Characteristic Compressive Strength (MPa) | Target Compressive Strength (MPa) |
|---|
| Characteristic Cylinder (150 × 300) mm Compressive Strength | Equivalent Cube (150 × 150 × 150) mm Compressive Strength | (150 × 300) mm Cylinder | (150 × 150 × 150) mm Cube |
|---|
| C30/37 | 30 | 37 | 36 | 43 |
Table 21.
Mass of test specimens for normal aggregates.
Table 21.
Mass of test specimens for normal aggregates.
| Aggregate Grain Size (D) (up to) mm | Sample Amount Required for Experiment (minimum) kg |
|---|
| 63 | 40 |
| 32 | 10 |
| 16 | 2.6 |
| 8 | 0.6 |
| <4 | 0.2 |
Table 22.
Type-1 mixture quantity, unit volume weight and compressive strength test results.
Table 22.
Type-1 mixture quantity, unit volume weight and compressive strength test results.
| Mixture Type | BHA (t/m3) | Cement (C) (kg) | Pumice Powder (kg) | Lime (kg) | Water (kg) | Average Compressive Strength (MPa) |
|---|
| 1-1 | 5.834 | 1500 | 0 | 0 | 900 | 29.7 |
| 1-2 | 5.534 | 1200 | 300 | 0 | 900 | 17.3 |
| 1-3 | 5.503 | 900 | 600 | 0 | 900 | 12.7 |
| 1-4 | 5.292 | 600 | 900 | 0 | 900 | 10.1 |
| 1-5 | 5.058 | 300 | 1200 | 0 | 900 | 7.6 |
| 1-6 | 4.850 | 0 | 1500 | 0 | 900 | 0.2 |
Table 23.
Type-2 mixture quantity, unit volume weight and compressive strength test results.
Table 23.
Type-2 mixture quantity, unit volume weight and compressive strength test results.
| Mixture Type | BHA (t/m3) | Cement (C) (kg) | Pumice Powder (kg) | Lime (kg) | Water (kg) | Average Compressive Strength (MPa) |
|---|
| 2-1 | 4.850 | 0 | 1500 | 0 | 900 | 0.2 |
| 2-2 | 4.863 | 0 | 1200 | 300 | 900 | 0.3 |
| 2-3 | 4.874 | 0 | 900 | 600 | 900 | 0.5 |
| 2-4 | 4.916 | 0 | 600 | 900 | 900 | 0.4 |
| 2-5 | 4.945 | 0 | 300 | 1200 | 900 | 0.3 |
| 2-6 | 4.975 | 0 | 0 | 1500 | 900 | 0.2 |
Table 24.
Type-3 mixture quantity, unit volume weight and compressive strength test results.
Table 24.
Type-3 mixture quantity, unit volume weight and compressive strength test results.
| Mixture Type | BHA (t/m3) | Cement (C) (kg) | Pumice Powder (kg) | Lime (kg) | Water (kg) | Average Compressive Strength (MPa) |
|---|
| 3-1 | 5.834 | 1500 | 0 | 0 | 900 | 29.7 |
| 3-2 | 5.806 | 1200 | 0 | 300 | 900 | 20.1 |
| 3-3 | 5.663 | 900 | 0 | 600 | 900 | 14.5 |
| 3-4 | 5.550 | 600 | 0 | 900 | 900 | 13.0 |
| 3-5 | 5.325 | 300 | 0 | 1200 | 900 | 8.1 |
| 3-6 | 4.975 | 0 | 0 | 1500 | 900 | 0.2 |
Table 25.
Type-1 mixture quantity, weight per unit of volume and compression test results.
Table 25.
Type-1 mixture quantity, weight per unit of volume and compression test results.
| Mixture Type | BHA (t/m3) | Cement (C) (kg) | Pumice Powder (kg) | Lime (kg) | Water (kg) | Average Compressive Strength (MPa) |
|---|
| 4-1-1 | 5.534 | 1200 | 300 | 0 | 900 | 17.3 |
| 4-1-2 | 5.666 | 960 | 300 | 240 | 900 | 15.6 |
| 4-1-3 | 5.626 | 720 | 300 | 480 | 900 | 9.6 |
| 4-1-4 | 5.420 | 480 | 300 | 720 | 900 | 4.3 |
| 4-1-5 | 5.198 | 240 | 300 | 960 | 900 | 1.2 |
| 4-1-6 | 4.945 | 0 | 300 | 1200 | 900 | 1.1 |
Table 26.
Type-2 mixture quantity, weight per unit of volume and compression test results.
Table 26.
Type-2 mixture quantity, weight per unit of volume and compression test results.
| Mixture Type | BHA (t/m3) | Cement (C) (kg) | Pumice Powder (kg) | Lime (kg) | Water (kg) | Average Compressive Strength (MPa) |
|---|
| 4-2-1 | 5.534 | 1200 | 300 | 0 | 900 | 17.3 |
| 4-2-2 | 5.559 | 1200 | 240 | 60 | 900 | 15.4 |
| 4-2-3 | 5.624 | 1200 | 180 | 120 | 900 | 17.4 |
| 4-2-4 | 5.717 | 1200 | 120 | 180 | 900 | 19.5 |
| 4-2-5 | 5.780 | 1200 | 60 | 240 | 900 | 18.0 |
| 4-2-6 | 5.806 | 1200 | 0 | 300 | 900 | 20.1 |
Table 27.
Type-4-3 mixture quantity, weight per unit of volume and compression test results.
Table 27.
Type-4-3 mixture quantity, weight per unit of volume and compression test results.
| Mixture Type | BHA (t/m3) | Cement (C) (kg) | Pumice Powder (kg) | Lime (kg) | Water (kg) | Average Compressive Strength (MPa) |
|---|
| 4-3-1 | 5.534 | 1200 | 300 | 0 | 900 | 17.3 |
| 4-3-2 | 5.516 | 999 | 250.5 | 250.5 | 900 | 15.5 |
| 4-3-3 | 5.508 | 856.5 | 214.5 | 429 | 900 | 9.2 |
| 4-3-4 | 5.385 | 750 | 187.5 | 562.5 | 900 | 4.2 |
| 4-3-5 | 5.303 | 666 | 168 | 666 | 900 | 1.2 |
| 4-3-6 | 5.225 | 600 | 150 | 750 | 900 | 1.1 |
Table 28.
Type-4-4 mixture quantity, weight per unit of volume and compression test results.
Table 28.
Type-4-4 mixture quantity, weight per unit of volume and compression test results.
| Mixture Type | BHA (t/m3) | Cement (C) (kg) | Pumice Powder (kg) | Lime (kg) | Water (kg) | Average Compressive Strength (MPa) |
|---|
| 4-4-1 | 4.874 | 0 | 900 | 600 | 900 | 0.5 |
| 4-4-2 | 5.152 | 150 | 750 | 600 | 900 | 1.3 |
| 4-4-3 | 5.166 | 255 | 645 | 600 | 900 | 3.5 |
| 4-4-4 | 5.492 | 337.5 | 562.5 | 600 | 900 | 7.0 |
| 4-4-5 | 5.607 | 400.5 | 499.5 | 600 | 900 | 15.6 |
| 4-4-6 | 5.710 | 450 | 450 | 600 | 900 | 20.2 |
Table 29.
Type-4-5 mixture quantity, weight per unit of volume and compression test results.
Table 29.
Type-4-5 mixture quantity, weight per unit of volume and compression test results.
| Mixture Type | BHA (t/m3) | Cement (C) (kg) | Pumice Powder (kg) | Lime (kg) | Water (kg) | Average Compressive Strength (MPa) |
|---|
| 4-5-1 | 4.874 | 0 | 900 | 600 | 900 | 0.5 |
| 4-5-2 | 4.891 | 100.5 | 900 | 499.5 | 900 | 1.5 |
| 4-5-3 | 4.915 | 171 | 900 | 429 | 900 | 1.9 |
| 4-5-4 | 4.957 | 225 | 900 | 375 | 900 | 3.1 |
| 4-5-5 | 5.013 | 267 | 900 | 333 | 900 | 5.2 |
| 4-5-6 | 5.058 | 300 | 900 | 300 | 900 | 7.6 |
Table 30.
Type-4-6 mixture quantity, weight per unit of volume and compression test results.
Table 30.
Type-4-6 mixture quantity, weight per unit of volume and compression test results.
| Mixture Type | BHA (t/m3) | Cement (C) (kg) | Pumice Powder (kg) | Lime (kg) | Water (kg) | Average Compressive Strength (MPa) |
|---|
| 4-6-1 | 4.874 | 0 | 900 | 600 | 900 | 0.5 |
| 4-6-2 | 4.913 | 250.5 | 750 | 499.5 | 900 | 0.9 |
| 4-6-3 | 4.951 | 429 | 642 | 429 | 900 | 4.9 |
| 4-6-4 | 4.997 | 562.5 | 562.5 | 375 | 900 | 10.2 |
| 4-6-5 | 5.015 | 666 | 501 | 333 | 900 | 15.6 |
| 4-6-6 | 5.037 | 750 | 450 | 300 | 900 | 21.9 |
Table 31.
Type-4-7 mixture quantity, weight per unit of volume and compression test results.
Table 31.
Type-4-7 mixture quantity, weight per unit of volume and compression test results.
| Mixture Type | BHA (t/m3) | Cement (C) (kg) | Pumice Powder (kg) | Lime (kg) | Water (kg) | Average Compressive Strength (MPa) |
|---|
| 4-7-1 | 5.806 | 1200 | 0 | 300 | 900 | 20.1 |
| 4-7-2 | 5.607 | 960 | 240 | 300 | 900 | 15.6 |
| 4-7-3 | 5.492 | 720 | 480 | 300 | 900 | 7.0 |
| 4-7-4 | 5.166 | 480 | 720 | 300 | 900 | 3.5 |
| 4-7-5 | 5.152 | 240 | 960 | 300 | 900 | 1.3 |
| 4-7-6 | 4.863 | 0 | 1200 | 300 | 900 | 0.3 |
Table 32.
Type-4-8 mixture quantity, weight per unit of volume and compression test results.
Table 32.
Type-4-8 mixture quantity, weight per unit of volume and compression test results.
| Mixture Type | BHA (t/m3) | Cement (C) (kg) | Pumice Powder (kg) | Lime (kg) | Water (kg) | Average Compressive Strength (MPa) |
|---|
| 4-8-1 | 5.806 | 1200 | 0 | 300 | 900 | 20.1 |
| 4-8-2 | 5.780 | 1200 | 60 | 240 | 900 | 18.0 |
| 4-8-3 | 5.717 | 1200 | 120 | 180 | 900 | 19.5 |
| 4-8-4 | 5.624 | 1200 | 180 | 120 | 900 | 17.4 |
| 4-8-5 | 5.559 | 1200 | 240 | 60 | 900 | 15.4 |
| 4-8-6 | 5.534 | 1200 | 300 | 0 | 900 | 17.3 |
Table 33.
Type-4-9 mixture quantity, weight per unit of volume and compression test results.
Table 33.
Type-4-9 mixture quantity, weight per unit of volume and compression test results.
| Mixture Type | BHA (t/m3) | Cement (C) (kg) | Pumice Powder (kg) | Lime (kg) | Water (kg) | Average Compressive Strength (MPa) |
|---|
| 4-9-1 | 5.806 | 1200 | 0 | 300 | 900 | 20.1 |
| 4-9-2 | 5.516 | 999 | 250.5 | 250.5 | 900 | 15.5 |
| 4-9-3 | 5.479 | 856.5 | 429 | 214.5 | 900 | 9.3 |
| 4-9-4 | 5.316 | 750 | 562.5 | 187.5 | 900 | 3.9 |
| 4-9-5 | 4.991 | 666 | 666 | 168 | 900 | 1.0 |
| 4-9-6 | 4.976 | 600 | 750 | 150 | 900 | 0.7 |
Table 34.
Maximum compressive strength results for optimum binder fixation.
Table 34.
Maximum compressive strength results for optimum binder fixation.
| Mixture Type | BHA (t/m3) | Cement (C) (kg) | Pumice Powder (kg) | Lime (kg) | Water (kg) | Average Compressive Strength (MPa) |
|---|
| 1-2 | 5.534 | 1200 | 300 | 0 | 900 | 17.3 |
| 2-3 | 4.874 | 0 | 900 | 600 | 900 | 0.5 |
| 3-2 | 5.806 | 1200 | 0 | 300 | 900 | 20.1 |
| 4-1-1 | 5.534 | 1200 | 300 | 0 | 900 | 17.3 |
| 4-2-4 | 5.717 | 1200 | 120 | 180 | 900 | 19.5 |
| 4-3-1 | 5.534 | 1200 | 300 | 0 | 900 | 17.3 |
| 4-4-6 | 5.710 | 450 | 450 | 600 | 900 | 20.2 |
| 4-5-6 | 5.058 | 300 | 900 | 300 | 900 | 7.6 |
| 4-6-6 | 5.037 | 750 | 450 | 300 | 900 | 21.9 |
| 4-7-1 | 5.806 | 1200 | 0 | 300 | 900 | 20.1 |
| 4-8-1 | 5.806 | 1200 | 0 | 300 | 900 | 20.1 |
| 4-9-1 | 5.806 | 1200 | 0 | 300 | 900 | 20.1 |
Table 35.
Reference concrete (RC) and optimum binder concrete (PPCC) sieve analysis.
Table 35.
Reference concrete (RC) and optimum binder concrete (PPCC) sieve analysis.
| Sieve Diameter (mm) | On Sieve Remaining Weight (gr) | On Sieve Total Remaining Weight (gr) | On Sieve Total Remaining Weight (%) | Remaining Under Sieve (%) |
|---|
| 16 | - | - | - | 100 |
| 8 | 990 | 990 | 33 | 67 |
| 4 | 660 | 1650 | 55 | 45 |
| 2 | 420 | 2070 | 69 | 31 |
| 1 | 300 | 2370 | 79 | 21 |
| 0.5 | 270 | 2640 | 88 | 12 |
| 0.25 | 210 | 2850 | 95 | 5 |
Table 36.
The average compressive and bending strength test results of concrete types.
Table 36.
The average compressive and bending strength test results of concrete types.
| Concrete Type | BHA (t/m3) | Curing Type | Average Compressive Strength (MPa) | Average Bending Strength (MPa) |
|---|
| RC | 2.290 | 7 days 20 ± 2 °C water curing | 33.8 | 4.2 |
| 28 days 20 ± 2 °C water curing | 38.2 | 4.7 |
| PPCC | 2.150 | 7 days 20 ± 2 °C water curing | 25.1 | 3.2 |
| 28 days 20 ± 2 °C water curing | 28.3 | 3.5 |


