Article

Preliminary Characterization of Novel LDPE-Based Wear-Resistant Composite Suitable for FDM 3D Printing

Faculty of Materials Engineering and Metallurgy, Silesian University of Technology, Krasinskiego 8 Street, 40-019 Katowice, Poland
*
Author to whom correspondence should be addressed.
Materials 2019, 12(16), 2520; https://doi.org/10.3390/ma12162520
Submission received: 26 June 2019 / Revised: 30 July 2019 / Accepted: 5 August 2019 / Published: 8 August 2019
(This article belongs to the Special Issue Recycled and Sustainable Materials in Composite Design)

Abstract

:
Low-density polyethylene (LDPE) composites reinforced with finely powdered waste glass were identified as a potential material for 3D printed structures for use in low-duty frictional applications. A recently published 3D printing model was used to calculate the limits in the filament feed rate and printing speed. Tribological tests (pin-on-disc method) of the printed composites were performed for different print-path directions. Differential scanning calorimetry (DSC) was performed on the samples and the composites showed a higher crystallinity compared with LDPE, which partially explains the higher elastic modulus of the composites determined during static tensile tests. Using a fine glass powder as reinforcement improved the wear resistance of LDPE by 50% due to the formation of a sliding film on the sample’s surface. An evident effect of friction direction vs. the printed path direction on wear was found; which was likely related to differences in the removal of friction products from the friction area for different print-path directions. The LDPE composites with fine waste glass particles are promising materials for low-duty frictional applications and should be the subject of further research.

1. Introduction

Additive manufacturing (AM) is a novel and revolutionary technique where it is possible to produce elements with complex geometries directly from the desired material [1]. For thermoplastic materials, the most common AM technique is fusion deposition modeling (FDM) because it is very simple, relatively cheap, and is a kind of 3D printing [2] that can be fully automated, which is becoming increasingly common in materials technologies [3]. One of the disadvantages of using FDM is the low mechanical strength of the products, which can only be produced from some types of thermoplastics, which limits the usage of FDM technology [4]. A possible solution is the application of strong materials, such as polyetheretherketone (PEEK), but such materials are very expensive and not readily available. An alternative method is the use of thermoplastic composites reinforced with hard particles or short fibers. Such FDM printed composites show much better properties, such as higher strength, improved wear resistance, and better dielectric permittivity compared with neat thermoplastics [5,6]. The addition of reinforcement materials can also help to solve some common problems with the 3D printing of neat polymers. For example, adding iron or copper particles to ABS reduces the distortion of printed parts [7,8]. Currently, composites reinforced with short fibers, long fibers, powders, or nanocomponents can be found in many solutions [9,10,11] and are also applicable for 3D printing [4,12].
The wear behavior of 3D printed composites is a relatively new topic that has mainly been researched for ABS or PC-ABS blends [13,14]. The wear resistance of Nylon-6 composites has also been described [
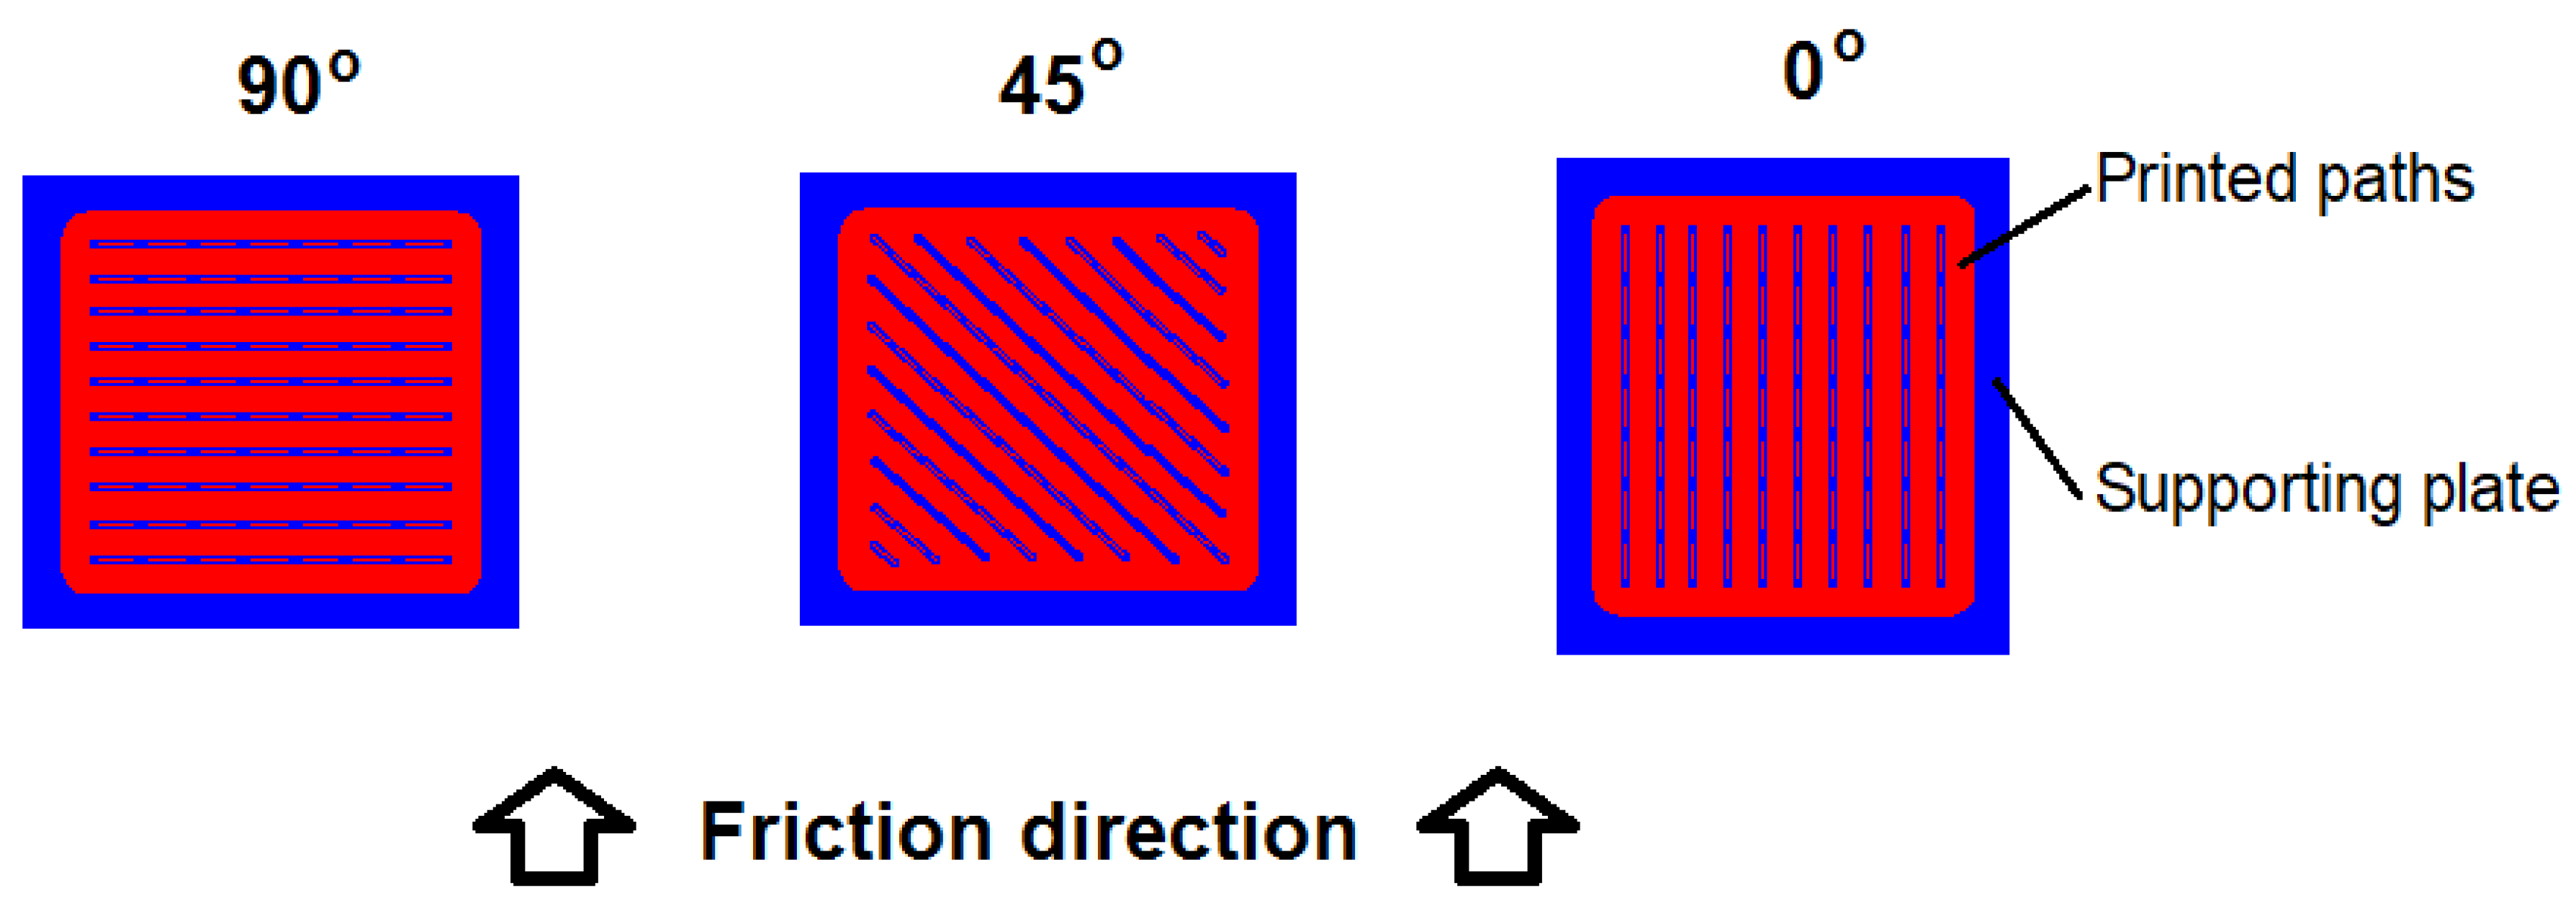
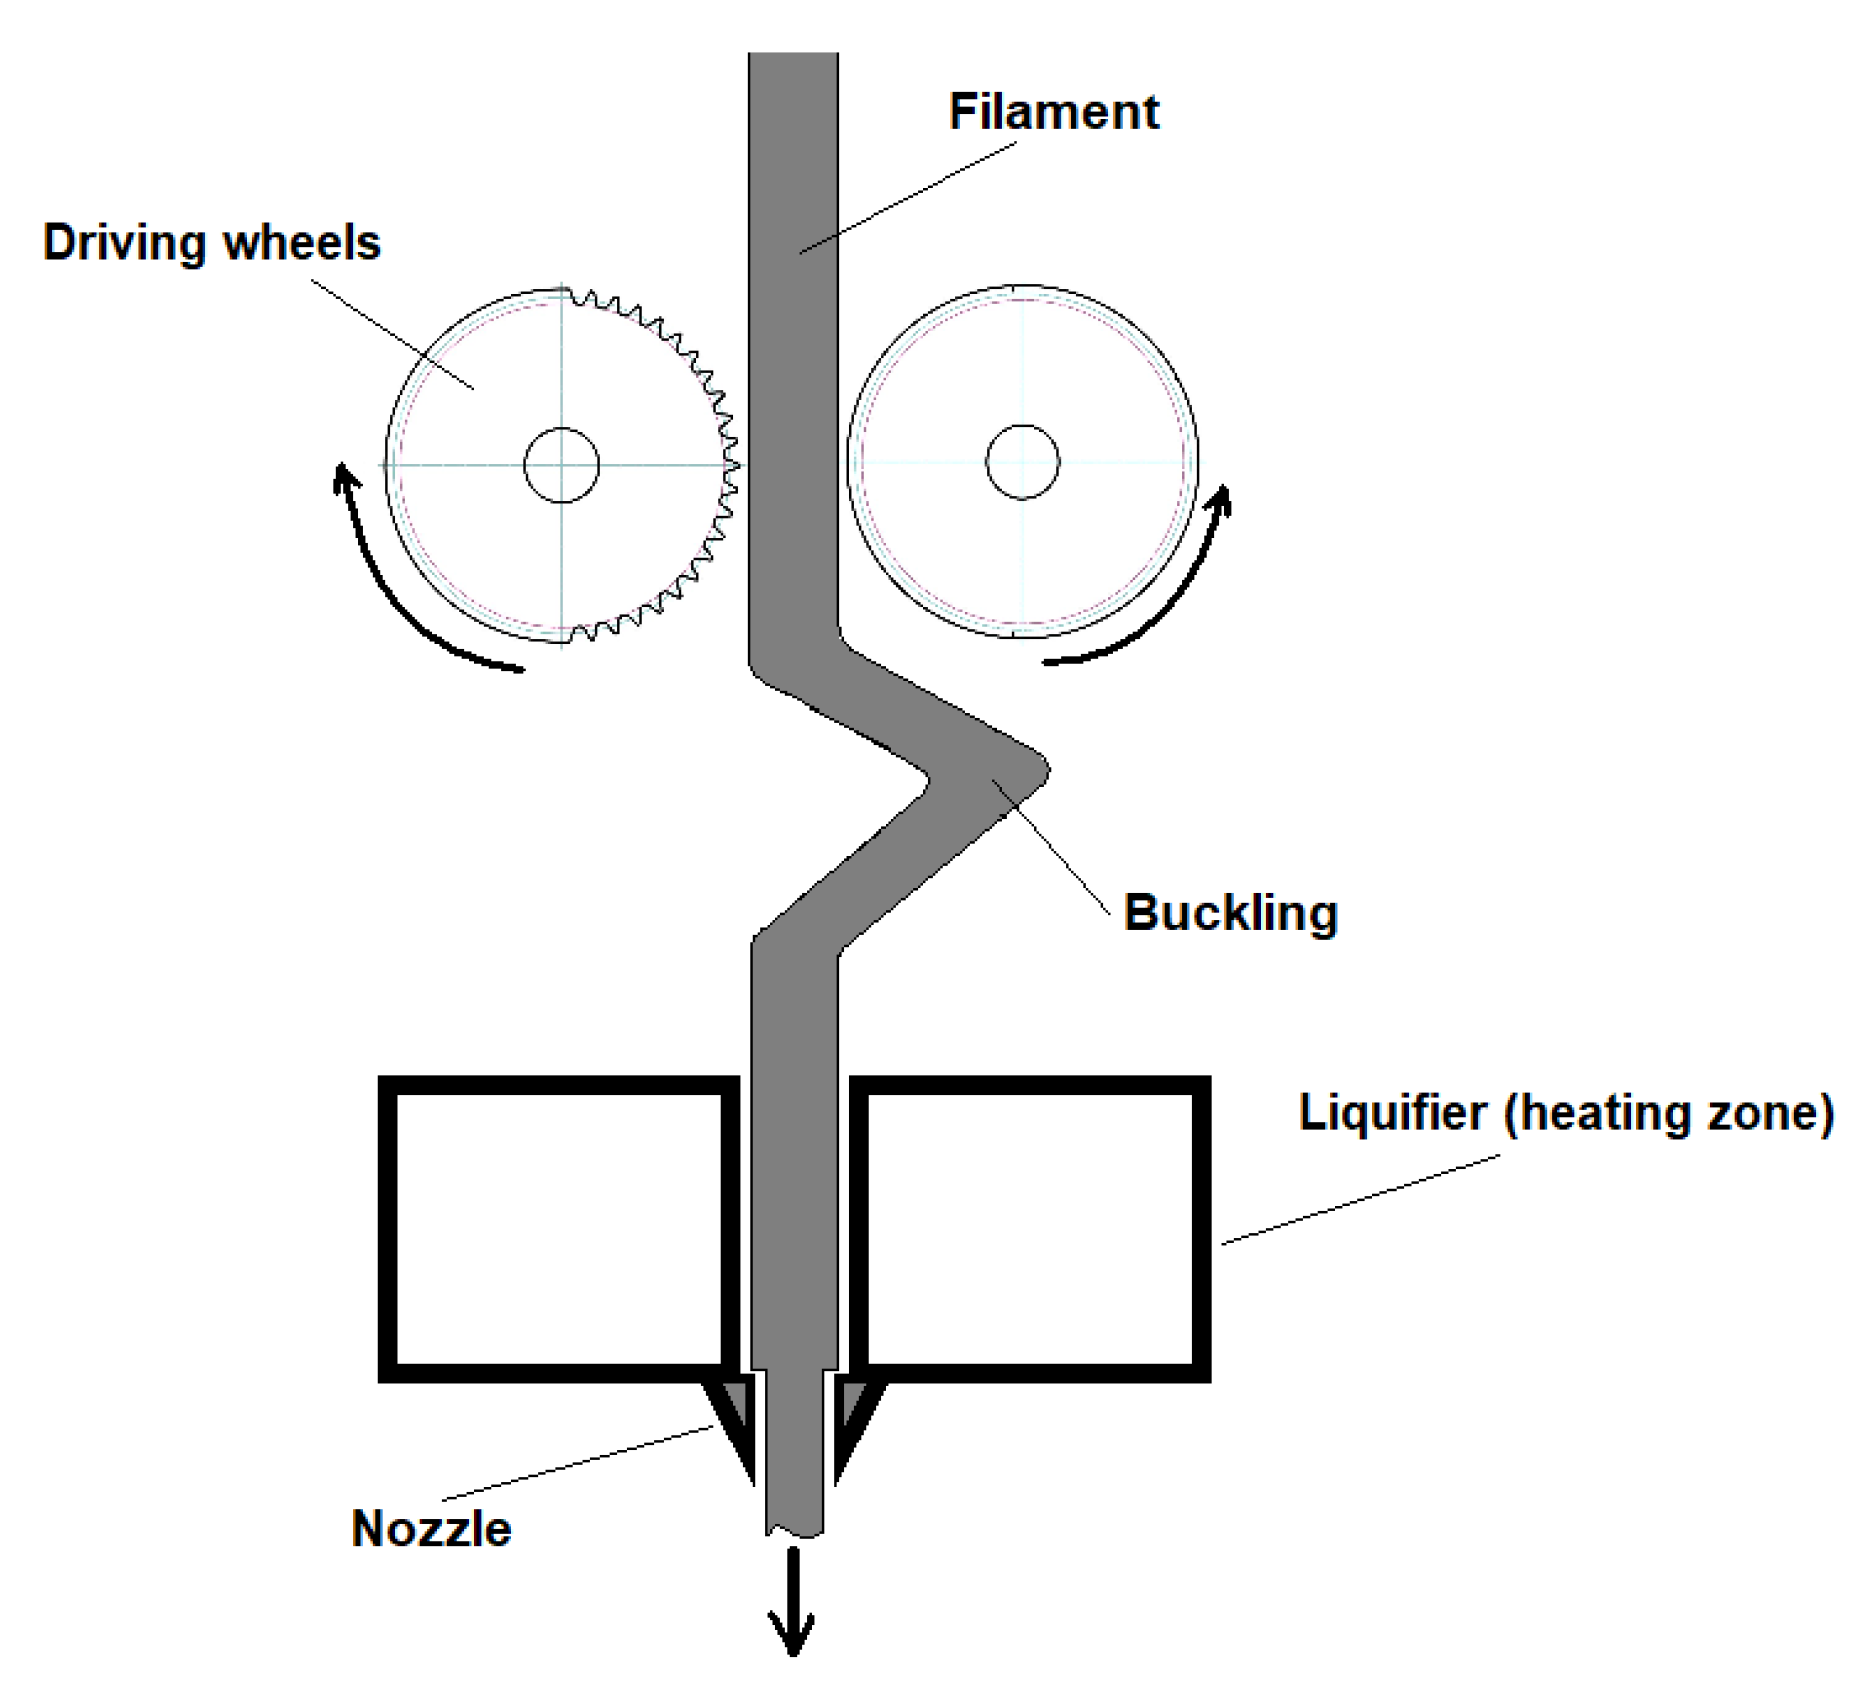
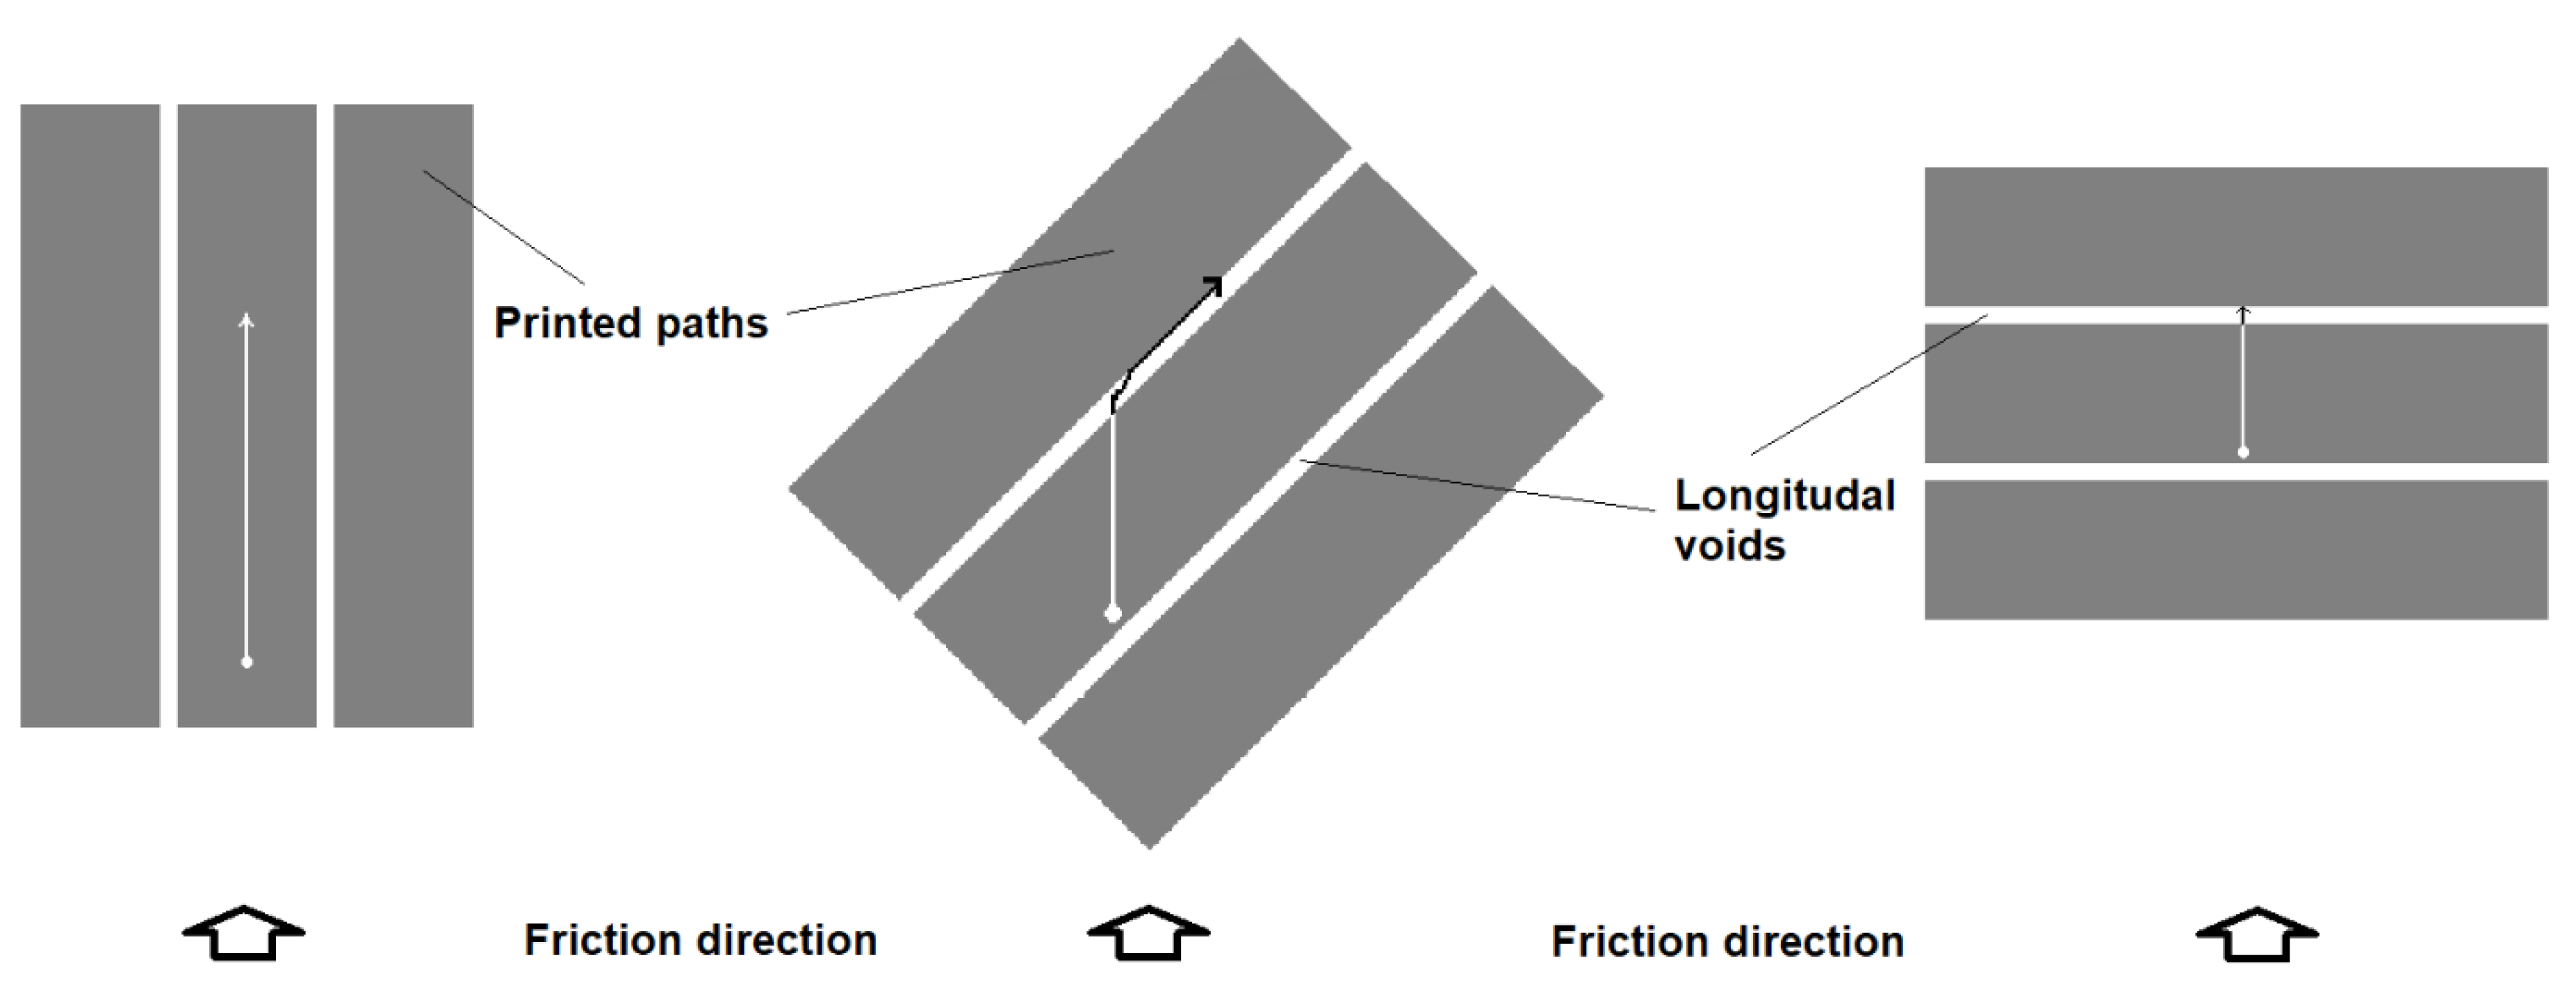
15]. Since 3D printed parts exhibit anisotropic mechanical properties [16], their wear mechanism may also vary depending on the friction direction (Figure 1). Thus, such behavior should be more thoroughly investigated.
LDPE is an inexpensive and very popular material that is currently used mainly in packaging, toys, and everyday-use items, which generate significant waste that must be recycled. The reuse of polymer wastes as filaments for FDM printing is a relatively new and popular topic; there are works [15] describing the use of polymer waste to obtain material for 3D printing. However, LDPE has a relatively low strength and stiffness, poor bed adhesion, and high shrinkage, which may disqualify it from being used in FDM printing. Nevertheless, some problems can be solved by reinforcing LDPE with hard particles to produce composites [9,17]. As mentioned before, adding ceramic or metal powders to LDPE can improve its storage modulus [8], reduce shrinkage, and increase its mechanical properties [7]. Currently, LDPE composites with a mold flow index (MFI) of 10 g/10 min were successfully printed [18], so it is possible to manufacture an LDPE composite filament for FDM printing made from waste materials.
The use of LDPE as a friction material is not common, but it can be used in new applications where frictional properties and wear resistance are of great importance. An example of this is the mesosterephs in the soles of shoes, where in addition to the necessary friction properties, a low hardness, plasticity, and elasticity are important. It may also be a good carrying material for solid lubricants [19], e.g., as a layer or near-surface filler. Other mass applications include novel high-endurance sliding pads for furniture, such as chairs and stools. In the rapidly innovating field of consumer products, many other applications for thermoplastics (e.g., [20]) and FDM technology can be imagined [21].
Mathematical descriptions of FDM 3D printing are still being investigated. The problem of control and performance limitations can be considered in relation to melting in a liquifier or layer deposition [22,23,24,25,26,27,28]. Recent publications describing this issue have shown that mathematical modeling can be used to estimate process parameters, and to also avoid potential 3D printing failures, such as buckling or filament grinding. For example, Mackay et al. [26] attempted to determine the minimum required temperature of feed filaments. The experimental evaluation and mathematical prediction of FFF limits were performed by Go et al. [25] and Turner et al. [23] previously provided a review of melt extrusion descriptions. Osswald et al. [24] proposed a model based on the formation of a thin melt polymer film in a nozzle, which made it possible to estimate the maximum filament feed rate in which the melted polymer is pushed through a nozzle by a fed filament. The force applied by the filament was proportional to its feed rate. When the filament moves faster than its tip is melted, failure from buckling or grinding can occur. One way to prevent this is by matching the filament velocity to the feed rate. The maximum feed rate can be calculated using the least-squares method if the tensions in the filament are equal to the force necessary to push melt through the nozzle.
The aim of this study is to characterize a new composite suitable for FDM printing, which is inexpensive—making it suitable for mass production—and has enhanced wear resistance. In previous work, the authors made an LDPE composite reinforced with glass waste (an additional eco-role) as a 3D printing material [29] with a melt flow index (MFI) of 2 g/10 min. Glass powder obtained from shredded car windscreen wastes was used as a reinforcement material to increase the printability of LDPE. In this work, the authors continue the attempts to characterize this material in two areas: its technological properties and wear resistance. A previously described mathematical model was applied to establish the buckling conditions and to estimate the maximum feed rate of the filament. Tribology tests were performed on 3D printed parts to determine whether glass wastes can be used as a reinforcement material to enhance the wear resistance of 3D printed parts and if the friction direction influences the specific wear rate of 3D printed composites.

2. Materials and Methods

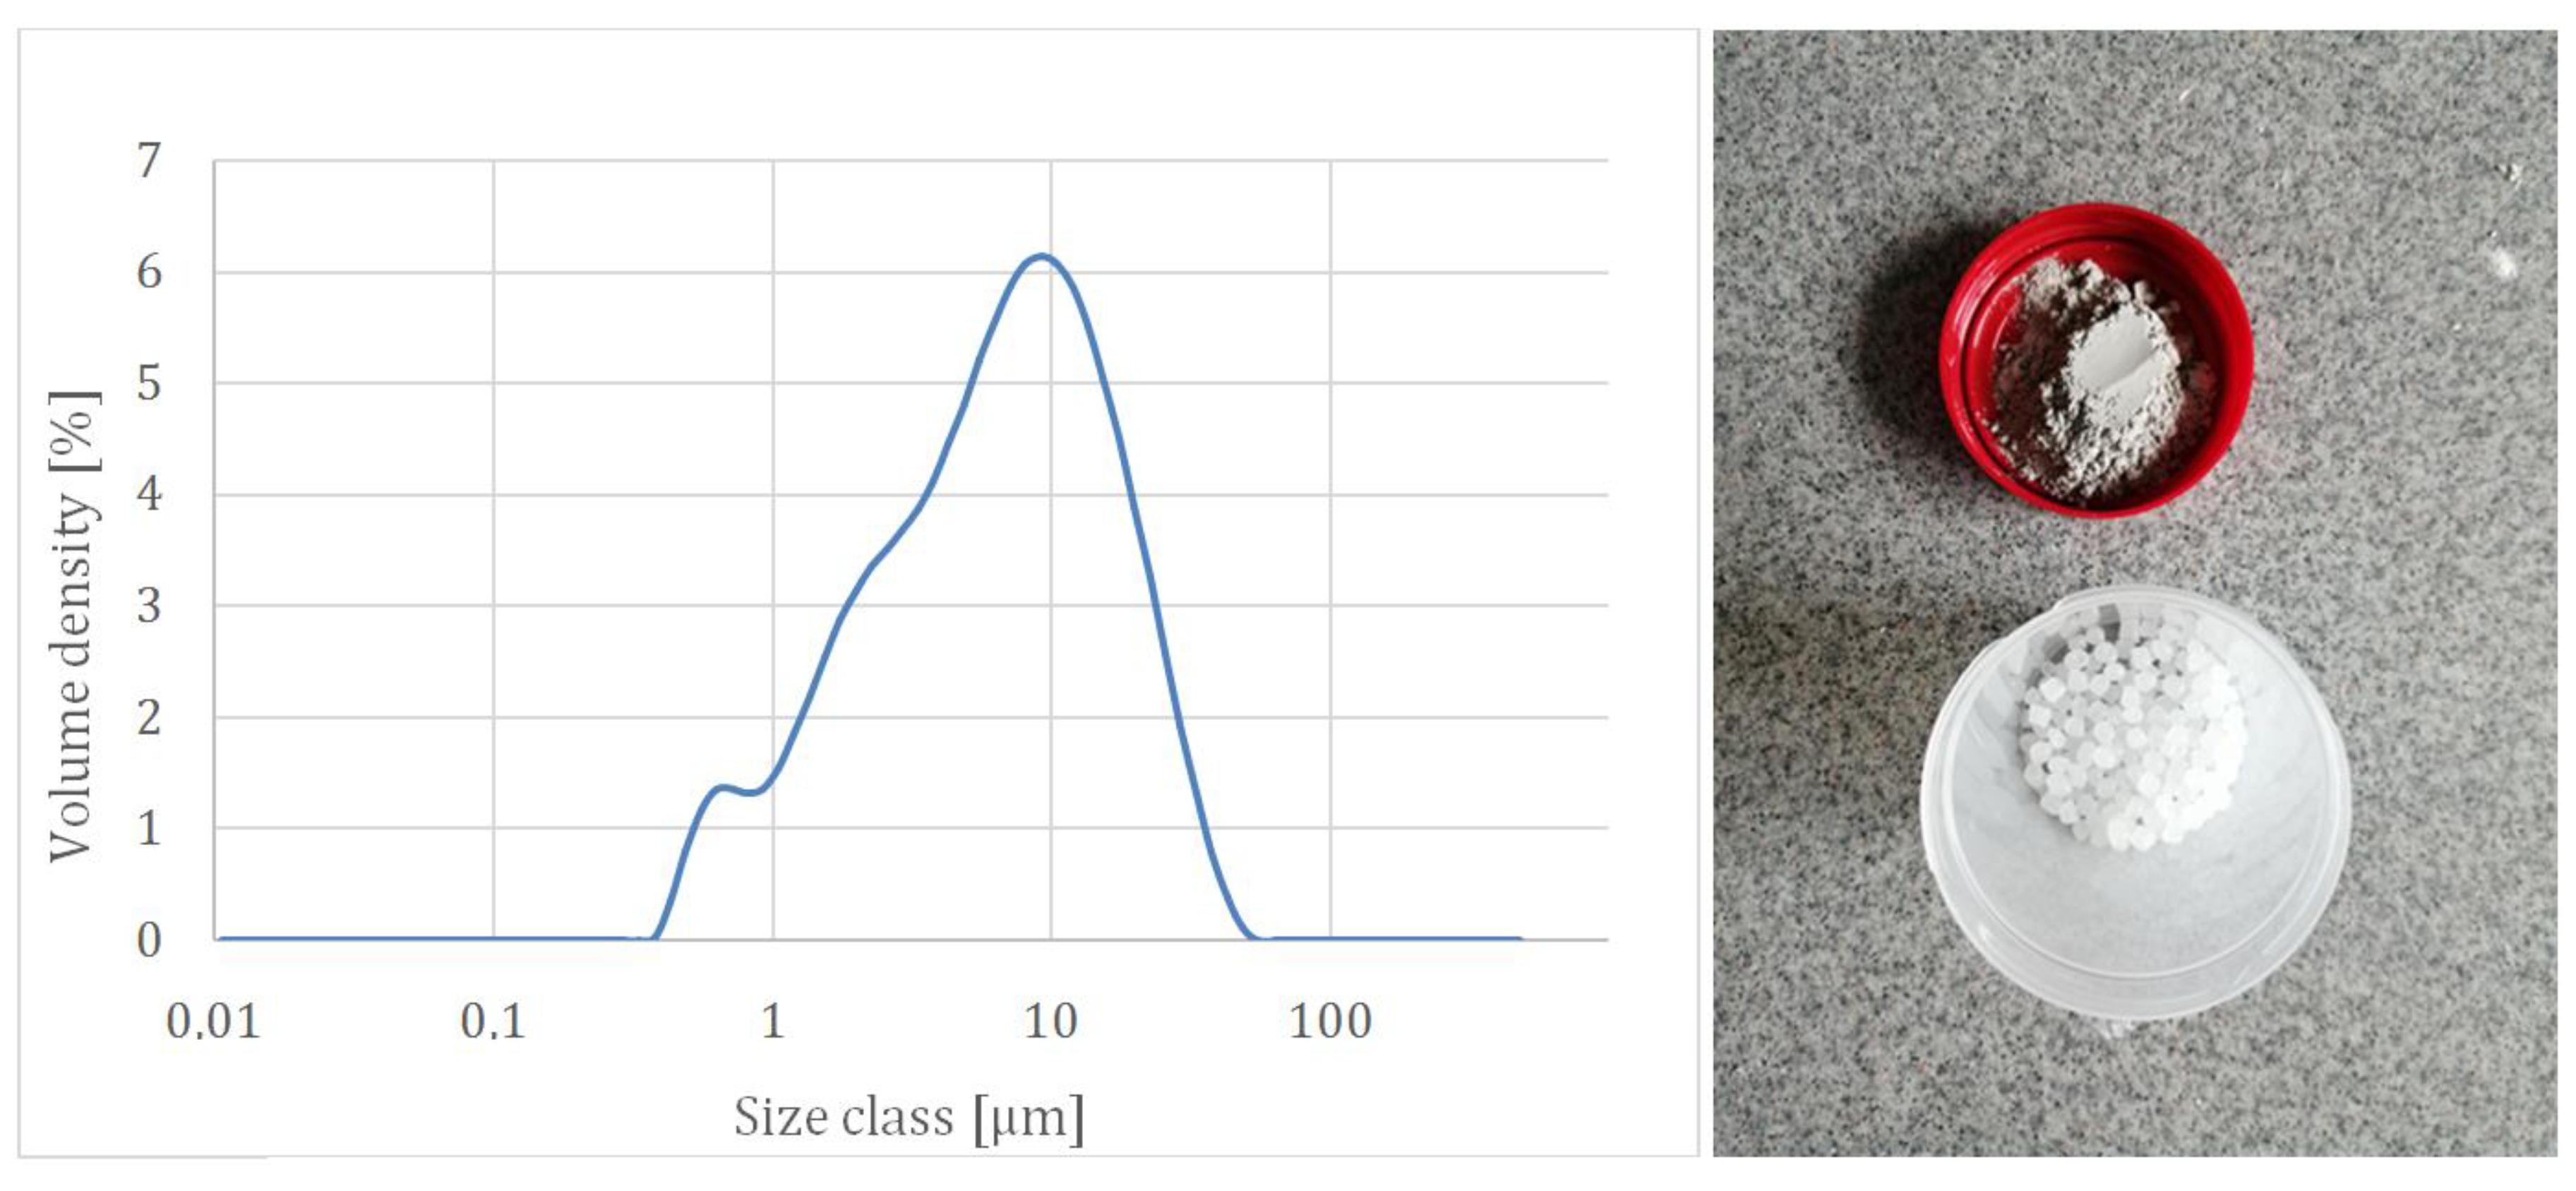
The matrix material was LDPE (Malen E FGNX 23-D022, Basell Orlen Polyolefins, Płock, Poland) with an MFI (190 °C/2.16 kg) of 1.95 g/10 min. The reinforcement material was glass powder containing polyvinyl butyral (PVB) obtained from laminated car glass waste. In this work, composites with 15 and 30 vol% of powder were made, along with neat LDPE as the reference. The glass pieces were mechanically cleaned from the outer layers of PVB foil and initially milled in a hammer grinder mill Retsch SK300 (Retsch, Haan, Germany) with a sieve mesh diameter of 0.5 mm. To obtain a fine powder, a planetary ball mill (Fritsch Pullverisser 6) was used. During milling, the powder-to-ball ratio was 1:4, and the milling speed was 600 rpm. An effective milling time of 60 min resulted in a powder of D90 = 20.1 μm with no grains larger than 100 μm (Figure 2).
Gradual mixing is a common technique to achieve powders with a wide range of particle diameters [10,30]. The obtained range of particle diameters was the minimum one expected to ensure the efficiency of the FDM printing process and at the same time the smallest effect on the cost of the material.
The obtained powder was mechanically mixed with LDPE granules, dried at 70 °C for 24 h, and then extruded. Obtaining the glass used to produce the powder is relatively simple and cheap, especially compared with advanced methods such as those described in [31] or [32]. It is rather more similar to more massive technological methods applied for modern materials [33,34].
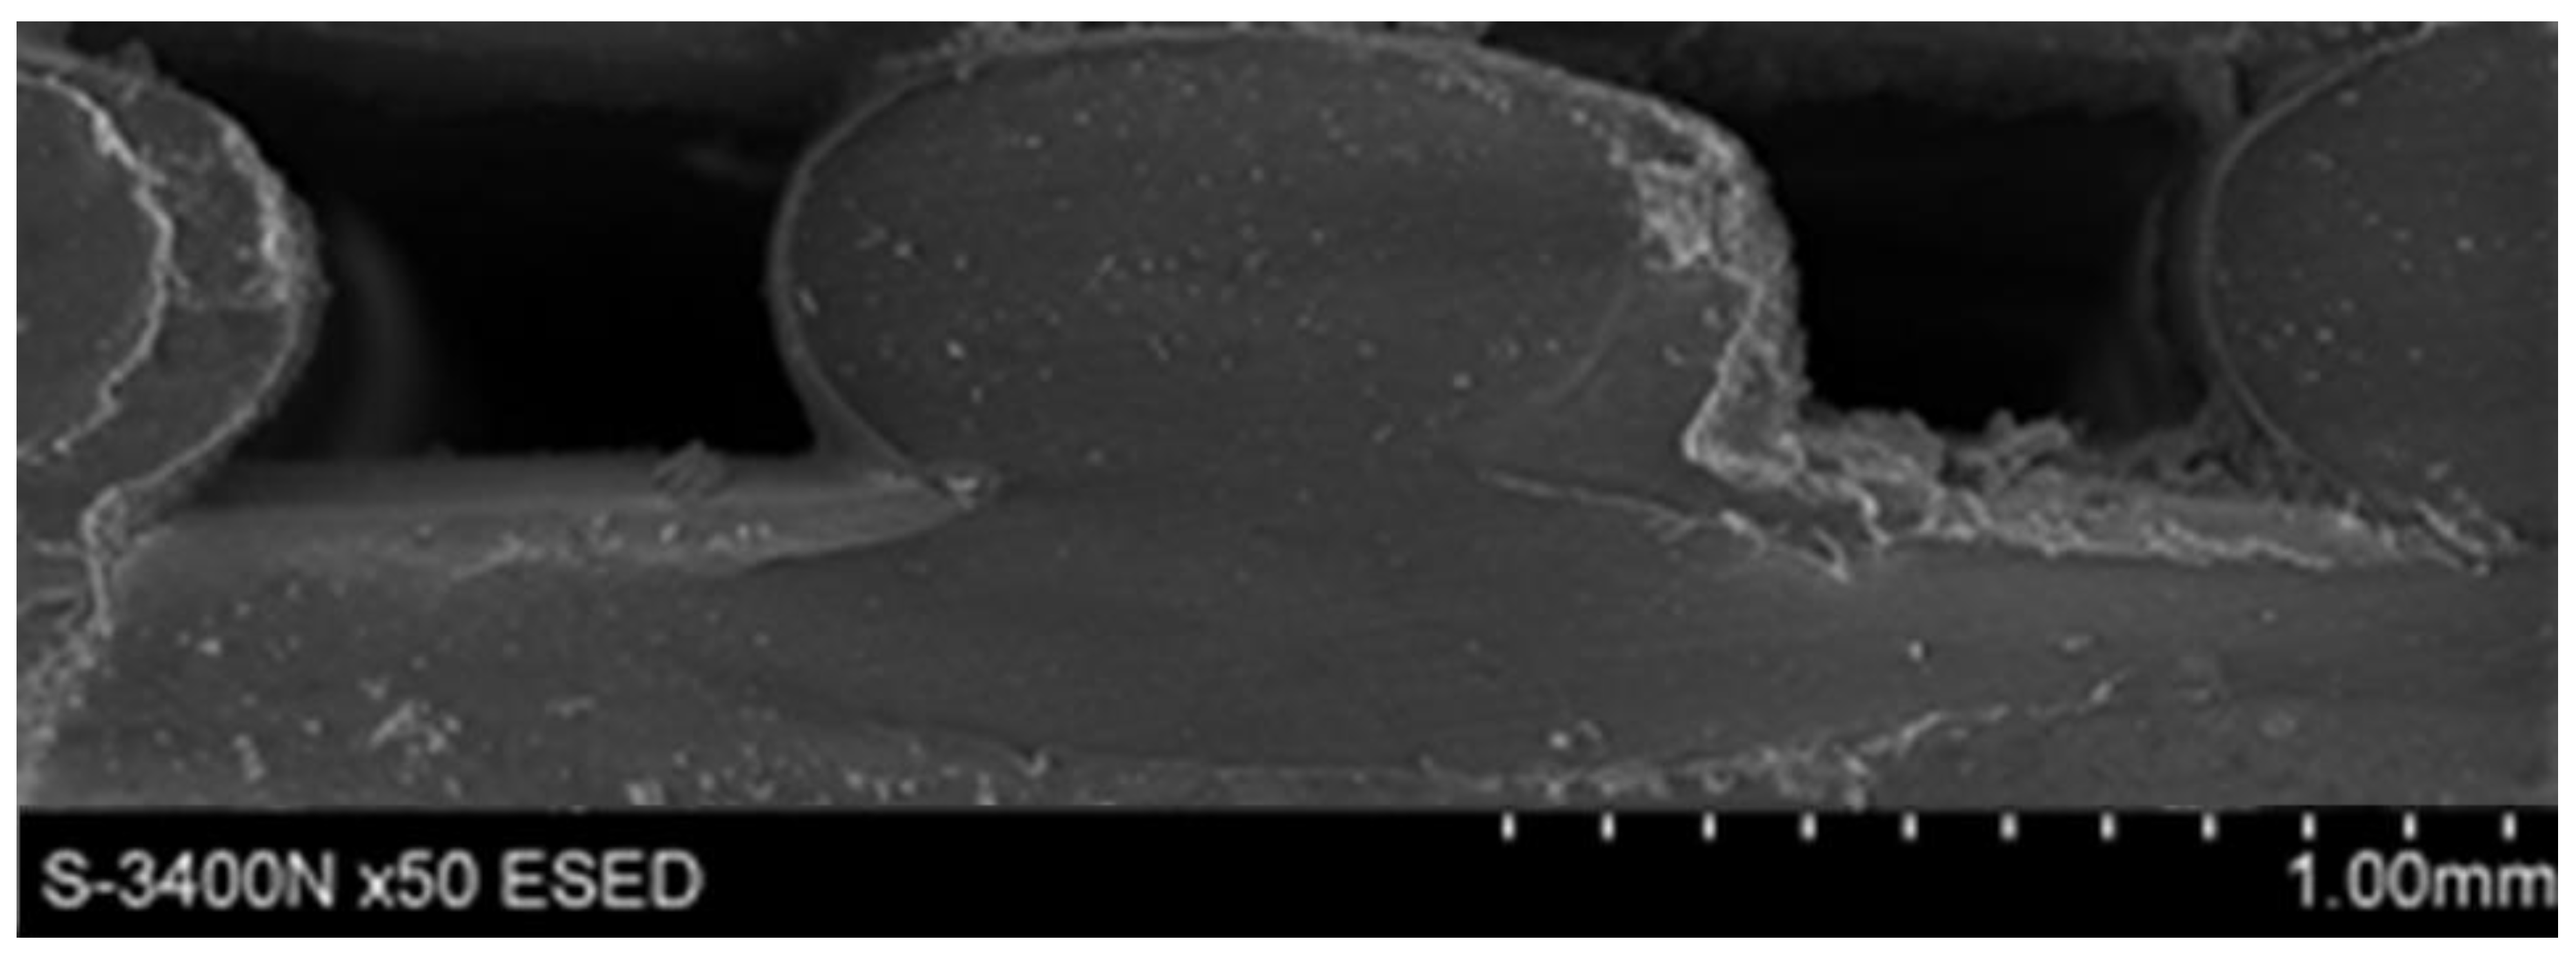
After the first extrusion using a ZAMAK DTR EHP-2x16S (Zamak Mercator, Skawina, Poland) extruder, composites were re-granulated and extruded again to obtain a homogenous material, which was extruded in the form of a filament with a diameter of 1.45 ± 0.10 mm that was suitable for 3D printing. The nozzle temperature during extrusion was 190 °C, screw speed 28 rpm and winder speed 8 rpm.
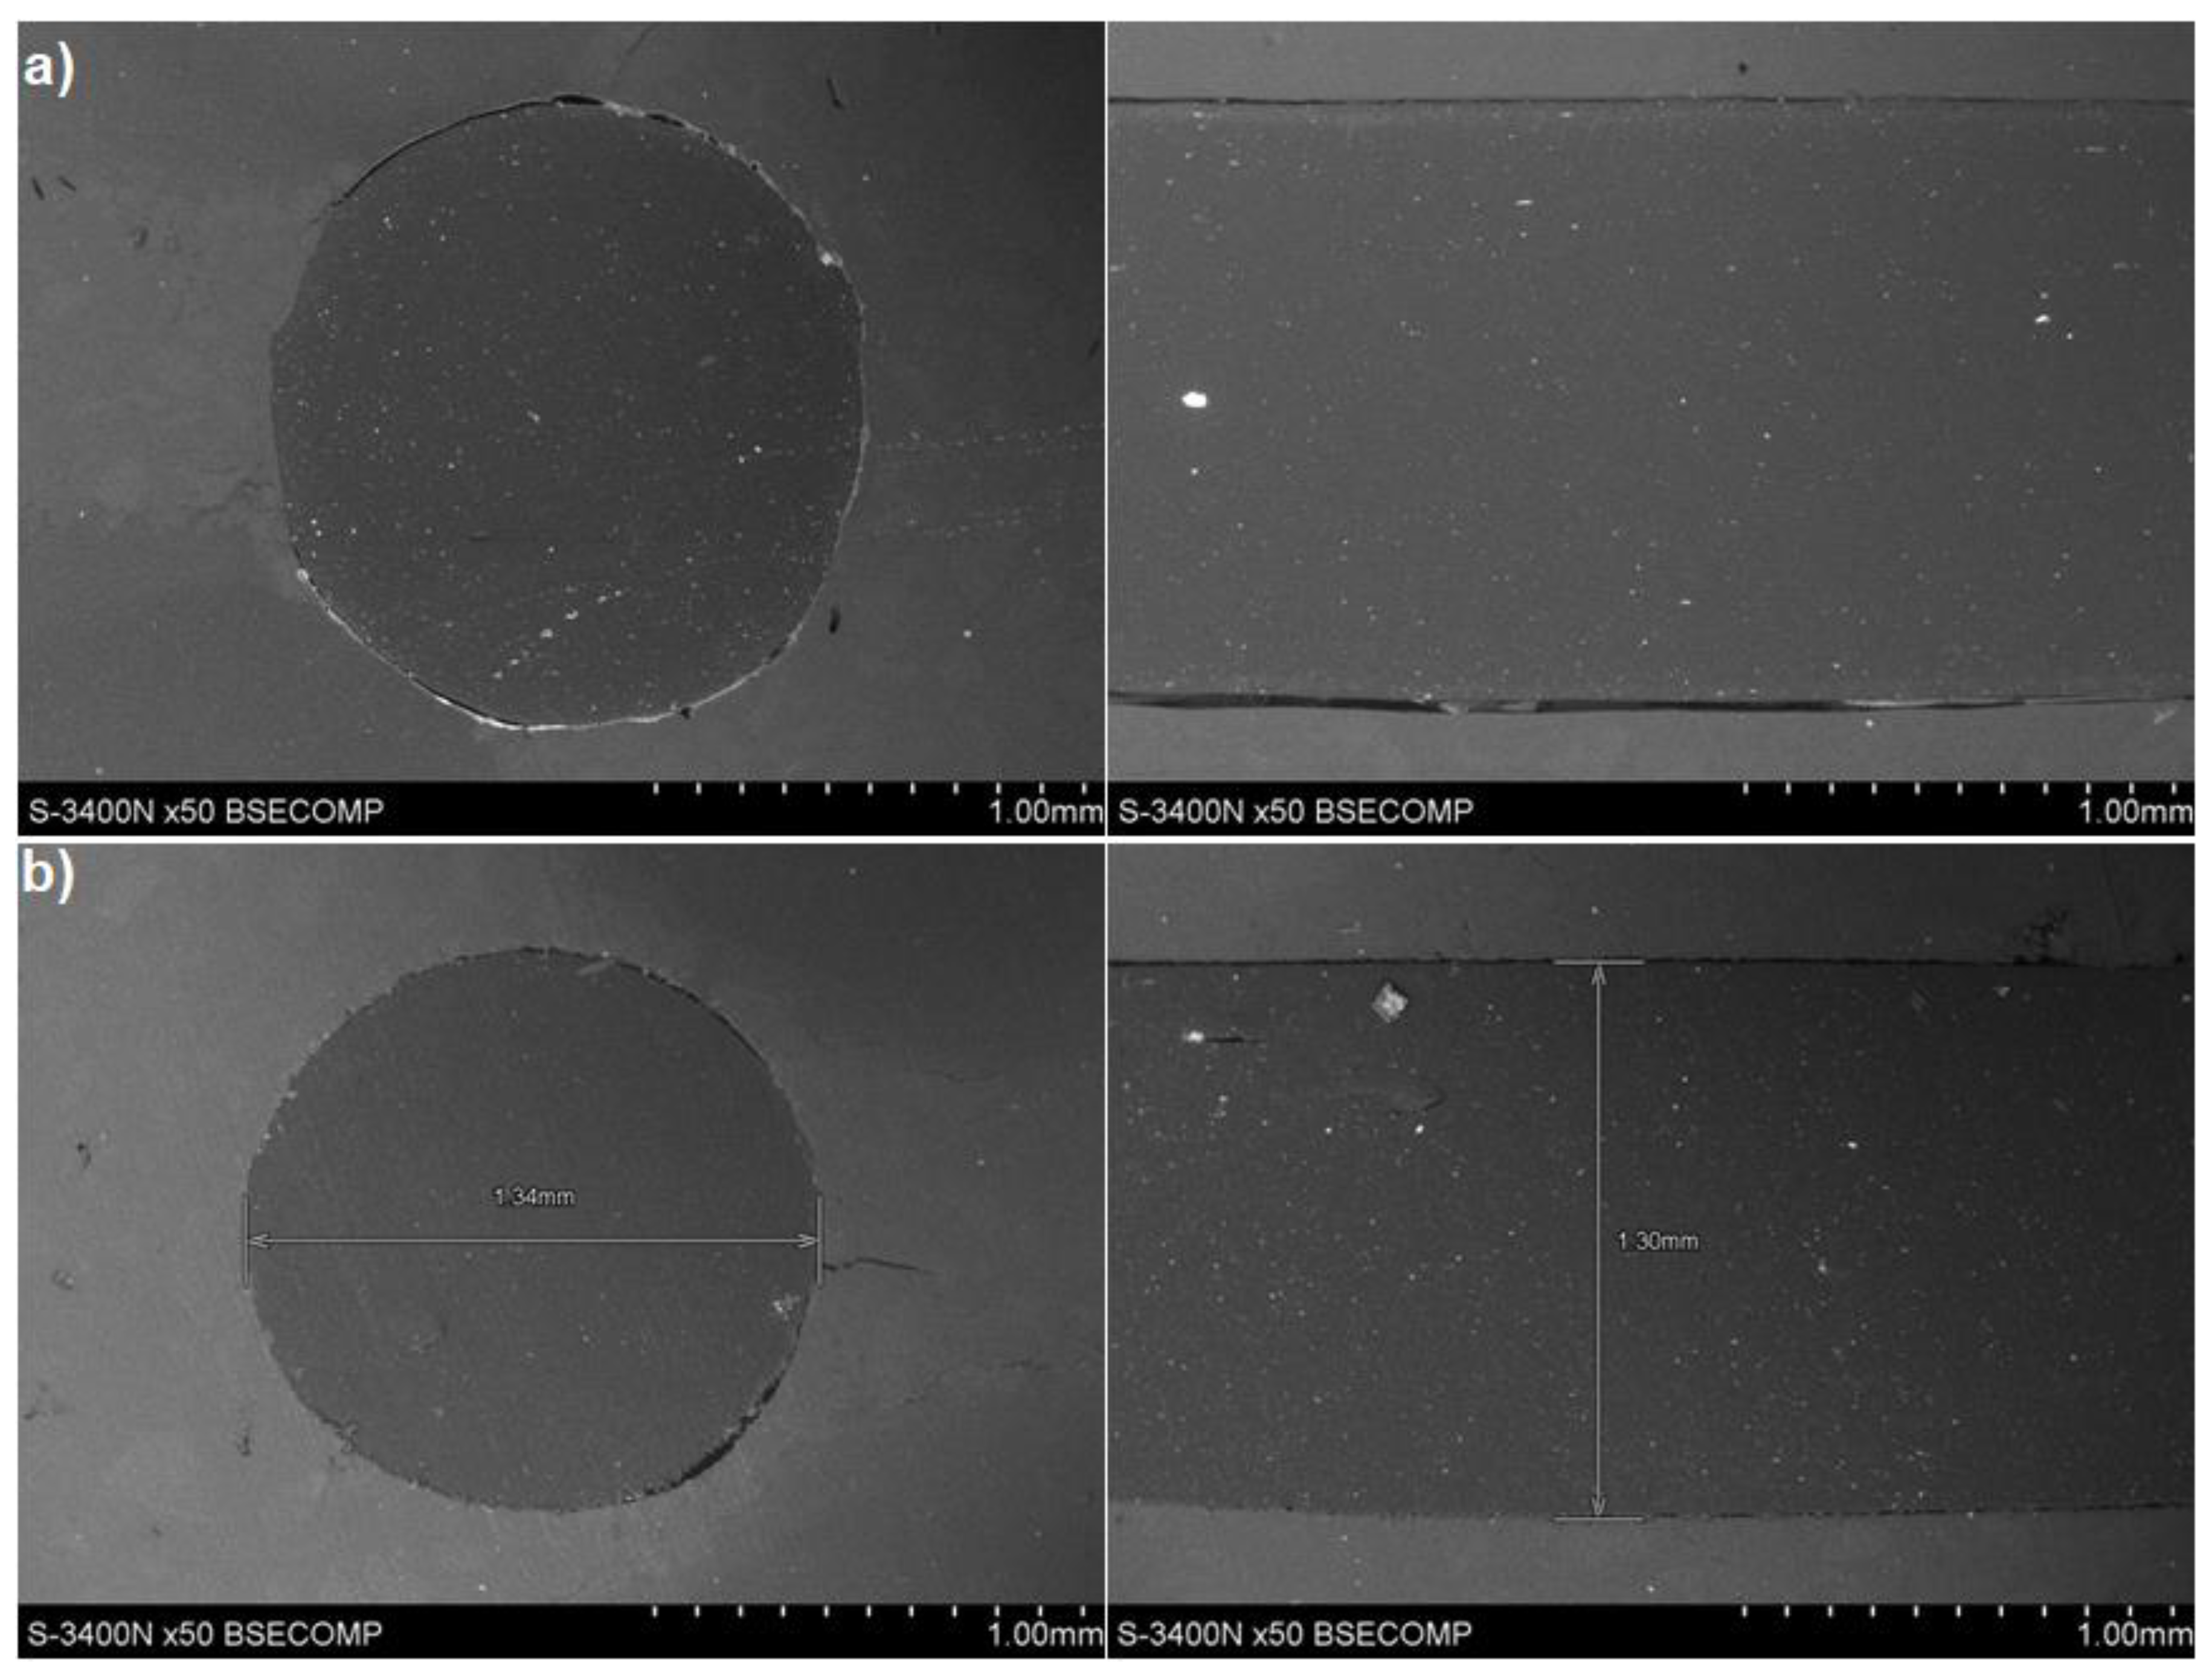
The microstructure of the obtained filament and the distribution of glass particles in the polymer matrix were evaluated using a Hitachi S-3400N (Hitachi, Tokio, Japan) scanning electron microscope (SEM).
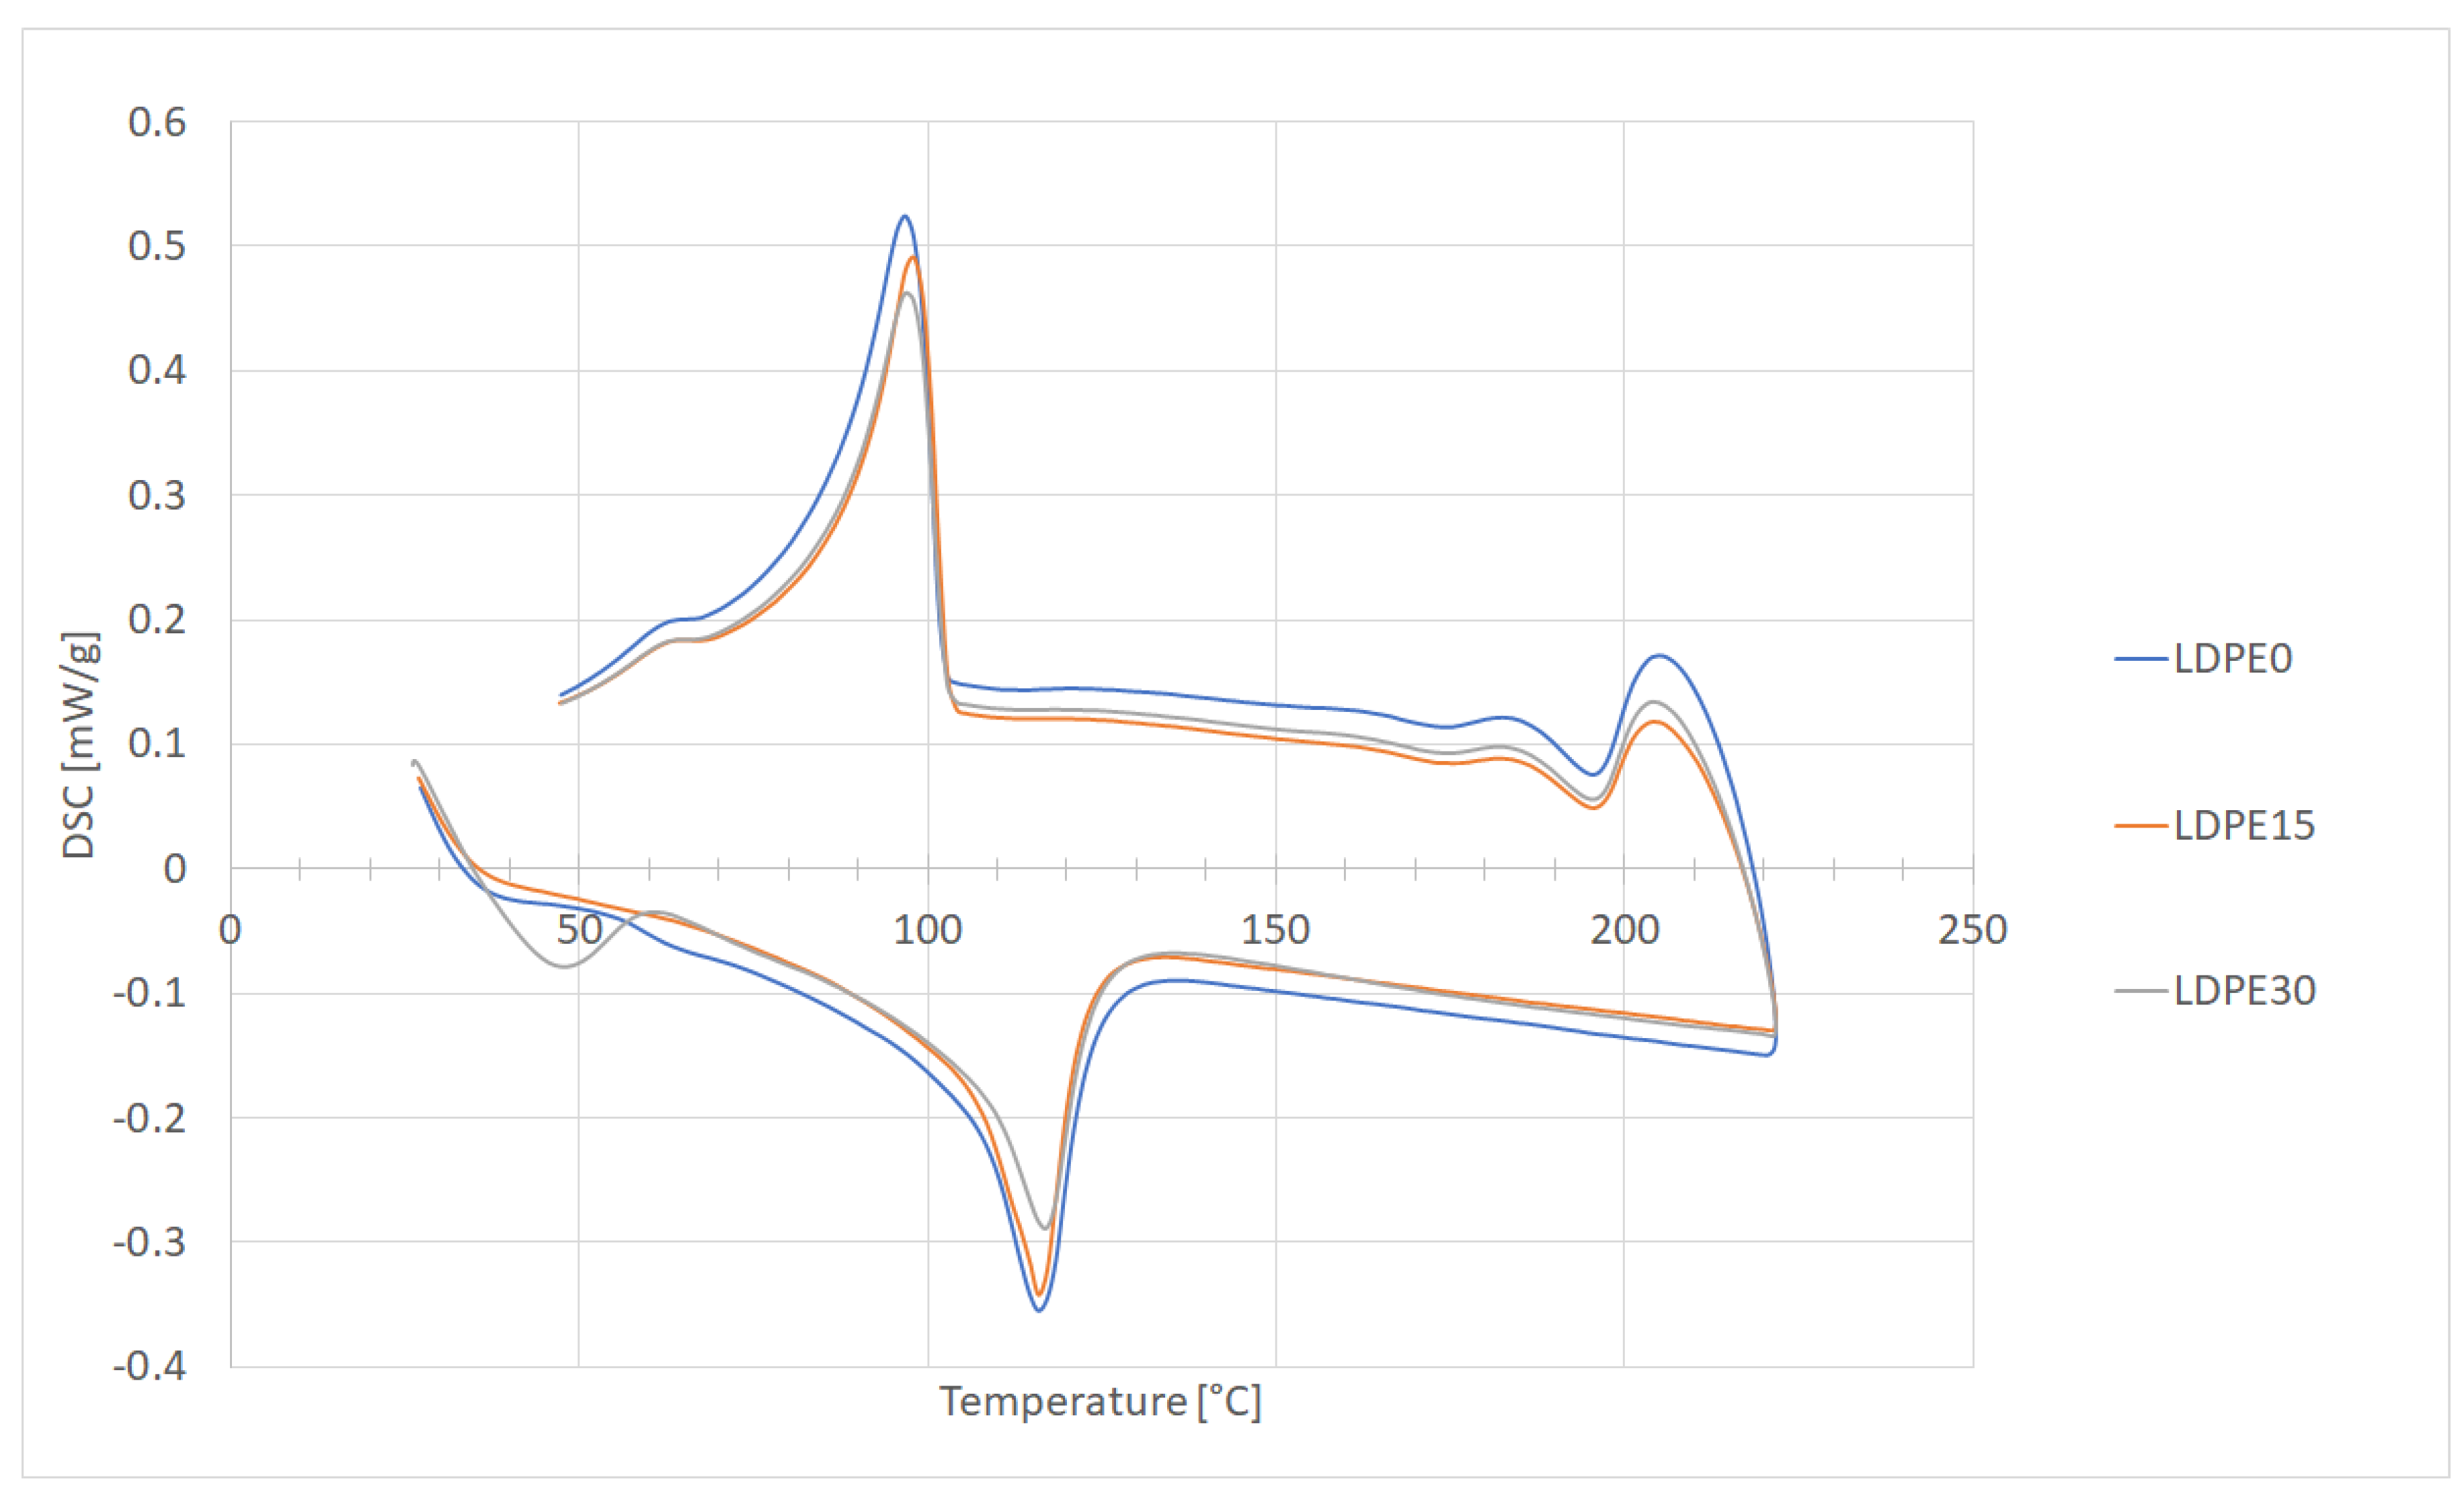
Differential scanning calorimetry NETZSCH DSC 404 F1 (Erich Netzsch GmbH, Wunsiedel, Germany) was used to determine the enthalpy of fusion to calculate the critical filament feed rate. The measurements were carried out in argon (gas flow 20 mL/min) and with heating/cooling rate 5 K/min. Along with this, the crystallinity of neat LDPE and the composites was determined using Equation (1) [35,36,37,38]:
χ % = 1 1 Δ w t % Δ H c Δ H f 0
where wt% is the mass percentage of the reinforcement, ΔHc is the crystallization enthalpy [J/g], and ΔHf0 is the theoretical crystallization enthalpy of 100% crystalline LDPE [293 J/g].
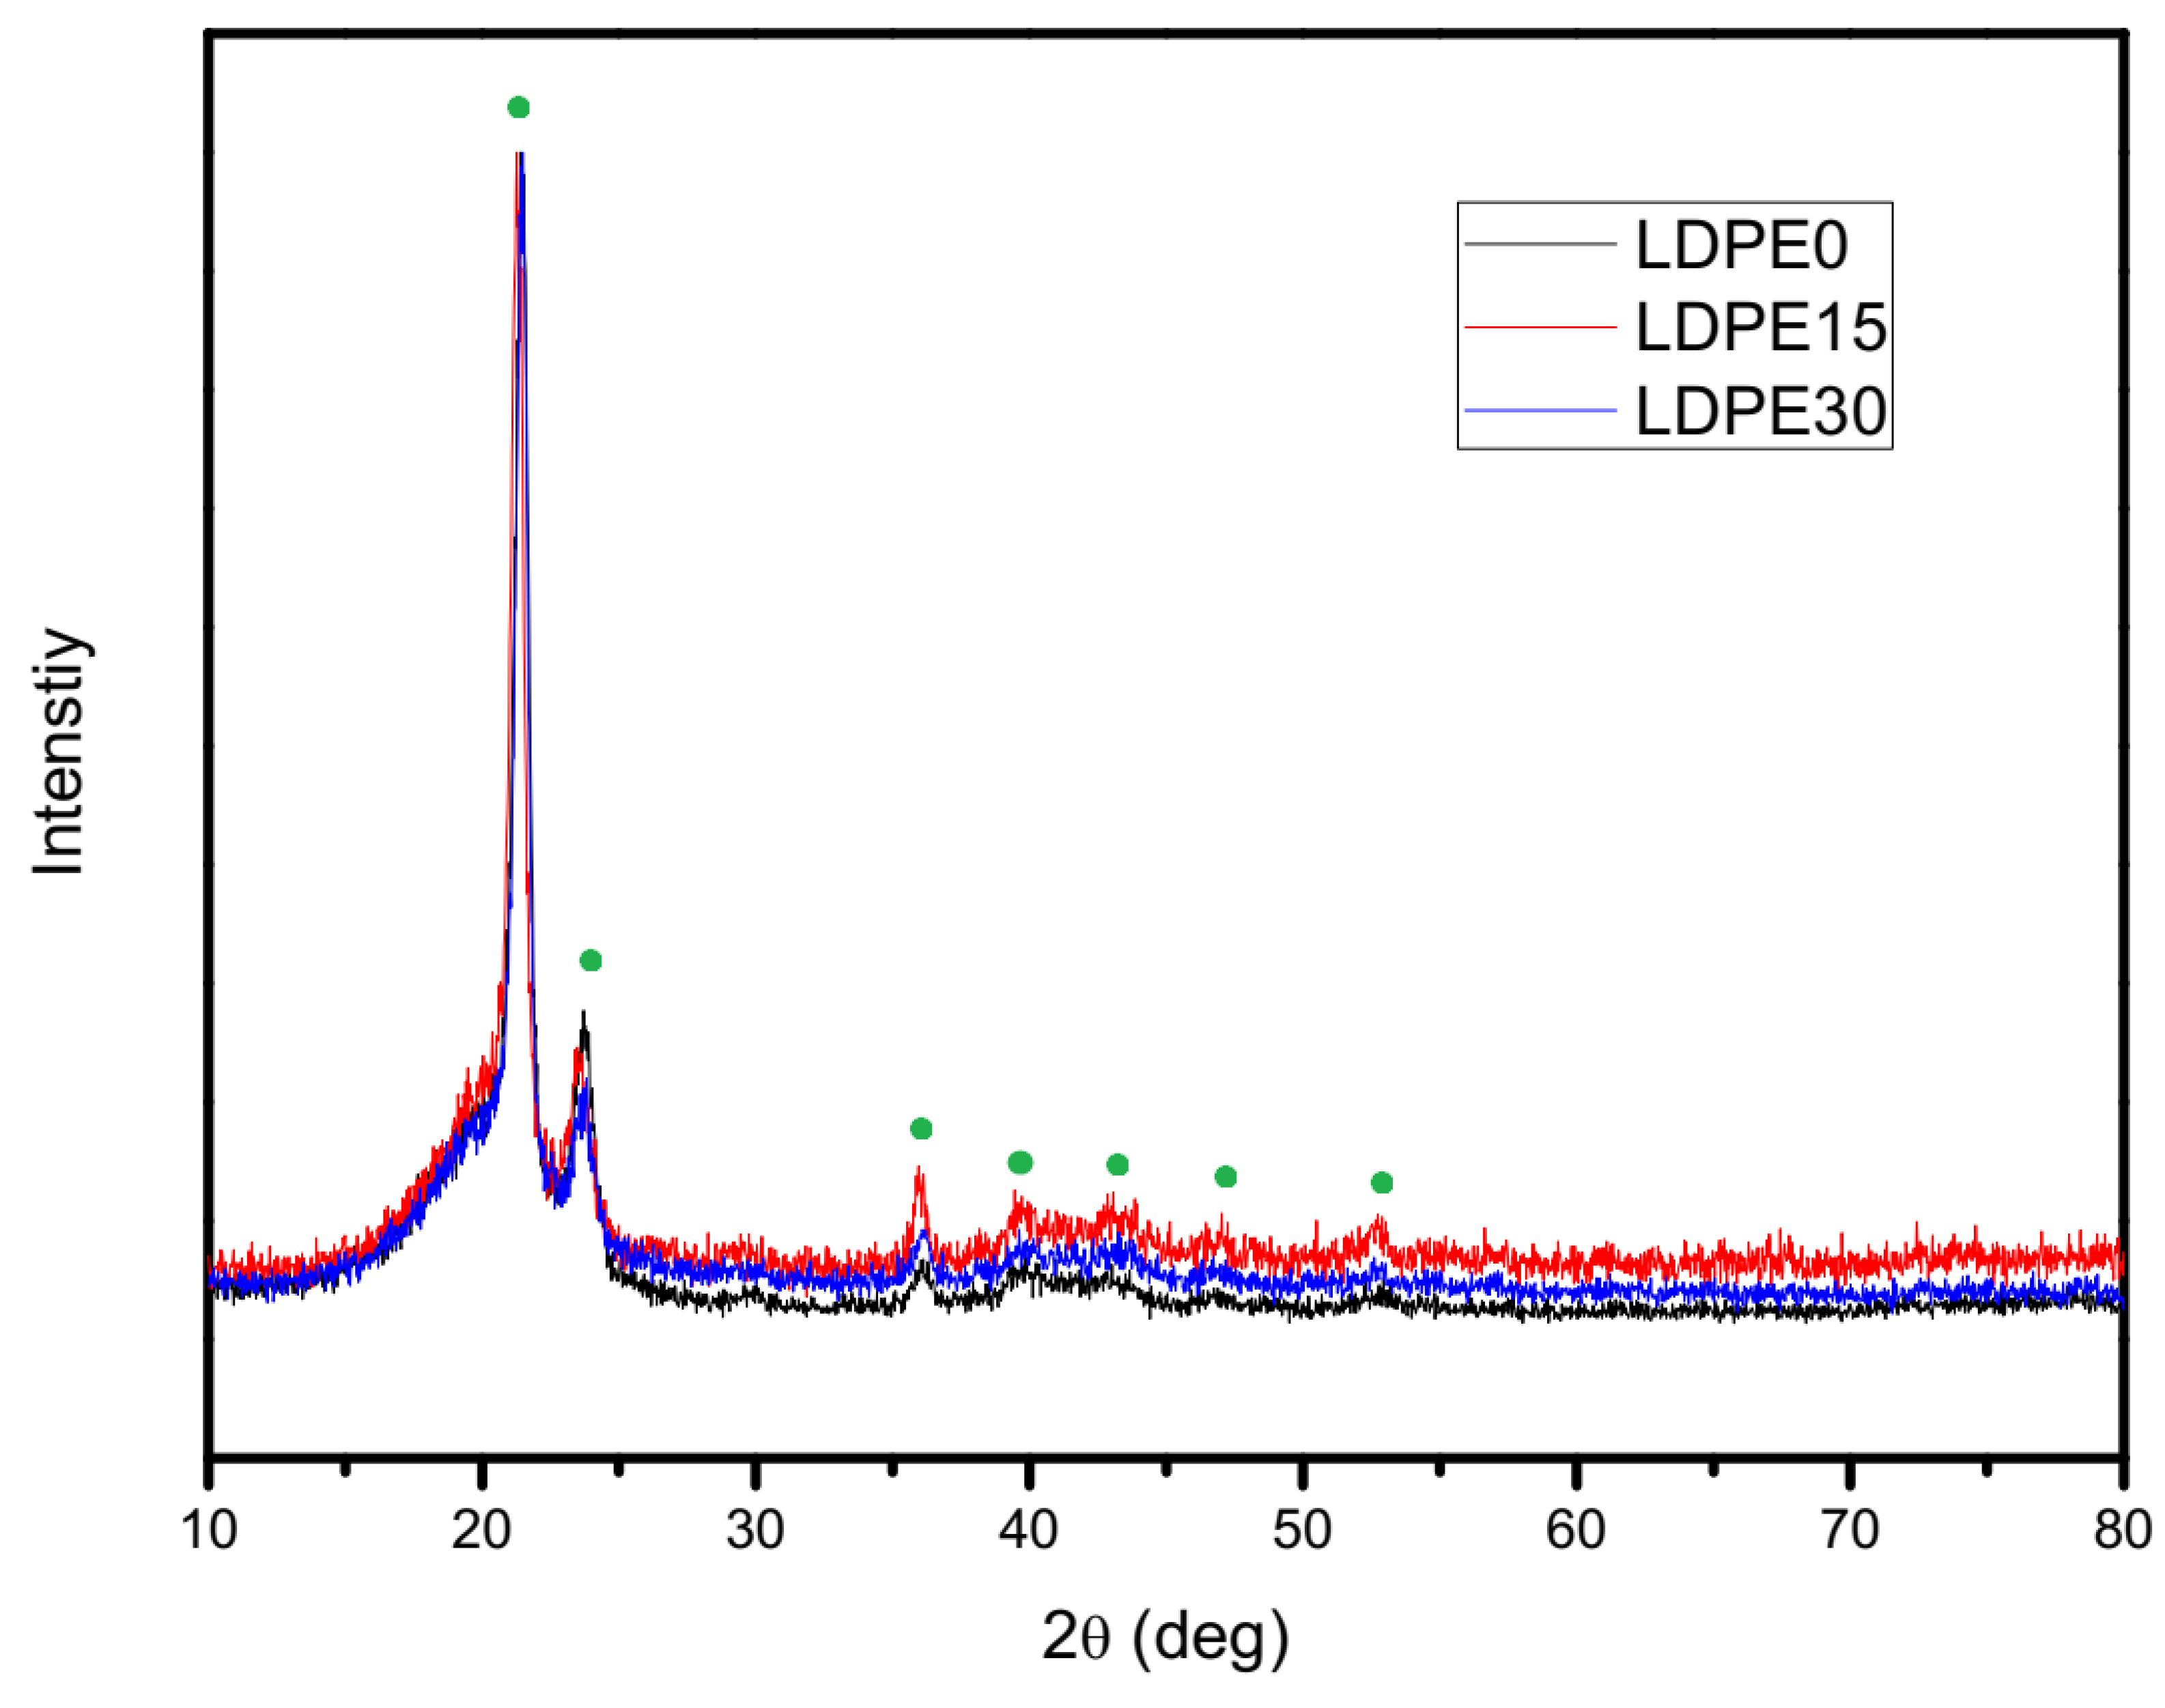
To confirm crystallinity results from DSC analysis, x-ray diffraction (XRD) tests of the neat LDPE and the composites were performed. The measurements were taken on bulk samples at Panalytical Empyreal at room temperature using Cu kα radiation (λ = 1.5405 Å), scanning step of 0.03° from 10° to 80° of 2Ɵ (Bragg angle) and 45 kV/40mA. In order to obtain reliable results, XRD curves were normalized. The crystallinity was calculated with Equation (2):
χ % = A C ( A C + A A ) × 100 %
where: Ac—the area of the crystal region, AA—the area of the amorphous region, Ac + AA—total area.
In a previous publication [29], the produced filaments were subjected to a static tensile test. The length of the measuring base was 100 mm, the deformation speed was 25 mm/min, and the device used was an INSTRON 4469 (Instron, Norwood, MA, USA). The results from this test were used to obtain the Young’s Modulus of all materials, and the calculated values are listed in Table 1 and were used in further calculations.
The power-law relation for the all obtained composites was approximated from viscosity vs. shear rate curves. The values of 〈γ〉 and τ were obtained from MFI measurements performed on CEAST plastometer (Instron, Norwood, MA, USA) using the following Equations. (3) and (4):
τ = R N F 2 π R p 2 l
where RN is the nozzle radius [0.9 mm], Rp is the piston radius [4.6 mm], F is the applied force defined as load [L, kg], g = 9.80665 m/s2 and l is the nozzle length [7.7 mm],
γ ˙ = 4 M F I 600 ρ π R N 3
where MFI is the melt flow index (210 °C) [g/10 min], and ρ is the density [g/cm3].
The above procedure was postulated among others in [39]. In order to estimate the power-law coefficient, the MFI was measured at different loads. Measurements were taken at loads of 1200, 1400, 1700, 2000, 2200, 2400, and 2700 grams. The samples at each load were taken 5 times and errors for MFI, 〈γ〉, τ and η were calculated with the partial derivative of mean squared error (MSE). The obtained consistency index K and the power-law exponents were determined from approximation curves to calculate the filament feed rate. Friction test samples were printed as in previous work [29], and their parameters are shown in Table 2.
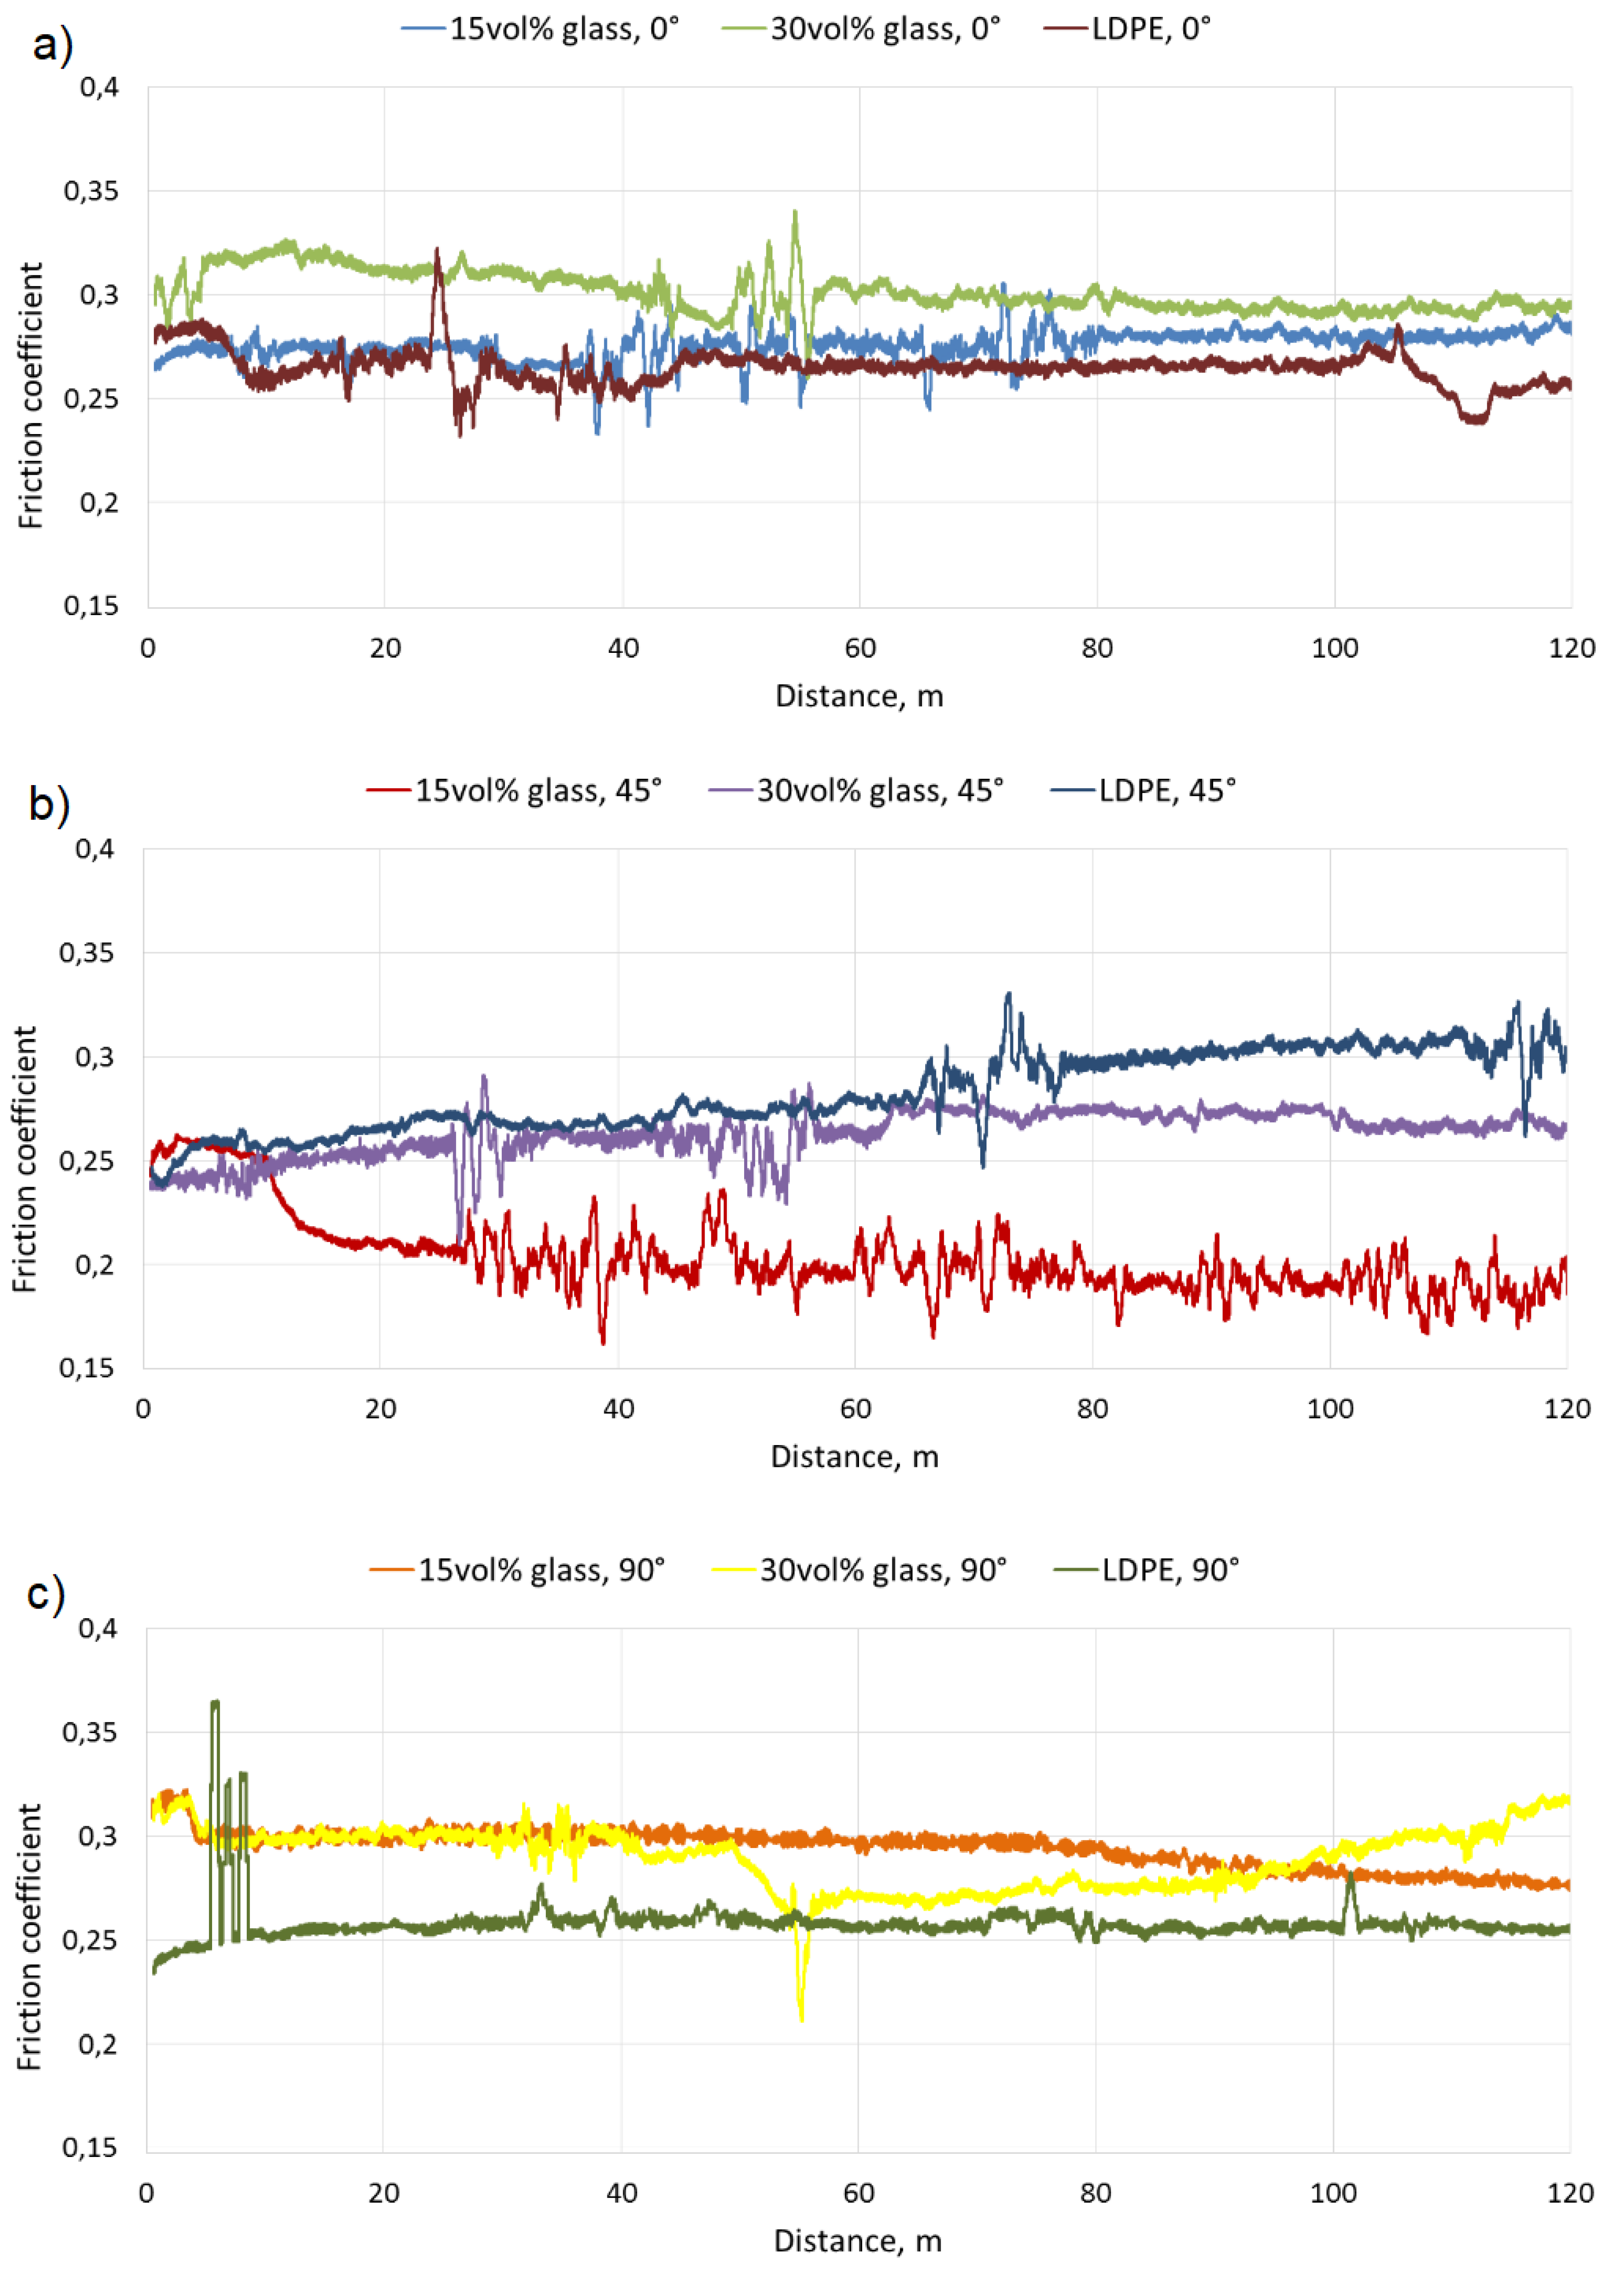
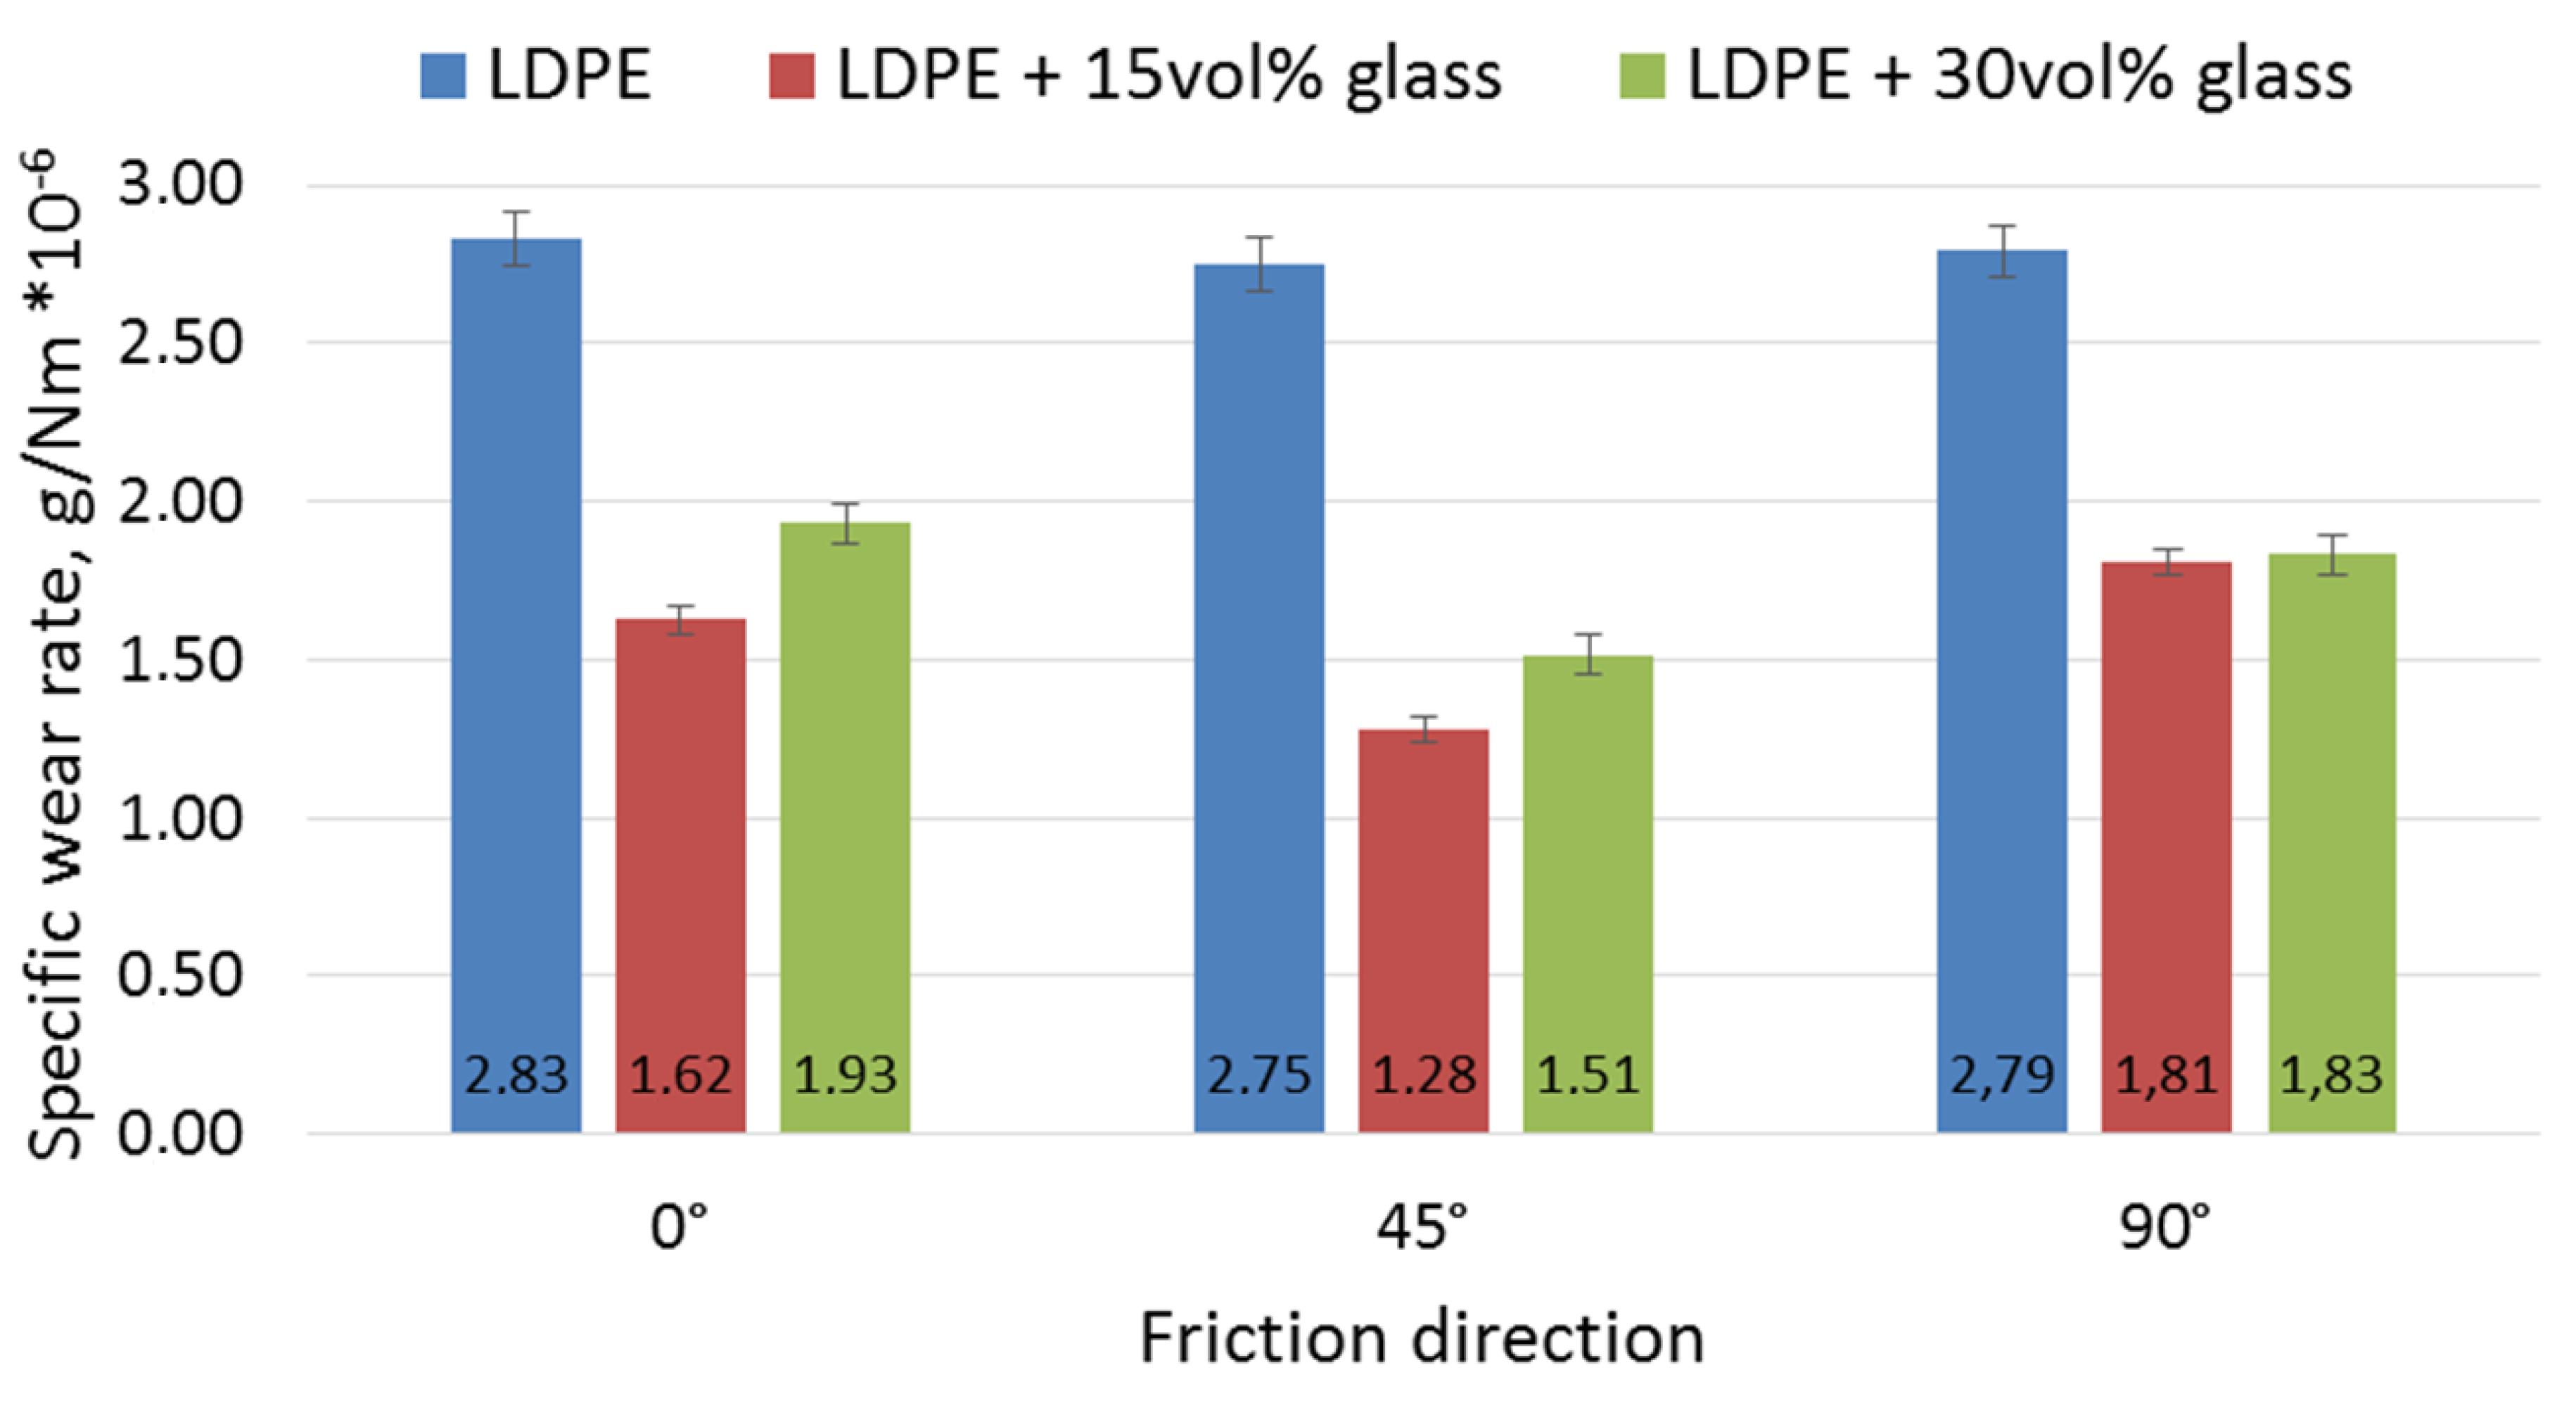
The tribological properties of the printed composites were determined using a TM-01M tester (pin-on-disc method) in dry friction conditions in reciprocating movement. Tests were carried out for a distance of 120 meters, under a 20 N load, with a velocity of 0.03 m/s, with a cast-iron countersample (φ = 3 mm). Such a friction pair was chosen as a comparative method to assess possible future applications of the composite. Moreover, the impact of the path layout was determined, and friction tests were conducted in three directions: parallel to the outer printed paths (0°), perpendicular to the paths (90°), and at 45°. Tests were performed on three specimens and the presented curves are the representative ones. The average size of wear trace was 4 mm width and 12 mm length. The specific wear rate (SWR) was calculated according to Equation (5):
S p e c i f i c   w e a r   r a t e   ( S W R ) =   Δ m P · L
where Δ m is the mass change of a sample, P is the load, and L is the distance.
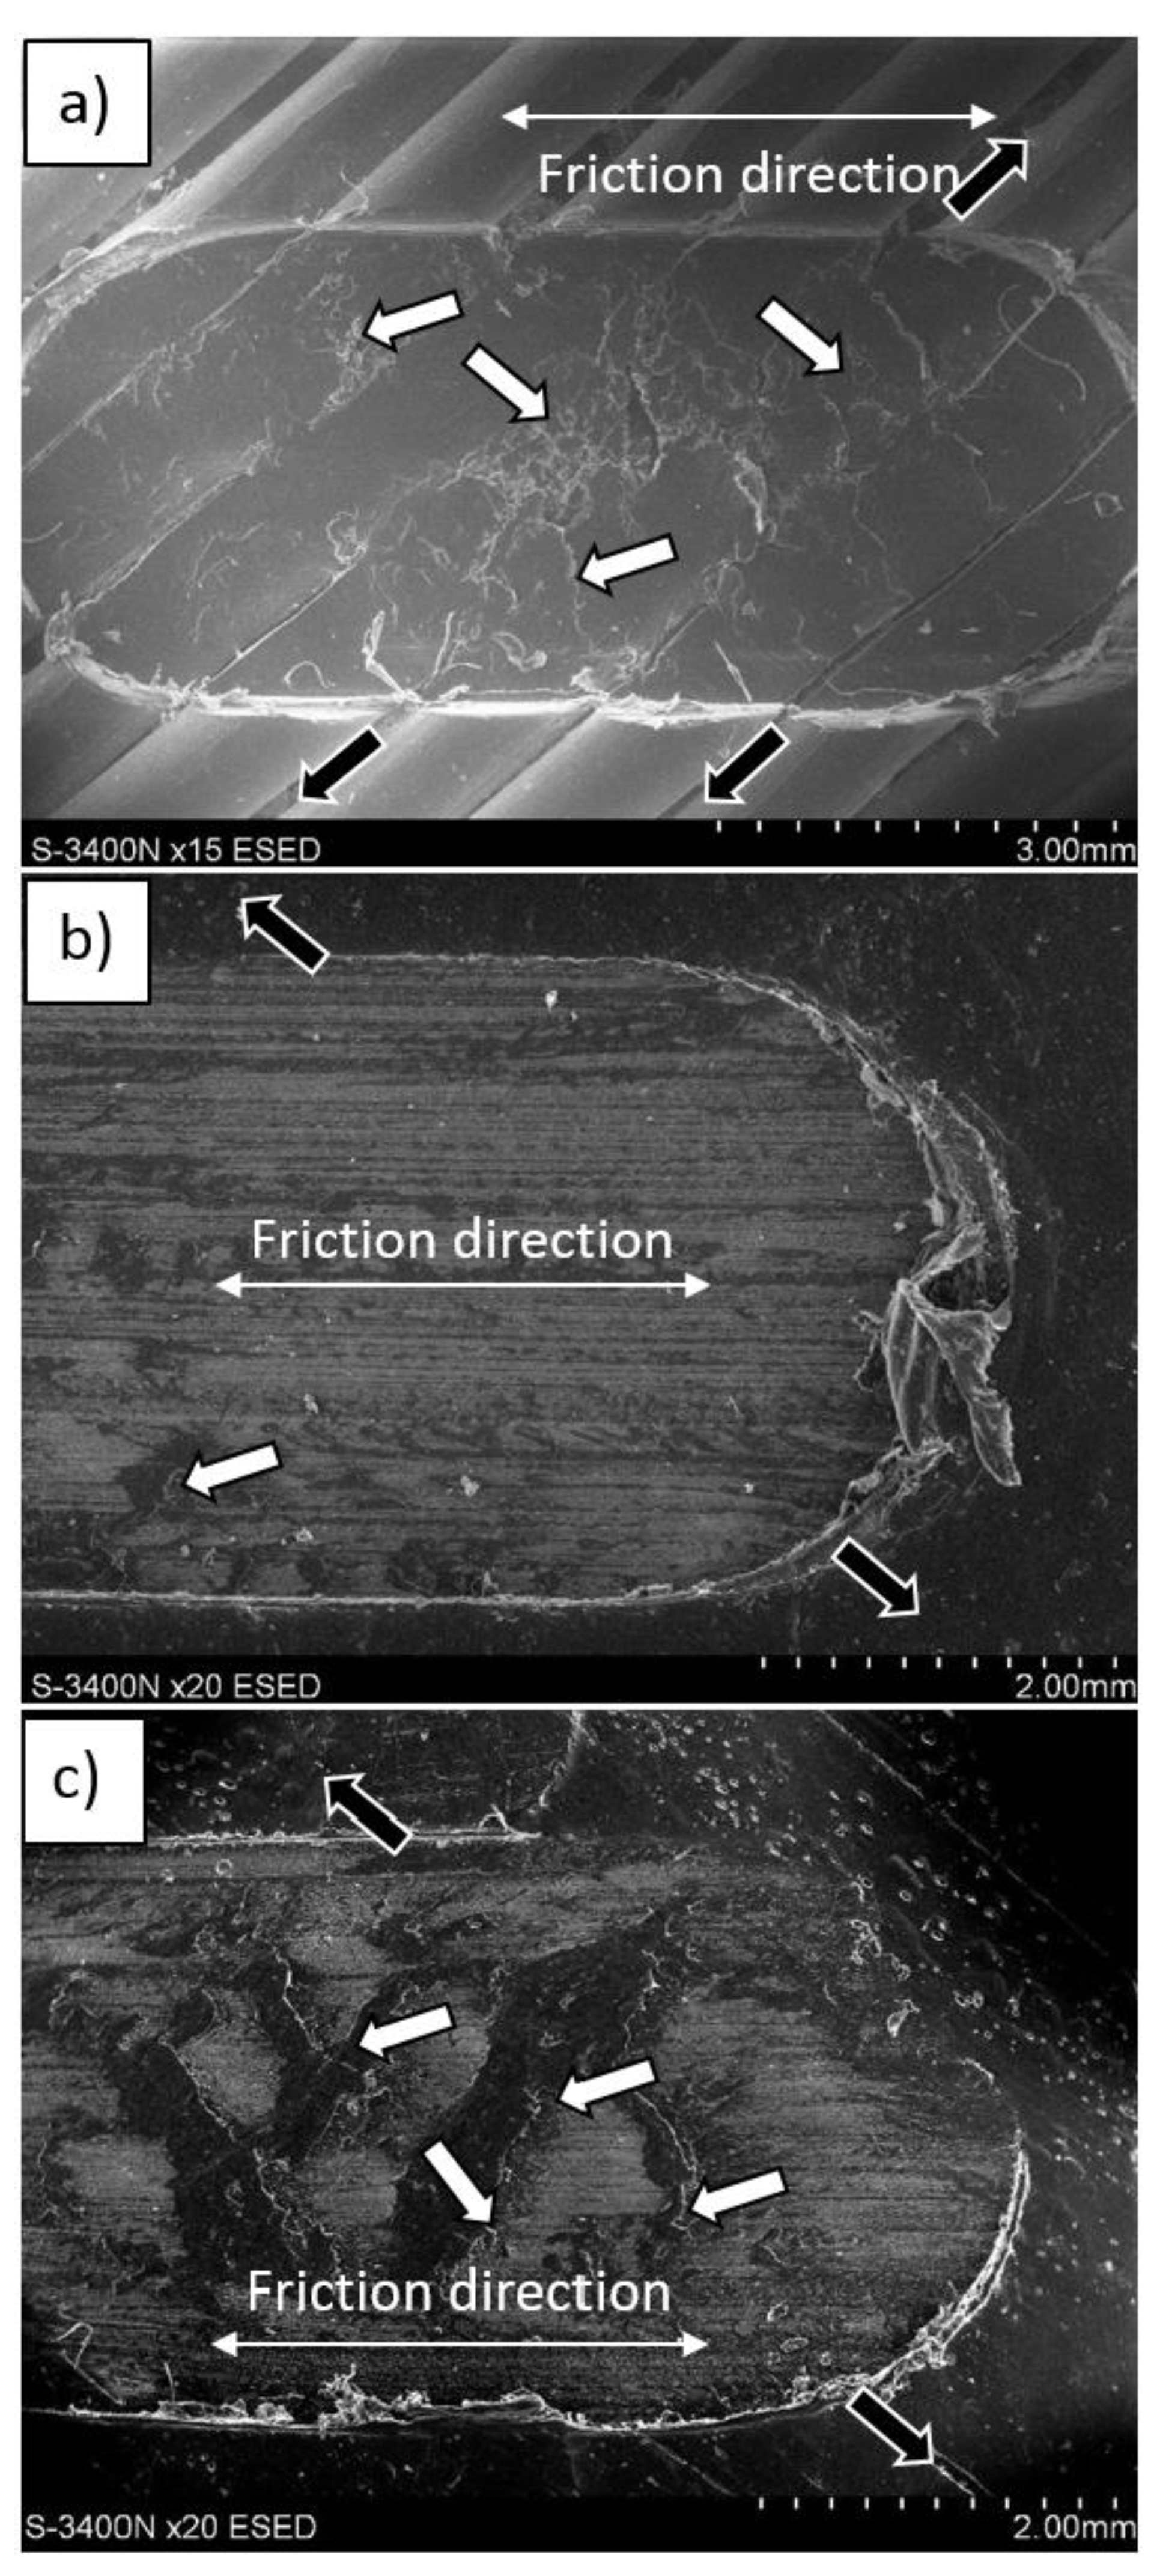
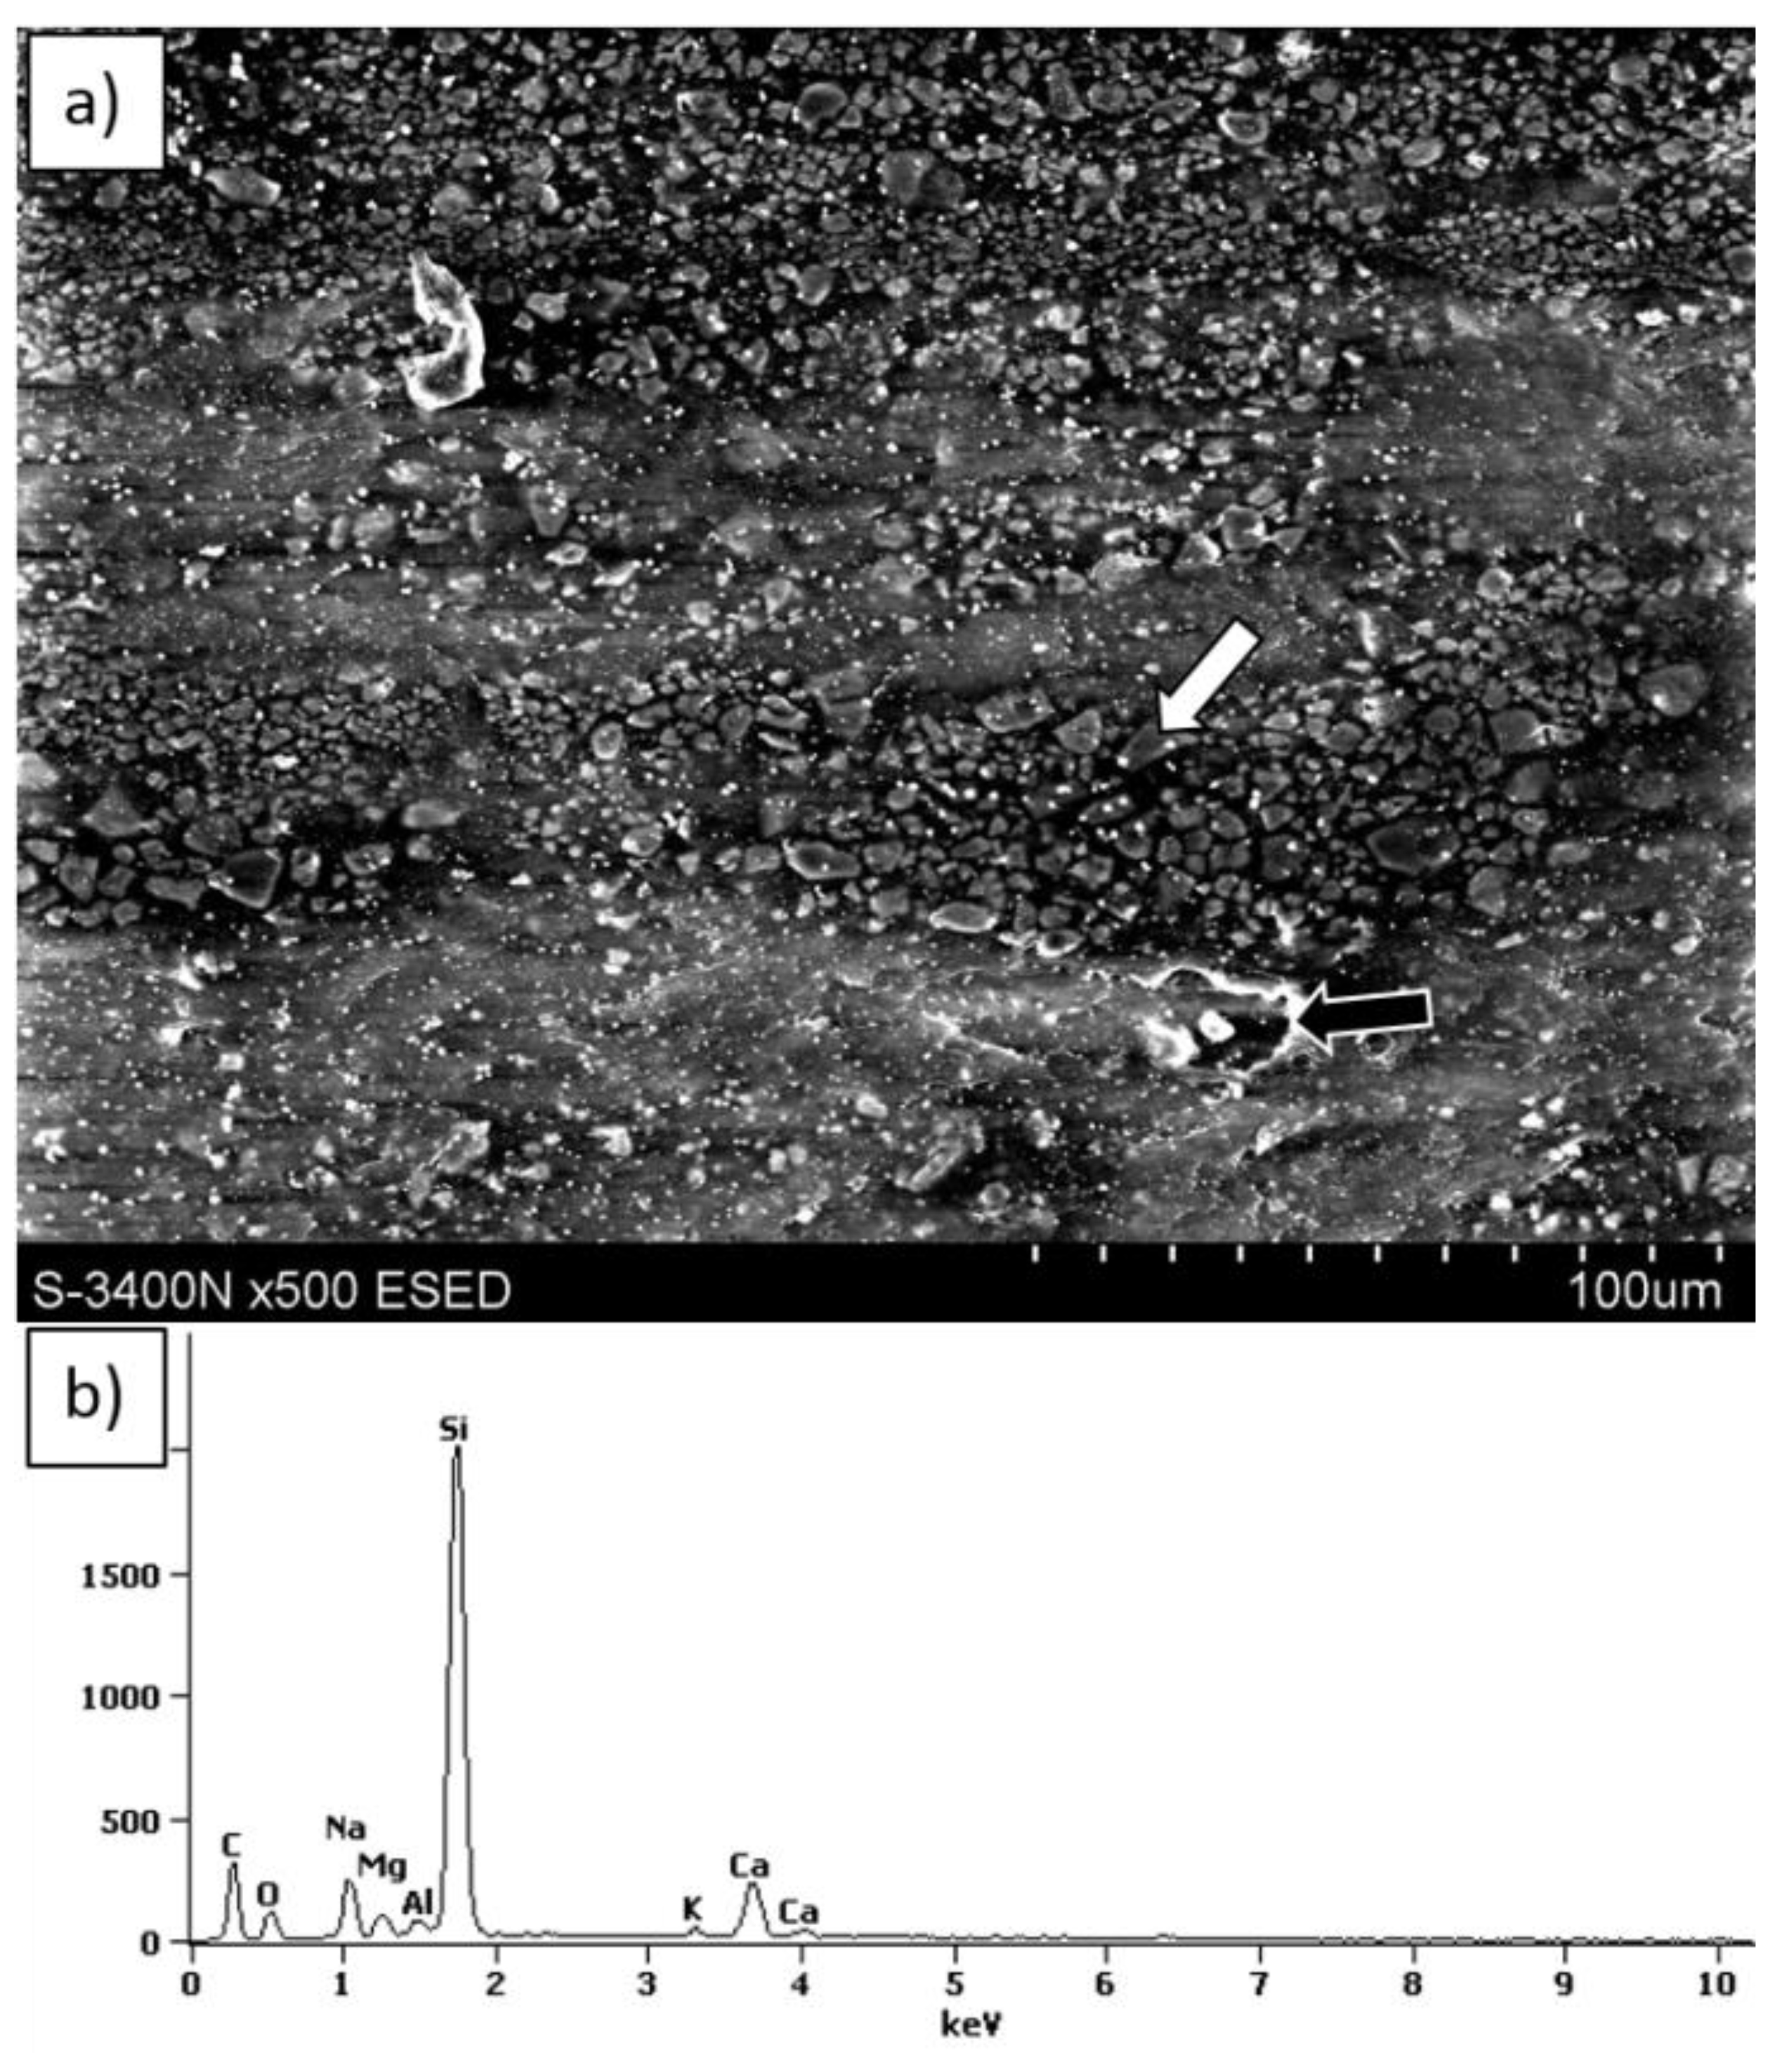
Finally, sample surfaces after friction tests were characterized using scanning electron microscope (SEM).
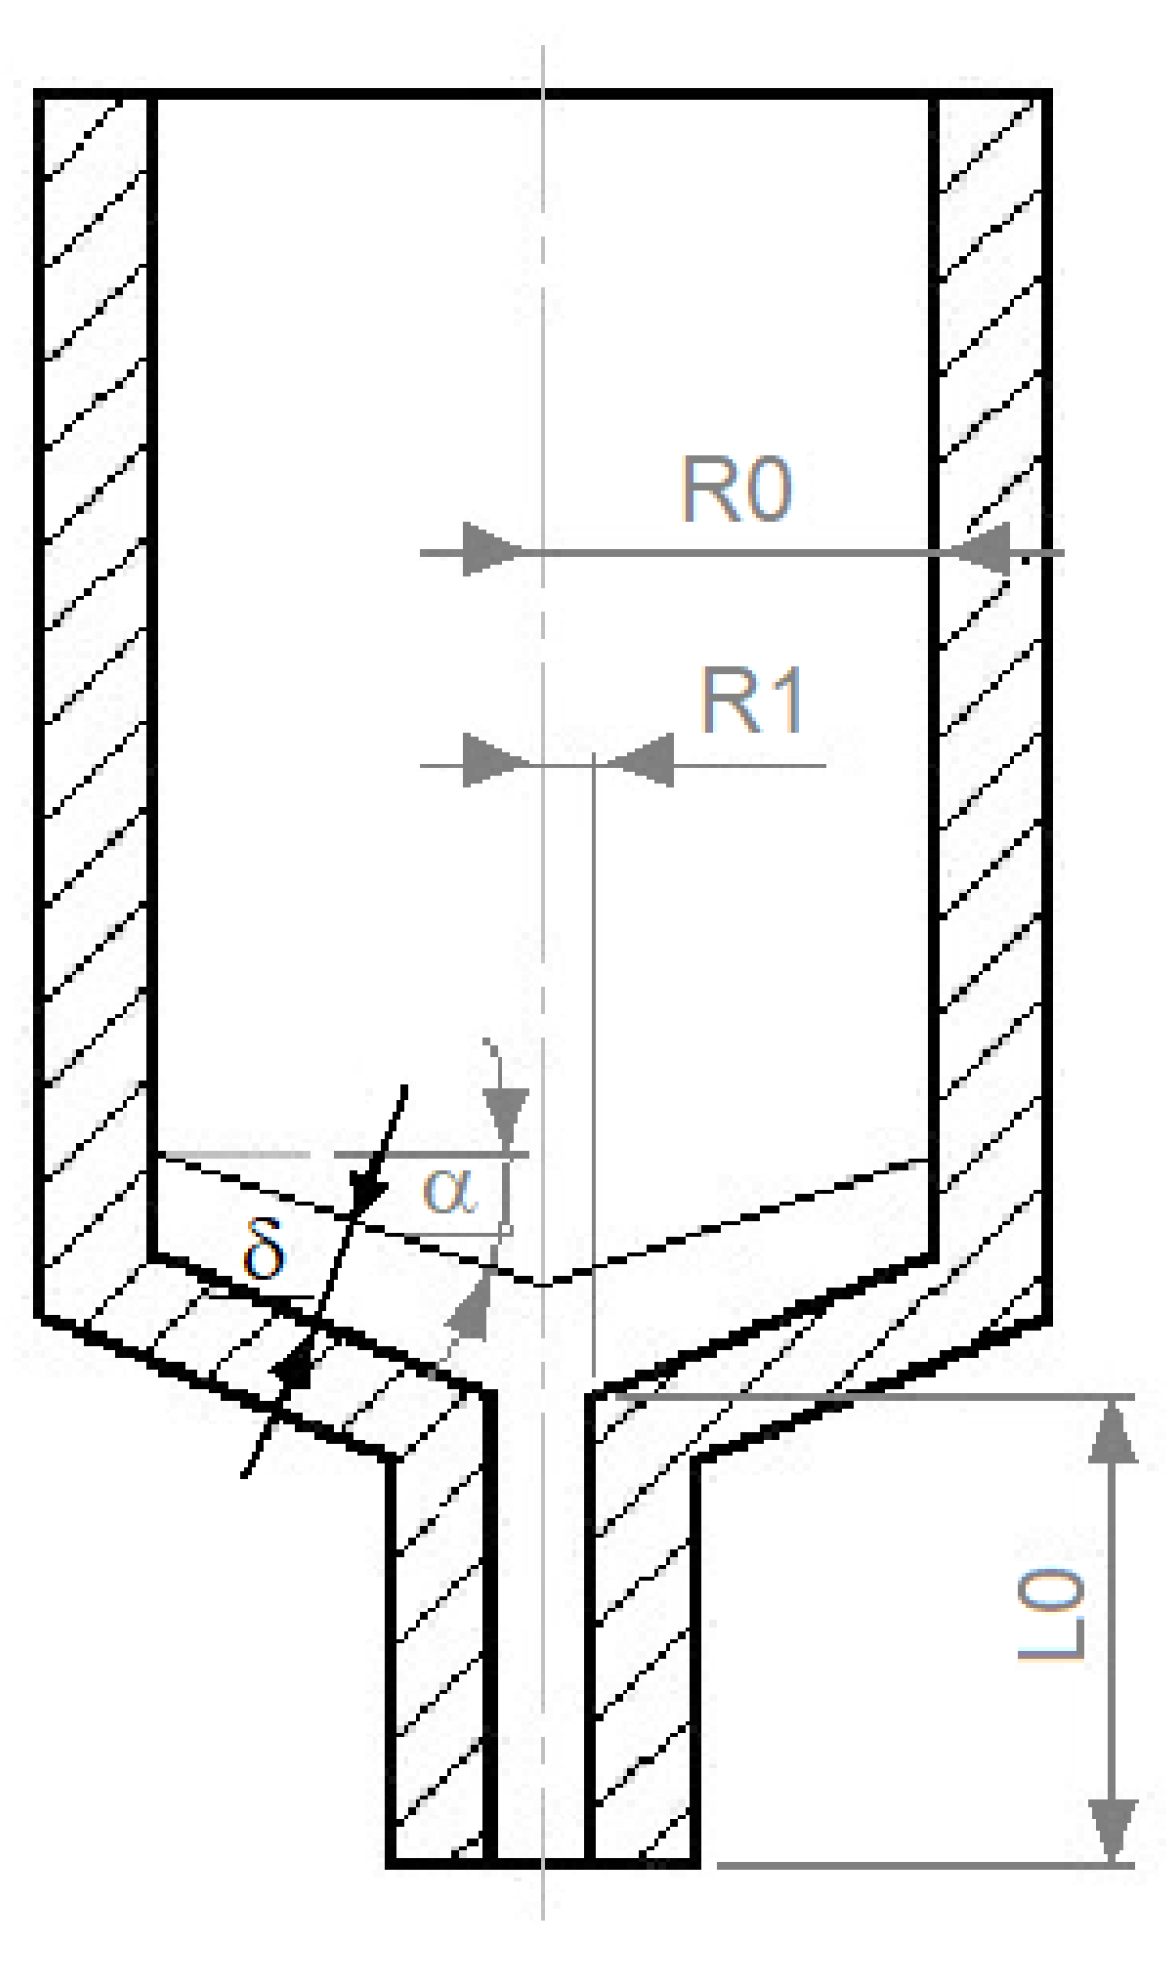
The maximum filament feed rate was calculated using the mathematical model proposed by Osswald et al. [24] in which a melt filament is pushed towards a conical (or flat in this case) nozzle to form a thin film. The vital dimensions of the melting area of the printer are illustrated in Figure 3.
Such an approach requires melting the material in a liquifier and simultaneously applying a force to the filament, which moves it through the nozzle. In the model, the force applied to the filament can be expressed as a function of the filament feed rate, liquifier geometry, and the material properties (Equations (6) and (7)):
F = ( 6 π μ f v ρ s ρ m R 0 4 cos β 2   δ 3 ) [ ln ( R 1 R 0 ) + 3 4 + 1 4 ( R 1 R 0 ) 4 ( R 1 R 0 ) 2 ] 8 π μ c v ρ s ρ m L 2 ( R 1 R 0 ) 2
where µf is the viscosity of the melt film [Pa·s], ρs is the filament density [g/cm3], ρm is the melt density [g/cm3], R0 is the filament radius [mm], R1 is the nozzle radius [mm], δ is the thickness of the melt film [mm], µc is the polymer viscosity in the nozzle [Pa·s], and L2 is the nozzle height [mm].
δ = k m ( T d T m ) ρ s v [ λ + C p ( T m T 0 ) ]
where km is the thermal conductivity of the melt [Wm−1K−1], Tm is the polymer melting point [K], λ is the melt enthalpy [J/kg], Cp is the heat capacity of the filament [Jkg−1K−1], and T0 is the initial temperature of the filament [K].
To determine the maximum filament velocity, the least-squares method may be applied. As the boundary condition, a Euler buckling condition (Equation (8)) was used as proposed by Bellini et al. [22]:
P c r = π E d 0 2 16 L 0 2
where E is the filament’s Young’s Modulus [GPa], d0 is the filament diameter [mm], and L0 is the distance between the rollers and liquifier [mm].
This approach is very suitable because by changing the filament diameter, liquifier geometry, or Young’s Modulus of the material, the critical buckling pressure can be increased. This condition can also be applied for flexible filaments such as LDPE and its composites. The linear printing speed (in either the X or Y direction) was estimated from the calculated feed rate by simply assuming that the printing volume rate equals the fed filament volume.

3. Results and Discussion

3.1. Composites Characteristics

The microstructures of the obtained composites are shown in Figure 4. The reinforcement composite filaments were homogeneously distributed throughout the matrix, and there was also a clearly visible difference in morphology between the composites, representing a different glass powder volume fraction.
After 3D printing (Figure 5), the composites showed good bonding between path layers without cracks or voids, which indicates that the layers were well-melted and mutually permeated.
The MFI values were used to determine rheological coefficients of the composites using the power law (Equation (4)). The MFI indexes determined for the obtained composites at various loads are given in Table 3.
As can be seen in some cases, the introduction of solid particles into a polymer matrix increased its MFI. However, it is only apparent and such effect can be explained with an increased density. The MFI tests are performed in a vertical position, which causes a stronger acceleration from gravity for the materials at higher mass density. In general, the viscosity of composites must be higher than those of neat LDPE, so their flow rate must be lower [40,41,42]. The presented analytical methodology (Equation (4)) uses MFI, but it takes into account the density, so the influence of the "gravitational" factor is neutralized in it. This effect can be confirmed by using MFI to calculate the flow rate Q (Equation (9)) [43]:
Q = M F I ρ
For instance, the flow rate of neat LDPE (at load 2000 g) is 3.29 cm3/10 min, when for composites that value decrease to 3.14 and 3.03 cm3/10 min, respectively for LDPE15 and LDPE30 (Table 4). Similar increases of MFI for LDPE were observed in the work of Bedi et al. [18].
The melt enthalpy was obtained from DSC analysis (Figure 6). The addition of glass particles did not significantly influence the melting and crystallization temperature. In all samples, a transition at 65 °C was observed, which was related to the relaxation after LDPE crystallization. The composite samples exhibited a higher crystallinity than neat LDPE, which indicates that the glass powder likely influences the nucleation during crystallization. It may also justify above-mentioned changes in the viscosity vs. shear rate relation.
Performed XRD analysis confirmed the semi-crystalline structure of neat LDPE and the obtained composites (Figure 7).
The interpretation of the peaks was made according to work by Schmacke [44]. All samples exhibit a similar crystalline form of PE. However, the area of crystal peaks at 21.3° and 23.7° of 2θ (two highest peaks) decreased while the area of the smaller peaks increased. The crystallinity calculated from XRD confirms the DSC measurement, however, the increase in crystallinity for composites is smaller. According to others work [45], fine glass particles (D90 = 20.1 μm) can behave as nucleating agenda similar to talc. To confirm such conclusion additional research in this field is necessary.

3.2. Feed Rate Calculation

Most parameters of the model calculation in Table 5 were determined experimentally or measured, but the heat capacity, the thermal conductivity of the melt, and melt density were taken from another source [46].
The values of Cp and km for LDPE15 and LDPE30 were calculated from a rule-of-mixture equation using the weight fraction (Equation (10)) [31]:
A c = A m w t % m + A r w t % r
where Ac is a property of the composite, Am is a matrix property, Ar is a reinforcement property, wt%m is the weight fraction of the matrix, and wt%r is the weight fraction of the reinforcement. The parameters used to mathematically model the FDM process feed rate (Equations (7) and (8)) for neat LDPE and for the obtained composites are given in Table 6. The melt density of all samples was assumed to be 80% of the solid density, according to [47].
The calculated values of feed rate and printing speed (Table 7) matches the experimentally determined printing parameter in Table 2 (printing speed = 3 mm/s).
3D printing these materials at a speed higher than 3 mm/s results in filament buckling directly below the driving wheels (Figure 8).
This indicates that the presented model can predict printing parameters, but there are some differences between the theoretical and experimental values which are the result of inadequately estimating the thermal properties of materials. The modeling results suggest that the composite materials can be fed faster than neat LDPE. Even though the viscosity of composites is higher during printing, the difference is probably compensated for by a higher stiffness along with a change in its thermal properties. In addition, the melt film thickness is higher for LDPE15 and LDPE30, which should lower the tension in the filament. Such a result suggests that in composite filaments, the reinforcement can absorb more heat than the matrix and transfer it to the nozzle, which impacts the melting process. Such behavior should be limited since an increase in the viscosity will have a greater impact on 3D printing than mechanical or thermal changes.

3.3. Tribological Properties

Representative curves of friction coefficient changes vs. friction distance are presented in Figure 9. The specific wear rate (SWR) of the materials was set in Figure 10.
A slight increase in the average value of the friction coefficient was observed for composites compared with the reference material, but only into 0° and 90° directions. For the 45° direction, the trend is reversed. However, the performed tests showed that the most favorable friction direction for LDPE-based 3D prints was 90°, which was related to the relatively poor bonding between the printed paths. The application of LDPE-based composites with glass particles increases the friction coefficient but also stabilizes it. Unlike the pure polymer, in composites, the most favorable direction was 45°. This direction showed a friction coefficient reduction of approximately 30% for the composite with 15 vol.% glass and approximately 10% for the composite with 30 vol. % glass, compared with the neat LDPE.
The application of fine glass powder reduced the wear in the examined friction couple in all friction directions. However, the highest SWR reduction (up to approx. 50%) was observed in the 45° printed paths direction, which indicates that this direction was more beneficial when applied to the composites. This is unlike the neat LDPE, for which the SWR was practically independent of the path’s direction. The effect of the path’s direction was even stronger in the composite with 15 vol. % of glass powder than for the 30% one, suggesting some complex friction mechanisms in this case. Most likely, hard glass particles skidded from the friction area and created a kind of film on the surface which facilitated countersample movement. These particles acted as microscopic rolling bearings in a mechanism described in [48] and [19]. In order for this film to be effective, the number of particles per unit area must be adequate—neither too small nor too large—and this number undoubtedly depends on the volume fraction of particles in the composite. To precisely define it, a separate test procedure would have to be carried out, but it can be concluded from the results shown in Figure 10 that the 15% composite was more optimal than the 30% one. The number of particles in the film also depends on the intensity of the removal of particles from the friction area, which depends on the direction of the printed tracks in the case of a 3D-printed element. The track of the potential particle skidded by the countersample, at different track directions, is shown in Figure 11.
The track is limited by the longitudinal voids between the paths (see also Figure 5). Most likely, for the optimal effect, the film must achieve "stability", which it does achieve when the distance tracked by the skidded particles is too short (90° position) or too long (0° position). The most optimal direction seems to be 45°. The path of the skidded particles is long enough that the right number of them creates a film, but short enough that there are not too many particles, which results in "seizing" of the system and intense wear. Similar mechanisms for metal composites were precisely analyzed, among others in [48]. The obtained results do not indicate that the texture of the material caused by the printing process significantly influences its wear resistance.
SEM observation of sample surfaces after tribological test showed that glass particles separate from the matrix. In the next step, the wrested particles were stuck again in the LDPE matrix (Figure 12 and Figure 13). This effect is more intense when the composite with 15% vol. glass powder was applied (Figure 12, bright areas).
The dark areas visible in the SEM micrographs represent the plastic deformation of LDPE. It should be noted that adding 15 vol.% reinforcing powder was more beneficial due to the better arrangement of glass sticking, since there were larger areas of neat LDPE between the particles, compared with the 30%. Accumulation of friction products was observed in the side region of the wear trace in the 30% composite (Figure 13). Energy dispersive spectroscopy (EDS) tests showed that the products (building the tribological film) consisted solely of glass, which justifies the different wear behavior of the composites described above.
Basing of presented feed rate calculation model there is possible to predict a behavior of composites with different glass particles volume fraction (e.g., 50%). Collected data about investigated materials (LDPE0, LDPE15, and LDPE30) showed that the increase of the reinforcing phase would cause a slight increase in melt viscosity, would not have a significant effect on the crystallinity of the matrix and—due to the above-described friction mechanisms—probably would not improve the wear resistance of the material.
The results obtained in the study are of great practical importance. They show, among others, that:
  • you can produce low-duty friction material from waste—waste glass was used in the work, but the LD-PE used as a matrix also can be a waste material, probably with the highest tonnage of all materials.
  • the frictional properties of the soft (and cheap) polymer can be significantly improved by adding a relatively cheap reinforcing component.
  • you can optimize the path layout in the FDM printed material so as to minimize frictional wear.
  • simple and easily determinable coefficients (e.g., MFI) can be used to predict the technological properties of FDM-related materials, which can greatly simplify and speed up the procedure for implementing new printing materials.

4. Conclusions

In this preliminary work, the technological properties (filament feed rate and printing speed) and wear resistance (specific wear rate) of novel 3D-FDM printed LDPE-matrix composites were evaluated. The following general conclusions were drawn:
The applied procedure using a mathematical model was used to estimate the maximum feed rate and hence the printing speed. Such use is effective and helpful for researching new 3D printing materials.
The composites showed a higher elastic modulus compared with neat LDPE. An improvement in the elastic modulus allows a faster print speed, but failure in printed parts may be observed due to faster printing.
Composite samples exhibited a higher crystallinity than neat LDPE. However, the increase is very slight and close to the error limit.
Using a fine glass powder as a reinforcement in the thermoplastic polymer composites improved their wear resistance due to the formation of a sliding film on the sample surface.
An evident effect of the friction direction vs. the printed path direction on the wear appeared, which was probably related to differences in the removal of friction products from the friction area for different print-path layouts against the friction direction.
The LDPE composite with auto-screen glass particles is a promising material and should be studied further.

Author Contributions

Conceptualization, P.O., M.G., and M.K.; methodology, P.O. and M.G; software, P.O. and M.G.; validation, M.K.; formal analysis, M.K. and P.O.; investigation, P.O. and M.G.; resources, P.O. and M.G.; data curation, P.O. and M.G.; writing—original draft preparation, P.O., M.G., and M.K.; writing—review and editing, M.K., P.O., and M.G.; visualization, M.G., P.O., and M.K.; supervision, M.K.; project administration, M.K.; funding acquisition, M.K.

Funding

Publication supported as a part of the Rector’s grant in the area of scientific research and development works. Silesian University of Technology, grant number 11/030/RGJ19/0231.

Conflicts of Interest

The authors declare no conflict of interest. The funders had no role in the design of the study; in the collection, analyses, or interpretation of data; in the writing of the manuscript, or in the decision to publish the results.

References

  1. Chua, C.K.; Leong, K.F. 3D Printing and Additive Manufacturing: Principles and Applications; WSPC: Singapore, 2014. [Google Scholar]
  2. Redwood, B.; Schoffer, F.; Garret, B. The 3D Printing Handbook: Technologies, Design and Applications; 3D Hubs: Toronto, ON, Canada, 2017. [Google Scholar]
  3. Sorrentino, L.; Anamateros, E.; Bellini, C.; Carrino, L.; Corcione, G.; Leone, A.; Paris, G. Robotic filament winding: An innovative technology to manufacture complex shape structural parts. Compos. Struct. 2019, 220, 699–707. [Google Scholar] [CrossRef]
  4. Wang, X.; Jiang, M.; Zhou, Z.; Gou, J.; Hui, D. 3D printing of polymer matrix composites: A review and prospective. Compos. Part B 2017, 110, 442–458. [Google Scholar] [CrossRef]
  5. Boparai, K.; Singh, R.; Singh, H. Comparison of tribological behaviour for Nylon6-Al-Al2O3 and ABS parts fabricated by fused deposition modeling. Virtual Phys. Prototyp. 2015, 10, 59–66. [Google Scholar] [CrossRef]
  6. Isakov, D.; Lei, Q.; Castles, F.; Stevens, C.; Grovenor, C.; Grant, P. 3D printed anisotropic dielectric composite with meta-material features. Mater. Des. 2016, 93, 423–430. [Google Scholar] [CrossRef]
  7. Chung, H.; Das, S. Processing and properties of glass bead particulate-filled functionally graded Nylon-11 composites produced by selective laser sintering. Mater. Sci. Eng. A 2006, 437, 226–234. [Google Scholar] [CrossRef]
  8. Nikzad, M.; Masood, S.; Sbarski, I. Thermo-mechanical properties of a highly filled polymeric composites for fused deposition modeling. Mater. Des. 2011, 32, 3448–3456. [Google Scholar] [CrossRef]
  9. Śleziona, J. Podstawy Technologii Kompozytów; Wydawnictwo Politechniki Śląskiej: Gliwice, Poland, 1998. [Google Scholar]
  10. Oleksiak, B.; Kozioł, M.; Wieczorek, J.; Krupa, M.; Folega, P. Strength of briquettes made of Cu concentrate and carbon-bearing materials. Metalurgia 2015, 54, 95–97. [Google Scholar]
  11. Majerski, K.; Bienias, J.; Surowska, B. Tensile strength of titanium/fibre reinforced polymers at different temperature values. Compos. Theory Pract. 2018, 18, 88–94. [Google Scholar]
  12. Boparai, K.S.; Singh, R. Thermoplastic composites for fused deposition modeling filament: Challenges and applications. Ref. Modul. Mater. Sci. Mater. Eng. 2018. [Google Scholar] [CrossRef]
  13. Giemza, B.; Domański, M.; Deliś, M.; Kapica, D. Tribological properties of 3D printed components. J. Konbin 2018. [Google Scholar] [CrossRef]
  14. Mohamed, O.A.; Masood, S.H.; Bhowmik, J.L.; Somers, A.E. Investigation on the tribological behaviour and wear mechanism of parts processed by fused deposition additive manufacturing process. J. Manuf. Process. 2017, 29, 149–159. [Google Scholar] [CrossRef]
  15. Zander, N.E.; Gillan, M.; Burckhard, Z.; Garde, F. Recycled polypropylene blends as novel 3D printing materials. Addit. Manuf. 2019, 25, 122–130. [Google Scholar] [CrossRef]
  16. Schirmeister, C.G.; Hees, T.; Licht, E.H.; Mulhaupt, R. 3D printing of high-density polyethylene by fused filament fabrication. Addit. Manuf. 2019, 28, 152–159. [Google Scholar] [CrossRef]
  17. Boczkowska, A.; Krzesiński, G. Kompozyty i Techniki ich Wytwarzania; OWPW: Warszawa, Poland, 2016. [Google Scholar]
  18. Bedi, P.; Singh, R.; Ahuja, I.P.S. Effect of SiC/Al2O3 particle size reinforcement in recycled LDPE matrix on mechanical properties of FDM feed stock filament. Virtual Phys. Prototyp. 2018. [Google Scholar] [CrossRef]
  19. Posmyk, A.; Myalski, J. Using composite coatings containing solid lubricants to minimize friction in piston combustion engines for aviation. Compos. Theory Pract. 2019, 19, 3–6. [Google Scholar]
  20. Stachak, P.; Hebda, E.; Pielichowski, K. Foaming extrusion of thermoplastic polyurethane modified by POSS nanofillers. Compos. Theory Pract. 2019, 19, 23–29. [Google Scholar]
  21. Singh, R.; Singh, S.; Fraternali, F. Development of in-house composite wire-based feed stock filaments of fused deposition modeling for wear-resistant materials and structures. Compos. Part B 2016, 98, 244–249. [Google Scholar] [CrossRef]
  22. Bellini, A.; Guceri, S.; Bertoldi, M. liquefier dynamics in fused deposition. J. Manuf. Sci. Eng. 2004, 126, 237–246. [Google Scholar] [CrossRef]
  23. Turner, B.N.; Strong, R.; Gold, S.A. A review of melt extrusion additive manufacturing processes: I. Process design and modeling. Rapid Prototyp. J. 2014, 20, 192–204. [Google Scholar] [CrossRef]
  24. Osswald, T.A.; Puentes, J.; Kattinger, J. Fused filament fabrication melting model. Addit. Manuf. 2018, 22, 51–59. [Google Scholar] [CrossRef]
  25. Go, J.; Schiffres, S.N.; Stevens, A.G.; Hart, A.J. Rate limits of additive manufacturing by fused filament fabrication and guidelines for high-throughput system design. Addit. Manuf. 2017, 16, 1–11. [Google Scholar] [CrossRef]
  26. Mackay, M.E.; Swain, Z.R.; Banbury, C.R. The performance of the hot end in a plasticating 3D printer. J. Rheol. 2017. [Google Scholar] [CrossRef]
  27. Pollard, D.; Ward, C.; Herrmann, G.; Etches, J. Filament temperature dynamics in fused deposition modeling and outlook for control. Procedia Manuf. 2017, 11, 536–544. [Google Scholar] [CrossRef]
  28. Xia, H.; Lu, J.; Dabiri, S.; Tryggvason, G. Fully resolved numerical simulations of fused deposition modeling. Part I: fluid flow. Rapid Prototyp. J. 2018, 24, 463–476. [Google Scholar] [CrossRef]
  29. Olesik, P.; Kozioł, M.; Konik, D.; Jała, J. The use of shredded car windscreen waste as reinforcement of thermoplastic composites for 3D (FDM) printing. Compos. Theory Pract. 2019, 19, 30–33. [Google Scholar]
  30. Durukan, O.; Kahraman, I.; Parlevliet, P.; Geistbeck, M.; Seyhan, A.T. Microfluidization, time-effective and solvent free processing of nanoparticle containing thermosetting matrix resin suspensions for producing composites with enhanced thermal properties. Eur. Polym. J. 2016, 85, 575–587. [Google Scholar] [CrossRef]
  31. Latko-Duralek, P.; Dydek, K.; Sobczakand, M.; Boczkowska, A. Processing and characterization of thermoplastic nanocomposite fibers of hot melt copolyamide and carbon nanotubes. J. Thermoplast. Compos. Mater. 2018, 31, 359–375. [Google Scholar] [CrossRef]
  32. Szperlich, P.; Toroń, B. An ultrasonic fabrication method for epoxy resin/sbsi nanowire composites, and their application in nanosensors and nanogenerators. Polymers 2019, 11, 479. [Google Scholar] [CrossRef] [PubMed]
  33. Korol, J.; Lenza, J.; Formela, K. Manufacture and research of TPS/PE biocomposites properties. Compos. Part B 2015, 68, 310–316. [Google Scholar] [CrossRef]
  34. Thakur, V.K.; Singh, A.S.; Thakur, M.K. Ecofriendly biocomposites from natural fibers: Mechanical and weathering study. Int. J. Polym. Anal. Charact. 2013, 18, 64–72. [Google Scholar] [CrossRef]
  35. Paszkiewicz, S.; Szymczyk, A.; Pawlikowska, D.; Subocz, J.; Zenker, M.; Masztak, R. Electrically and thermally conductive low density polyethylene-based nanocomposites reinforced by mwcnt or hybrid mwcnt/graphene nanoplatelets with improved thermo-oxidative stability. Nanomaterials 2018, 8, 264. [Google Scholar] [CrossRef] [PubMed]
  36. Batista, N.L.; Olivier, P.; Bernhart, G.; Rezende, M.C.; Botelho, E.C. Correlation between degree of crystallinity, morphology and mechanical properties of PPS/carbon fiber laminates. Mater. Res. 2016, 19, 195–201. [Google Scholar] [CrossRef] [Green Version]
  37. Lee, T.H.; Boey, F.Y.C.; Khor, K.A. On the determination of polymer crystallinity for a thermoplastic PPS composite by thermal analysis. Compos. Sci. Technol. 1995, 53, 259–274. [Google Scholar] [CrossRef]
  38. Battegazzore, D.; Bocchini, S.; Frache, A. Crystallization kinetics of poly (lactic acid)-talc composites. eXPRESS Polymer Lett. 2011, 5, 849–858. [Google Scholar] [CrossRef]
  39. Shenoy, V.; Saini, D.R. Thermoplastic Melt Rheology and Processing; Taylor and Francis Inc.: New York, NY, USA, 1996. [Google Scholar]
  40. Sabeta, M.; Soleimani, H. Inclusion of graphene on LDPE properties. Heliyon 2019, 5, e02053. [Google Scholar] [CrossRef] [Green Version]
  41. Kirchberg, S. Simulation and injection molding of ring-shaped polymer bonded nickel braze metal composite preforms based on rheological and thermal analyses. Open J. Compos. Mater. 2013, 3, 24–29. [Google Scholar] [CrossRef]
  42. Sikora, J.W.; Gajdos, I.; Puszka, A. Polyethylene-matrix composites with halloysite nanotubes with enhanced physical/thermal properties. Polymers 2019, 11, 787. [Google Scholar] [CrossRef]
  43. Shenoy, A.V.; Saini, D.R.; Nadkarni, V.M. Melt rheology of polymer blends from melt flow index. Int. J. Polym. Mater. 1984, 10, 213–235. [Google Scholar] [CrossRef]
  44. Schmacke, S. Investigations of Polyethylene Materials by Means of X-ray Diffraction; Technical University of Dortmund: Dortmund, Germany, 2010. [Google Scholar]
  45. Refaa, Z.; Boutaous, M.; Rousset, F. Crystallization kinetics of poly-(lactic acid) with and without talc: Optical microscopy and calorimetric analysis. AIP Conf. Proc. 2014, 1593, 342. [Google Scholar]
  46. Martienssen, W.; Warlimont, H. Springer Handbook of Condensed Matter and Materials Data; Springer: Berlin, Germany, 2005. [Google Scholar]
  47. Available online: www.beaumontic.com (accessed on 12 June 2019).
  48. Myalski, J. Kształtowanie Właściwości Tribologicznych Kompozytów Zawierających Węgiel Szklisty; Wydawnictwo Politechniki Śląskiej: Gliwice, Poland, 2011. [Google Scholar]
Figure 1. 3D printout with possible anisotropy vs. friction direction.
Materials 12 02520 g001
Figure 2. The particle size distribution of the obtained glass powder (left) and the powder with low-density polyethylene (LDPE) granules (right).
Materials 12 02520 g002
Figure 3. Main dimensions of the melting area of the printer [21].
Materials 12 02520 g003
Figure 4. Composite filament microstructure: (a) LDPE15, (b) LDPE30.
Materials 12 02520 g004
Figure 5. Bonding between path layers in the 3D printout printed from the LDPE30 composite.
Materials 12 02520 g005
Figure 6. Differential scanning calorimetry (DSC) plots of neat LDPE and the obtained composites.
Materials 12 02520 g006
Figure 7. X-ray diffraction plot of neat LDPE and the obtained composites.
Materials 12 02520 g007
Figure 8. Illustration of filament buckling due to exceeding a printing speed of 3 mm/s.
Materials 12 02520 g008
Figure 9. Representative curves of changes of the friction coefficient determined for neat LDPE and for composites over a distance of 120 m, rotated relative to the friction direction by: (a) 0°, (b) 45°, (c) 90°.
Materials 12 02520 g009
Figure 10. Calculated specific wear rate for examined materials: neat LDPE and the composites.
Materials 12 02520 g010
Figure 11. The idea of particle movement after it is separated from the matrix (marked with arrows)—in the three cases of printed paths directions vs. friction direction.
Materials 12 02520 g011
Figure 12. SEM micrographs of surfaces after friction tests: (a) LDPE, (b) LDPE-15% vol. glass, and (c) LDPE 30% vol. glass. The test was performed at a 45° angle, and white arrows indicate areas of plastic deformation and delamination, while black arrows indicate the direction ("canals") of friction products removal.
Materials 12 02520 g012
Figure 13. (a) Representative SEM micrograph of the LDPE-30% vol. glass composite surface after conducting a friction test with the corresponding energy dispersive spectroscopy (EDS) spectra (b) of stacked particles (white arrow). The black arrow indicates a microregion of plastic deformation.
Materials 12 02520 g013
Table 1. Young’s modulus of the composites.
LDPE0LDPE15LDPE30
Glass content, vol %01530
Young’s Modulus [GPa]0.193 (0.010)0.208 (0.016)0.219 (0.007)
Table 2. Established printing parameters.
Nozzle DiameterBuild Plate TemperaturePrinting TemperatureLayer ThicknessPrinting SpeedPrinting Speed of the First LayerFlow RateCooling
1 mm70 °C210 °C0.5 mm3 mm/s50%80%none
Table 3. Mold flow index (MFI) results for the neat LDPE and for the obtained composites.
LDPE
Load [g]120014001700200022002400
MFI [g/10 min]1.35 (0.07)1.63 (0.08)2.19 (0.11)2.97 (0.15)3.35 (0.17)3.6 (0.18)
LDPE15
Load [g]120014001700200022002450
MFI [g/10 min]1.30 (0.04)1.61 (0.05)2.18 (0.07)2.96 (0.10)3.42 (0.11)4.25 (0.14)
LDPE30
Load [g]120014501700200022002450
MFI [g/10 min]1.70 (0.11)1.93 (0.13)2.22 (0.07)2.98 (0.10)3.55 (0.14)4.28 (0.14)
Table 4. Flow rate (Q) values obtained for tested composite melts.
ParameterLDPE0LDPE15LDPE30
Flow rate Q [cm3/10 min]3.293.143.03
Table 5. Power law coefficients (Equations (1) and (7)), melt enthalpy, crystallization enthalpy, and crystallinity of the neat LDPE and the composites.
K [Pas]nTm [K]Tc [K]ΔHm [J/g]ΔHc [J/g]χm%χc%
LDPE040660.647115.9696.8756.6657.8919.319.8
LDPE1545630.601115.9798.156.1355.4423.623.5
LDPE3047520.595117.2496.8458.7453.4727.425
Table 6. Parameters used in mathematical modeling of FDM process feed rate for the neat LDPE and for the obtained composites.
ParameterLDPE0LDPE15LDPE30
Solid density [kg/m3]902.04942.70983.45
Melt density [kg/m3]721.63754.16786.76
Young Modulus [GPa]0.2000.2080.219
km [W/m K]0.330.450.49
Cp [J/kg K]230020281899
Printing temperature [K]483483483
Nozzle length [mm]111
Nozzle angle [°]555555
Nozzle diameter [mm]111
Distance between rollers and liquifier, Lf [mm]454545
Critical pressure, Pcr [kPa]140.9146.5154.3
Table 7. Results of mathematical modeling: melt thickness, feed rate, and printing speed (Equations (7) and (8)).
PropertyLDPE0LDPE15LDPE30
Melt thickness [µm]279.91373.44379.86
Feed rate [mm/s]0.720.830.89
Printing speed [mm/s]2.382.752.95

