Article

Improvement of Surface Roughness and Hydrophobicity in PETG Parts Manufactured via Fused Deposition Modeling (FDM): An Application in 3D Printed Self–Cleaning Parts

Department of Mechanical Engineering, University of Cordoba, Medina Azahara Avenue, 5–14071 Cordoba, Spain
*
Author to whom correspondence should be addressed.
Materials 2019, 12(15), 2499; https://doi.org/10.3390/ma12152499
Submission received: 7 July 2019 / Revised: 28 July 2019 / Accepted: 2 August 2019 / Published: 6 August 2019

Abstract

:
The fused deposition modeling (FDM) technique is used today by companies engaged in the fabrication of traffic signs for the manufacture of light-emitting diode LED spotlights. In this sector, the surface properties of the elements used (surface finish, hydrophobic features) are decisive because surfaces that retain little dirt and favor self–cleaning behavior are needed. A design of experiments (L27) with five factors and three levels has been carried out. The factors studied were: Layer height (LH), print temperature (T), print speed (PS), print acceleration (PA), and flow rate (F). Polyethylene terephthalate glycol (PETG) specimens of 25.0 × 25.0 × 2.4 mm have been printed and, in each of them, the surface roughness (Ra,0, Ra,90), sliding angle (SA0, SA90), and contact angle (CA0, CA90) in both perpendicular directions have been measured. Taguchi and ANOVA analysis shows that the most influential variables in this case are printing acceleration for Ra, 0 (p–value = 0.052) and for SA0 (p–value = 0.051) and flow rate for Ra, 90 (p–value = 0.001) and for SA90 (p–value = 0.012). Although the ANOVA results for the contact angle are not significant, specimen 8 (PA = 1500 mm/s2 and flow rate F = 110%) and specimen 10 (PA =1500 mm/s2 and F = 100%) have reached contact angle values above or near the limit value for hydrophobia, respectively.

Graphical Abstract

1. Introduction

One pillar of industry 4.0 is additive manufacturing [1]. This technology allows [2,3]: The direct manufacture of prototypes or small batches, the production of functional parts, and the obtaining of components at a low price. There are several 3D printing techniques [4], although the most extended is the fused deposition modeling (FDM), also known as fused filament fabrication (FFF) [5].
The FDM technique consists of the orderly deposition of layers by melting a thermoplastic filament [6,7]. One of the main virtues of FDM is that it allows us to work with a wide variety of plastic materials. Polylactic acid (PLA) [8] and acrylonitrile butadiene styrene (ABS) [9] were the first materials used in FDM, but today suppliers have an extensive catalogue that includes new materials every year [10].
A recent material available on the market is polyethylene terephthalate glycol (PETG). This polyester copolymer has an increasing importance in 3D printing [11,12], due to its properties [13,14]: Durability, flexibility; high impact resistance, high chemical resistance, ultraviolet and weather resistance; low moisture absorption; it acts as a gas barrier; it is odorless, recyclable, and has food contact; it is easy to print and it does not produce fumes during the building.
Industries dedicated to the manufacture of traffic signs use PETG to print spotlights for LEDs, due to its properties (UV and weather resistance, mainly) (Figure 1). The batch size of this type of order is usually small, and 3D printing allows manufacturing the spotlights in a cheap, immediate, and customized way. The use of 3D printing in the manufacture of elements for optics is not new [15].
In road signaling, it is important to have vertical flat elements that are not very rough (that do not accumulate dirt) and self–cleaning surfaces (when it rains, they clean themselves) [16]. In this last case, the mechanism is as follows: On hydrophobic surfaces (with low water sliding angles and high contact angles) spherical water droplets roll and carry away dust and dirt particles [17,18]. Recent works have achieved hydrophobic behavior in 3D parts printed by FDM, using a dip coating method [19].
The aim of this work is to determine the most suitable values for different printing parameters in order to reduce surface roughness and sliding angle in PETG 3D printed parts via FDM. For this purpose, an orthogonal experiment design has been carried out with five5 factors and three levels. The factors are (Figure 2): Layer height (LH), extruder temperature (T), print speed (PS), print acceleration (PA), and flow rate (F).
In FDM 3D printing, the layer height is the distance on a vertical axis between one layer and the next; the extruder temperature is defined as the temperature of the printing nozzle; the printing speed is the space traveled by the nozzle per unit of time during printing; the printing acceleration is the speed gain during printing; the flow rate is the multiplier of the filament output stream according to the part geometry [20].

2. Materials and Methods

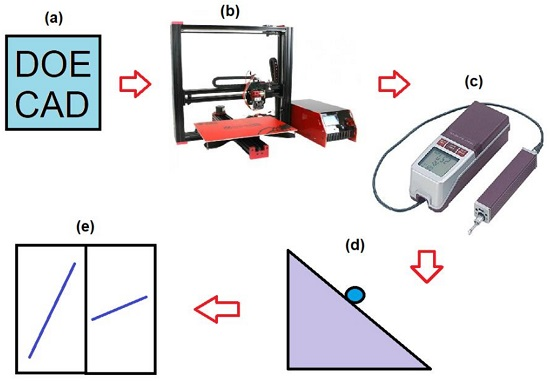
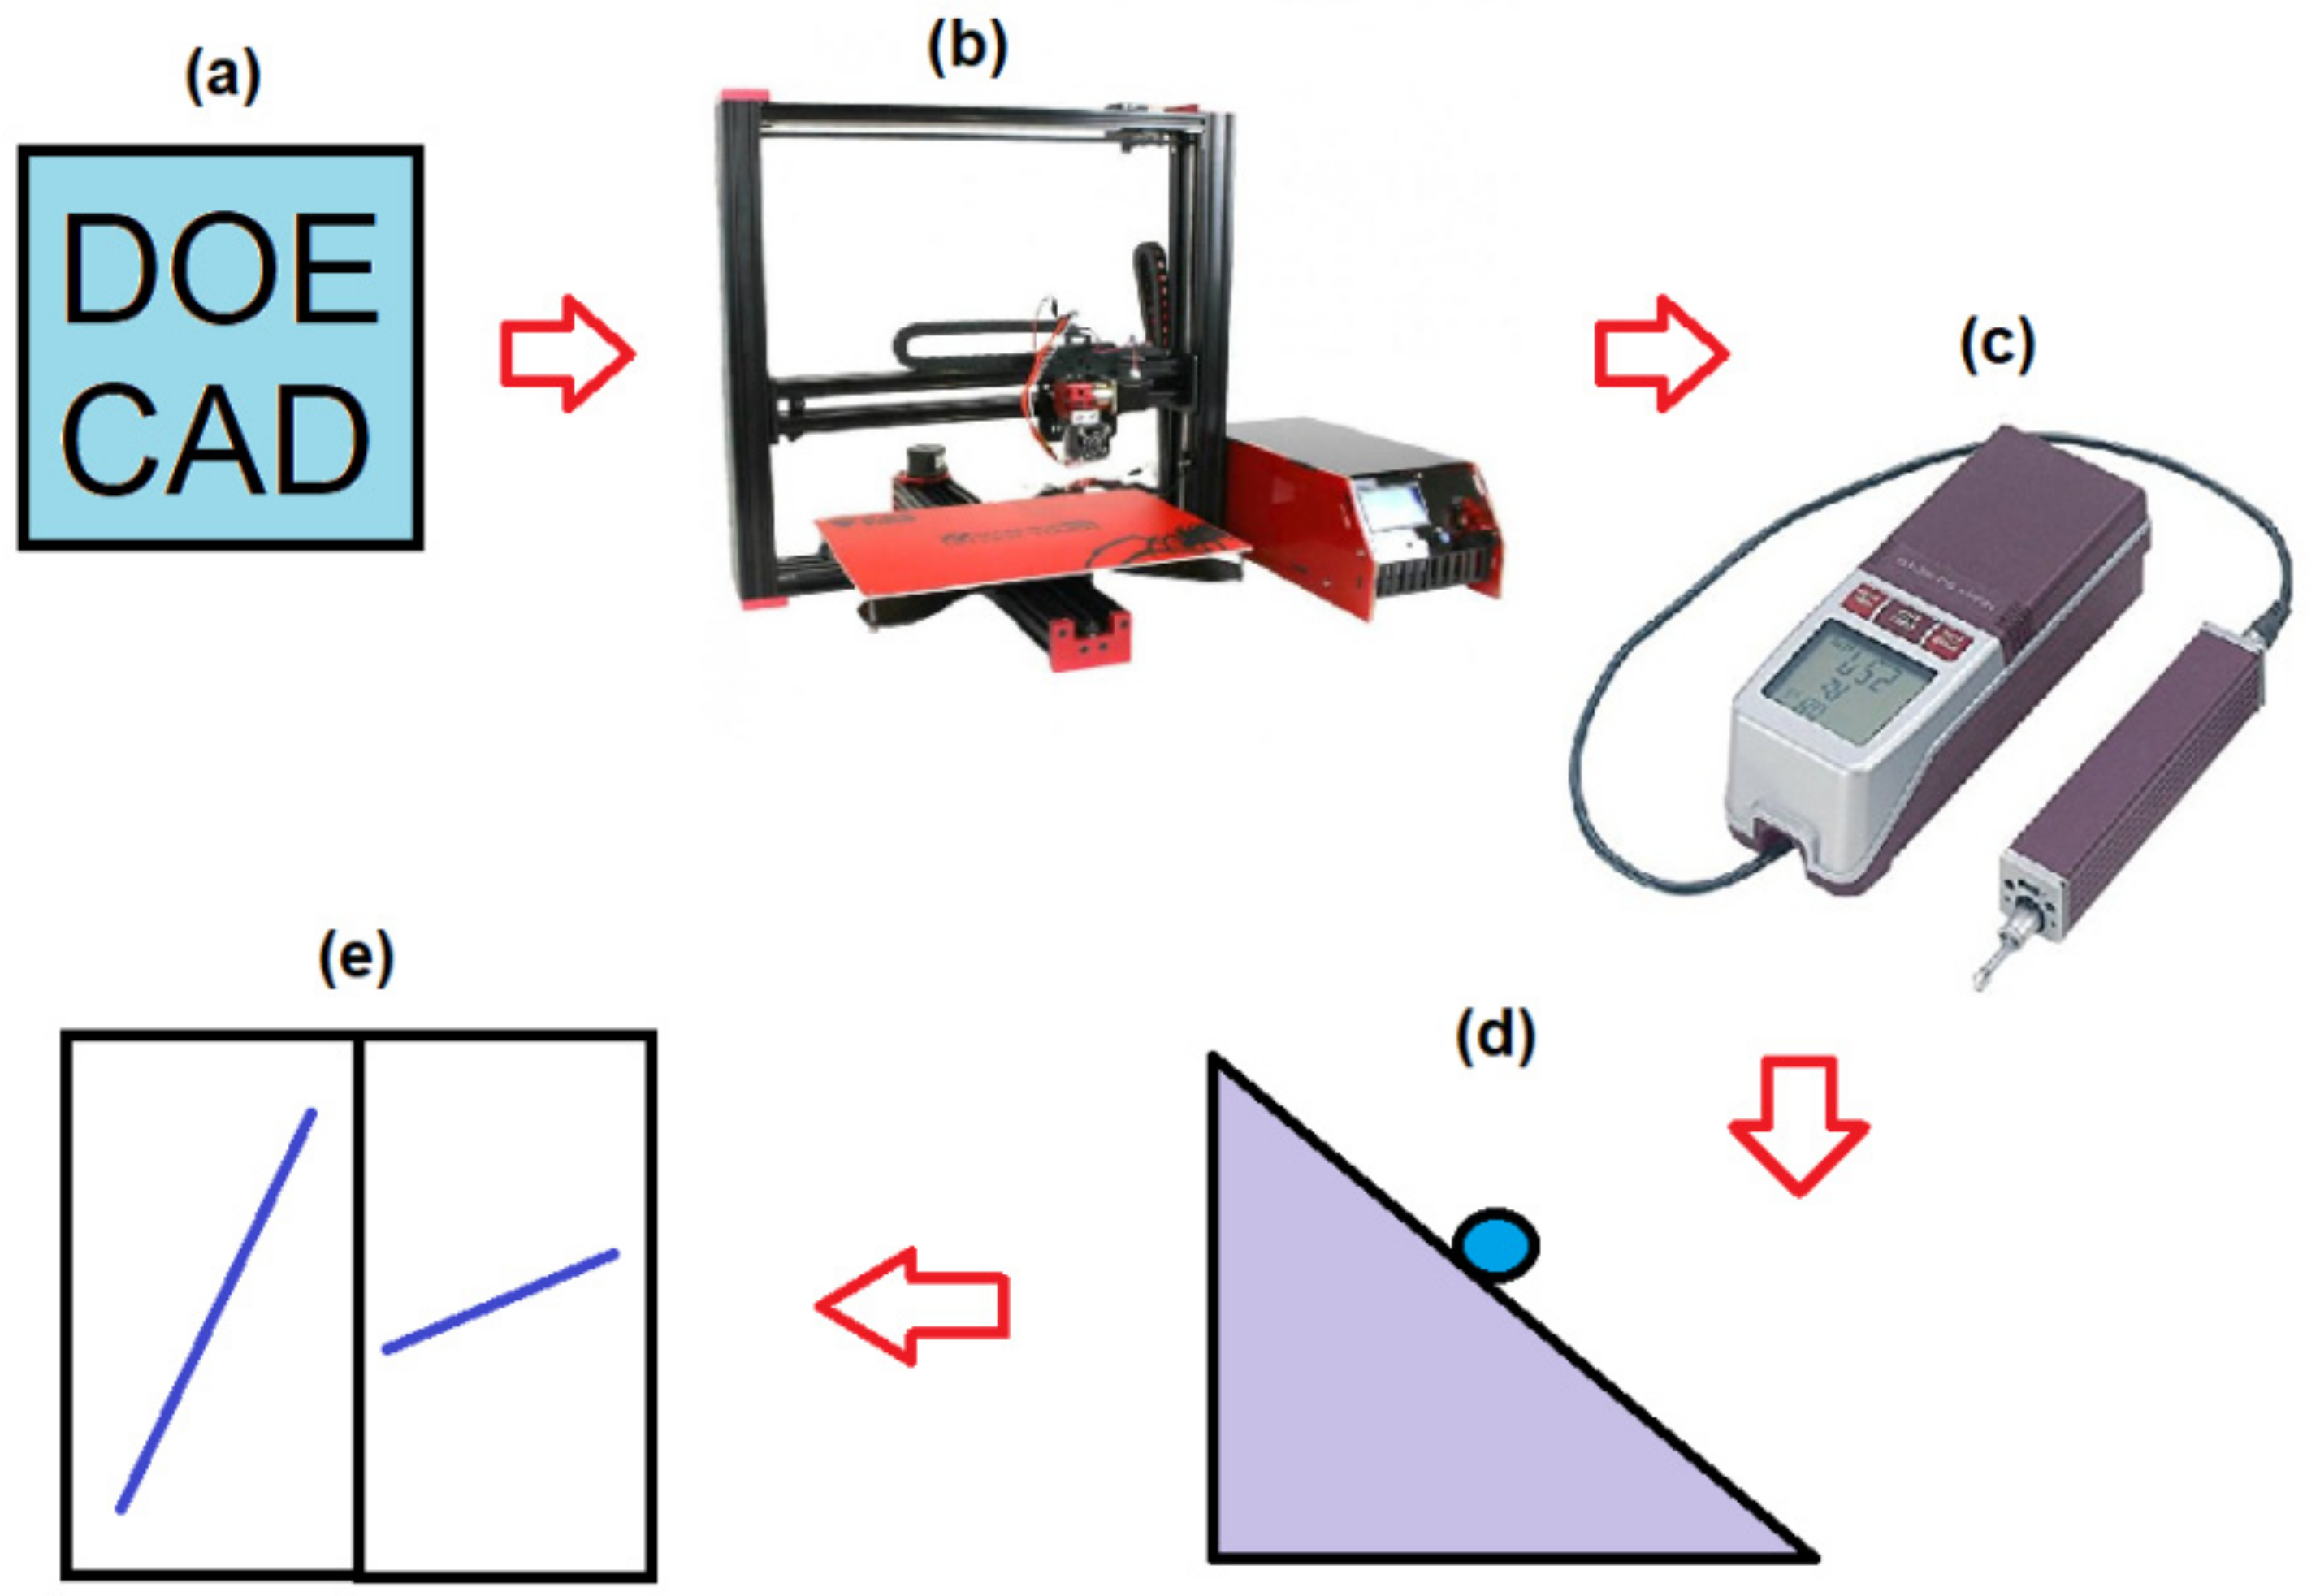
2.1. Design of Experiments and the CAD–CAM Process
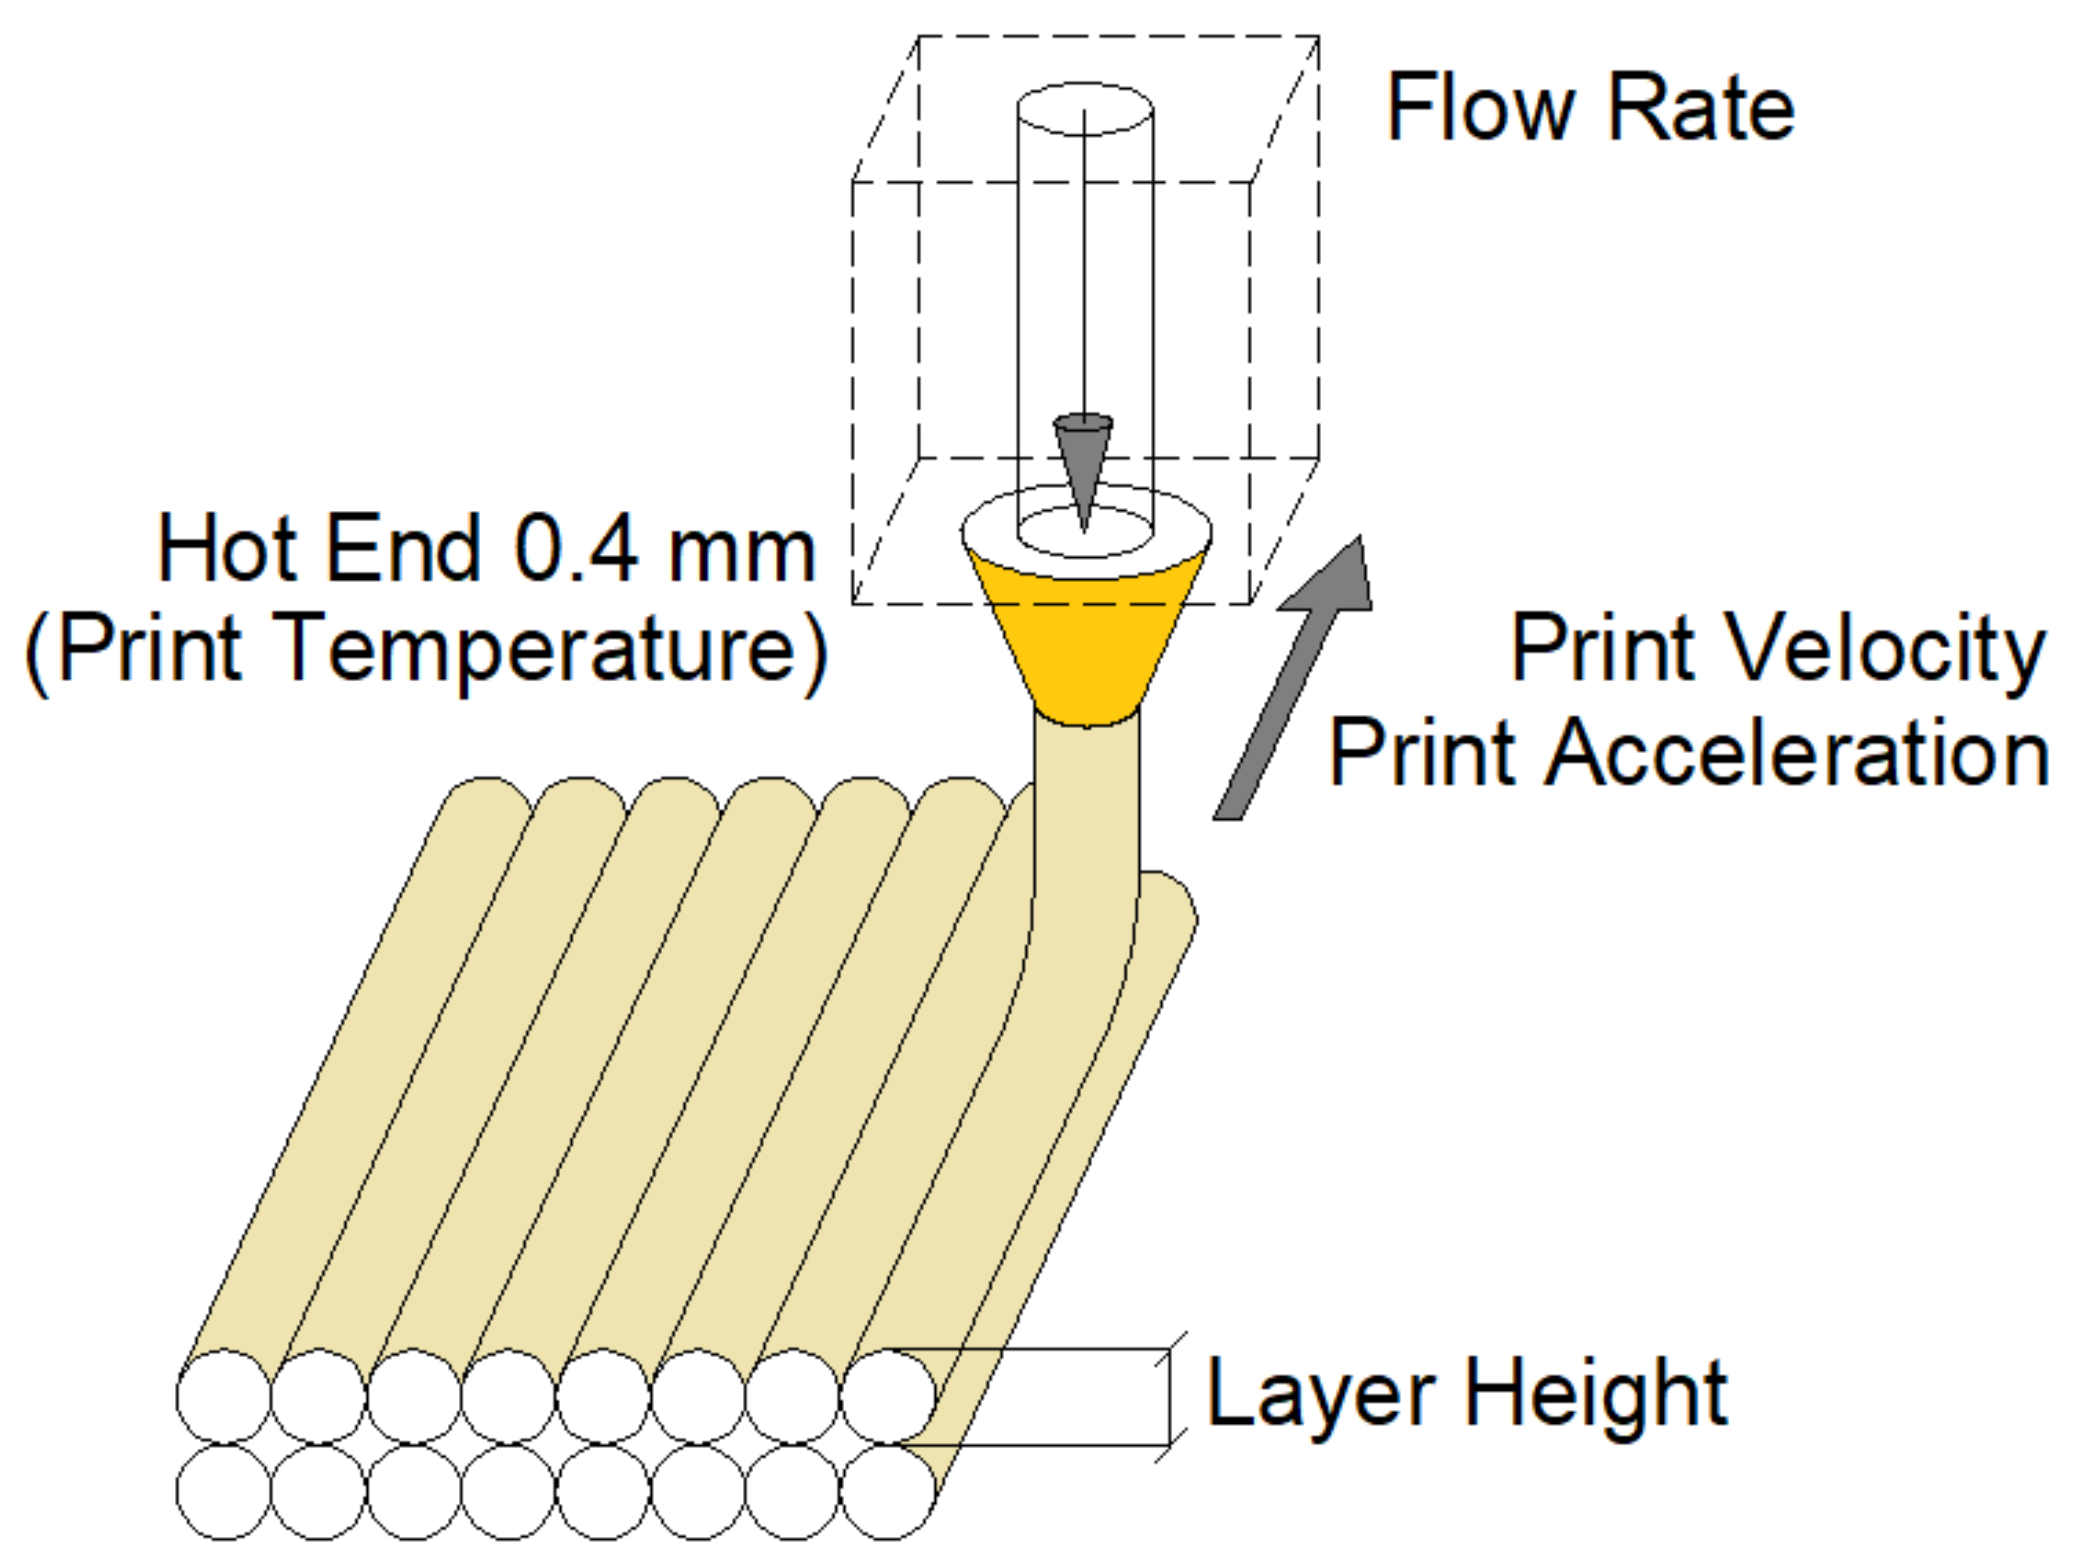
The methodology used in this work is summarized in Figure 3. An orthogonal design of experiments (DOE) was carried out [21]. The parameters studied in this DOE are shown in Table 1. One specimen of each type has been printed using the values presented in Table 2. Specimen design was performed using SolidWorks software. CURA slicing software was used to define the printing parameters planned in the DOE and to generate the numerical control (NC) code [22]. The CURA numerical control (NC) files are available online as Supplementary Materials.

2.2. 3D Printing

The material used in the manufacture of the specimens was PETG filament, provided by the supplier SmartMaterials 3D® (SmartMaterials 3D, Alcalá la Real, Spain) [10]. The diameter of the filament used was 1.75 mm, and it was presented in spools of 750 g.
The printing system used was Tevo Black Widow Tevo Technologies® (Tevo 3D printers, Zhanjiang, China) (Figure 3b). The machine had an extruder head with 0.4 mm diameter nozzle and a positioning accuracy of 0.012 mm in the XY plane (printing surface) and 0.004 mm in its vertical axis (Z axis) [23]. It was controlled by the Arduino Mega 2560 rev3 open source system [24]. A total of 27 specimens, with dimensions 25.0 × 25.0 × 2.4 mm, were printed.
The following printing parameters were set as fixed: The bed temperature was equal to room temperature; the first layer height was equal to 0.25 mm; the selected infill was grid type (rectangular); the infill percentage was equal to 50%. It should be noted that the number of shells depended on the fixed layer height: 15 layers for the layer height was equal to 0.16 mm; 12 layers for layer height was equal to 0.20 mm; 10 layers for layer height was equal to 0.24 mm.

2.3. Surface Roughness Measurements

The surface roughness (Ra) [25] was measured on every printed specimen, using a perthometer MITUTOYO model SJ–210® (Mitutoyo, Kawasaki, Japan) (Figure 3c) and following the standard ISO 4288: 1996 [26]. This parameter was measured 5 times along the 0° direction (Ra,0) and another 5 times along the 90° direction (Ra,90) in each specimen (Figure 4).

2.4. Sliding and Contact Angle Measurements

The sliding angle (SA) was measured by means of a low cost measurement device (Figure 3d), consisting of Arduino Uno® electronics (Arduino, Torino, Italy) [24], a shield computer numerical control CNC circuit, a Nema 17 5 Kgf motor, and a DRV8825 driver. This measurement was made by depositing a drop of 50 microliters of GRIFOLS pure water (Grifols, Barcelona, Spain) on the surface of each specimen. Once deposited, the system rotates with an angular velocity of 10 microradians per second, measuring the minimum angle at which the drop moves with the help of an inclinometer HOLEX® electronic protractor [27]. This inclinometer incorporates a calibration procedure that was performed before taking the measurements. The sliding angle was measured 5 times along the 0° direction (SA0) and another 5 times along the 90° directions (SA90) in each specimen (Figure 4).
The contact angle (CA) has been measured using the Attension Theta Lite device (Biolin Scientific, Gothenburg, Sweden). Drops of 2 microliters of pure GRIFOLS water were used. Each measurement was performed for a time of 100 s. Once the angle was stabilized, an instant was selected and the mean between the contact angles measured by the left and right was calculated. The contact angle was measured 5 times along the 0° direction (CA0) and another 5 times along the 90° directions (CA90) in each specimen (Figure 4).

2.5. Statistical Data Processing
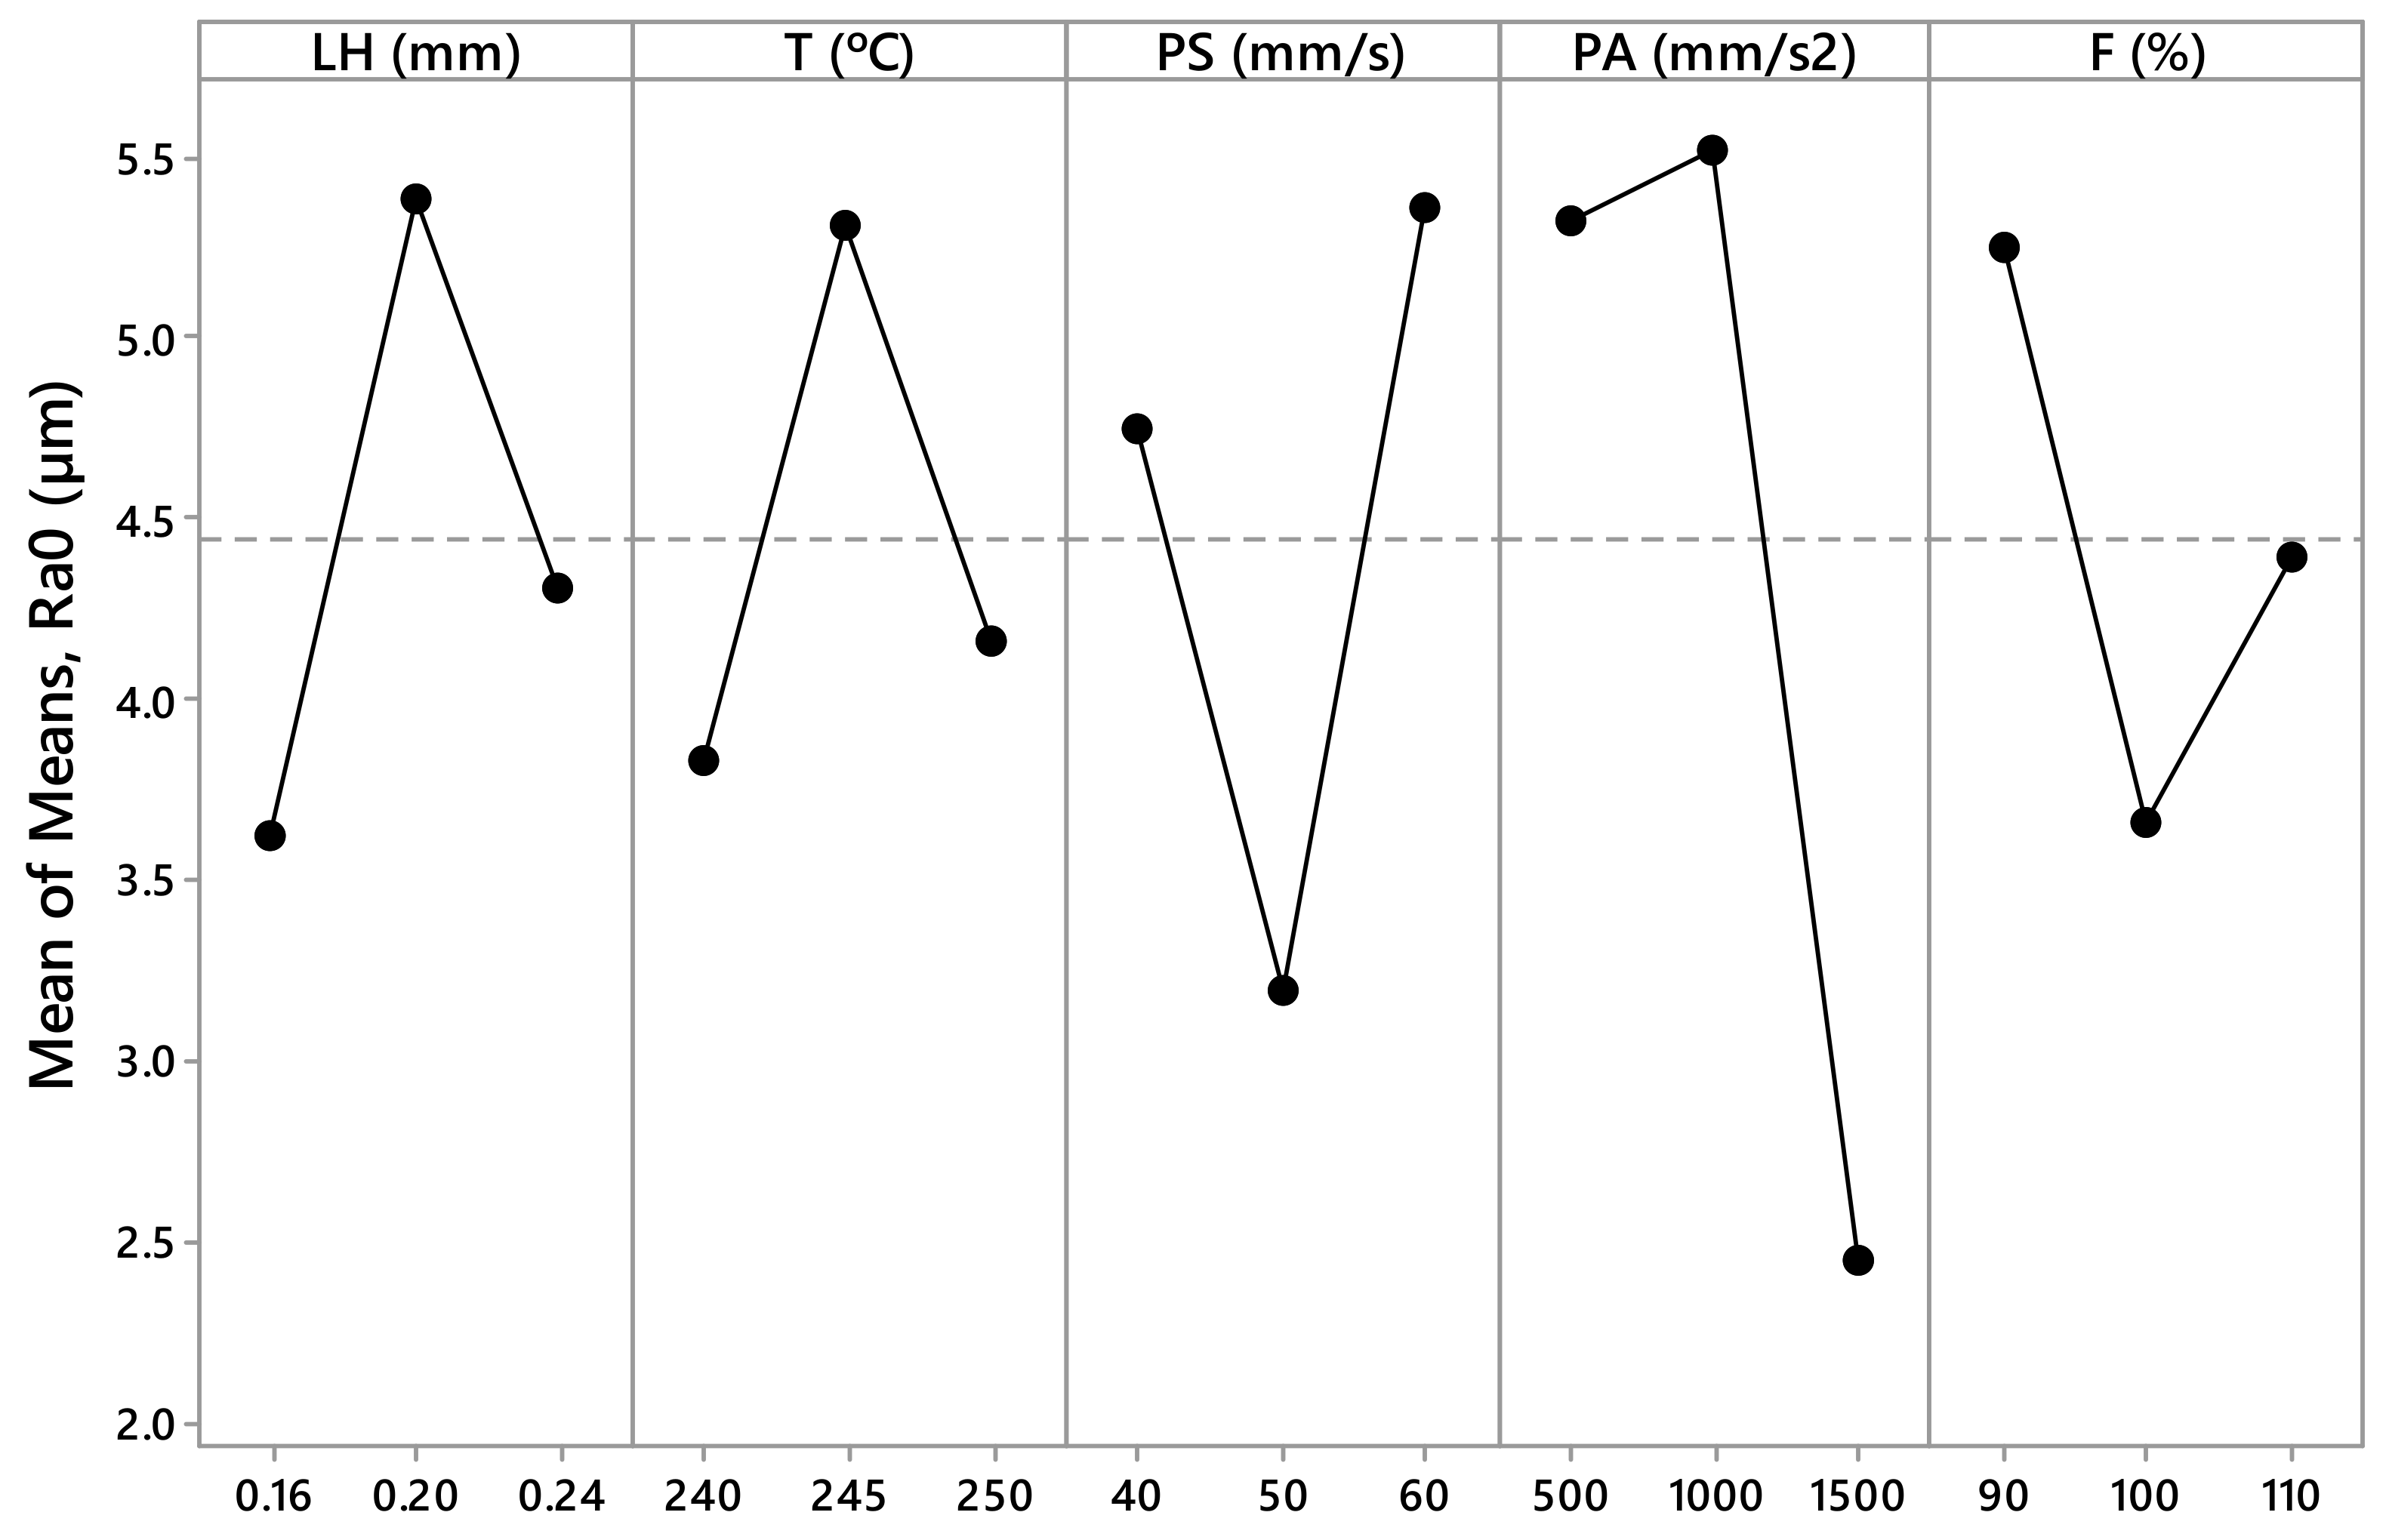
The values of roughness and the sliding angle were analyzed using the Minitab software (Figure 3e). The analysis of the influence of each parameter on Ra,0, Ra,90, SA0, SA90, CA0, and CA90 was carried out according to Taguchi’s method and analysis of variance (ANOVA) [28,29,30,31].

3. Results

The measured values Ra,0, Ra,90, SA0, SA90, CA0, and CA90 are presented in Table 3 and Table 4. These values have been calculated as the arithmetic mean of the different measurements made for each parameter. From this data, Figure 5, Figure 6, Figure 7, Figure 8, Figure 9 and Figure 10 have been elaborated following the Taguchi method [32]. To support these results, an analysis of the variance (ANOVA) has been carried out [32].
Figure 5 shows that the most influential variables in the Ra,0 variation are the printing acceleration (PA). According to the ANOVA (Table 5), the parameter PA has a p–value equal to 0.052 ( ~ 0.05) and a contribution equal to 23%. In relation to the Ra,90 (Figure 6), the most influential parameters are the flow rate (F) and the printing speed (PS). According to ANOVA (Table 6), the parameter F has a p–value equal to 0.001 (less than 0.05) and a contribution equal to 43.74%, and the parameter PS has a p–value equal to 0.023 (less than 0.05) and a contribution equal to 16.81%.
In the case of the sliding angle in the direction parallel to the filament (SA0) (Figure 7), there are several influential parameters. According to the ANOVA (Table 7), the printing acceleration (PA) parameter has a p–value equal to 0.051 ( ~ 0.05) and a contribution of 18.36%; the printing speed (PS) parameter has a p–value equal to 0.076 (less than 0.10) and a contribution of 15.44%; the temperature (T) parameter has a p–value equal to 0.091 (less than 0.10) and a contribution of 14.23%. The most influential parameter in the variable sliding angle in the direction perpendicular to the filament (SA90) is the flow rate (Figure 8). According to the ANOVA (Table 8), F has a p–value equal to 0.012 (less than 0.05) and a contribution equal to 34.67%.
In the case of the contact angle, the PA and F parameters are the most influential factors in the case of CA0 (Figure 9), and the T, PA, and F parameters are the most influential in the case of CA90 (Figure 10). If the ANOVA is consulted, it can be seen how the F parameter has a contribution of 14.47% in CA0 and the PA parameter has a contribution of 10.24% in CA0 (Table 9). In this case, the significance is low, since the p–value is 0.177 and 0.282, respectively. On the other hand, the F parameter has a contribution of 15.10% in CA90, the PA parameter has a contribution of 12.05% in CA90, and the T parameter has a contribution of 12.17% in CA90 (Table 10). However, the significance is low, since the p–value is 0.148, 0.210, and 0.207, respectively.
Specimens 1 and 22 have been examined by a SEM microscope (Figure 11). As can be seen, the images support the results obtained by the experimental methodology. Specimen 1 (PA = 500 mm/s2; F = 90%) has high values of surface roughness (Ra,0 = 10.64 μm; Ra,90 = 12.24 μm) and sliding angle (SA0 = 16.76°; SA90 = 33.08°), and intermediate values of contact angle (CA0 = 68.75° and CA90 = 83.43°); at the other end, specimen 22 (PA = 1500 mm/s2; F = 100%) has low values of roughness (Ra,0 = 3.79 μm; Ra,90 = 8.68 μm) and sliding angle (SA0 = 14.46°; SA90 = 36.52°), and high values of contact angle (CA0 = 73.42° and CA90 = 105.36°). In the literature on self–cleaning surfaces [17,18], there is a preference for surfaces with low roughness (they accumulate less dirt), low sliding angles, and high contact angles (water droplets roll better).
Figure 12 shows the contact angle CA90 for specimen 8 (PA = 1500 mm/s2 and F = 110%) and the contact angle CA0 for specimen 10 (PA = 1500 mm/s2 and F = 100%). Both specimens have reached the highest value for the contact angle in every direction (Table 4).
Finally, a headlight was printed using PETG (Figure 13). This spotlight is similar to the one used by a company from Córdoba (Spain) to manufacture traffic signs with LEDs (Figure 1). In the manufacture of the diffuser, the printing parameters of test 22 have been used (it provides the most balanced values). To reduce dust accumulation (Ra,0 < Ra,90) and achieve a better self-cleaning effect (SA0 < SA90), the diffuser printed in 3D should be mounted with the fused filaments perpendicular to the ground.

4. Discussion

The influence of various printing factors on the surface properties of flat specimens made of PETG by FDM has been studied in this work. For this purpose, the surface roughness, sliding angle, and contact angle were measured in 27 specimens, manufactured according to a fractionated orthogonal arrangement. The results have been analyzed using the Taguchi method and ANOVA.
According to this, the parameters with the highest influence on surface roughness, sliding angle, and contact angle are the printing acceleration (PA) and flow rate (F) (Figure 5, Figure 6, Figure 7, Figure 8, Figure 9 and Figure 10). The contribution of PA to Ra,0 is 23.00% (Table 5), to SA0 is 18.36% (Table 7), and to CA0 is 10.24% (Table 9). When the PA takes the value 1500 mm/s2, the mean values of Ra,0 are lower (Figure 5), the SA0 values are intermediate (Figure 7), and the CA0 values are higher (Figure 9). On the other hand, the contribution of F to Ra,90 is 43.74% (Table 6), to SA90 is 34.67% (Table 8), and to CA90 is 15.10% (Table 10). When F acquires the value of 110%, the mean values of both Ra,90 and SA90 are lower (Figure 6 and Figure 8).
There are not too many papers in the literature studying hydrophobicity of FDM printed parts. Lee et al. [19] have achieved sliding angles equal to 12° and contact angles equal to 150° on specimens printed in PLA using dip coating with silica nanoparticles. Nanoparticles alter the initial characteristics of the printed surface, contributing to the generation of a ‘fakir bed’. On this improved surface, the contact angle is higher (Figure 14a). However, in this work the influence of printing parameters was not studied.
In the present work, PETG FDM printed parts have been analyzed. PETG has a slightly higher contact angle than PLA [33]. In addition, the influence of printing parameters has been studied, without the need for post–processing. Based on the results obtained, low SA values are linked to the generation of rounded filament profiles (Figure 11a and Figure 14b). These profiles are obtained by modifying the road width (which is controlled by the flow rate (F) of material through the nozzle) [34,35]. Other types of profiles offer greater obstacles to the drop, which slides with difficulty (Figure 11b and Figure 14c).
On the other hand, the influence of printing acceleration (PA) on the geometry acquired by the deposited filament has already been studied by other authors [36]. Different acceleration values mean different longitudinal geometry of the deposited material [25]. High acceleration values reduce the transition zones and allow a more homogeneous deposited filament to be obtained (Figure 15).
Finally, it should be indicated that in this work it has been possible to obtain contact angles equal to 107.91° and 86.42° for CA90 and CA0, respectively (Figure 12). These values exceed or are close to the 90° value, established as a limit to qualify a surface as hydrophobic. These values have been achieved for specimen 8 (F = 1500 mm/s2 and F = 110%) and specimen 10 (F = 1500 mm/s2 and F = 100%).

5. Conclusions

FDM 3D printing is increasingly used in the industry. The low cost of FDM printers and the great diversity of filament materials available on the market justify this fact. However, the printing of parts with certain surface characteristics (low surface roughness, low sliding angle, high contact angle) requires a systematic and scientific study.
In the present work, which parameters are more influential to obtain lower values of Ra and SA and higher values of CA in PETG parts manufactured via FDM has been studied. The parameters studied were layer height, print temperature, print speed, print acceleration, and flow rate. A fractionated orthogonal experiment design has been used. The results were analyzed using the Taguchi method and ANOVA.
From the results obtained, it can be stated that the parameters with the greatest influence are the flow rate (F) and the print acceleration (PA). The flow rate is responsible for the fact that the section of the deposited filament is more or less circular. The print acceleration is responsible for the fact that this section is kept more or less uniform along the printing road. Depending on the programmed parameters, the profile and the behavior obtained in every specimen is different in each case.
The results obtained in this work may be of interest to companies that manufacture small batches of products that need to have certain surface characteristics. In this case, the authors have transferred the results obtained to a nearby company that manufactures traffic signs with LEDs. The diffusers of the spotlights that have been manufactured using the appropriate parameters present less surface roughness and sliding angle, and a higher contact angle. These properties make the diffuser more able to perform its function on the road.
In future works, we intend to study whether the combination of an adequate selection of printing parameters and the use of post-processing techniques (dip–coating or similar) can further improve the properties of 3D printed surfaces.

Supplementary Materials

The CURA NC files are available online at https://www.mdpi.com/1996-1944/12/15/2499/s1.

Author Contributions

Conceptualization, P.E.R.; methodology, P.E.R.; software, P.E.R.; validation, J.M.B. and P.E.R.; formal analysis, P.E.R.; investigation, J.M.B.; resources, P.E.R.; data curation, J.M.B.; writing—original draft preparation, J.M.B.; writing—review and editing, P.E.R.; visualization, J.M.B.; supervision, P.E.R.; project administration, P.E.R.; funding acquisition, P.E.R.

Funding

This research was funded by University of Cordoba, via ‘Plan Propio de Investigacion’.

Acknowledgments

The authors would like to thank Smart Materials 3D for the material supplied and Estampaciones Casado (http://estampacionescasado.com/) for sharing information about the process followed in the manufacture of LED traffic sign projectors. We must also thank the laboratory technician Ana Martin Bernal for her help during the work.

Conflicts of Interest

The authors declare no conflict of interest.

References

  1. Mueller, B. Additive manufacturing technologies–Rapid prototyping to direct digital manufacturing. Assem. Autom. 2012, 32. [Google Scholar] [CrossRef]
  2. Ford, S.; Despeisse, M. Additive manufacturing and sustainability: an exploratory study of the advantages and challenges. J. Clean. Prod. 2016, 137, 1573–1587. [Google Scholar] [CrossRef]
  3. Attaran, M. The rise of 3–D printing: The advantages of additive manufacturing over traditional manufacturing. Bus. Horiz. 2017, 1–12. [Google Scholar] [CrossRef]
  4. Lee, J.Y.; An, J.; Chua, C.K. Fundamentals and applications of 3D printing for novel materials. Appl. Mater. Today. 2017, 7, 120–133. [Google Scholar] [CrossRef]
  5. Boparai, K.S.; Singh, R.; Singh, H. Development of rapid tooling using fused deposition modeling: a review. Rapid Prototyp. J. 2016, 22, 281–299. [Google Scholar] [CrossRef]
  6. Hwang, S.; Reyes, E.I.; Moon, K.; Rumpf, R.C.; Kim, N.S. Thermo–mechanical characterization of metal/polymer composite filaments and printing parameter study for fused deposition modeling in the 3D printing process. J. Electron. Mater. 2015, 44, 771–777. [Google Scholar] [CrossRef]
  7. Melocchi, A.; Parietti, F.; Maroni, A.; Foppoli, A.; Gazzaniga, A.; Zema, L. Hot-melt extruded filaments based on pharmaceutical grade polymers for 3D printing by Fused Deposition Modeling. Int. J. Pharm. 2016, 509, 255–263. [Google Scholar] [CrossRef] [PubMed]
  8. Gupta, B.; Revagade, N.; Hilborn, J. Poly (lactic acid) fiber: An overview. Prog.Polym.Sci. 2007, 32, 455–482. [Google Scholar] [CrossRef]
  9. Cantrell, J.T.; Rohde, S.; Damiani, D.; Gurnani, R.; Disandro, L.; Anton, J.; Young, A.; Jerez, A.; Steinbach, D.; Kroese, C.; et al. Experimental characterization of the mechanical properties of 3D Printed ABS and polycarbonate parts. Rapid Prototyp. J. 2017, 23, 811–824. [Google Scholar] [CrossRef]
  10. Smart Materials 3D Home Page. Available online: https://www.smartmaterials3d.com/en/ (accessed on 17 January 2019).
  11. Zaman, U.K.; Boesch, E.; Siadat, A.; Rivette, M.; Baqai, A.A. Impact of fused deposition modeling (FDM) process parameters on strength of built parts using Taguchi’s design of experiments. Int. J. Adv. Manuf. Technol. 2019, 101, 1215–1226. [Google Scholar] [CrossRef]
  12. Li, J.; Wang, Y.; He, J.; Liu, H.; Xiang, G. Rapid Production of Customised Electronic Systems via Multifunctional Additive Manufacturing Technology. In Proceedings of the 2018 IEEE 3rd International Conference on Integrated Circuits and Microsystems, Shanghai, China, 24–26 November 2018; IEEE: Piscataway, NJ, USA, 2018; pp. 298–301. [Google Scholar]
  13. Szykiedans, K.; Credo, W.; Osiński, D. Selected Mechanical Properties of PETG 3D Prints. Procedia Eng. 2017, 177, 455–461. [Google Scholar] [CrossRef]
  14. Klippstein, H.; Diaz de Cerio Sanchez, A.; Hassanin, H.; Zweiri, Y.; Seneviratne, L. Fused Deposition Modeling for Unmanned Aerial Vehicles (UAVs): A Review. Adv. Eng. Mater. 2017, 1700552, 1–17. [Google Scholar] [CrossRef]
  15. Willis, K.D.D.; Brockmeyer, E.; Hudson, S.E.; Poupyrev, I. Printed optics: 3D printing of embedded optical elements for interactive devices. In Proceeding, Proceeding of UIST ’12 Proceedings of the 25th annual ACM symposium on User interface software and technology, Cambridge, MA, USA, 7–10 October 2012; ACM: New York, NY, USA, 2012; pp. 589–598. [Google Scholar]
  16. Midtdal, K.; Petter, B. Self–cleaning glazing products: A state–of–the-art review and future research pathways. Sol. Energy Mater. Sol. Cells 2013, 109, 126–141. [Google Scholar] [CrossRef]
  17. Barthlott, W.; Neinhuis, C. Purity of the sacred lotus, or escape from contamination in biological surfaces. Planta 1997, 202, 1–8. [Google Scholar] [CrossRef]
  18. Parkin, I.P.; Palgrave, R.G. Self–cleaning coatings. J. Mater. Chem. 2005, 15, 1689–1695. [Google Scholar] [CrossRef]
  19. Lee, K.M.; Park, H.; Kim, J.; Chun, D. Fabrication of a superhydrophobic surface using a fused deposition modeling (FDM) 3D printer with poly lactic acid (PLA) filament and dip coating with silica nanoparticles. Appl. Surf. Sci. 2019, 467–468, 979–991. [Google Scholar] [CrossRef]
  20. Chohan, J.S.; Singh, R. Pre and post processing techniques to improve surface characteristics of FDM parts: a state of art review and future applications. Rapid Prototyp. J. 2017, 23. [Google Scholar] [CrossRef]
  21. Roy, R. A Primer on Taguchi Method, 2nd ed.; Society of Manufacturing Engineers (SME): Dearborn, MI, USA, 2010. [Google Scholar]
  22. Ultimaker Cura. Available online: https://ultimaker.com/en/products/ultimaker-cura-software (accessed on 6 July 2019).
  23. Tevo3D. Available online: https://tevo3dprinterstore.com/pages/about-us (accessed on 6 July 2019).
  24. Arduino. Available online: https://store.arduino.cc/arduino-mega-2560-rev3 (accessed on 6 July 2019).
  25. Turner, B.N.; Gold, S.A. A review of melt extrusion additive manufacturing processes: II. Materials, dimensional accuracy, and surface roughness. Rapid Prototyp. J. 2015, 21, 250–261. [Google Scholar] [CrossRef]
  26. Geometrical Product Specifications (GPS)–Surface Texture: Profile Method–Rules and Procedures for the Assessment of Surface Texture; ISO 4288:1996; International Organization for Standardization: Geneva, Switzerland, 1996.
  27. HOLEX Digital Inclinometer. Available online: https://www.hoffmann-group.com/GR/el/pangakis/Metrology/Rules%2C-spirit-levels/Digital-clinometer-HOLEX/p/467564- (accessed on 6 July 2019).
  28. Sood, A.K.; Ohdar, R.K.; Mahapatra, S.S. Improving dimensional accuracy of fused deposition modelling processed part using grey Taguchi method. Mater. Des. 2009, 30, 4243–4252. [Google Scholar] [CrossRef]
  29. Moza, Z.; Kitsakis, K.; Kechagias, J.; Mastorakis, N. Optimizing dimensional accuracy of fused filament fabrication using Taguchi design. In Proceedings of the 14th International Conference on Instrumentation, Measurement, Circuits and Systems (IMCAS-14), Salerno, Italy, 27–29 June 2015; pp. 110–114. [Google Scholar]
  30. Hsu, T.J.; Lai, W.H. Manufacturing parts optimization in the three–dimensional printing process by the Taguchi method. J. Chinese Inst. Eng. 2010, 33, 121–130. [Google Scholar] [CrossRef]
  31. Khan, R.M. Problem Solving and Data Analysis Using Minitab: A Clear and Easy Guide to Six Sigma Methodology, 2nd ed.; John Wiley & Sons Inc.: West Sussex, UK, 2013. [Google Scholar]
  32. Montgomery, D. Design and Analysis of Experiments, 8th ed.; John Wiley & Sons Inc.: Hoboken, NJ, USA, 2012. [Google Scholar]
  33. Bernasconi, R.; Natale, G.; Levi, M.; Tironi, M.; Magagnin, L. Electroless plating of PLA and PETG for 3D printed flexible substrates. ECS Trans. 2015, 66, 23–35. [Google Scholar] [CrossRef]
  34. Ahn, S.; Montero, M.; Odel, D.; Roundy, S.; Wright, P.K. Anisotropic material properties of fused deposition modeling ABS. Rapid Prototyp. J. 2002, 8, 248–257. [Google Scholar] [CrossRef] [Green Version]
  35. Hebda, M.; McIlroy, C.; Whiteside, B.; Canton-Rose, F.; Coates, P. A method for predicting geometric characteristics of polymer deposition during fused–filament-fabrication. Addit. Manuf. 2019, 27, 99–108. [Google Scholar] [CrossRef]
  36. Di Angelo, L.; Di Stefano, P.; Marzola, A. Surface quality prediction in FDM additive manufacturing. Int. J. Adv. Manuf. Technol. 2017, 93, 3655–3662. [Google Scholar] [CrossRef]
Figure 1. 3D printed LED spotlights for road signals.
Materials 12 02499 g001
Figure 2. Fused deposition modeling (FDM) 3D printer parameters studied in the work.
Materials 12 02499 g002
Figure 3. Graphical description of the methodology followed in the work: (a) Design of experiments and computer-aided design and computer-aided manufacturing CAD-CAM stage, (b) D printing of specimens, (c) surface roughness measurements, (d) sliding and contact angle measurements, (e) statistical data processing.
Materials 12 02499 g003
Figure 4. Graphical explanation of the orientations in which the measurements have been carried out.
Materials 12 02499 g004
Figure 5. Results obtained via the Taguchi method for Ra,0: Layer height (LH), printing temperature (T), printing speed (PS), printing acceleration (PA), and flow rate (F).
Materials 12 02499 g005
Figure 6. Results obtained via the Taguchi method for Ra 90: Layer height (LH), printing temperature (T), printing speed (PS), printing acceleration (PA), and flow rate (F).
Materials 12 02499 g006
Figure 7. Results obtained via the Taguchi method for SA0 (°): Layer height (LH), printing temperature (T), printing speed (PS), printing acceleration (PA), and flow rate (F).
Materials 12 02499 g007
Figure 8. Results obtained via the Taguchi method for SA90 (°): Layer height (LH), printing temperature (T), printing speed (PS), printing acceleration (PA), and flow rate (F).
Materials 12 02499 g008
Figure 9. Results obtained via the Taguchi method for CA0 (°): Layer height (LH), printing temperature (T), printing speed (PS), printing acceleration (PA), and flow rate (F).
Materials 12 02499 g009
Figure 10. Results obtained via the Taguchi method for CA90 (°): Layer height (LH), printing temperature (T), printing speed (PS), printing acceleration (PA), and flow rate (F).
Materials 12 02499 g010
Figure 11. Micrographs obtained via SEM (× 37): (a) Specimen 22, (b) specimen 1.
Materials 12 02499 g011
Figure 12. (a) Specimen 8: Contact angle measured in direction perpendicular to extrusion direction (CA90), (b) specimen 10: Contact angle measured in direction parallel to extrusion direction (CA0).
Materials 12 02499 g012
Figure 13. Headlight printed in polyethylene terephthalate glycol (PETG) for traffic sign.
Materials 12 02499 g013
Figure 14. Drop sliding over different profiles: (a) Profile obtained by Lee et al. [19] by dip-coating in a solution with nanoparticles, (b) profile obtained through an appropriate selection of PA and F (specimen 22), (c) profile obtained through an inappropriate selection of PA and F (specimen 1).
Materials 12 02499 g014
Figure 15. Road dimensional errors at start, acceleration, deceleration, and stopping of a print head (elaborated from [25]).
Materials 12 02499 g015
Table 1. Factors and levels used in design of experiments (DOE).
Printing ParameterLevel 1Level 2Level 3
Layer height (LH), mm0.160.200.24
Temperature (T), °C240245250
Printing speed (PS), mm/s405060
Printing acceleration (PA), mm/s250010001500
Flow rate (F), %90100110
Table 2. Design of experiment (L27), according to the Taguchi method: Layer height (LH), printing temperature (T), printing speed (PS), printing acceleration (PA), and flow rate (F).
No.LH
(mm)
T
(°C)
PS
(mm/s)
PA
(mm/s2)
F
(%)
No.LH
(mm)
T
(°C)
PS
(mm/s)
PA
(mm/s2)
F
(%)
10.162404050090140.2024560500100
20.1624040500100150.2024560500110
30.1624040500110160.20250401000110
40.16245501000110170.2025040100090
50.1624550100090180.20250401000100
60.16245501000100190.24240601000110
70.16250601500100200.2424060100090
80.16250601500110210.24240601000100
90.1625060150090220.24245401500100
100.20240501500100230.24245401500110
110.20240501500110240.2424540150090
120.2024050150090250.242505050090
130.202456050090260.2425050500100
270.2425050500110
Table 3. Results for surface roughness (Ra,0, Ra,90).
TestRa,0 (µm)Ra,90 (µm)
MeanStd. Dev.MeanStd. Dev.
110.642.2212.241.24
20.910.166.460.69
31.120.219.161.55
42.420.9632.990.28
51.800.775.501.12
68.811.9110.921.08
74.551.9623.653.27
81.370.5614.451.84
90.950.175.410.32
101.460.3223.471.96
111.660.549.050.78
121.550.4810.070.75
136.251.5420.082.65
147.781.8315.364.79
1510.170.7512.562.00
169.740.8510.181.11
174.690.955.461.39
185.110.305.331.57
194.271.0710.661.99
206.992.318.210.53
215.860.596.051.28
223.790.668.680.48
233.050.495.720.57
243.701.286.800.39
254.120.7319.652.16
264.681.078.960.59
272.250.147.120.47
Table 4. Results for sliding angle (SA0, SA90) and contact angle (CA0, CA90).
TestSA0 (°)SA90 (°)CA0 (°)CA90 (°)
MeanStd. Dev.MeanStd. Dev.MeanStd. Dev.MeanStd. Dev.
116.762.0533.082.9768.755.5283.4311.18
29.400.9326.312.7550.847.6481.039.32
314.181.6018.123.3957.914.7885.713.57
411.241.6941.934.5280.333.49100.422.81
515.562.5018.202.1930.660.8052.037.72
616.284.1329.914.5578.651.4085.957.98
712.680.7539.902.8877.243.22107.686.54
814.640.8335.882.0968.245.60107.912.10
914.683.2830.324.0770.562.5396.016.52
1013.001.2944.322.6386.424.28101.5010.38
1111.742.2127.383.3466.251.7371.166.11
1213.080.9437.941.4185.334.4391.292.97
1315.922.0246.803.9470.291.3498.026.00
148.330.9231.404.4166.704.9191.292.96
1516.571.0926.960.8638.2511.7337.597.12
1620.293.8727.104.8267.3910.2385.155.38
1720.083.0324.725.7672.523.9487.041.78
1820.242.5522.382.4964.441.9273.091.81
1910.660.8234.281.3742.293.4462.534.93
2012.364.2739.603.6965.926.0979.864.67
2111.643.0527.562.2366.6713.2074.612.90
2214.462.1036.526.4173.423.53105.369.58
2312.723.4519.321.7453.397.7764.834.55
249.021.2133.254.6556.035.4779.603.20
257.461.0236.963.0575.718.4795.773.50
2614.723.8432.082.1456.463.9989.781.87
2712.152.2725.763.7562.434.6388.893.76
Table 5. Results of ANOVA for Ra,0.
SourceDegree of FreedomSequential Sums of SquaresContribution (%)Adjusted Mean SquaresF–Valuep–Value
LH (mm)214.186.147.0900.950.406
T (°C)210.834.695.4150.730.498
PS (mm/s)222.369.6811.1821.500.252
PA (mm/s2)253.1423.0026.5693.570.052
F (%)211.424.945.7080.770.481
Error16119.0651.547.441
Total26230.99100.00
Table 6. Results of ANOVA for Ra,90.
SourceDegree of FreedomSequential Sums of SquaresContribution (%)Adjusted Mean SquaresF–Valuep–Value
LH (mm)291.947.4445.9722.120.152
T (°C)233.422.7016.7090.770.479
PS (mm/s)2207.8916.81103.9474.800.023
PA (mm/s2)215.821.287.9120.370.700
F (%)2540.9043.74270.45112.480.001
Error16346.6028.0321.662
Total261236.58100.00
Table 7. Results of ANOVA for SA0.
SourceDegree of FreedomSequential Sums of SquaresContribution (%)Adjusted Mean SquaresF–Valuep–Value
LH (mm)237.14110.9018.5702.140.150
T (°C)248.50214.2324.2512.800.091
PS (mm/s)252.62415.4426.3123.040.076
PA (mm/s2)262.56618.3631.2833.610.051
F (%)21.2180.360.6090.070.932
Error16138.67540.708.667
Total26340.727100.00
Table 8. Results of ANOVA for SA90.
SourceDegree of FreedomSequential Sums of SquaresContribution (%)Adjusted Mean SquaresF–Valuep–Value
LH (mm)215.830.757.9130.130.880
T (°C)233.411.5816.7040.270.765
PS (mm/s)2205.879.76102.9341.680.218
PA (mm/s2)2142.756.7771.3761.160.337
F (%)2731.3834.67365.6895.970.012
Error16980.4946.4761.280
Total262109.72100.00
Table 9. Results of ANOVA for CA0.
SourceDegree of FreedomSequential Sums of SquaresContribution (%)Adjusted Mean SquaresF–Valuep–Value
LH (mm)2237.05.00118.50.670.526
T (°C)2257.65.43128.80.730.499
PS (mm/s)2239.35.05119.60.680.523
PA (mm/s2)2485.510.24242.71.370.282
F (%)2685.614.47342.81.940.177
Error162834.359.81177.1
Total264739.1100.00
Table 10. Results of ANOVA for CA90.
SourceDegree of FreedomSequential Sums of SquaresContribution (%)Adjusted Mean SquaresF–Valuep–Value
LH (mm)2281.433.88140.710.550.585
T (°C)2881.6212.17440.811.740.207
PS (mm/s)257.590.7928.790.110.893
PA (mm/s2)2873.2312.05436.611.720.210
F (%)21093.4915.10546.742.160.148
Error164056.6256.00253.54
Total267243.97100.00

