Influence of Na2O Content and Ms (SiO2/Na2O) of Alkaline Activator on Workability and Setting of Alkali-Activated Slag Paste


Abstract
1. Introduction
2. Materials and Method
2.1. Materials and Alkaline Activator
2.2. Mixture Design
2.3. Test Method
2.3.1. Calorimetric Measurement
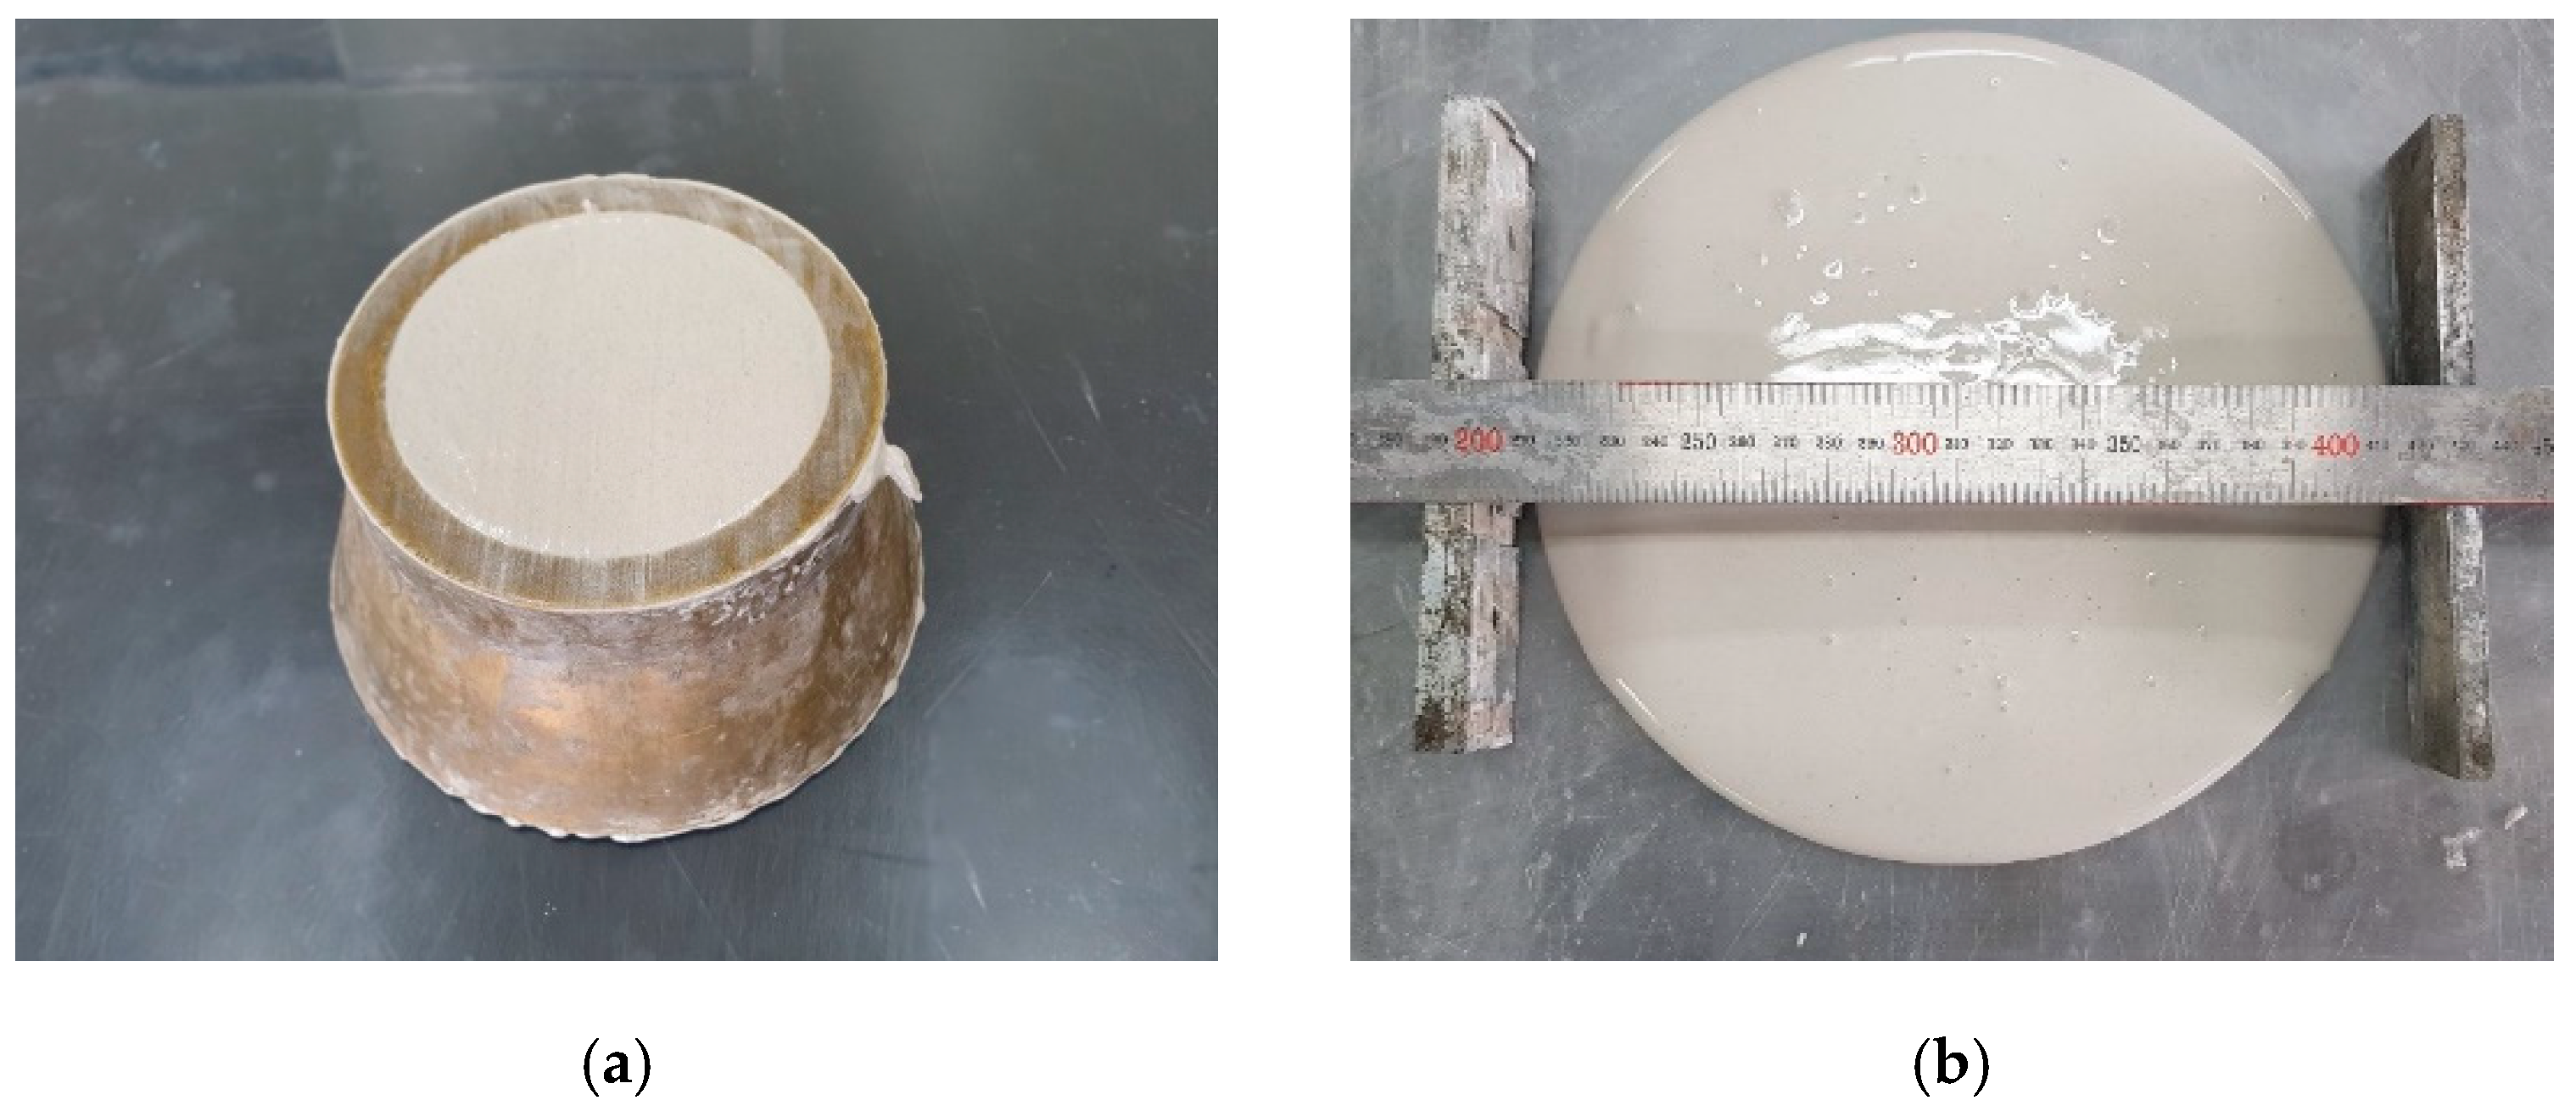
2.3.2. Workability
2.3.3. Setting Time
2.3.4. Rheology and Ultrasonic Pulse Velocity (UPV)
2.3.5. Compressive Strength
3. Results and Discussion
3.1. Heat Release of Pastes
3.2. Workability
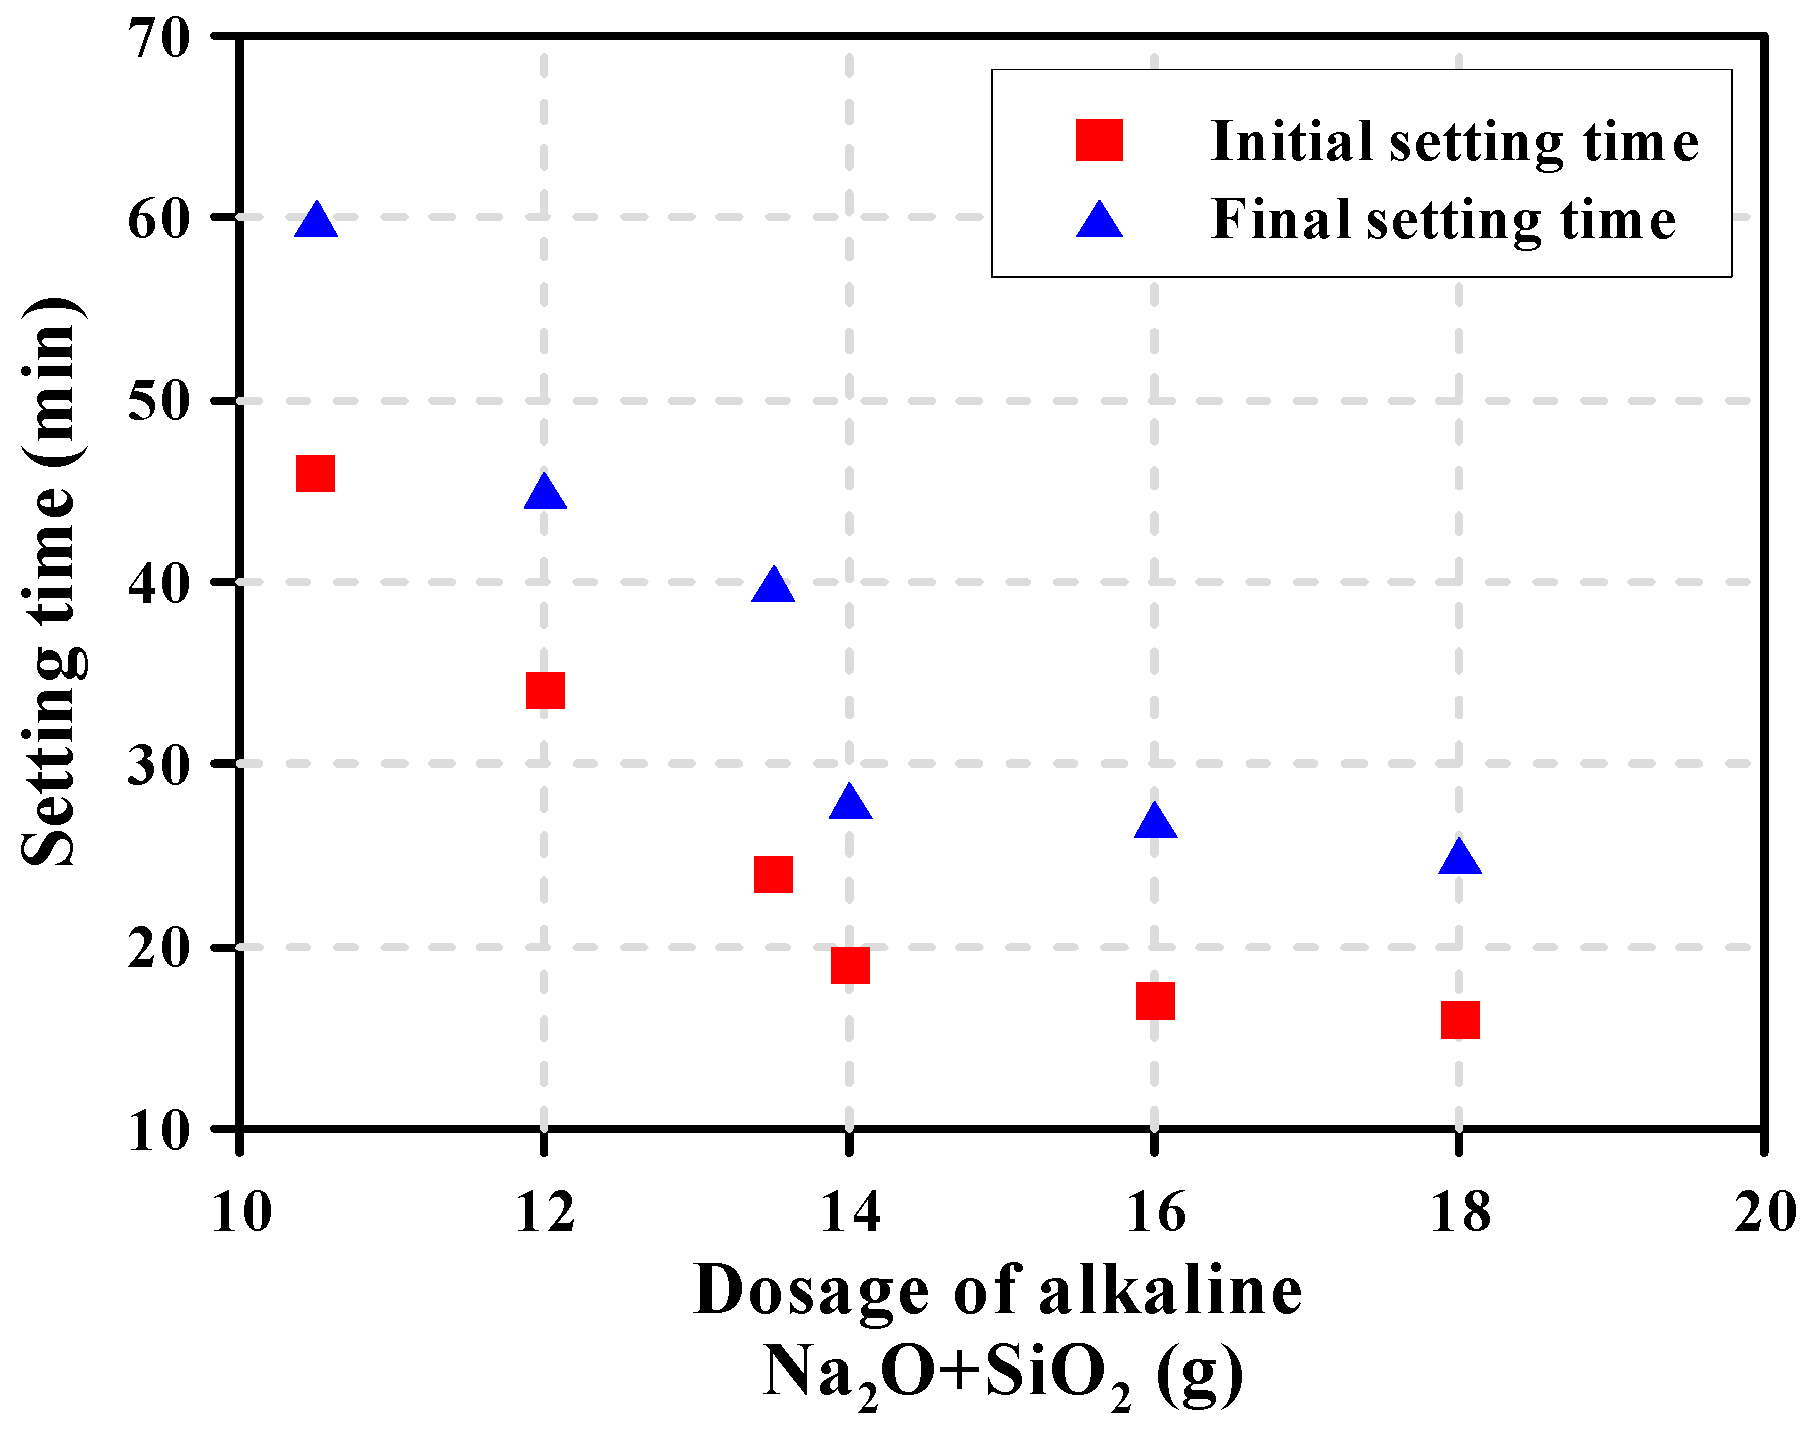
3.3. Setting Time
3.4. Viscosity Measurement Limit and Ultrasonic Pulse Velocity
3.5. Compressive Strength
4. Conclusions
- The Na2O content and Ms strongly affected the rate of heat release, workability, and setting time of alkali-activated pastes. In particular, when alkaline activators with Na2O content of ≥6% (Ms = 0.75–1.25) were used, the activation and reaction of the GGBFS were enhanced because of the effects of high dosage of alkaline (Na2O + SiO2), which resulted in workability rapidly decreasing and setting quickly occurring. However, the Na2O content and Ms did not significantly affect the compressive strength development of the AAS mortars when the Na2O content increased from 6% to 8%. On the other hand, for the pastes with Na2O content = 4%, the rate of heat release was quite low for the initial 24 h and setting was delayed up to 4 h and 40 min, and even the workability was maintained for more than 1 h.
- In AAS pastes with high Na2O content, setting occurred within a few minutes after flowability was lost, and thus, it was not easy to measure the flowability with the existing mini slump test. However, since the changes in viscosity of the paste can be continuously monitored over time using the rheology/UPV test, the measurement of VML and UPV could allow the quantitative assessment of the time at which flowability was lost and consequently, to predict the initial setting time of the paste.
- For the production of AAS concrete with high early strength of 25 MPa at 24 h, it is suggested from the test results that the Na2O content and Ms of the alkaline activator should be as much as 6% and 1.0, respectively. However, to secure the workability of AAS paste, chemical admixtures such as superplasticizers should be used to adequately control the workability and setting in highly alkaline environments.
Author Contributions
Funding
Conflicts of Interest
References
- Provis, J.L. Alkali-activated materials. Cem. Concr. Res. 2018, 114, 40–48. [Google Scholar] [CrossRef]
- Provis, J.L.; Palomo, A.; Shi, C. Advances in understanding alkali-activated materials. Cem. Concr. Res. 2015, 78, 110–125. [Google Scholar] [CrossRef]
- Shi, C. Early microstructure development of activated lime-fly ash pastes. Cem. Concr. Res. 1996, 26, 1351–1359. [Google Scholar] [CrossRef]
- Poon, C.S.; Kou, S.C.; Lam, L.; Lin, Z.S. Activation of fly ash/cement systems using calcium sulfate anhydrite (CaSO4). Cem. Concr. Res. 2001, 31, 873–881. [Google Scholar] [CrossRef]
- Bellum, R.R.; Nerella, R.; Madduru, S.R.C.; Indukuri, C.S.R. Mix Design and Mechanical Properties of Fly Ash and GGBFS-Synthesized Alkali-Activated Concrete (AAC). Infrastructures 2019, 4, 20. [Google Scholar] [CrossRef]
- Li, C.; Sun, H.; Li, M.L. A Review: The Composition mbetween Alkali -Activated Slag m(Si + Ca) and Metakaolin(Si + Al) Cements. Cem. Concr. Res. 2010, 40, 341–1349. [Google Scholar] [CrossRef]
- Shi, C.; Roy, D.; Krivenko, P. Alkali-Activated Cements and Concretes; CRC Press: Boca Raton, FL, USA, 2003. [Google Scholar]
- Pacheco, T.F.; Castro, G.J.; Jalali, S. Alkali-activated binders: A review: Part 1. Historical background, terminology, reaction mechanisms and hydration products. Constr. Build. Mater. 2008, 22, 1305–1314. [Google Scholar] [CrossRef]
- Pacheco, T.F.; Castro, G.J.; Jalali, S. Alkali-activated binders: A review. Part 2. About materials and binders manufacture. Constr. Build. Mater. 2008, 22, 1315–1322. [Google Scholar] [CrossRef]
- Mangat, P.S.; Ojedokun, O.O. Influence of curing on pore properties and strength of alkali activated mortars. Constr. Build. Mater. 2018, 188, 337–348. [Google Scholar] [CrossRef]
- Haha, M.B.; Le Saout, G.; Winnefeld, F.; Lothenbach, B. Influence of activator type on hydration kinetics, hydrate assemblage and microstructural development of alkali activated blast-furnace slags. Cem. Concr. Res. 2011, 41, 301–310. [Google Scholar] [CrossRef]
- Chang, J.J. A study on the setting characteristics of sodium silicate-activated slag pastes. Cem. Concr. Res. 2003, 33, 1005–1011. [Google Scholar] [CrossRef]
- Zuo, Y.; Nedeljković, M.; Ye, G. Coupled thermodynamic modelling and experimental study of sodium hydroxide activated slag. Constr. Build. Mater. 2008, 188, 262–279. [Google Scholar] [CrossRef]
- Krizan, D.; Zivanovic, B. Effects of dosage and modulus of water glass on early hydration of alkali-slag cements. Cem. Concr. Res. 2002, 32, 1181–1188. [Google Scholar] [CrossRef]
- Collins, F.G.; Sanjayan, J.G. Workability and mechanical properties of alkali activated slag concrete. Cem. Concr. Res. 1999, 29, 455–458. [Google Scholar] [CrossRef]
- Bakharev, T.; Sanjayan, J.G.; Cheng, Y.B. Sulfate attack on alkali-activated slag concrete. Cem. Concr. Res. 2002, 32, 211–216. [Google Scholar] [CrossRef]
- Neto, A.A.M.; Cincotto, M.A.; Repette, W. Drying and autogenous shrinkage of pastes and mortars with activated slag cement. Cem. Concr. Res. 2008, 38, 565–574. [Google Scholar] [CrossRef]
- Bakharev, T.; Sanjayan, J.G.; Cheng, Y.B. Effect of admixtures on properties of alkali-activated slag concrete. Cem. Concr. Res. 2000, 30, 1367–1374. [Google Scholar] [CrossRef]
- Nedeljković, M.; Li, Z.; Ye, G. Setting, strength, and autogenous shrinkage of alkali-activated fly ash and slag pastes: Effect of slag content. Materials 2018, 11, 2121. [Google Scholar] [CrossRef]
- Wan, H.; Shui, Z.; Lin, Z. Analysis of geometric characteristics of GGBS particles and their influences on cement properties. Cem. Concr. Res. 2004, 34, 133–137. [Google Scholar] [CrossRef]
- Wang, P.; Trettin, R.; Rudert, V. Effect of fineness and particle size distribution of granulated blast-furnace slag on the hydraulic reactivity in cement systems. Adv. Cem. Res. 2005, 17, 161–167. [Google Scholar] [CrossRef]
- ASTM C128-15. Standard Test Method for Relative Density (Specific Gravity) and Absorption of Fine Aggregate; ASTM International: West Conshohocken, PA, USA, 2015. [Google Scholar]
- ASTM C33-13. Specification for Concrete Aggregates; ASTM International: West Conshohocken, PA, USA, 2013. [Google Scholar]
- ASTM, C1437-15. Standard Test Method for Flow of Hydraulic Cement Mortar; ASTM International: West Conshohocken, PA, USA, 2015. [Google Scholar]
- ASTM, C191-18a. Standard Test Methods for Time of Setting Hydraulic Cement by Vicat Needle; ASTM International: West Conshohocken, PA, USA, 2018. [Google Scholar]
- ASTM C109-16a. Standard Test Method for Compressive Strength of Hydraulic Cement Mortars (Using 2-in. or [50-mm] Cube Specimens); ASTM International: West Conshohocken, PA, USA, 2016. [Google Scholar]
- Shi, C.; Day, R.L. A calorimetric study of early hydration of alkali-slag cements. Cem. Concr. Res. 1995, 25, 1333–1346. [Google Scholar] [CrossRef]
- Ravikumar, D.; Neithalath, N. Reaction kinetics in sodium silicate powder and liquid activated slag binders evaluated using isothermal calorimetry. Thermochim. Acta 2012, 546, 32–43. [Google Scholar] [CrossRef]
- Puertas, F.; Varga, C.; Alonso, M.M. Rheology of alkali-activated slag pastes. Effect of the nature and concentration of the activating solution. Cem. Concr. Compos. 2014, 53, 279–288. [Google Scholar] [CrossRef]
- Huanhai, Z.; Xuequan, W.; Zhongzi, X.; Mingshu, T. Kinetic study on hydration of alkali-activated slag. Cem. Concr. Res. 1993, 23, 1253–1258. [Google Scholar] [CrossRef]
- Altan, E.; Erdoğan, S.T. Alkali activation of a slag at ambient and elevated temperatures. Cement and Concrete Composites. Cem. Concr. Compos. 2012, 34, 131–139. [Google Scholar] [CrossRef]
- Wei, S.; Yunsheng, Z.; Jones, M.R. Using the ultrasonic wave transmission method to study the setting behavior of foamed concrete. Constr. Build. Mater. 2014, 51, 62–74. [Google Scholar] [CrossRef]
- Zhang, S.; Zhang, Y.; Li, Z. Ultrasonic monitoring of setting and hardening of slag blended cement under different curing temperatures by using embedded piezoelectric transducers. Constr. Build. Mater. 2018, 159, 553–560. [Google Scholar] [CrossRef]
- Lee, H.K.; Lee, K.M.; Kim, Y.H.; Yim, H.; Bae, D.B. Ultrasonic in-situ monitoring of setting process of high-performance concrete. Cem. Concr. Res. 2004, 34, 631–640. [Google Scholar] [CrossRef]


| Type | CaO | SiO2 | Al2O3 | MgO | SO3 | TiO2 | K2O | MnO | Fe2O3 |
|---|---|---|---|---|---|---|---|---|---|
| GGBFS | 44.0 | 33.7 | 13.8 | 5.2 | 1.2 | 0.7 | 0.5 | 0.2 | 0.1 |
| Type | Density (g/cm3) | Blaine (cm2/g) | Particle Size Distribution (μm) | |||
|---|---|---|---|---|---|---|
| Mean | d10 | d50 | d90 | |||
| GGBFS | 2.90 | 4253 | 14.2 | 1.4 | 10.2 | 33.2 |
| Mixture | Na2O | SiO2 | Alkaline (Na2O + SiO2) | Ms (SiO2/Na2O) | Alkali Activator | l/b | |
|---|---|---|---|---|---|---|---|
| NaOH | Na2SiO3 | ||||||
| 4-0.75 | 4.0 | 3.0 | 7.0 | 0.75 | 3.89 | 10.60 | 0.42 |
| 4-1.00 | 4.0 | 4.0 | 8.0 | 1.00 | 3.47 | 14.13 | |
| 4-1.25 | 4.0 | 5.0 | 9.0 | 1.25 | 3.04 | 17.67 | |
| 6-0.75 | 6.0 | 4.5 | 10.5 | 0.75 | 5.83 | 15.90 | |
| 6-1.00 | 6.0 | 6.0 | 12.0 | 1.00 | 5.20 | 21.20 | |
| 6-1.25 | 6.0 | 7.5 | 13.5 | 1.25 | 4.56 | 26.50 | |
| 8-0.75 | 8.0 | 6.0 | 14.0 | 0.75 | 7.78 | 21.20 | |
| 8-1.00 | 8.0 | 8.0 | 16.0 | 1.00 | 6.93 | 28.27 | |
| 8-1.25 | 8.0 | 10.0 | 18.0 | 1.25 | 6.08 | 35.34 | |
| Mixture | Initial Setting Time (min) | Final Setting Time (min) |
|---|---|---|
| 4-0.75 | 280 | 355 |
| 4-1.00 | 65 | 112 |
| 4-1.25 | 33 | 53 |
| 6-0.75 | 46 | 60 |
| 6-1.00 | 34 | 45 |
| 6-1.25 | 24 | 40 |
| 8-0.75 | 19 | 28 |
| 8-1.00 | 17 | 27 |
| 8-1.25 | 16 | 25 |
| Mixture | VML (min:s) | UPV (m/s) at VML |
|---|---|---|
| 4-0.75 | 19:40 | 990.75 |
| 4-1.00 | 16:20 | 929.75 |
| 4-1.25 | 15:20 | 939.00 |
| 6-0.75 | 17:20 | 967.75 |
| 6-1.00 | 14:00 | 909.50 |
| 6-1.25 | 11:20 | 911.75 |
| 8-0.75 | 12:20 | 936.50 |
| 8-1.00 | 11:00 | 909.50 |
| 8-1.25 | 9:00 | 972.50 |
© 2019 by the authors. Licensee MDPI, Basel, Switzerland. This article is an open access article distributed under the terms and conditions of the Creative Commons Attribution (CC BY) license (http://creativecommons.org/licenses/by/4.0/).
Share and Cite
Choi, S.; Lee, K.-M. Influence of Na2O Content and Ms (SiO2/Na2O) of Alkaline Activator on Workability and Setting of Alkali-Activated Slag Paste. Materials 2019, 12, 2072. https://doi.org/10.3390/ma12132072
Choi S, Lee K-M. Influence of Na2O Content and Ms (SiO2/Na2O) of Alkaline Activator on Workability and Setting of Alkali-Activated Slag Paste. Materials. 2019; 12(13):2072. https://doi.org/10.3390/ma12132072
Chicago/Turabian StyleChoi, Sung, and Kwang-Myong Lee. 2019. "Influence of Na2O Content and Ms (SiO2/Na2O) of Alkaline Activator on Workability and Setting of Alkali-Activated Slag Paste" Materials 12, no. 13: 2072. https://doi.org/10.3390/ma12132072
APA StyleChoi, S., & Lee, K.-M. (2019). Influence of Na2O Content and Ms (SiO2/Na2O) of Alkaline Activator on Workability and Setting of Alkali-Activated Slag Paste. Materials, 12(13), 2072. https://doi.org/10.3390/ma12132072