Article

Effect of Polymer Blends on the Properties of Foamed Wood-Polymer Composites

College of Mechanical and Electrical Engineering, Beijing University of Chemical Technology, Beijing 100029, China
*
Author to whom correspondence should be addressed.
Materials 2019, 12(12), 1971; https://doi.org/10.3390/ma12121971
Submission received: 25 May 2019 / Revised: 11 June 2019 / Accepted: 17 June 2019 / Published: 19 June 2019

Abstract

:
The polypropylene (PP)/wood flour (WF) composites were prepared using a co-rotating twin-screw extruder followed by a single-screw extruder foaming system in this paper. Polymers, such as polyolefin elastomer (POE), high-density polyethylene (HDPE) or microcrystalline wax, were blended with PP in the preparation of composites to improve the melt strength. And a cavity transfer mixer was introduced to increase the distribution uniformity of components in composites. Meanwhile, the effect of the polymer blends on the microstructure and mechanical properties of samples was investigated. The experimental results show that the addition of POE and HDPE resulted in the second melting peak in the differential scanning calorimeter (DSC) curves and a great decrease in the cell size was caused by the added POE. However, due to the velocity difference of composites in the die, the shape of bubbles gradually became irregular. Moreover, the impact strength of samples significantly increased by 85% for the added POE and the apparent density decreased by 6.7%. And the minimum Vicat softening temperature of 133.7 °C was obtained when the mass ratio of HDPE to PP was 4/6.

Graphical Abstract

1. Introduction

Compared with neat polymers, the wood-polymer composites have advantages in material costs and stiffness, which helps wood-polymer composites to be gradually accepted by the plastics industry [1]. However, these advantages are obtained at the expense of a loss in ductility and impact strength of the composites, and the addition of wood flour will lead to a higher density of composites compared to neat polymers and wood, which have limited the use of wood-polymer composites in some areas in recent years.
Therefore, a uniform microcellular structure was introduced into the wood-polymer composites to improve ductility and decrease density. This can be attributed to the fact that small bubbles can effectively suppress crack growth by passivating the crack tip and increasing the energy required for crack growth. As a result, the products with microcellular structure can be used in automotive, high-speed rail, aerospace, military and other fields.
However, most of the wood-plastic foamed products on the market use amorphous polymer as the resin matrix, such as polyvinyl chloride (PVC) [2,3], polystyrene (PS) [4]. This is because the melt strength of amorphous polymers decreases slowly with the increase of processing temperature during the transition from high elastic state to viscous flow state, which makes PVC and PS can effectively restrain the excessive expansion of bubbles in the foaming process. Compared with the amorphous polymers, the melt strength of crystalline polymers decreases rapidly after the processing temperature exceeds the melting temperature, which leads to a narrow temperature range for the melt strength of crystalline polymers to meet the foaming requirements. The temperature range of PP is just 4 °C, while the temperature range of PS is 50 °C. In the extrusion process, the actual temperature of the material is difficult to control accurately. And the narrow temperature range will make it difficult for the melt of PP to support the excessive expansion of the bubbles in the foaming process, which will cause bubble collapse, bubble coalescence and other defects. So PP is seldom used to prepare microporous plastics, although it has lower density, higher water and chemical resistance, better mechanical properties and higher operating temperature [5,6,7].
In order to achieve a uniform microcellular structure, many researches were focused on blending PP with other polymers to improve the melt strength, such as HDPE, polybutylene terephthalate (PBT), polytetrafluoroethylene (PTFE) and so on. The introduction of HDPE would increase the solubility of CO2 and decrease the crystallinity of both HDPE and PP, which contributed to facilitate the production of microcellular foam in blend materials [8]. Besides, the addition of PBT acts as heterogeneous nucleation during crystallization and the physical network formed by the entanglement of fibrous PBT can effectively restrain the growth of bubbles in the foaming process, which helps to reduce cell size as well as improve cell density and cell uniformity [9]. Compared with HDPE and PBT, the fibrous PTFE can not only enhance the CO2 sorption capacity of the matrix, but also form a physical network in the melt to restrain the bubbles, which resulted in a great increase in bubble density and volume expansion ratio [10,11]. The samples with microcellular structure mentioned above are prepared by batch foaming process. In contrast, the cell size and cell density of samples prepared by microcellular continuous extrusion are at least one order of magnitude different from those of samples prepared by batch foaming. In addition, most of the studies concerning microcellular continuous extrusion of PP are based on capillary die with a diameter less than 2 mm, and there are few studies that focus on microcellular continuous extrusion of PP/WF composites.
Therefore, on the basis of previous studies, PP/WF composites will be prepared by microcellular continuous extrusion in this article based on the die with large rectangular section. And in the previous studies, POE was often used to improve the ductility of composites, although the effect of POE on the cell morphology was seldom investigated [12,13]. Besides, in the previous experiments, the fact that the addition of a small amount of microcrystalline wax helped to obtain the smaller bubbles was found, which was also seldom investigated.
Moreover, in order to improve the cellular structure, it is necessary to increase the distribution uniformity of materials to obtain the polymer/gas homogenous system, which mainly depended on the introduction of static mixer and the enhancement of screw shear action in the previous research [13,14]. However, the addition of wood flour would increase the viscosity of composites and made the mixing of composites more difficult. Besides, the previous work indicted that the static mixer used in the preparation of wood-plastic composites was easy to deform for the high extrusion pressure. As a result, the cavity transfer mixer (CTM) [14] was introduced to replace the role of static mixer in the preparation of wood-plastic composites. What’s more, the melt pump was also introduced to maintain the stability of extrusion pressure.
In this study, the blends of PP with POE, HDPE and microcrystalline wax were prepared respectively and selected as a polymeric matrix. And a cavity transfer mixer was mounted to achieve a single-phase polymer solution with higher distribution uniformity in the foaming process. Then, the effect of polymer blends on the thermal and crystalline performance and rheological property of the composites was investigated. Besides, the effect of polymer blends on the cell morphology and mechanical properties of samples was also investigated.

2. Experimental

2.1. Materials

The samples studied in this article were mainly prepared from materials such as polymer blends, wood flour (WF), inorganic filler and blowing agent. The polymer blends were made by blending PP with POE, HDPE and microcrystalline wax, respectively. PP, B1002W with the density of 0.902 g/cm3 and the melt flow index of 1.0 g/10 min at 230 °C/2.16 kg, was obtained from SINOPEC (Beijing, China). HDPE, 5000S with the density of 0.950 g/cm3 and the melt flow index of 0.9 g/10 min at 190 °C/2.16 kg, was obtained from SINOPEC, China. POE, DF605 with the density of 0.862 g/cm3 and the melt flow index of 0.5 g/10 min at 190 °C/2.16 kg, was obtained from Mitsui Chemicals (Tokyo, Japan). Microcrystalline wax, 155 with the density of 0.783 g/cm3 and the melting temperature of 69.3 °C, was obtained from Nippon Seiro Co. (Tokyo, Japan). Besides, the poplar wood flour with the grain size of 150 μm (100 mesh) was obtained from HC wooden Co. (Jiangshan, China). And the nucleating agent, talc was obtained from Haicheng Talc Powder Manufacturer, China, with the grain size of 23 μm (600 mesh). In order to improve the interface between polymer blends and wood flour, maleic anhydride-g-PP (MAH-g-PP, D201) used as the coupling agent was obtained from Shanghai Bingo International Trading Co. (Shanghai, China), with the melt flow index of 150 g/10 min at 230 °C/2.16 kg. At last, the blowing agent, Azodicarbonamide (AC) was obtained from Selon Industrial Co. (Leping, China), with the gas production of 220 mL/g and the decomposition temperature of 160 °C.

2.2. Composites Preparation

First, in order to improve the melt strength of the polymer matrix, PP was blended with other polymers in a high-speed mixer (SHR-25A, Zhangjiagang Yongli Machinery Co., Ltd., Suzhou, China) for 4 min, such as HDPE, POE and microcrystalline wax. Then, the mixtures were melt-extruded using a 20-mm-diameter co-rotating twin-screw extruder with the length/diameter ratio of 40 (Kunshan Kesun, Rubber & Plastic Machinery Co., Kunshan, China). At last, the molten polymer was cooled by air and then fed into a pelletizer to obtain the resin pellets with uniform size.
Second, the wood flour dried at 80 °C for 24 h was blended with resin pellets, talc and MAH-g-PP in a high-speed mixer for 30 min. The mass ratio of polymer blends, wood flour, talc and MAH-g-PP was 70:30:10:3.5 in this study. Besides, the compositions of polymer blends for different samples are listed in Table 1. Then, similar with the steps above, the mixture was melt-extruded using a co-rotating twin-screw extruder to further improve the uniformity of distribution of wood flour in composition. And the WPC pellets with uniform size were obtained after the extrudate was fed into a pelletizer.
During the extrusion process, the zone temperatures and rotational speed of the twin-screw extruder were set at 130, 150, 170, 185, and 170 °C (from hopper to die) and 150 rpm, respectively.

2.3. Extrusion Foaming

In this study, the foaming samples were prepared by a single-screw extruder foaming system, which was shown in Figure 1. The foaming system mainly consisted of a 45-mm-diameter single-screw extruder with the length/diameter ratio of 25 (Shanghai Sanlei Plastic Machinery Manufacturing Co., Ltd., Shanghai, China), a cavity transfer mixer, a melt pump (ZB-B3-20CC, Batte Melt Pump Zhengzhou Co., Ltd., Zhengzhou, China), a sheet die with a rectangular outlet section and a tractor. The rectangular outlet section of die was 80 mm in width by 8 mm in height, respectively.
Before extrusion, the WPC pellets were blended with the AC foaming agent at a mass ratio of 100:0.5 in a high-speed mixer for 3 min. Besides, the liquid paraffin was added before mixing and the powder of AC foaming agent was uniformly wrapped on the surface of WPC particles in the mixing process because of the adhesion of liquid paraffin. Then the mixture was put in the hopper to achieve a single-phase polymer solution under the strong shear action of screw mixing and the cavity transfer mixer. At last, the single-phase solution was delivered into the sheet die where the gas solubility in the polymer would decrease suddenly for the rapid pressure drop of the melt. As a result of the decrease of the gas solubility, a lot of bubbles would nucleate and growth in the resin matrix to create a foam structure. Considering the decomposition temperature of the blowing agent and the melting temperature of the WPC pellets, the temperatures of the sheet die and the melt pump were kept at 180 °C, and the zone temperatures of the extruder barrel were kept at 140, 160 and 175 °C, respectively.

2.4. Characterization

2.4.1. Thermal Analysis

The crystallization behavior of the samples was analyzed by a differential scanning calorimeter (Q2000, TA Instruments Co., New Castle, DE, USA). The measurements were performed in nitrogen atmosphere as following procedures: samples were heated up to 210 °C at rate of 10 °C/min and held in a molten state for 1 min to erase any previous thermal history, followed by cooling down to the room temperature at the same rate. Data for heating and cooling cycle were recorded, and then, the melting temperature (Tm) and crystallization temperature (Tc) values for the samples were read from the graphs, as listed in Figure 2. The crystallinity percentage (Xc) of the PP phase was calculated according to the following equation:
X c = H f H f o × ω
where H f is the heat of fusion generated by the cold crystallization, H f o is the theoretical heat of fusion of 100% crystalline PP with a value of 209 J/g [9], and ω is the weight fraction of PP in the sample.

2.4.2. Rheological Property Testing

The rheological properties of samples in this study were characterized by the frequency dependences of molten-state oscillatory shear moduli, such as the shear storage modulus G′ and the loss modulus G″, which were conducted using a parallel-plate rheometer (HAAKE MARS III, Thermo Fisher Scientific Inc., Waltham, MA, USA). The tests were performed in dynamic mode between parallel plates (diameter 25 mm, gap 1 mm) at 180 °C in nitrogen atmosphere. Besides, in the process of testing, frequency sweeps between 0.01 and 100 rad/s were carried out at strains within the linear viscoelastic range and the scan amplitude was 1%.

2.4.3. Morphological Analysis

The microstructures of the samples were observed by a scanning electron microscope (Model S-4700, Japan Hitachi Company, Tokyo, Japan). In order to avoid damaging the surface morphology, each sample was fractured after cooling in liquid nitrogen for about 10 min and sputter-coated with gold before observation. Then the SEM photographs were analyzed by image analysis software (Image Pro Plus 6.0) to obtain the average cell size and cell density of the samples.
The number average diameter of all cells in one micrograph, d ¯ , was calculated as follows:
d ¯ = i = 1 n d i n
where di is the diameter of a single cell, and n is the number of counted cells. At least 100 cells were selected randomly from the SEM graph of each sample to evaluate the average diameter.
The cell density N0, defined as the number of cells per unit volume of the polymer, was calculated as follows:
N 0 = [ n M 2 A ] 3 / 2 ρ 0 ρ f
where A is the area of an SEM graph (cm2), n is the number of cells in the micrograph, M is the magnification factor, ρ 0 is the density of the unfoamed sample and ρ f is the density of the foamed sample [15].

2.4.4. Mechanical Property Testing

All the mechanical properties of samples were tested according to standard testing methods. Both tensile tests and flexural tests were conducted on a universal tester (KXWW, Chengde Taiding Testing Machine Manufacturing Co., Ltd., Chengde, China) with a load cell of 5 kN. The tensile strengths of the samples were measured according to GB/T 1040.2-2006 with a draw speed of 10 mm/min. Meanwhile, the three-point flexural tests were conducted according to GB/T 9341-2008 with a cross-head speed of 10 mm/min [16].
Moreover, notched impact strength tests were conducted on an impact tester (KBANM-II, Chengde Taiding Testing Machine Manufacturing Co., Ltd., China) according to GB/T 1843-2008. Before testing, a side-edge notch with a depth of 2 mm was machined on each specimen. For each data point, at least 5 to 10 samples were tested in this study [17].

2.4.5. Density Measurements

To measure the apparent density of each sample, the weight and volume of the sample were separately determined using an electronic balance with an accuracy of 0.01 g and a micrometer caliper with an accuracy of 0.01 mm. The weight of the sample was divided by the sample’s volume to obtain the apparent density. Besides, five replicates were used for each sample and the mean value was taken.

2.4.6. Vicat Softening Point Testing

The Vicat softening point tests were conducted on a HDT-Vicat test equipment (KXRW-300CL-3, Chengde Taiding Testing Machine Manufacturing Co., Ltd., China) with a heating rate of 50 °C/h, according to GB/T 1633-2000.

3. Results and Discussions

3.1. Thermal Property

Previous studies have shown that blending with HDPE will simultaneously reduce the crystallinity of both HDPE and PP [8,18]. As shown in Figure 2, the samples containing HDPE had two well-separated melting peaks in the DSC curves, which reflected the two crystalline phases in the composites. Besides, the peak value of PP in the DSC curves decreased with the increasing content of HDPE for that the crystalline phase of HDPE dispersed in the PP matrix would greatly destroy the regularity of the molecular chain around it [19]. Meanwhile, with the increase of HDPE content, the two well-separated melting peaks representing the melting points of PP and HDPE in the polymer blends would get close to each other, which contributed to broaden the melting range of composites.
There were also two melting peaks in the curves of samples blended with POE. But the melting peak of the POE crystalline phase was not obvious in the DSC curves, because the added POE was an amorphous polymer with low crystallinity. Besides, the added POE played the role of heterogeneous nucleation during the crystallization process, which increased the crystallization rate of PP. But the long molecular chains of POE also hindered the aggregation and rearrangement of PP macromolecular chains, which resulted in the crystal defects and reduced the crystallinity of PP [20]. According to the data in Figure 2b, the addition of POE caused a greater decrease in the crystallinity of PP at the POE content of 40% compared to HDPE.
Moreover, the addition of microcrystalline wax also caused the decrease of the crystallinity of PP. But due to the small content of microcrystalline wax, the added microcrystalline wax had a less influence on the crystallinity and the second melting peak did not appear in the DSC curves [21].

3.2. Rheological Property

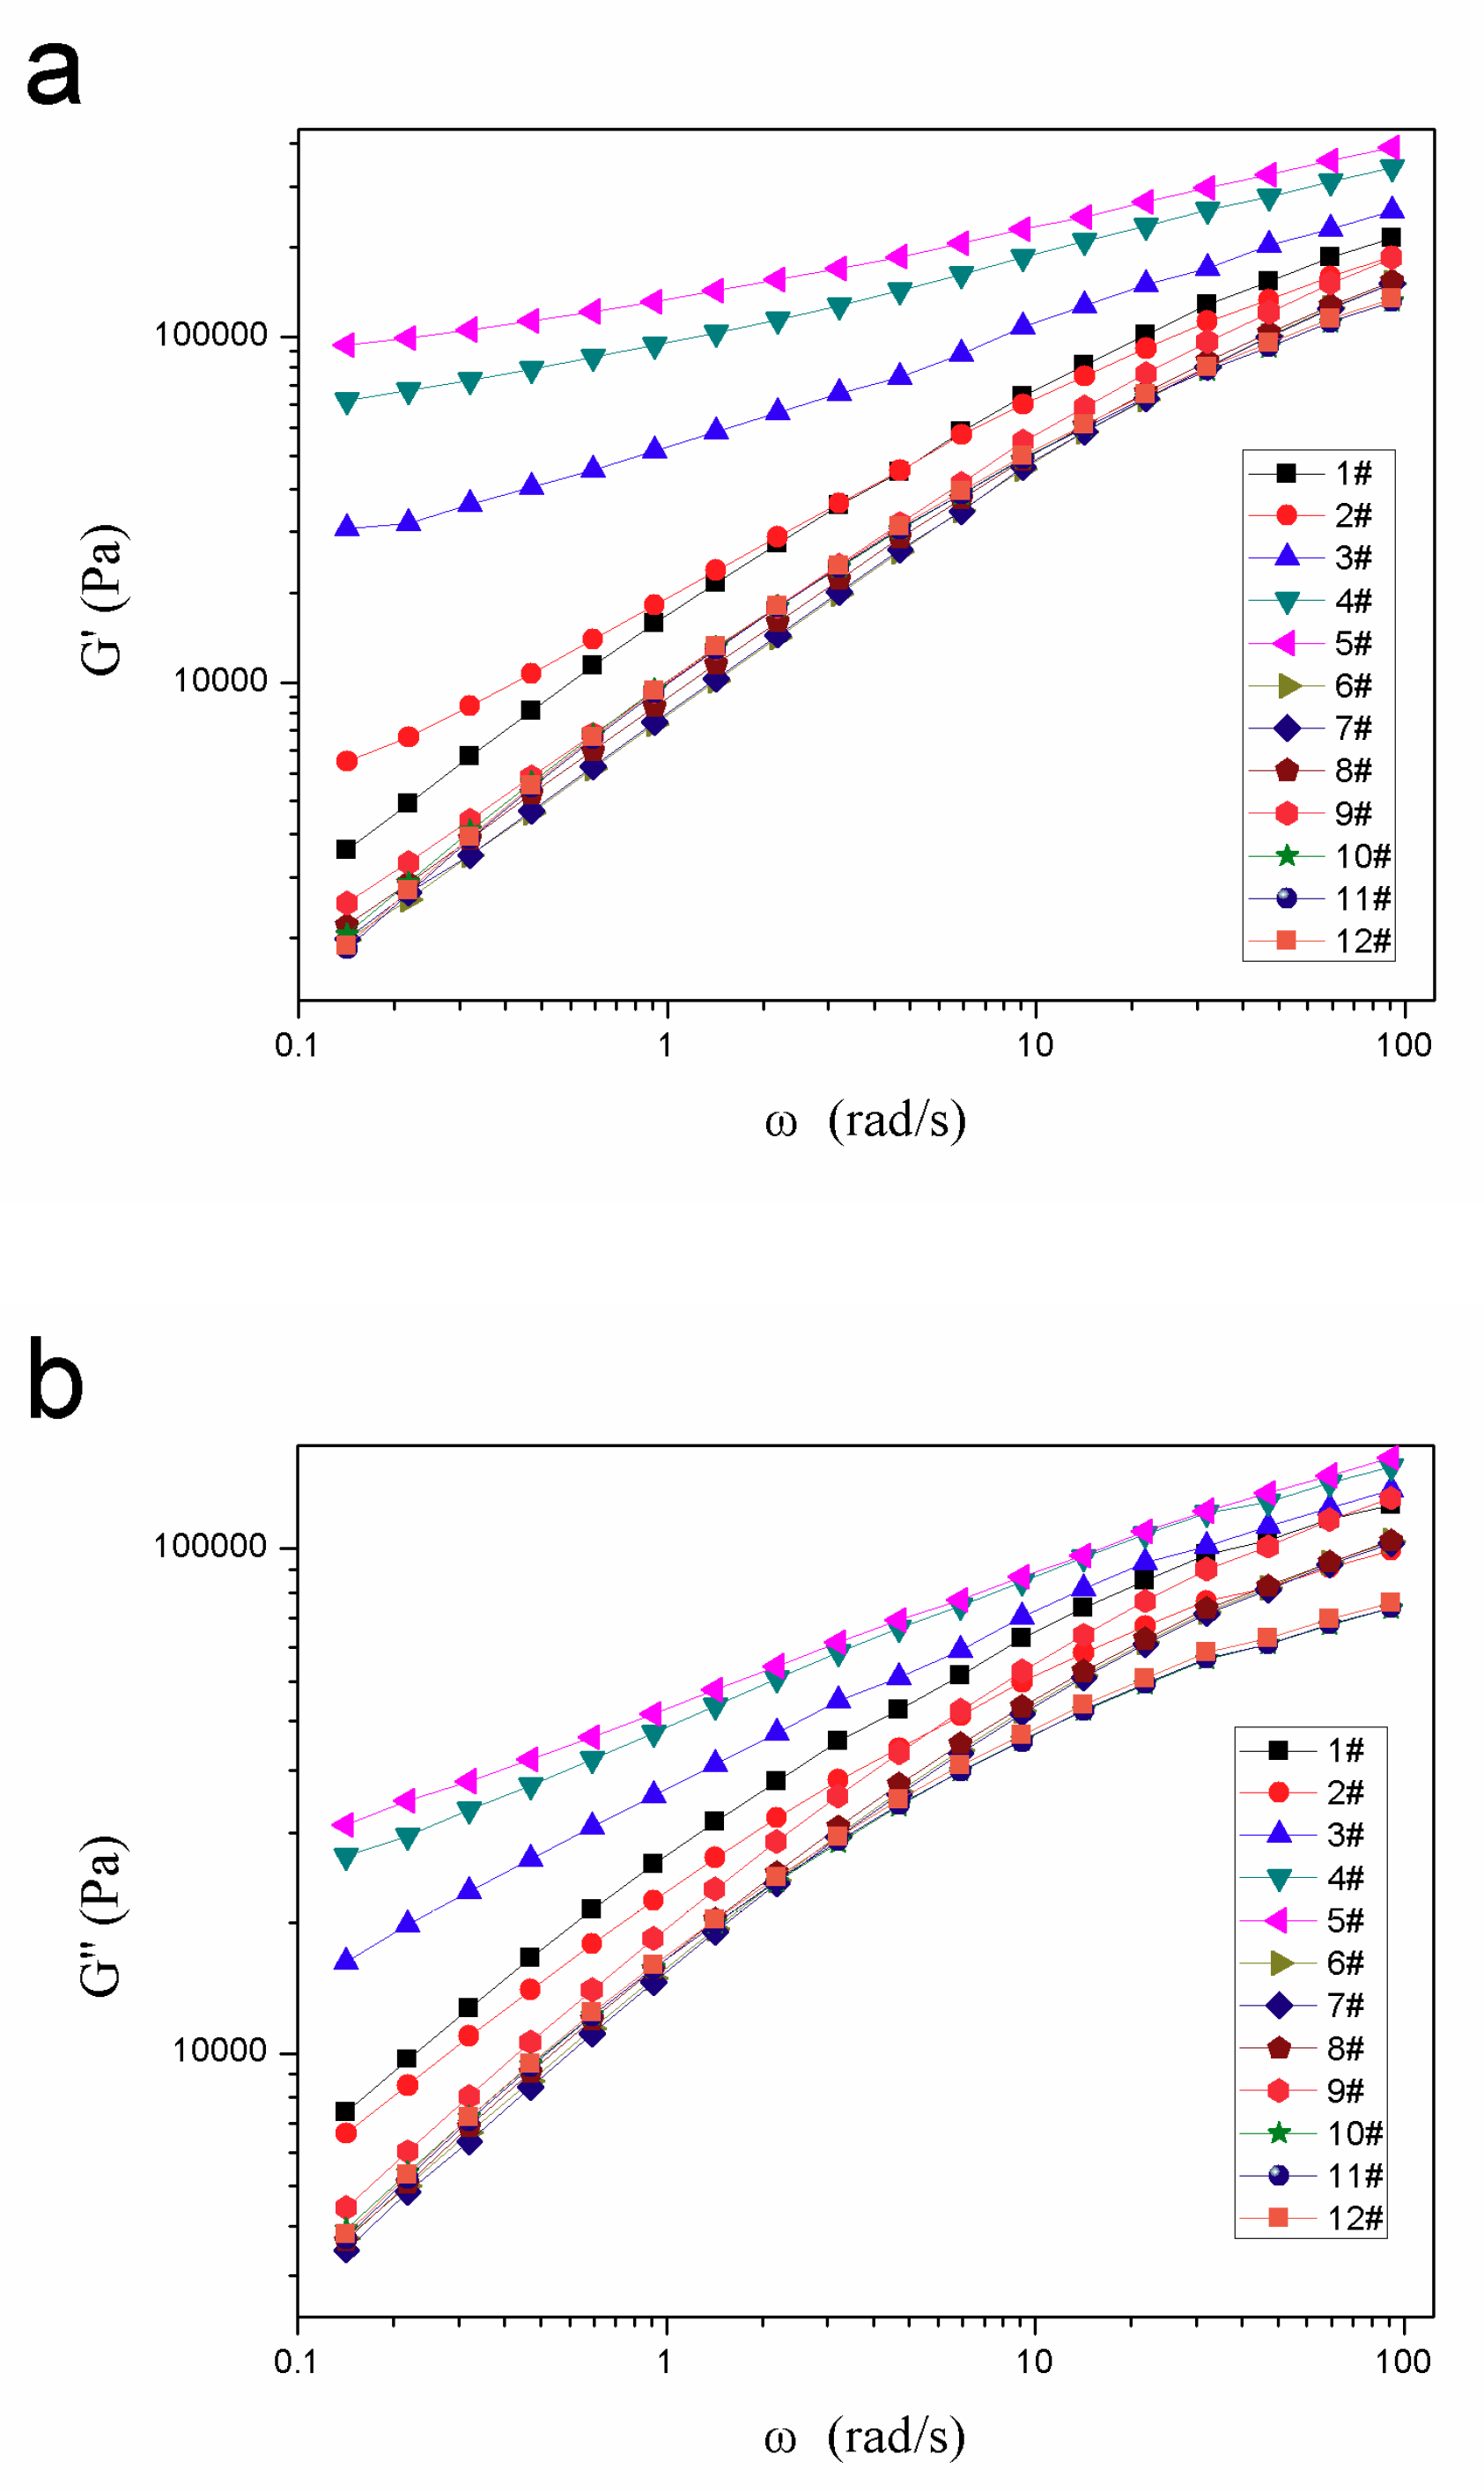
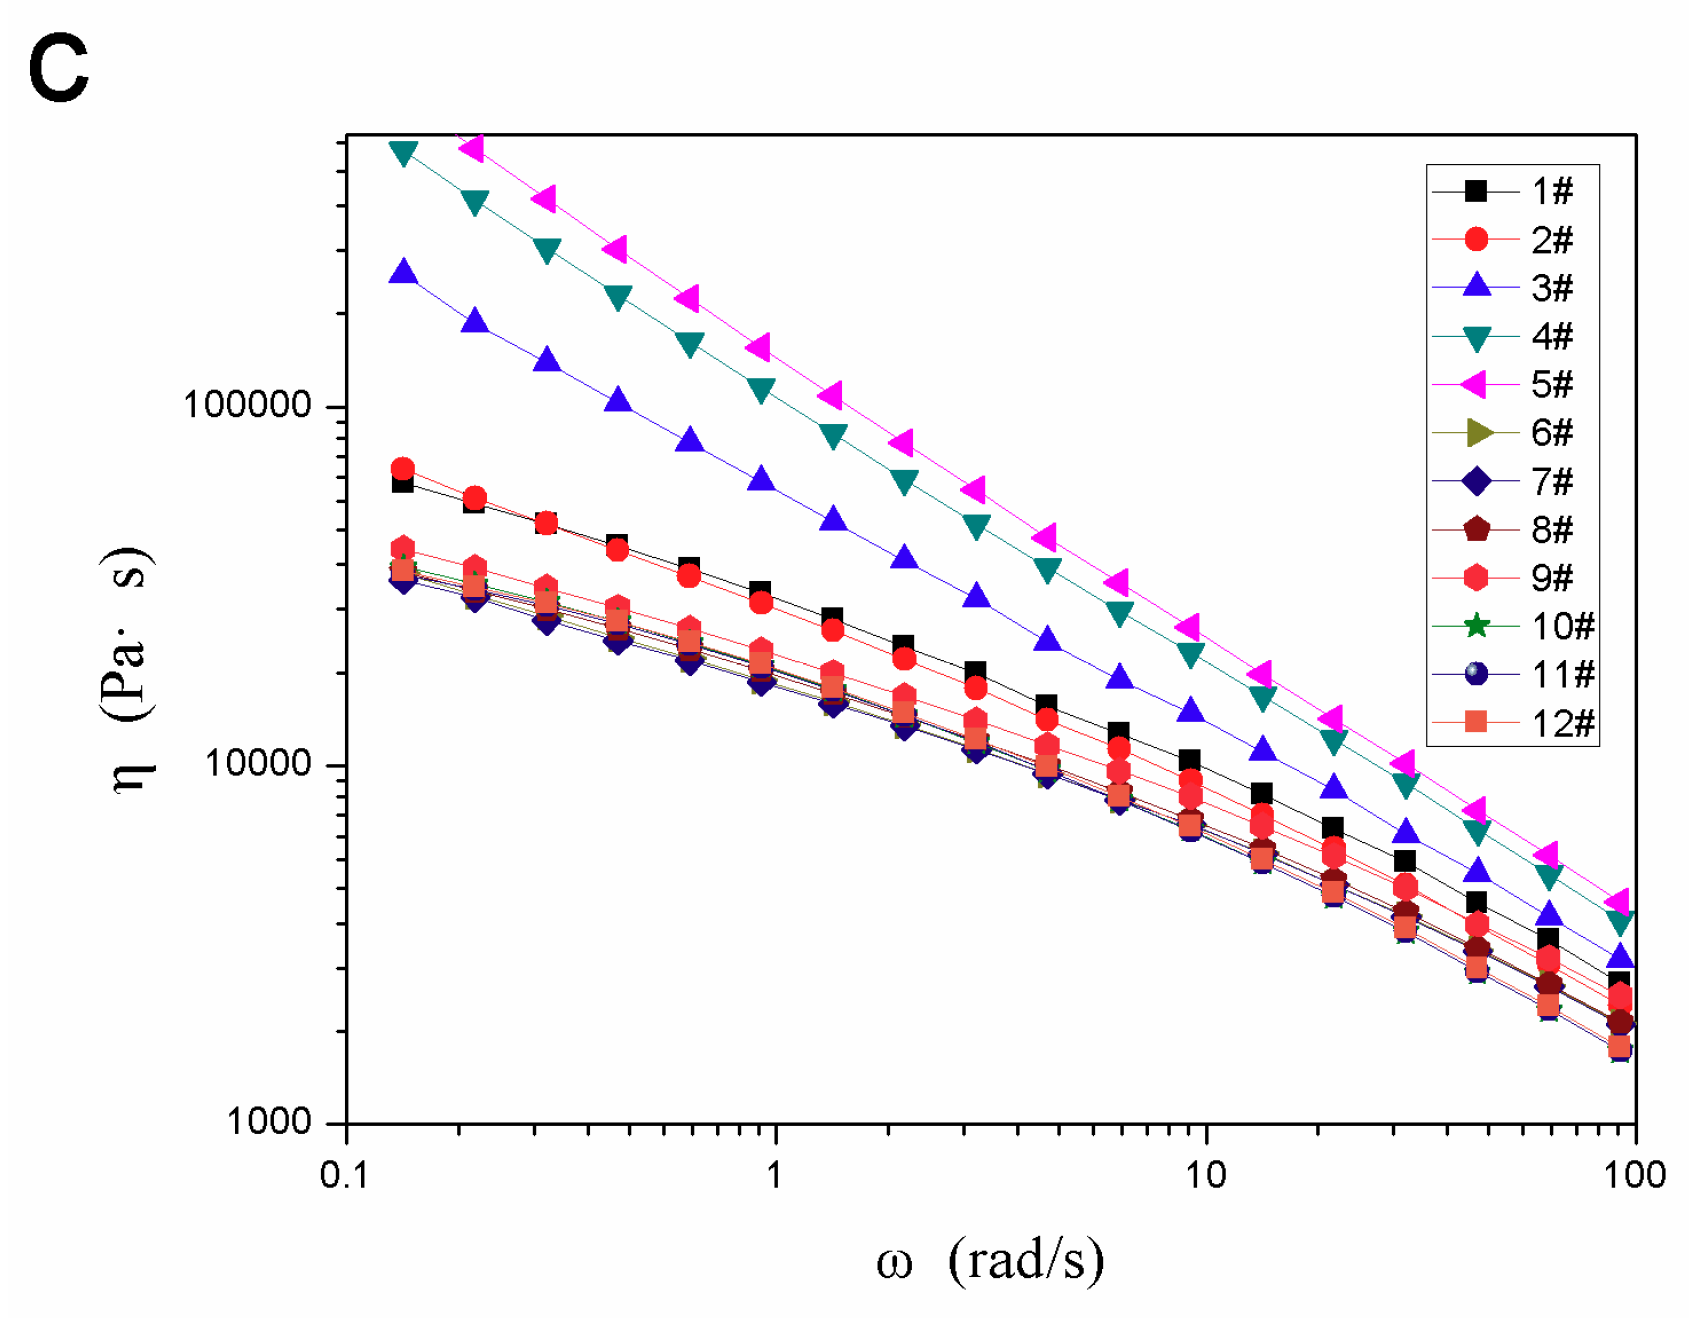
As shown in Figure 3, the polymer blends in the composites had a significant effect on the rheological properties of samples, such as storage modulus (G′), loss modulus (G″) and complex viscosity (η). According to the data in Figure 3, the addition of POE distinctly increased both the oscillating shear modulus and the complex viscosity, especially at low frequency region. This might be attributed to the fact that the addition of POE with numerous branched chains could form a large number of physical cross-linking points with PP in the process of melt mixing, which contributed to the improvement of the melt strength of composites. Besides, with the increase of POE content, the added POE gradually became a continuous phase in the composites and the viscosity of composites also tended to be stable. When the blending ratio of POE and PP was 4/6, the shear modulus and complex viscosity of composites changed little compared with that of the sample with mass ratio of 3/7.
Compared with POE, the addition of HDPE and microcrystalline wax would melt first during the mixing process and then penetrate into PP molecules to reduce friction between molecular chains, which made the molecular chains easier to slip and rotate at the time of deformation. As a result, the storage modulus (G′), loss modulus (G″) and complex viscosity (η) of samples blended with HDPE and microcrystalline wax decreased for the lubrication of HDPE and microcrystalline wax [21,22].

3.3. Cell Morphology

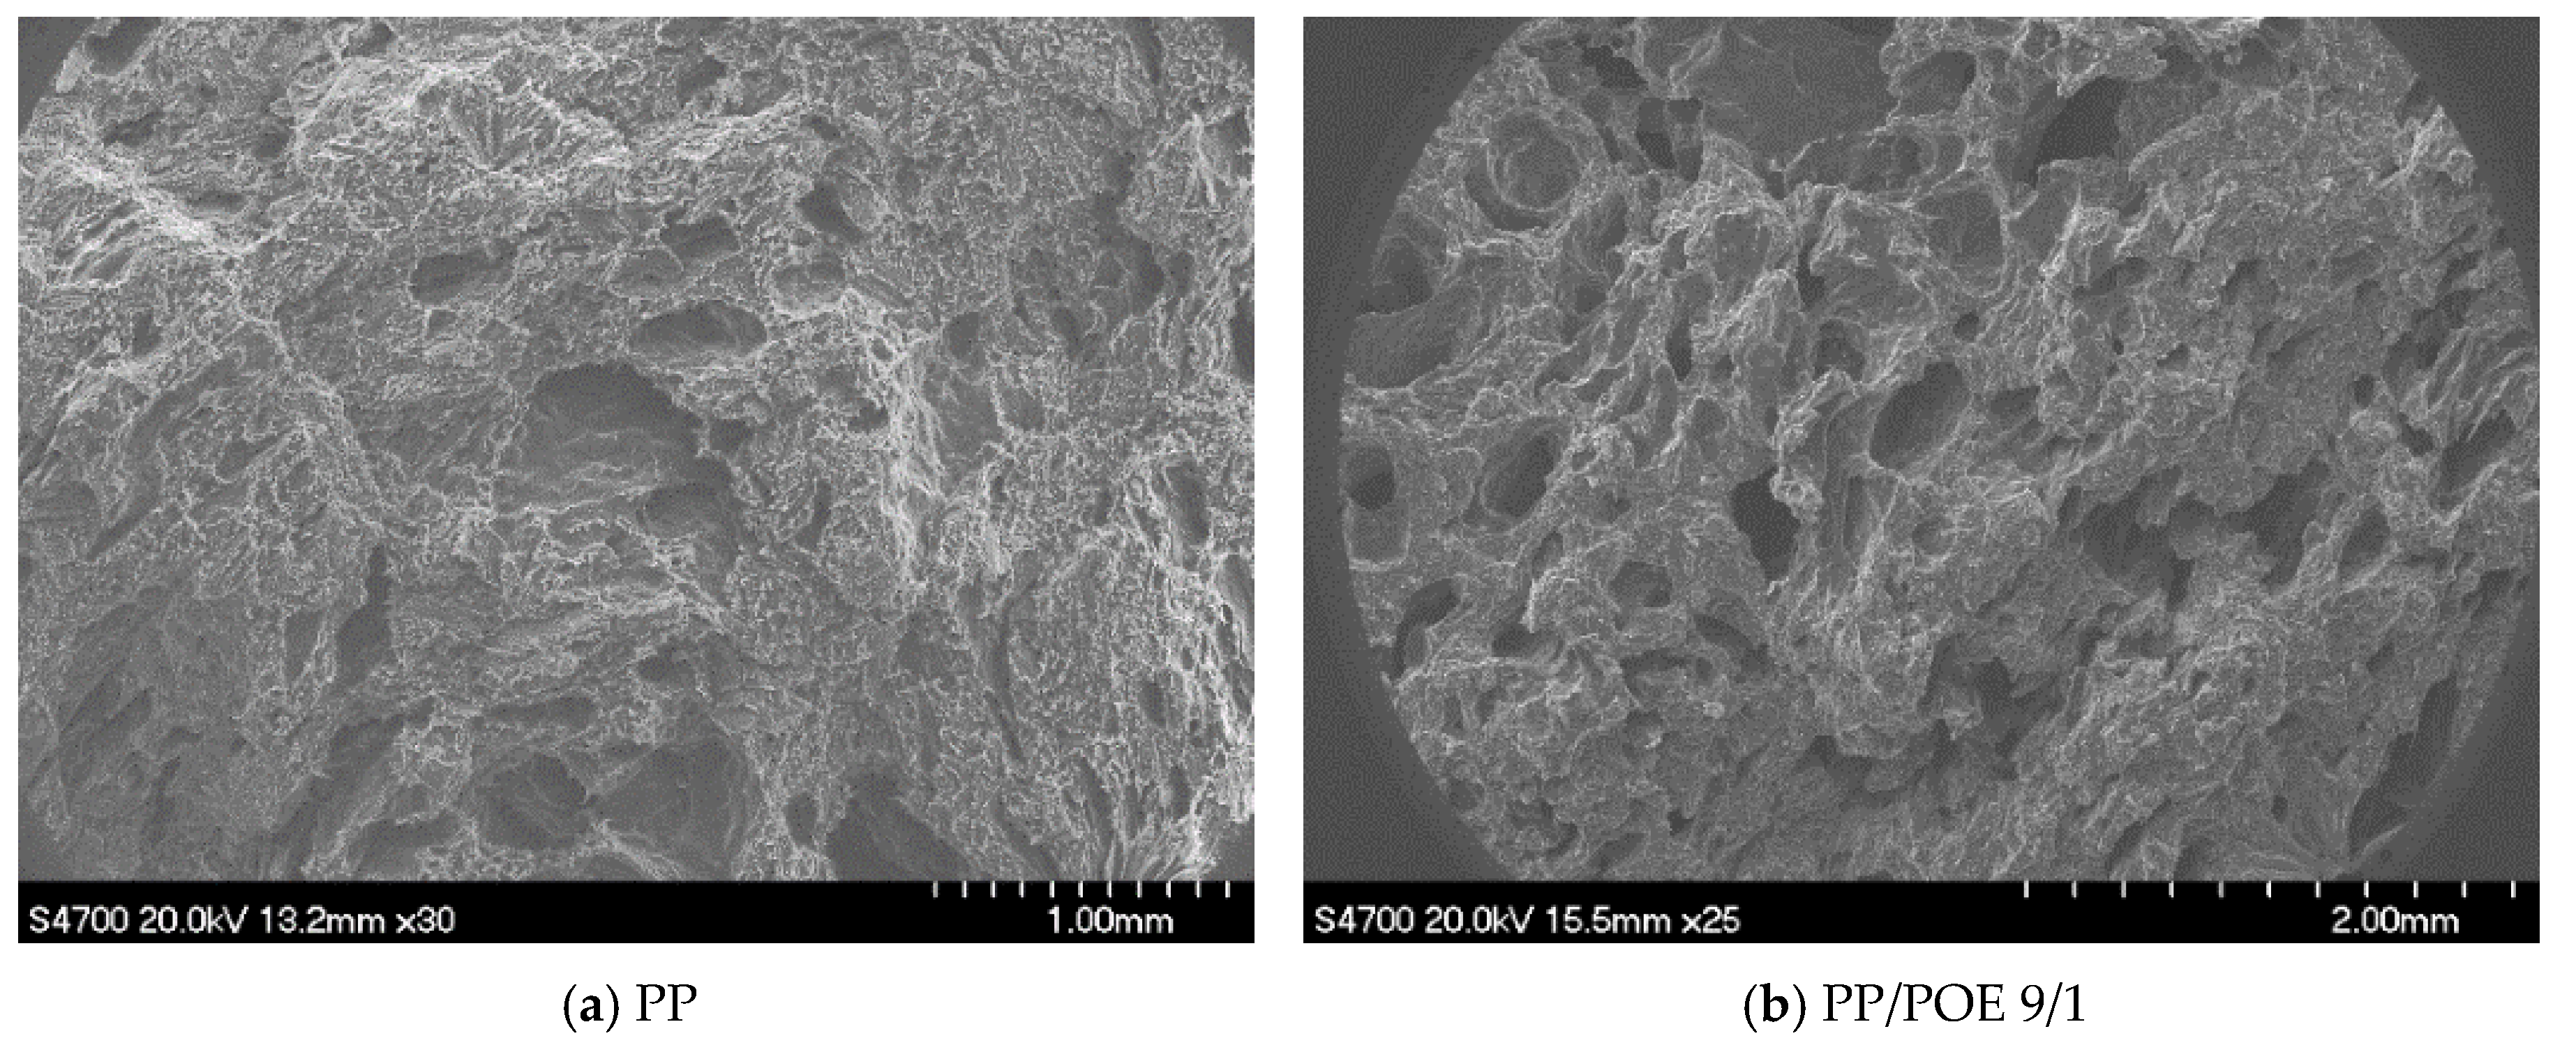
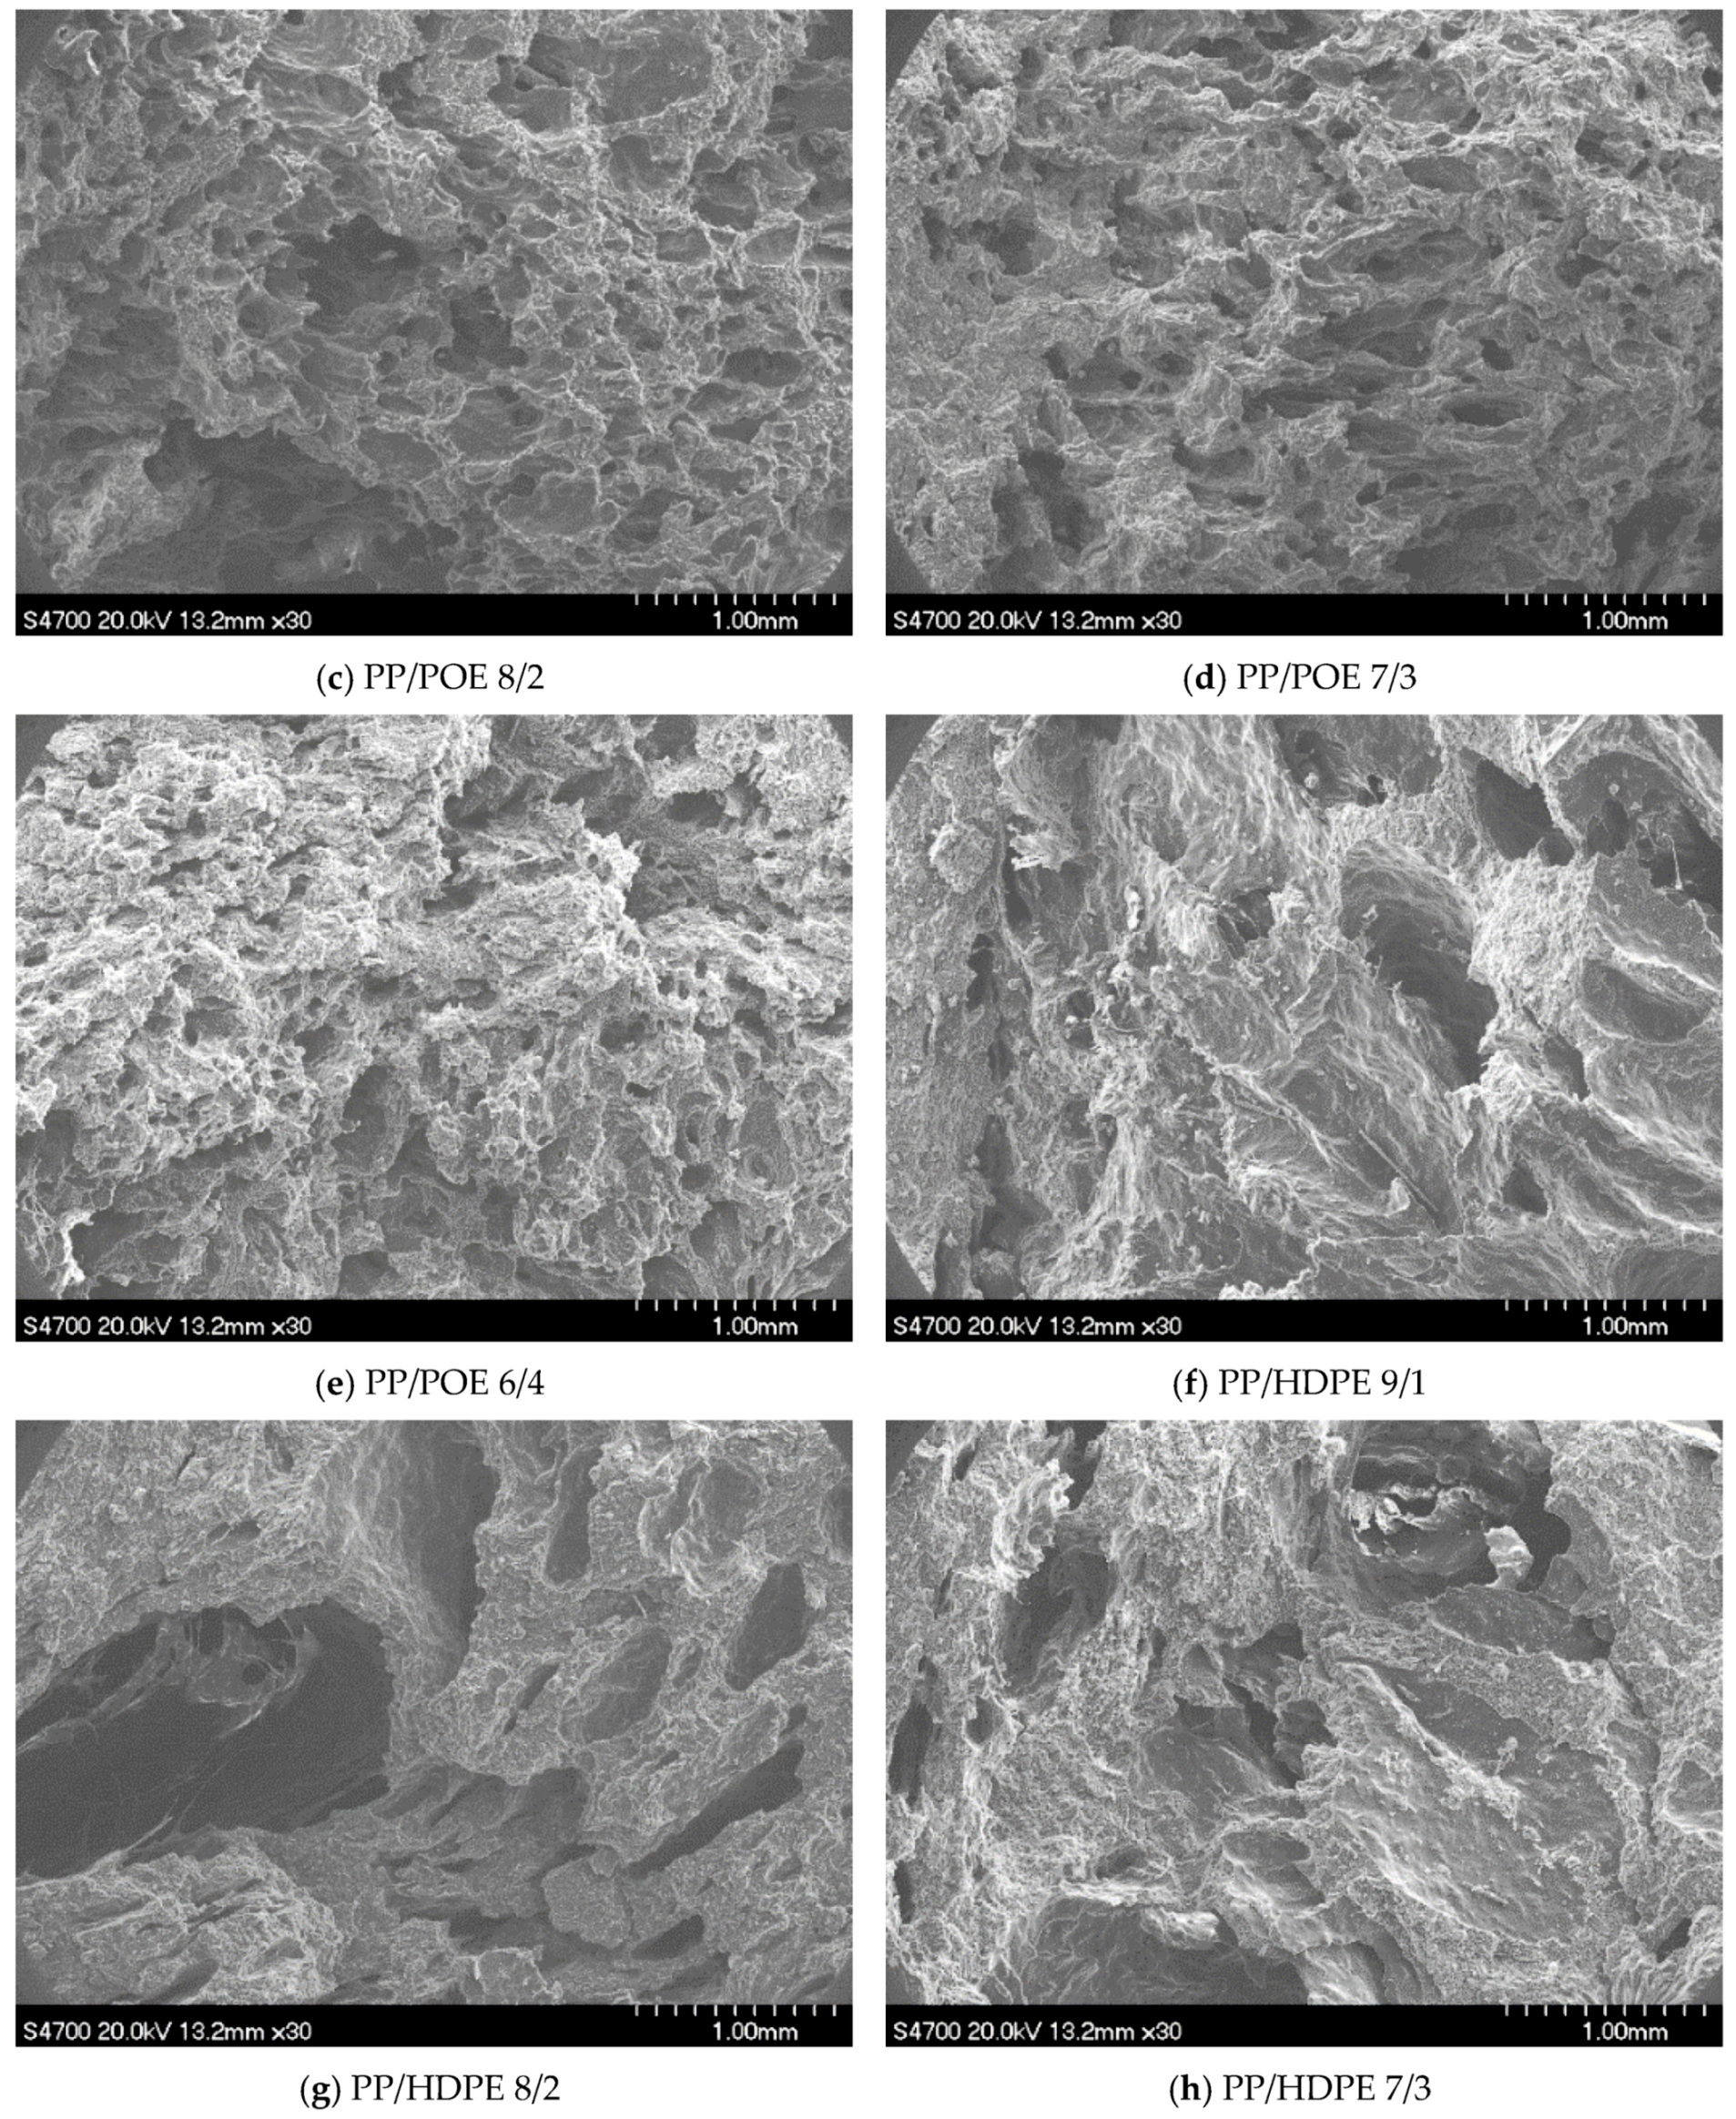
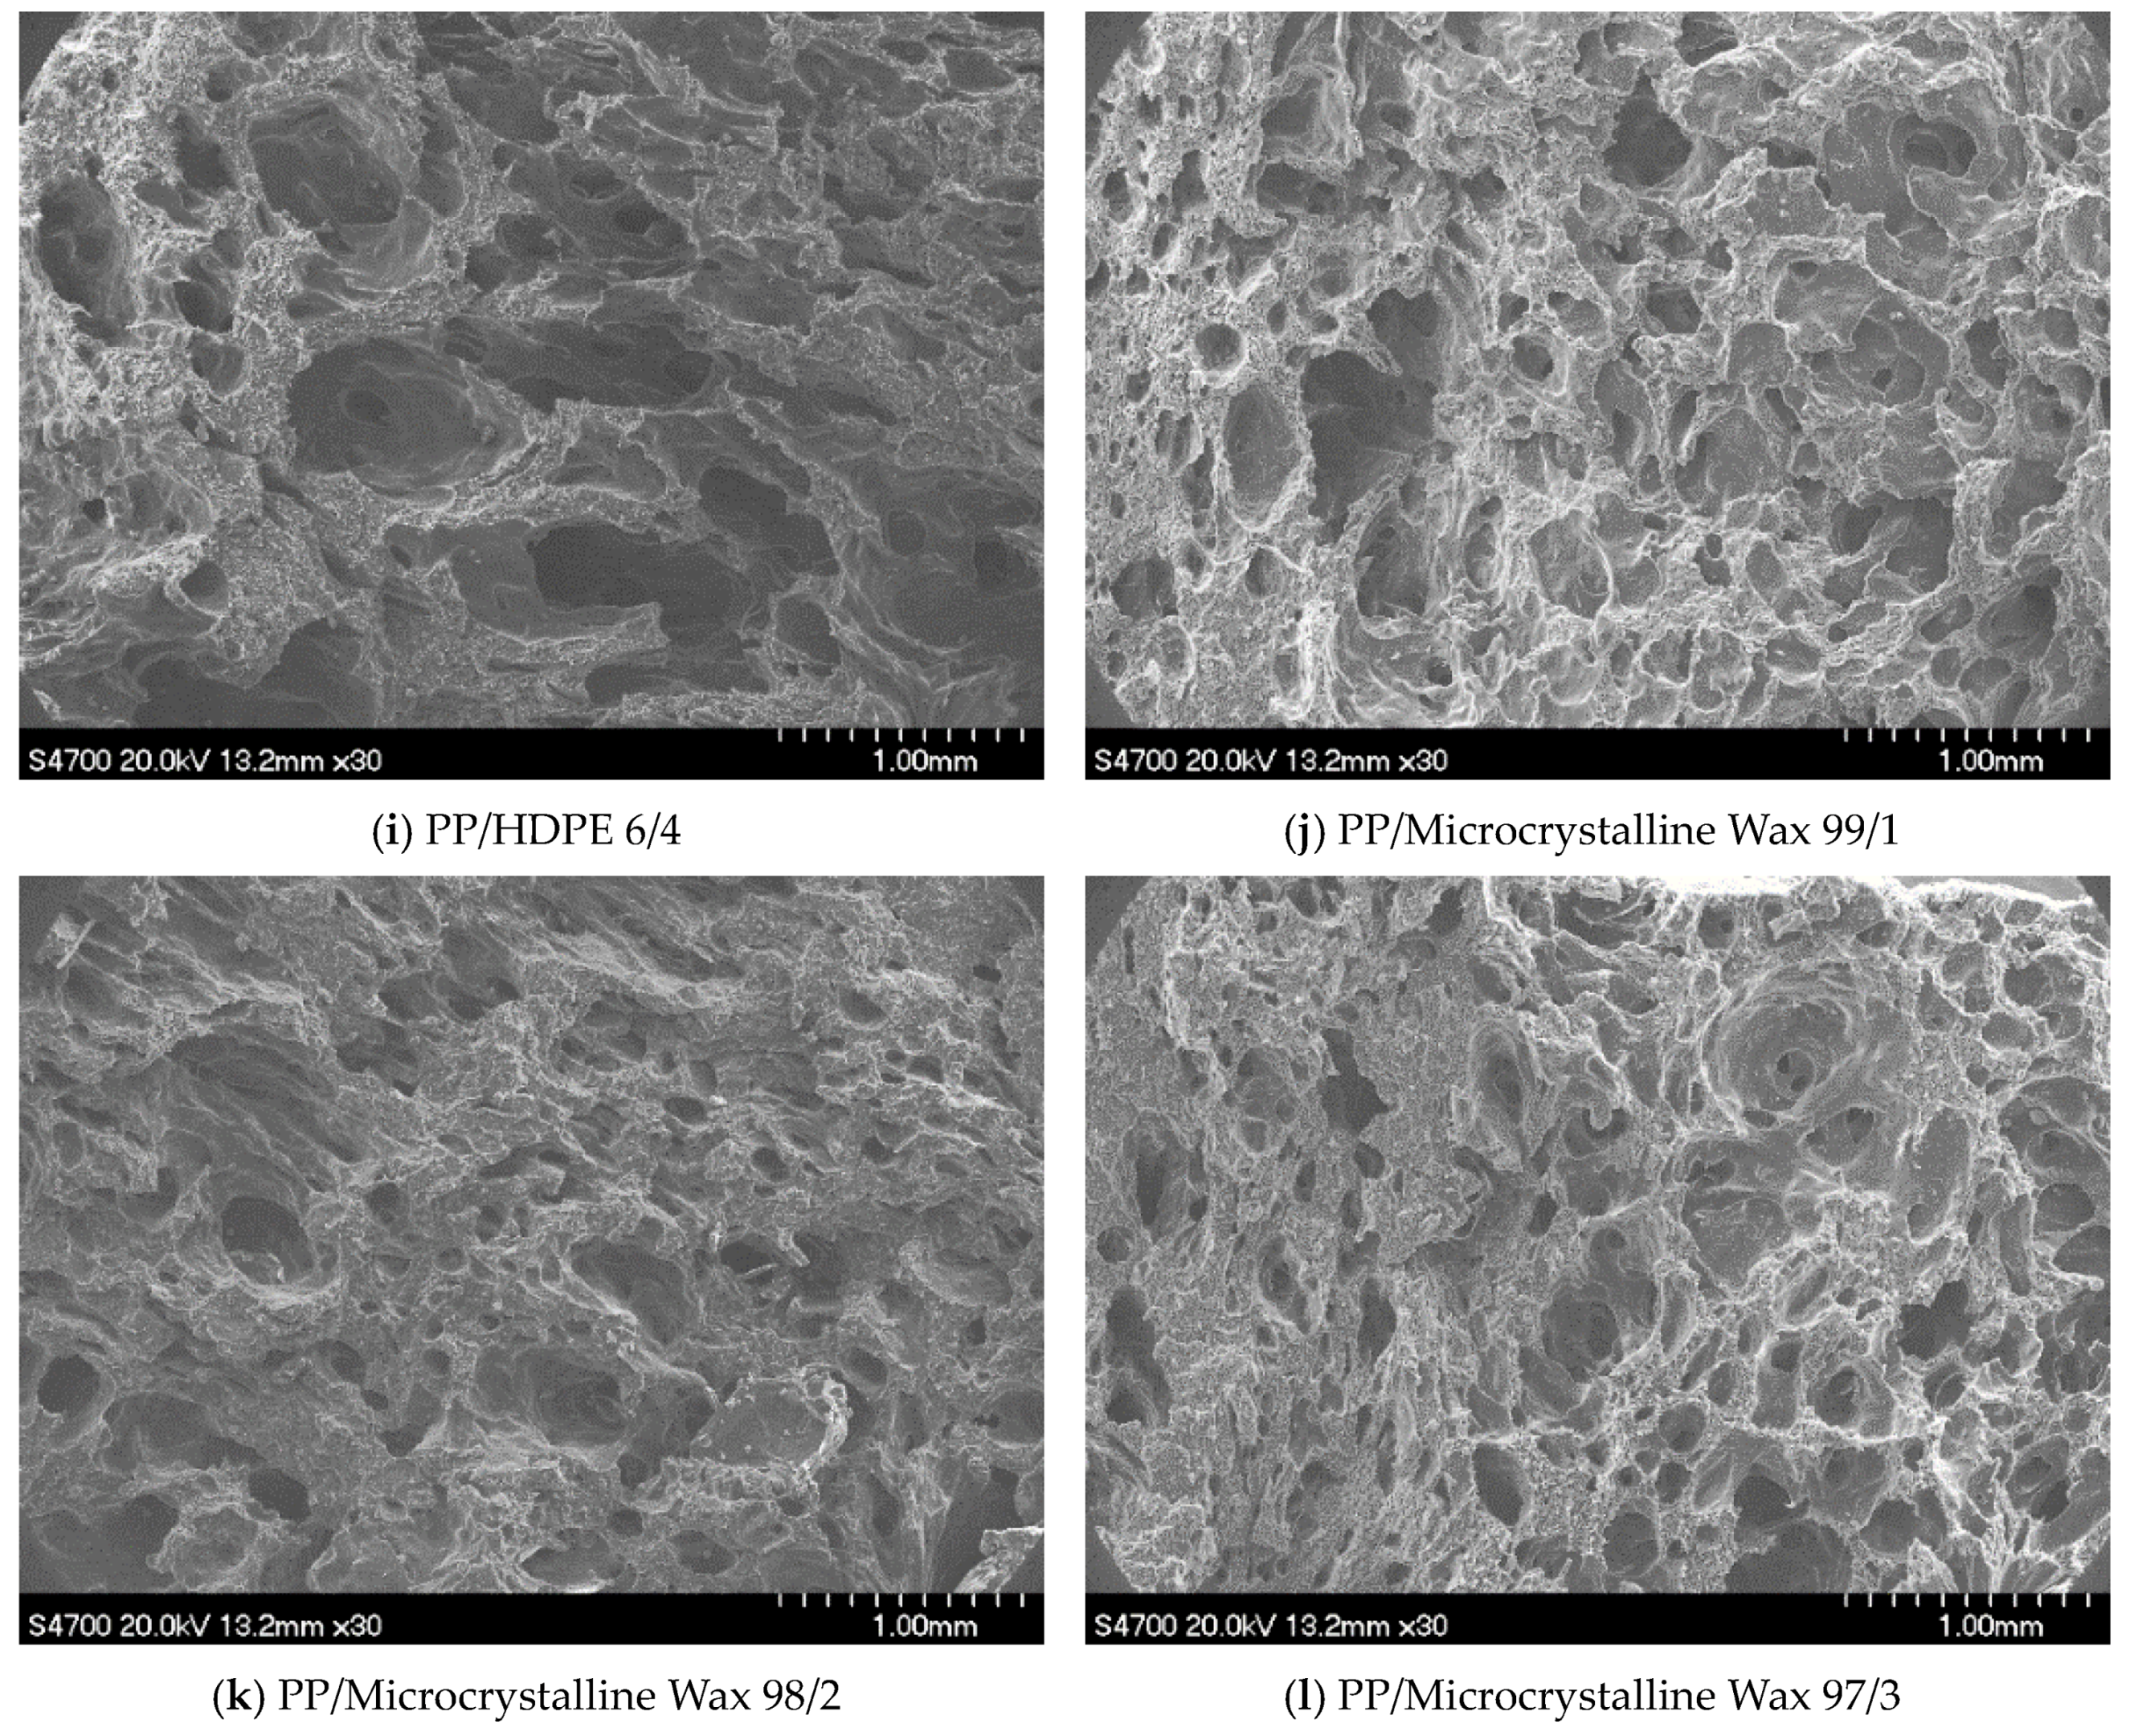
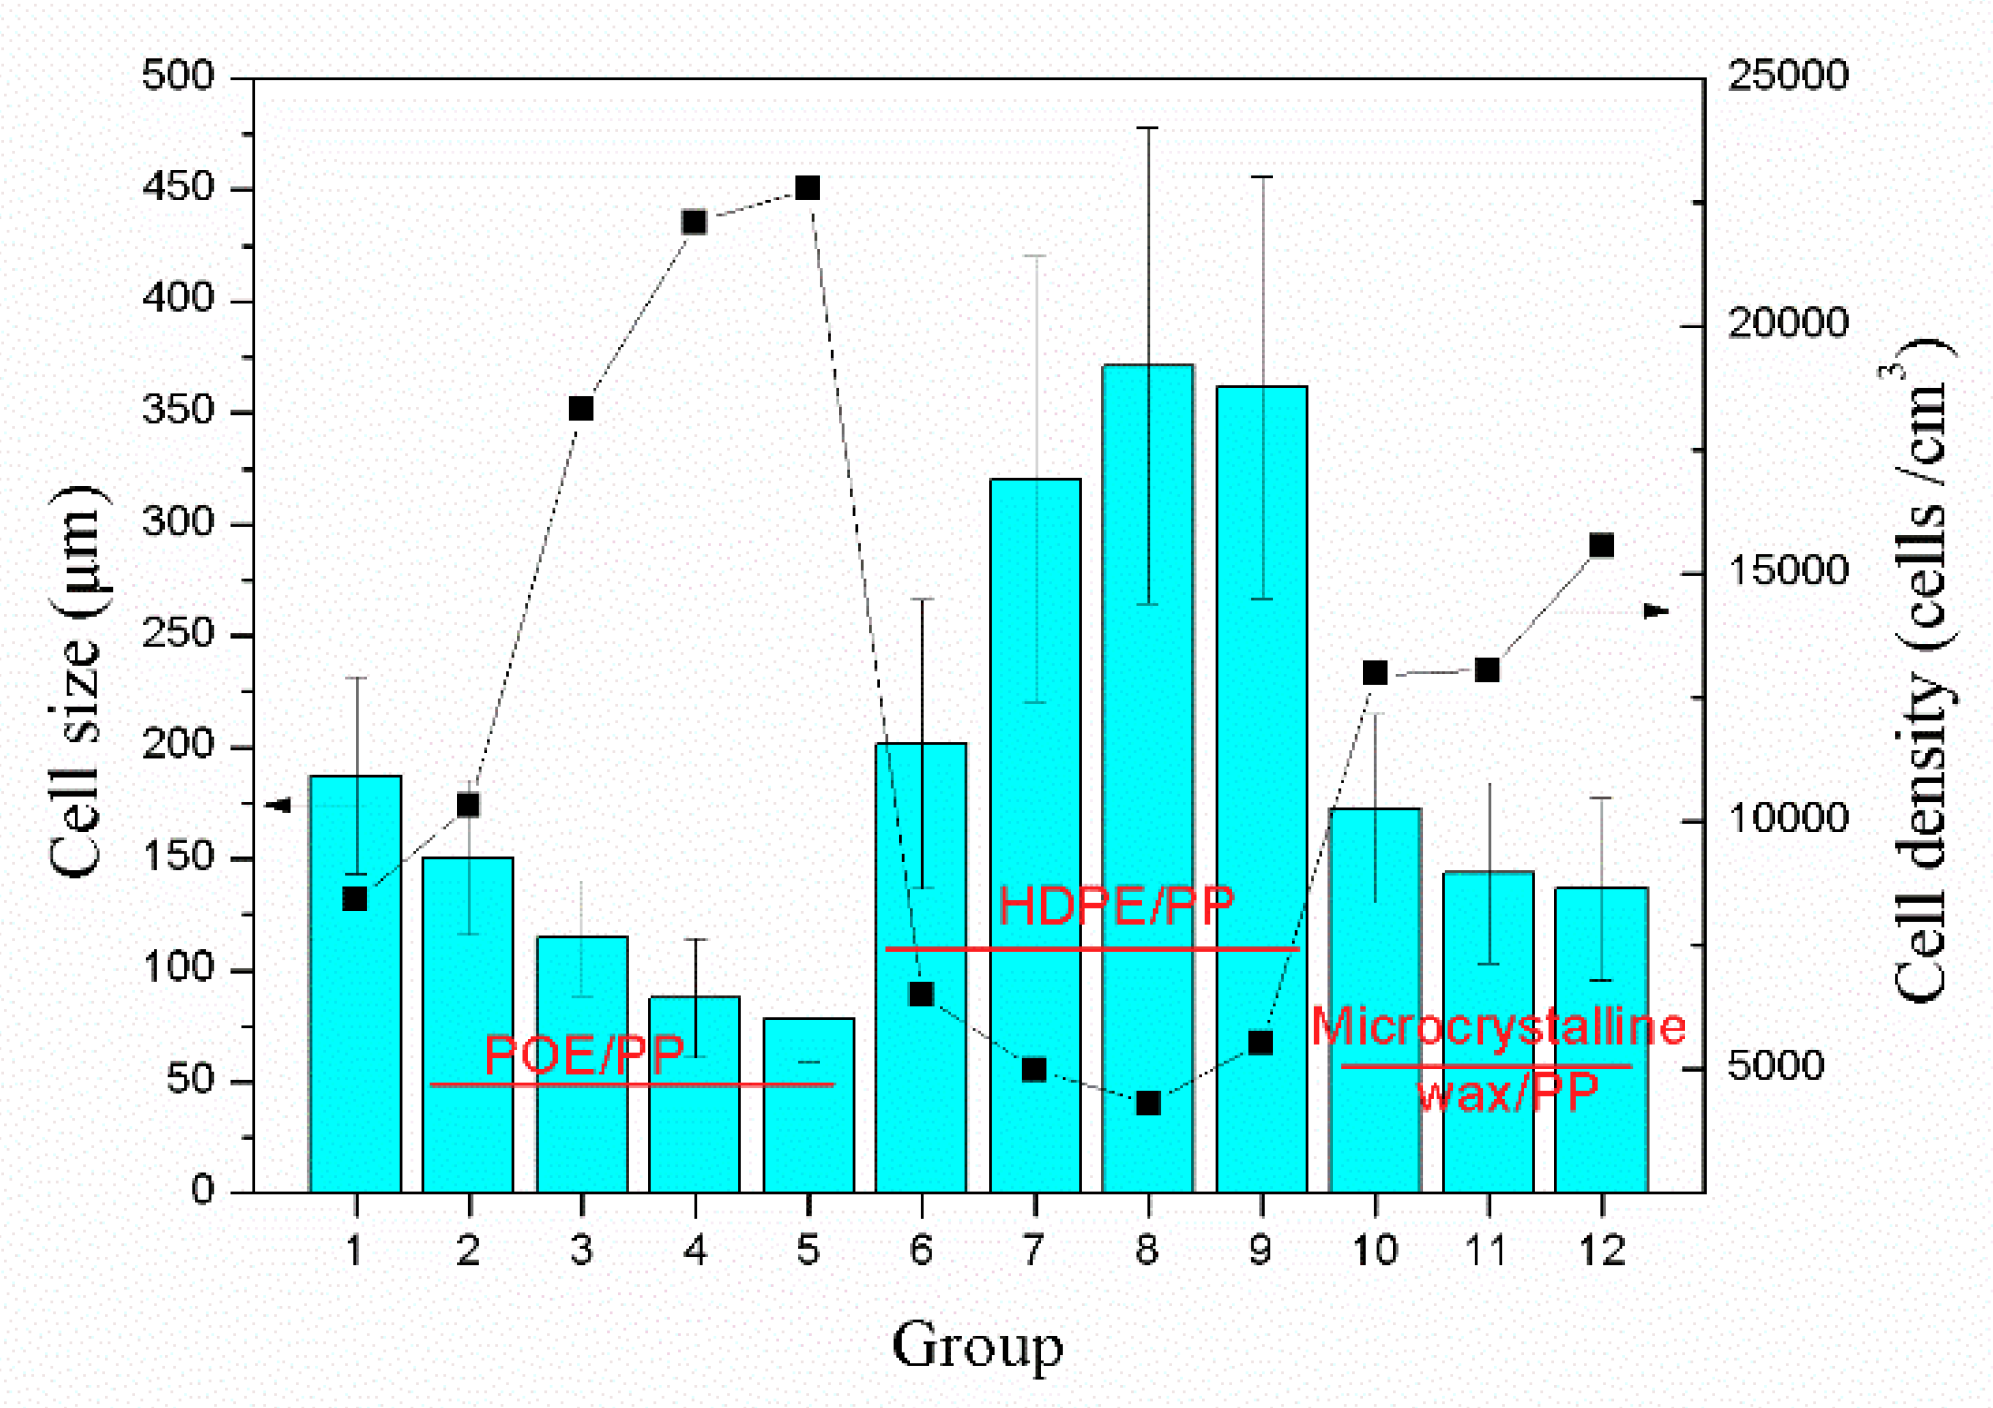
Figure 4 shows the microstructure of different samples and the cell size calculated by the micrographs is presented in Figure 5. According to the data in Figure 5, the addition of both POE and microcrystalline wax increased the cell population density and decreased the cell size of the samples. During the foaming process, the added microcrystalline wax acted as a lubricant to increase the uniformity of distribution of the wood flour in the resin matrix, which helped to avoid the combination of cells caused by wood powder agglomeration and helped to slightly improve the cell structure of the samples. Besides, the addition of POE could greatly improve the melt strength of composites, which contributed to increase the resistance of bubble expansion and avoid excessive expansion of the bubbles. When the blending ratio of POE and PP was 4/6, the cell size of sample reduced to 78 μm, which was reduced by 58% compared to the sample without blending. And the cell population density increased to 2.3 × 10⁵ cells/cm3, which was 170% higher than that of the sample without blending.
However, the addition of HDPE was responsible for the sharp decline in the cell population density and the great increase in the cell size. This is mainly because the reduced melt strength of the composites blended with HDPE made the cell wall become thinner during the extrusion process. On one hand, the thinner cell wall was unable to support the excessive expansion of the bubbles, which caused the merging of adjacent cells to form larger cells. On the other hand, the thinner cell wall could lead to the escape of gas used for bubble nucleation and bubble growth, which caused the collapse of bubbles and a slight decrease in the cell size [23].
According to the previous studies, the shape of bubbles in the cellular plastic prepared by batch foaming [24], injection molding foaming [25,26] or compression molding foaming is nearly spherical. However, compared with other methods, the shape of bubbles prepared by extrusion foaming was not very regular, which was mainly attributed to the fact that the materials were in a flowing state during the foaming process [27].
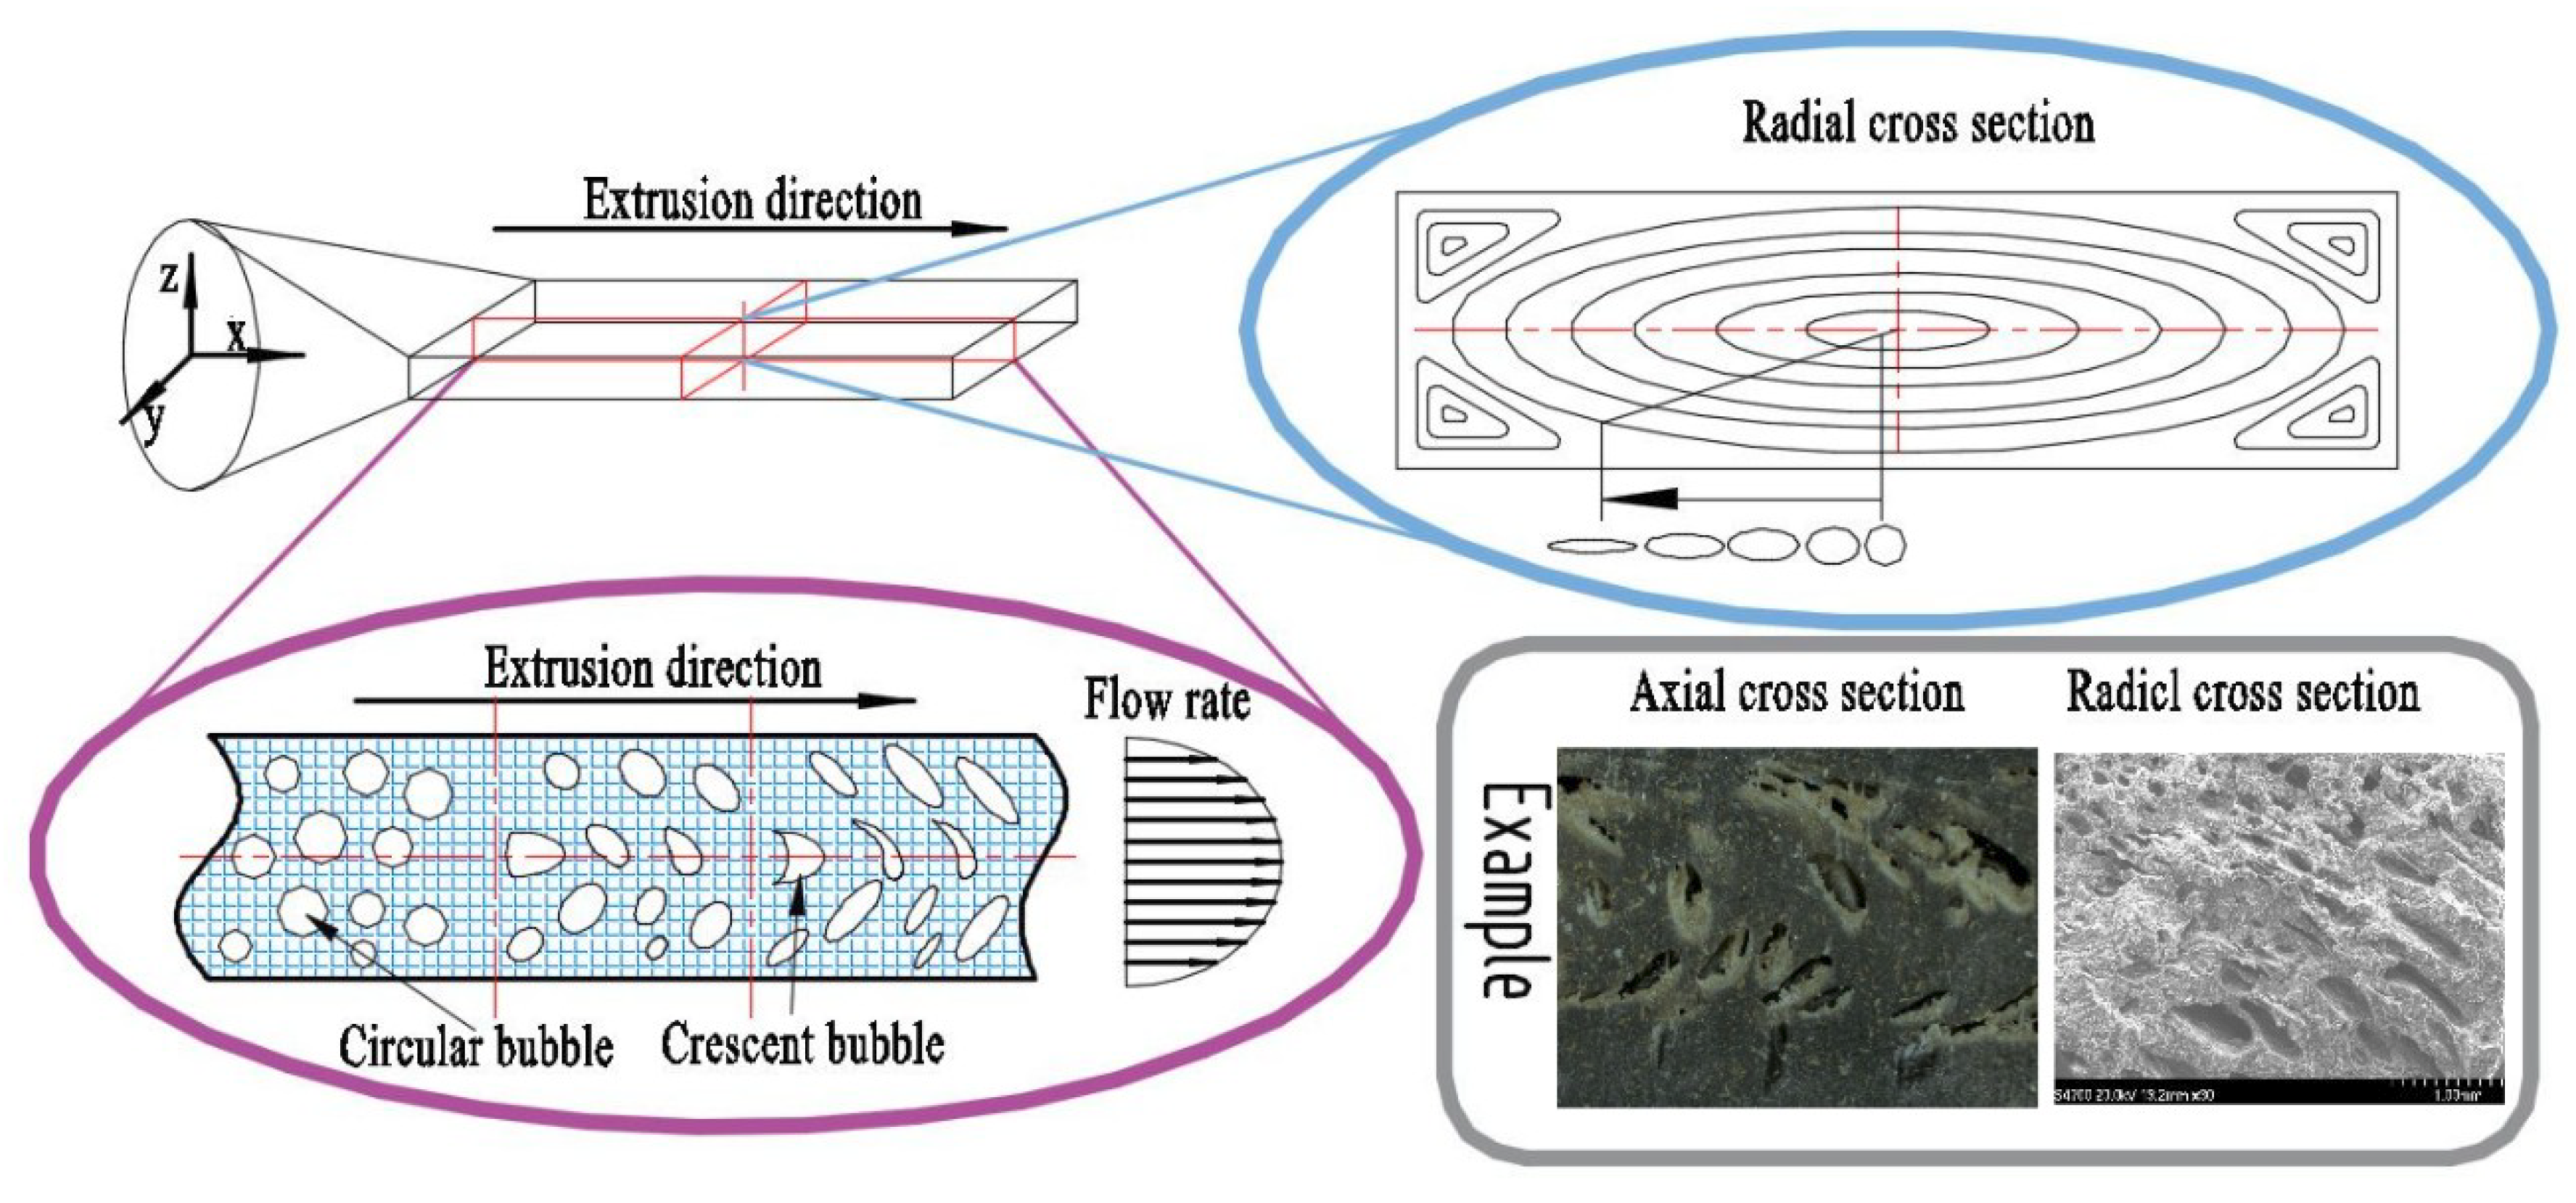
As shown in Figure 6, the molten materials in the sheet die flowed along the axial direction (x axis) under the action of the melt pump. Meanwhile, the flow rate of the materials showed parabola variation with the z axis and the maximum flow rate was achieved in the middle of flow channel. Due to the velocity difference along the z axis, the shape of bubbles on the cross section perpendicular to the y axis gradually changed from spherical to crescent during extrusion. Moreover, Figure 6 also shows the flow pattern of materials at the radial section. In the flow process, the bubbles in the flow field were gradually stretched along the flow direction into fusiform.

3.4. Mechanical Properties

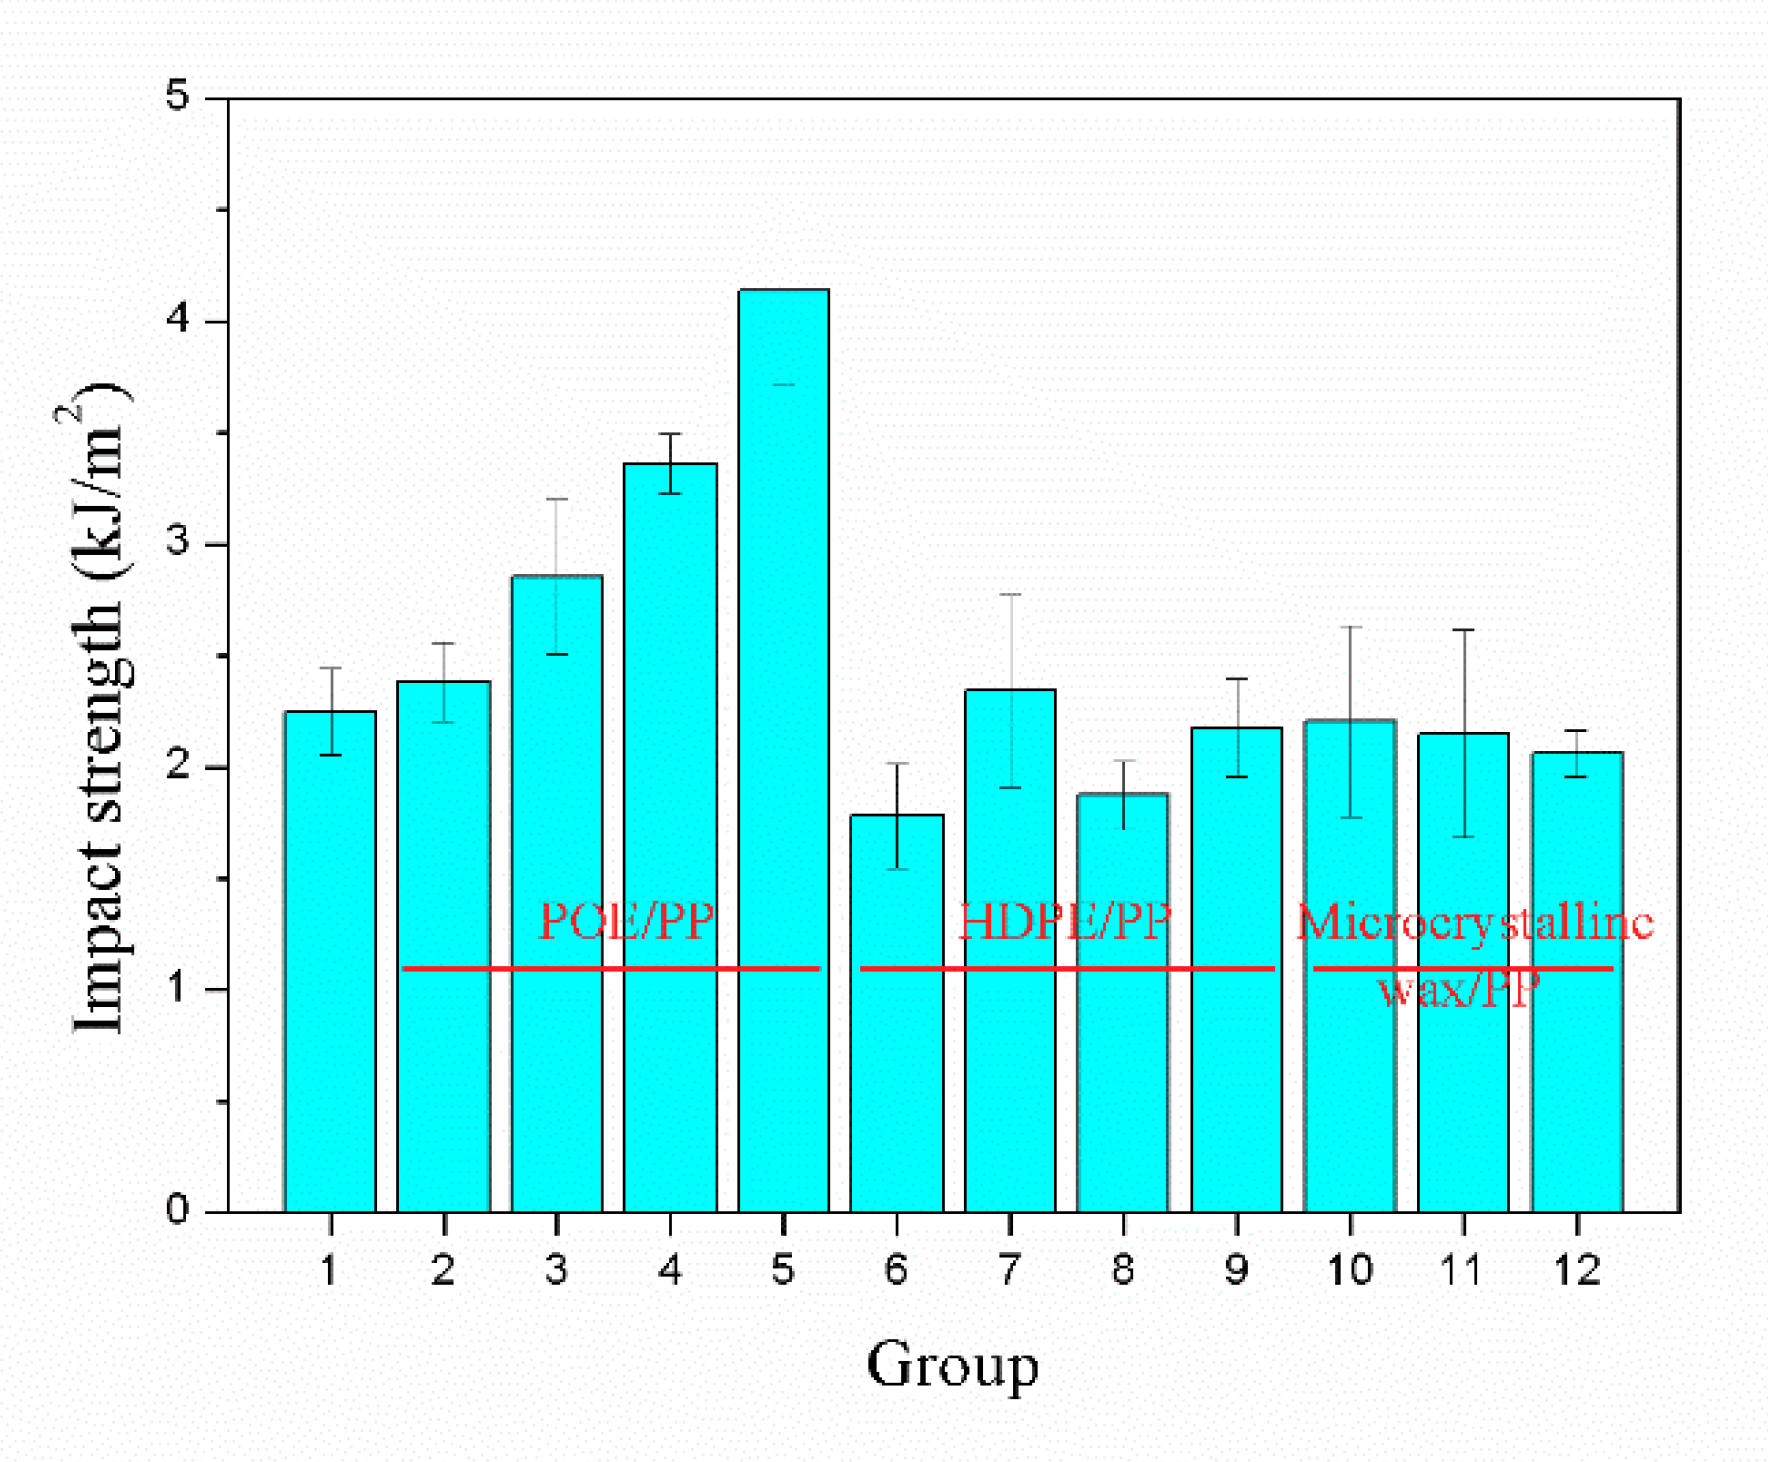
As shown in Figure 7, compared with HDPE and microcrystalline wax, the impact strength of the samples was significantly improved with the addition of POE. When the blending ratio of POE and PP was 4/6, the impact strength of the sample was 4.1 kJ/m2, which was 84% higher than that of the sample without blending. On one hand, the added POE helped to improve the ductility of PP/POE blend [12]. The POE particles dispersed in composites acted as stress concentration points when subjected to external impact loading, which could generate crazes and shear bands in matrix and consume a lot of energy. Meanwhile, the growth of crazes were hindered by the continuous branching of crazes and the interference of stress fields between crazes and shear bands [28]. On the other hand, the addition of POE contributed to improve the melt strength of composites, which helped to achieve a uniform microcellular structure. The microcellular structure in the samples could passivate the crack tip and thereby increase the impact strength of the samples.
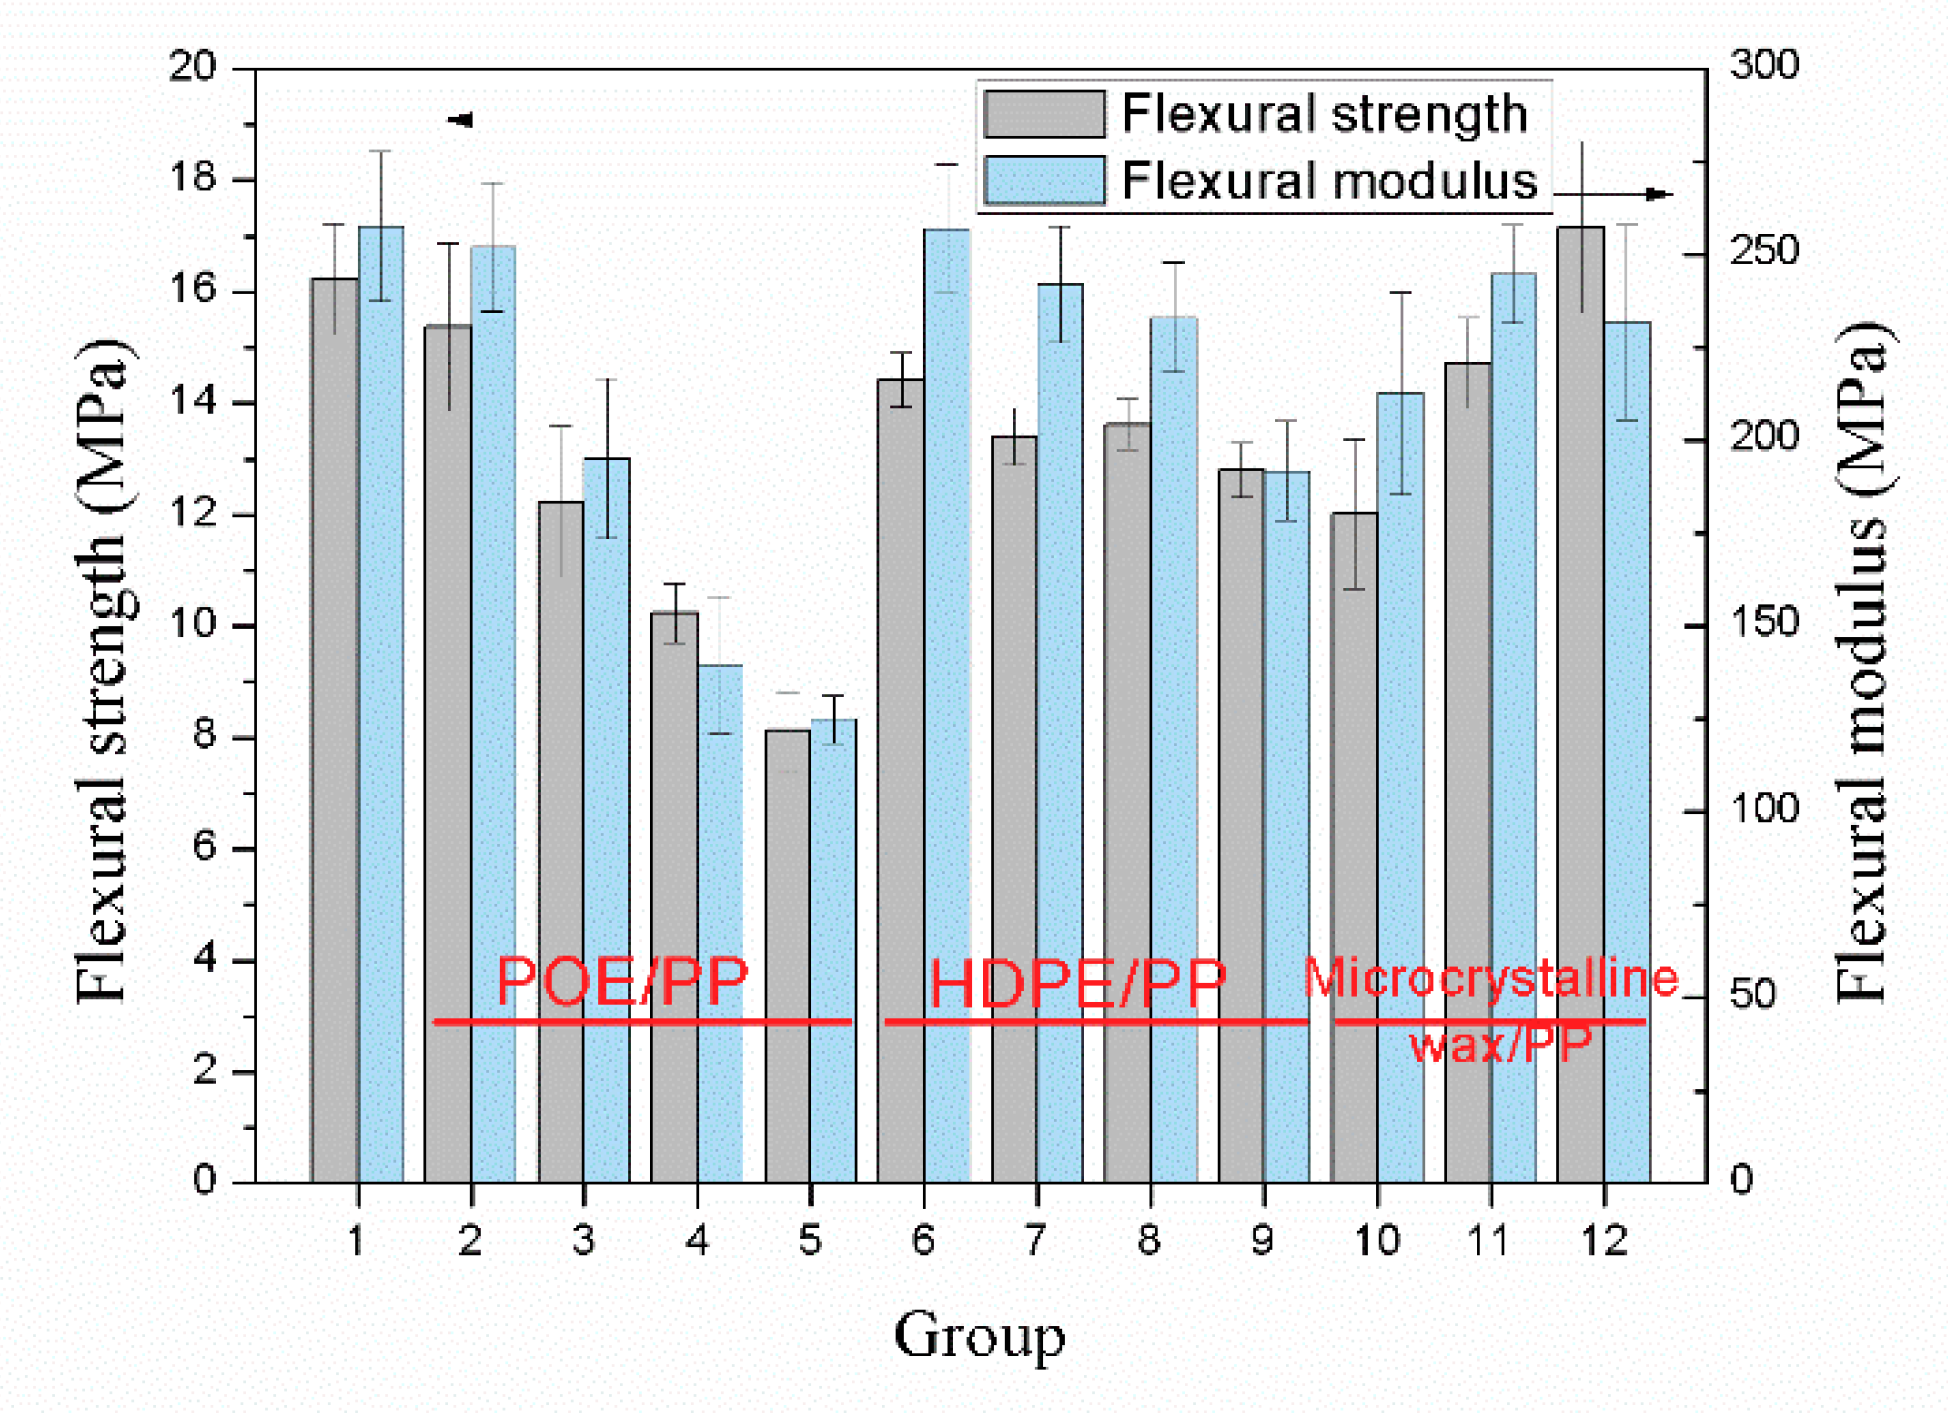
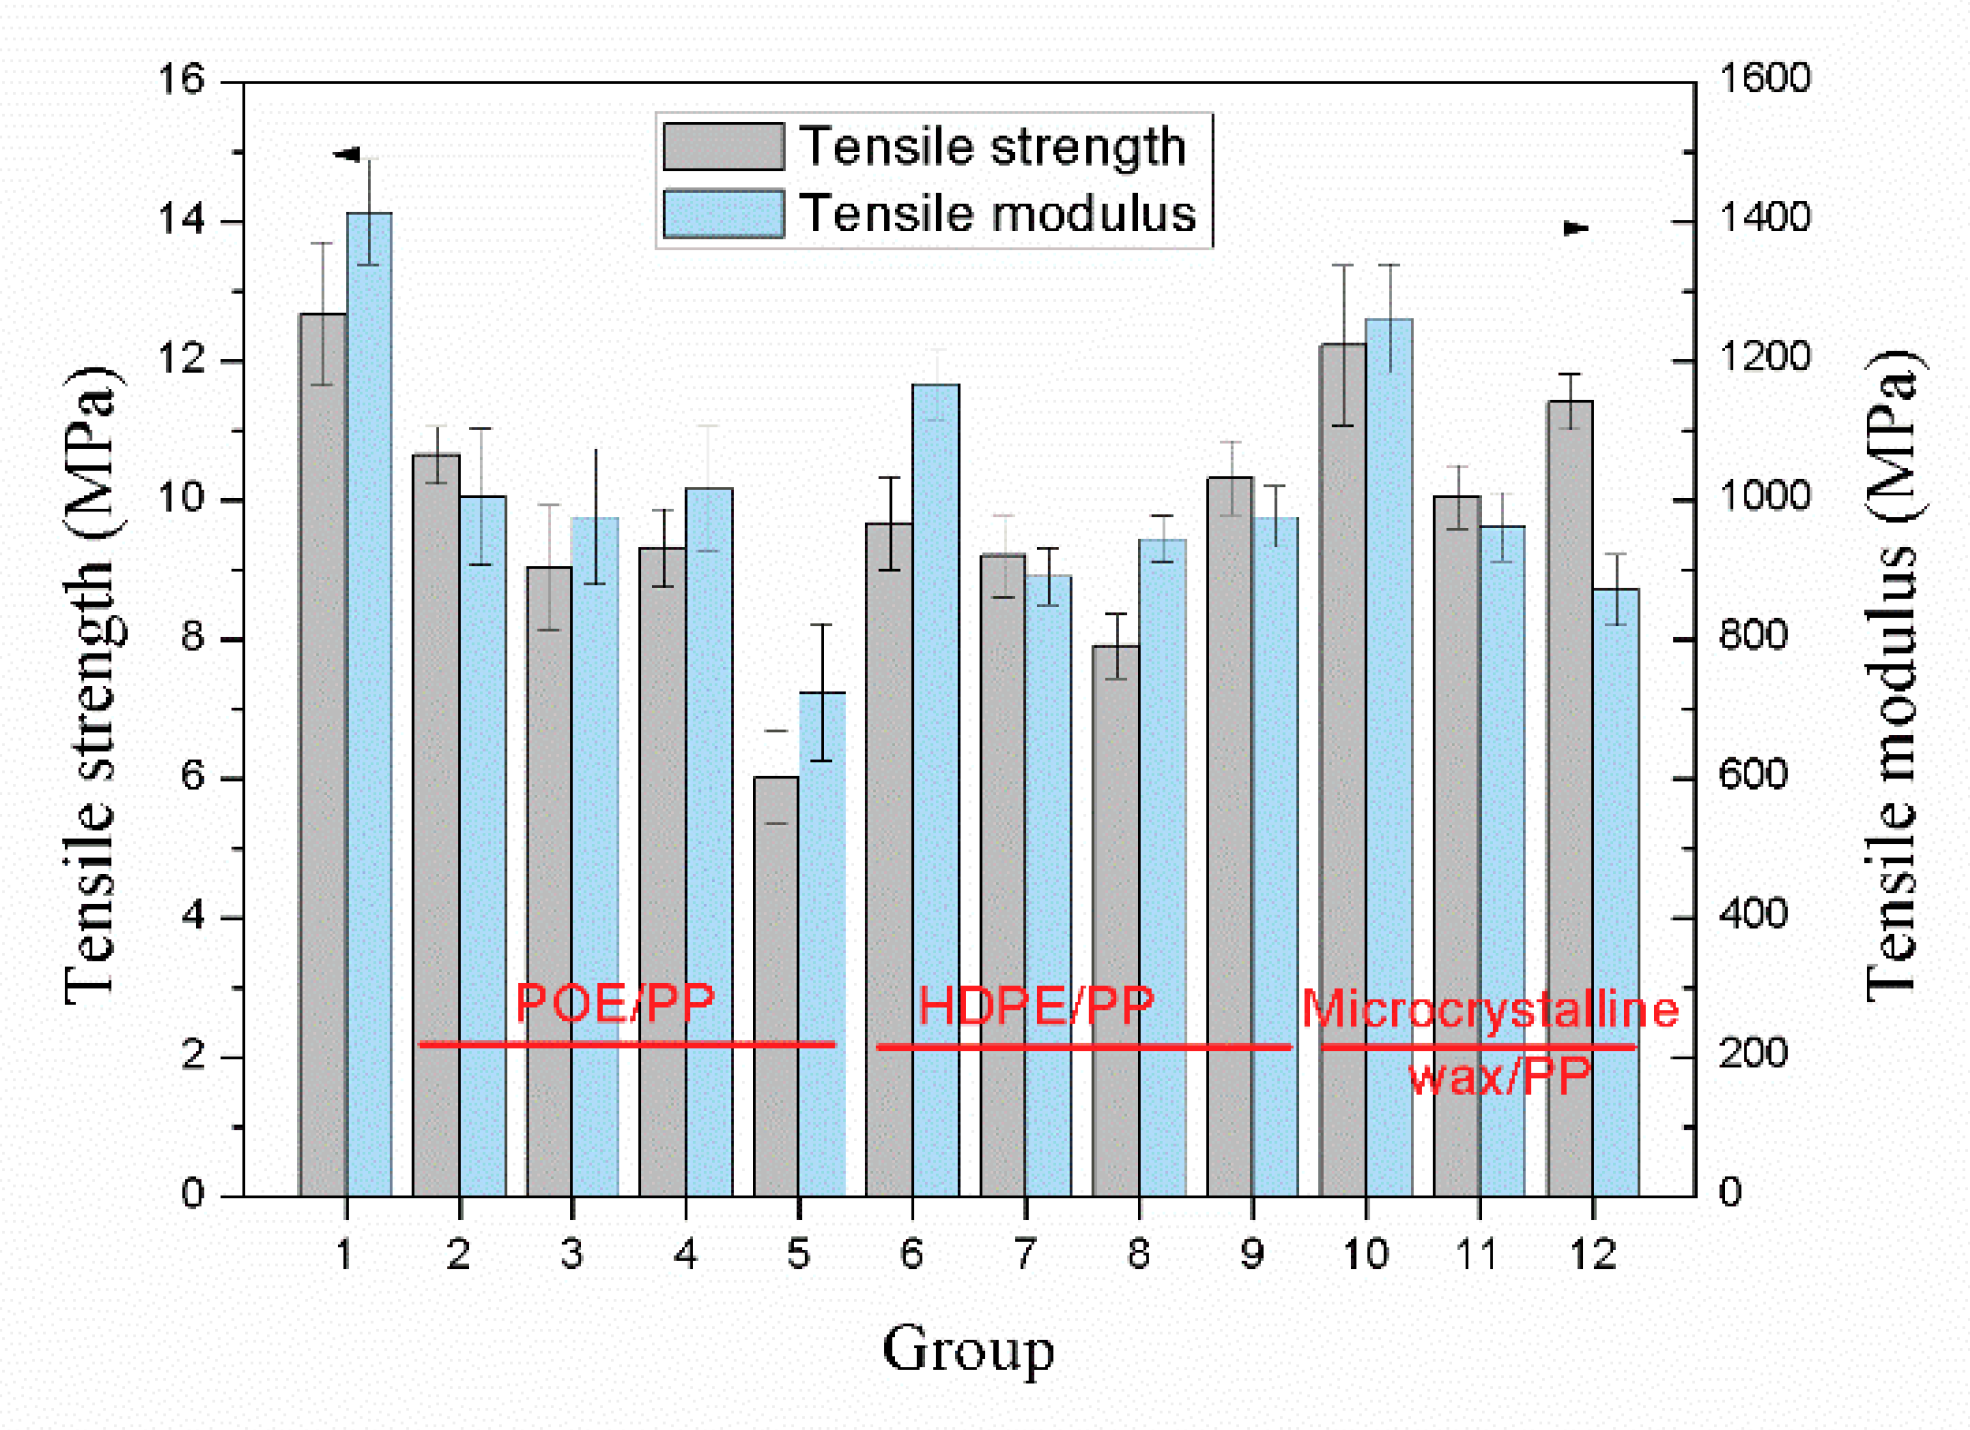
As shown in Figure 8 and Figure 9, blending with POE and HDPE significantly reduced the flexural strength and tensile strength of the samples. Compared with HDPE, the addition of POE had a greater impact on the mechanical properties of the samples. When the blending ratio of POE and PP was 4/6, the tensile strength and flexural strength of the sample were 6 MPa and 8.1 MPa, respectively, which were reduced by 34% and 50%, respectively, compared to the sample without blending. This is mainly determined by the performance of the POE itself. Although the addition of POE can effectively improve the cell structure of the sample, the poor mechanical strength of the POE itself greatly weakens the tensile and bending strength of the sample [29,30]. However, the effect of HDPE is completely opposite to that of POE. Although blending with HDPE cannot improve the cell structure of the sample, the better mechanical properties of HDPE compared to POE make the tensile and bending strength of the sample decrease less. In contrast, the addition of microcrystalline wax helped to improve the mechanical properties of the samples. When the blending ratio of microcrystalline wax and PP was 3/97, the tensile and flexural strengths of the sample were 11.4 MPa and 17.2 MPa, respectively, which were 25% and 6% higher than that of the sample without blending, respectively. On one hand, the content of microcrystalline wax is small, which makes the mechanical strength of the samples less affected by the performance of the microcrystalline wax itself. On the other hand, the addition of microcrystalline wax can slightly improve the cell structure of the samples.
Therefore, in the actual production process, the determination of POE content needs to consider the effect of POE on the ductility and mechanical strength of the samples.

3.5. Apparent Density and Vicat Softening Temperature

Figure 10 shows the apparent densities and Vicat softening temperatures of different samples, which were affected by the compositions of the polymer blends and the microstructure of samples.
As shown in Figure 10, the addition of POE caused the decrease of apparent densities of samples. When the mass ratio of POE to PP was 4/6, the apparent density of sample decreased by 6.7%. On one hand, the density of POE was smaller than PP. On the other hand, the addition of POE improved the melt strength of composites, which prevented the gas used for bubble nucleation and bubble growth from escaping from molten materials. Besides, the addition of microcrystalline wax also decreased the apparent densities of samples, which was similar with POE. However, with the increase of HDPE, the density of samples increased after an initial decrease and the minimum density was obtained at the mass ratio of 1/9, which was mainly due to the low melt strength leading to the loss of gas.
According to the data in Figure 10, the Vicat softening temperature of sample without polymer blends was 153.4 °C. But the Vicat softening temperature of sample decreased with the increase of the content of POE, HDPE or microcrystalline wax. On one hand, the Vicat softening temperatures of POE, HDPE and microcrystalline wax were lower than PP. On the other hand, the addition of POE, HDPE and microcrystalline wax decreased the crystallinity of PP, which also resulted in the decrease of the Vicat softening temperatures. When the mass ratio of HDPE to PP was 4/6, the Vicat softening temperature of the sample reached the minimum value 133.7 °C, which was 12.8% lower than that before blending.

4. Conclusions

In this study, the extrusion foaming process of PP/wood flour composites was studied. And the effects of the addition of POE, HDPE and microcrystalline wax on the rheological properties, cell morphology and mechanical properties of samples were investigated. The conclusions from this research are as follows:
  • The addition of HDPE and POE resulted in the two well-separated melting peaks in the DSC curves. But only POE could significantly increase both the oscillating shear modulus and the complex viscosity of the composites.
  • Compared with HDPE and microcrystalline wax, the sample with the introduction of POE could achieve the minimum cell size 78 μm and the maximum cell density 2.3 × 10⁴ cells/cm3, which caused a significant decrease of 58% in the cell size and a great increase of 170% in the cell population density. But the velocity difference of composites flowing in the sheet die made the shape of bubbles irregular. The bubbles on the radial section were stretched into the shape similar with the convex lens. Besides, the bubbles gradually became crescent-shaped along the extrusion direction.
  • Compared with the tensile and flexural property, the impact strength of the samples was significantly improved with the addition of POE. And the impact strength of sample blended with POE at the ratio of 6/4 increased by 84% compared with the sample without blending. Besides, the addition of microcrystalline wax contributed to the minimum apparent density of sample with the decline of 9%. Meanwhile, among the three polymer blends, the addition of HDPE contributed to the minimum Vicat softening temperature 133.7 °C at the blending ratio of 6/4.
However, compared with the samples prepared by the batching foaming process [31,32,33], the foamed wood-plastic samples prepared in this article have not reached the standard of microporous plastics in terms of cell size and cell density. Therefore, the future research needs to focus on the effects of the nucleating agent, interface modification and other aspects, so as to realize the preparation of microporous wood-plastic products with large cross-section. And the wood-plastic products with micro-porous structure can meet the requirements of high strength and light weight components in automotive, high-speed rail, aerospace, military and other fields by virtue of their excellent cost-effective ratio and high specific strength.

Author Contributions

Conceptualization, P.X. and M.J.; methodology, S.W.; software, S.W. and J.T.; validation, S.W., J.T. and R.Z.; formal analysis, S.W.; investigation, J.T.; resources, R.Z.; data curation, S.W.; writing—original draft preparation, S.W.; writing—review and editing, P.X. and M.J.; visualization, S.W.; supervision, P.X. and M.J.; project administration, P.X.; funding acquisition, M.J.

Funding

This research received no external funding.

Conflicts of Interest

The authors declare no conflict of interest.

Nomenclature

PPPolypropylene H f Heat of fusion generated by the cold crystallization
WFWood flour H f o Theoretical heat of fusion of 100% crystalline PP
POEPolyolefin elastomerωWeight fraction of PP in the sample
HDPEHigh-density polyethyleneG′Shear storage modulus
DSCDifferential Scanning CalorimeterG″Loss modulus
PVCPolyvinyl chlorideηComplex viscosity
PSPolystyrene d ¯ Number average diameter of all cells in one micrograph
PBTPolybutylene terephthalatediDiameter of a single cell
PTFEPolytetrafluoroethylenenNumber of counted cells
MAH-g-PPMaleic anhydride-g-PPN0Number of cells per unit volume of the polymer
ACAzodicarbonamideAArea of an SEM graph
WPCWood-polymer compositesMMagnification factor
TmMelting temperature ρ 0 Density of the unfoamed sample
TcCrystallization temperature ρ f Density of the foamed sample
XcCrystallinity percentageHDTHot Deformation Temperature

References

  1. Zhang, S.; Rodrigue, D.; Riedl, B. Preparation and morphology of polypropylene/wood flour composite foams via extrusion. Polym. Compos. 2010, 26, 731–738. [Google Scholar] [CrossRef]
  2. Atas, C.; Sevim, C. On the impact response of sandwich composites with cores of balsa wood and PVC foam. Compos. Struct. 2011, 93, 40–48. [Google Scholar] [CrossRef]
  3. Petchwattana, N.; Covavisaruch, S.J.M. Influences of particle sizes and contents of chemical blowing agents on foaming wood plastic composites prepared from poly(vinyl chloride) and rice hull. Mater. Des. 2011, 32, 2844–2850. [Google Scholar] [CrossRef]
  4. Shalbafan, A. Investigation of Foam Materials to be Used in Lightweight Wood Based Composites; University of Hamburg: Hamburg, Germany, 2013. [Google Scholar]
  5. Ichazo, M.N.; Albano, C.; González, J.; Perera, R.; Candal, M.V. Polypropylene/wood flour composites: Treatments and properties. Compos. Struct. 2001, 54, 207–214. [Google Scholar] [CrossRef]
  6. Mohanty, S.; Nayak, S.K.; Verma, S.K.; Tripathy, S.S. Effect of MAPP as a coupling agent on the performance of jute-PP Composites. J. Reinf. Plast. Comp. 2004, 23, 625–637. [Google Scholar] [CrossRef]
  7. Feng, D.; Caulfield, D.F.; Sanadi, A.R. Effect of compatibilizer on the structure-property relationships of kenaf-fiber/polypropylene composites. Polym. Compos. 2010, 22, 506–517. [Google Scholar] [CrossRef]
  8. Rachtanapun, P.; Selke, S.E.M.; Matuana, L.M. Microcellular foam of polymer blends of HDPE/PP and their composites with wood fiber. J. Appl. Polym. Sci. 2010, 88, 2842–2850. [Google Scholar] [CrossRef]
  9. Luo, Y.; Xin, C.; Yang, Z.; Yan, B.; Li, Z.; Li, X.; He, Y. Solid-state foaming of isotactic polypropylene and its composites with spherical or fibrous poly(butylenes terephthalate). J. Appl. Polym. Sci. 2015, 132. [Google Scholar] [CrossRef]
  10. Rizvi, A.; Tabatabaei, A.; Barzegari, M.R. In situ fibrillation of CO2-philic polymers: Sustainable route to polymer foams in a continuous process. Polymer 2013, 54, 4645–4652. [Google Scholar] [CrossRef]
  11. Ali, R.; Chu, R.K.M.; Lee, J.H.; Park, C.B. Superhydrophobic and oleophilic open-cell foams from fibrillar blends of polypropylene and polytetrafluoroethylene. ACS Appl. Mater. Interfaces 2014, 6, 21131–21140. [Google Scholar]
  12. Yang, J.; Zhang, Y.; Zhang, Y.J.P. Brittle-ductile transition of PP/POE blends in both impact and high speed tensile tests. Polymer 2003, 44, 5047–5052. [Google Scholar] [CrossRef]
  13. Gao, Y.; Li, J.; Li, Y.; Yuan, Y.Q.; Huang, S.H.; Du, B.X. Effect of elastomer type on electrical and mechanical properties of polypropylene/elastomer blends. In Proceedings of the 2017 International Symposium on Electrical Insulating Materials (ISEIM), Toyohashi City, Japan, 11–15 September 2017; pp. 574–577. [Google Scholar]
  14. Grosso, G.; Hulsen, M.A.; Fard, A.S.; Overend, A.; Anderson, P.D.; Grosso, G.; Hulsen, M.A.; Fard, A.S.; Overend, A.; Anderson, P.D. Mixing processes in the cavity transfer mixer: A thorough study. AIChE J. 2017, 64, 1034–1048. [Google Scholar] [CrossRef] [Green Version]
  15. Kong, W.L.; Bao, J.B.; Wang, J.; Hu, G.H.; Xu, Y.; Zhao, L. Preparation of open-cell polymer foams by CO2 assisted foaming of polymer blends. Polymer 2016, 90, 331–341. [Google Scholar] [CrossRef]
  16. Chen, T.; Xue, P.; Jia, M. The property of polycarbonate/acrylonitrile butadiene styrene-based conductive composites filled by nickel-coated carbon fiber and nickel-graphite powder. Polym. Compos. 2017, 38, 157–163. [Google Scholar] [CrossRef]
  17. Wang, J.; Chen, D. Microcellular polypropylene single-polymer composites prepared by insert-microcellular injection molding. Compos. Part A Appl. Sci. Manuf. 2016, 90, 567–576. [Google Scholar] [CrossRef]
  18. Rachtanapun, P.; Selke, S.E.M.; Matuana, L.M. Characterization of microcellular foamed polyolefin blend composites with wood fiber. Int. J. Polym. Mater. 2004, 53, 971–983. [Google Scholar] [CrossRef]
  19. Zhang, P.; Zhou, N.Q.; Wu, Q.F.; Wang, M.Y.; Peng, X.F. Microcellular foaming of PE/PP blends. J. Appl. Polym. Sci. 2010, 104, 4149–4159. [Google Scholar] [CrossRef]
  20. Guo, Y.X.; Ren, X.L.; Wang, B.B.; Guo-Sheng, H.U. Isothermal crystallization behavior of in-situ crosslinking modified PP/POE composites. J. Biomater. Sci.-Polym. E 2010, 26, 46–49. [Google Scholar]
  21. Salimi, A. Characterization of nano scale adhesion at solid surface of oxidized PP wax/PP blends. Int. J. Adhes. Adhes. 2012, 33, 61–66. [Google Scholar] [CrossRef]
  22. Souza, A.M.C.; Demarquette, N.R. Influence of composition on the linear viscoelastic behavior and morphology of PP/HDPE blends. Polymer 2002, 43, 1313–1321. [Google Scholar] [CrossRef]
  23. Wang, M.; Xie, L.; Qian, B.; Ma, Y.; Zhou, N. Extrusion foaming behavior of a polypropylene/nanoclay microcellular foam. J. Appl. Polym. Sci. 2016, 133. [Google Scholar] [CrossRef]
  24. Jiang, X.L.; Liu, T.; Xu, Z.M.; Zhao, L.; Hu, G.H.; Yuan, W.K. Effects of crystal structure on the foaming of isotactic polypropylene using supercritical carbon dioxide as a foaming agent. J. Supercrit. Fluid 2009, 48, 167–175. [Google Scholar] [CrossRef]
  25. Ameli, A.; Nofar, M.; Jahani, D.; Rizvi, G.; Park, C.B. Development of high void fraction polylactide composite foams using injection molding: Crystallization and foaming behaviors. Chem. Eng. J. 2015, 262, 78–87. [Google Scholar] [CrossRef]
  26. Zhou, Y.; Gong, W.; He, L. Application of a novel organic nucleating agent: Cucurbit[6]uril to improve polypropylene injection foaming behavior and their physical properties. J. Appl. Polym. Polym. Sci. 2017, 134. [Google Scholar] [CrossRef]
  27. Jung, P.U. Development of Innovative Gas-Assisted Foam Injection Molding Technology; University of Toronto: Toronto, ON, Canada, 2014. [Google Scholar]
  28. Qiang, F.; Wang, G. Polyethylene toughened by rigid inorganic particles. Polym. Eng. Sci. 2010, 32, 94–97. [Google Scholar]
  29. Chiu, F.-C.; Fu, S.-W.; Chuang, W.-T.; Sheu, H.-S. Fabrication and characterization of polyamide 6,6/organo-montmorillonite nanocomposites with and without a maleated polyolefin elastomer as a toughener. Polymer 2008, 49, 1015–1026. [Google Scholar] [CrossRef]
  30. Du, B.X.; Xu, H.; Li, J. Effects of mechanical stretching on space charge behaviors of PP/POE blend for HVDC cables. IEEE Trans. Dielect. Electr. Insul. 2017, 24, 1438–1445. [Google Scholar] [CrossRef]
  31. Xu, Y.; Zhang, S.; Peng, X.; Wang, J. Fabrication and mechanism of poly(butylene succinate) urethane ionomer microcellular foams with high thermal insulation and compressive feature. Eur. Polym. J. 2018, 99, 250–258. [Google Scholar] [CrossRef]
  32. Ding, Y.; Ying, S.; Xiao, Z.; Wu, X. Cell structure of microcellular combustible object foamed by supercritical carbon dioxide. Def. Technol. 2018, 14, 1–7. [Google Scholar] [CrossRef]
  33. Blanca, S.P.; Miriam, T.L.; Cipriano, R.; María, T.S.; Jesús, L.P.; Félix, C.G.; José, A.R.; José, M.G. Microcellular foamed aromatic polyamides (aramids). Structure, thermal and mechanical properties. Eur. Polym. J. 2019, 110, 9–13. [Google Scholar]
Figure 1. Schematic diagram of the single-screw extruder foaming system.
Materials 12 01971 g001
Figure 2. DSC thermograms and results of the samples with different polymer blends: (a) DSC thermograms, (b) DSC results.
Materials 12 01971 g002
Figure 3. Rheological properties of the samples with different polymer blends: (a) storage modulus (G′), (b) loss modulus (G″), (c) complex viscosity (η).
Materials 12 01971 g003aMaterials 12 01971 g003b
Figure 4. Cell morphology of the foaming samples with different polymer blends: (a) sample 1, (b) sample 2, (c) sample 3, (d) sample 4, (e) sample 5, (f) sample 6, (g) sample 7, (h) sample 8, (i) sample 9, (j) sample 10, (k) sample 11, (l) sample 12.
Materials 12 01971 g004aMaterials 12 01971 g004bMaterials 12 01971 g004c
Figure 5. Cell size and cell density of the foaming samples with different polymer blends.
Materials 12 01971 g005
Figure 6. Schematic illustration of cell formation in the sheet die.
Materials 12 01971 g006
Figure 7. Notched impact strength of the samples with different polymer blends.
Materials 12 01971 g007
Figure 8. Flexural strength and modulus of the samples with different polymer blends.
Materials 12 01971 g008
Figure 9. Tensile strength and modulus of the samples with different polymer blends.
Materials 12 01971 g009
Figure 10. Density and Vicat softening point of the samples with different polymer blends.
Materials 12 01971 g010
Table 1. Compositions of the polymer blends.
SampleWeight (%)
PPPOEHDPEMicrocrystalline Wax
1100---
29010--
38020--
47030--
56040--
690-10-
780-20-
870-30-
960-40-
1099--1
1198--2
1297--3