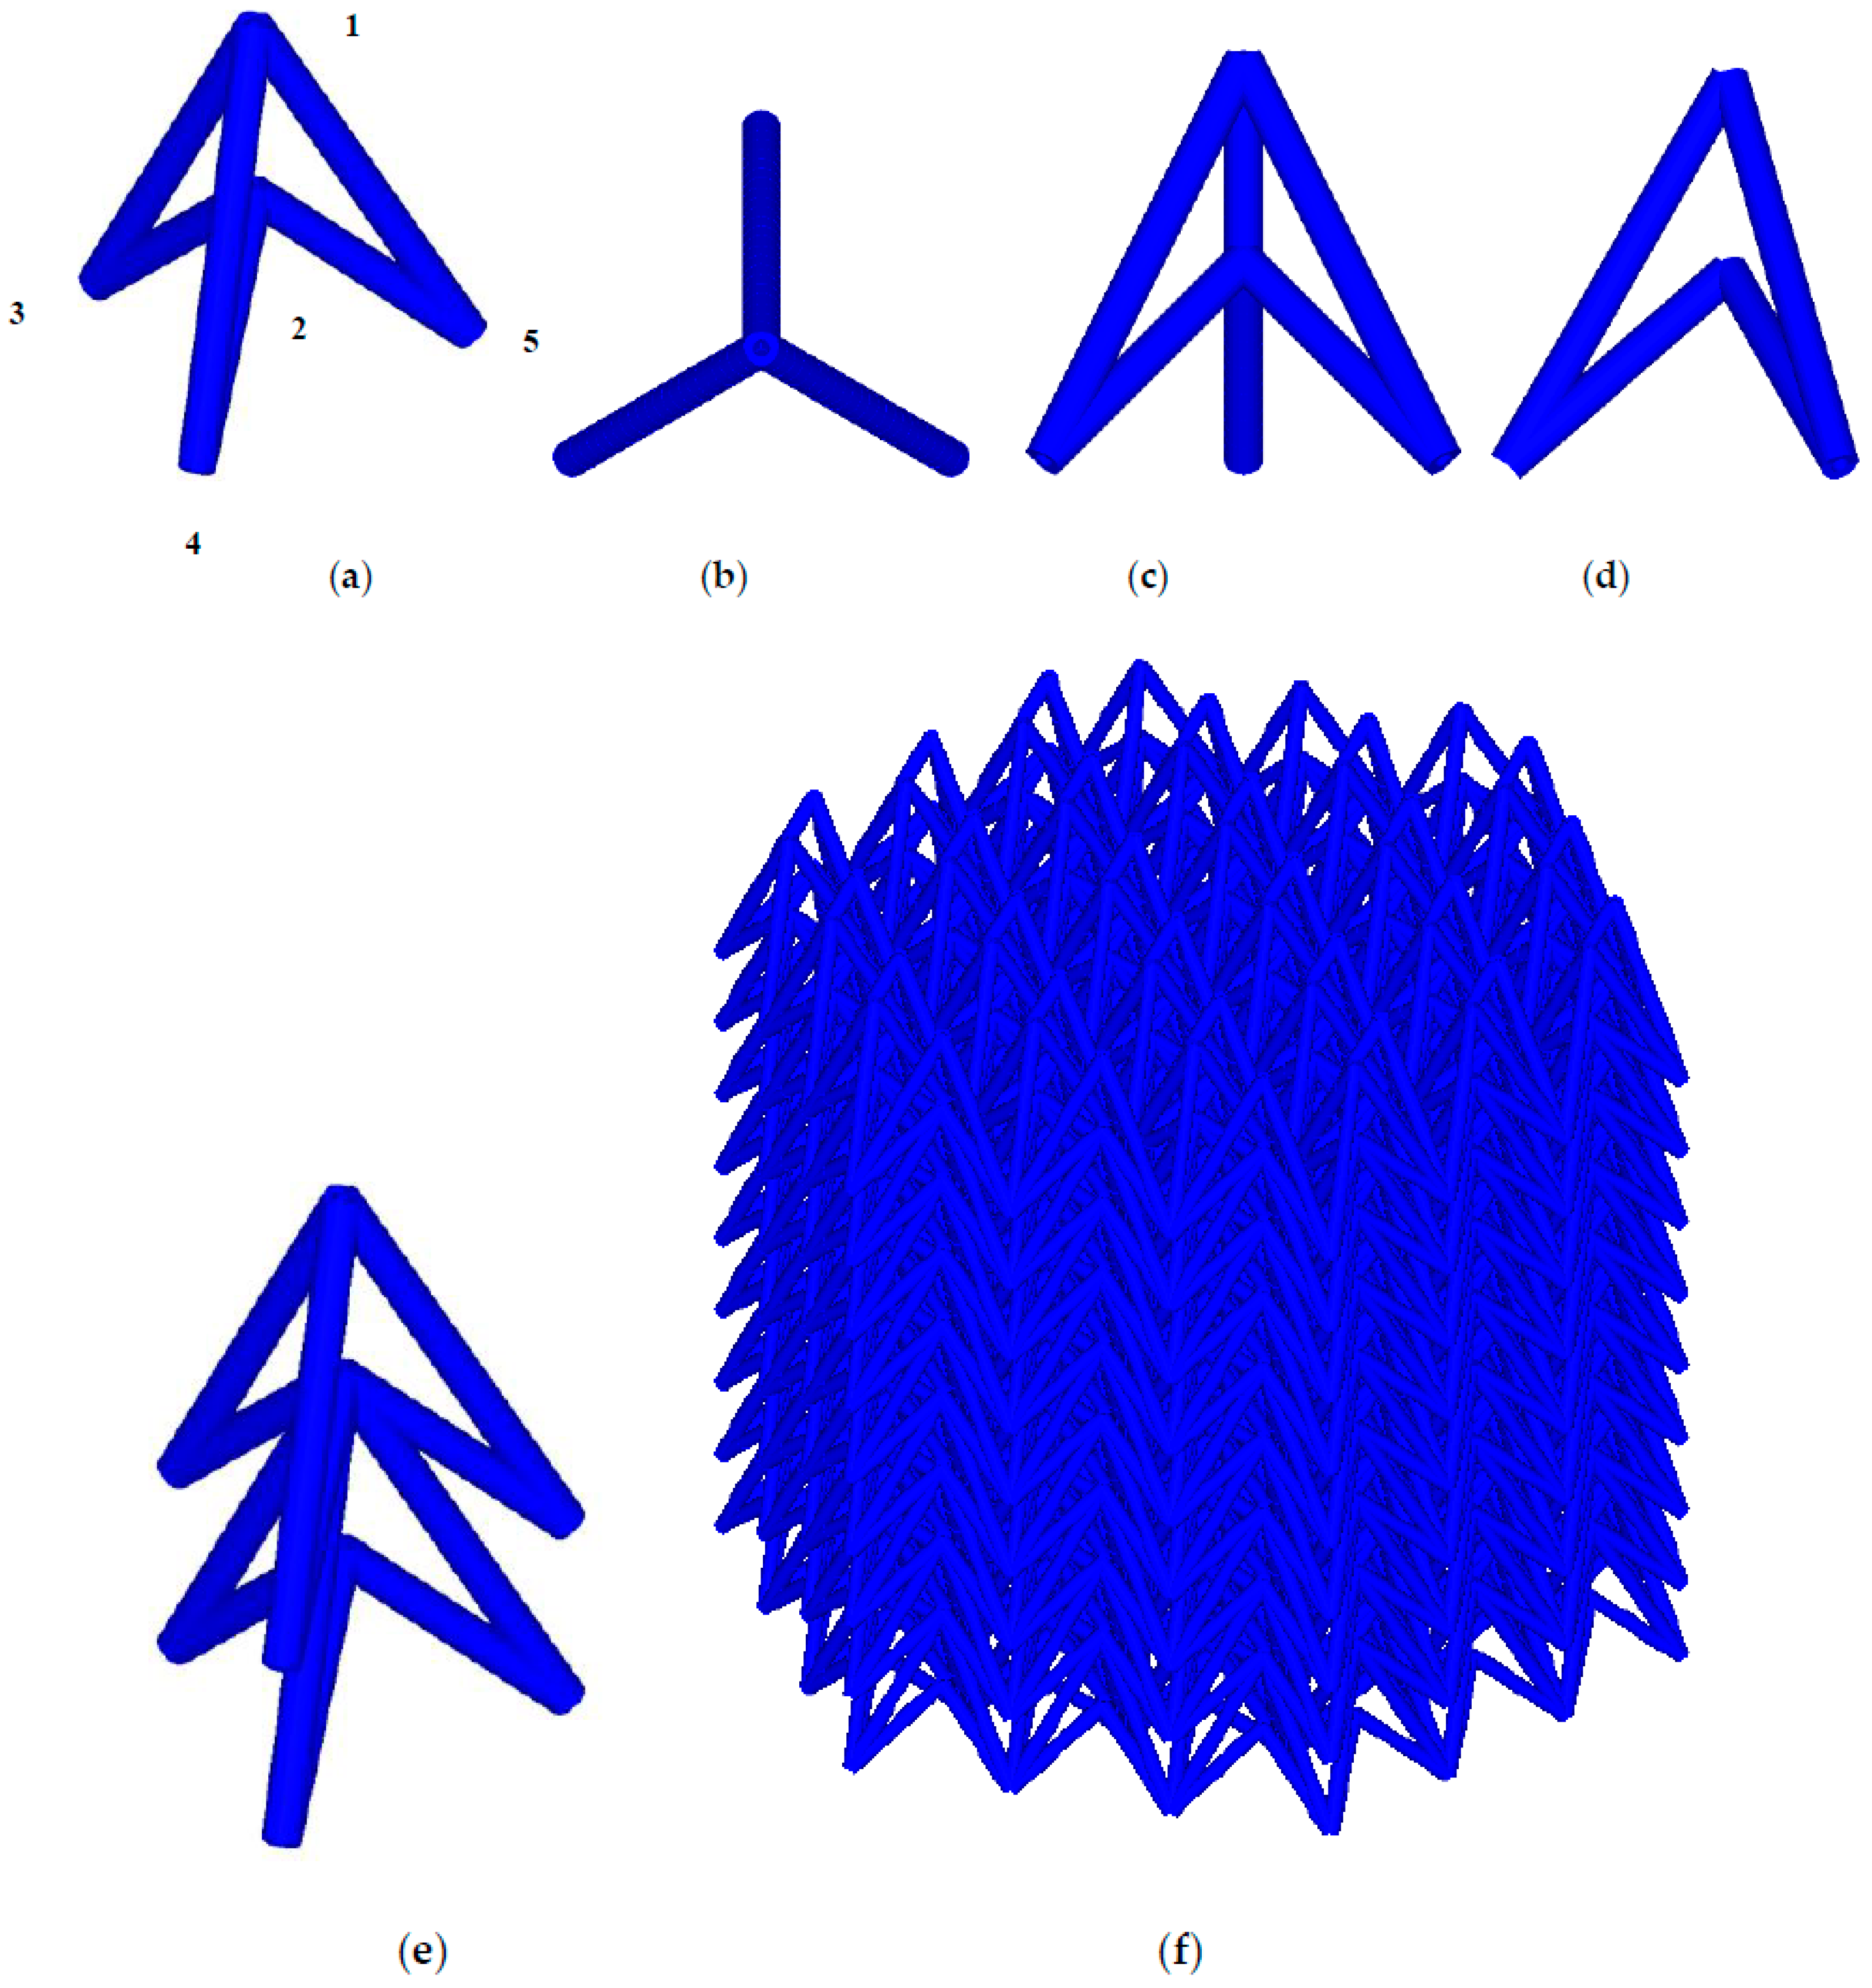
Figure 1.
The schematic of Type A lattice in: (a) 3D viewpoint; (b) top view (c) front view; (d) left view; and (e) an array.
Figure 1.
The schematic of Type A lattice in: (a) 3D viewpoint; (b) top view (c) front view; (d) left view; and (e) an array.
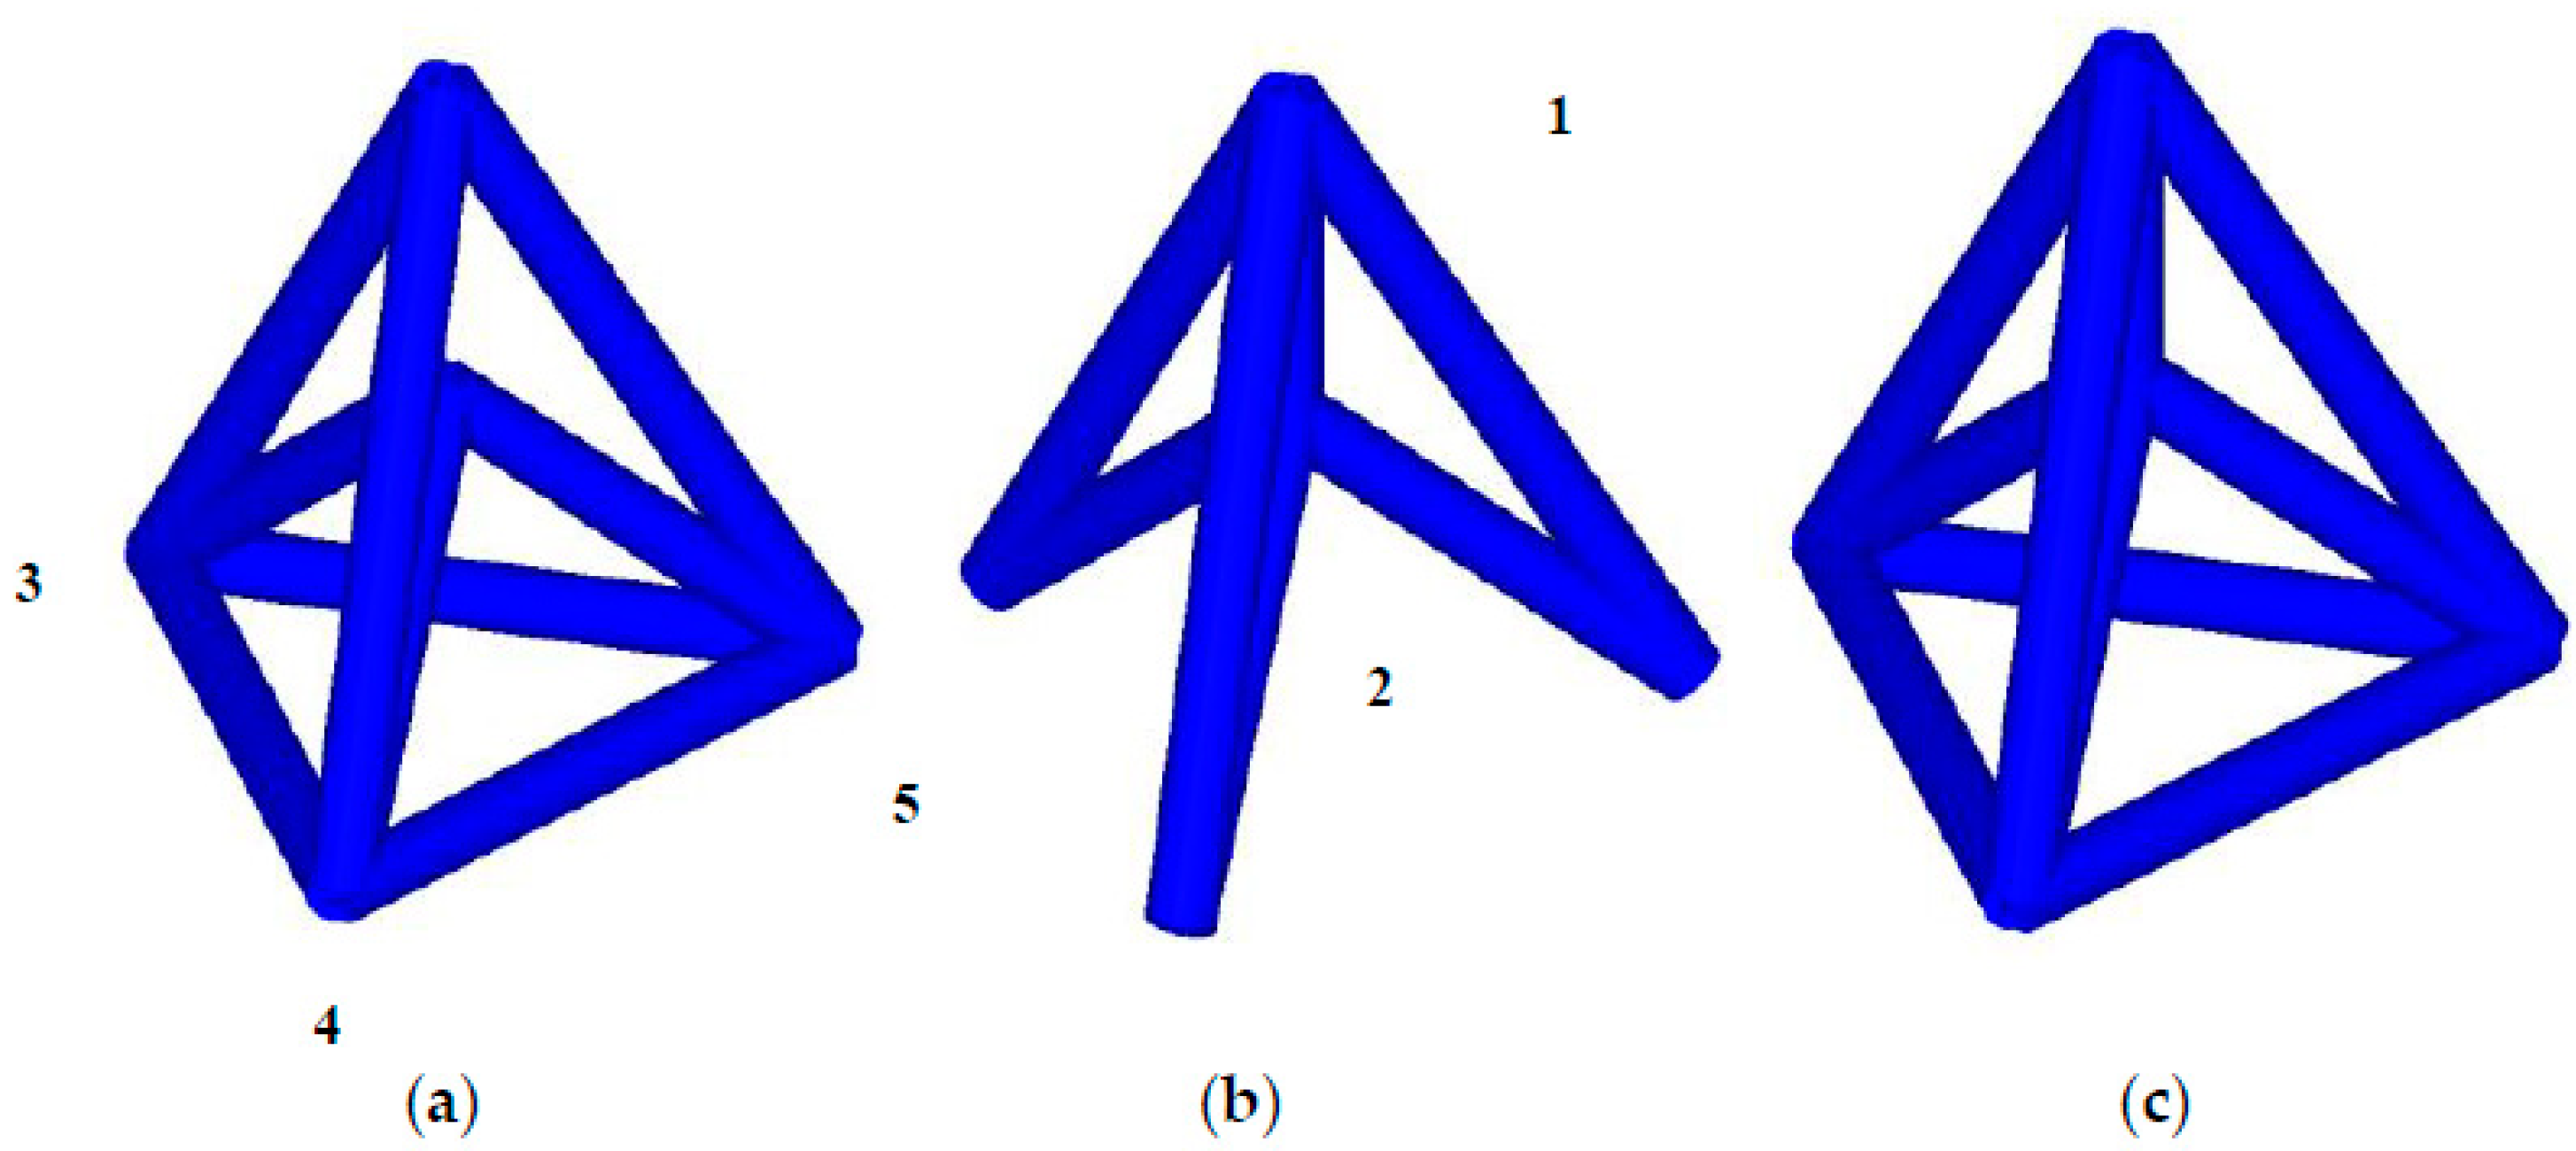
Figure 2.
The schematic of a lattice in the shape of (a) Type B; (b) Type C; and (c) Type D.
Figure 2.
The schematic of a lattice in the shape of (a) Type B; (b) Type C; and (c) Type D.
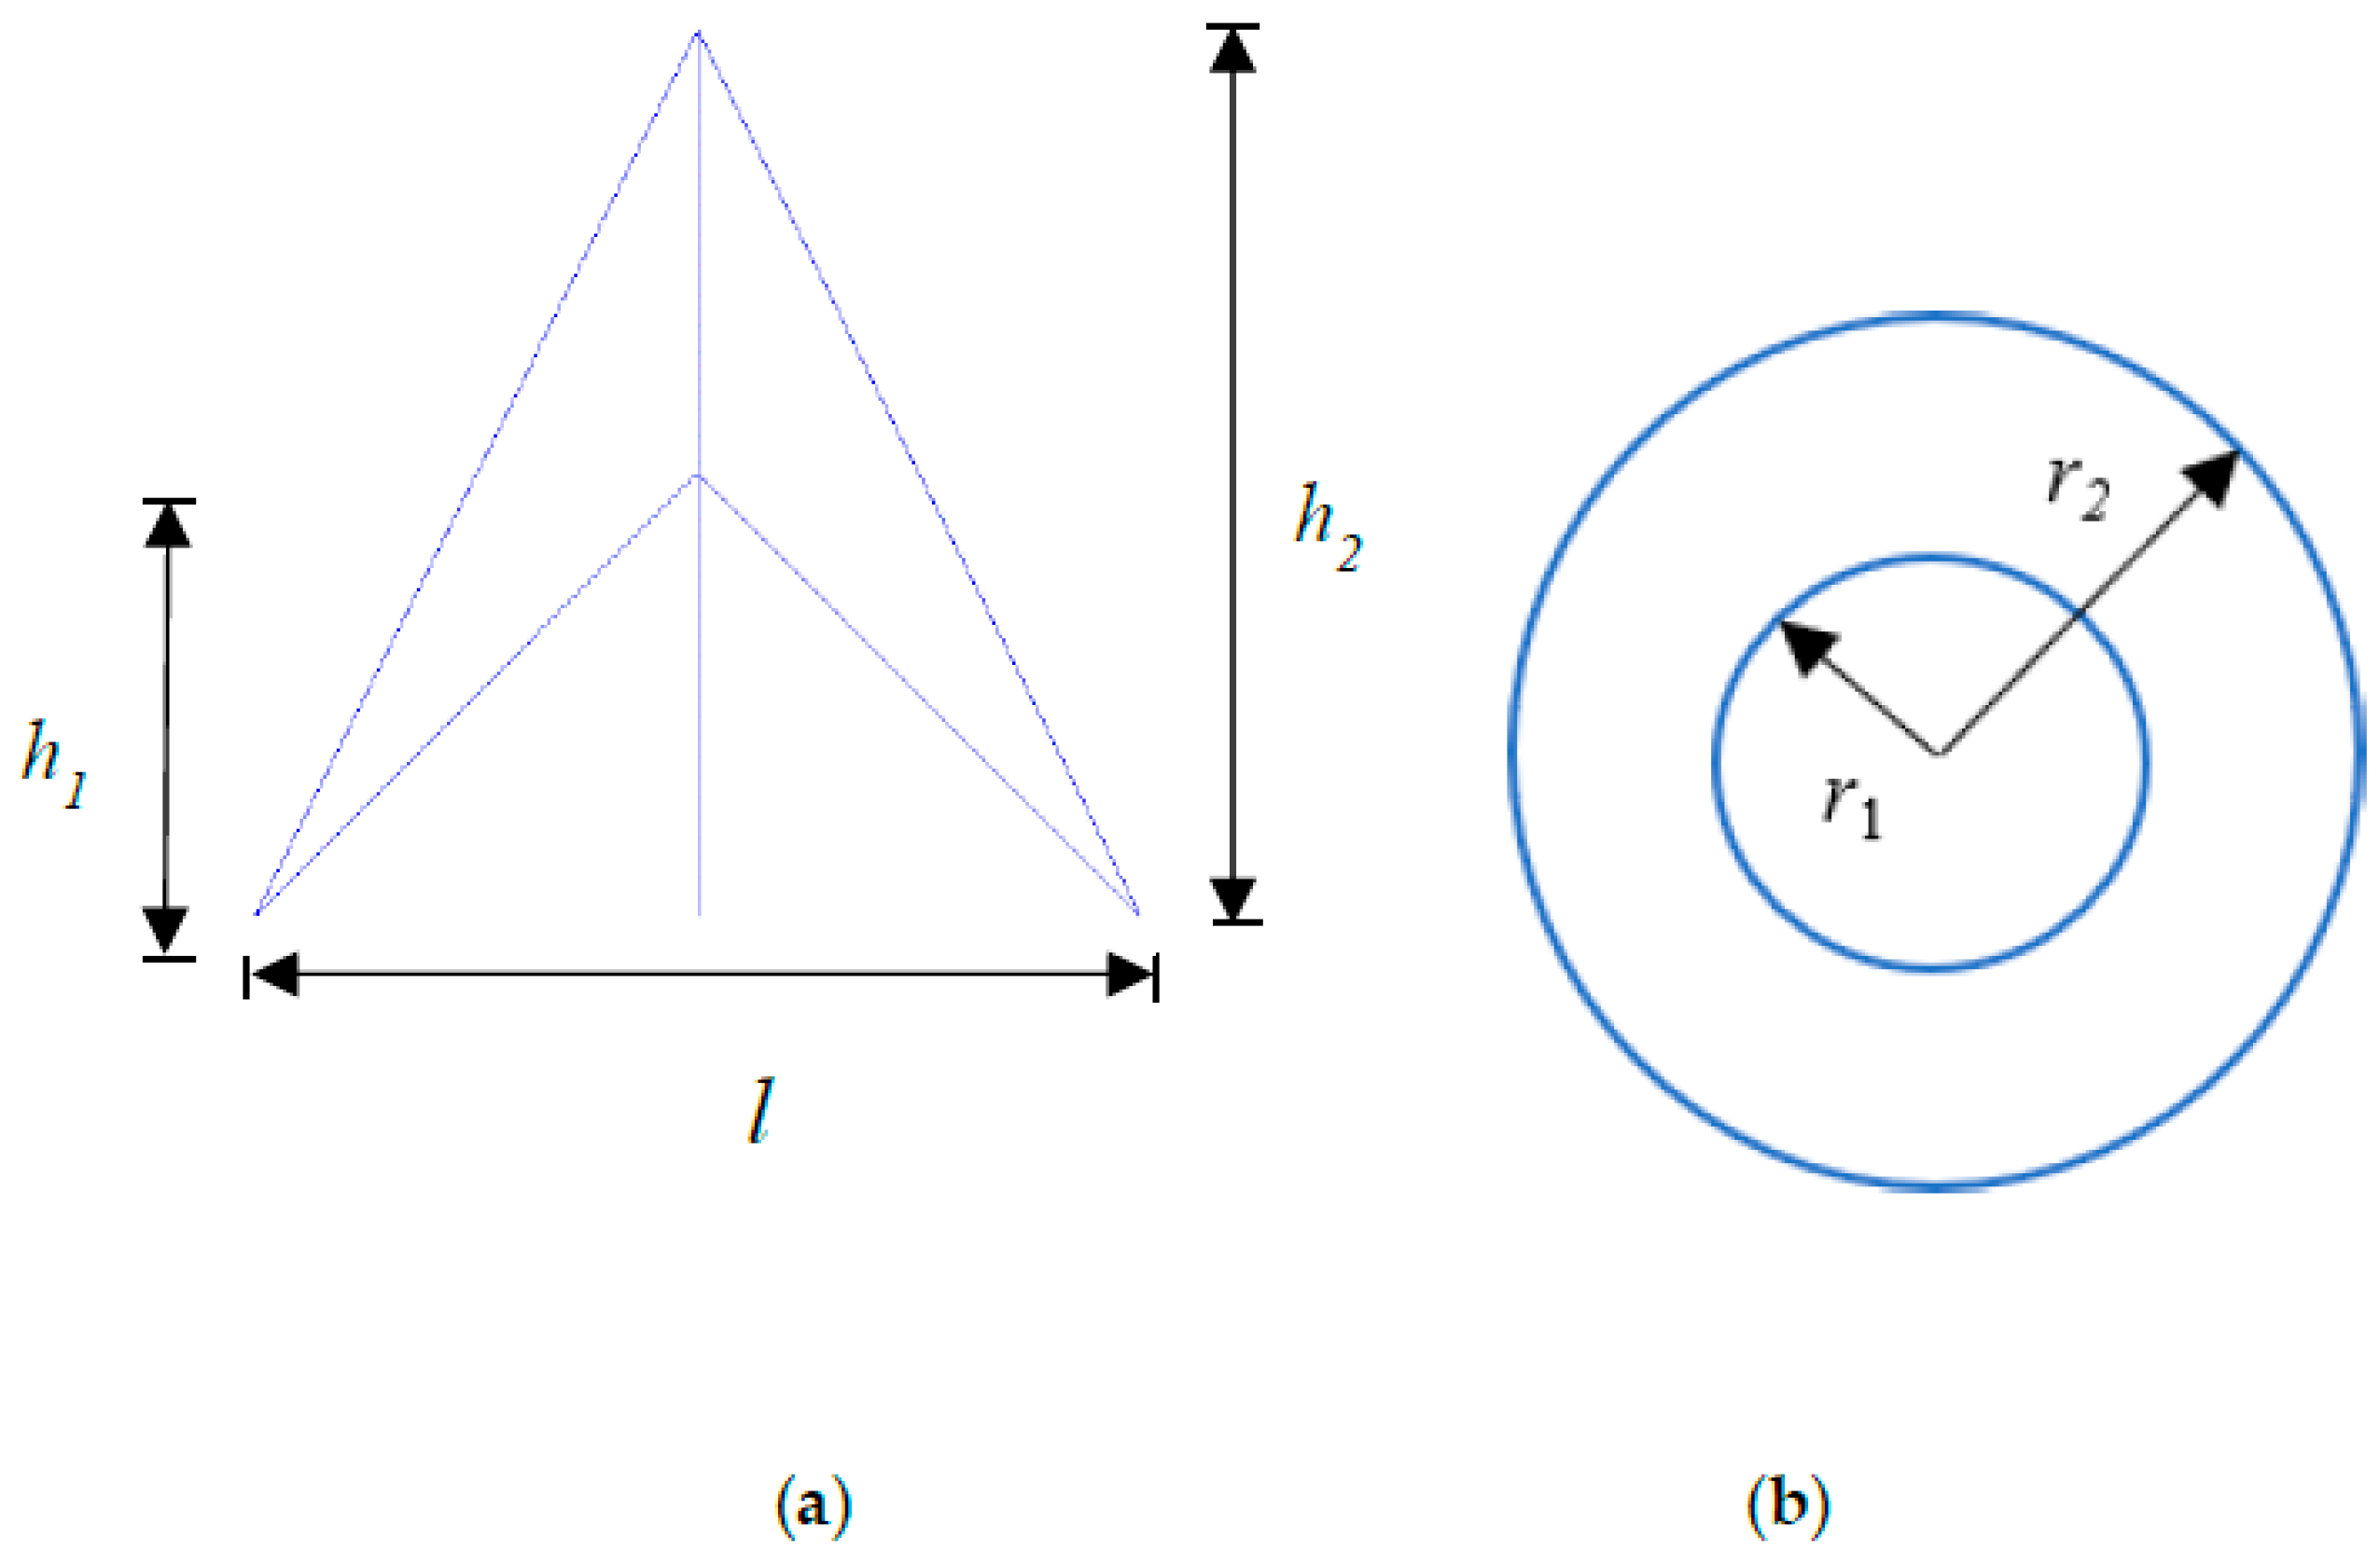
Figure 3.
Cell geometry size: (a) topology shape size; (b) beam size.
Figure 3.
Cell geometry size: (a) topology shape size; (b) beam size.
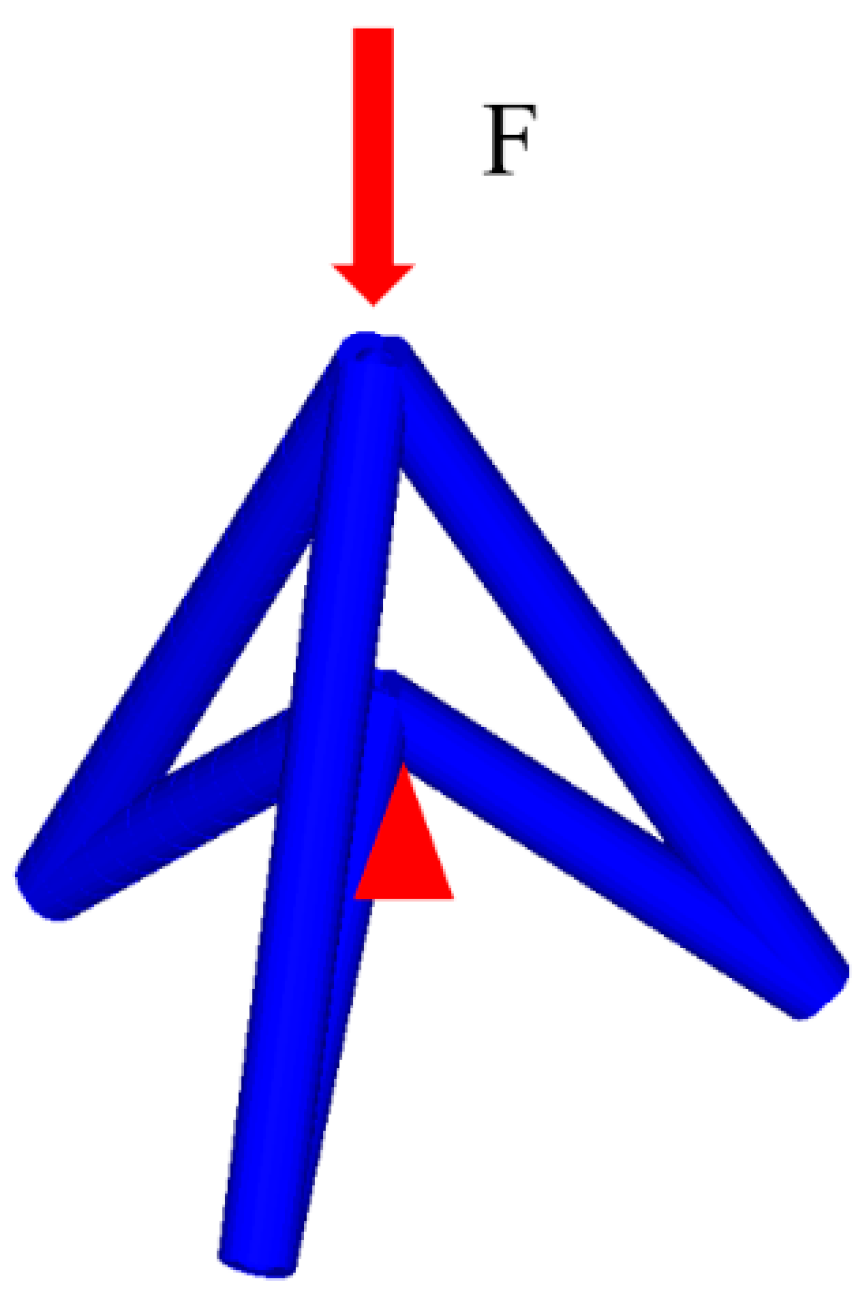
Figure 4.
The model of unit cell analysis.
Figure 4.
The model of unit cell analysis.
Figure 5.
The Surfaces of effective properties for Type A cell: (a) effective Young’s modulus E; (b) effective Poisson ratio v; (c) relative density .
Figure 5.
The Surfaces of effective properties for Type A cell: (a) effective Young’s modulus E; (b) effective Poisson ratio v; (c) relative density .
Figure 6.
The changes of the effective properties with respect to the and for Type A cell: (a) effective Young’s modulus E; (b) effective Poisson ratio v; (c) relative density .
Figure 6.
The changes of the effective properties with respect to the and for Type A cell: (a) effective Young’s modulus E; (b) effective Poisson ratio v; (c) relative density .
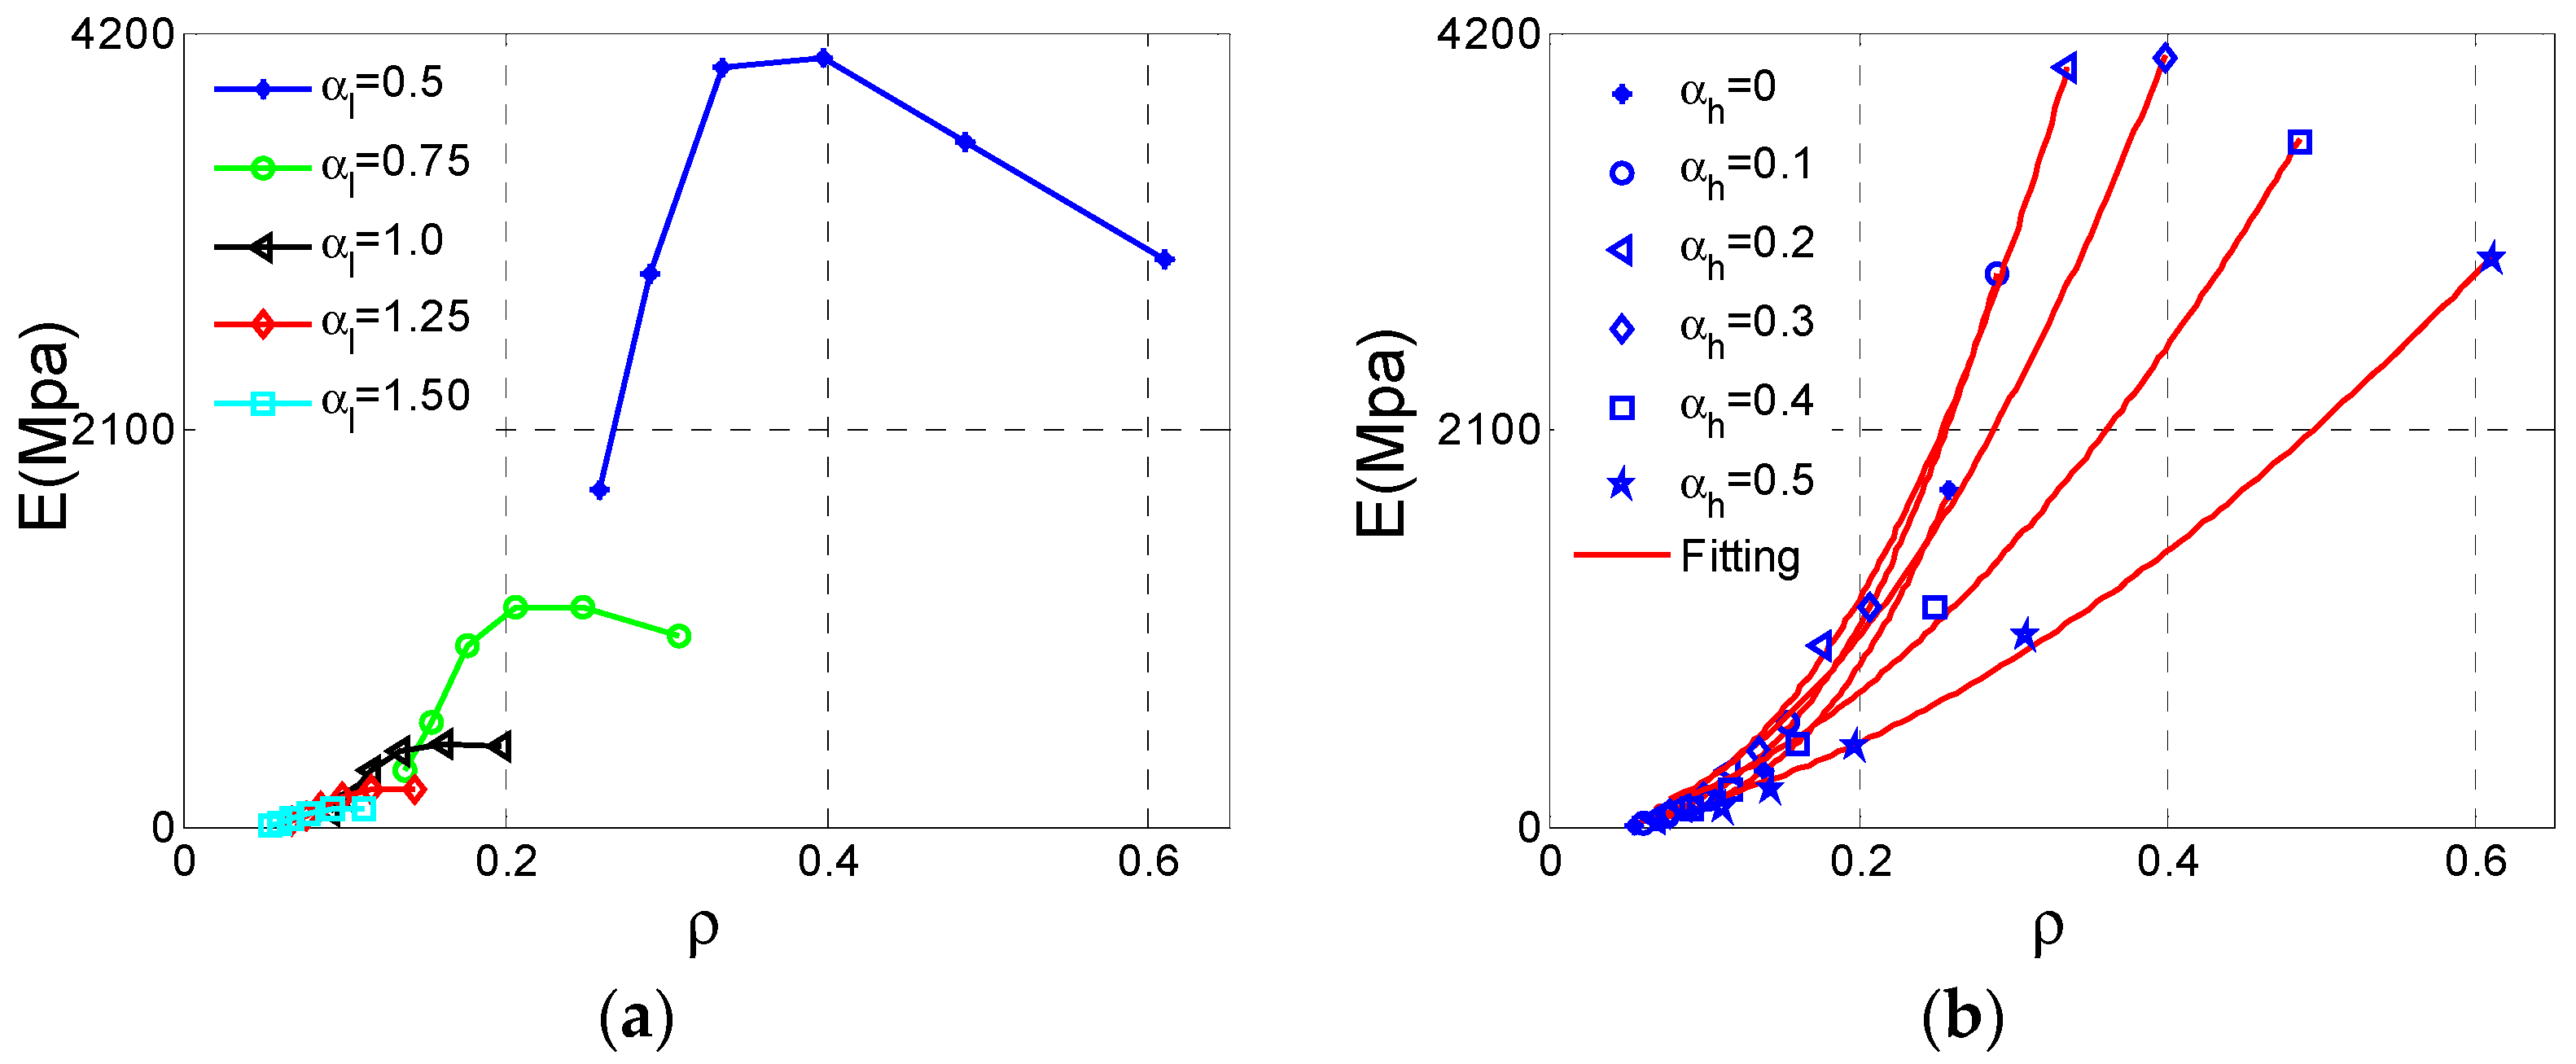
Figure 7.
The changes of effective Young’s modulus E for Type A cell with respect to the relative density : (a) data set; (b) fitting curves.
Figure 7.
The changes of effective Young’s modulus E for Type A cell with respect to the relative density : (a) data set; (b) fitting curves.
Figure 8.
The Surfaces of effective properties for Type B cell: (a) effective Young’s modulus E; (b) effective Poisson ratio v; (c) relative density .
Figure 8.
The Surfaces of effective properties for Type B cell: (a) effective Young’s modulus E; (b) effective Poisson ratio v; (c) relative density .
Figure 9.
The changes of the effective properties with respect to the height ratio and the length ratio for Type B cell: (a) effective Young’s modulus E; (b) effective Poisson ratio v; (c) relative density .
Figure 9.
The changes of the effective properties with respect to the height ratio and the length ratio for Type B cell: (a) effective Young’s modulus E; (b) effective Poisson ratio v; (c) relative density .
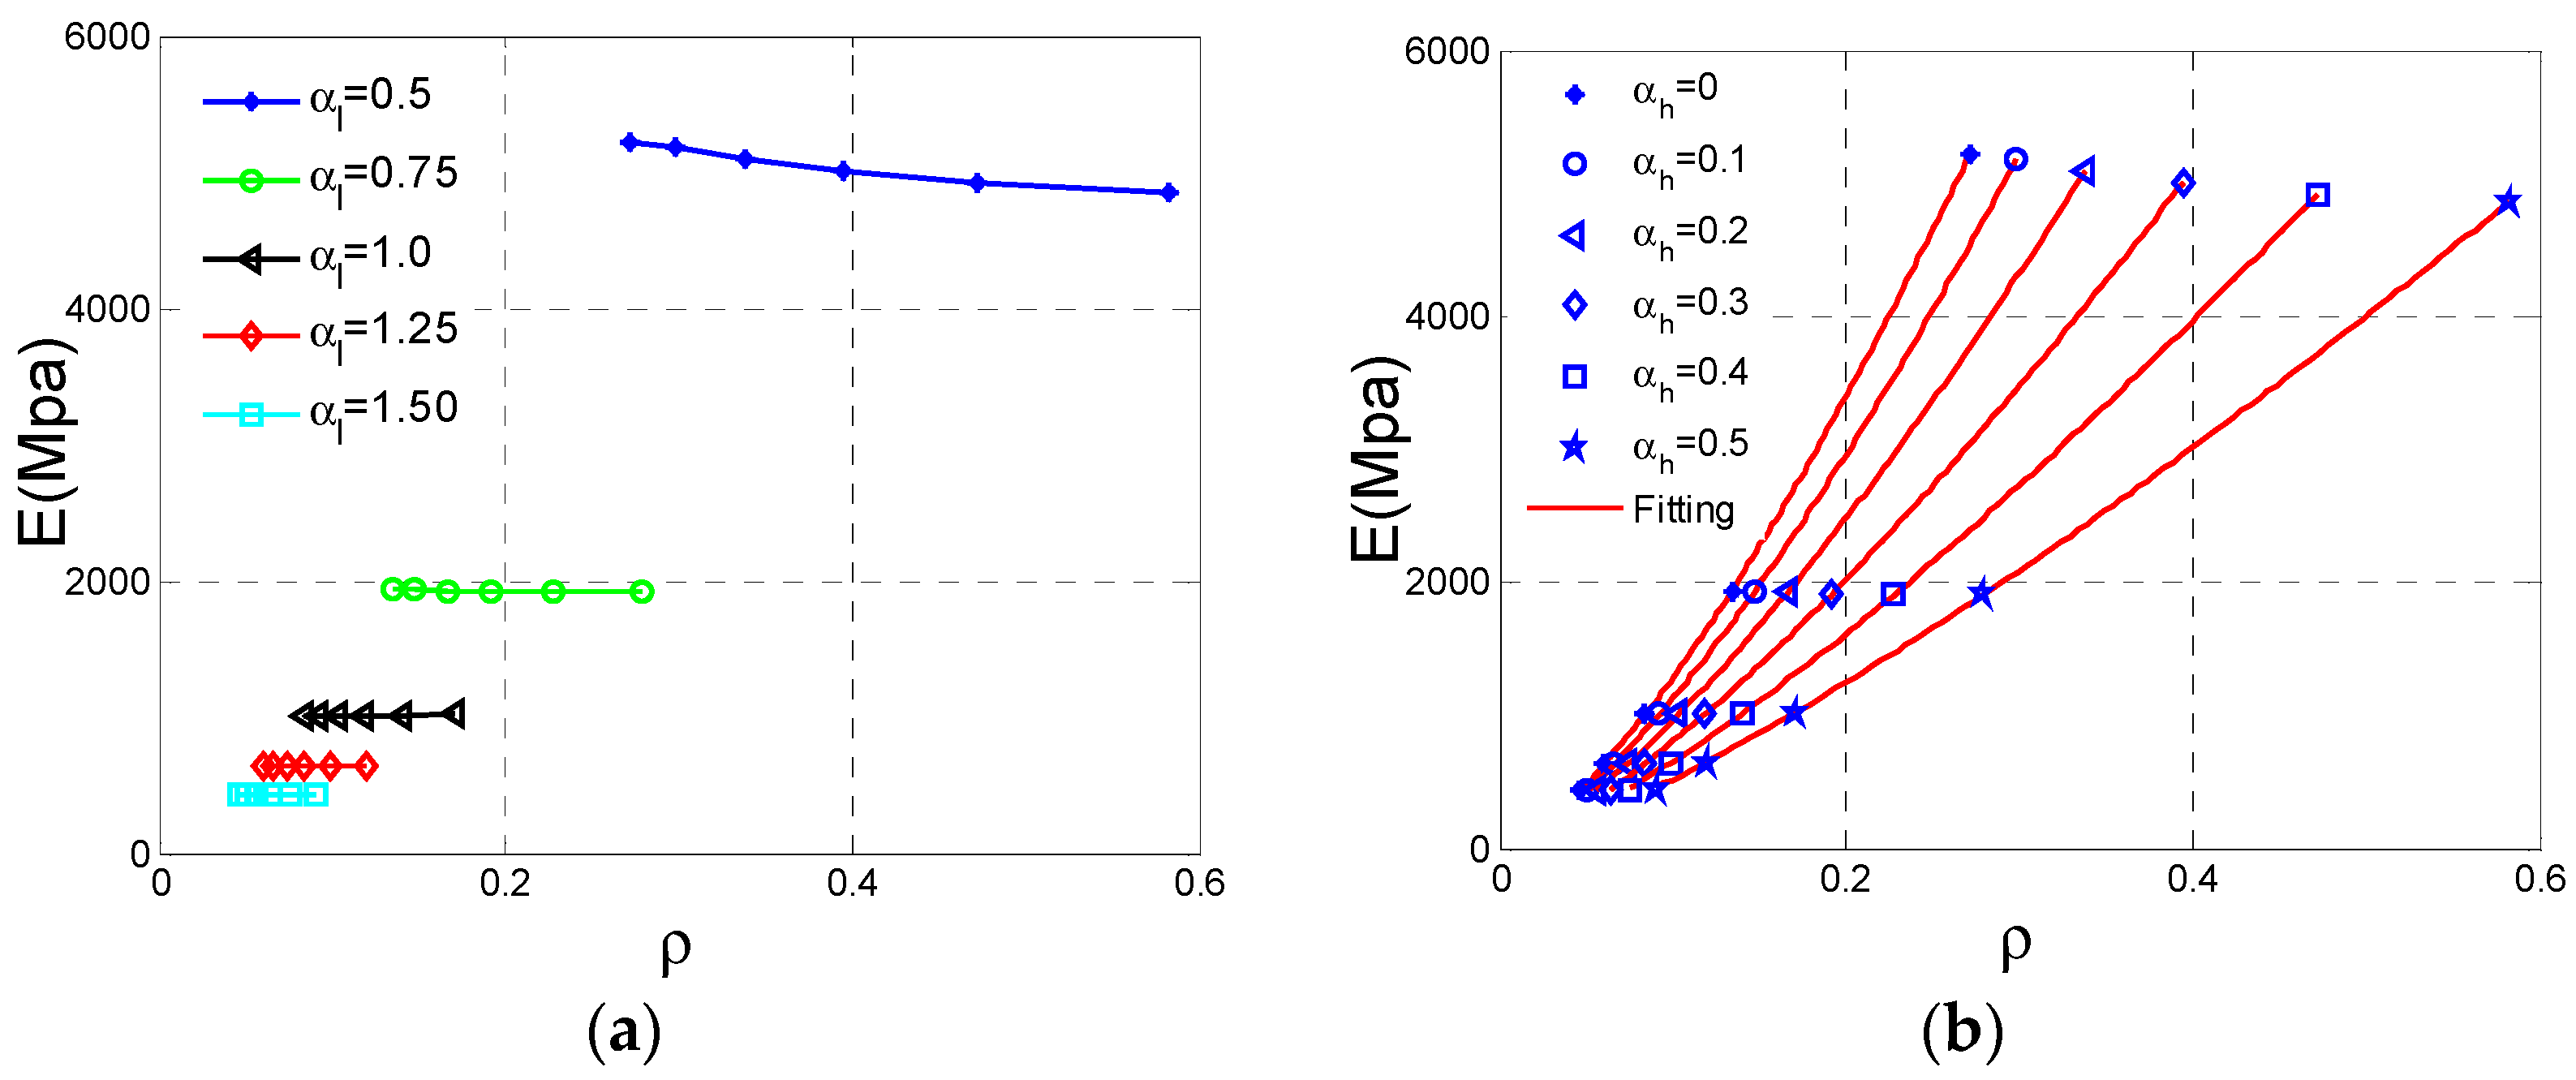
Figure 10.
The changes of effective Young’s modulus E for Type B cell with respect to the relative density : (a) data set; (b) fitting curves.
Figure 10.
The changes of effective Young’s modulus E for Type B cell with respect to the relative density : (a) data set; (b) fitting curves.
Figure 11.
The Surfaces of effective properties for Type C cell: (a) effective Young’s modulus E; (b) effective Poisson ratio v; (c) relative density .
Figure 11.
The Surfaces of effective properties for Type C cell: (a) effective Young’s modulus E; (b) effective Poisson ratio v; (c) relative density .
Figure 12.
The changes of the effective properties with respect to the height ratio and the length ratio for Type C cell: (a) effective Young’s modulus E; (b) effective Poisson ratio v; (c) relative density .
Figure 12.
The changes of the effective properties with respect to the height ratio and the length ratio for Type C cell: (a) effective Young’s modulus E; (b) effective Poisson ratio v; (c) relative density .
Figure 13.
The changes of effective Young’s modulus E for Type C cell with respect to the relative density : (a) data set; (b) fitting curves.
Figure 13.
The changes of effective Young’s modulus E for Type C cell with respect to the relative density : (a) data set; (b) fitting curves.
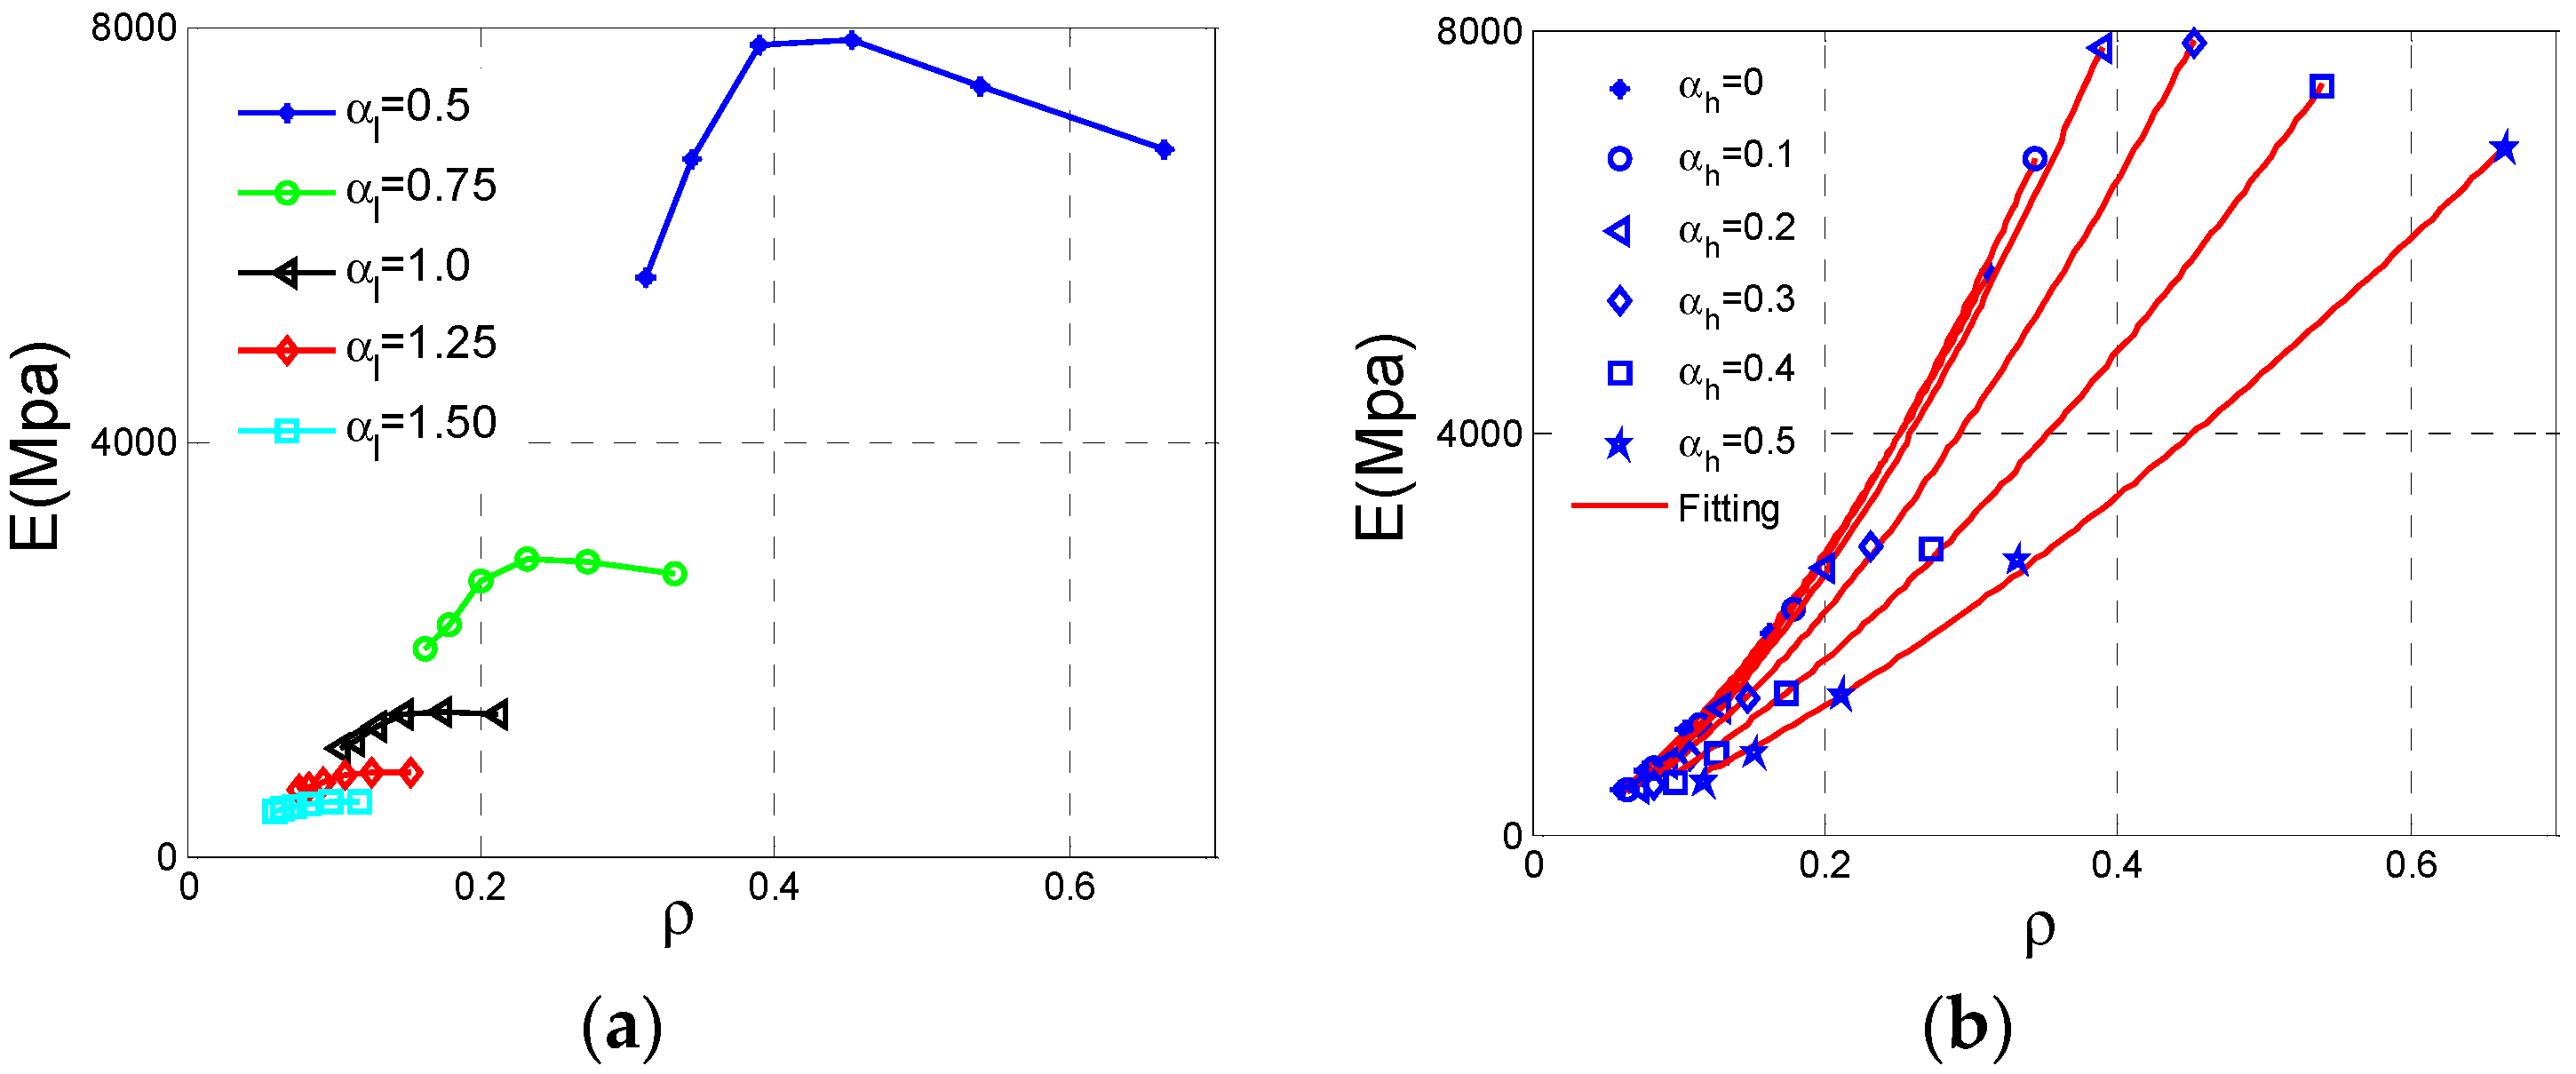
Figure 14.
The Surfaces of effective properties for Type D cell: (a) effective Young’s modulus E; (b) effective Poisson ratio v; (c) relative density .
Figure 14.
The Surfaces of effective properties for Type D cell: (a) effective Young’s modulus E; (b) effective Poisson ratio v; (c) relative density .
Figure 15.
The changes of the effective properties with respect to the height ratio and the length ratio for Type D cell: (a) effective Young’s modulus E; (b) effective Poisson ratio v; (c) relative density .
Figure 15.
The changes of the effective properties with respect to the height ratio and the length ratio for Type D cell: (a) effective Young’s modulus E; (b) effective Poisson ratio v; (c) relative density .
Figure 16.
The changes of effective Young’s modulus E for Type D cell with respect to the relative density : (a) data set; (b) fitting curves.
Figure 16.
The changes of effective Young’s modulus E for Type D cell with respect to the relative density : (a) data set; (b) fitting curves.
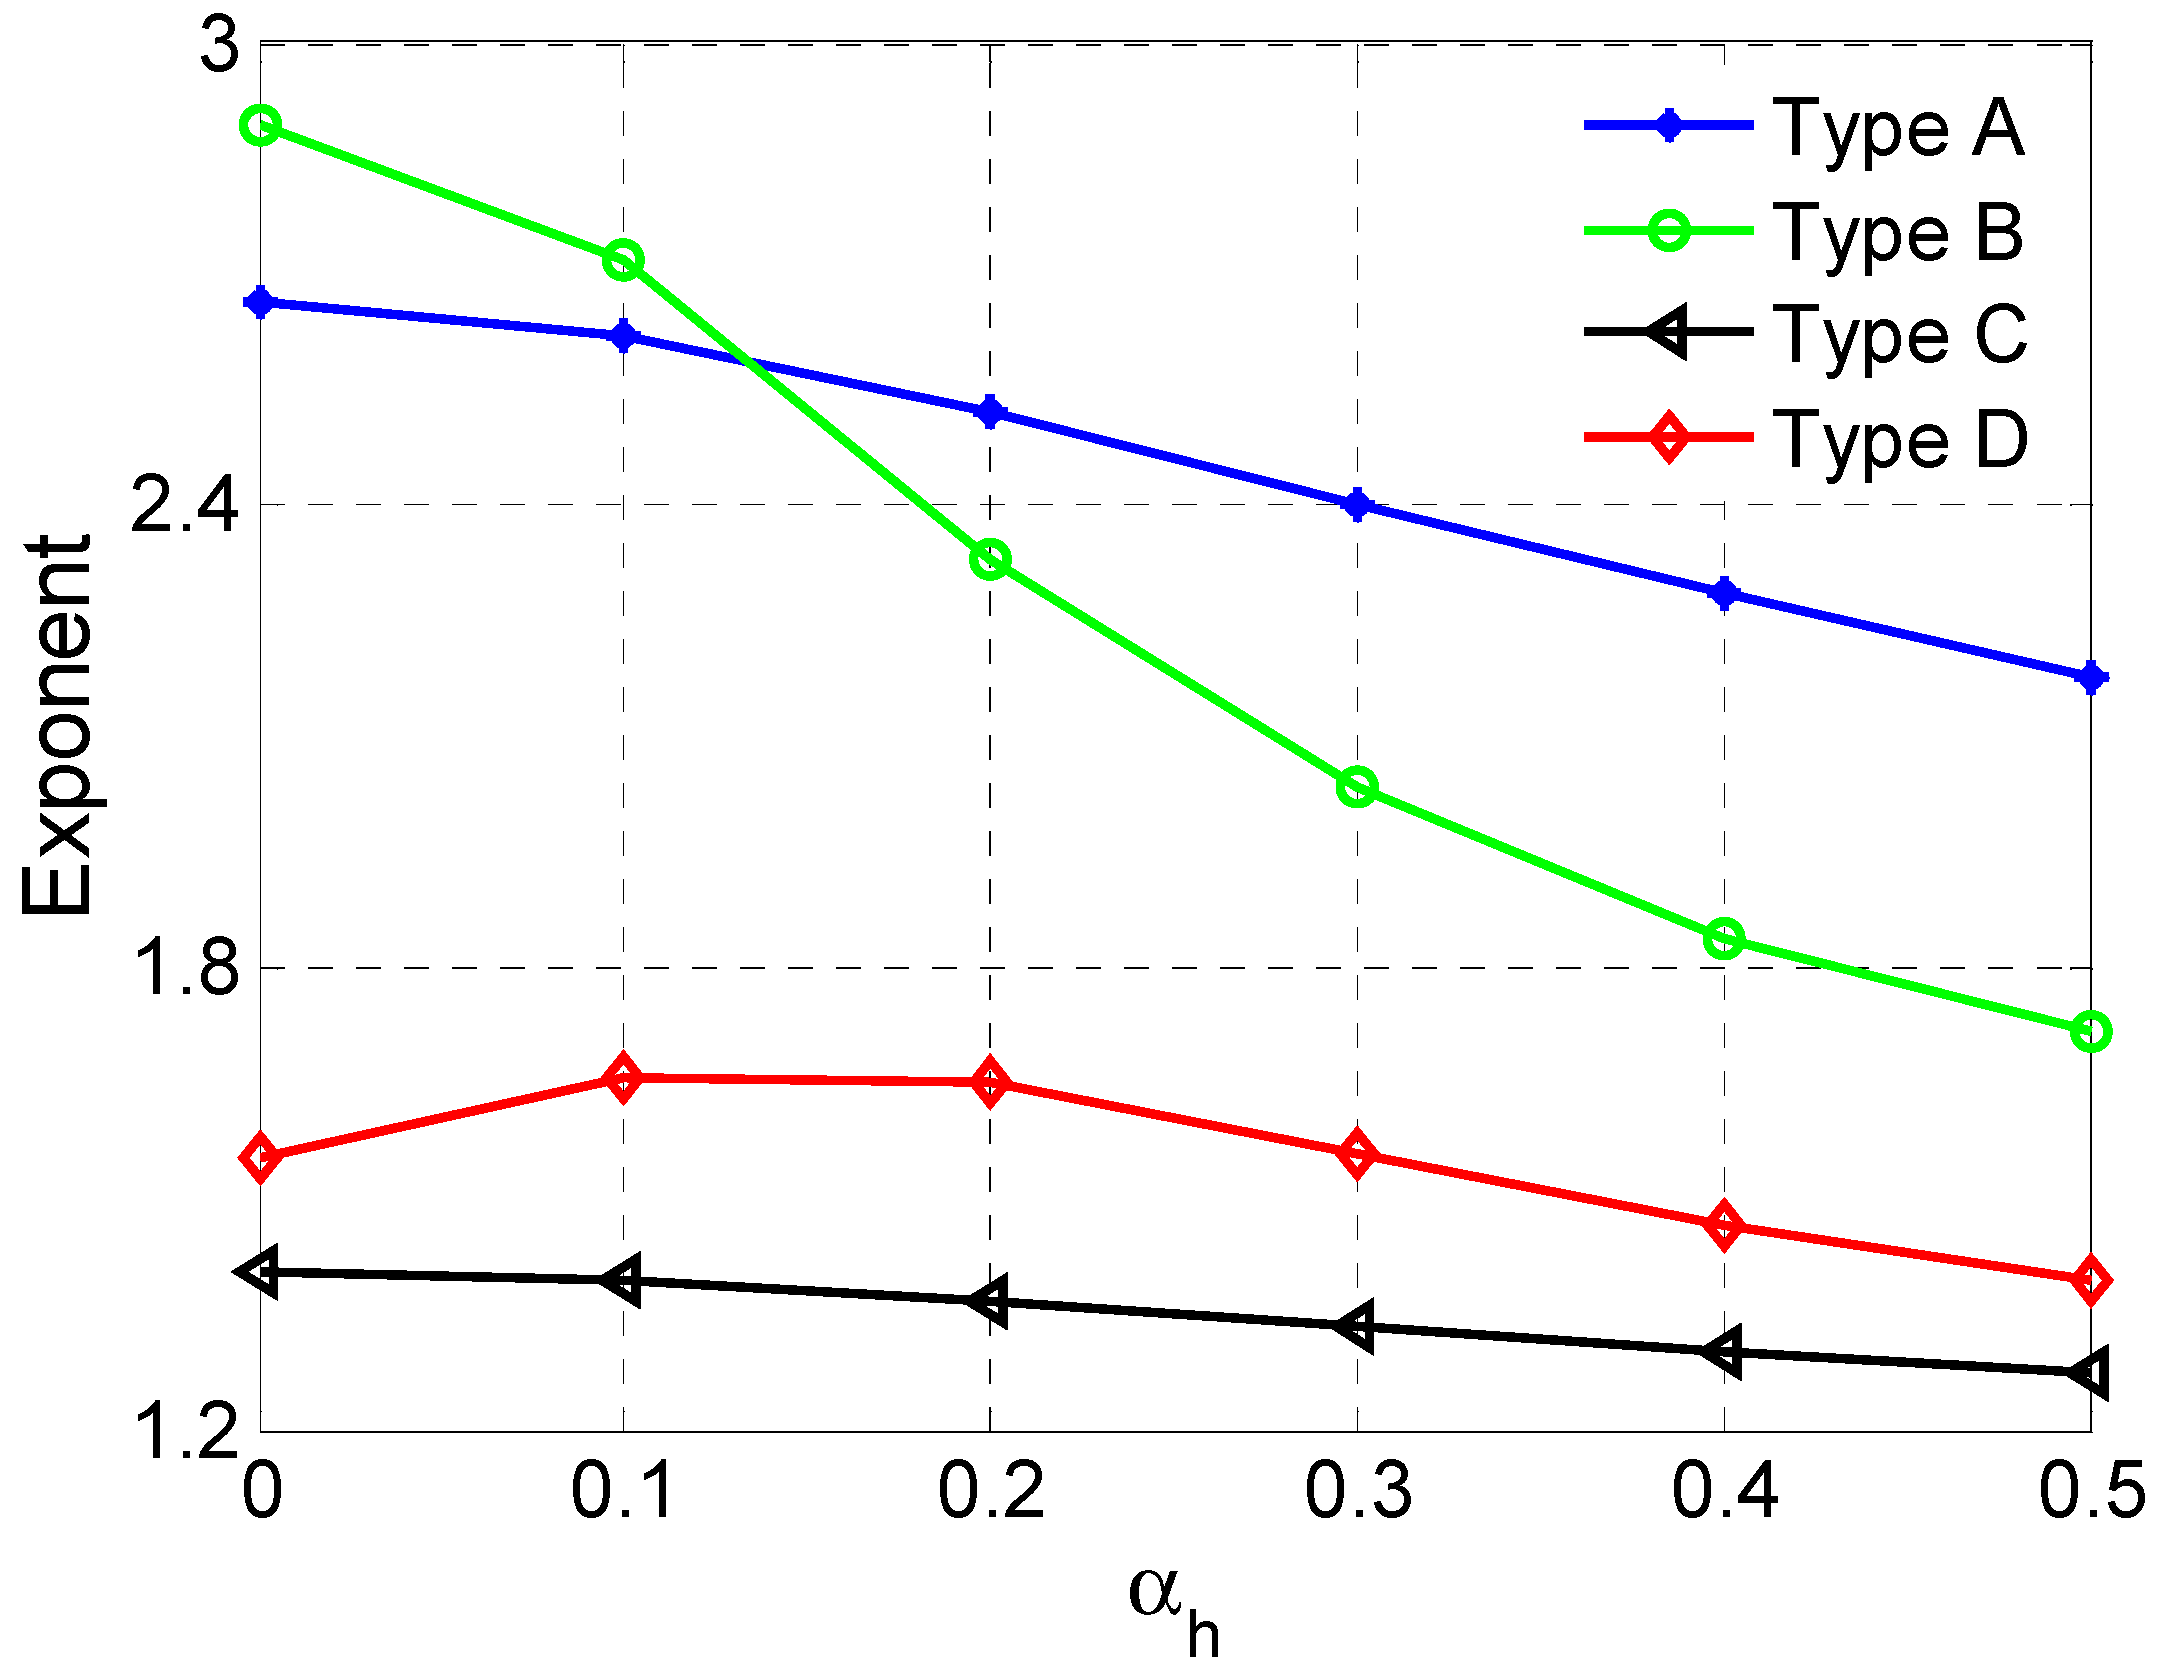
Figure 17.
The dependence of the exponent e on the height ratio.
Figure 17.
The dependence of the exponent e on the height ratio.
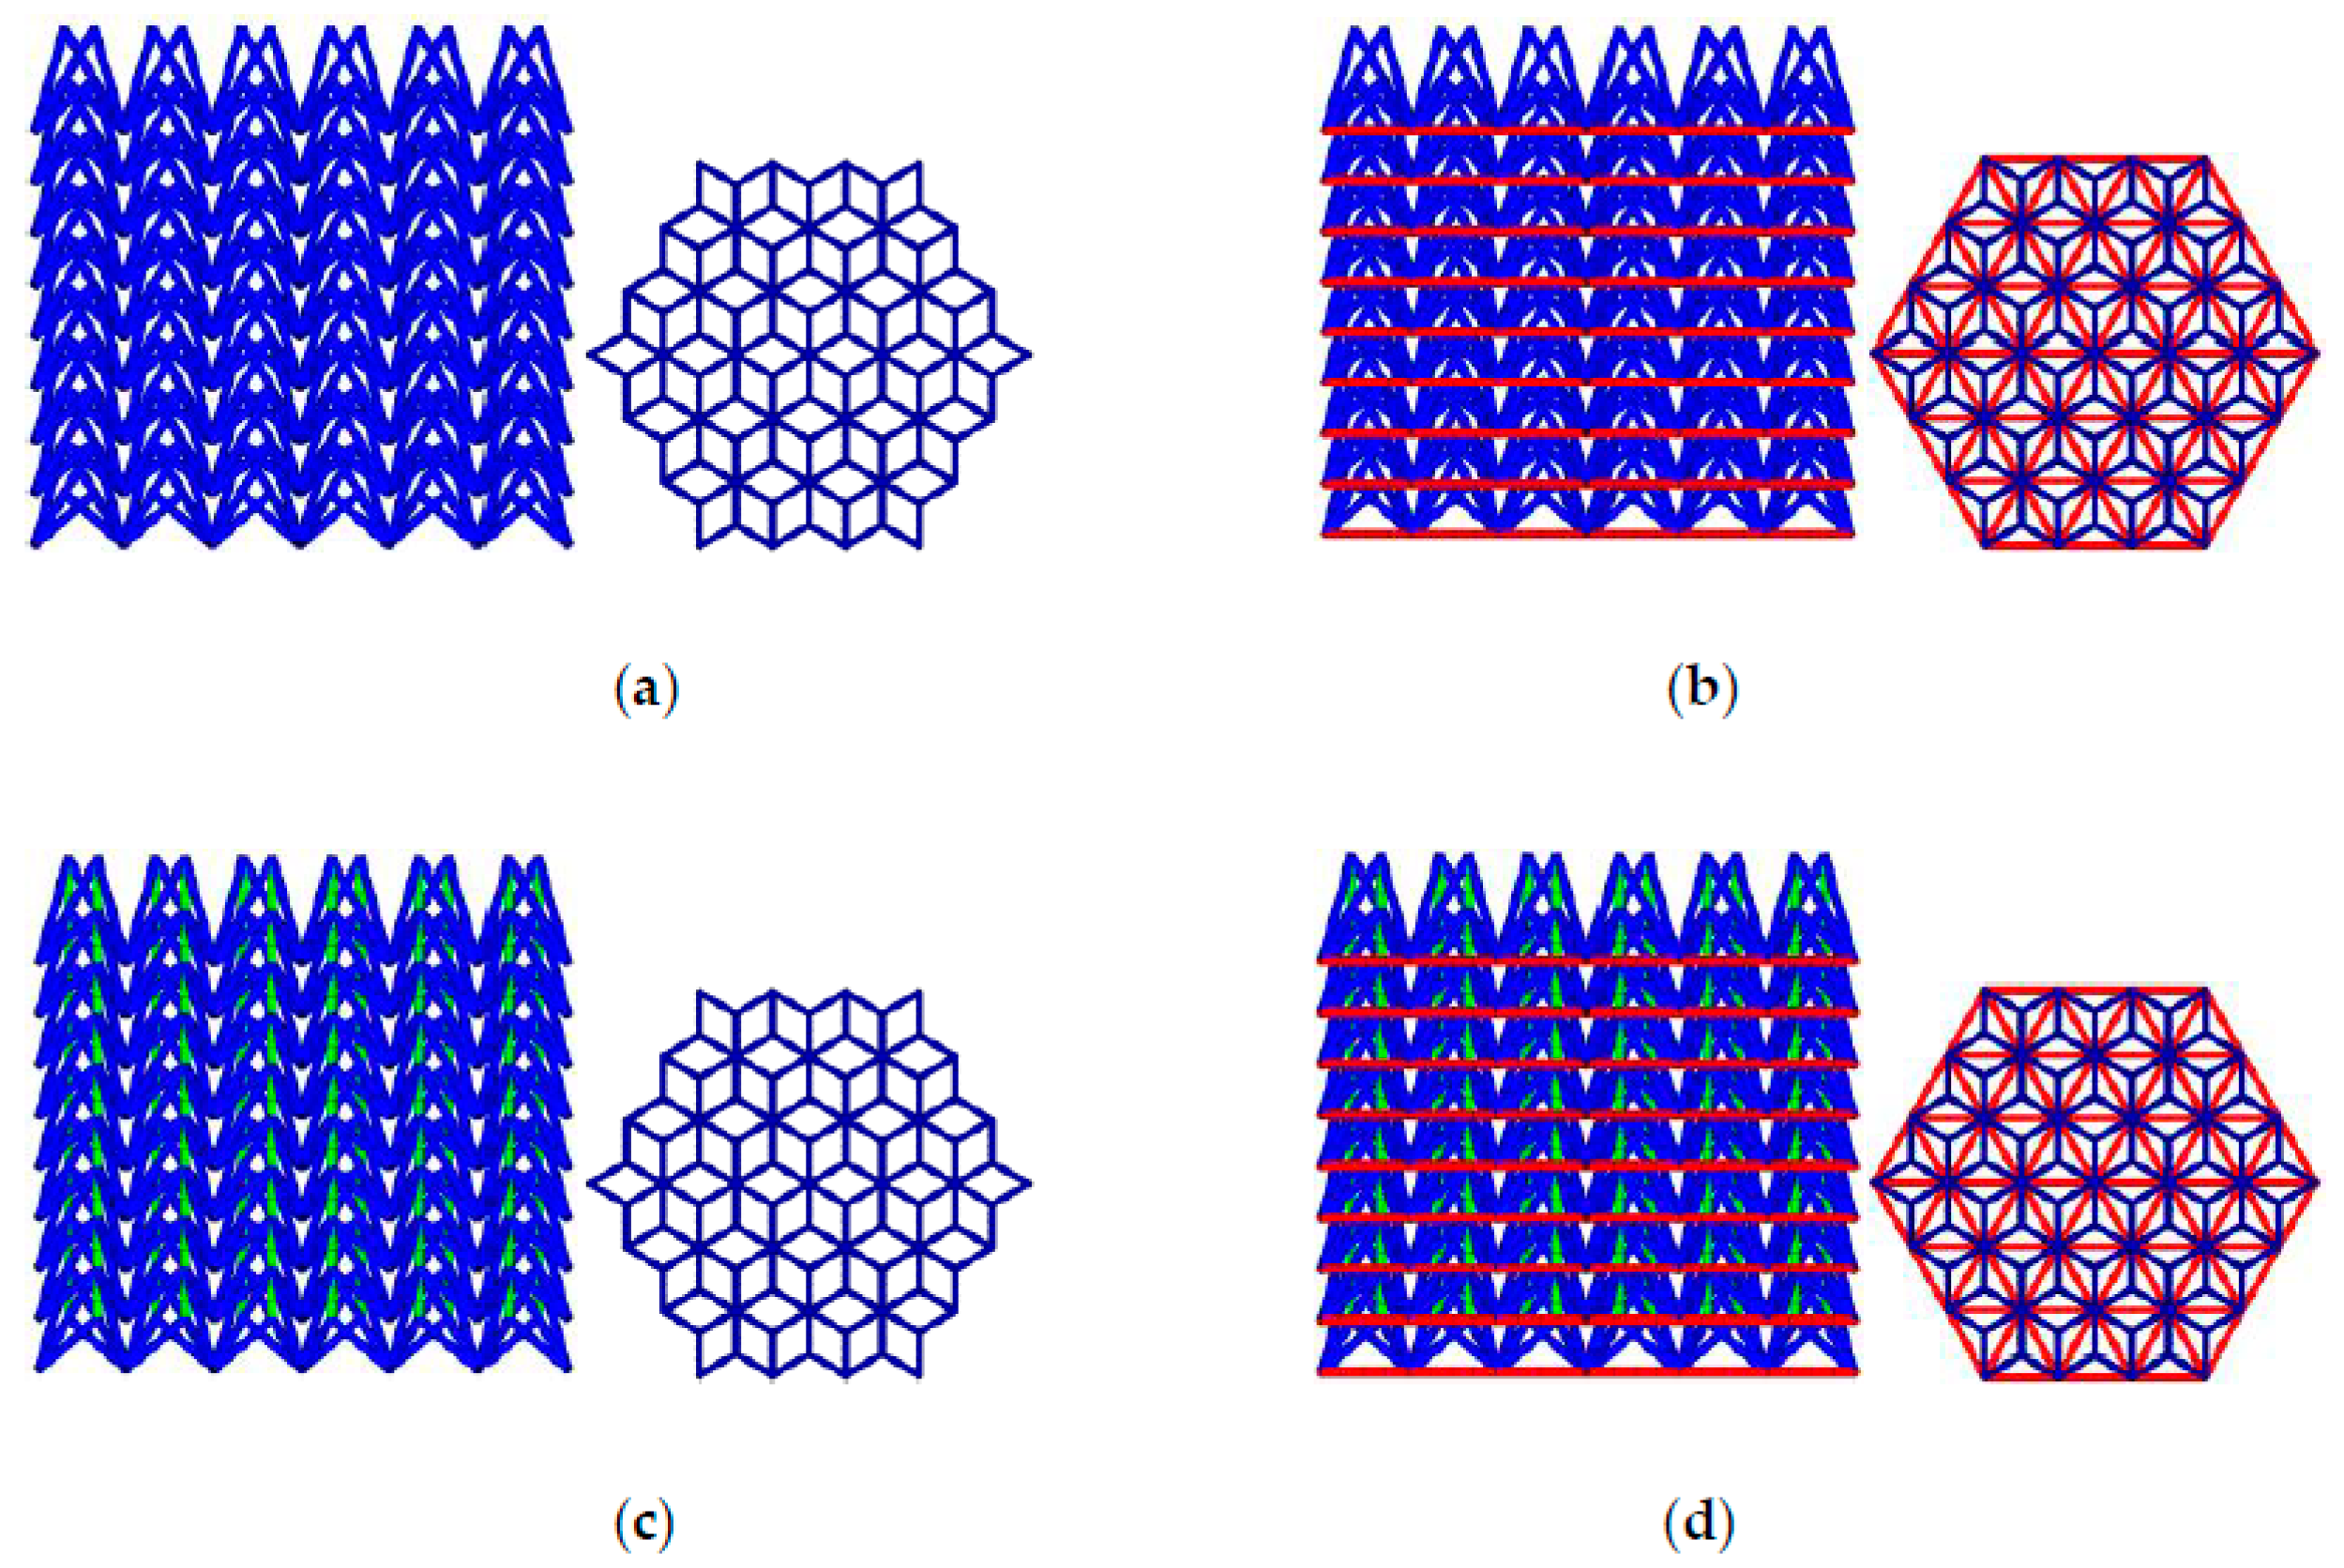
Figure 18.
Structures fabricated by four novel NPR cells: (a) Type A NPR structure; (b) Type B NPR structure; (c) Type C NPR structure; (d) Type D NPR structure.
Figure 18.
Structures fabricated by four novel NPR cells: (a) Type A NPR structure; (b) Type B NPR structure; (c) Type C NPR structure; (d) Type D NPR structure.
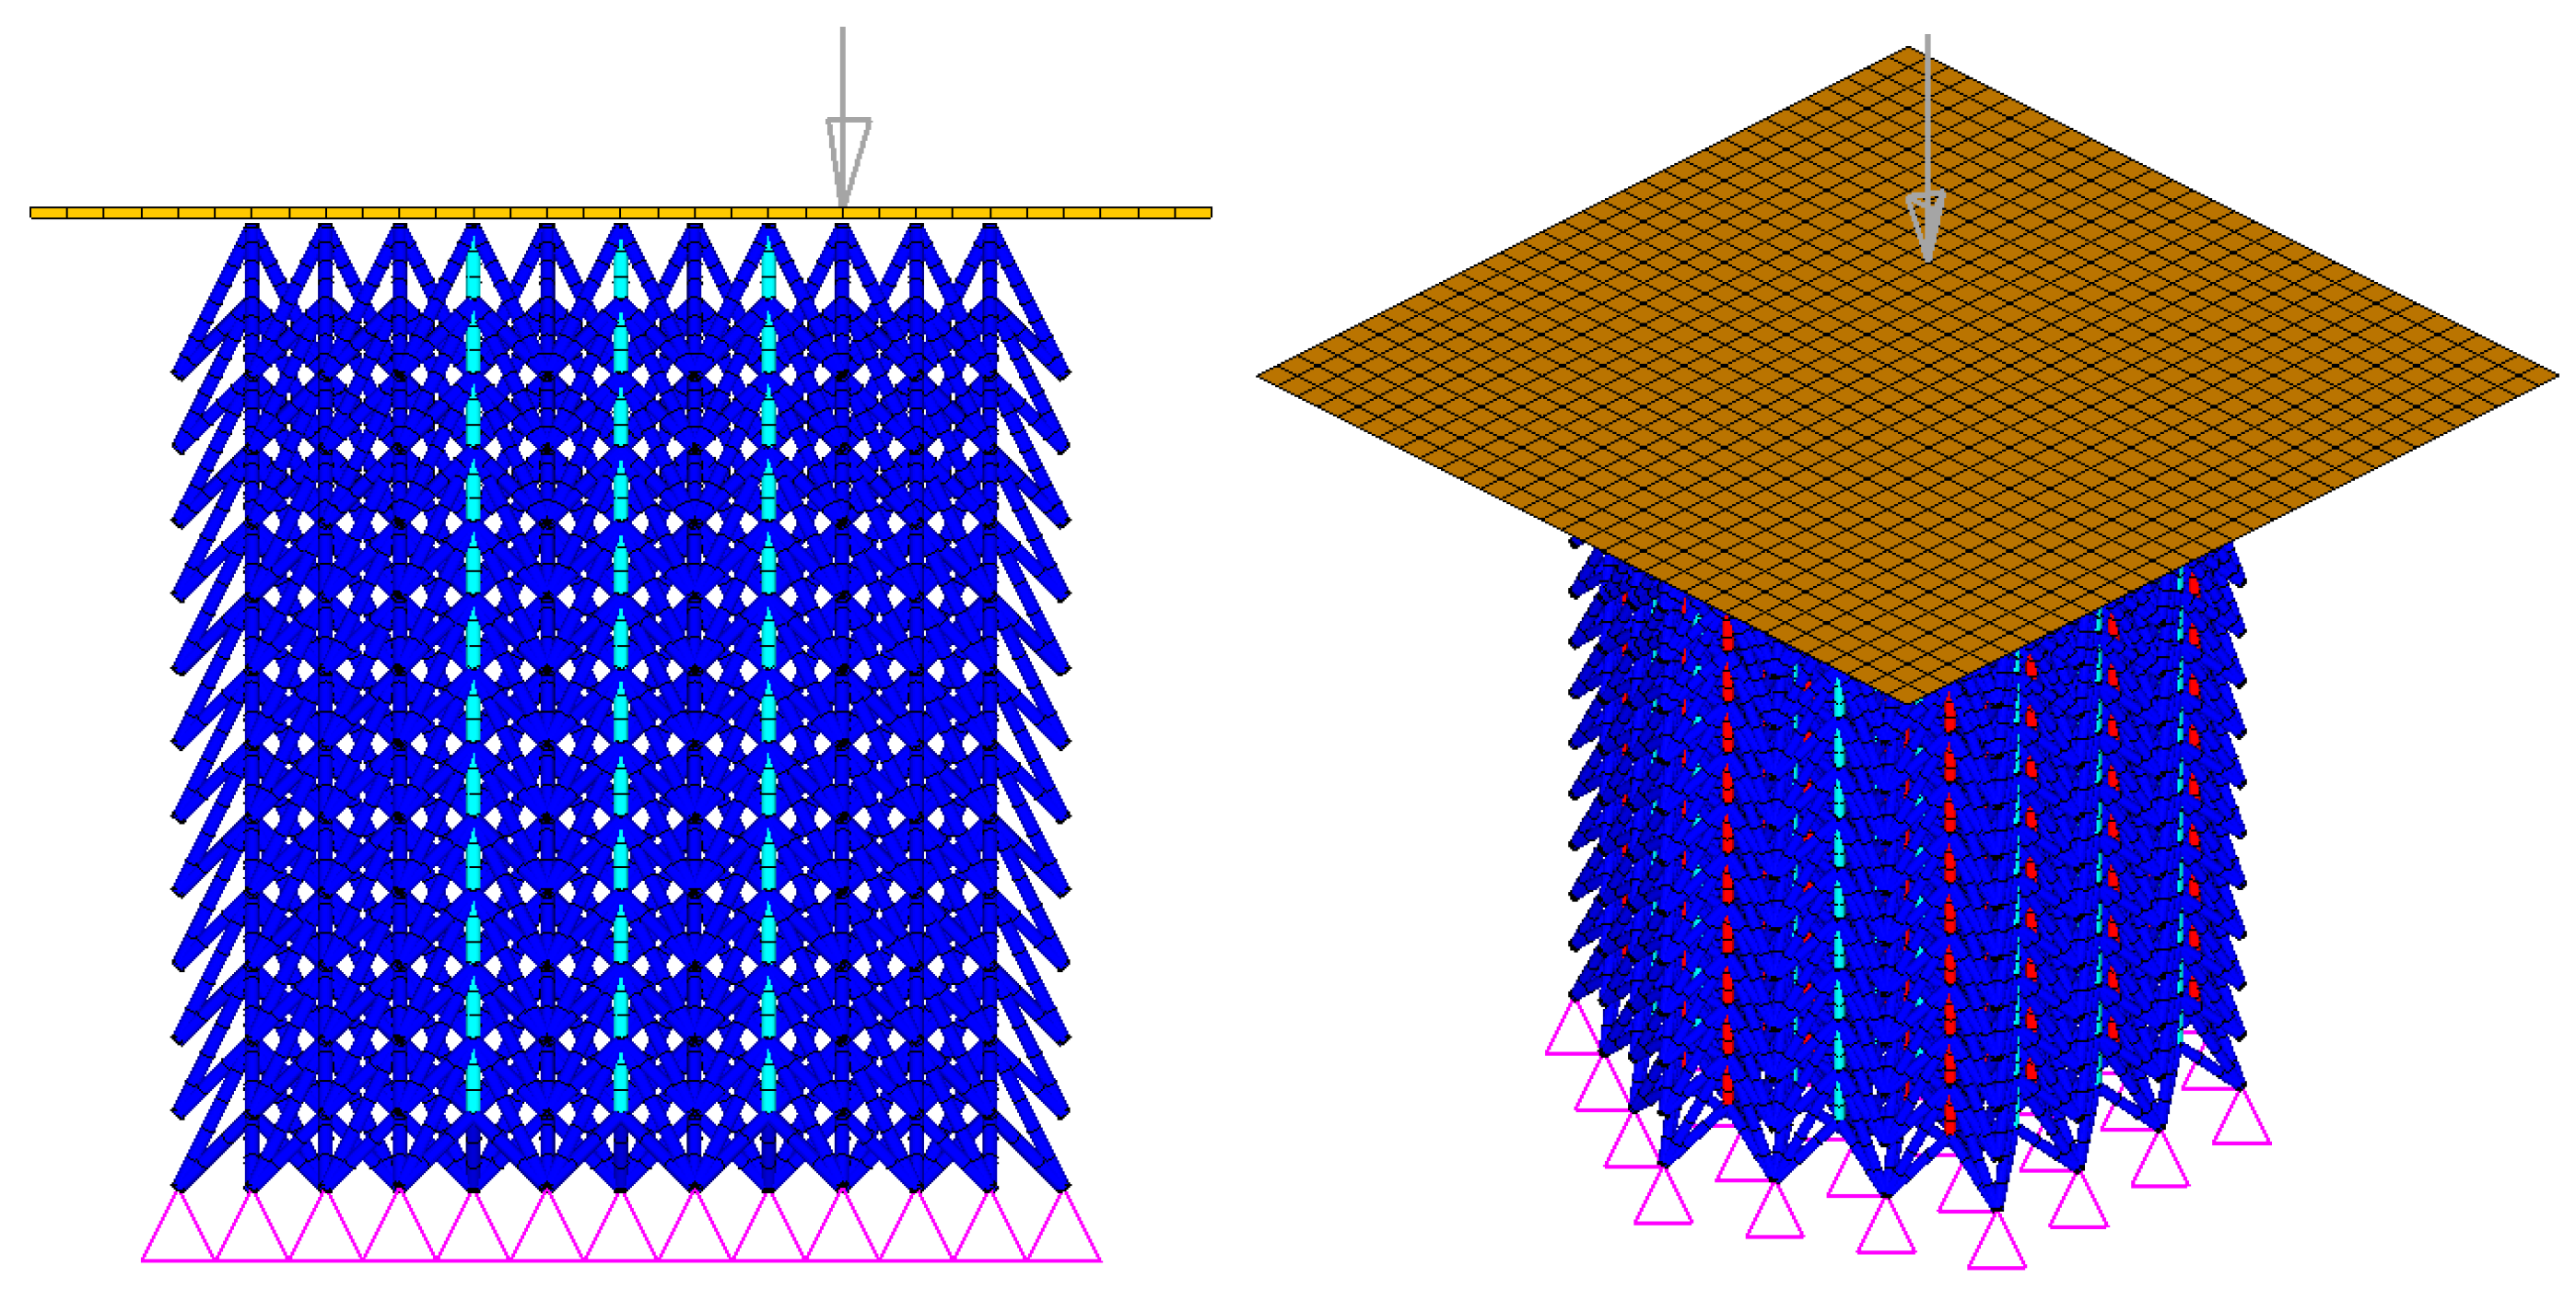
Figure 19.
The FE model of NPR lattice structure.
Figure 19.
The FE model of NPR lattice structure.
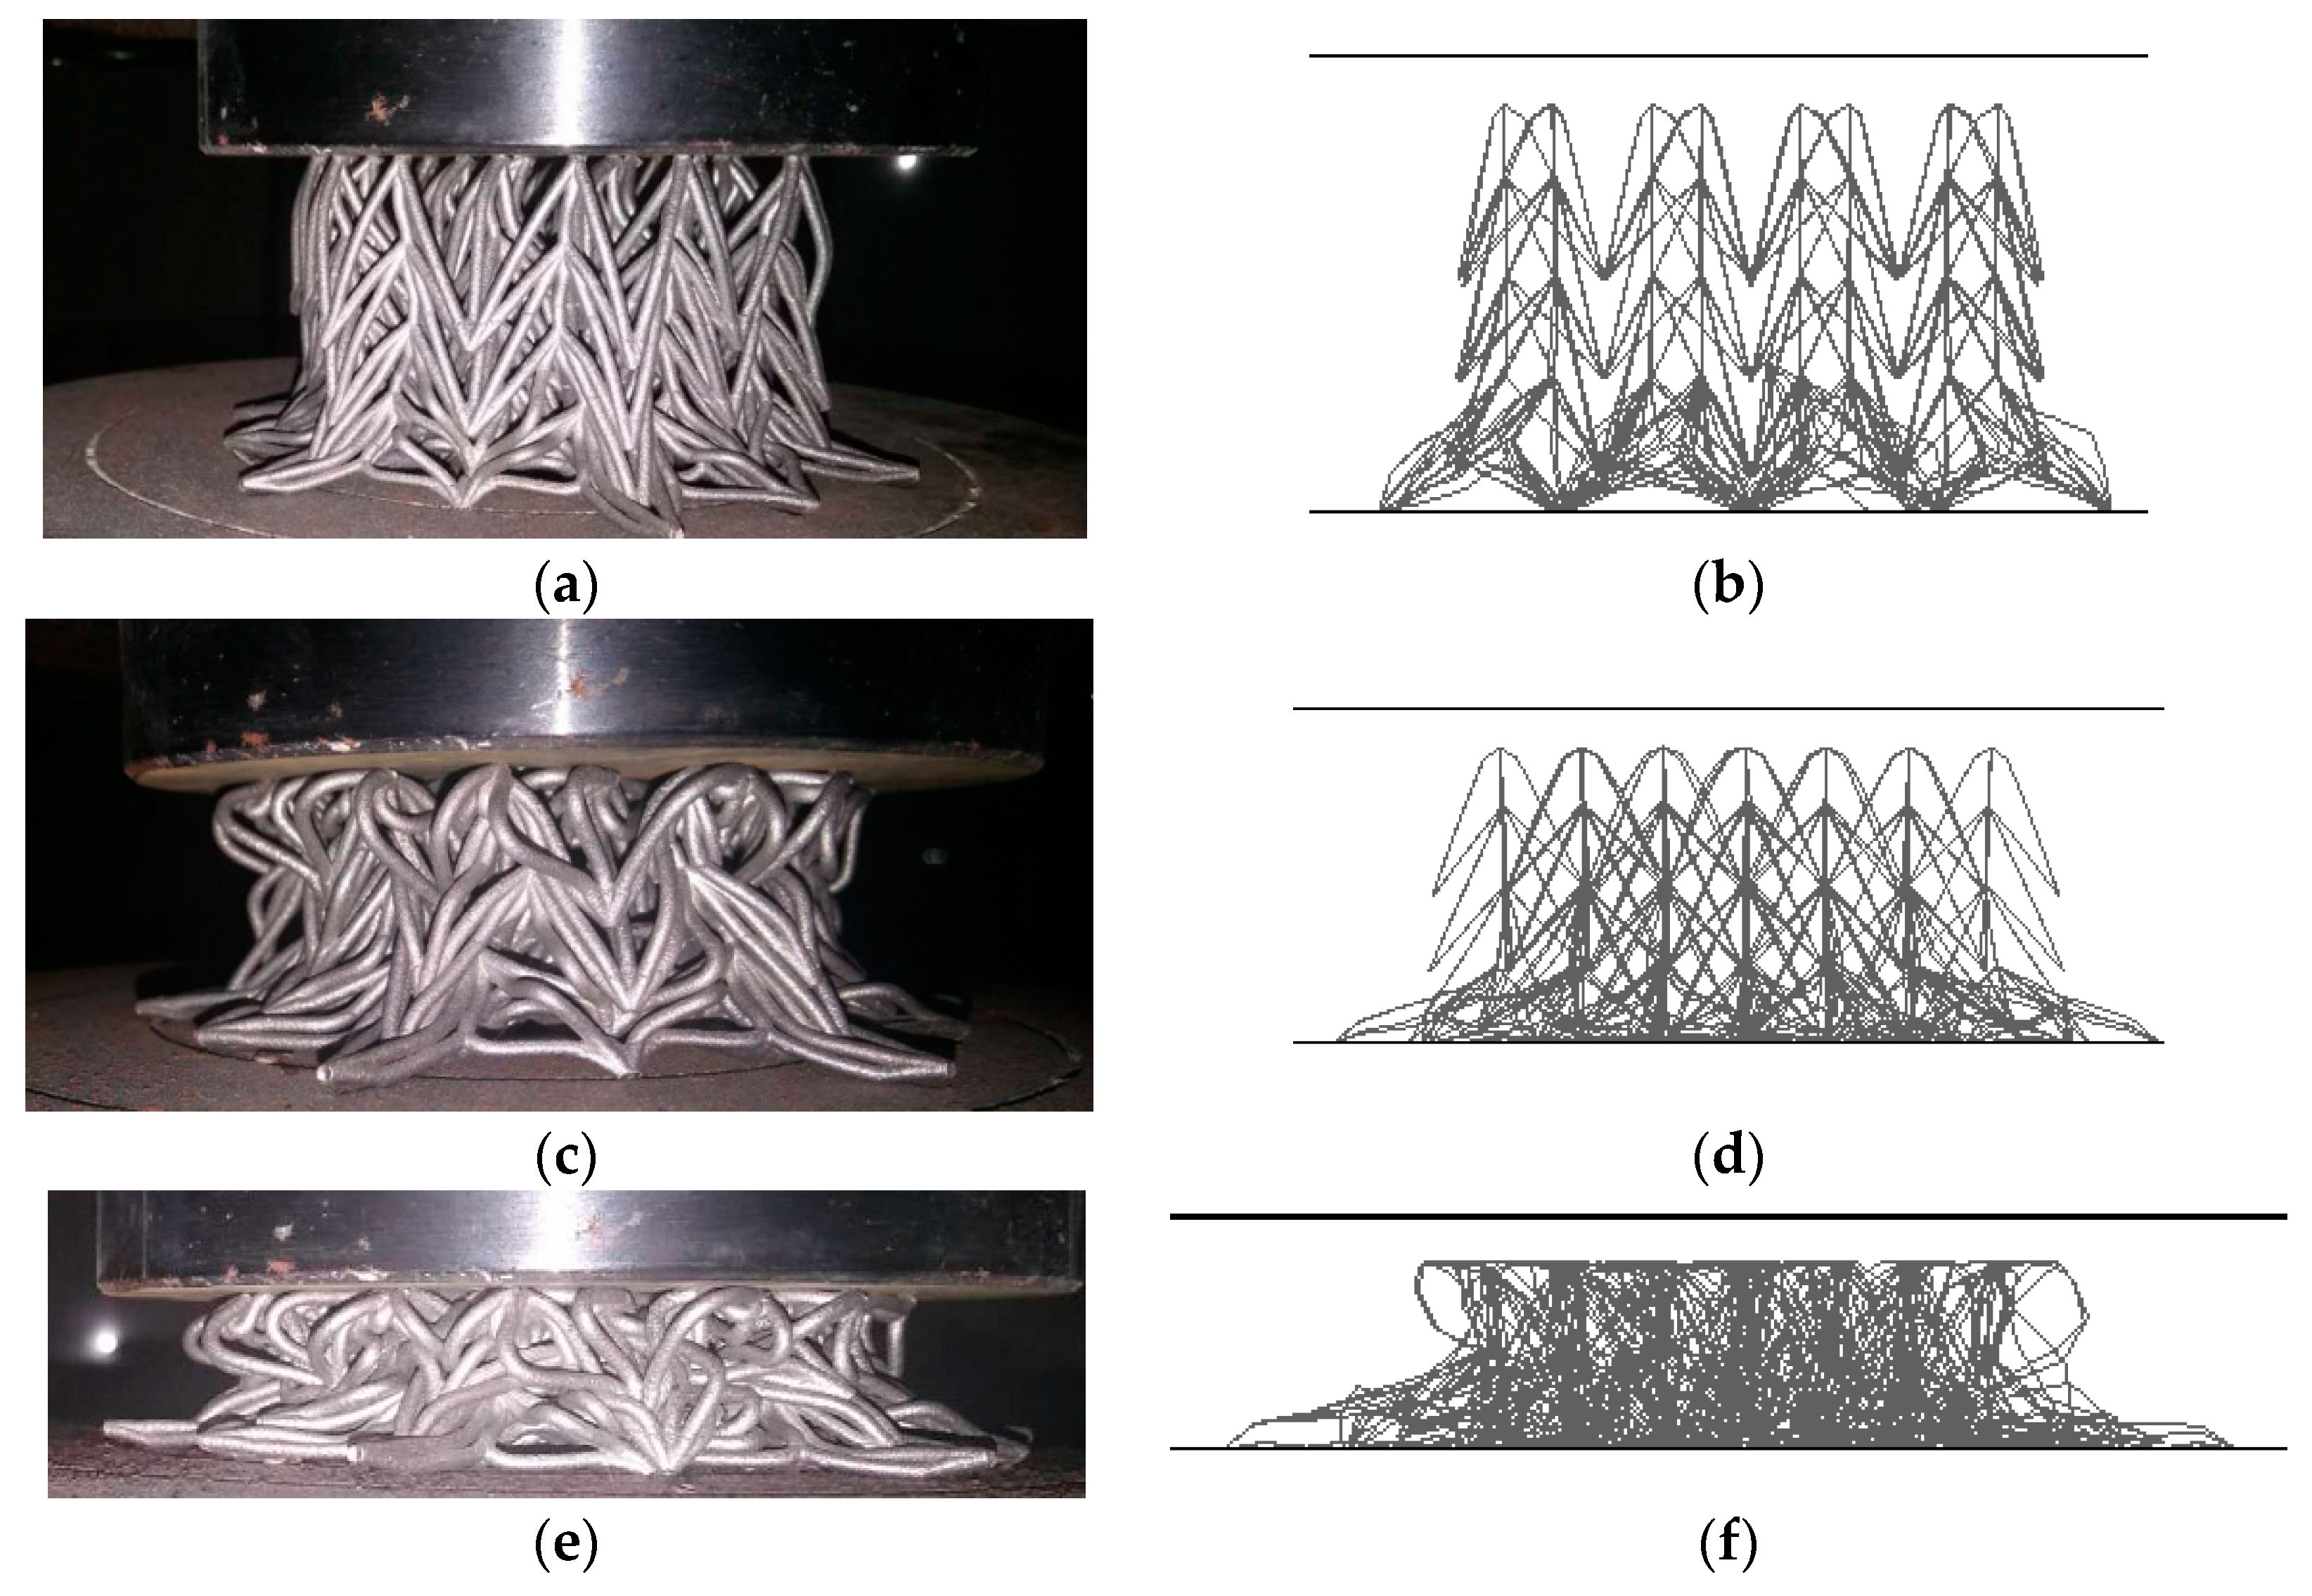
Figure 20.
Comparison of compressive deformation process: (a) experiment, 10 mm deformation; (b) simulation, 10 mm; (c) experiment, 20 mm; (d) simulation, 20 mm; (e) experiment, 30 mm; (f) simulation, 30 mm.
Figure 20.
Comparison of compressive deformation process: (a) experiment, 10 mm deformation; (b) simulation, 10 mm; (c) experiment, 20 mm; (d) simulation, 20 mm; (e) experiment, 30 mm; (f) simulation, 30 mm.
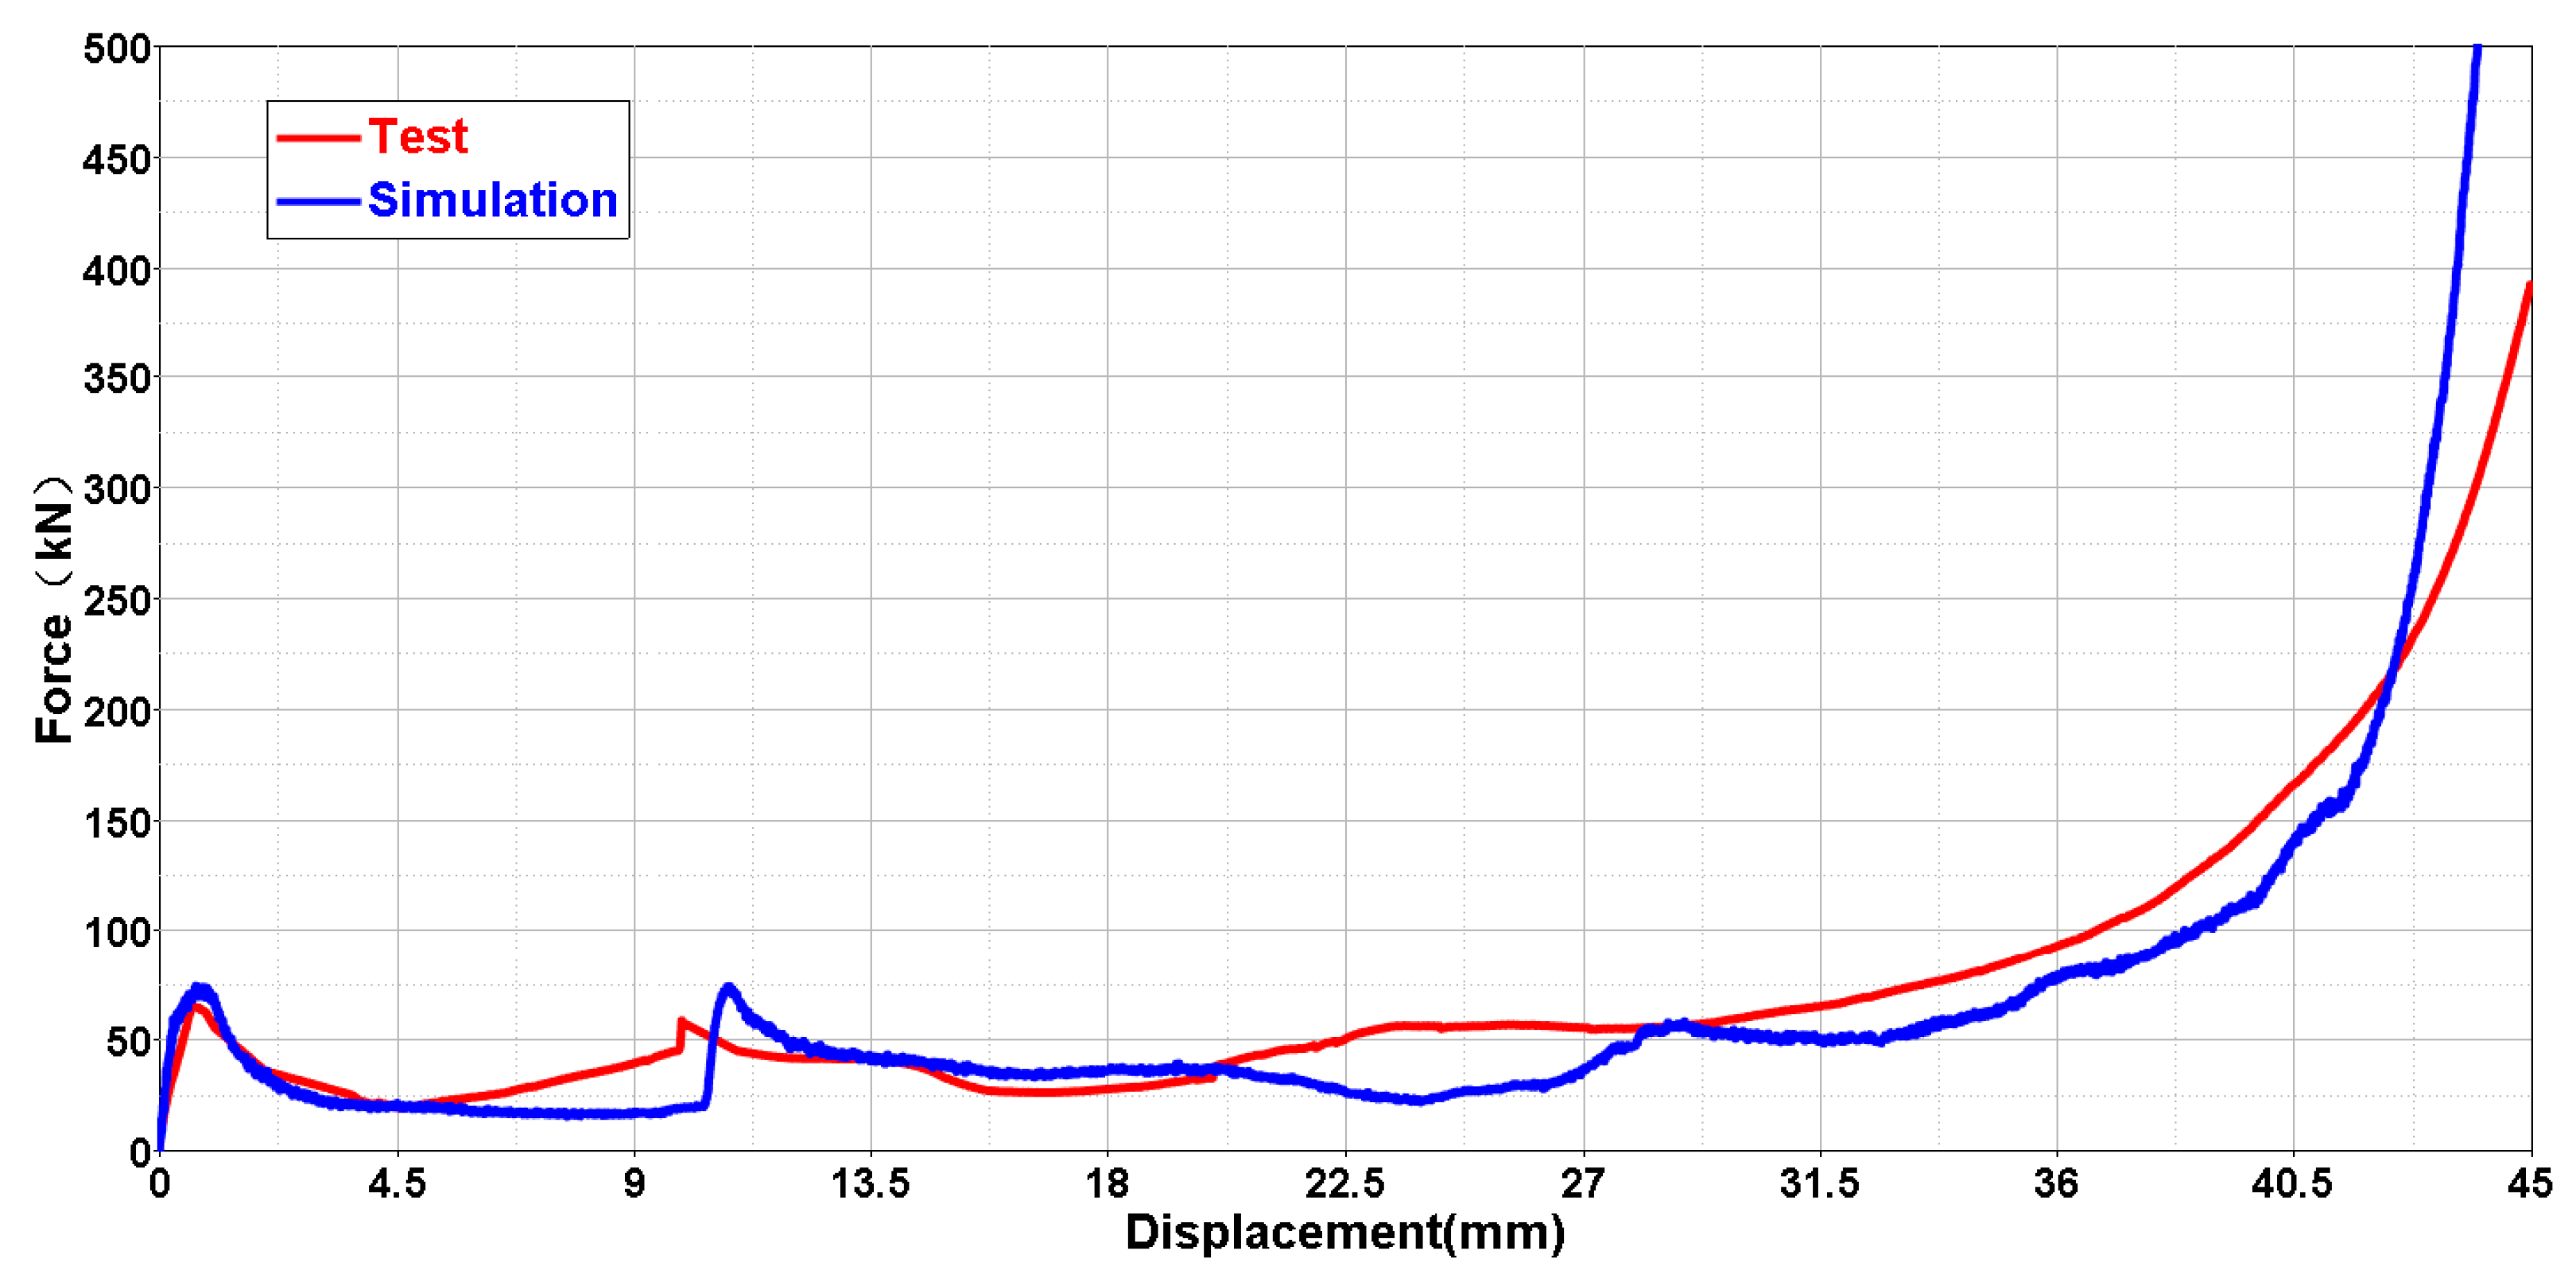
Figure 21.
Comparison of the force-displacement curves of the NPR structure (Type C, 24 cells per layer, 4 layers, = 0.5, = 1, h2 = 20 mm, r1 = 0 mm, r2 = 0.8 mm).
Figure 21.
Comparison of the force-displacement curves of the NPR structure (Type C, 24 cells per layer, 4 layers, = 0.5, = 1, h2 = 20 mm, r1 = 0 mm, r2 = 0.8 mm).
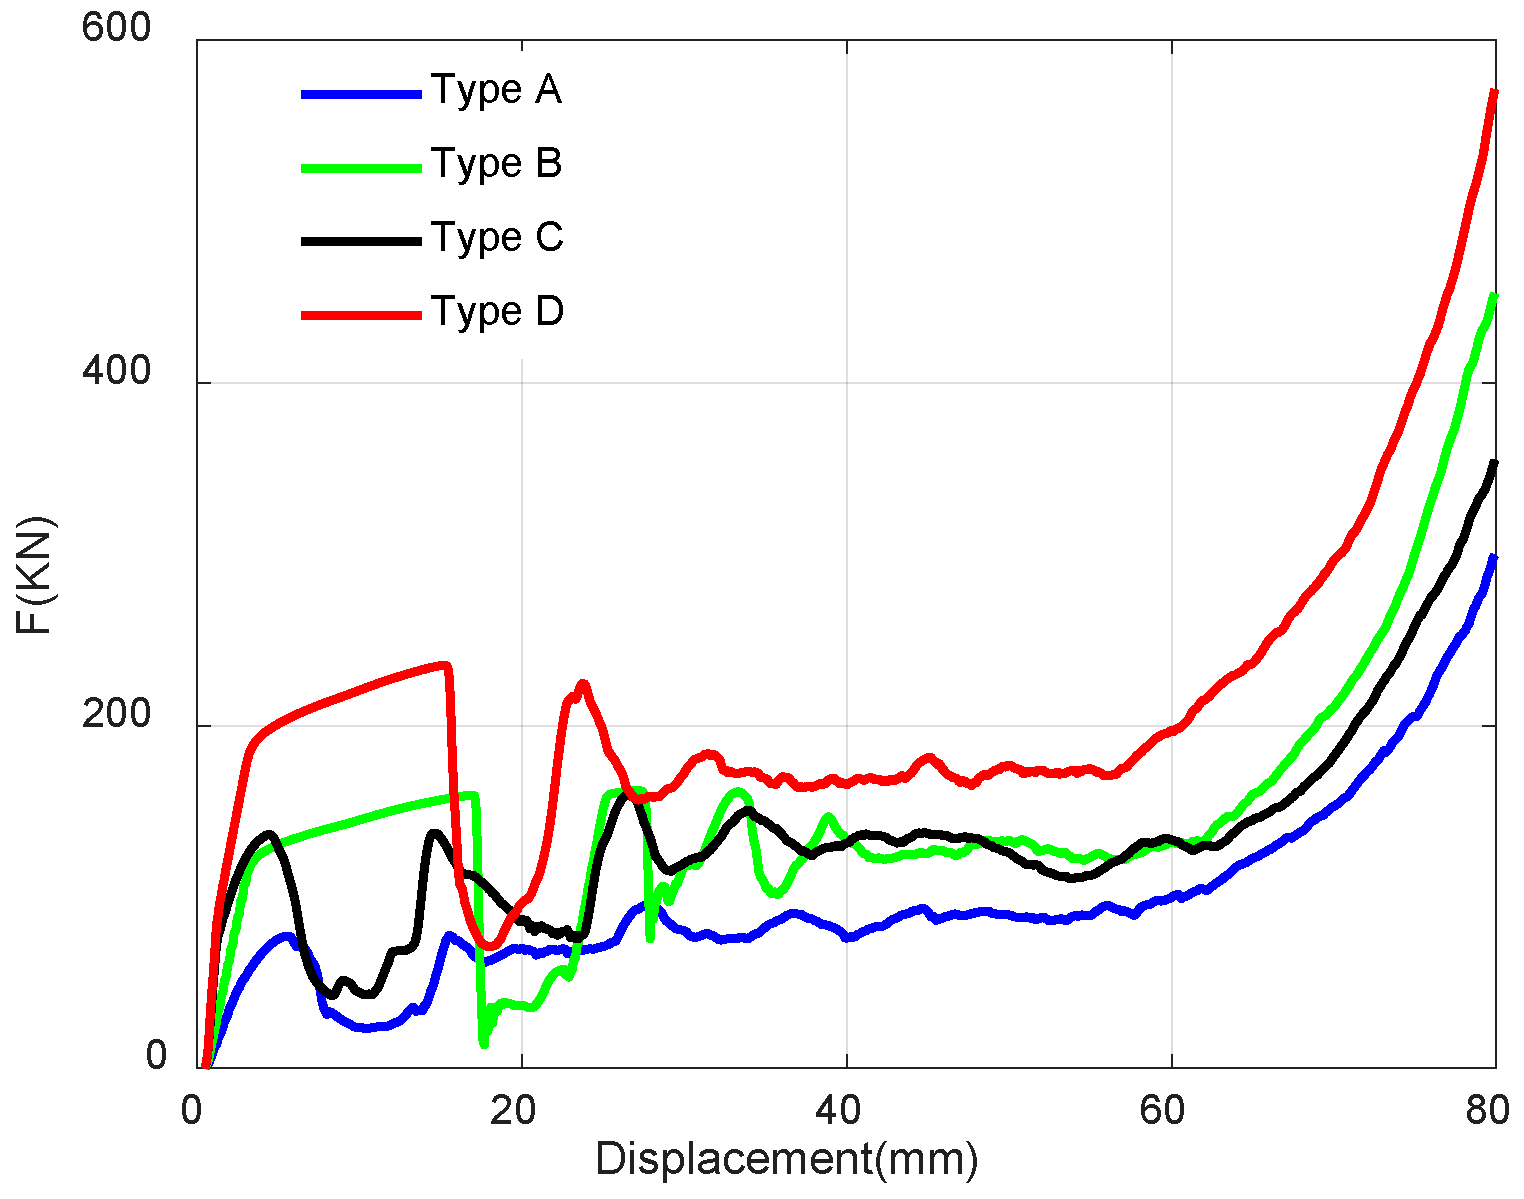
Figure 22.
Comparison of four lattices in terms of the quasi-static compressive force and displacement.
Figure 22.
Comparison of four lattices in terms of the quasi-static compressive force and displacement.
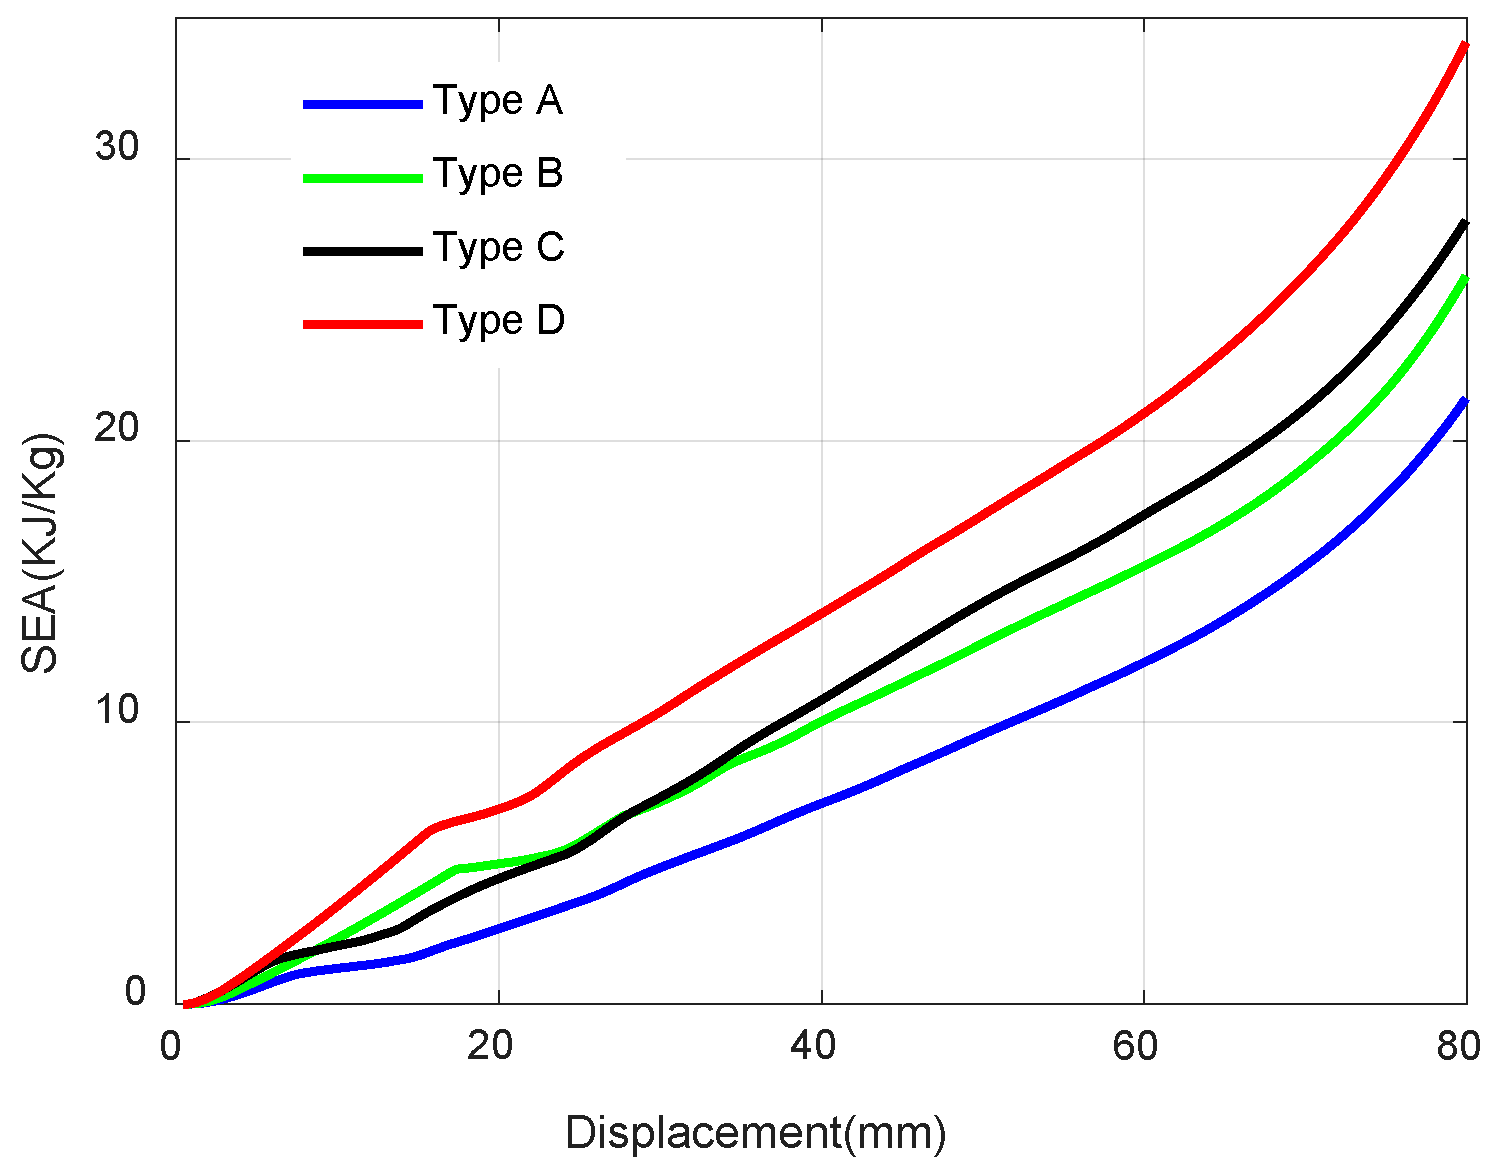
Figure 23.
Comparison of four lattices in terms of quasi-static compressive SEA and displacement.
Figure 23.
Comparison of four lattices in terms of quasi-static compressive SEA and displacement.
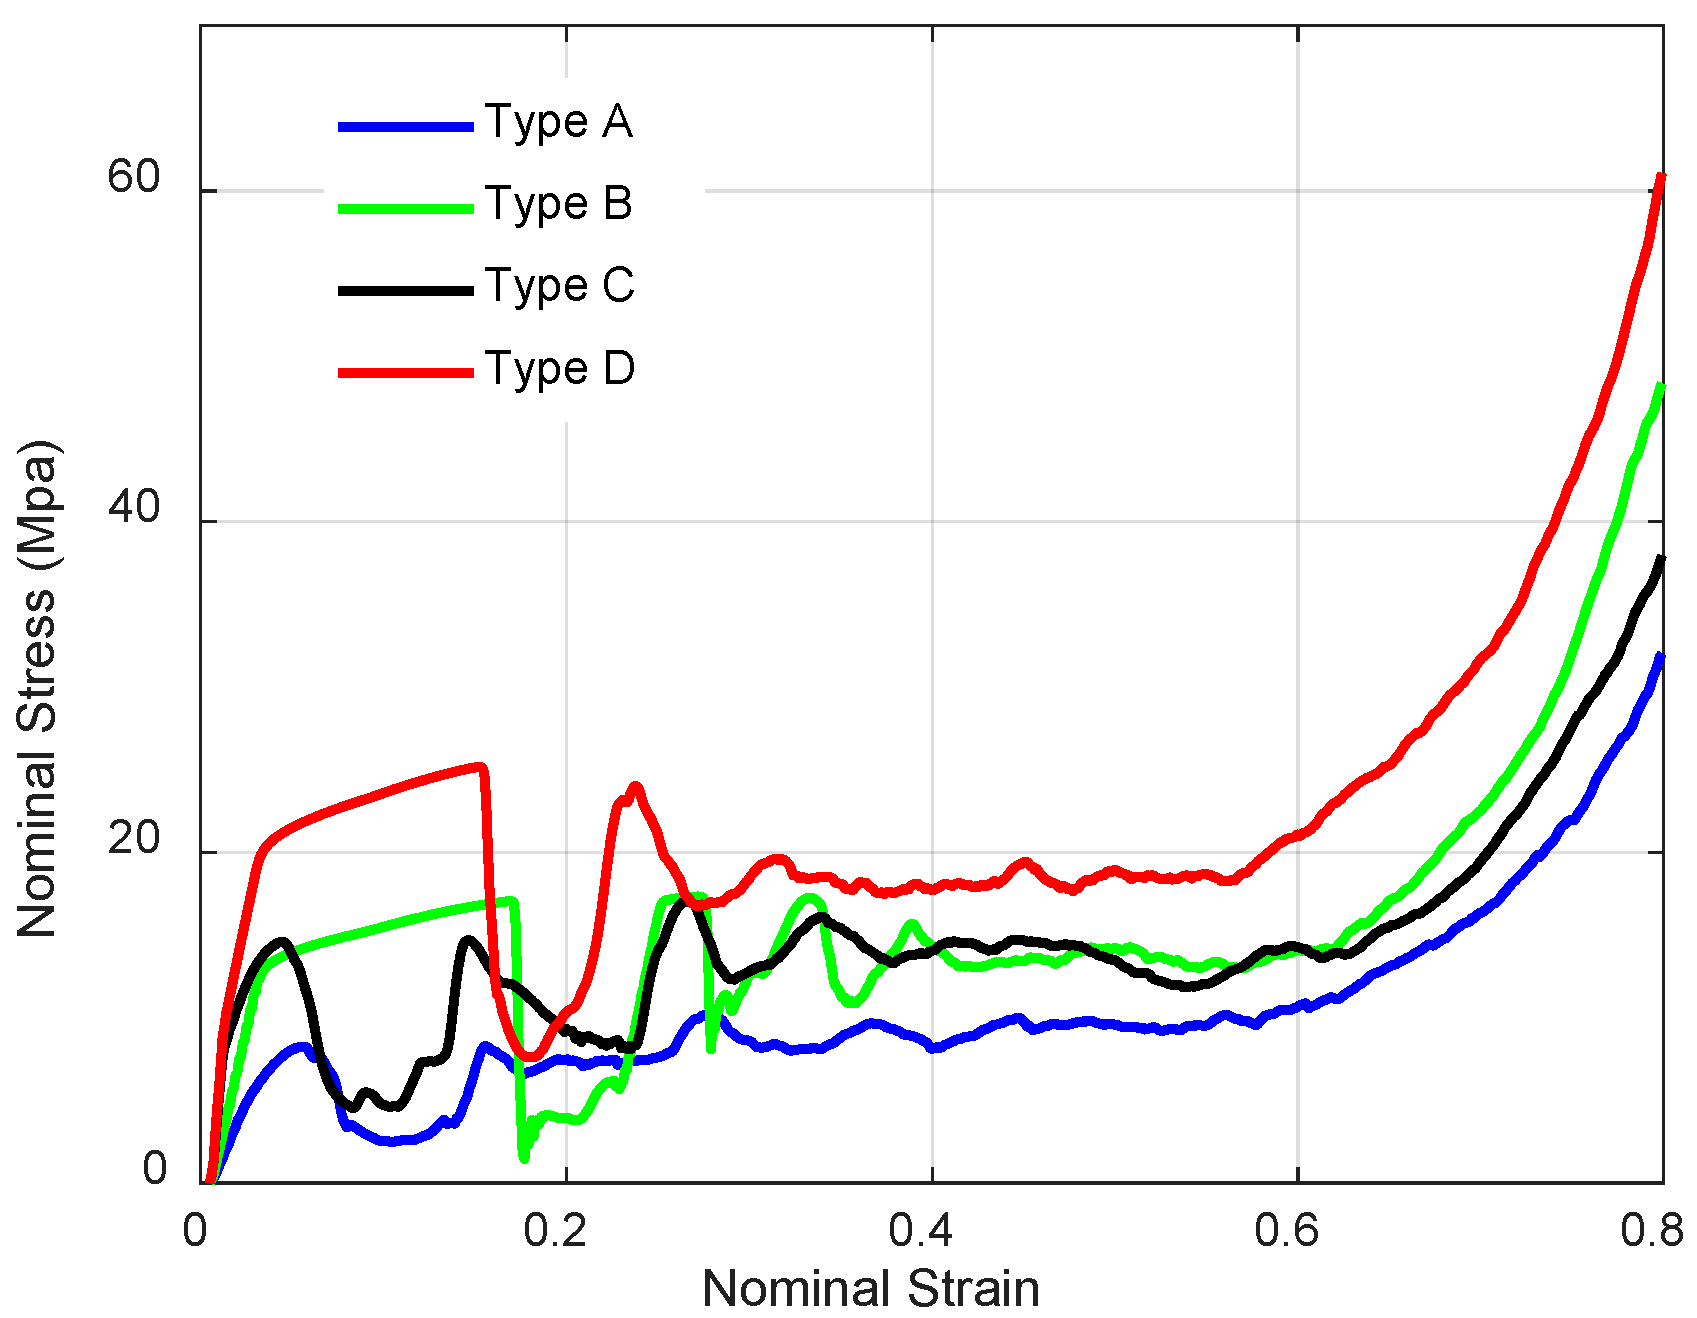
Figure 24.
Nominal stress-strain curves of NPR lattice structures.
Figure 24.
Nominal stress-strain curves of NPR lattice structures.
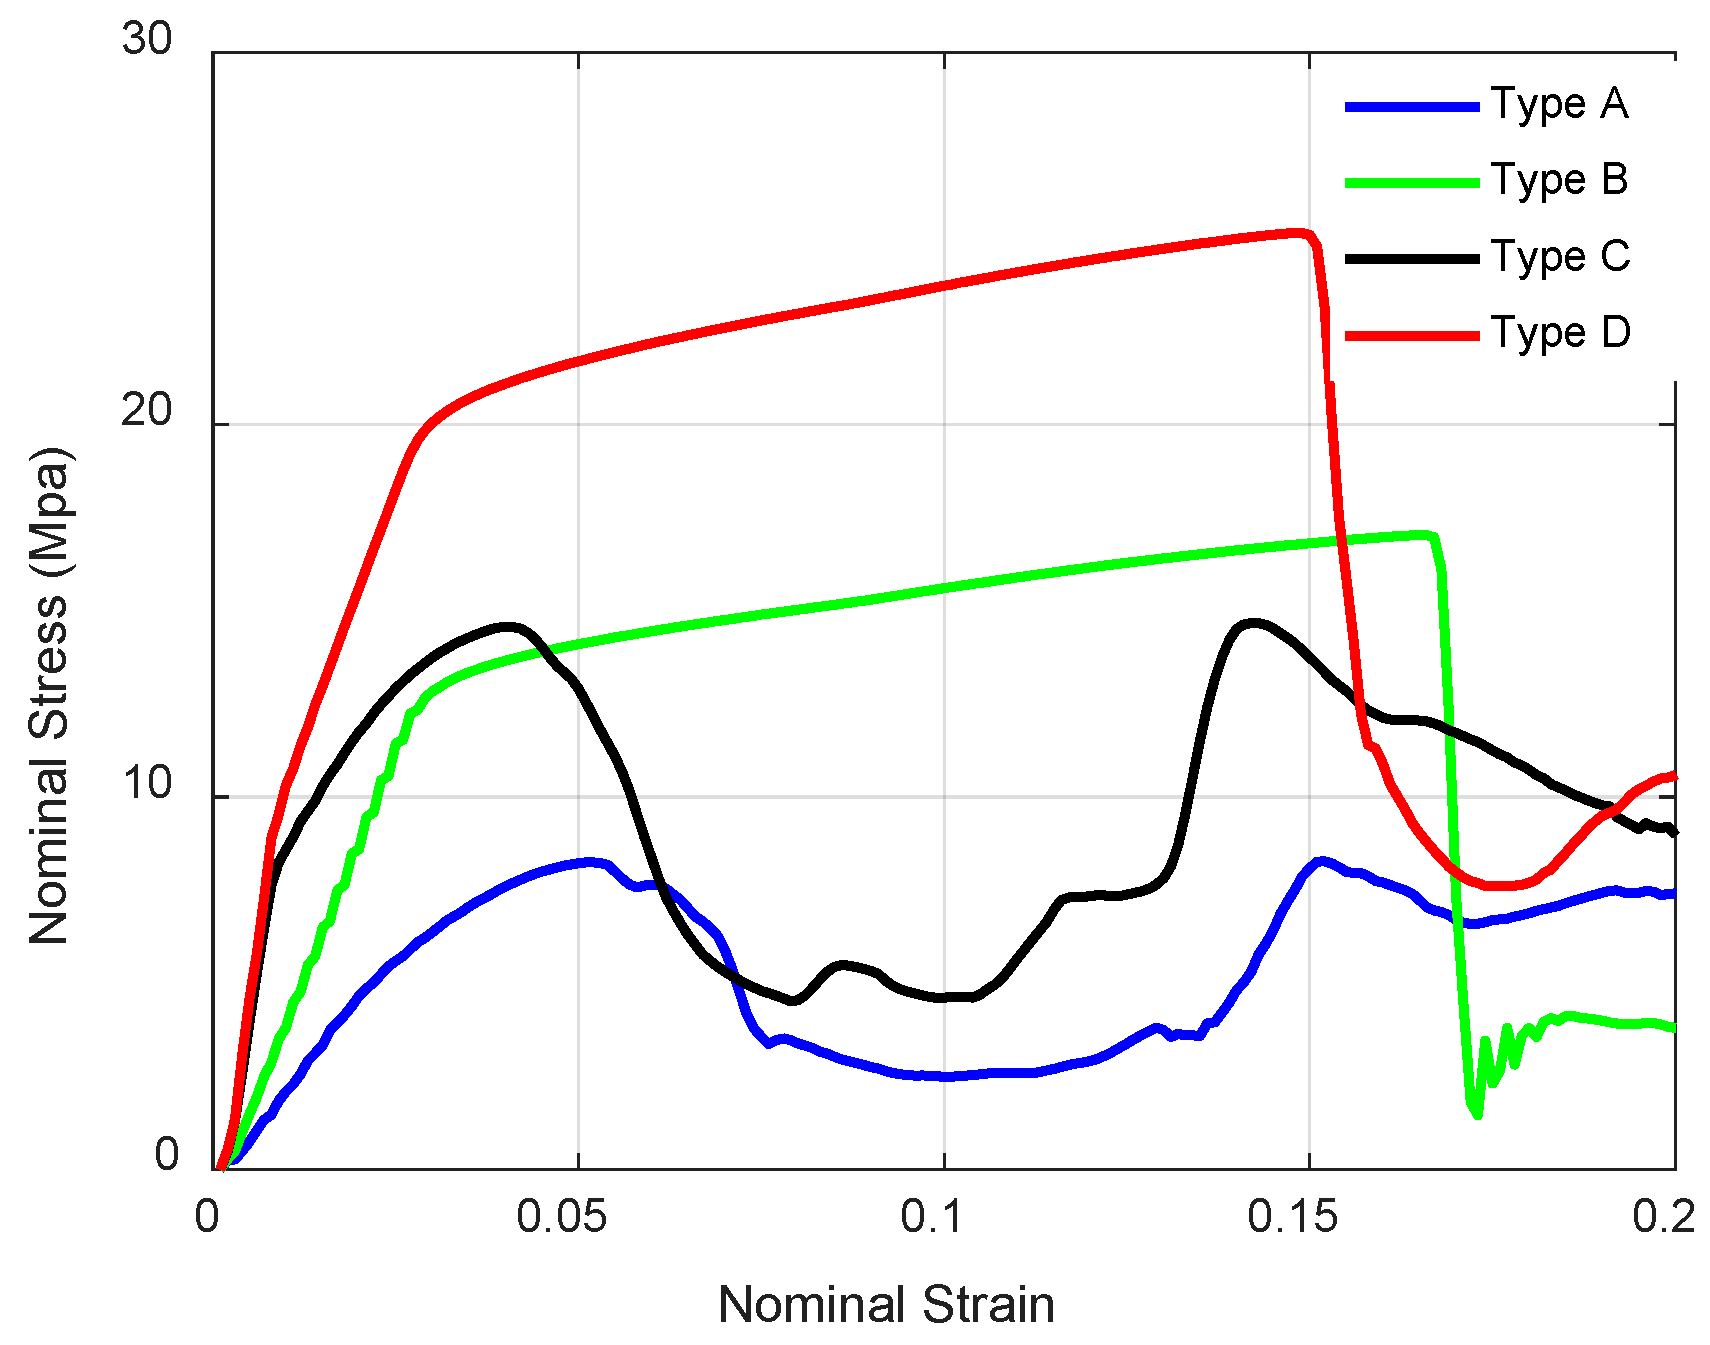
Figure 25.
Nominal stress-strain curves of NPR lattice structures (strain range from 0 to 0.2).
Figure 25.
Nominal stress-strain curves of NPR lattice structures (strain range from 0 to 0.2).
Figure 26.
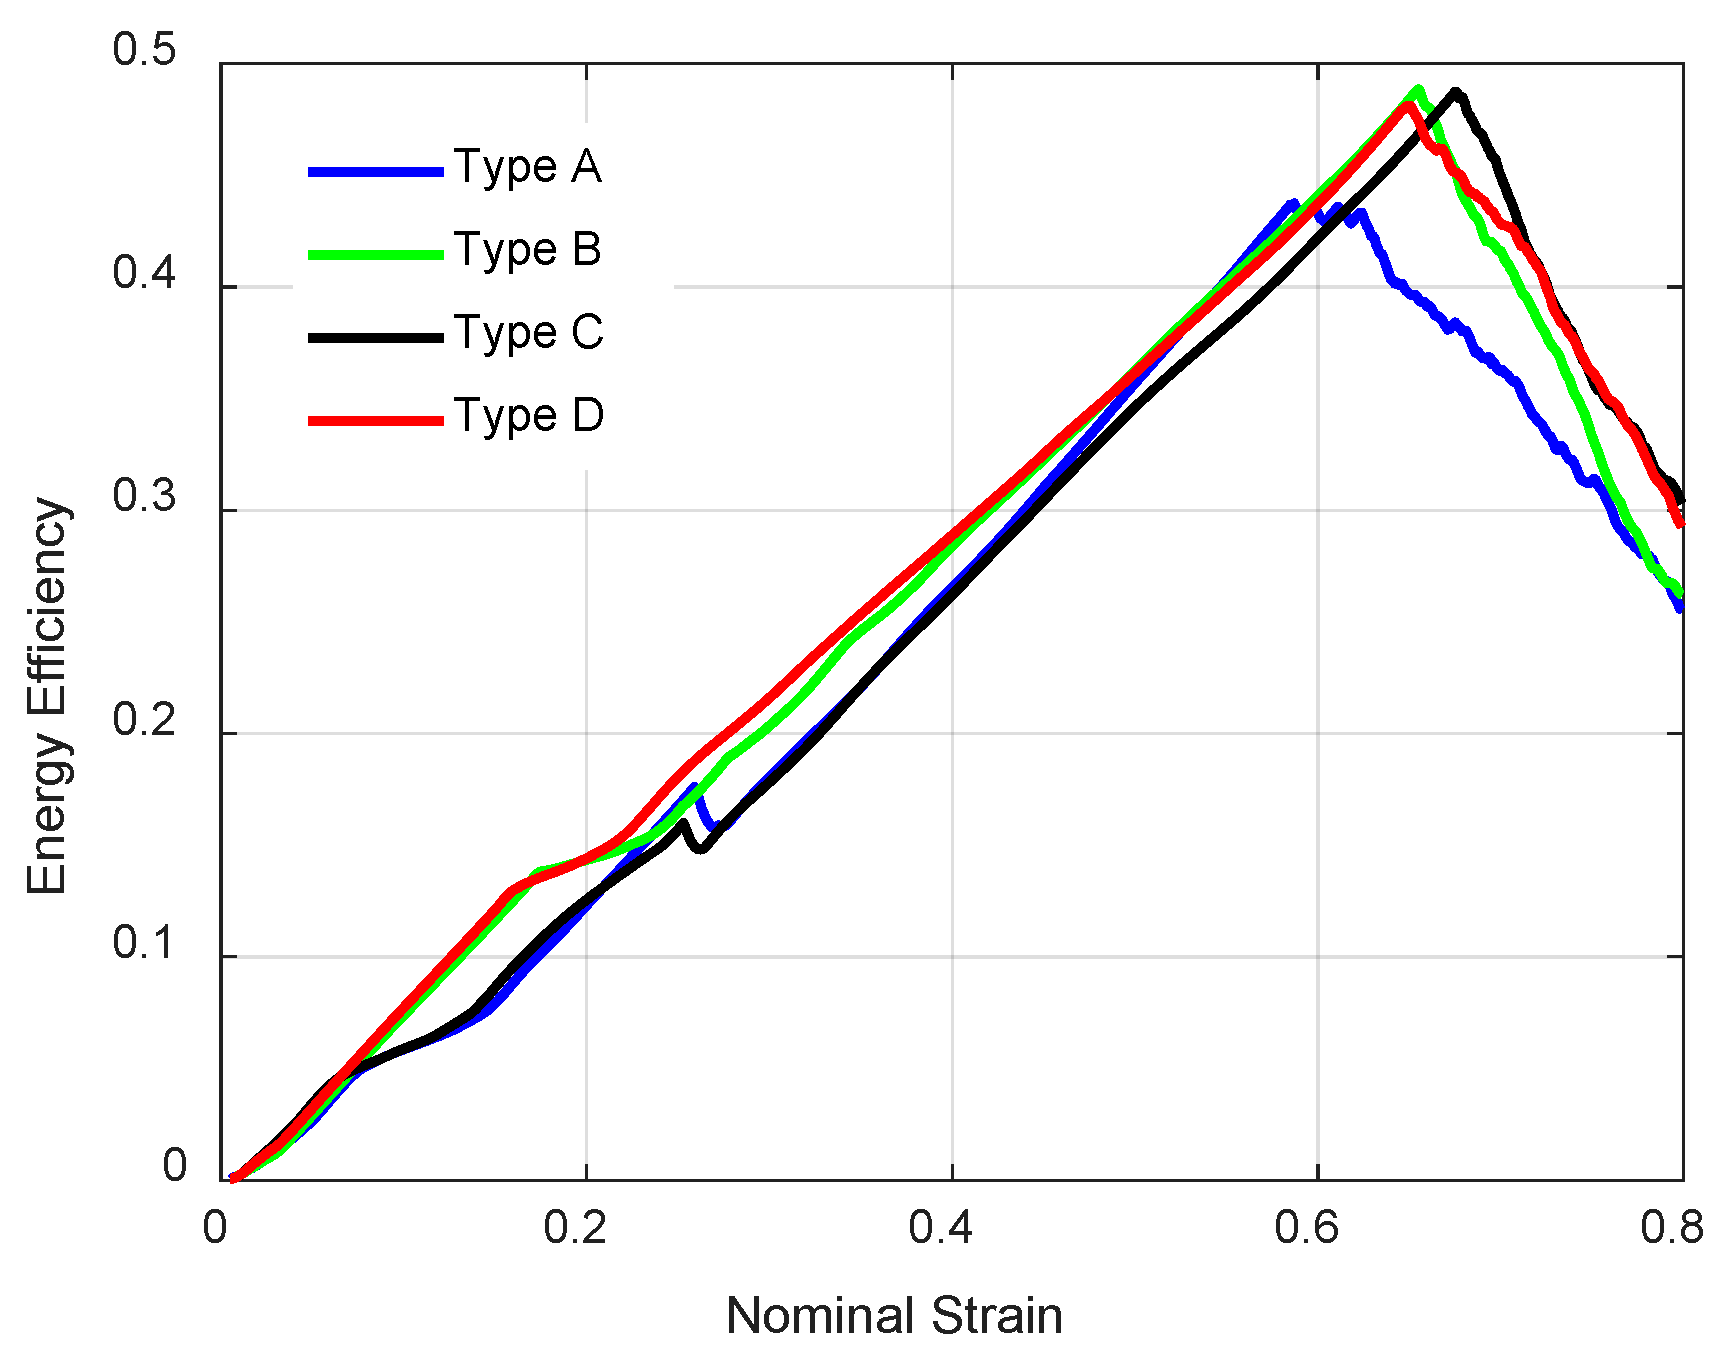
Energy efficiency curves of NPR lattice structures.
Figure 26.
Energy efficiency curves of NPR lattice structures.
Figure 27.
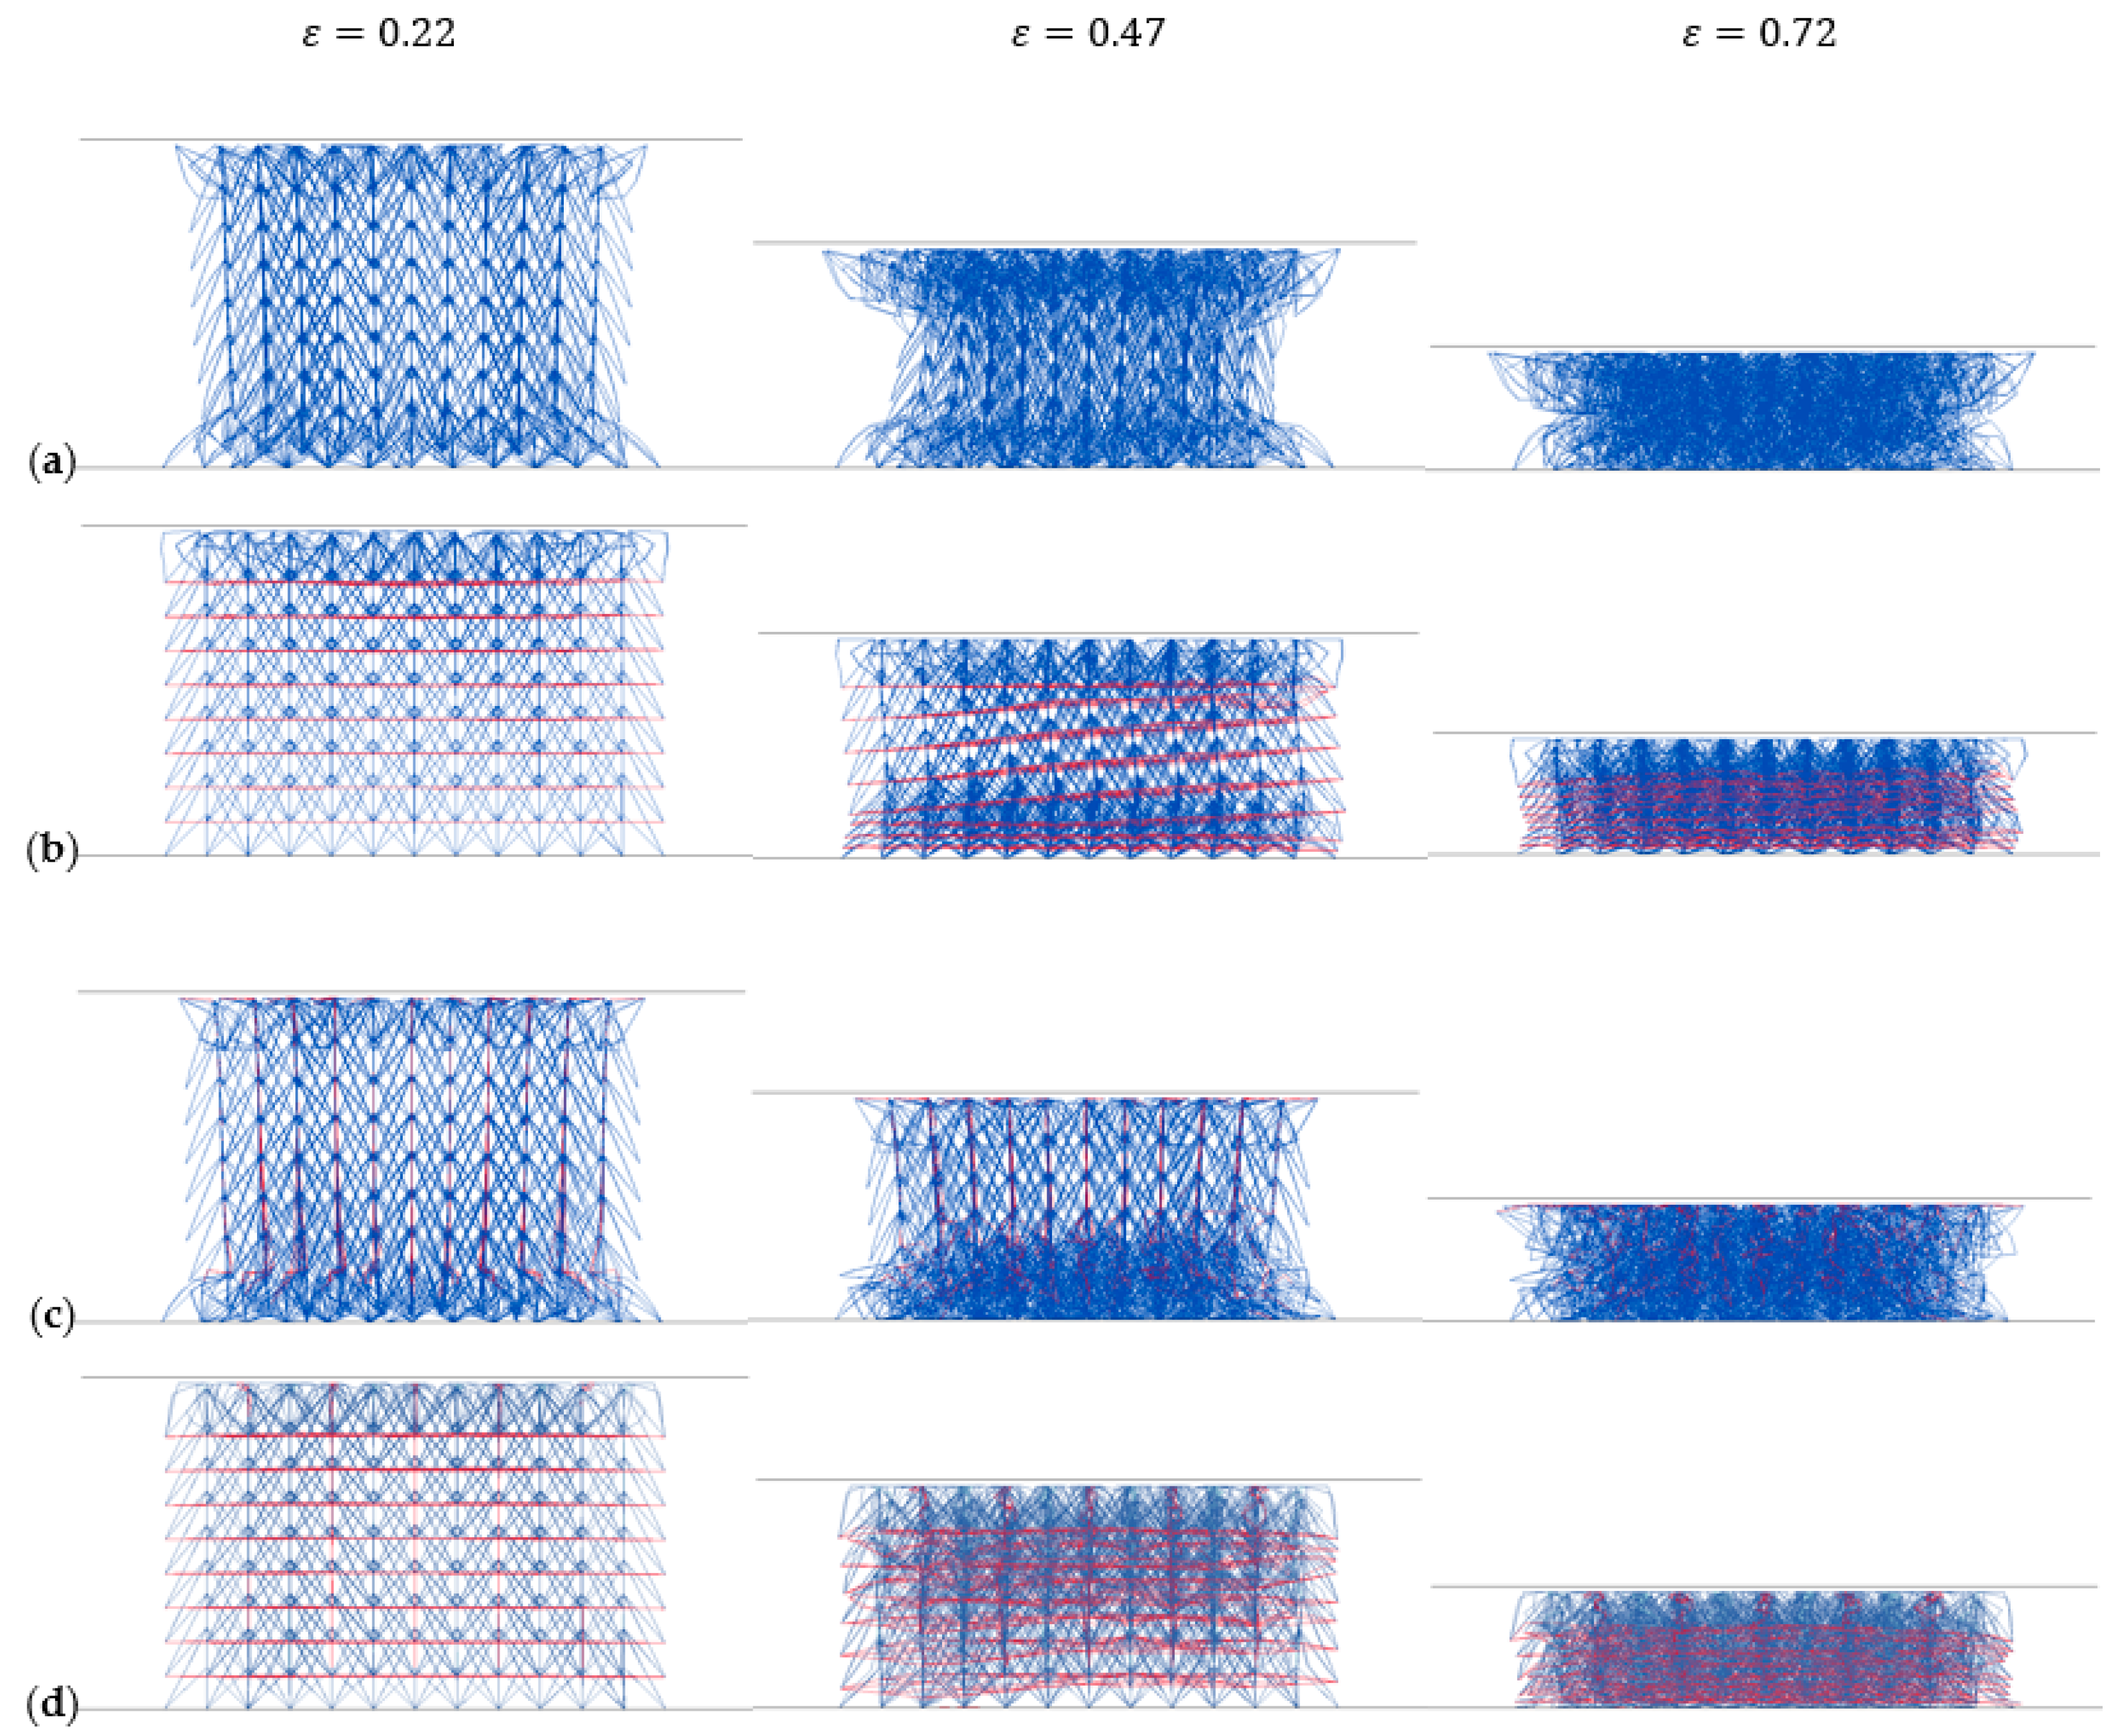
Compressive deformation of four NPR lattice structures: (a) Type A NPR lattice; (b) Type B NPR lattice; (c) Type C NPR lattice; (d) Type D NPR lattice.
Figure 27.
Compressive deformation of four NPR lattice structures: (a) Type A NPR lattice; (b) Type B NPR lattice; (c) Type C NPR lattice; (d) Type D NPR lattice.
Table 1.
The formula of relative density for four types of NPR lattices.
Table 1.
The formula of relative density for four types of NPR lattices.
| Types of NPR Cells | Relative Density |
|---|
| Type A | |
| Type B | |
| Type C | |
| Type D | |
Table 2.
Fitting parameters of Type A cell analyses.
Table 2.
Fitting parameters of Type A cell analyses.
| | | | | | | |
|---|
| e | 2.661 | 2.621 | 2.521 | 2.403 | 2.288 | 2.174 |
| R2 | 0.999 | 0.999 | 0.999 | 0.999 | 0.999 | 0.999 |
Table 3.
Fitting parameters of Type B cell analyses.
Table 3.
Fitting parameters of Type B cell analyses.
| | | | | | | |
|---|
| e | 2.893 | 2.719 | 2.332 | 2.032 | 1.836 | 1.715 |
| R2 | 0.999 | 0.999 | 0.999 | 0.998 | 0.997 | 0.997 |
Table 4.
Fitting parameters of Type C cell analyses.
Table 4.
Fitting parameters of Type C cell analyses.
| | | | | | | |
|---|
| e | 1.405 | 1.397 | 1.368 | 1.333 | 1.300 | 1.271 |
| R2 | 0.999 | 0.999 | 0.999 | 0.999 | 0.999 | 0.999 |
Table 5.
Fitting parameters of Type D cell analyses.
Table 5.
Fitting parameters of Type D cell analyses.
| | | | | | | |
|---|
| e | 1.553 | 1.658 | 1.653 | 1.559 | 1.468 | 1.393 |
| R2 | 0.999 | 0.999 | 0.999 | 0.999 | 0.999 | 0.999 |
Table 6.
The mechanical parameters of four NPR lattice structures.
Table 6.
The mechanical parameters of four NPR lattice structures.
| (MPa) | Type A | Type B | Type C | Type D |
|---|
| First elastic modulus | 209.7 | 461.45 | 1089.2 | 1271.7 |
| Yield stress | 8.24 | 17.04 | 14.56 | 25.15 |
Table 7.
The densification strain and plateau stress of four NPR structures.
Table 7.
The densification strain and plateau stress of four NPR structures.
| | Type A | Type B | Type C | Type D |
|---|
| 0.588 | 0.656 | 0.676 | 0.651 |
| (MPa) | 8.28 | 13.21 | 13.06 | 18.76 |
