Article

Hot Deformation Behavior and a Two-Stage Constitutive Model of 20Mn5 Solid Steel Ingot during Hot Compression

Department of Mechanical Engineering, Tsinghua University, Beijing 100084, China
*
Author to whom correspondence should be addressed.
Materials 2018, 11(3), 434; https://doi.org/10.3390/ma11030434
Submission received: 21 February 2018 / Revised: 7 March 2018 / Accepted: 14 March 2018 / Published: 16 March 2018
(This article belongs to the Special Issue Materials: 10th Anniversary)

Abstract

:
20Mn5 steel is widely used in the manufacture of heavy hydro-generator shaft forging due to its strength, toughness, and wear resistance. However, the hot deformation and recrystallization behaviors of 20Mn5 steel compressed under a high temperature were not studied. For this article, hot compression experiments under temperatures of 850–1200 °C and strain rates of 0.01 s−1–1 s−1 were conducted using a Gleeble-1500D thermo-mechanical simulator. Flow stress-strain curves and microstructure after hot compression were obtained. Effects of temperature and strain rate on microstructure are analyzed. Based on the classical stress-dislocation relationship and the kinetics of dynamic recrystallization, a two-stage constitutive model is developed to predict the flow stress of 20Mn5 steel. Comparisons between experimental flow stress and predicted flow stress show that the predicted flow stress values are in good agreement with the experimental flow stress values, which indicates that the proposed constitutive model is reliable and can be used for numerical simulation of hot forging of 20Mn5 solid steel ingot.

1. Introduction

Heavy cylinder forgings are widely used in key equipment such as a nuclear pressure vessel, hydro-generator shaft, and hydrogenation reactor [1,2].
20Mn5 steel has been widely used in the manufacture of hydro-generator shaft forging due to its good balance of strength, toughness, wear resistance, and weldability. However, for heavy 20Mn5 solid steel ingot, defects including coarse grains and shrinkage cavities exist. To lower the cost of production and shorten the production cycle of the heavy hydro-generator shaft forging, it is necessary to carry out numerical simulations to obtain reasonable forging process parameters to make sure that the coarse grains can be refined and shrinkage cavities can be eliminated. In order to carry out a successful simulation of the hot forging process, a precise constitutive model that describes the effect of temperature, strain rate, and strain on stress is essential. At present, there are no reports on the constitutive model of heavy 20Mn5 solid steel ingot.
In this article, hot compression experiments of 20Mn5 steel under temperatures of 850–1200 °C and strain rates of 1/s, 0.1/s, and 0.01/s are carried out using a Gleeble-1500D thermo-mechanical simulator. Flow stress-strain curves and microstructure after hot compression on different temperatures and strain rates are obtained. Based on the experimental flow stress curves, a two-stage constitutive model is established by introducing the classical stress–dislocation relationship and the kinetic equation of dynamic recrystallization (DRX) [3,4,5,6,7,8,9,10,11,12,13,14,15,16,17,18,19,20,21,22]. By comparisons of the predicted flow stress values and experimental flow stress values, the proposed physically-based constitutive model shows high accuracy. Therefore, the newly developed constitutive model of 20Mn5 steel can be used for numerical simulations of the hot forging process. Moreover, the flow stress curves and microstructure after hot compression can provide an important reference for the establishment of forging process specifications for a 20Mn5 heavy hydro-generator shaft.

2. Materials and Methods

2.1. Experimental Material

Cylindrical samples with a diameter of 8 mm and a height of 12 mm were taken from a 20Mn5 solid steel ingot used for a heavy hydro-generator shaft. The chemical composition of 20Mn5 steel is given in Table 1. Figure 1 shows the initial as-cast microstructure of 20Mn5 steel, which contains ferrite and pearlite. The white part represents ferrite, and the black part represents pearlite.

2.2. Experimental Procedure

The hot compression experiments were carried out on a Gleeble-1500D (DSI, New York, NY, USA) thermal and mechanical simulation machine. First, the specimens were heated to 1000 °C at a heating rate of 5 °C/s and held there for 3 min. Then, the temperature was adjusted to deformation temperature (850–1200 °C, with a 50 °C interval) at 10 °C/s and held for 60 s to get a uniform temperature distribution. Then, the specimens were compressed to a true strain of 0.7 under deformation temperatures of 850–1200 °C with a 50 °C interval and strain rates of 1/s, 0.1/s, and 0.01/s. Finally, the specimens were quenched with water in order to retain the morphologies of austenite grains. After the hot compression experiments, the specimens were cut, ground, polished, and etched in the mixture of 5 g picric acid, 4 g sodium dodecyl benzene sulfonate, and 100 mL water at 60–70 °C. Then, the morphologies of emerged austenite grains were observed by OLYMPUS BX51 microscope (Olympus Corporation, Tokyo, Japan).

3. Results and Discussion

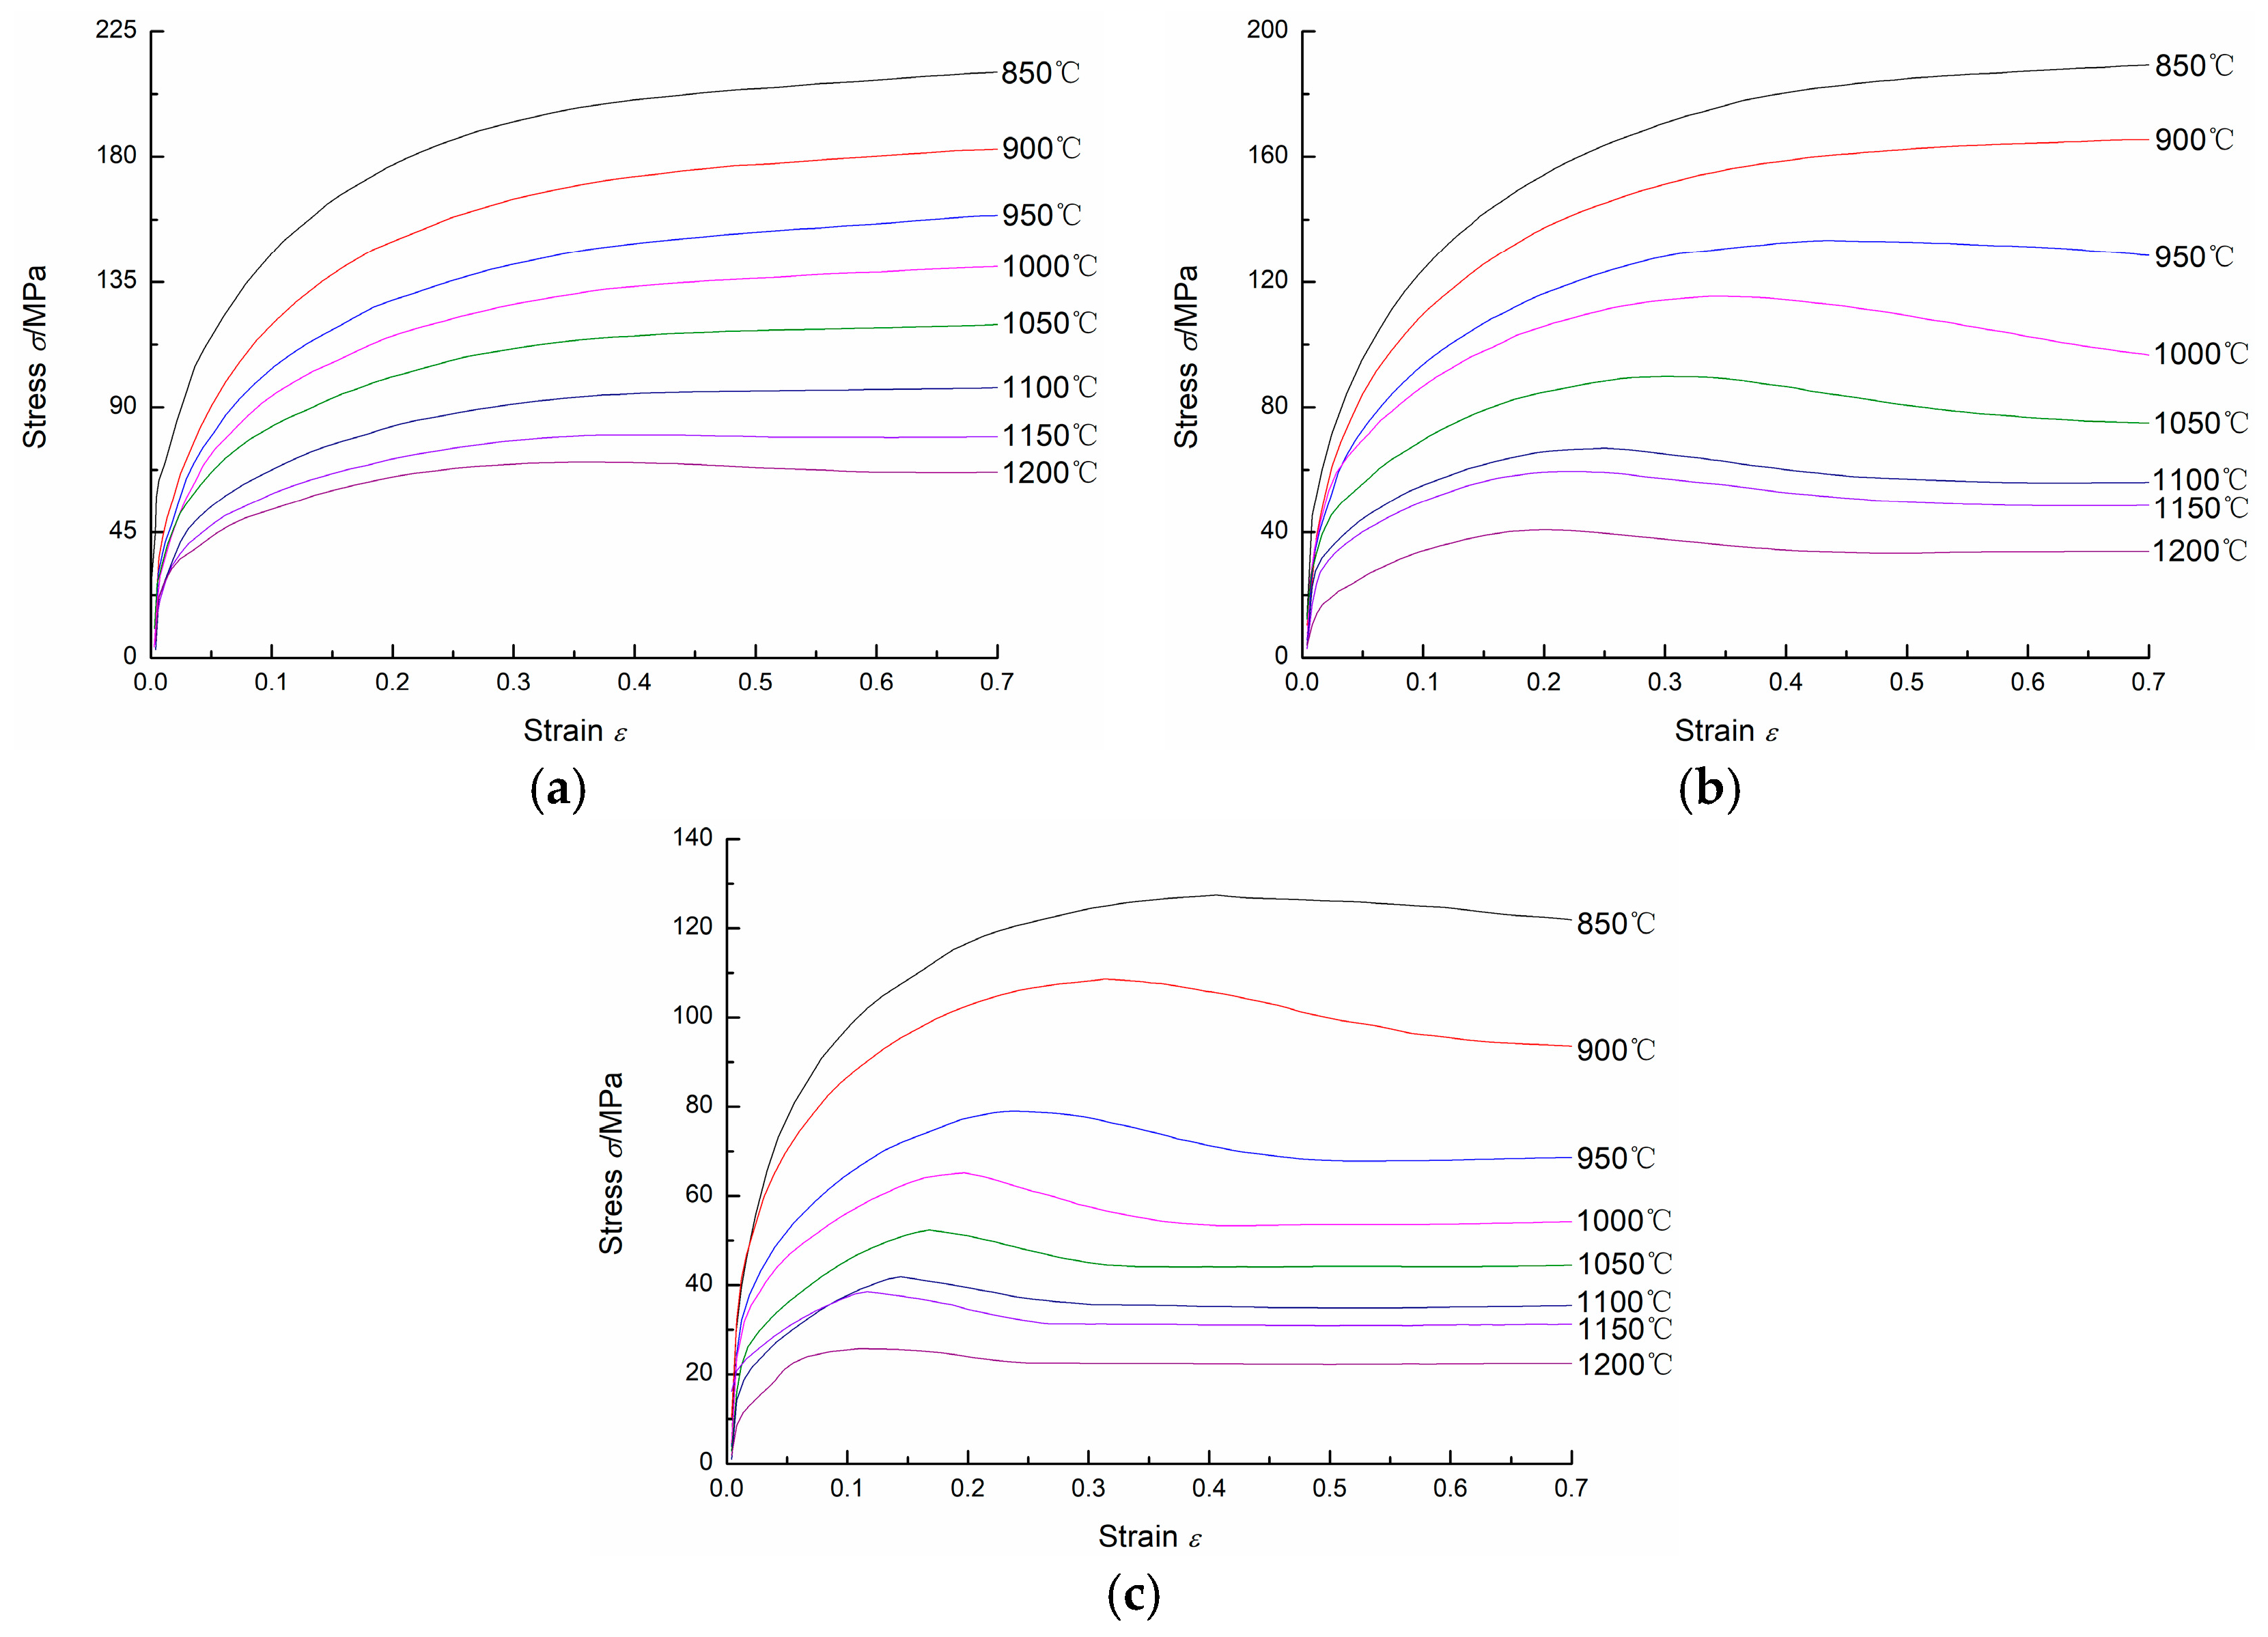
3.1. Flow Stress Curves

Figure 2 shows the flow stress curves of 20Mn5 steel compressed at different temperatures and different strain rates. As shown in Figure 2, for the same strain rate and strain, the flow stress is larger when the specimen is compressed at a lower temperature; for the same temperature and strain, the flow stress is larger when the specimen is compressed at higher strain rate. It can easily be seen that at high temperatures and low strain rates, the flow stress increases to a peak stress at first, and then reduces to a steady-state stress and remains as a constant as the strain increases. For low temperatures and high strain rates, the steady-state stress does not occur. Moreover, for the same strain rate, the peak strain and steady-state strain increase when the compression temperature decreases; for the same temperature, the peak strain and steady-state strain increase when the strain rate increases.
For 20Mn5 steel, the flow stress is influenced by work hardening (WH), dynamic recovery (DRV), and dynamic recrystallization (DRX), which compete during hot compression. In the initial deformation stage, working hardening and dynamic recovery occur. Dislocation movement and rearrangement can reduce the dislocation density, but working hardening comes into prominence. As a result, the flow stress increases as the strain increases. When strain reaches a critical value, dynamic recrystallization occurs and the softening effect caused by dynamic recrystallization dominates. Correspondingly, the flow stress increases gradually until peak stress at first, and then decreases as the strain increases. Finally, a dynamic balance between working hardening, dynamic recovery, and dynamic recrystallization is reached. The flow stress remains constant as the strain increases [23,24].

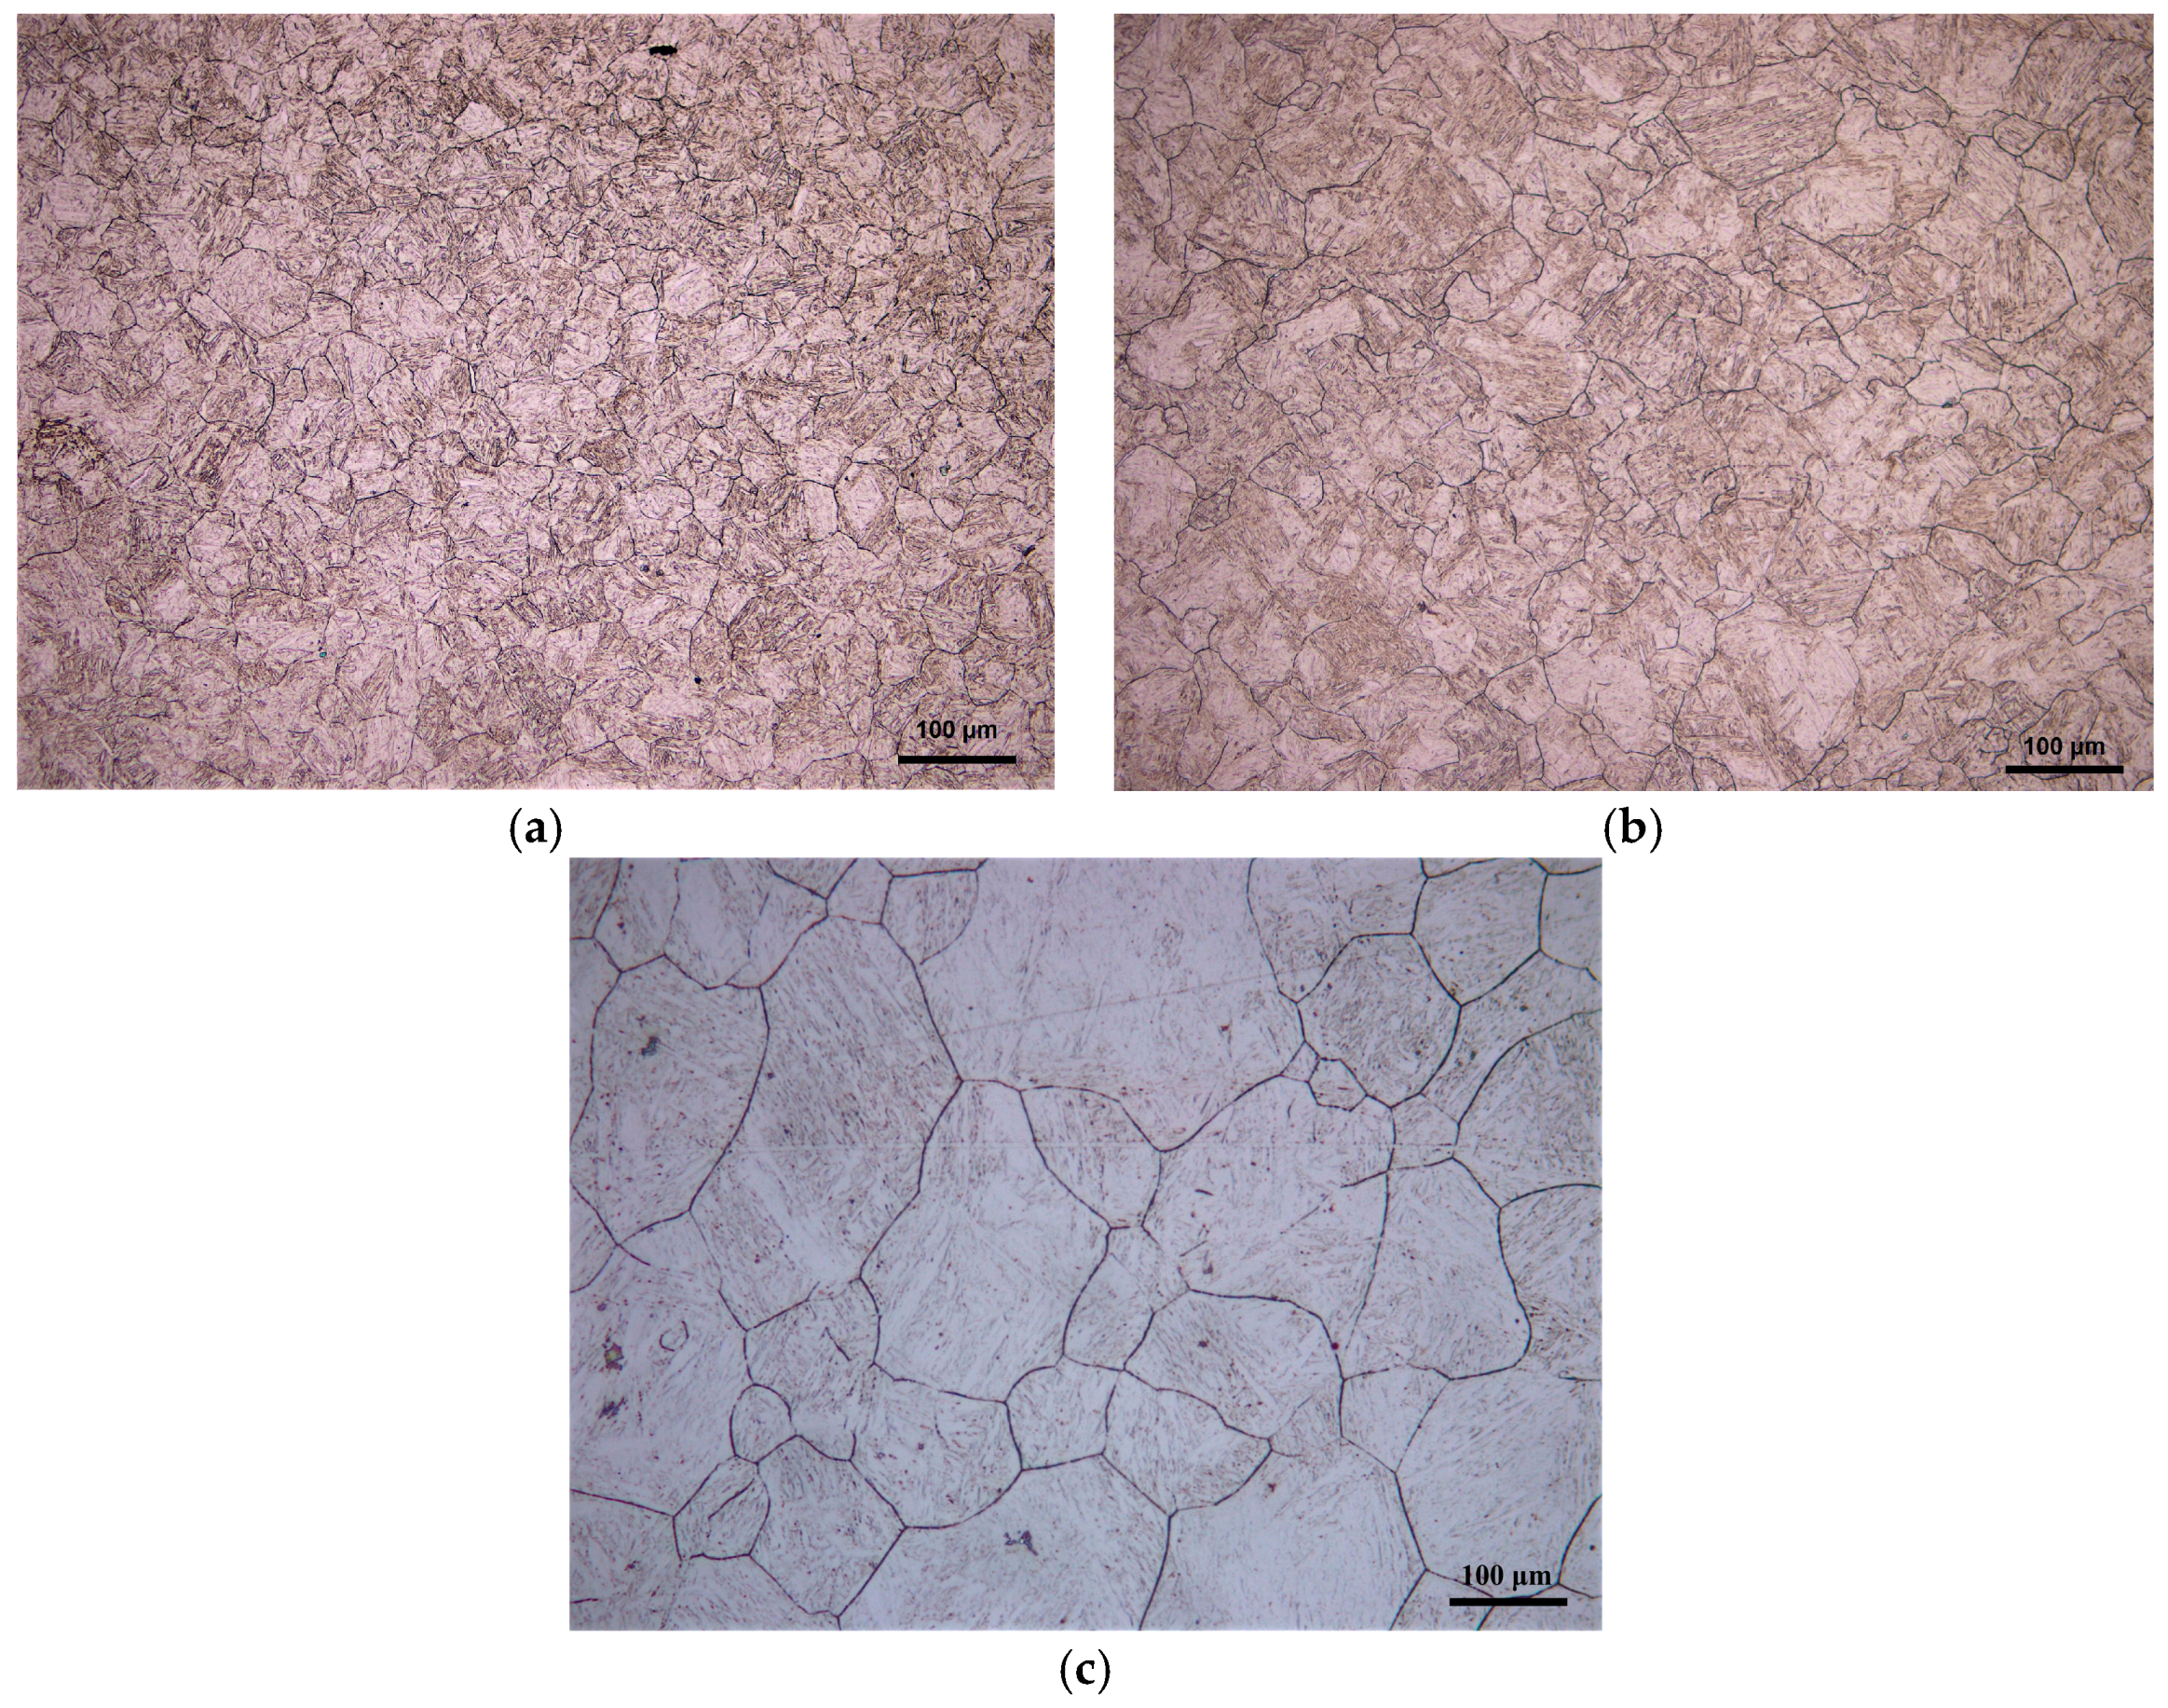
3.2. Effect of Temperature and Strain Rate on Microstructure after Hot Compression

Figure 3 shows the microstructure of 20Mn5 steel compressed to a true strain of 0.7 under a strain rate of 0.01/s and different temperatures. It is obvious that the austenite grain size increases with the increase of the compression temperature. Under eight temperatures and a strain rate of 0.01/s, dynamic recrystallization occurs. The occurrence of dynamic recrystallization shown in Figure 3 can also be seen from the measured flow stress curves. In the above flow stress curves corresponding to Figure 3, the flow stress curves all reach a steady state when the strain equals a certain value, which indicates that dynamic recrystallization is complete.
Figure 4 shows the microstructure of 20Mn5 steel compressed to a true strain of 0.7 at 1200 °C and different strain rates. The higher the strain rate, the smaller the grain size. The reason for this phenomenon is that the high strain rate reduces the deformation time at a certain strain and the recrystallized nucleus has insufficient time to fully grow [23,24].

4. Establishment of a Two-Stage Constitutive Model and Its Verification

4.1. The Derivation of a Two-Stage Constitutive Model

Figure 5 shows two typical flow stress curves for hot working. In curve B, in the initial deformation stage (0 ≤ ε < εc), stress increases from σ0 to σc as a result of working hardening and dynamic recovery. When strain equals a critical value εc, dynamic recrystallization occurs. As strain increases, first, the stress increases from σc to σp, and then stress decreases from σp to a steady-state stress σss. If dynamic recrystallization never occurs in some materials, the change of stress with strain will be similar to curve A.
The flow stress curve of 20Mn5 steel in this study is similar to curve B, and a two-stage method is used to establish the flow stress model of 20Mn5 steel.
(1) Stage of working hardening and dynamic recovery (0 ≤ ε < εc)
The evolution of the dislocation density with strain is generally considered to be as follows:
d ρ d ε = k 1 ρ k 2 ρ ,
where k1 represents the coefficient of working hardening and k2 is the coefficient of dynamic recovery.
When ε = 0 , ρ = ρ 0 , where ρ 0 is the initial dislocation density.
By integration of Equation (1), dislocation density ρ can be expressed as follows:
ρ = ( k 1 k 2 k 1 k 2 e k 2 2 ε + ρ 0 e k 2 2 ε ) 2 ,
when d ρ d ε = 0 , ρ s = ( k 1 k 2 ) 2 , where ρ s is the saturation dislocation density corresponding to the saturation stress σ s .
Based on the above equations and the classical Taylor relation σ = α μ b ρ , where α is the material constant, μ is the shear modulus, and b is the distance between atoms in the slip direction, the stress σ W H at strain ε can be expressed as follows:
σ W H = σ s + ( σ 0 σ s ) e k 2 2 ε , ( ε ε c ) .
(2) Stage of dynamic recrystallization (εεc)
The volume fraction of DRX, X d r x , can be determined by the following equation:
X d r x = 1 exp ( k d ( ε ε c ε p ) n d ) ,   ( ε ε c ) ,
where X d r x is the volume fraction of DRX, ε c is the critical strain, ε p is the peak strain, and k d and n d are constants related to material.
The relationship between X d r x and stress parameters can be given as follows:
X d r x = σ W H σ σ s σ s s ,   ( ε ε c ) ,
where σ s is the saturation stress, σ s s is the steady-state stress, σ W H is the stress at strain ε calculated by Equation (3), and σ is flow stress at strain ε .
By combining Equations (4) and (5), the flow stress during DRX period can be given by the following expression:
σ = σ W H ( σ s σ s s ) ( 1 exp ( k d ( ε ε c ε p ) n d ) ) ,   ( ε ε c ) .

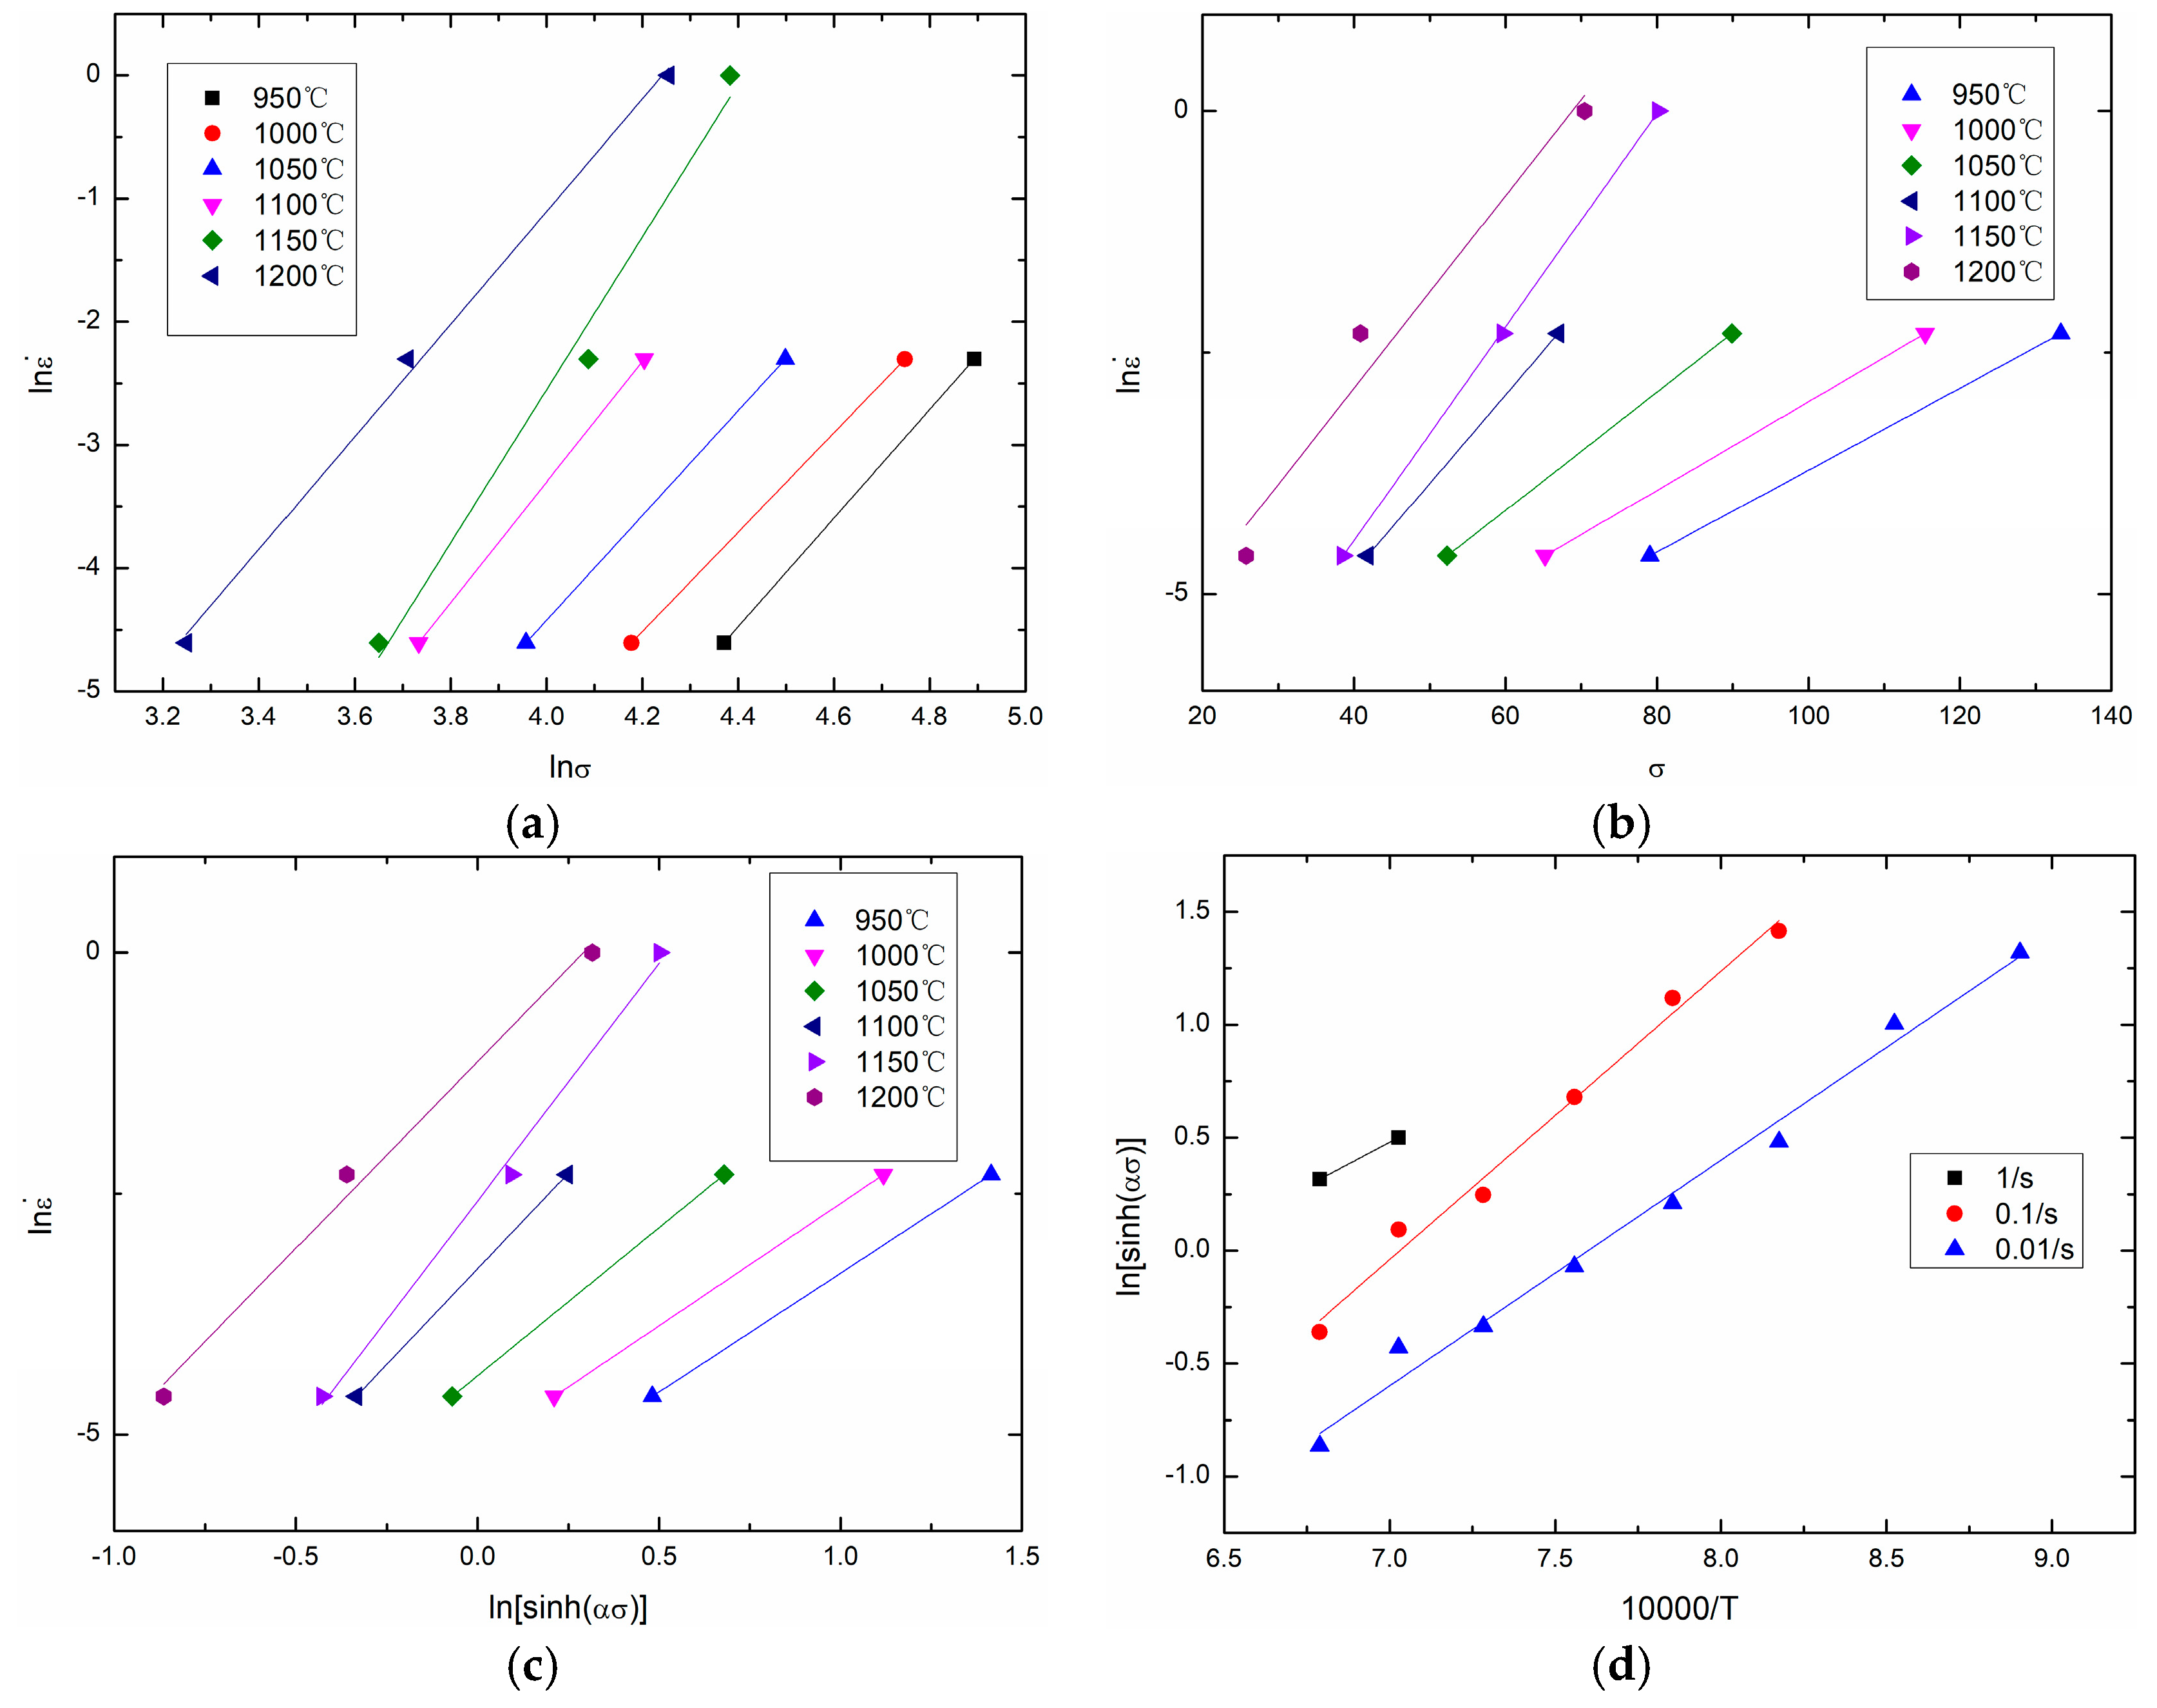
4.2. Determination of Material Constants (α, n, Q, and A) Based on the Peak Stress

The Arrhenius equation proposed by Sellars and Tegart is widely used to describe the relationship between flow stress, strain rate and temperature:
ε = A [ sinh ( α σ ) ] n exp ( Q R T ) ,
where A , α , and n are material constants; Q is the activation energy of deformation (J/mol); ε is the strain rate (s−1); σ is the flow stress (MPa); T is the absolute temperature (K); and R is the gas constant (8.314 J/(mol·K)).
Based on a Taylor expansion, the following equations can be obtained:
e α σ = 1 + α σ + ( α σ ) 2 2 ! + ( α σ ) 3 3 ! + ,
e α σ = 1 + ( α σ ) + ( α σ ) 2 2 ! + ( α σ ) 3 3 ! + ,
sinh ( α σ ) = e α σ e α σ 2 = α σ + ( α σ ) 3 3 ! + ,
According to Equations (7) and (10), the following equations can be easily obtained:
ε = A 1 σ n 1 exp ( Q R T ) ,   for   low   stress   level
ε = A 2 exp ( β σ ) exp ( Q R T ) ,   for   high   stress   level .
According to Equations (7), (11) and (12), the following equation is obvious:
α = β n 1 .
Taking the natural logarithms on both sides of Equations (7), (11), and (12), the following expressions can be obtained:
ln ε = ln A + n ln [ sinh ( α σ ) ] + ( Q R T ) ,
ln ε = ln A 1 + ( Q R T ) + n 1 ln σ ,
ln ε = ln A 2 + ( Q R T ) + β σ .
In this study, σ in the above equations is taken as the peak stress σ p . Based on experimental data and Equations (14)–(16), Figure 6 is drawn as follows. In Figure 6a, the slopes of the lines equal n1, and n1 = 4.724533 is obtained. In Figure 6b, the slopes of the lines equal β, and β = 0.075217 is obtained. Thus, α = β/n1 = 0.01592. In Figure 6c, the slopes of the lines equal n, and n = 3.474378 is obtained. In Figure 6d, the slopes of the lines equal Q/(10,000 nR), and the intercepts of the lines equal −(1/n)lnA + (1/n)ln ε . Thus, Q = 293561.4895 J/mol and A = 1.13 × 10¹² can be obtained.
From Equation (7), the following equation can be obtained:
σ p = ln ( ( Z A ) 1 n + ( Z A ) 2 n + 1 ) α = ln ( ( ε · exp ( Q R T ) A ) 1 n + ( ε · exp ( Q R T ) A ) 2 n + 1 ) α .
Based on the calculated material constants ( α , n , Q , and A ), the peak stress σ p at any temperature T and any strain rate ε can be obtained.

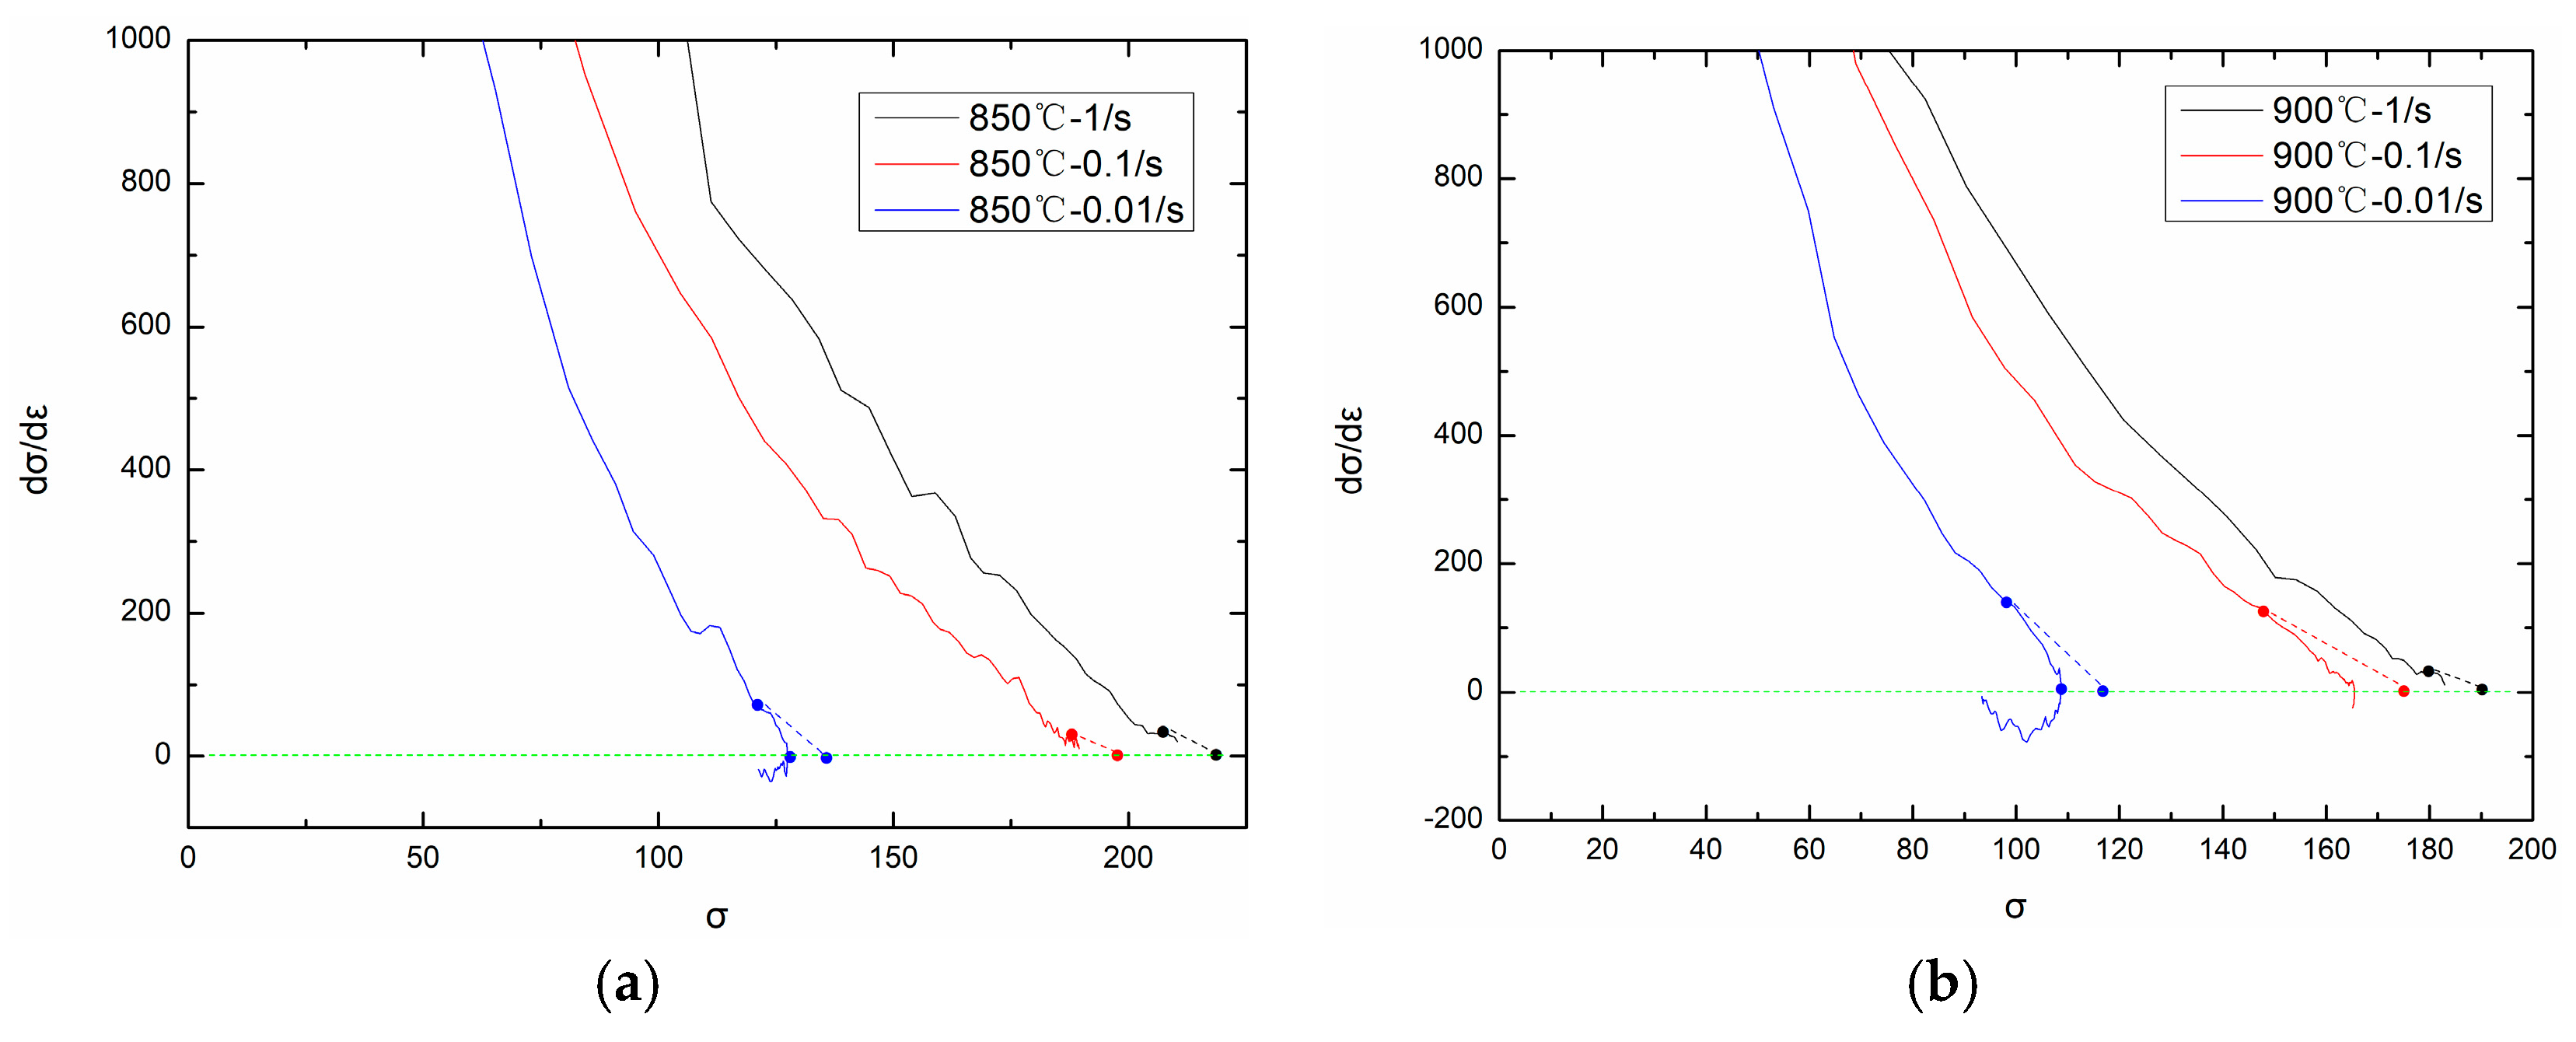
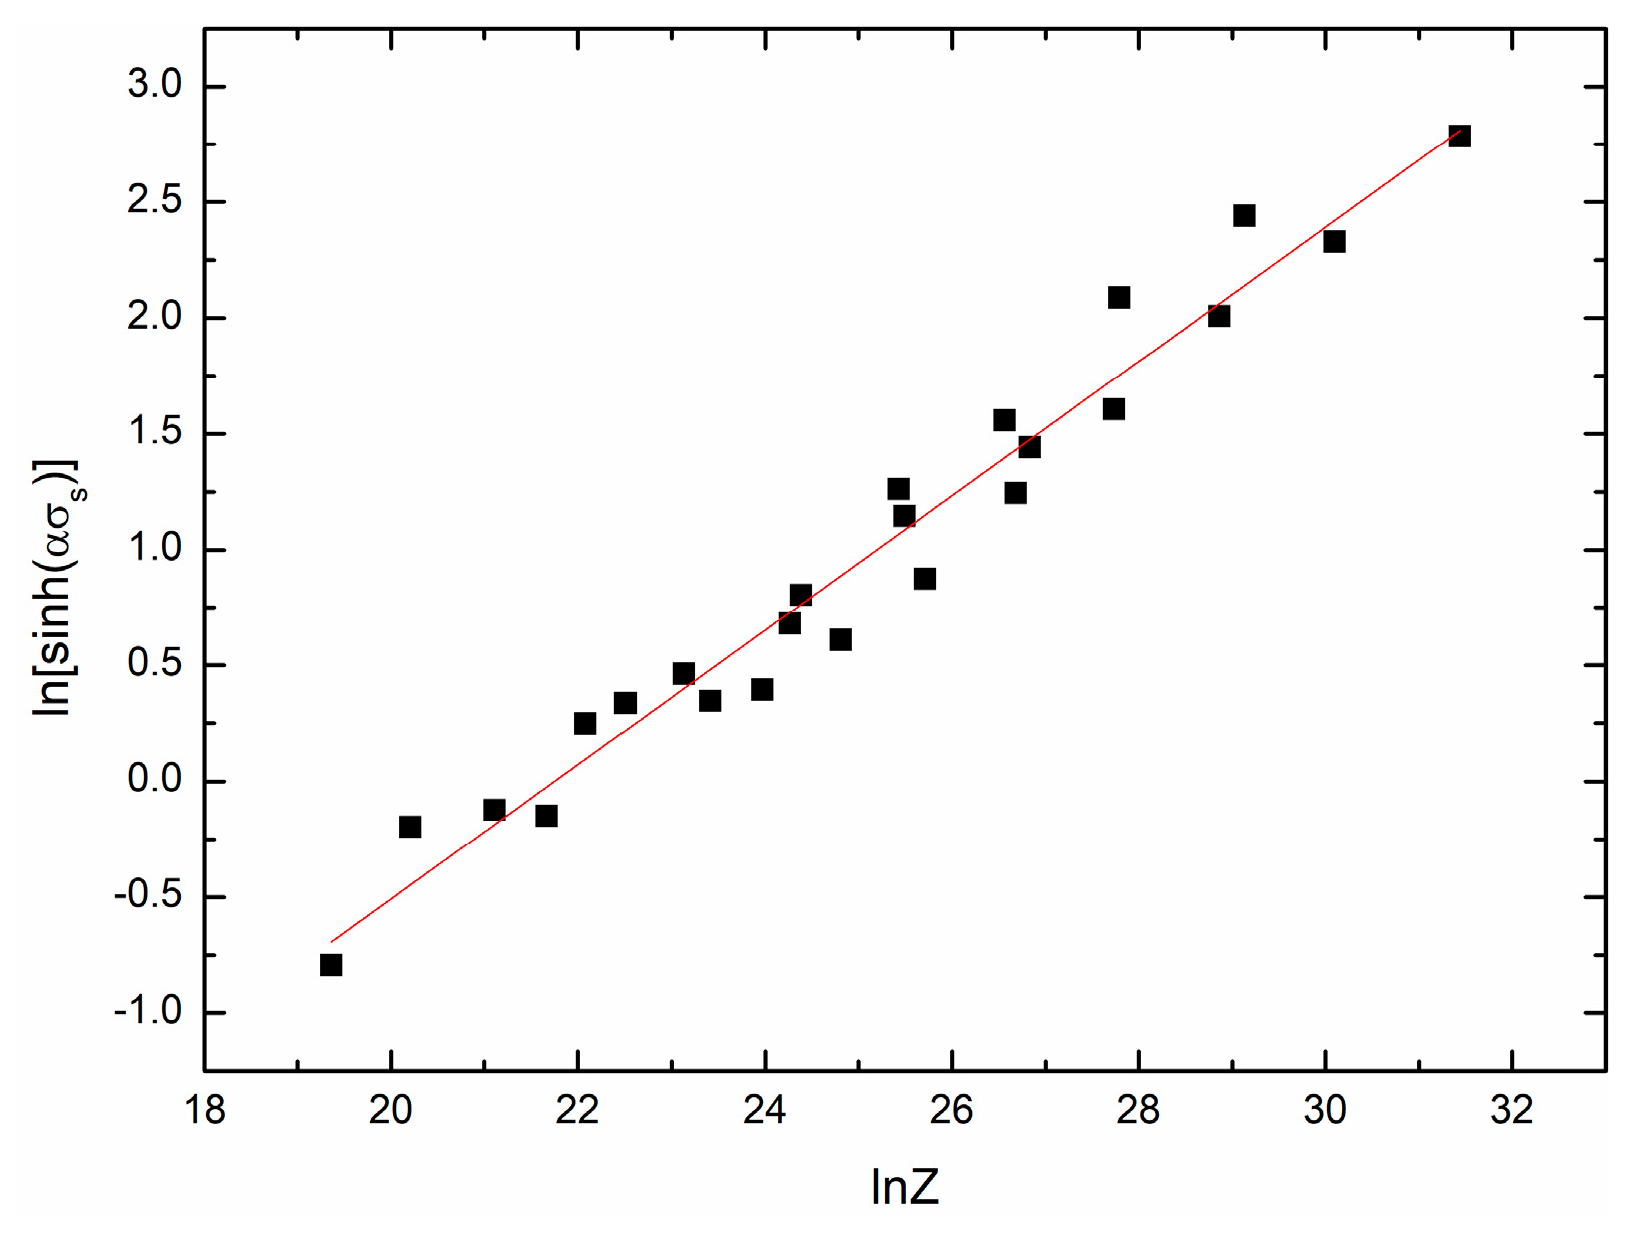
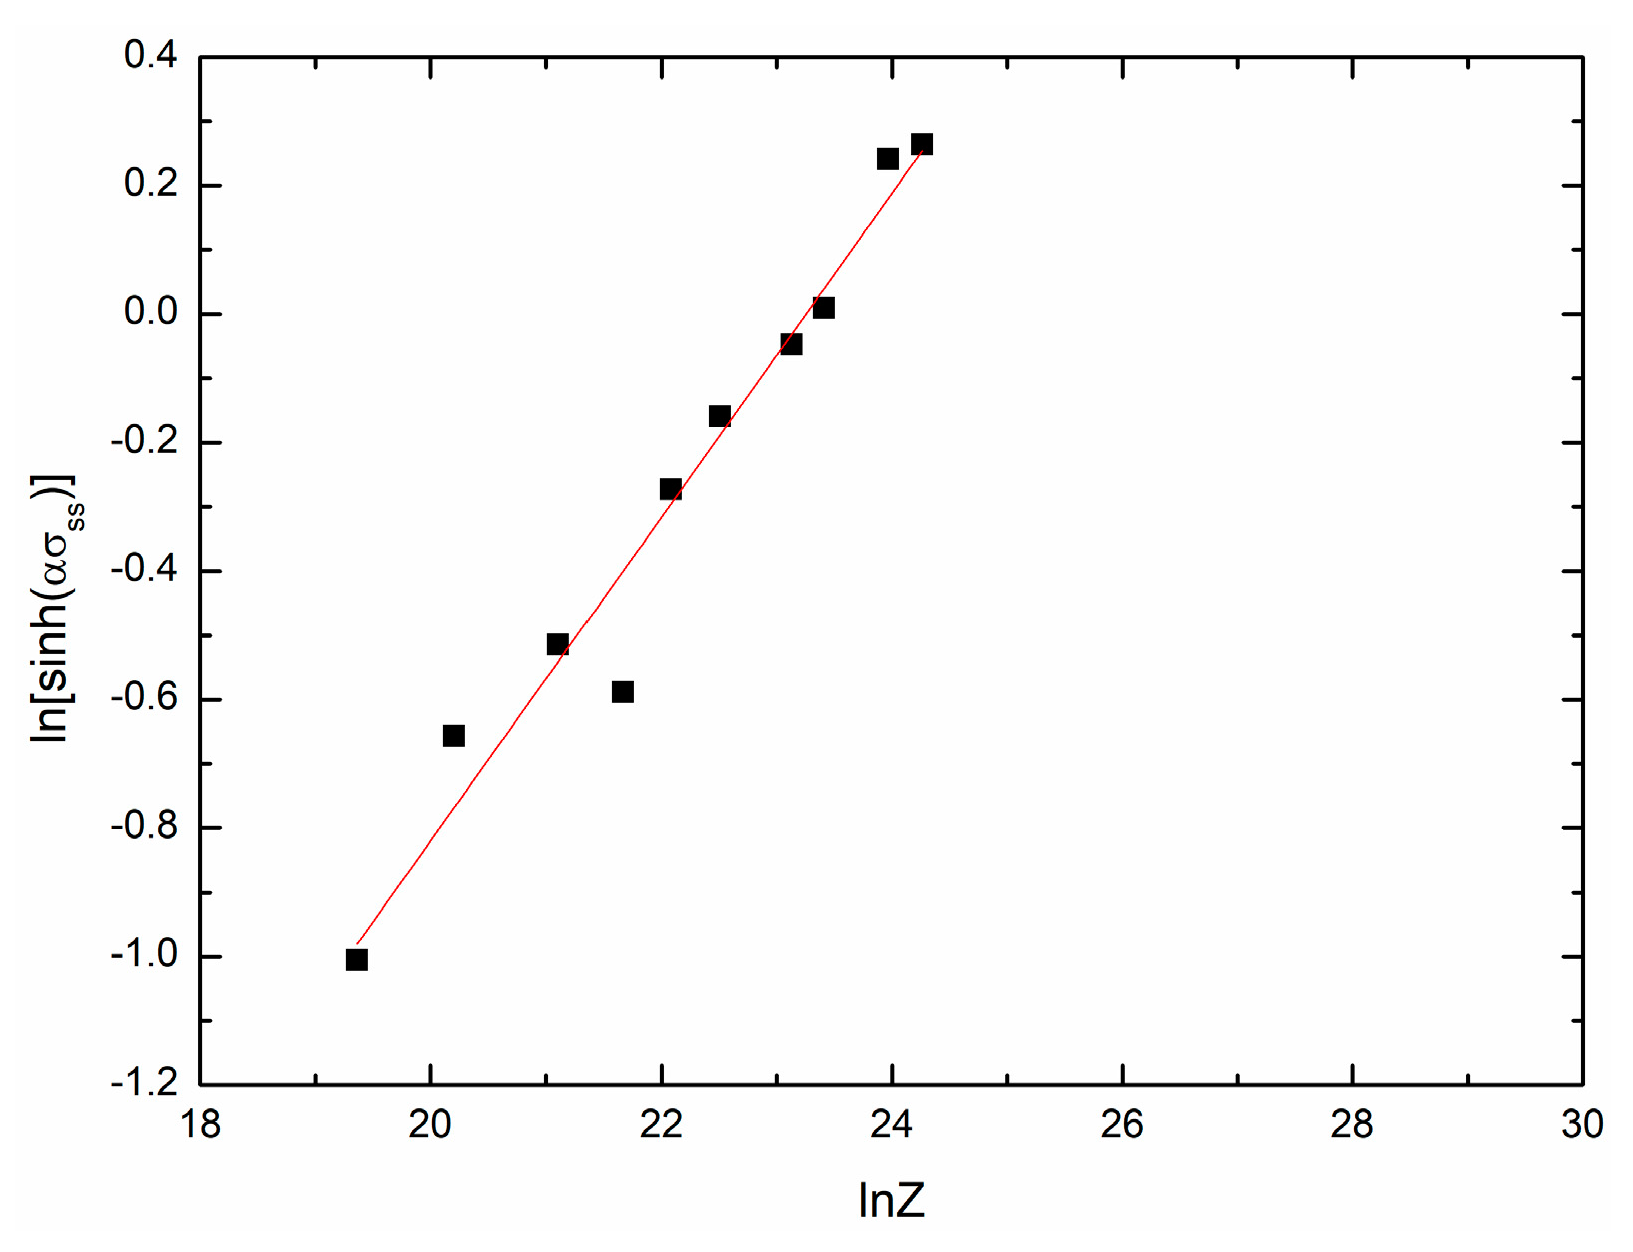
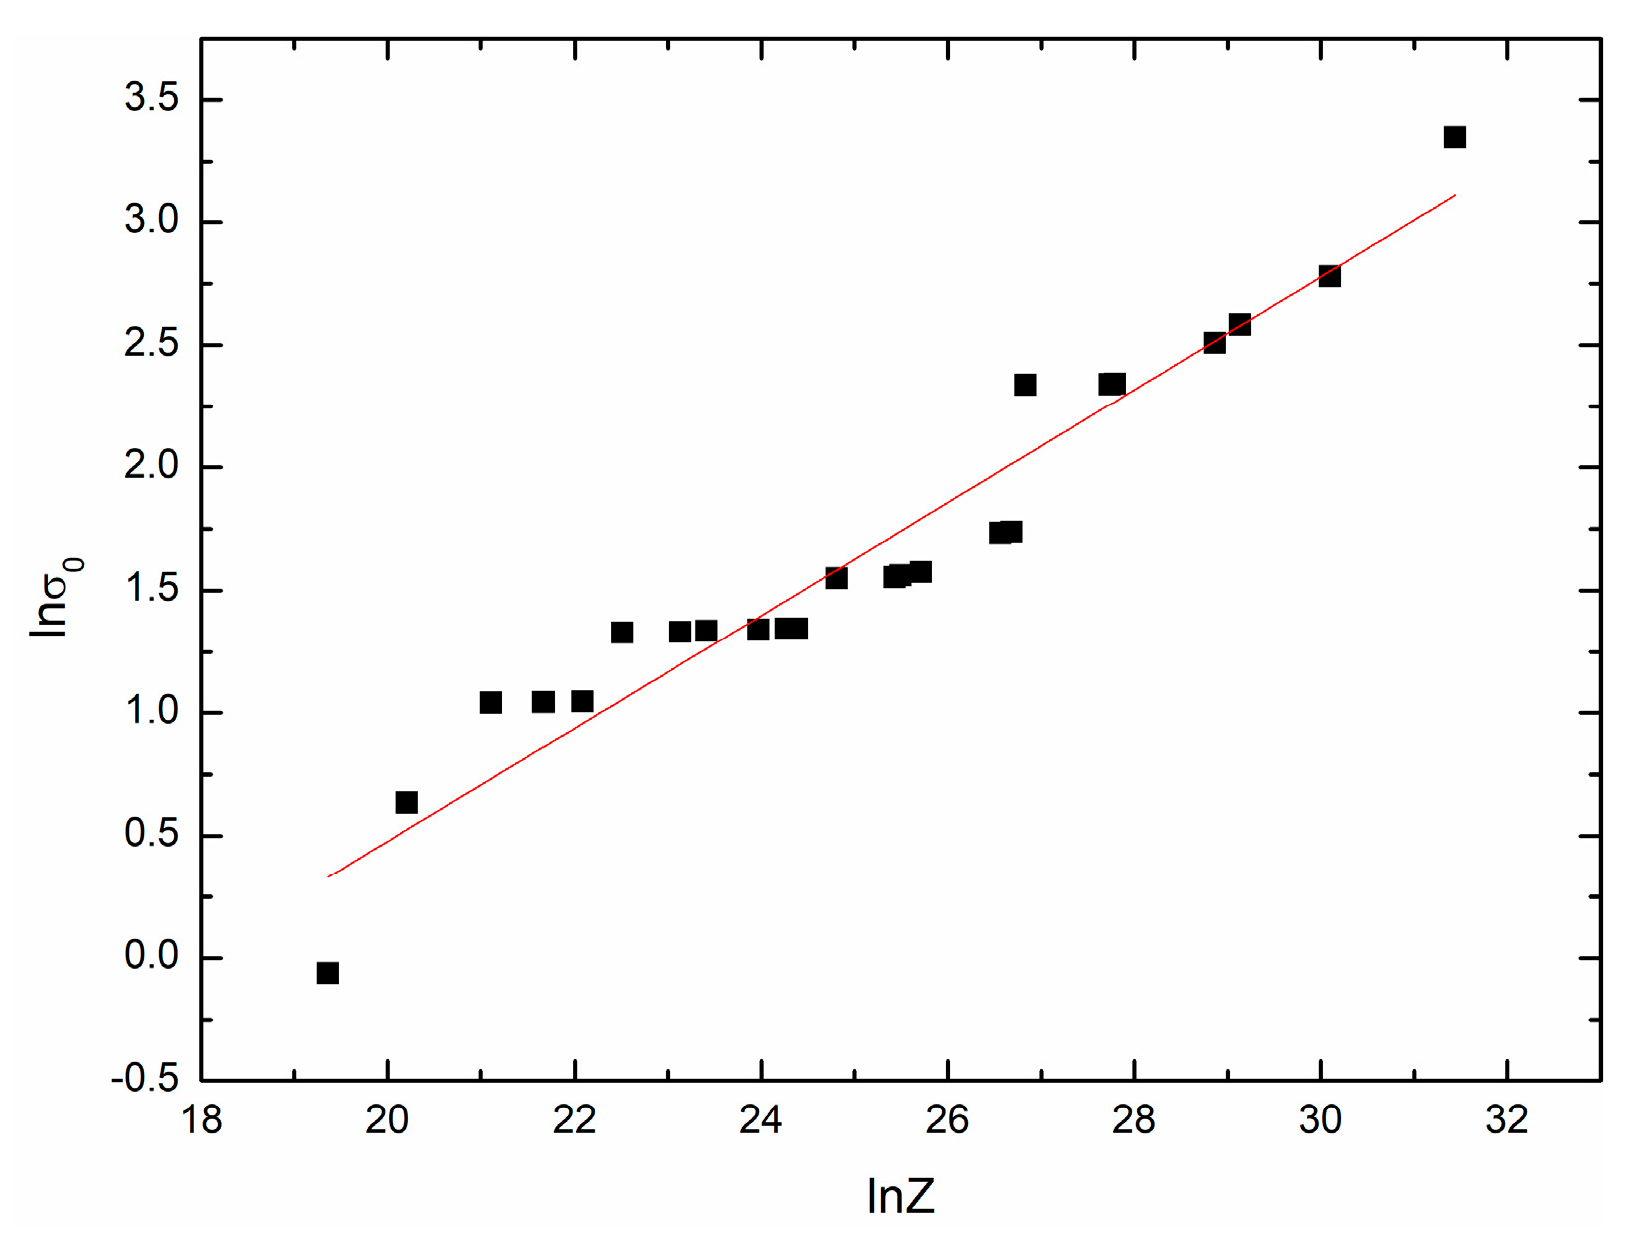
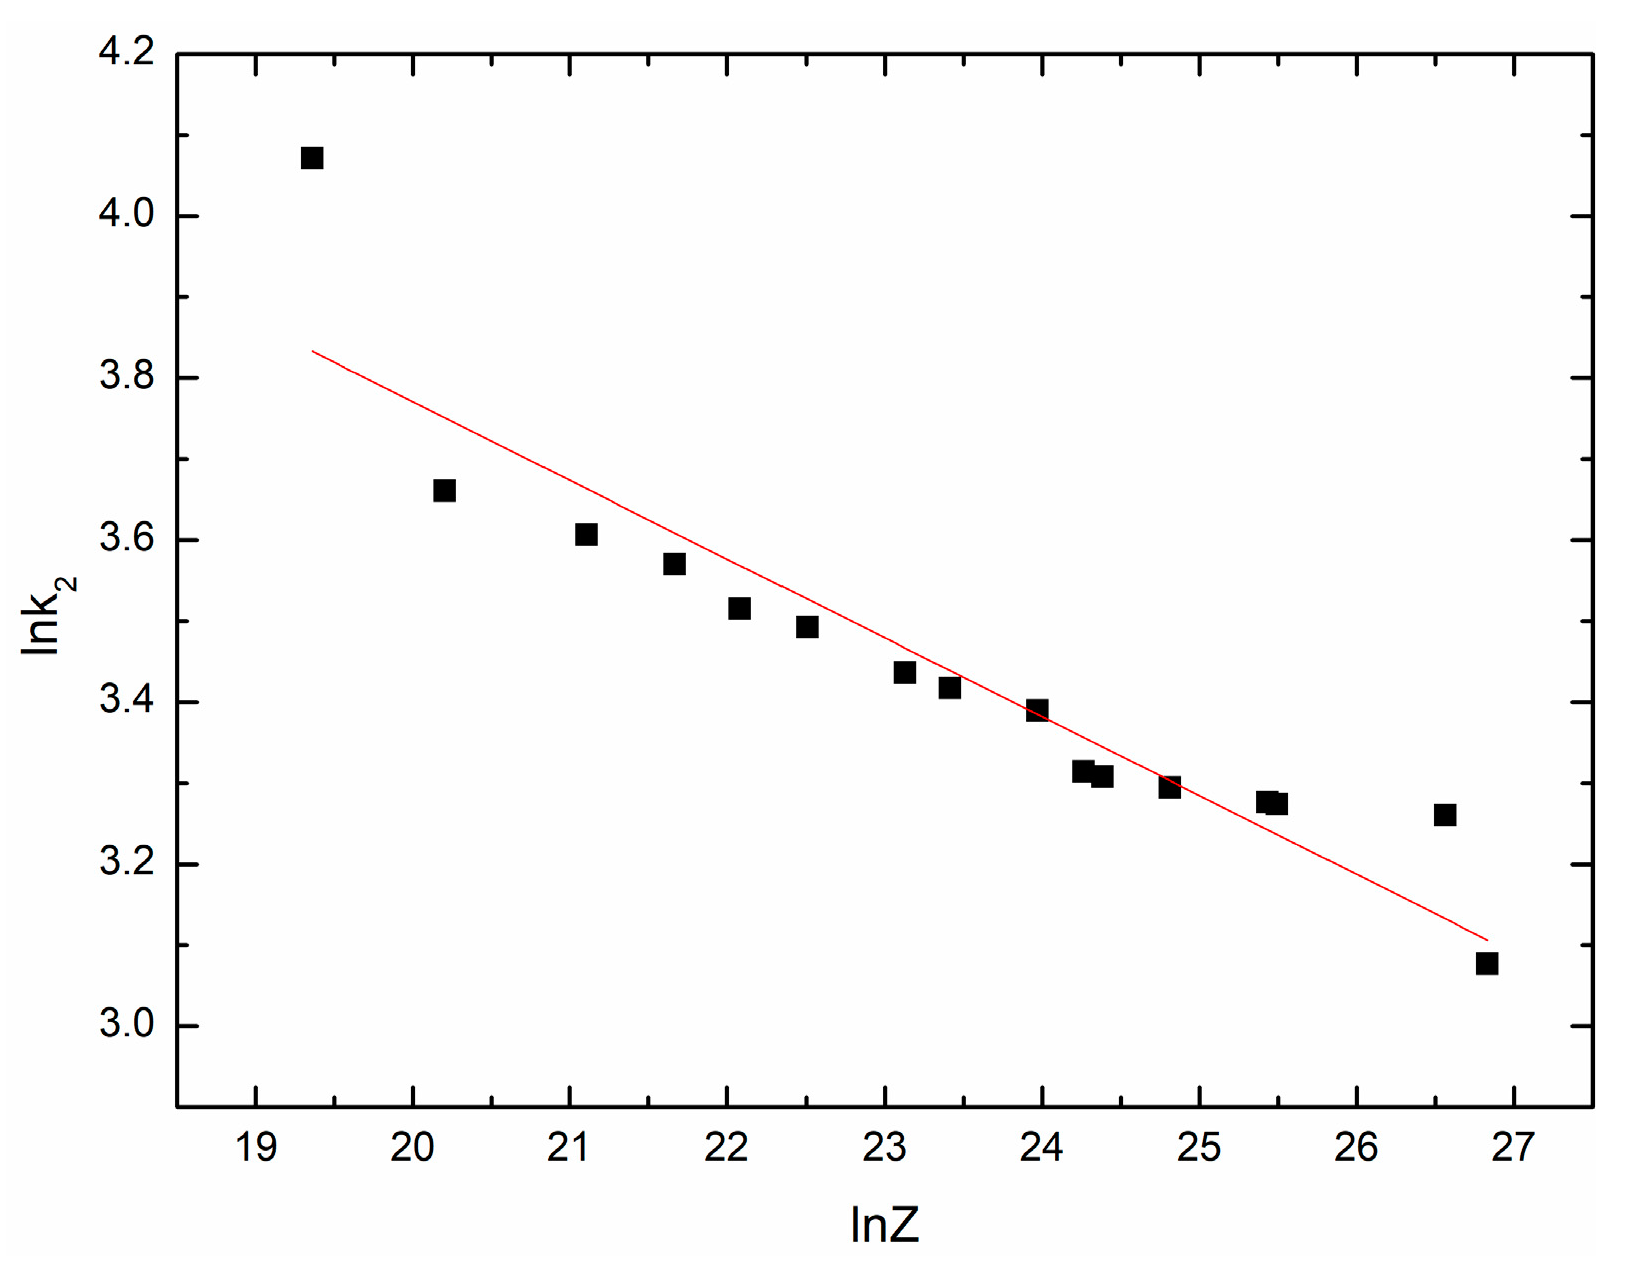
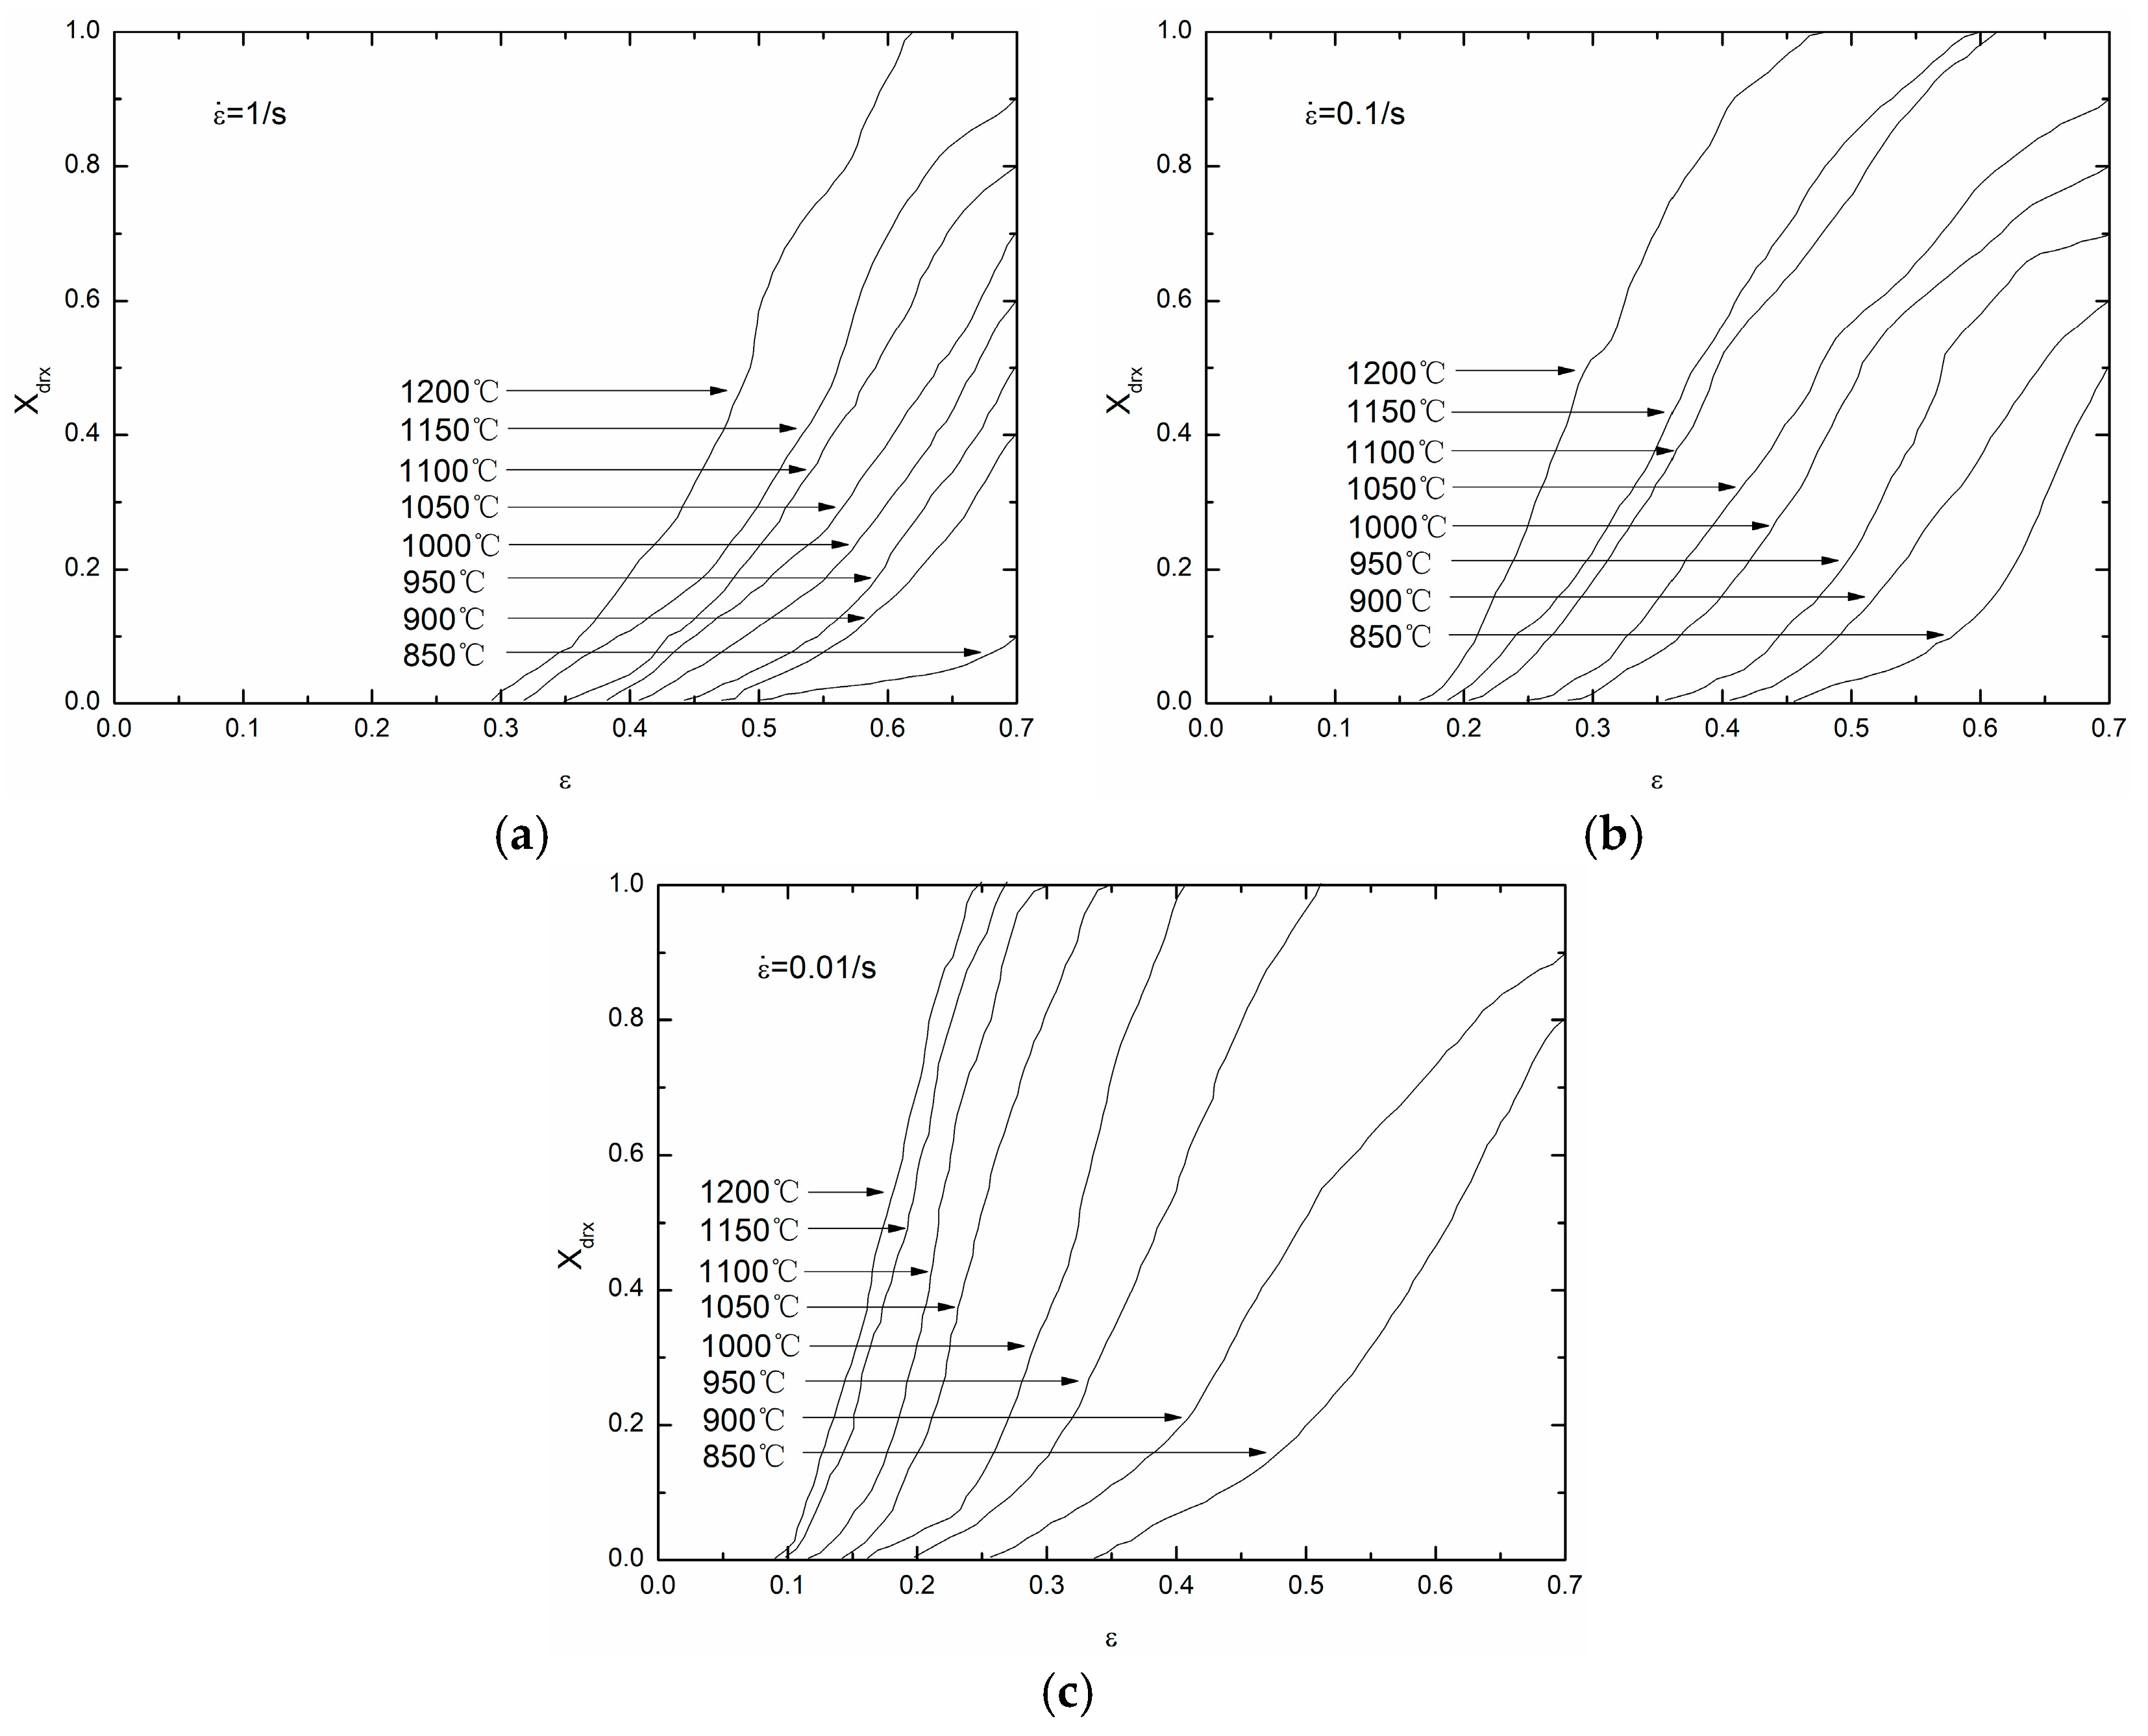
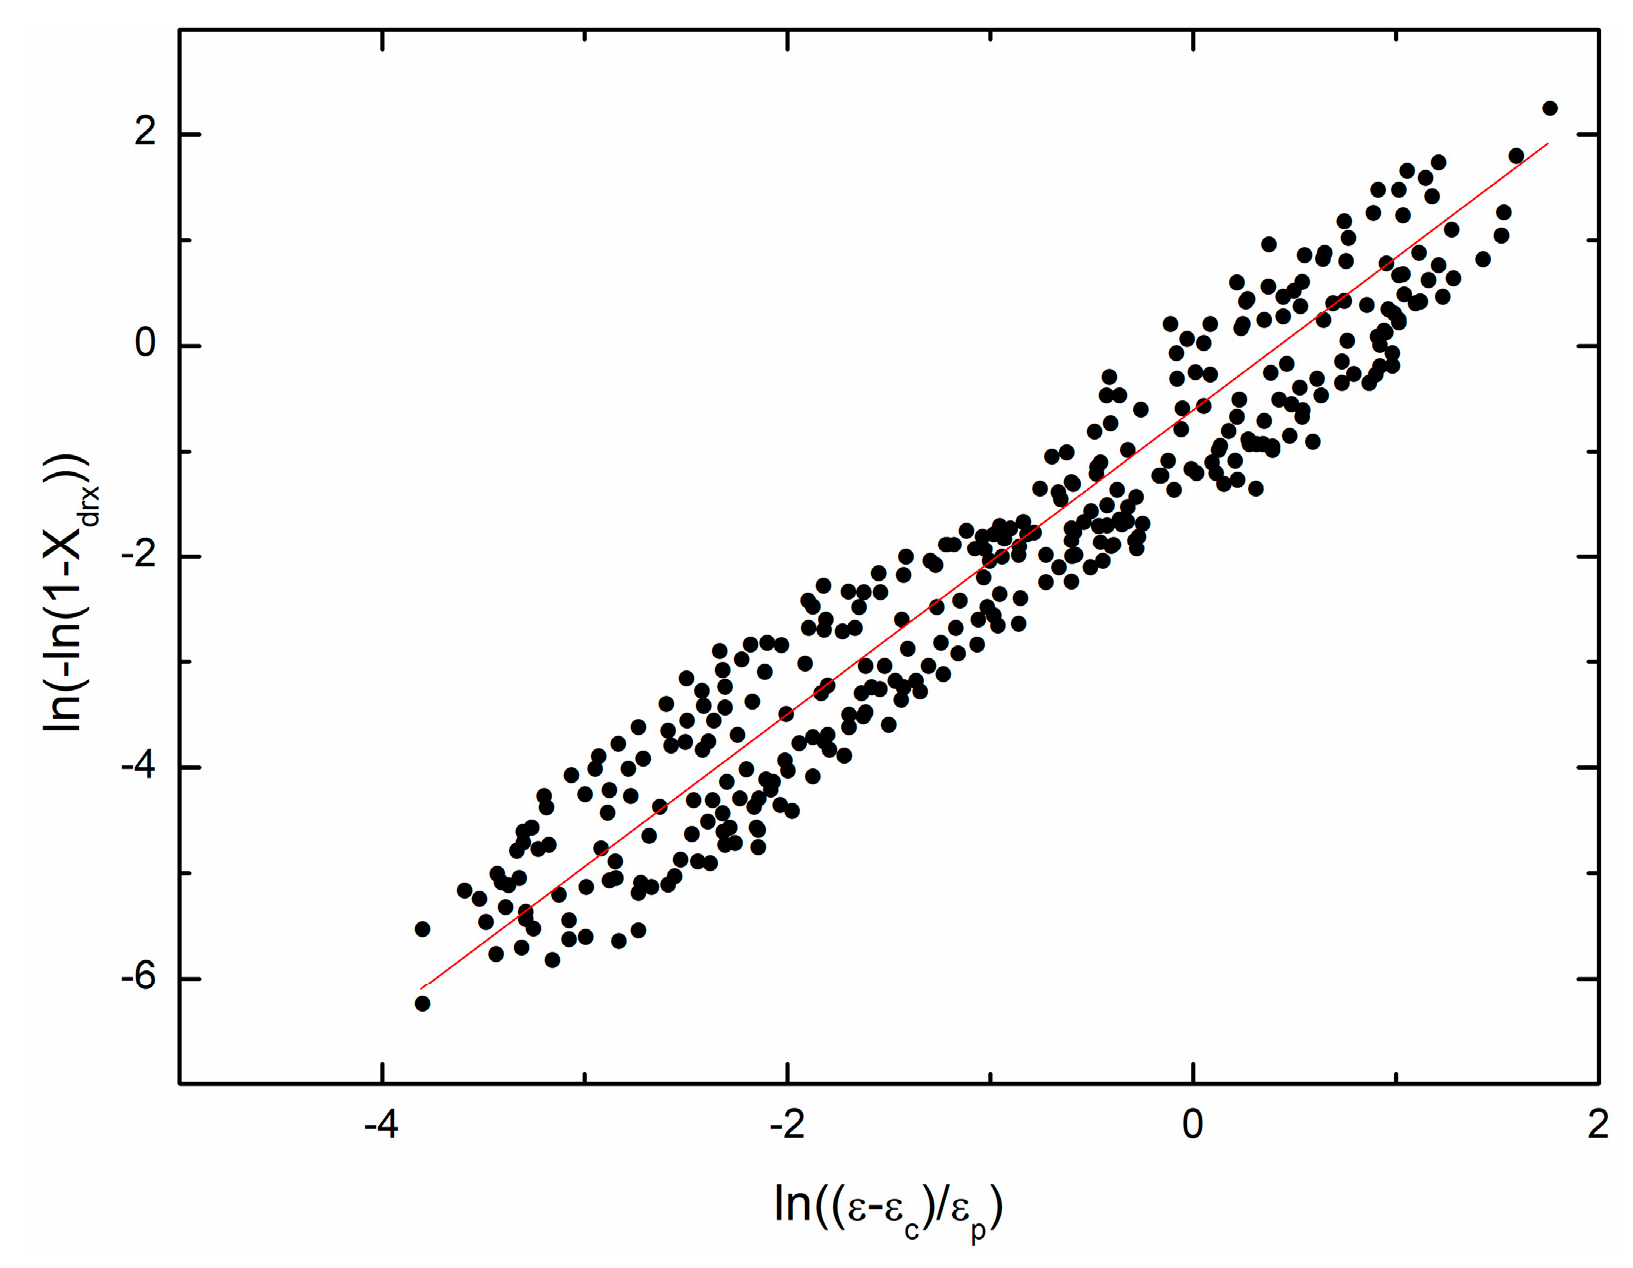
4.3. Determination of Materials Parameters (εp, εc, σs, σss, σ0, k2, kd, nd) in the Two-Stage Constitutive Model

The peak strain ε p can be obtained directly from the experimental flow stress curves. The mathematical model of ε p can be expressed as follows:
ε p = k Z m .
By taking natural logarithm on both sides of Equation (18) and using different groups of ε p , ε , T , and Q , Figure 7 can be drawn as follows. According to the fit result in Figure 7, ε p can be expressed as a function of Z:
ε p = 0.0028429 Z 0.18926 .
The critical strain and critical stress can be obtained from the θ σ (working hardening rate θ = d σ / d ε ) curve. Kim et al. propose that the θ σ curve can be divided into three segments. The first segment starts from σ 0 and ends with σ c , during which working hardening and dynamic recovery exist, and the working hardening rate is positive. The second segment starts from σ c and ends with σ p , during which dynamic recrystallization exists and the working hardening rate is also positive. The third segment starts from σ p and ends with σ s s , during which the working hardening rate is negative. Moreover, if we draw a tangent line at the critical point ( σ c , θ c ), the intersection of the tangent line and σ axis is ( σ s , 0).
Figure 8 shows the θ σ curves under different temperatures and strain rates. From Figure 8, critical stress σ c on different temperatures and strain rates can be obtained (the second derivative, d 2 θ / d σ 2 = 0 , when σ = σ c ). Based on experimental flow stress curves, the critical strain ε c , corresponding to critical stress σ c , can be easily obtained. By comparing critical strain ε c and peak strain ε p on each temperature and strain rate, the following relationship can be obtained:
ε c = 0.83 ε p .
The saturation stress σ s can be obtained by the tangent line method mentioned above. The steady-state stress σ s s can be obtained from the experimental flow stress curves. The mathematical models of σ s and σ s s can be expressed as follows:
sinh ( α σ s ) = k Z m ,
sinh ( α σ s s ) = k Z m ,
Figure 9 and Figure 10 show the fit results of ln [ sinh ( α σ s ) ] ln Z and ln [ sinh ( α σ s s ) ] ln Z , respectively. The mathematical models can be given as:
sinh ( 0.01592 σ s ) = 0.0018191 Z 0.29008 ,
sinh ( 0.01592 σ s s ) = 0.0028439 Z 0.25212 .
The mathematical model of initial stress σ 0 can also be obtained with the method mentioned above. Figure 11 shows the fit result. The following expression can be given:
σ 0 = 0.016168 Z 0.23010 .
The constant k 2 on different temperatures and strain rates can be given by the following expression:
k 2 = ln σ σ s σ 0 σ s ( 2 ) / ε .
Based on the stress-strain data ( ε     ε c ), many values of k 2 on each temperature and strain rate can be obtained, and the average value is taken. Figure 12 shows the fit result. The mathematical model is as follows:
k 2 = 303.59103 Z 0.097240 .
The volume fraction of DRX can be given as follows:
X d r x = σ W H σ σ s σ s s ,   ( ε ε c ) .
Based on Equation (28), different groups of ( X d r x , ε ) on each temperature and strain rate can be obtained. Figure 13 shows the X d r x ε curves with different temperatures and strain rates.
Making some transformations and taking the natural logarithm on the kinetic model of DRX gives:
ln ( ln ( 1 X d r x ) ) = ln k d + n d ln ( ε ε c ε p ) ,   ( ε ε c ) .
Figure 14 shows the fit result; n d = 1.4414, k d = 0.5511 are obtained.

4.4. Verification of the Proposed Two-Stage Constitutive Model

Based on the activation energy Q and the material parameters ( ε p , ε c , σ s , σ s s , σ 0 , k 2 , n d , k d ) determined above, the flow stress under any temperature, strain rate, and strain can be calculated. Figure 15 shows the comparison between the experimental results and the predicted results of the model. The predicted flow stress values are in good agreement with the experimental flow stress values. Thus, the proposed two-stage constitutive model can give a reasonable estimate of the flow stress of 20Mn5 steel and can be used for numerical simulation of the hot forging of a 20Mn5 solid steel ingot.
In order to evaluate the accuracy of the proposed two-stage constitutive model, standard statistical parameters (correlation coefficient R and average absolute relative error AARE) are calculated. Correlation coefficient R can give us information on the strength of the linear relationship between the predicted flow stress and experimental flow stress. R and AARE are expressed as follows:
R = i = 1 N ( σ E , i σ E ¯ ) ( σ P , i σ P ¯ ) i = 1 N ( σ E , i σ E ¯ ) 2 i = 1 N ( σ P , i σ P ¯ ) 2 ,
A A R E = i = 1 N | σ P , i σ E , i σ E , i | N ,
where σ E , i and σ P , i are the i-th experimental flow stress and predicted flow stress, respectively; σ E ¯ and σ P ¯ are the average value of the experimental flow stress and predicted flow stress, respectively; N is the number of the experimental flow stress.
The calculated R is 0.991, which shows that the strength of the linear relationship between the experimental flow stress and predicted flow stress is very strong. The calculated AARE is 3.01%, which indicates that the prediction accuracy of the proposed two-stage constitutive model is very high and the proposed two-stage constitutive model can be used for numerical simulation of hot forging of 20Mn5 solid steel ingot.

5. Conclusions

(1)
During hot compression of 20Mn5 steel, firstly, the flow stress increases to a peak stress, and then the flow stress decreases gradually to a steady-state stress with the increase of strain. Peak stress does not occur at 850–1100 °C and 1/s, or at 850–900 °C and 0.1/s. At a higher temperature and lower strain rate, the peak strain, steady-state strain, peak stress, and steady-state stress are smaller.
(2)
The material constants ( α , n , Q , A ) are calculated based on the peak stress.
(3)
A two-stage constitutive model of 20Mn5 steel is established. The related material parameters ( ε p , ε c , σ s , σ s s , σ 0 , k 2 , n d , k d ) are determined.
(4)
The proposed constitutive model can give a good prediction of the flow stress on different temperatures, strain rates, and strains, and can be used for numerical simulation of the hot forging of a 20Mn5 solid steel ingot.

Acknowledgments

This study was financially supported by the National Key Basic Research Program of China (2011CB012903).

Author Contributions

Min Liu conceived, designed, and performed the experiments, analyzed the data, and wrote the paper; Qing-Xian Ma and Jian-Bin Luo contributed some advice.

Conflicts of Interest

The authors declare no conflict of interest.

References

  1. Liu, M.; Ma, Q.X. Research on rotatory deformation uniformity and compaction effect of super-heavy hollow steel ingot. J. Mech. Eng. 2016, 52, 90–96. [Google Scholar] [CrossRef]
  2. Liu, M.; Dong, X.L.; Ma, Q.X. Investigation on hollow steel ingot forging process of heavy cylinder forging. J. Plast. Eng. 2013, 20, 1–8. [Google Scholar] [CrossRef]
  3. Mao, W.M.; Zhao, X.B. Recrystallization and Grain Growth of Metal, 1st ed.; Metallurgical Industry Press: Beijing, China, 1994; pp. 218–241. [Google Scholar]
  4. Chen, F.; Feng, G.W.; Cui, Z.S. New constitutive model for hot working. Metall. Mater. Trans. A 2016, 47, 1229–1239. [Google Scholar] [CrossRef]
  5. Dong, D.Q.; Chen, F.; Cui, Z.S. A physically-based constitutive model for SA508-III steel: Modeling and experimental verification. Mater. Sci. Eng. A 2015, 634, 103–115. [Google Scholar] [CrossRef]
  6. Chen, F.; Cui, Z.S.; Chen, S.J. Recrystallization of 30Cr2Ni4MoV ultra-super-critical rotor steel during hot deformation. Part I: Dynamic recrystallization. Mater. Sci. Eng. A 2011, 528, 5073–5080. [Google Scholar] [CrossRef]
  7. Chen, F.; Liu, J.; Ou, H.G.; Liu, B.; Cui, Z.S.; Long, H. Flow characteristics and intrinsic workability of IN718 superalloy. Mater. Sci. Eng. A 2015, 642, 279–287. [Google Scholar] [CrossRef]
  8. Li, X.C.; Duan, L.L.; Li, J.W.; Wu, X.C. Experimental study and numerical simulation of dynamic recrystallization behavior of a micro-alloyed plastic mold steel. Mater. Des. 2015, 66, 309–320. [Google Scholar] [CrossRef]
  9. Wang, J.; Zhao, G.Q.; Chen, L.; Li, J.L. A comparative study of several constitutive models for power metallurgy tungsten at elevated temperature. Mater. Des. 2016, 90, 91–100. [Google Scholar] [CrossRef]
  10. Lin, Y.C.; Chen, X.M. A critical review of experimental results and constitutive descriptions for metals and alloys in hot working. Mater. Des. 2011, 32, 1733–1759. [Google Scholar] [CrossRef]
  11. Wang, J.; Yang, H.T.; Wang, X.G.; Xiao, H. A new mathematical model for predicting flow stress up to the critical strain during hot deformation. Mater. Des. 2015, 65, 637–643. [Google Scholar] [CrossRef]
  12. Solhjoo, S.; Vakis, A.I.; Pei, Y.T.T. Two phenomenological models to predict the single peak flow stress curves up to the peak during hot deformation. Mech. Mater. 2017, 105, 61–66. [Google Scholar] [CrossRef]
  13. Ji, G.L.; Li, Q.; Li, L. A physical-based constitutive relation to predict flow stress for Cu-0.4Mg alloy during hot working. Mater. Sci. Eng. A 2014, 615, 247–254. [Google Scholar] [CrossRef]
  14. Ji, G.L.; Li, Q.; Ding, K.Y.; Yang, L.; Li, L. A physical-based constitutive model for high temperature deformation of Cu-0.36Cr-0.03Zr alloy. J. Alloys Compd. 2015, 648, 397–407. [Google Scholar] [CrossRef]
  15. Ji, G.L.; Li, L.; Qin, F.L.; Zhu, L.Y.; Li, Q. Comparative study of phenomenological constitutive equations for an as-rolled M50NiL steel during hot deformation. J. Alloys Compd. 2017, 695, 2389–2399. [Google Scholar] [CrossRef]
  16. Ji, G.L.; Li, F.G.; Li, Q.H.; Li, H.Q.; Li, Z. Research on the dynamic recrystallization kinetics of Aermet100 steel. Mater. Sci. Eng. A 2010, 527, 2350–2355. [Google Scholar] [CrossRef]
  17. Ji, G.L.; Li, Q.; Li, L. The kinetics of dynamic recrystallization of Cu-0.4Mg alloy. Mater. Sci. Eng. A 2013, 586, 197–203. [Google Scholar] [CrossRef]
  18. Chen, L.; Zhao, G.Q.; Yu, J.Q.; Zhang, W.D. Constitutive analysis of homogenized 7005 aluminum alloy at evaluated temperature for extrusion process. Mater. Des. 2015, 66, 129–136. [Google Scholar] [CrossRef]
  19. Dong, Y.Y.; Zhang, C.S.; Zhao, G.Q.; Guan, Y.J.; Gao, A.J.; Sun, W.C. Constitutive equation and processing maps of an Al-Mg-Si aluminum alloy: Determination and application in simulating extrusion process of complex profiles. Mater. Des. 2016, 92, 983–997. [Google Scholar] [CrossRef]
  20. Dong, Y.Y.; Zhang, C.S.; Lu, X.; Wang, C.X.; Zhao, G.Q. Constitutive equations and flow behavior of an as-extruded AZ31 magnesium alloy under large strain condition. J. Mater. Eng. Perform. 2016, 25, 2267–2281. [Google Scholar] [CrossRef]
  21. Chen, L.; Zhao, G.Q.; Yu, J.Q. Hot deformation behavior and constitutive modeling of homogenized 6026 aluminum alloy. Mater. Des. 2015, 74, 25–35. [Google Scholar] [CrossRef]
  22. Puchi-Cabrera, E.S.; Staia, M.H. Constitutive description of a low C-Mn steel deformed under hot-working conditions. Mater. Sci. Eng. A 2011, 528, 2843–2858. [Google Scholar] [CrossRef]
  23. Wang, Z.T.; Guan, T.D.; Xiao, J.R.; Lei, P.; Huo, W.C. Theory of Plastic Forming of Metals, 1st ed.; Mechanical Industry Press: Beijing, China, 1989. [Google Scholar]
  24. Zhou, J.H.; Guan, K.Z. Resistance of Plastic Forming of Metals, 1st ed.; Mechanical Industry Press: Beijing, China, 1989. [Google Scholar]
Figure 1. The initial as-cast microstructure of 20Mn5 steel.
Materials 11 00434 g001
Figure 2. Flow stress curves of the 20Mn5 steel under strain rates of: (a) 1/s; (b) 0.1/s; (c) 0.01/s.
Materials 11 00434 g002
Figure 3. Microstructure of 20Mn5 steel compressed to a true strain of 0.7 under strain rate of 0.01/s and temperatures of: (a) 850 °C; (b) 900 °C; (c) 950 °C; (d) 1000 °C; (e) 1050 °C; (f) 1100 °C; (g) 1150 °C; (h) 1200 °C.
Materials 11 00434 g003
Figure 4. Microstructure of 20Mn5 steel compressed to a true strain of 0.7 under temperature of 1200 °C and strain rates of: (a) 1/s; (b) 0.1/s; (c) 0.01/s.
Materials 11 00434 g004
Figure 5. Typical flow stress curves for hot working.
Materials 11 00434 g005
Figure 6. Calculation of material constants: (a) n1; (b) β; (c) n; (d) Q and A.
Materials 11 00434 g006
Figure 7. The relationship between ln ε p and ln Z .
Materials 11 00434 g007
Figure 8. dσ/dε-σ curves on different temperatures: (a) 850 °C; (b) 900 °C; (c) 950 °C; (d) 1000 °C; (e) 1050 °C; (f) 1100 °C; (g) 1150 °C; (h) 1200 °C.
Materials 11 00434 g008aMaterials 11 00434 g008b
Figure 9. The relationship between ln [ sinh ( α σ s ) ] and ln Z .
Materials 11 00434 g009
Figure 10. The relationship between ln [ sinh ( α σ s s ) ] and ln Z .
Materials 11 00434 g010
Figure 11. The relationship between ln σ 0 and ln Z .
Materials 11 00434 g011
Figure 12. The relationship between ln k 2 and ln Z .
Materials 11 00434 g012
Figure 13. The X d r x ε curves on different temperatures and strain rates: (a) 1 /s; (b) 0.1 /s; (c) 0.01 /s.
Materials 11 00434 g013
Figure 14. The relationship between ln ( ln ( 1 X d r x ) ) and ln ( ε ε c ε p ) .
Materials 11 00434 g014
Figure 15. The comparison between experimental results and predicted results of the model: (a) 1/s; (b) 0.1/s; (c) 0.01/s.
Materials 11 00434 g015
Table 1. Chemical composition of 20Mn5 steel (wt %).
CSiMnPSCrNiMoAl
0.240.261.470.00840.00200.150.0760.0200.015

