Abstract
The soft magnetic properties of Fe-based nanocrystalline alloys are determined by their grain size. In the present article, the (Fe0.4Co0.6)79Nb3B18 nanocrystalline alloys have been successfully prepared by isothermal annealing. The variation of soft magnetic properties as a function of annealing temperature and incubation time is investigated in detail. Two distinct crystallization behaviors were found for the (Fe0.4Co0.6)79Nb3B18 alloys. The initial nanocrystallization products comprise a mixture of α-Fe(Co), Fe2B, and Fe23B6-type crystalline metastable phases, and the final crystallization products are composed of α-Fe(Co), Fe2B, and Fe3B crystalline phases. The grain size decreases first and then increases with the increasing annealing temperature in the range of 764–1151 K, and a fine grain size with mean grain size of 12.7 nm can be achieved for alloys annealed at 880 K. As the annealing temperature increases from 764 K to 1151 K, the saturation magnetization increases first and then decreases without a significant increase of the coercivity. The alloys annealed at 880 K exhibit the optimized soft magnetic properties with high Ms of 145 emu g−1 and low Hc of 0.04 Oe.
1. Introduction
In 1988, Yoshizawa et al. [1] developed a new series of FeCuNbSiB nanocrystalline alloys with excellent magnetic properties. In 2013, Rizal et al. [2] artificially produced Fe-Co alloys with record high saturation magnetization (Ms > 240 emu/g). This group claimed that the increase of Ms is correlated with the increase of the lattice constant of the alloy. Thus, these Fe-based soft magnetic alloys have received great attention in the materials field [3,4,5]. The Fe-based nanocrystalline alloys with high performance have been served as the magnetic cores, sensors, and transformers in electrical industrial fields, and they are potential candidates to replace traditional soft magnetic alloys, such as silicon steel and ferrite. Generally speaking, metallic glass is in a thermodynamically metastable state. Upon heating, it would transform into a stable state by a crystallization process to form amorphous/nanocrystalline alloys. The soft magnetic properties in the Fe-based nanocrystalline alloys are determined by the type and grain size of the nano-scale precipitates. Nowadays, annealing crystallization is one of the key methods used to prepare Fe-based nanocrystalline alloys [6,7,8,9,10]. Therefore, it is of theoretical significance and engineering application value to explore the relationship between their magnetic properties and annealing process. Generally speaking, the grain size increases with increasing annealing temperature [11,12,13]. However, according to recent studies, as the annealing temperature increases, the grain size increases first, then decreases, and increases again in the Fe-based nanocrystalline alloys [14,15]. Xue et al. [14] pointed out that the grain size reaches the minimum value for the Fe83Nb2B14Cu1 alloys annealed at 813 K, while their saturation magnetization increases steadily from 1.4 T to 1.7 T with the increase of annealing temperature. Li et al. [15] pointed out that the Fe73.37Cu0.92Nb2.9Si13.56B9.24 nanocrystalline alloys with the finest grain size exhibited optimized magnetic properties. However, the experiments carried out by Jiang et al. [16] indicated that the grain size in the Fe73.5Cu1Nb3Si13.5B9 nanocrystalline alloys decreases slightly, and then increases with increasing annealing temperature, and the anomalous grain growth is ascribed to the different nucleation and volume diffusion rates at varied annealing temperatures. The variation of grain size as a function of annealing during the annealing process remains unclear, and it is quite difficult to determine the optimized annealing process for alloys with excellent soft magnetic properties. It is accepted that fine and well-distributed nanoscale precipitates within the amorphous matrix are of benefit to enhance the magnetic properties. Thus, it is of great importance to study the relationship between magnetic properties and the annealing process.
In this article, the aim is to explore the relationship between grain size and annealing temperature in the (Fe0.4Co0.6)79Nb3B18 alloys. In addition, the soft magnetic properties as a function of the kinds and size of the precipitates are also studied, which can provide theoretical guidance for the development of Fe-based nanocrystalline alloys with excellent soft magnetic properties.
2. Materials and Methods
Master alloy ingots with nominal composition of (Fe0.4Co0.6)79Nb3B18 were prepared by induction melting (SPG-40B high frequency induction heating equipment, Shenzhen, China) the mixture of pure Co (99.98 wt%), Fe (99.8 wt%), Fe-60 wt% Nb and Fe-17.5 wt% B master alloy. Then, the amorphous ribbons were prepared by melt-spinning method under high vacuum single-roller spinning equipment. During this process, the linear velocity and ejection pressure are 40 m/s and 20 kPa, respectively. The resulting ribbons have a thickness of 20–30 μm. Then, the isothermal annealing experiment was performed for the glassy ribbons sealed into quartz tubes under vacuum condition (4 × 10⁻³ Pa) in a resistance furnace. The annealing temperature (Ta) was set as 764 K, 800 K, 880 K, 974 K, and 1151 K.
Phase constitution was identified by X-ray diffractometer (XRD; Bruker D8 advance, Bruker AXS GmbH, Karlsruhe, Germany) with Cu Kα as a radiation (λ = 0.154056 nm) in steps of 0.02° in the 2θ = 30–120°. Thermal behaviors of the glassy ribbons were studied using differential scanning calorimetry (DSC; Mettler–Toledo TGA/DSC1, Mettler-Toledo International Inc., Zurich, Switzerland) at a continuous heating rate of 40 K min−1. Room-temperature magnetic hysteresis loops were measured using a vibrating sample magnetometer (VSM; Lake Shore 7410, Lake Shore Cryotronics, Columbus, OH, USA) under an applied magnetic field of 10,000 Oe.
3. Results and Discussion
3.1. Structure Identification and Thermal Properties in the As-Quenched (Fe0.4Co0.6)79Nb3B18 Alloys
Figure 1a shows the XRD pattern taken from the as-quenched (Fe0.4Co0.6)79Nb3B18 alloys. Only a wide diffraction peak in the 2θ region of 35–55° can be observed, and no sharp Bragg diffraction peaks corresponding to the crystalline phases are detected. This is the typical characteristic of amorphous alloys, indicating that a fully amorphous structure is obtained in the (Fe0.4Co0.6)79Nb3B18 alloys.
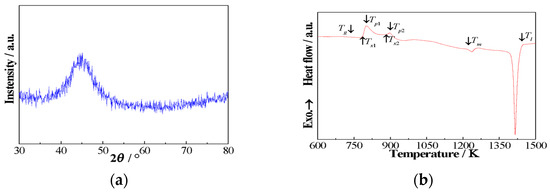
Figure 1.
XRD pattern (a) and DSC heating curve (b) of the as-quenched (Fe0.4Co0.6)79Nb3B18 alloys.
Figure 1b displays the DSC heating trace of the as-quenched (Fe0.4Co0.6)79Nb3B18 alloys with a constant heating rate of 40 K min−1. During the heating process, it undergoes a glass transition event followed by a supercooled liquid region, and then two-stage crystallization events are observed. The value of glass transition temperature (Tg) is equal to 732 K, and the values of first crystallization onset temperature (Tx1) and second crystallization onset temperature (Tx2) are equal to 786 K and 887 K, respectively. The supercooled liquid region ∆Tx = Tx1 − Tg, is estimated to be 54 K. In the high-temperature region, there are two endothermic peaks. The values of solidus temperature (Tm) and liquidus temperature (Tl) are 1219 K and 1444 K, respectively. The parameter Trg (=Tg/Tl) is calculated to be 0.507. The results suggest that present (Fe0.4Co0.6)79Nb3B18 alloys possess high glass forming ability (GFA). The temperature intervals ΔTN between two crystalline peaks, defined as Tx2 − Tx1, reach 101 K. It is reported that large ΔTN is of benefit to the fabrication of amorphous/nanocrystalline alloys by precisely controlling the annealing process.
3.2. Structural Evolution in the Annealed (Fe0.4Co0.6)79Nb3B18 Alloys
The (Fe0.4Co0.6)79Nb3B18 alloys were isothermally annealed at a temperature of Ta = 764 K, which is near Tx1 between Tg and Tx1. Figure 2 exhibits the XRD patterns of the (Fe0.4Co0.6)79Nb3B18 alloys annealed at 764 K for different incubation times. The crystallization products are composed of α-Fe(Co), Fe2B, and Fe23B6 phases for alloys annealed for 60 s. As the incubation time increases from 90 s to 900 s, the crystallization products still remain unchanged. The results indicate that increasing incubation time cannot change the crystallization process.
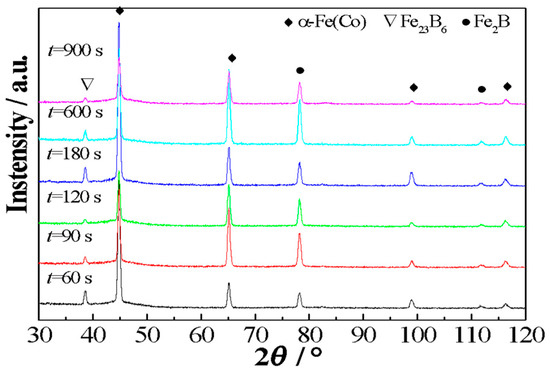
Figure 2.
XRD patterns of the (Fe0.4Co0.6)79Nb3B18 alloys annealed at 764 K for varied times.
Figure 3 displays the XRD patterns of the (Fe0.4Co0.6)79Nb3B18 alloys annealed at 764 K, 800 K, 880 K, 974 K, and 1151 K for 90 s, respectively. For alloys annealed at 764 K, the crystallization products consist of a mixture of α-Fe(Co), Fe23B6, and Fe2B phases. The formation of a metastable Fe23B6 phase was previously reported in the FeNbB ternary alloys [3,17,18,19]. It has an fcc structure with a lattice constant of a = 1.076 nm. In this structure, the cubo-octahedra and the cubes formed by metal atoms are symmetrically connected with metalloid atoms. Thus, it would prevent long-range ordered diffusion during the solidification process, which favors the enhancement of GFA. For the alloys annealed at 800 K and 880 K, which range from Tx1 to Tx2, the crystallization products remain unchanged, and they are composed of α-Fe(Co), Fe23B6, and Fe2B phases. Because of the relatively short incubation time, the Fe23B6 phase is not completely decomposed. Thus, the existence of the metastable Fe23B6 phase still can be detected in the XRD patterns. Although the crystallization products remain unchanged, the corresponding width and intensity of the Bragg diffraction peaks change. This phenomenon suggests that the α-Fe(Co), Fe23B6, and Fe2B phases undergo grain growth processes, and their volume fraction increases. When the annealing temperature is larger than Tp2, the crystallization products consist of α-Fe(Co), Fe2B, and Fe3B phases for alloys annealed at 974 K. The existence of Fe2B and Fe3B phases is attributed to the decomposition of the metastable Fe23B6 phase. As the annealing temperature is further increased to 1151 K, the crystallization products remain composed of α-Fe(Co), Fe2B, and Fe3B phases. The amount of relative diffraction peaks of Fe2B and Fe3B phases is increased, suggesting that the volume fractions of Fe2B and Fe3B phases are enhanced. Therefore, the crystallization processes in the (Fe0.4Co0.6)79Nb3B18 alloys can be expressed as:
Amorphous → Amorphous + α-Fe(Co) + Fe23B6 + Fe2B → α-Fe(Co) + Fe2B + Fe3B
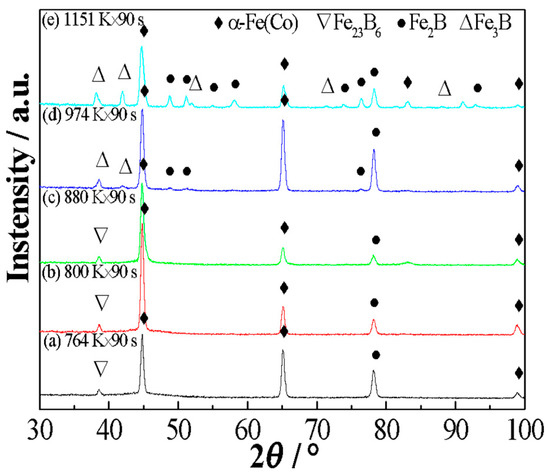
Figure 3.
Structural evolution of the (Fe0.4Co0.6)79Nb3B18 alloys annealed at different temperatures for 90 s.
The crystallinity refers to the degree of crystallization of amorphous alloys under different heat treatment processes. The crystallinity, Xc, can be expressed as,
where Wc and WA represent the mass fraction of the crystalline phase and amorphous phase, respectively.
Figure 4 shows the relationship between crystallinity Xc and annealing temperature Ta. The value of Xc is equal to 68.69% for alloys annealed at 764 K. With the increase of the annealing temperature, the crystallinity increases steadily. As the annealing temperature is further increased to 1151 K, the value of Xc becomes 98.88%.
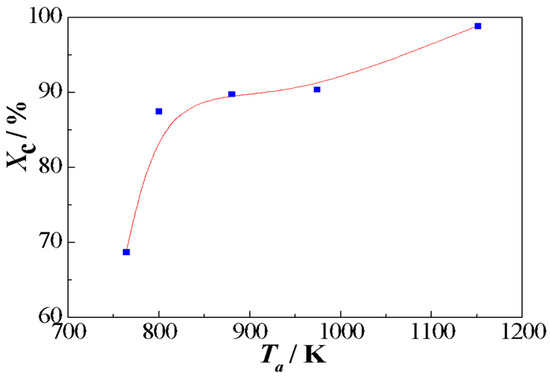
Figure 4.
Variation of crystallinity as a function of annealing temperature for the (Fe0.4Co0.6)79Nb3B18 alloys.
3.3. Variation of Grain Size and Annealing Temperature
According to the Scherrer Equation [6], the mean grain size (D) of the crystallite can be expressed as:
where λ is wavelength, θ is half the diffraction angle, β is full-width at half-maximum (FWHM) of the diffraction peak, and k is the constant (k = 0.89).
The mean grain size (D) as a function of annealing temperature is plotted in Figure 5, and the corresponding DSC curve is also given. With the increase of the annealing temperature within the range 764–1151 K, the mean grain size decreases steadily and then increases. In other words, the grain size has obvious valley value with the change of the annealing temperature. The mean grain size (D) is equal to 18.2 nm and 17.7 nm for alloys annealed at 764 K and 1151 K, respectively. It reaches the minimum value of 12.7 nm for alloys annealed at 880 K.
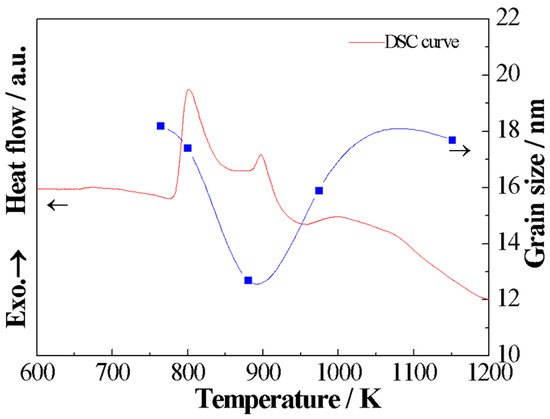
Figure 5.
The relationship between mean grain size and annealing temperature for the (Fe0.4Co0.6)79Nb3B18 alloys.
The relationship between mean grain size and annealing temperature is in accordance with that predicted by theoretical analysis [20,21]. In other words, when the annealing temperature is equal to 0.6 Tm, the mean grain size reaches the minimum value. It is directly related to the combined effect of a high nucleation rate and low grain growth rate. The crystallization process includes nucleation and grain growth processes. The nucleation rate I(Ta) and grain growth rate U(Ta) can be expressed as [20,22]:
where is melting entropy, τ (=1 − Ta/Tm) the undercooling, R the gas constant, ΔEn the activation energy of nucleation, ΔEg the activation energy of diffusion, Ta the annealing temperature, Tm the melting temperature, and I0, U0, and λ are the constants.
It can be found that the nucleation rate I(Ta) is determined by Ta and ΔEn, and grain growth rate U(Ta) is associated with Ta and ΔEg. The relationship between the nucleation rate and grain growth rate and annealing temperature is schematically plotted in Figure 6 [6], and Tx and Tm represent the first crystalline temperature and melting point, respectively. With the increase of Ta, I(Ta) and U(Ta) increase first and then decrease. As the temperature increases from the first crystalline temperature to the temperature of the extreme value of the nucleation rate, the nucleation rate increases faster than the grain growth rate, and it reaches the extreme value quickly. Previous theoretical research confirmed that, when the annealing temperature is equal to approximately 0.6Tm, a high nucleation rate and low grain growth rate can be achieved. Thus, it is reasonable to believe that the nanocrystalline alloys with fine grain sizes can be obtained for alloys annealed in the vicinity of 0.6Tm.
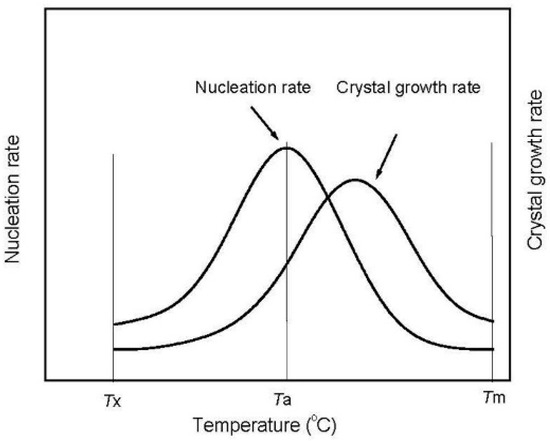
Figure 6.
Schematic diagram showing the plots of nucleation rate and grain growth rate as a function of annealing temperature.
3.4. Soft Magnetic Properties
Figure 7a displays the room-temperature magnetization hysteresis curves (M–H) of the (Fe0.4Co0.6)79Nb3B18 alloys annealed at 764 K for 60–900 s, and the inset shows the enlarged image of the M–H curves. As can be seen from Figure 7a, the annealed alloys exhibit obvious soft magnetic properties without a significant increase of the coercivity. Figure 7b exhibits the relationship between saturation magnetization (Ms) and coercivity (Hc) and incubation time (t) in the (Fe0.4Co0.6)79Nb3B18 alloys. The Ms value is equal to 113 emu g−1 for the as-quenched (Fe0.4Co0.6)79Nb3B18 alloys. Annealing for 60 s does not result in a significant change in Ms. As the incubation time further increases, the Ms value increases steadily. When the incubation time is equal to 900 s, the Ms value reaches the maximum value of 132 emu g−1. The increase of the Ms value is mainly determined by the grain size and volume fraction of the nano-scale precipitates. However, as the incubation time increases, the Hc value decreases slightly and then increases, and reaches 0.56 Oe for alloys annealed for 900 s. Short-time annealing benefits the reduction of internal stress, resulting in a slight decrease of Ms. However, further annealing leads to an increase in grain size, resulting in high Ms.
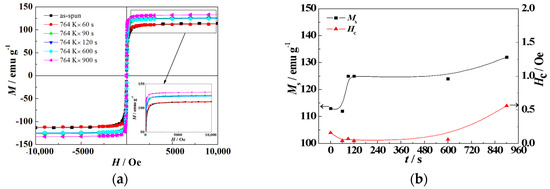
Figure 7.
Magnetization hysteresis curves taken from the (Fe0.4Co0.6)79Nb3B18 alloys annealed at 764 K (a) and the variation of Ms and Hc as a function of incubation time t (b).
Figure 8 displays the M–H curves of the (Fe0.4Co0.6)79Nb3B18 alloys annealed at 764 K, 800 K, 880 K, 974 K, and 1151 K for 90 s, respectively. The insert clearly shows the relationship between Ms and Hc and annealing temperature. The VSM results indicate that the saturation magnetization (Ms) increases first and then decreases with the increase of annealing temperature. The alloys annealed at 880 K exhibit the optimized soft magnetic properties with high Ms of 145 emu g−1 and low Hc of 0.04 Oe. The α-(Fe, Co) and Fe23B6 phases are ferromagnetic [17,23], while Fe2B or Fe3B phases belong to the hard magnetic phase [14]. During the annealing process, more and more short-range ordered clusters are formed within the amorphous matrix, and the coupling of these clusters leads to anisotropy. With the increase of annealing temperatures ranging from 764 K to 880 K, the crystallization products remain the same, while the mean grain size decreases. The ferromagnetic exchange between these α-Fe(Co) nanocrystals is enhanced, thus leading to an increase of Ms. However, further increase of the annealing temperature results in coarse crystals with the precipitation of hard magnetic phases Fe2B or Fe3B [24,25]. As a result, the Ms value of the alloys is found to decrease.
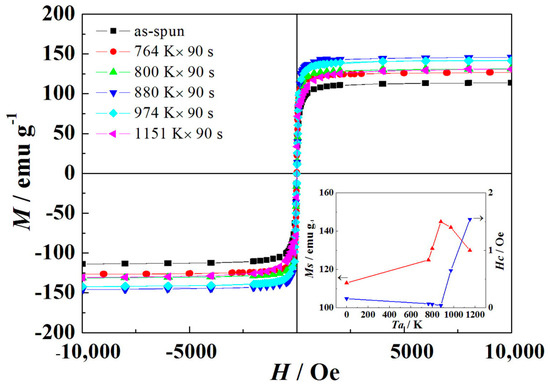
Figure 8.
Room-temperature magnetization hysteresis curves for the (Fe0.4Co0.6)79Nb3B18 alloys annealed at different temperatures.
According to the random anisotropy model (RAM) proposed by Hezer [26], the coercivity Hc is expressed as follows:
where pc is the dimensionless pre-factor of the order of unity, K1 is the magneto-crystalline anisotropy, A is exchange stiffness, and Js is saturation polarization.
The coercivity of the annealed (Fe0.4Co0.6)79Nb3B18 alloys is quite low. Similar results were also obtained in the Fe74Cu0.8Nb2.7Si15.5B7 alloys reported by Hoque et al. [27]. The coercivity of the annealed (Fe0.4Co0.6)79Nb3B18 alloys decreases first and then increases with the increase of annealing temperature. With the increase of annealing temperatures in the range of 764–880 K, the crystallization products remain the same, and mean grain size decreases, leading to a decrease of Hc value. However, a further increase of annealing temperature results in the formation of the Fe2B or Fe3B phases. It is reported that the K1 values for the Fe2B or Fe3B phases are equal to 430 kJ/m3 [24,27], which are larger than that of the α-Fe(Co) phase. Therefore, this increase would significantly increase the magneto-crystalline anisotropy, thus leading to an increase of Hc value.
4. Conclusions
- (1)
- During the crystallization process in the (Fe0.4Co0.6)79Nb3B18 alloys, a mixture of α-Fe(Co), Fe2B, and Fe23B6 phases is first precipitated from the amorphous matrix, and then the formation of α-Fe(Co), Fe2B, and Fe3B phases occurs due to the decomposition of the metastable Fe23B6 phase.
- (2)
- For alloys annealed at Tg~Tx1, as the incubation time increases, the saturation magnetization first remains unchanged, and then increases steadily, while the coercivity decreases first and then increases.
- (3)
- The mean grain sizes of the annealed (Fe0.4Co0.6)79Nb3B18 alloys first decrease and then increase with the increase of annealing temperature. The mean grain size reaches the minimum value of 12.7 nm for alloys annealed at 880 K.
- (4)
- The annealed (Fe0.4Co0.6)79Nb3B18 alloys exhibit excellent magnetic properties with high saturation magnetization and low coercivity. With the increase of annealing temperature, the saturation magnetization first increases and then decreases, while coercivity is not obviously enhanced. The alloys annealed at 880 K with the finest grain size exhibit the optimized soft magnetic properties.
Author Contributions
Y.F., M.Z., and L.Y. conceived and designed the experiments; M.Z., Z.J., and F.C. supervised the whole project and gave advice on manuscript editing; Y.F. and P.T. performed the experiments and analyzed the data; the final manuscript was edited by all the authors.
Funding
This research was funded by the National Natural Science Foundation of China (Nos. 51301125, 51371133); the Key Laboratory Scientific Research Program of Education Department of Shaanxi Province, China (No. 17KS055); and China Scholarship Council (CSC).
Conflicts of Interest
The authors declare no conflict of interest.
References
- Yoshizawa, Y.; Oguma, S.; Yamauchi, K. New Fe-based soft magnetic alloys composed of ultrafine grain structure. J. Appl. Phys. 1988, 64, 6044–6066. [Google Scholar] [CrossRef]
- Rizal, C.; Kolthammer, J.; Pokharel, R.K.; Choi, B.C. Magnetic properties of nanostructured Fe-Co alloys. J. Appl. Phys. 2013, 113, 113905. [Google Scholar] [CrossRef]
- Inoue, A.; Shen, B.L.; Koshiba, H.; Kato, H.; Yavari, A.R. Cobalt-based bulk glassy alloy with ultrahigh strength and soft magnetic properties. Nat. Mater. 2003, 2, 661–663. [Google Scholar] [CrossRef] [PubMed]
- Willard, M.A.; Laughlin, D.E.; McHenry, M.E.; Thoma, D.; Sickafus, K.; Cross, J.O.; Harris, V.G. Structure and magnetic properties of (Fe0.5Co0.5)88Zr7B4Cu1 nanocrystalline alloys. J. Appl. Phys. 1998, 84, 6773–6777. [Google Scholar] [CrossRef]
- McHenry, M.E.; Willard, M.A.; Laughlin, D.E. Amorphous and nanocrystalline materials for applications as soft magnets. Prog. Mater. Sci. 1999, 44, 291–433. [Google Scholar] [CrossRef]
- Tang, J.C.; Mao, X.Y.; Li, S.D.; Gao, W.L.; Du, Y.W. Effects of two-step annealing on the microstructures and soft magnetic properties of nanocrystalline Fe86Zr7B6Cu1 ribbons. J. Alloys Compd. 2004, 375, 233–238. [Google Scholar] [CrossRef]
- Cao, C.C.; Fan, J.W.; Zhu, L.; Meng, Y.; Wang, Y.G. Effects of relaxation time on local structural and magnetic properties of Fe80.8B10P8Cu1.2 amorphous alloy. Acta Phys. Sin. 2017, 66, 167501. (In Chinese) [Google Scholar]
- Fan, X.D.; Zhang, T.; Jiang, M.F.; Yangc, W.M.; Shen, B.L. Synthesis of novel FeSiBPCCu alloys with high amorphous forming ability and good soft magnetic properties. J. Non-Cryst. Solids 2018, in press. [Google Scholar] [CrossRef]
- Parsons, R.; Zang, B.; Onodera, K.; Kishimoto, H.; Kato, A.; Suzuki, K. Soft magnetic properties of rapidly-annealed nanocrystalline Fe-Nb-B-(Cu) alloys. J. Alloys Compd. 2017, 723, 408–417. [Google Scholar] [CrossRef]
- Xue, L.; Yang, W.M.; Liu, H.S.; Men, H.; Wang, A.; Chang, C.T.; Shen, B.L. Effect of Co addition on the magnetic properties and microstructure of FeNbBCu nanocrystalline alloys. J. Magn. Magn. Mater. 2016, 419, 198–201. [Google Scholar] [CrossRef]
- Ramanujan, R.V.; Zhang, Y.R. Quantitative transmission electron microscopy analysis of the nanocrystallization kinetics of soft magnetic alloys. Phys. Rev. B 2006, 74, 224408. [Google Scholar] [CrossRef]
- Kotan, H.; Darling, K.A.; Saber, M.; Scattergood, R.O.; Koch, C.C. An in situ experimental study of grain growth in a nanocrystalline Fe91Ni8Zr1 alloy. J. Mater. Sci. 2013, 48, 2251–2257. [Google Scholar] [CrossRef]
- Sahoo, T.; Majumdar, B.; Srinivas, V.; Srinivas, M.; Nath, T.K.; Agarwal, G. Improved magnetoimpedance and mechanical properties on nanocrystallization of amorphous Fe68.5Si18.5Cu1Nb3B9 ribbons. J. Magn. Magn. Mater. 2013, 343, 13–20. [Google Scholar] [CrossRef]
- Xue, L.; Liu, H.S.; Dou, L.T.; Yang, W.M.; Chang, C.T.; Inoue, A.; Wang, X.M.; Li, R.W.; Shen, B.L. Soft magnetic properties and microstructure of Fe84−xNb2B14Cux nanocrystalline alloys. Mater. Design 2014, 56, 227–231. [Google Scholar] [CrossRef]
- Li, P.; Su, H.L.; Song, Y.J.; Wu, Y.C. Effects of annealing temperature on microstructure and magnetic properties of Fe73.37Cu0.92Nb2.9Si13.56B9.24 amorphous alloy. Mater. Sci. Technol. 2013, 29, 460–463. [Google Scholar] [CrossRef]
- Jiang, J.Z. Anomalous grain growth in nanocrystalline Fe73.5Cu1Nb3Si13.5B9 alloys. Nanostruct. Mater. 1997, 9, 245–248. [Google Scholar] [CrossRef]
- Stoica, M.; Kumar, S.; Roth, S.; Ram, S.; Eckert, J.; Vaughan, G.; Yavari, A.R. Crystallization kinetics and magnetic properties of Fe66Nb4B30 bulk metallic glass. J Alloys Compd. 2009, 483, 632–637. [Google Scholar] [CrossRef]
- Torrens-Serra, J.; Rodríguez-Viejo, J.; Clavaguera-Mora, M.T. Nanocrystallization kinetics and glass forming ability of the Fe65Nb10B25 metallic alloy. Phys. Rev. B 2007, 76, 214111. [Google Scholar] [CrossRef]
- Imafuku, M.; Sato, S.; Koshiba, H.; Matsubara, E.; Inoue, A. Crystallization behavior of amorphous Fe90-XNb10BX (X = 10 and 30) alloys. Mater. Trans. JIM 2000, 41, 1526–1529. [Google Scholar] [CrossRef]
- Yao, B.; Guo, H.C.; Wang, J.; Ding, B.Z.; Li, H.; Wang, A.M.; Hu, Z.Q. Influence of pressure on the grain sizes in the crystallization process of an amorphous Fe-Mo-Si-B alloy. Phys. B Condens. Matter 1996, 228, 379–382. [Google Scholar] [CrossRef]
- Yang, W.M.; Liu, H.S.; Dun, C.C.; Zhao, Y.C.; Dou, L.M. The mechanism of the anomalous variation of grain size for Fe-based nanocrystalline alloys. Acta Phys. Sin. 2012, 61, 106802. (In Chinese) [Google Scholar]
- Guo, Y.C.; Wang, Z.X. Amorphous State Physics, 1st ed.; Scientific Press: Beijing, China, 1984; pp. 129–145. (In Chinese) [Google Scholar]
- Shen, B.L.; Men, H.; Inoue, A. Fe-based bulk glassy alloy composite containing in situ formed á-(Fe, Co) and (Fe, Co)23B6 microcrystalline grains. Appl. Phys. Lett. 2006, 89, 101915. [Google Scholar] [CrossRef]
- Gao, J.E.; Li, H.X.; Jiao, Z.B.; Wu, Y.; Chen, Y.H.; Yu, T.; Lu, Z.P. Effects of nanocrystal formation on the soft magnetic properties of Fe-based bulk metallic glasses. Appl. Phys. Lett. 2011, 99, 052504. [Google Scholar] [CrossRef]
- Zhu, M.; Fa, Y.; Jian, Z.Y.; Yao, L.J.; Jin, C.Q.; Nan, R.H.; Chang, F.E. Non-isothermal crystallization kinetics and soft magnetic properties of the Fe67Nb5B28 metallic glasses. J. Therm. Anal. Calorim. 2018, 132, 173–180. [Google Scholar] [CrossRef]
- Hezer, G. Grain size dependence of coercivity and permeability in nanocrystalline ferromagnets. IEEE Trans. Magn. 1990, 26, 1397–1402. [Google Scholar] [CrossRef]
- Hoque, M.S.; Hakim, M.A.; Dhar, U.; Saha, D.K.; Nordblad, P.; Paul, D.P. Detailed study of ultra-soft magnetic properties of Fe74Cu0.8Nb2.7Si15.5B7. Philos. Mag. 2011, 91, 2117–2139. [Google Scholar] [CrossRef]
© 2018 by the authors. Licensee MDPI, Basel, Switzerland. This article is an open access article distributed under the terms and conditions of the Creative Commons Attribution (CC BY) license (http://creativecommons.org/licenses/by/4.0/).