Influence of Bitumen Type and Asphalt Mixture Composition on Low-Temperature Strength Properties According to Various Test Methods


Abstract
1. Introduction
1.1. Background
1.2. Objectives
2. Materials and Methods
2.1. Materials
2.1.1. Bitumens
2.1.2. Asphalt Mixtures
2.2. Methods
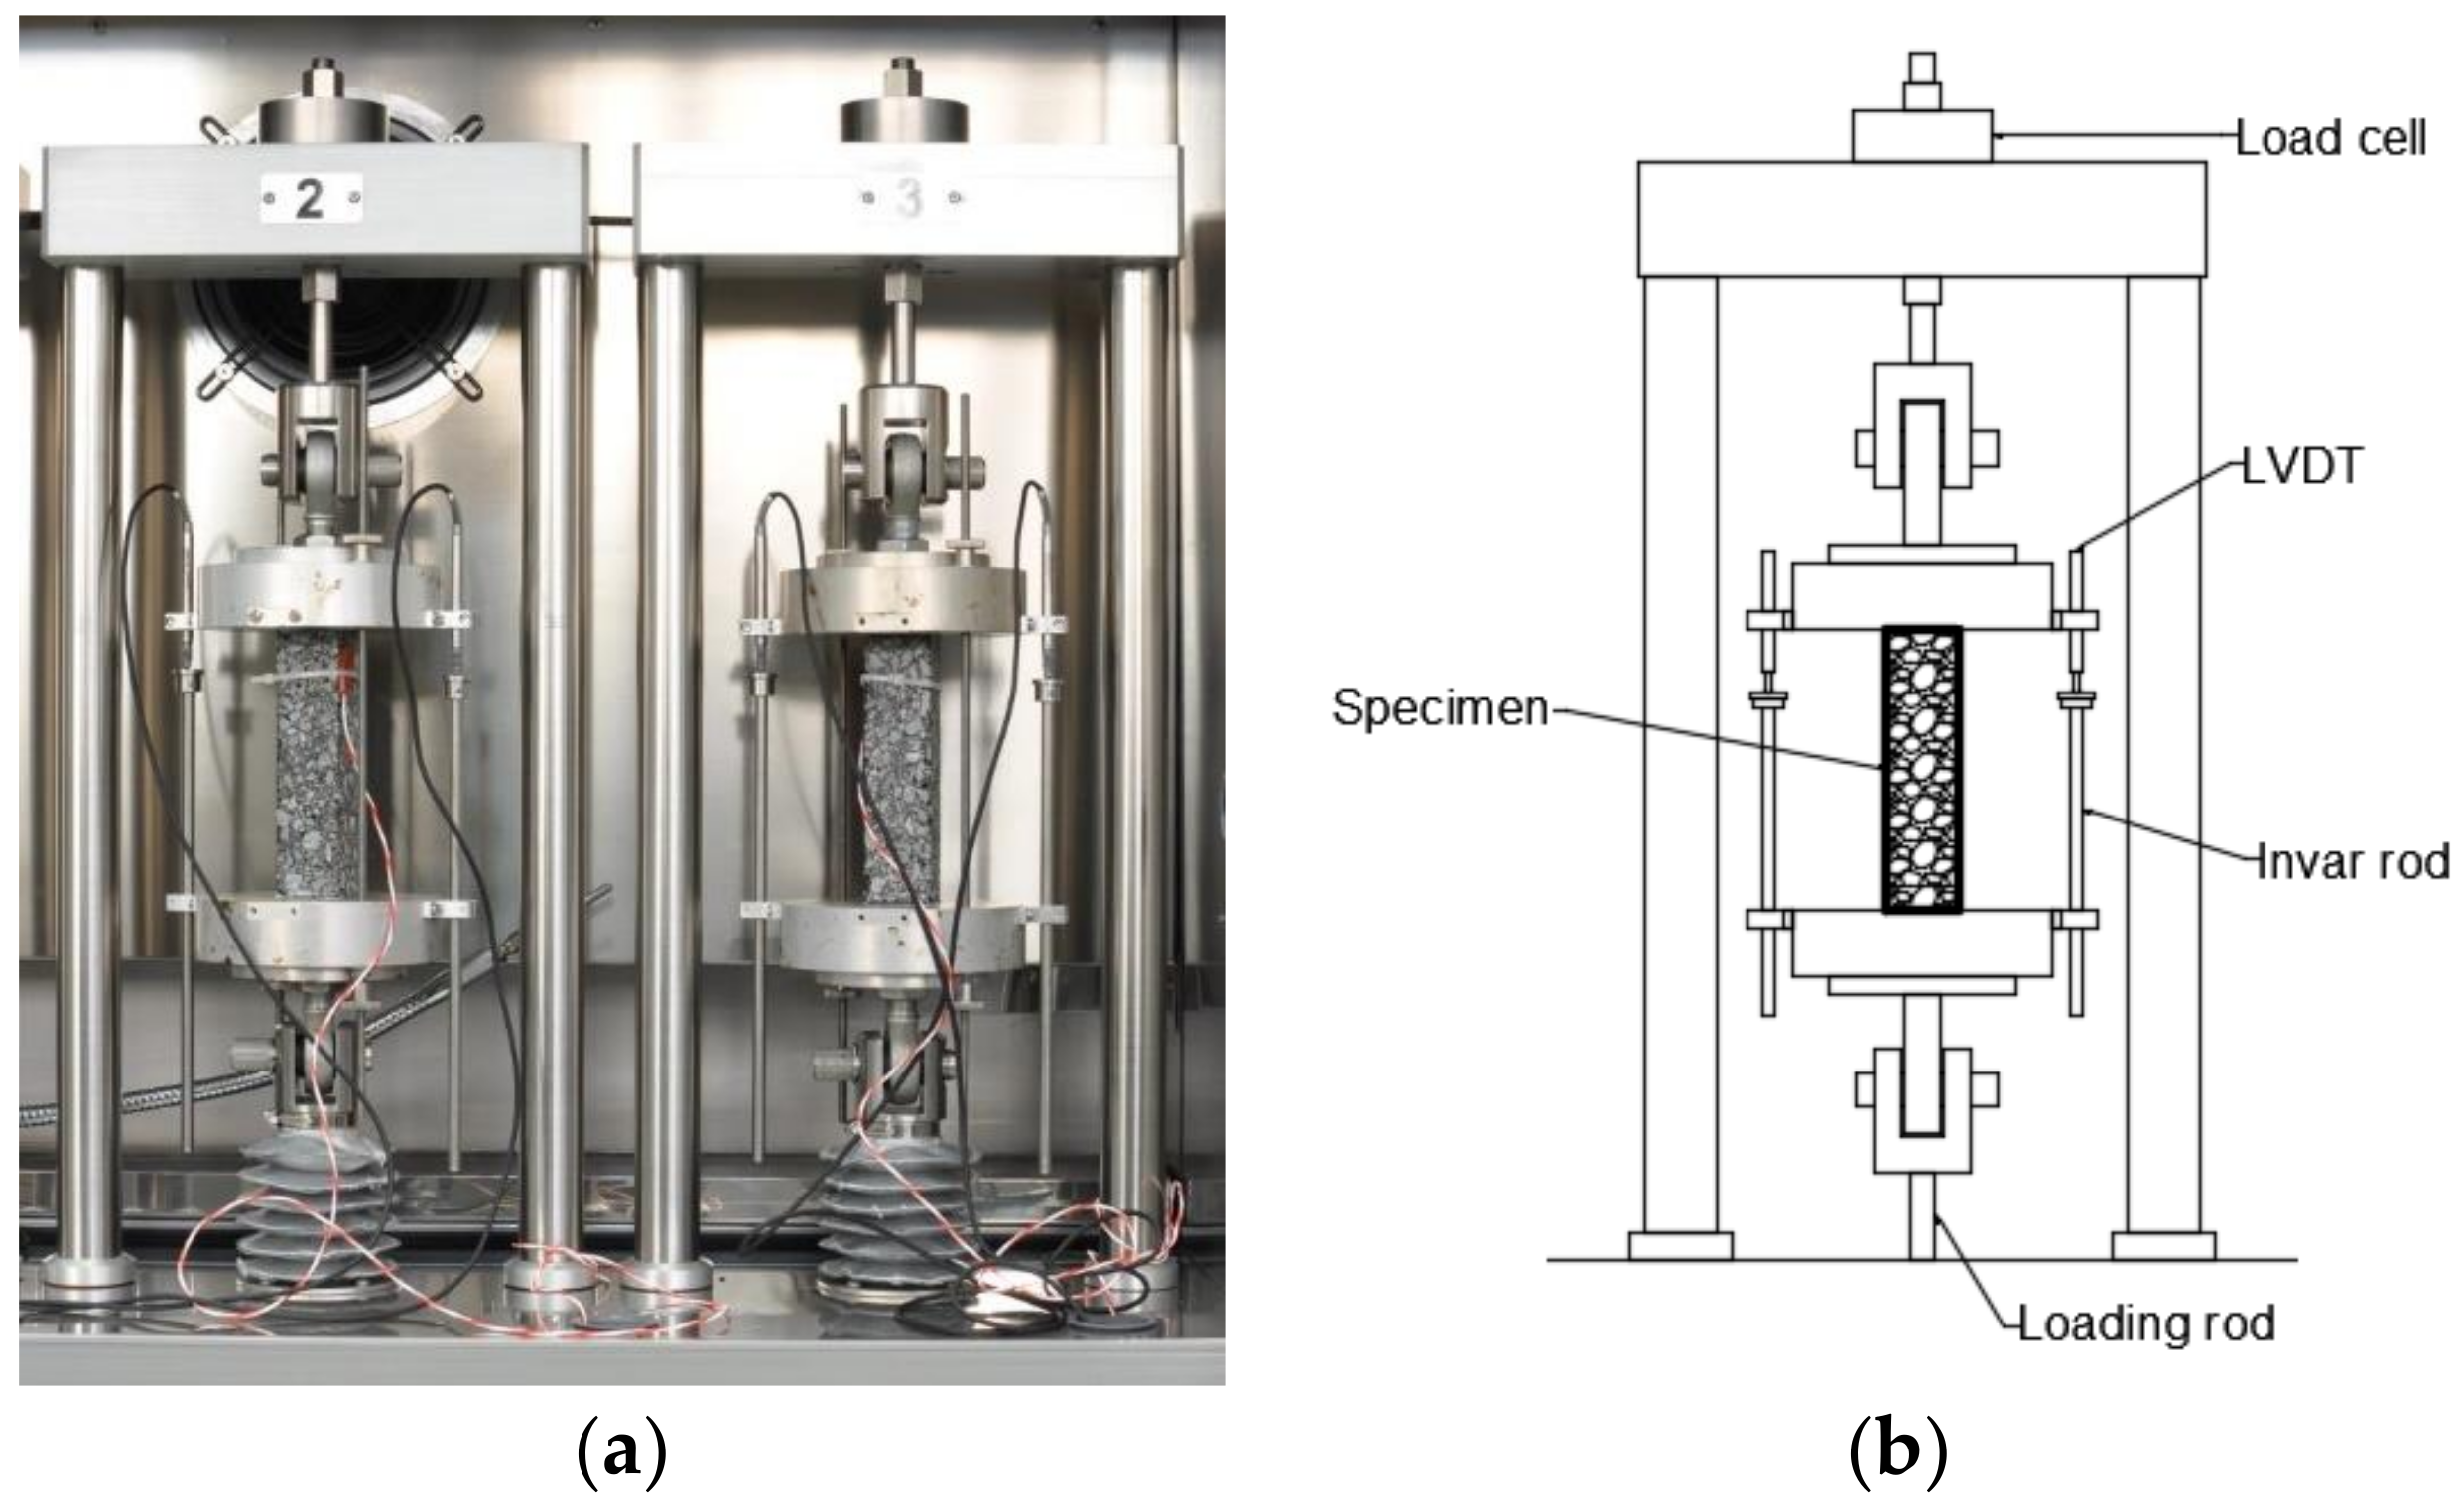
2.2.1. Uniaxial Tension Tests
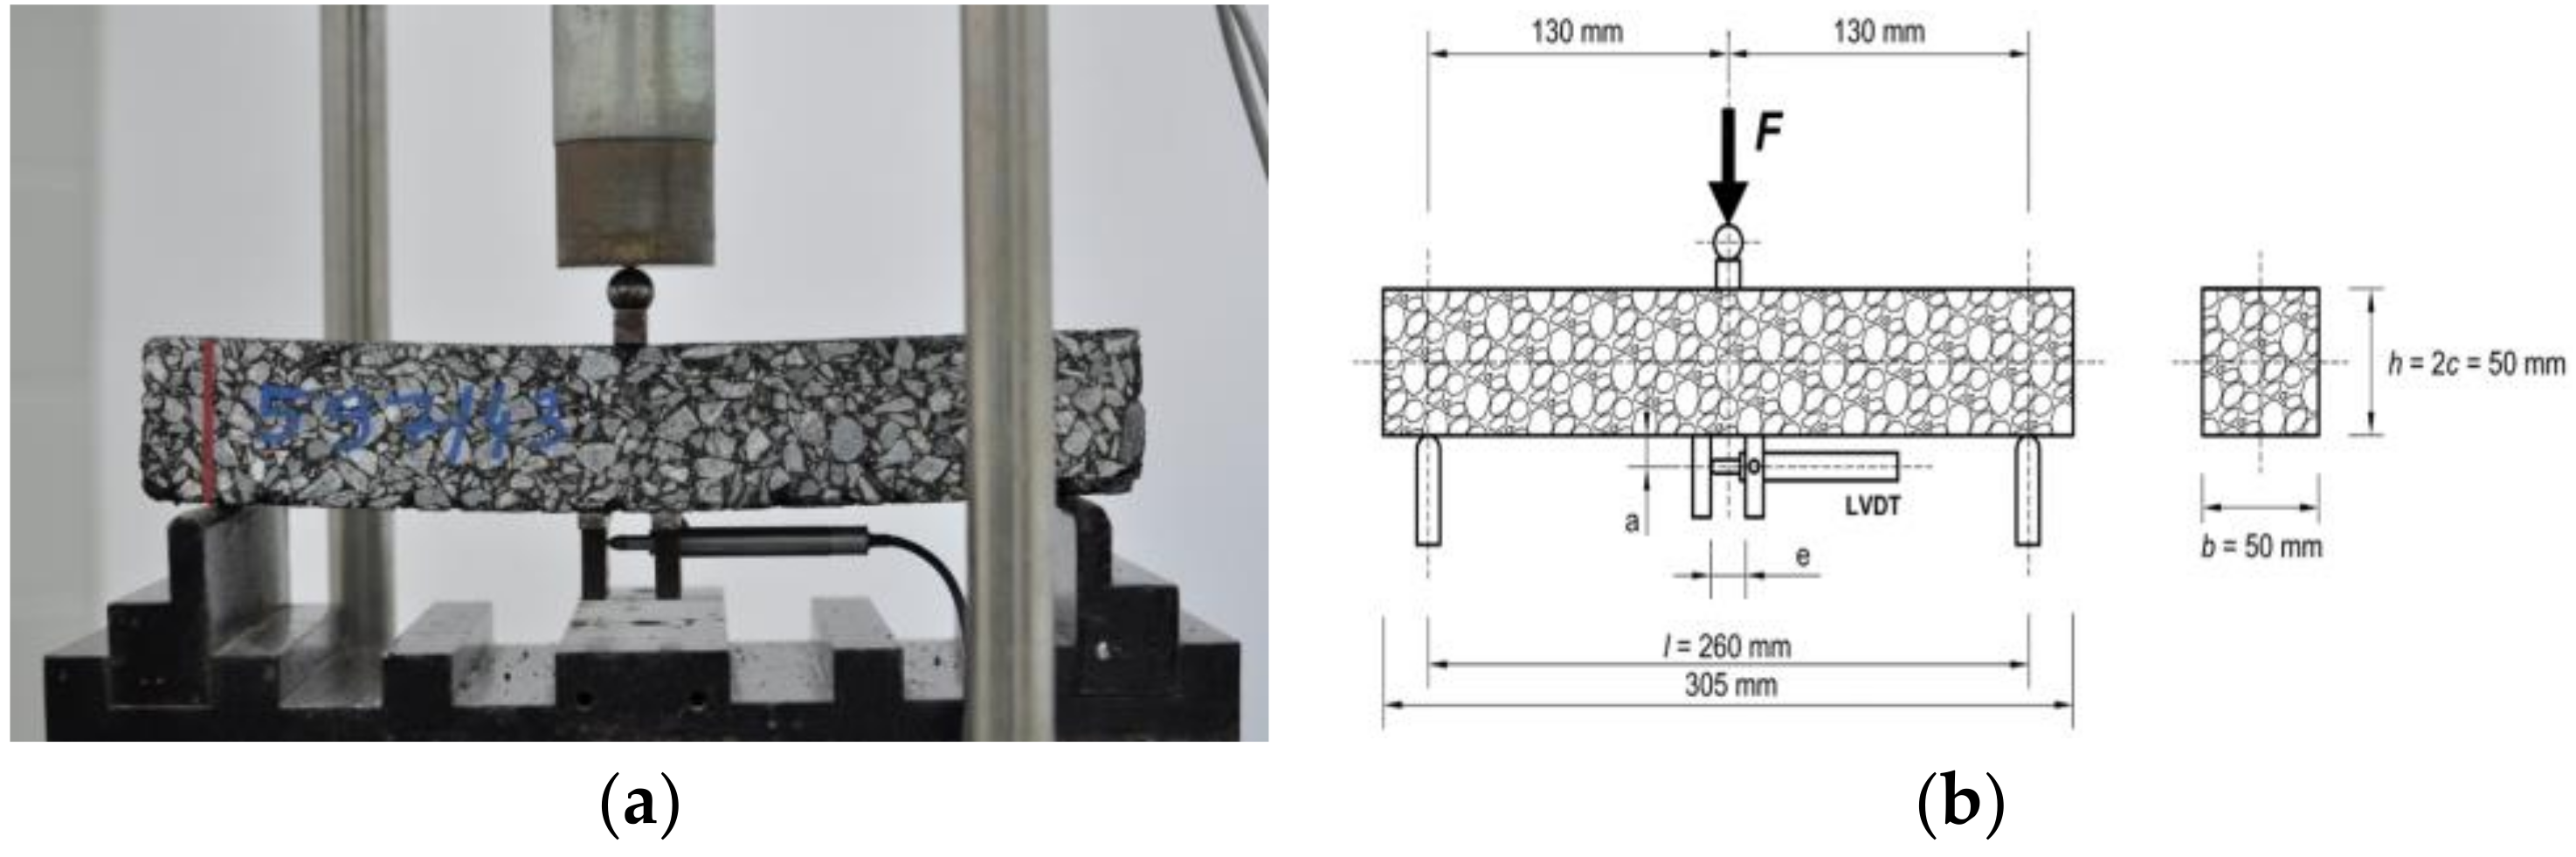
2.2.2. Bending Beam Test (BBT)
2.2.3. Semi-Circular Bending Test (SCB)
2.2.4. Summary of Test Methods and Tested Materials
3. Results and Discussion
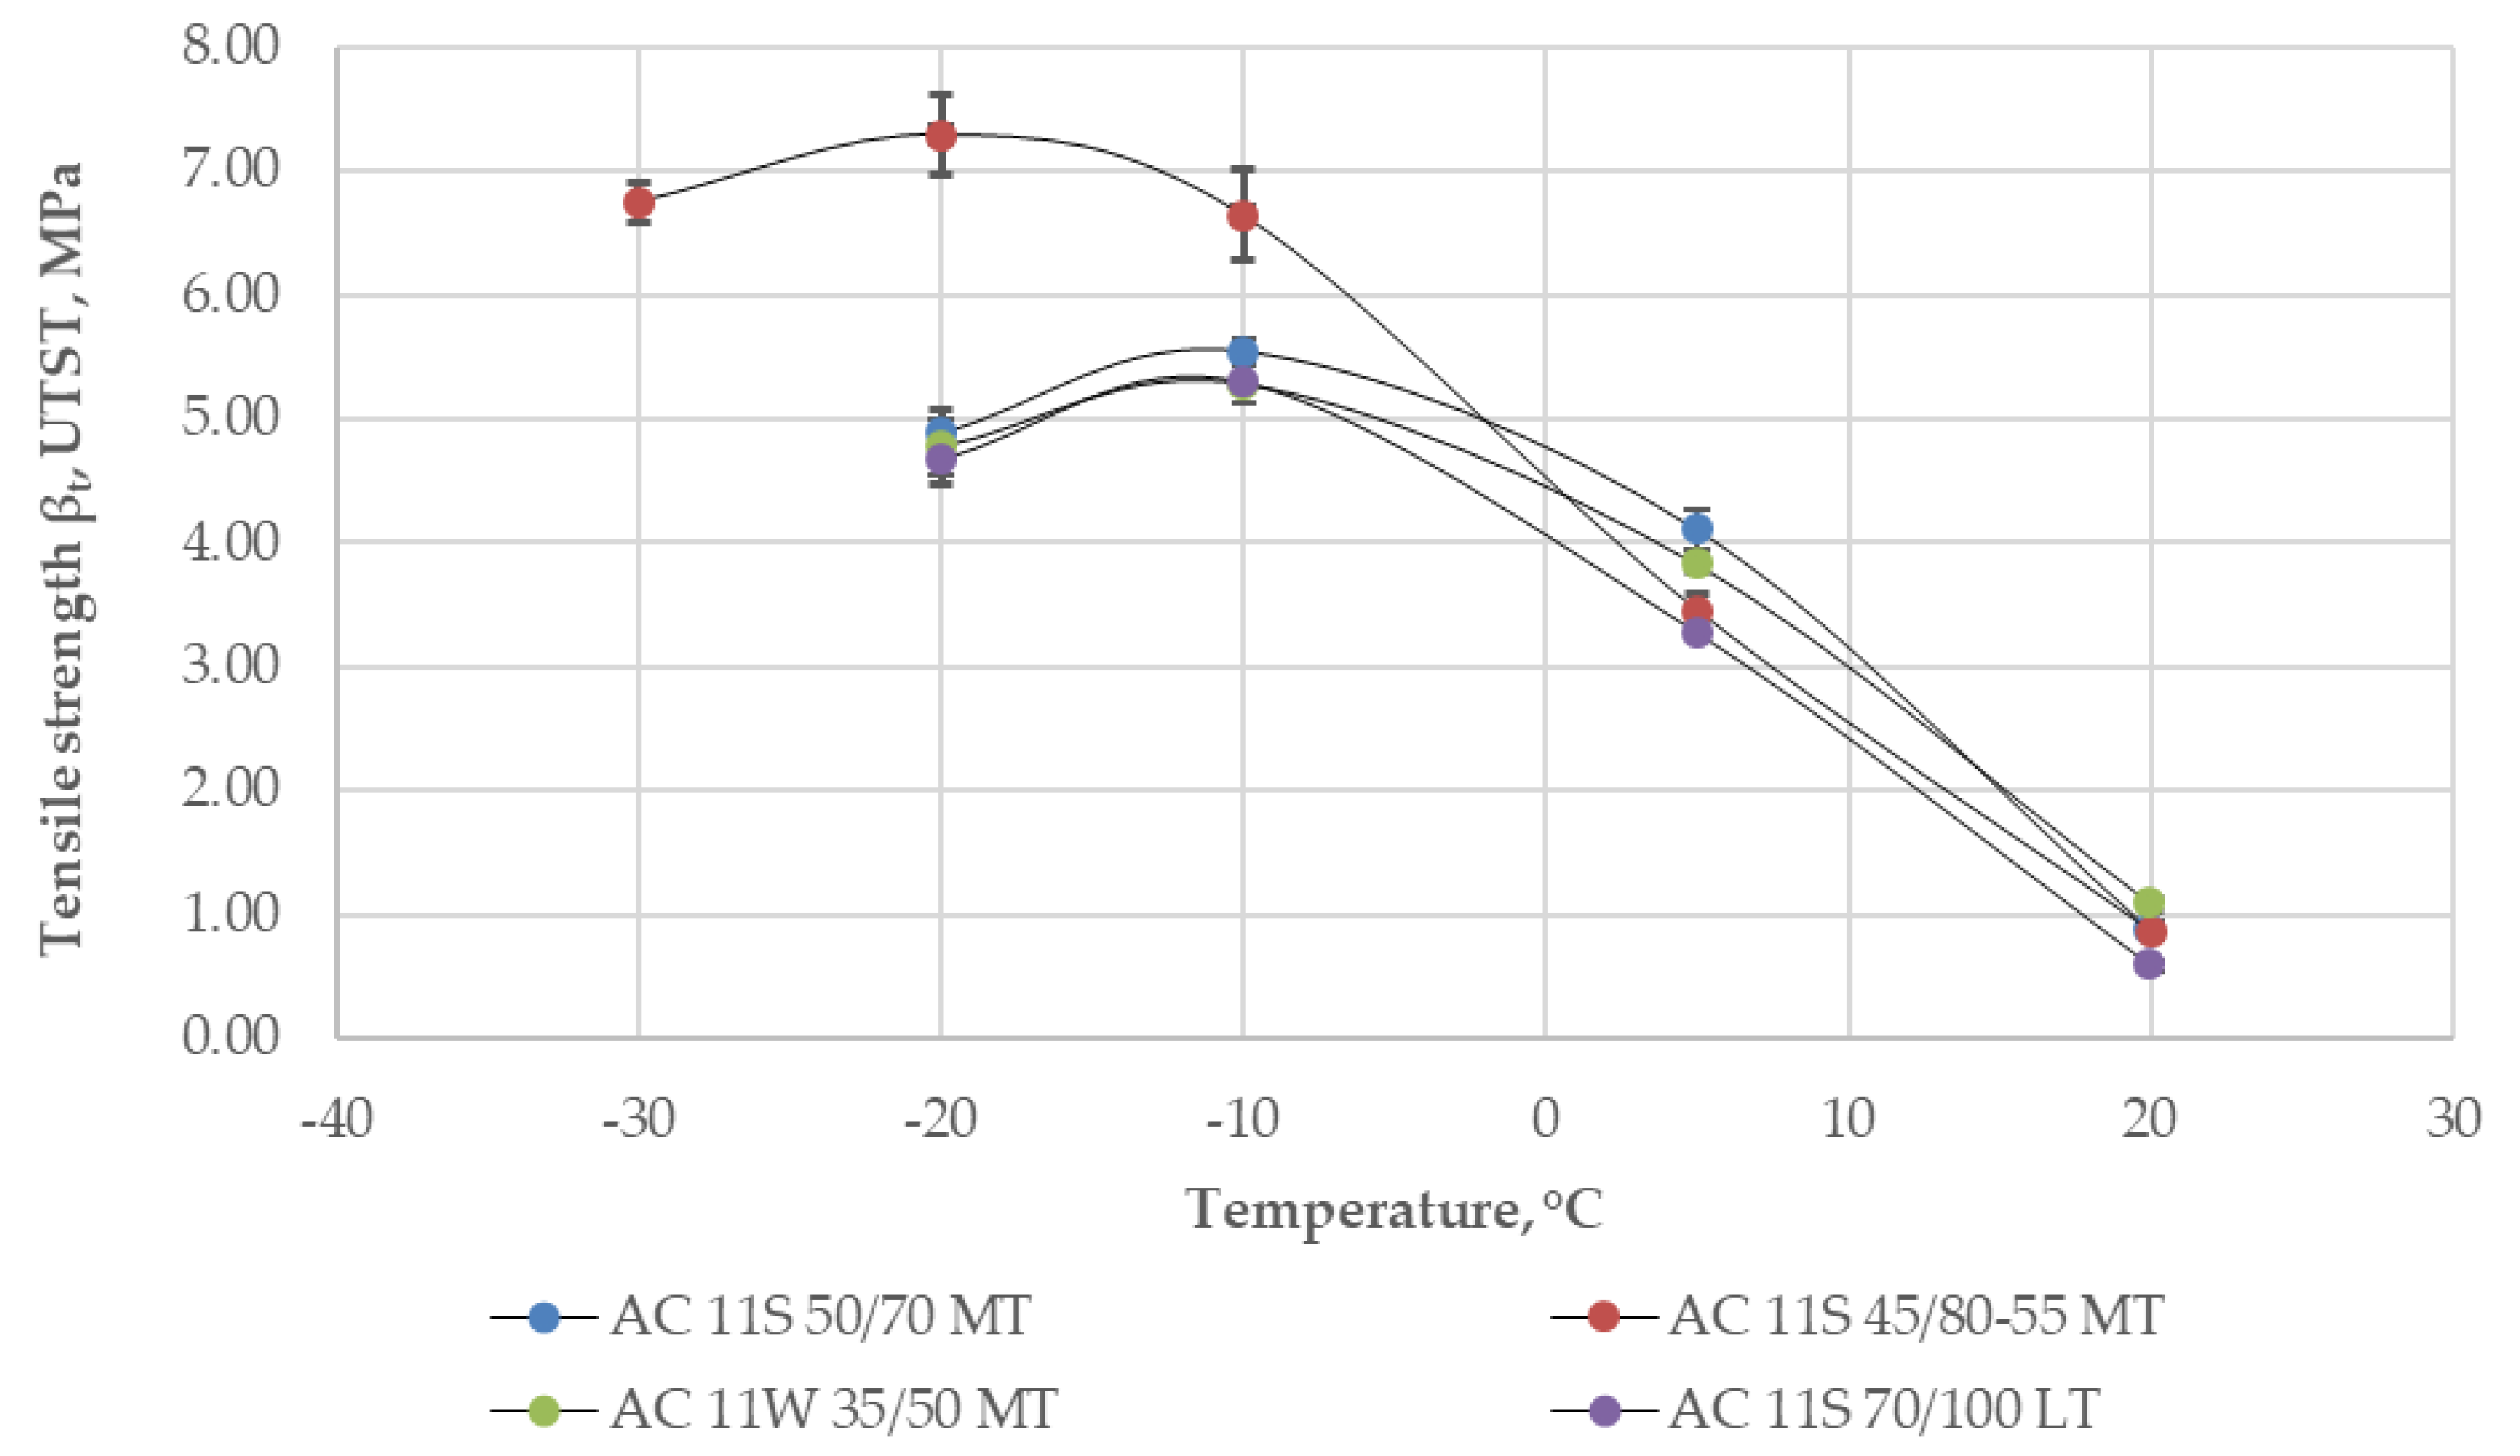
3.1. Results from the Uniaxial Tension Tests and Their Analysis
3.2. Results from the Bending Beam Test (BBT) and Their Analysis
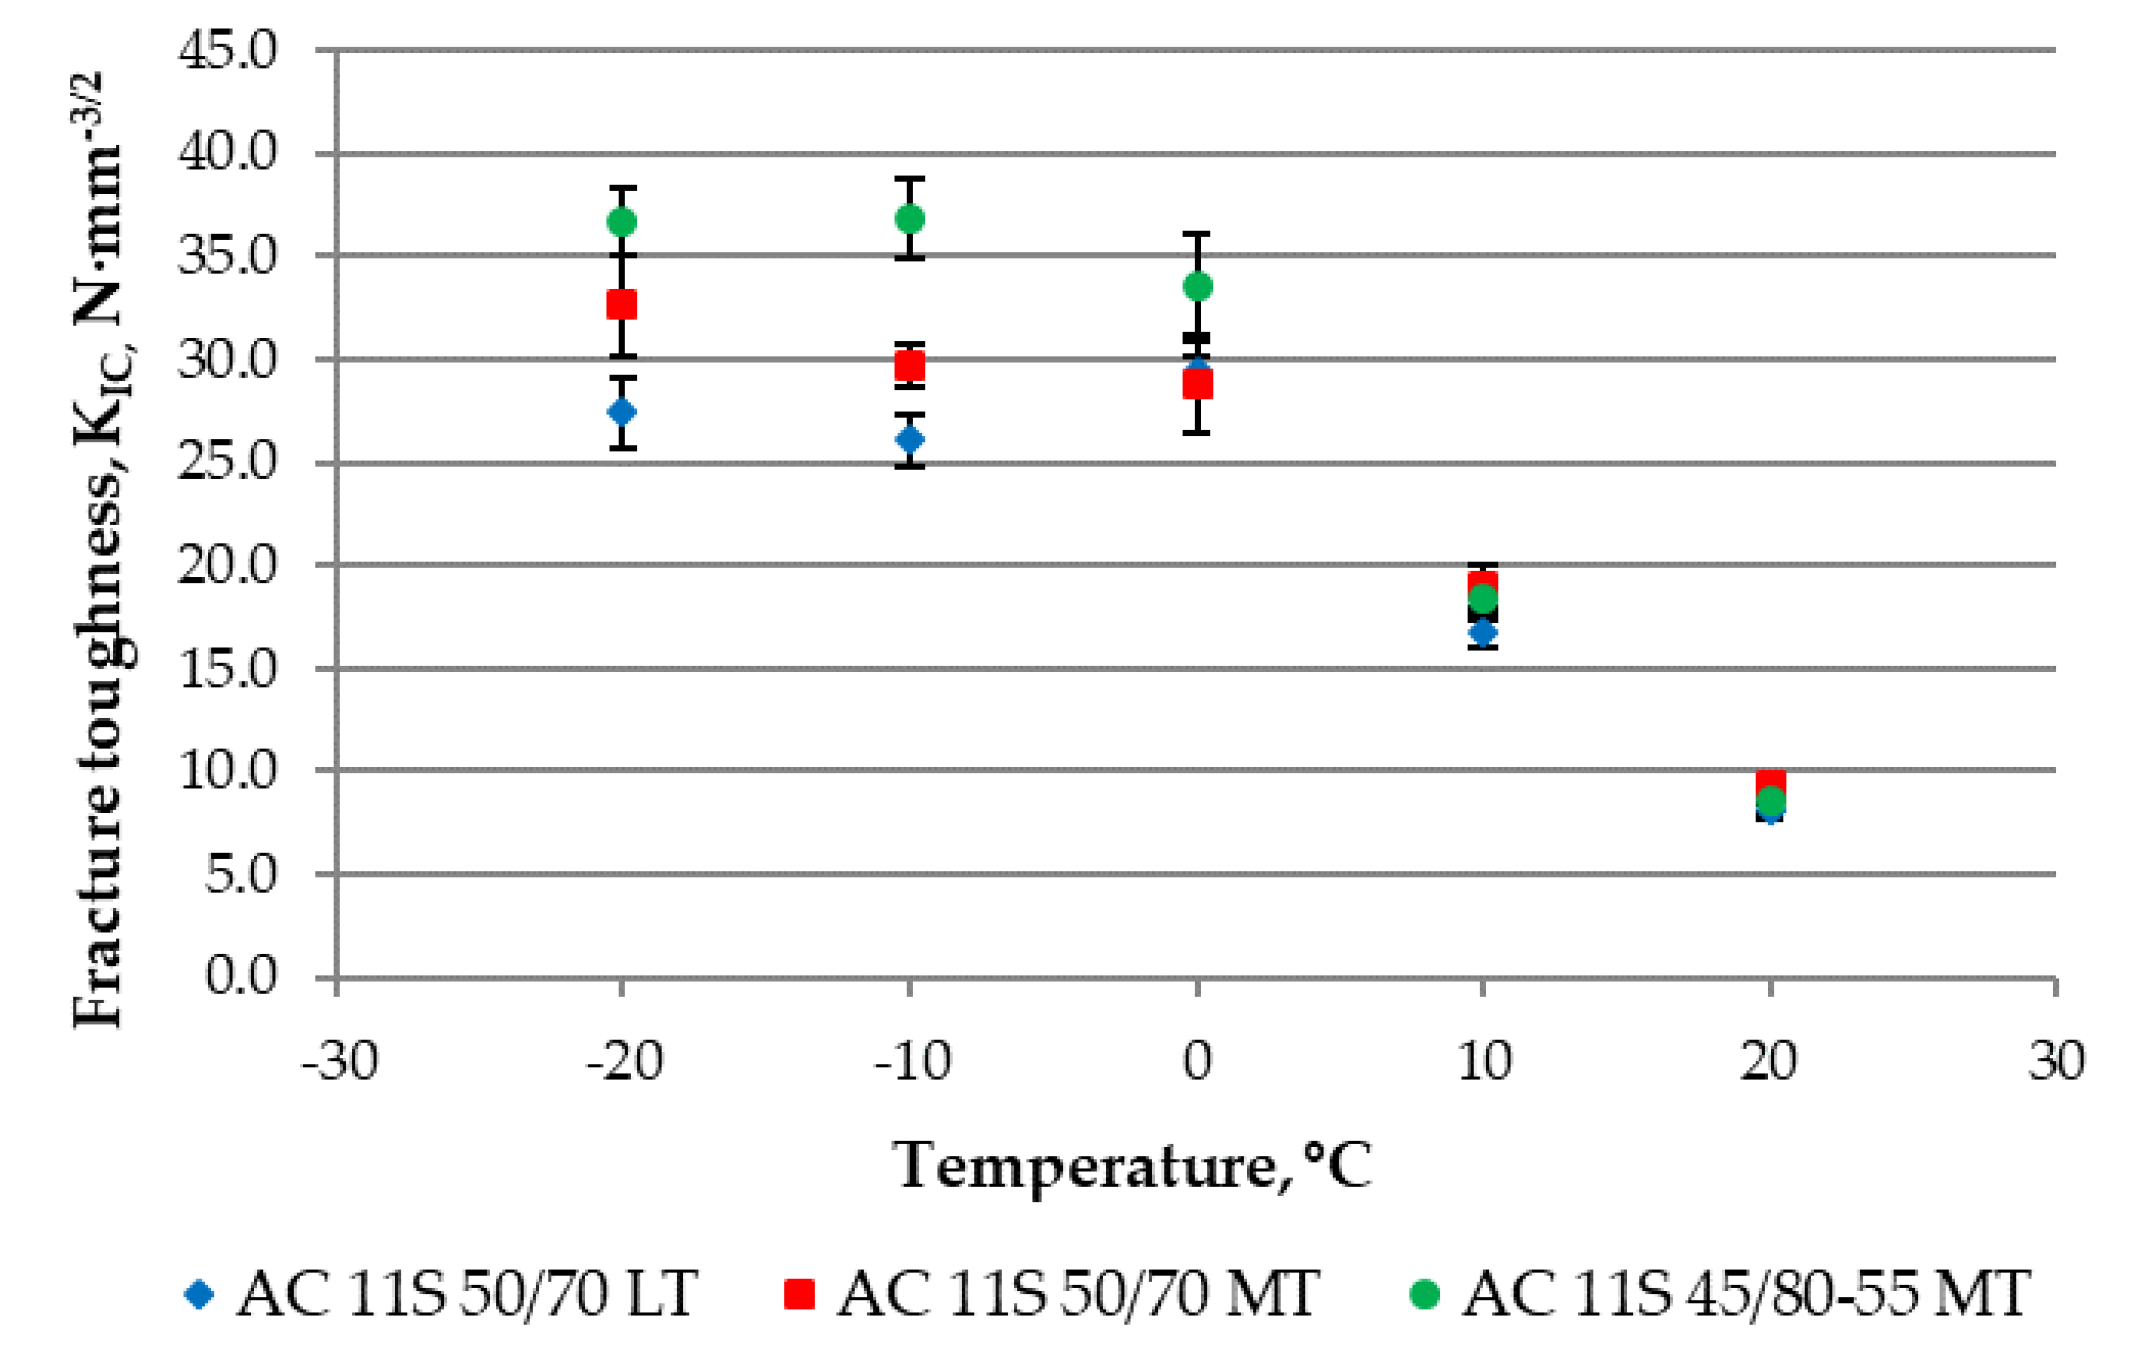
3.3. Results of Fracture Toughness from the Semi-Circular Bending Test (SCB) and their Analysis
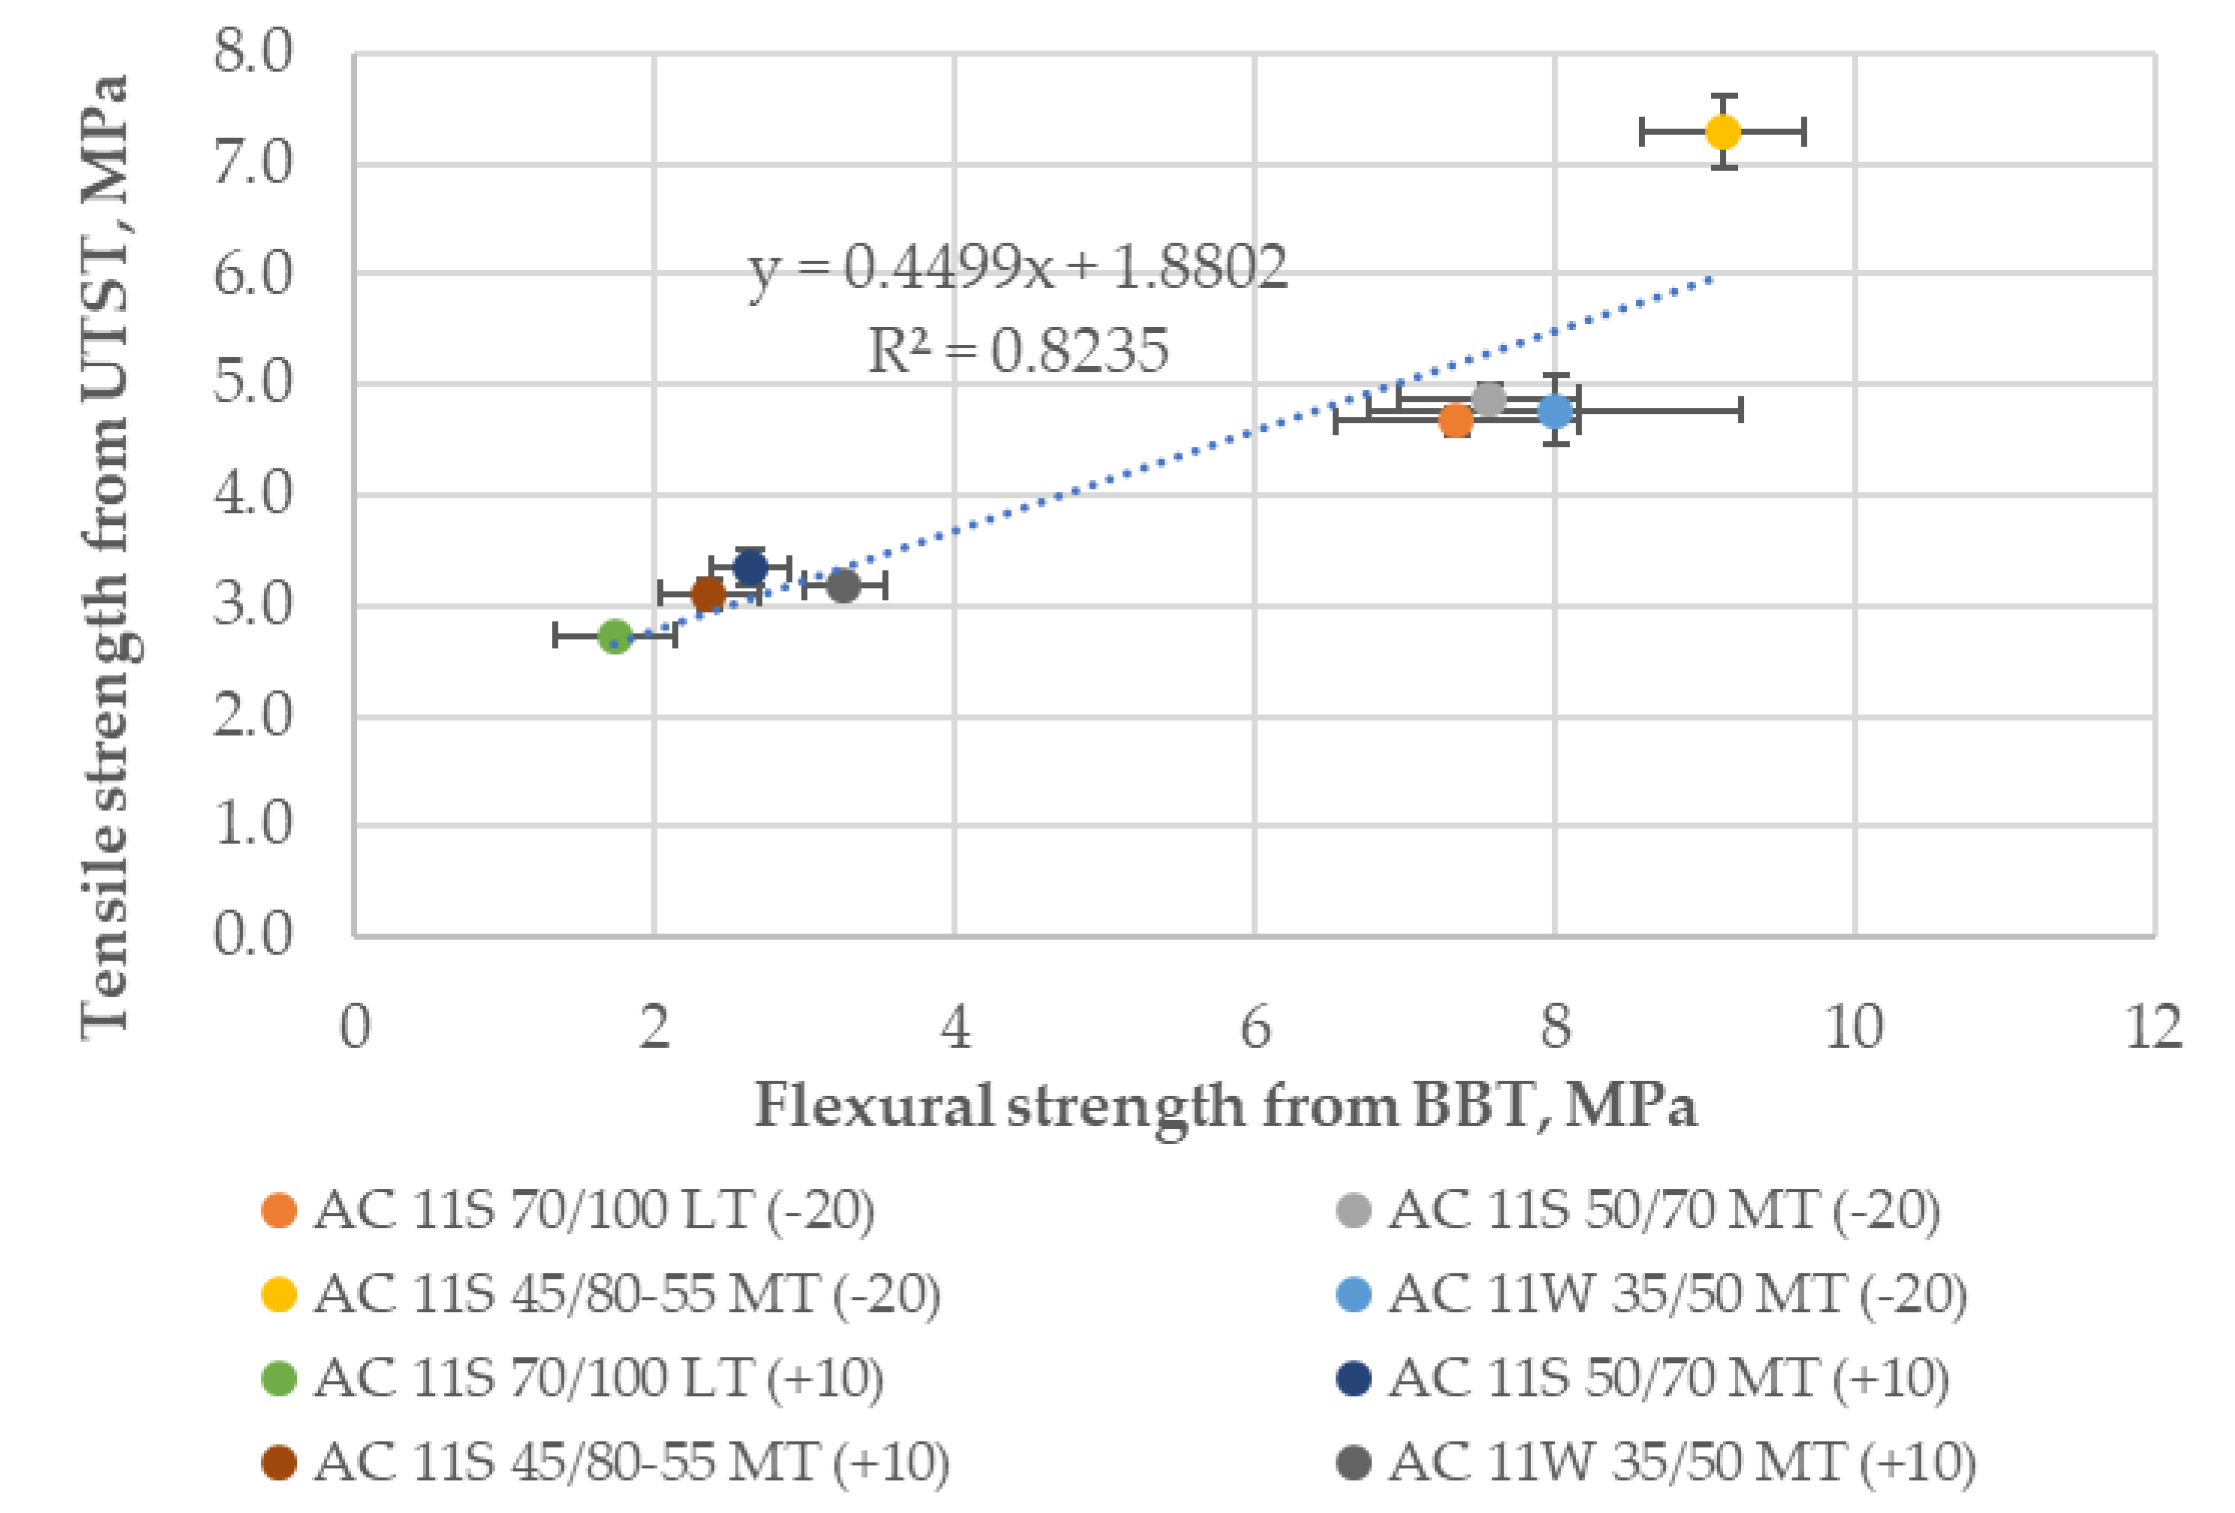
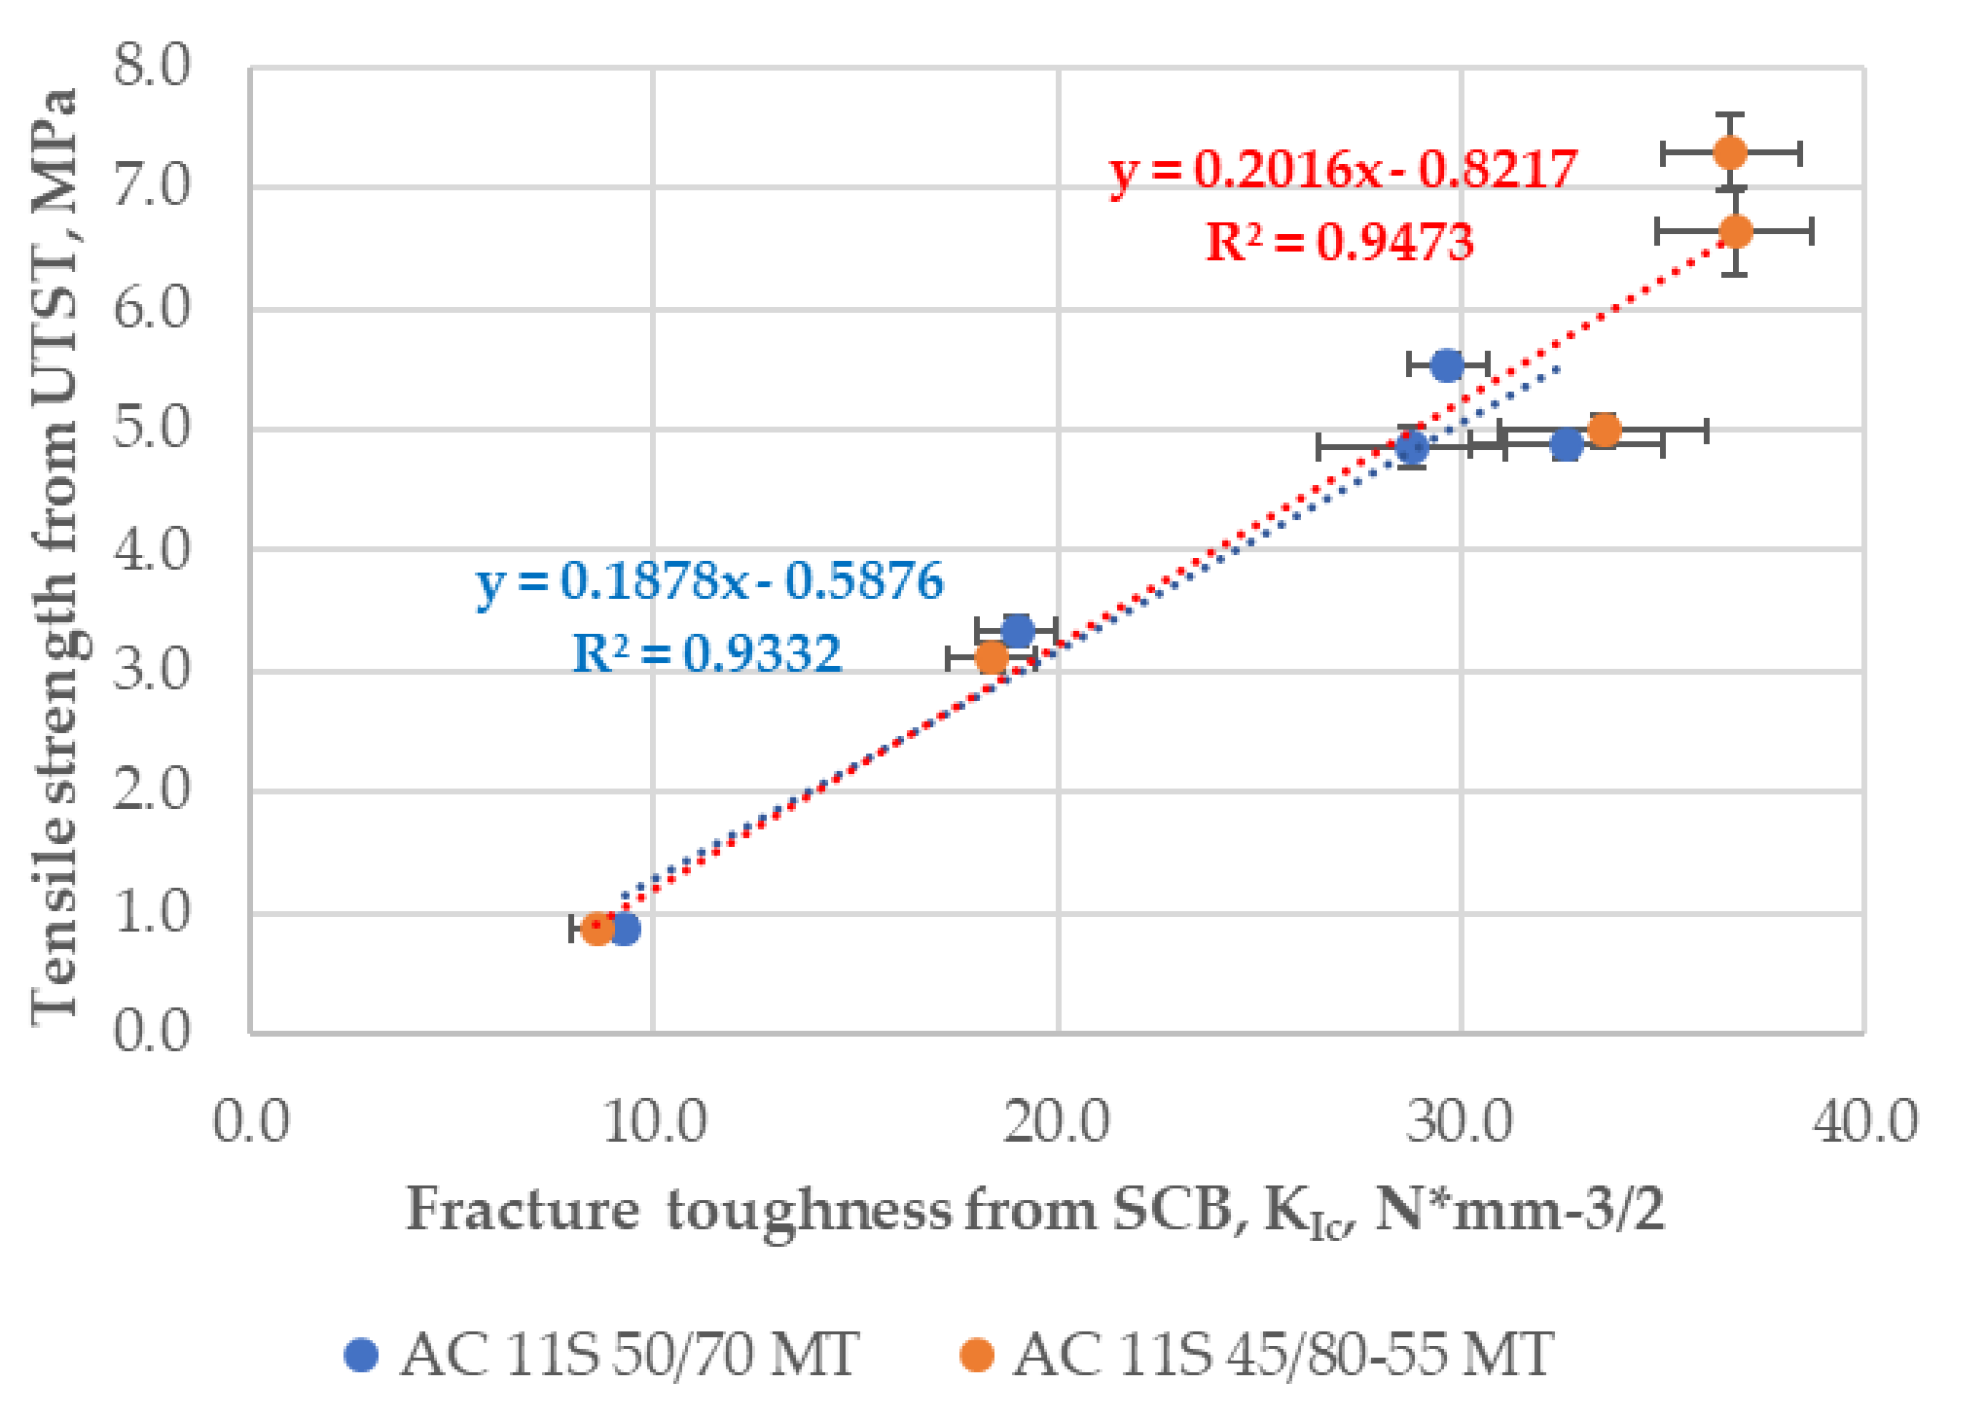
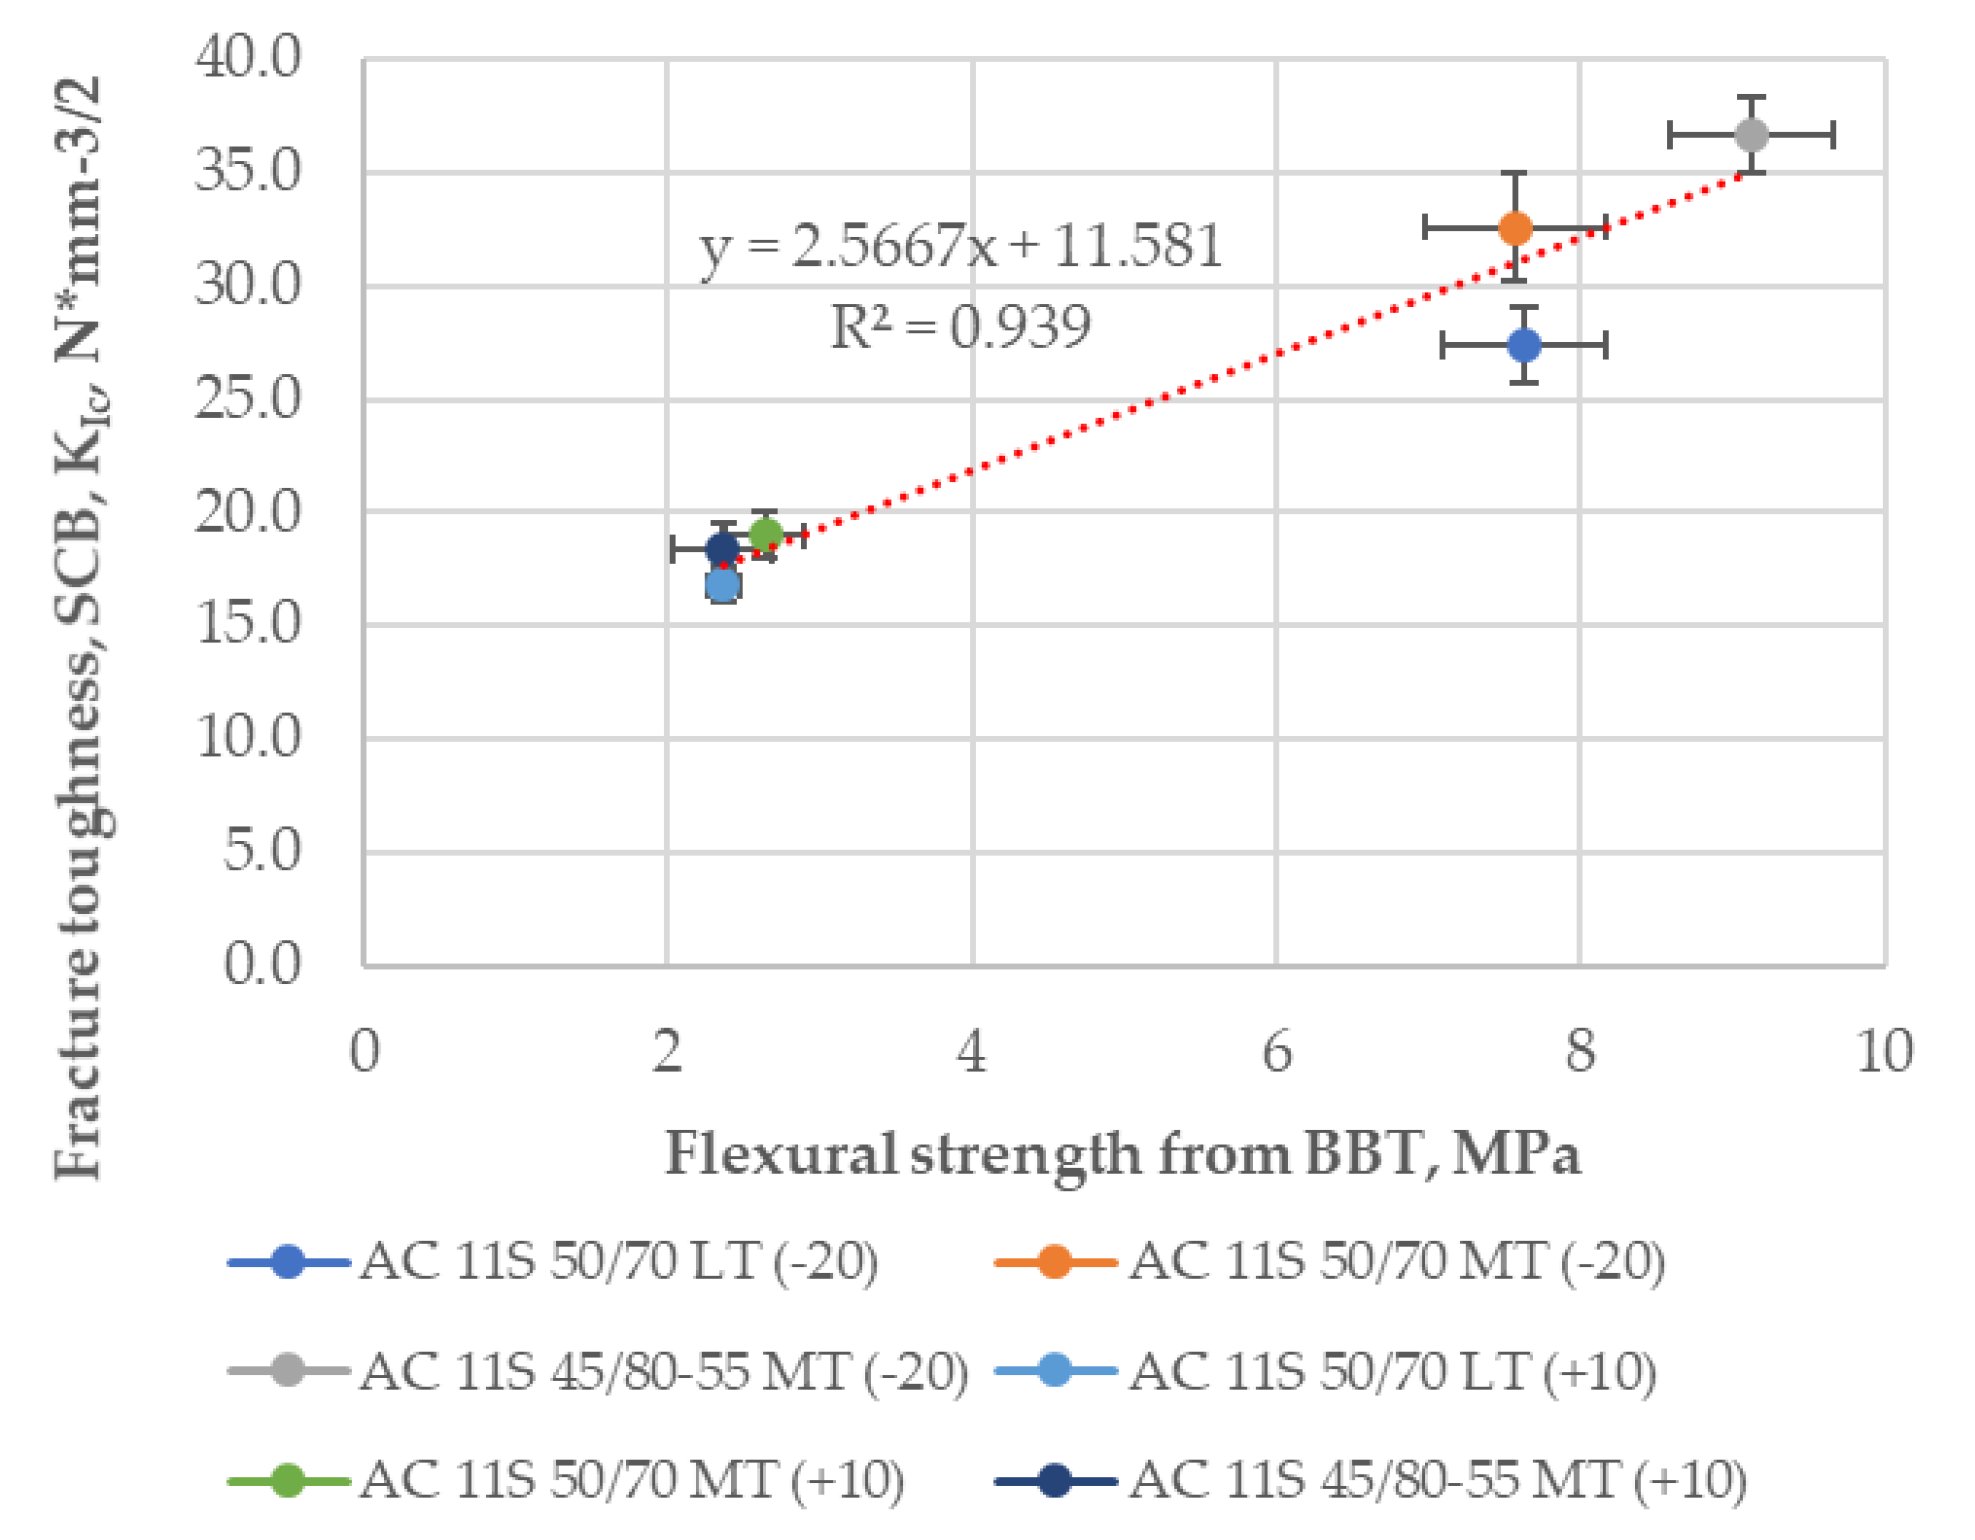
3.4. Correlations between Strength Results Obtained from Different Methods
4. Summary and Conclusions
- The type of bitumen is a factor of crucial importance in assessment of low-temperature properties of the tested asphalt mixtures. The results from the UTST show that a polymer-modified binder not only increased the tensile strength of the mixture, but also improved the peak value from about 5.5 MPa at −10 °C for asphalt mixtures with neat bitumens to over 7 MPa at a temperature of −20 °C for the asphalt mixture with SBS-modified bitumen.
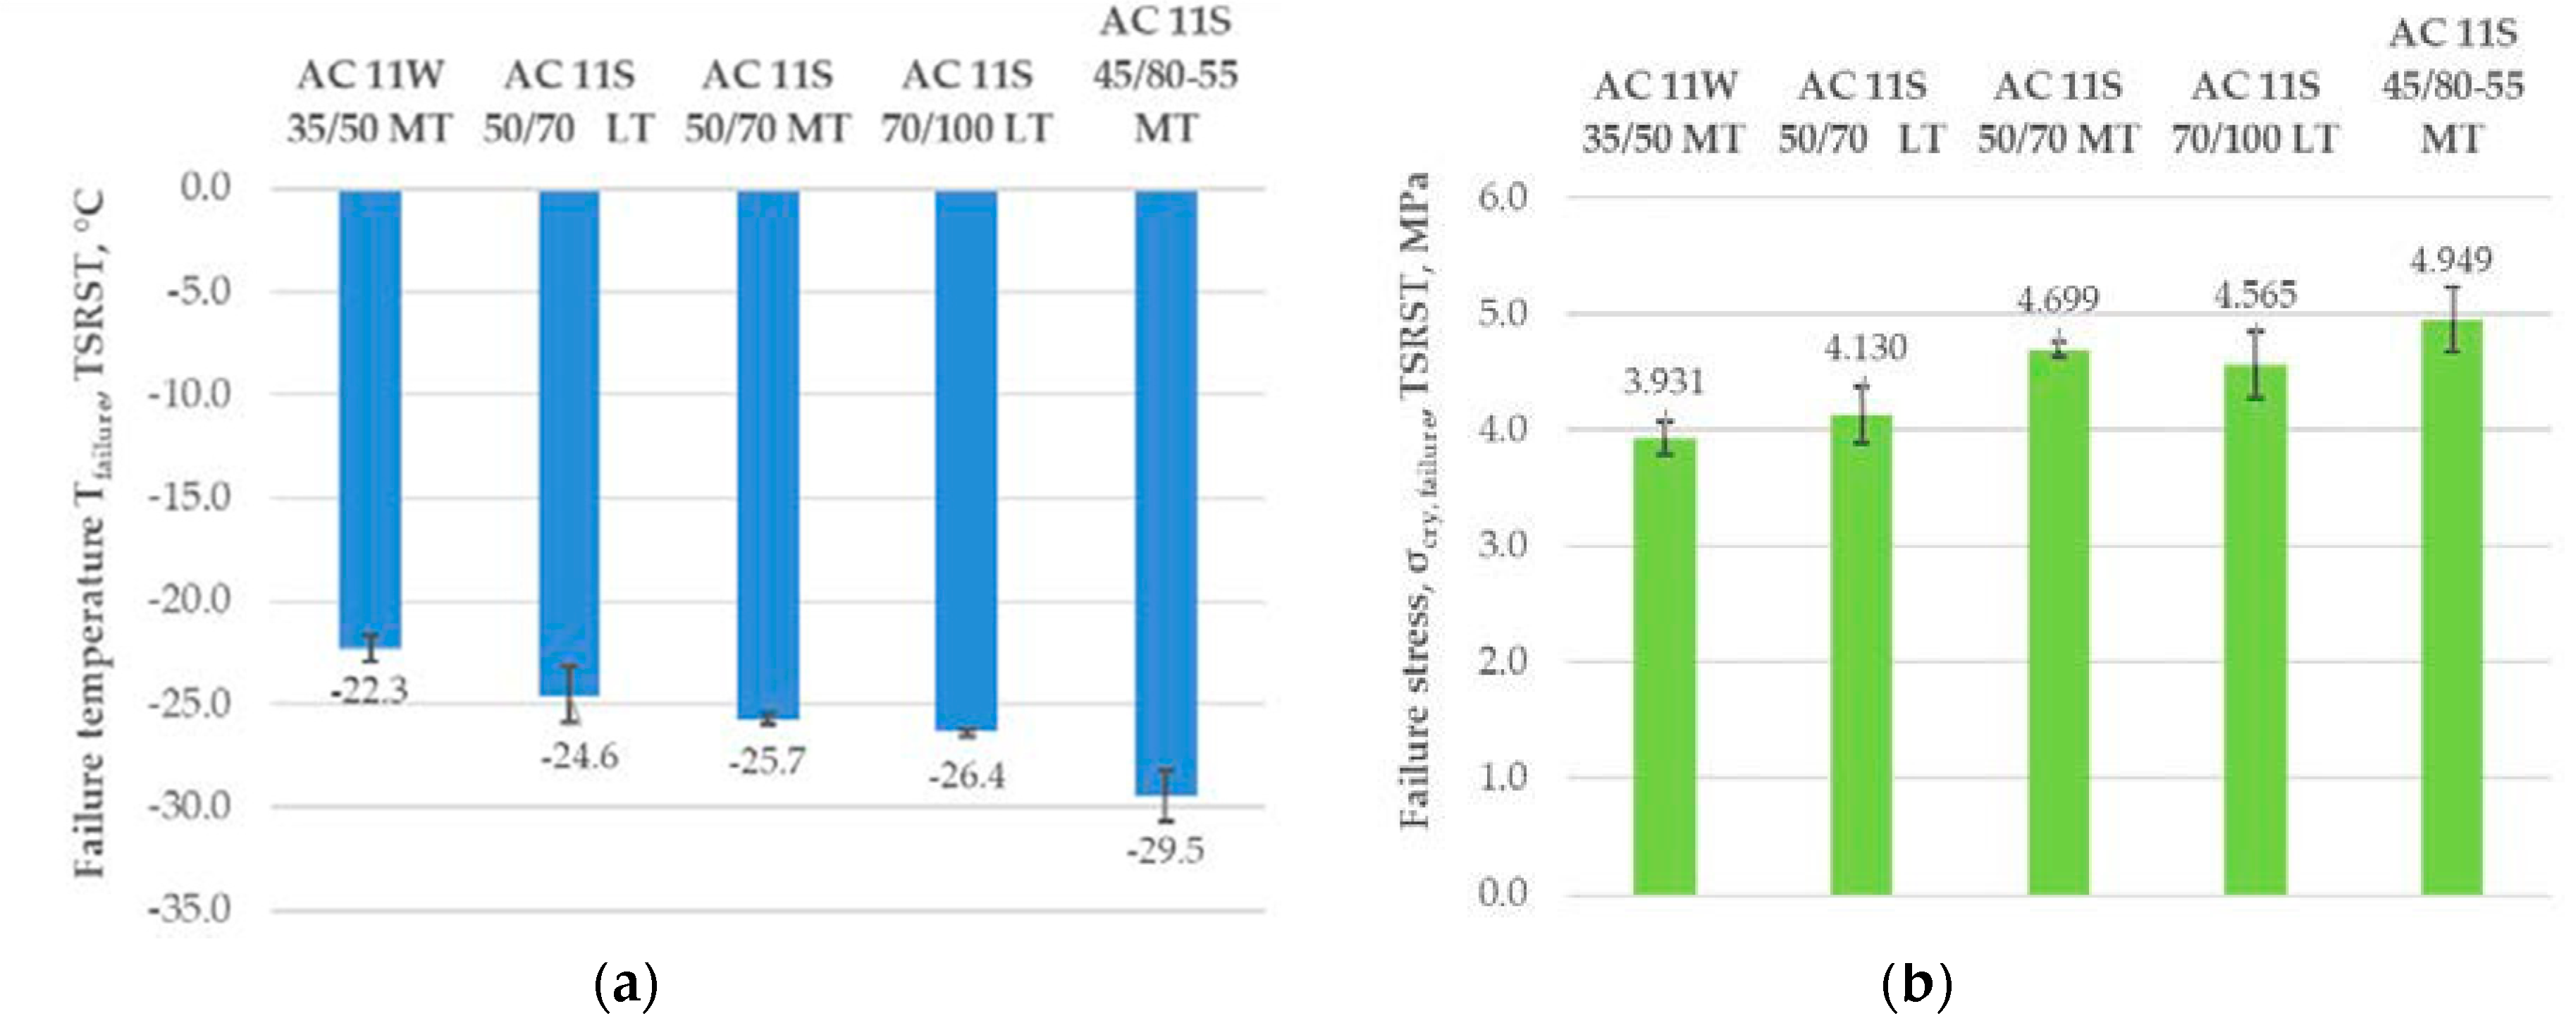
- The best low-temperature properties in the TSRST (the lowest value of failure temperature and the highest value of failure stress) were obtained for the asphalt concrete with SBS-modified bitumen 45/80–55. Other tests—the BBT and the SCB—also proved a better resistance of the asphalt mixture with SBS-modified bitumen to low-temperature cracking.
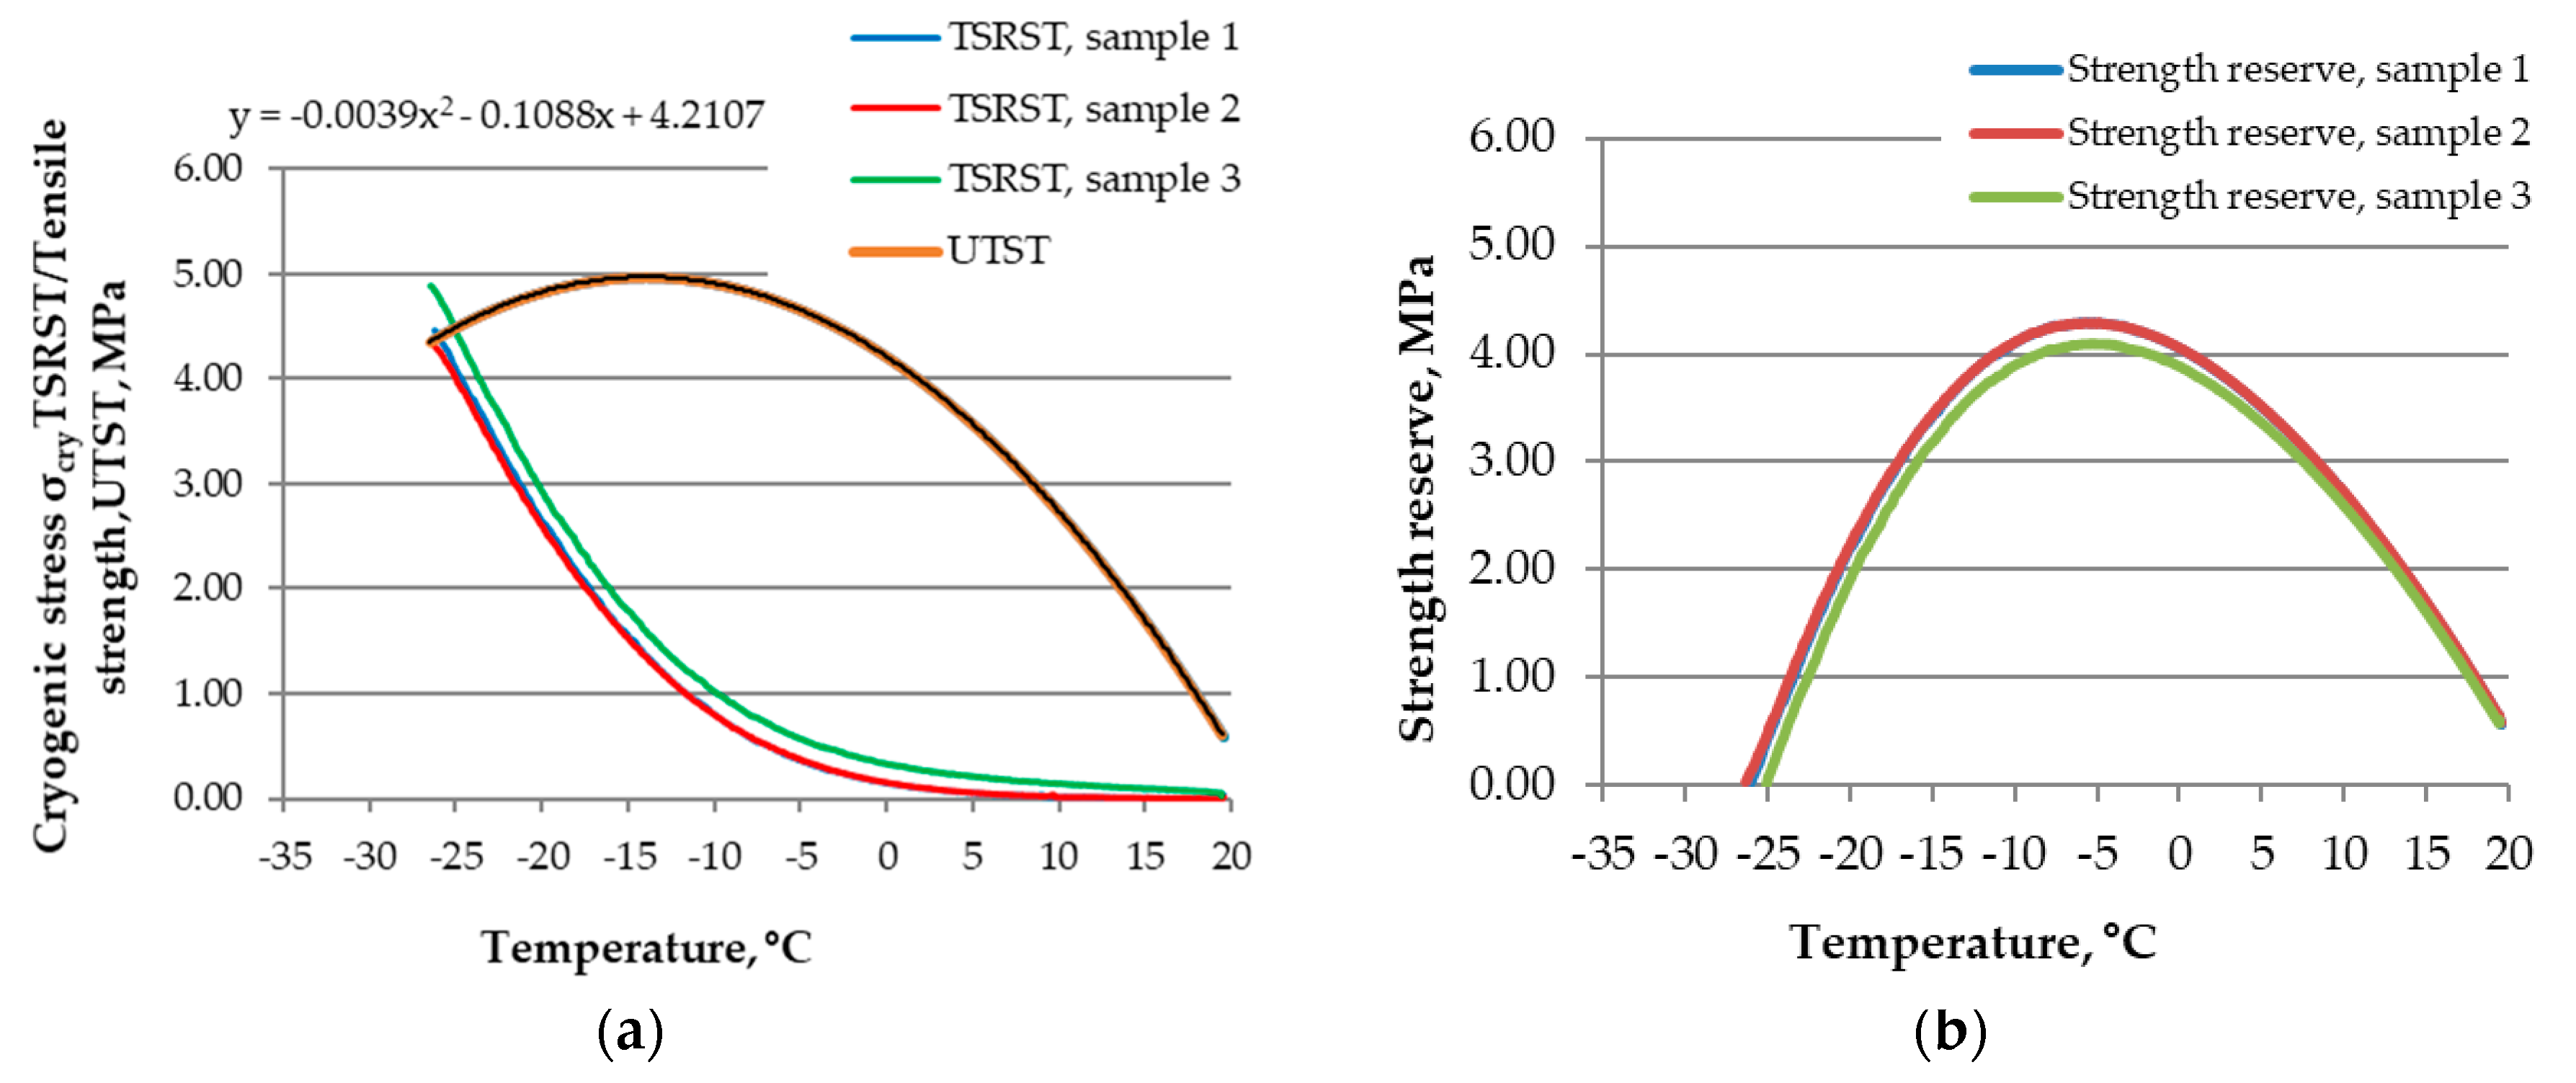
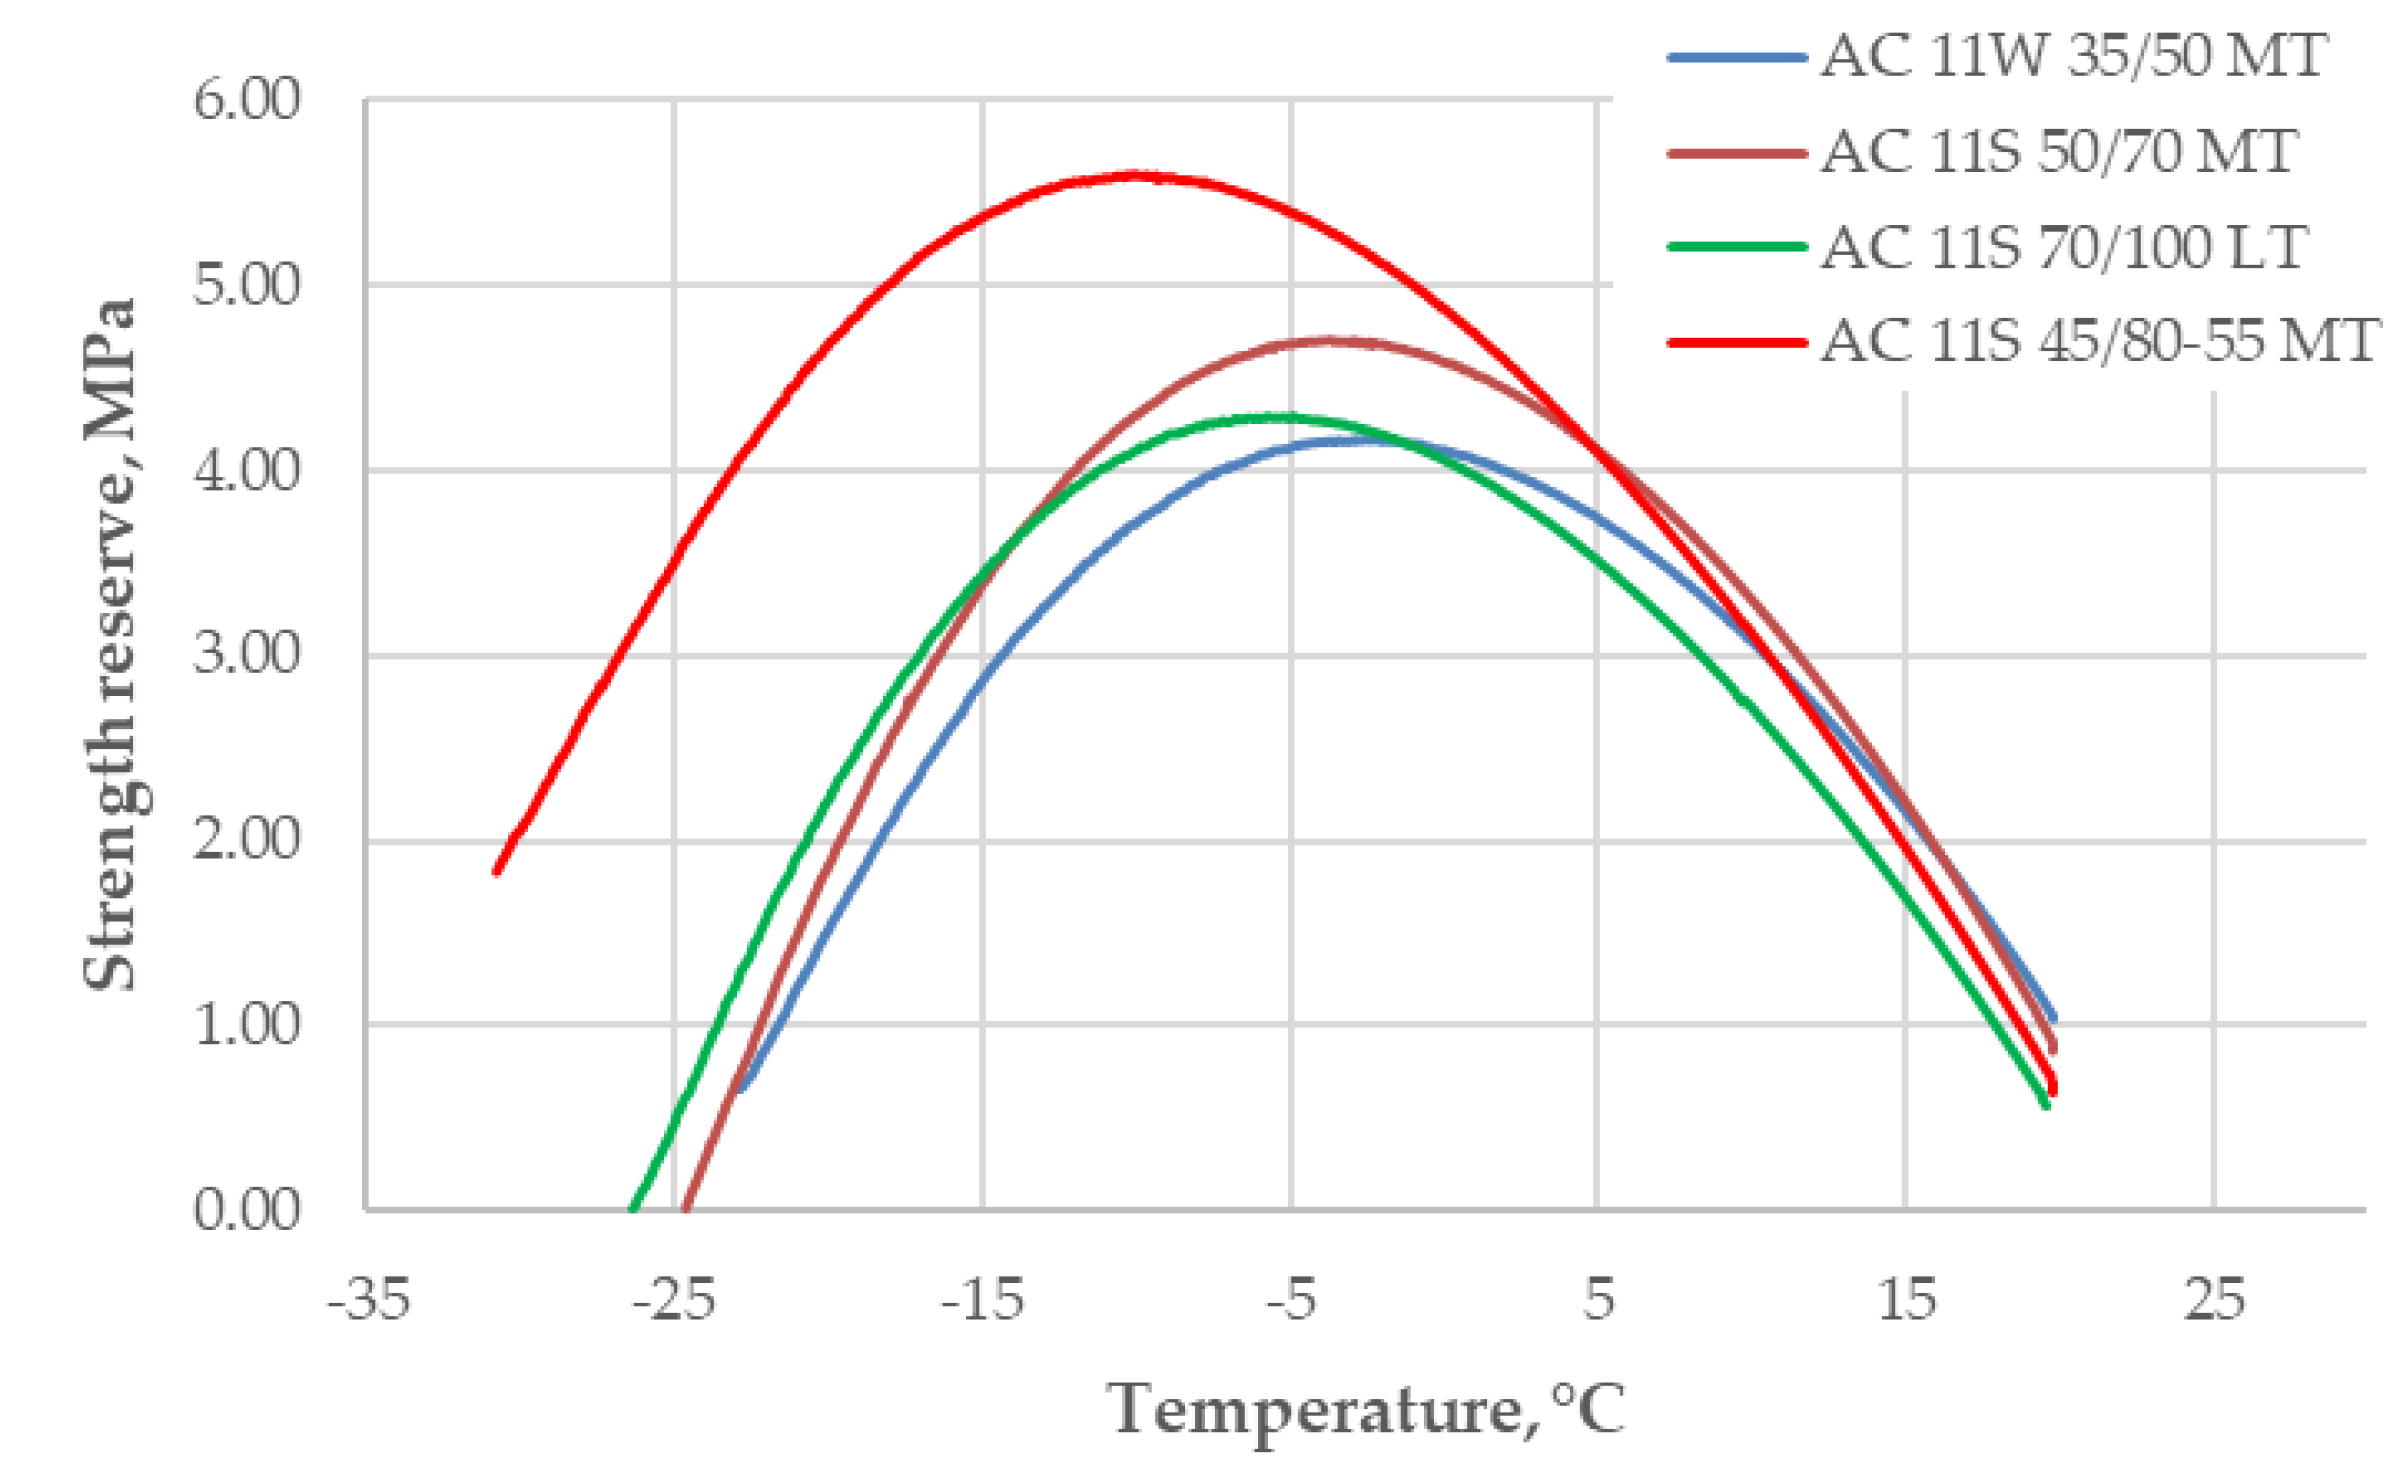
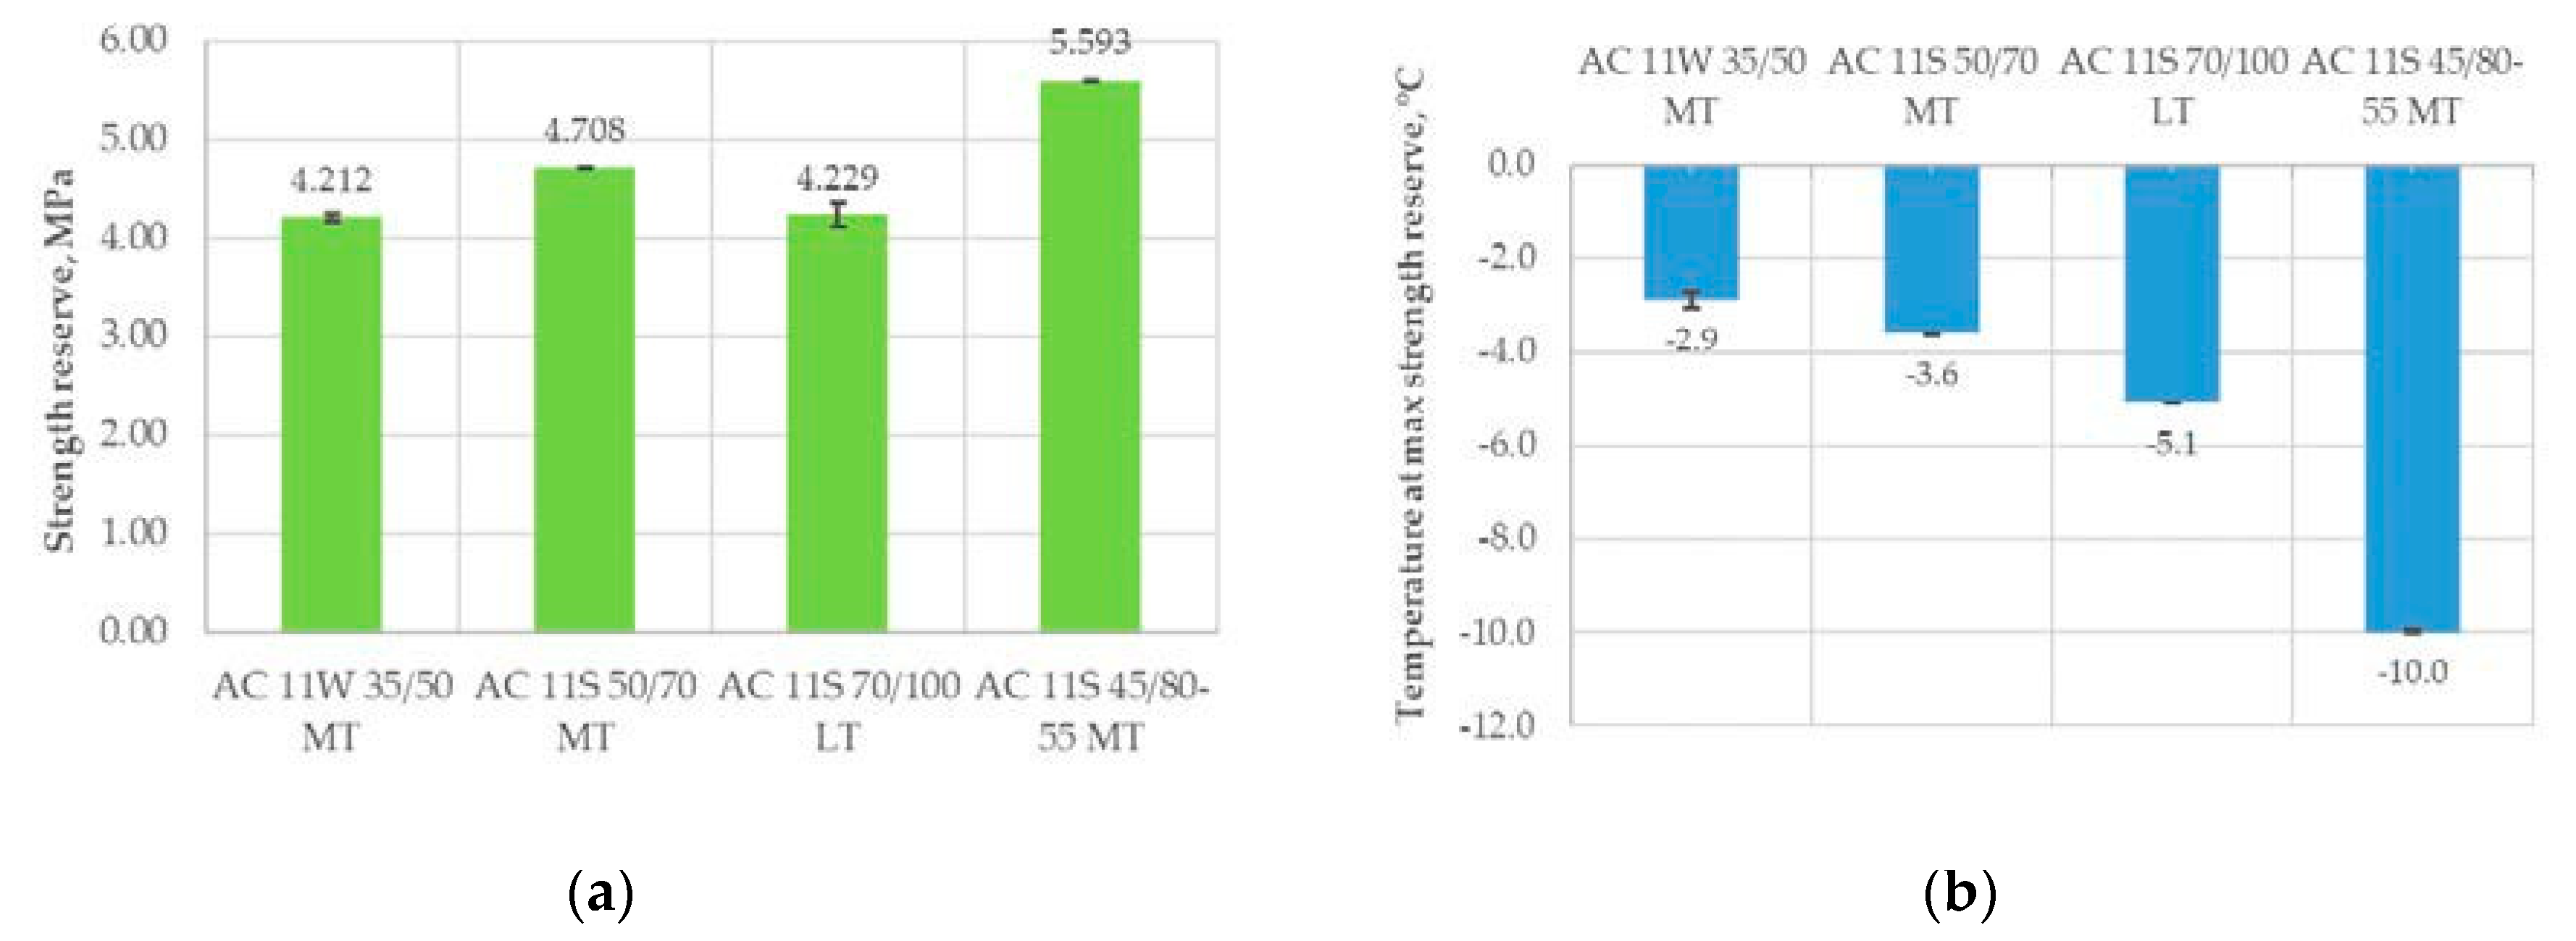
- The results of the strength reserve indicated that the best low-temperature properties were obtained for the asphalt mixture with SBS-polymer modified bitumen 45/80–55. The lowest values were obtained for the asphalt mixture with 35/50 neat bitumen.
- During the assessment of various asphalt mixture types, no important differences were observed between the TSRST results for the asphalt concrete designed for light traffic (LT) with a binder content of 5.8% by mass and for the asphalt concrete for medium traffic (MT) with a binder content of 5.6% by mass.
- The type of aggregate did influence the fracture toughness of the tested mixes. Asphalt concrete for low traffic with crushed gravel had a lower fracture toughness than the asphalt concrete for medium traffic with crushed gneiss.
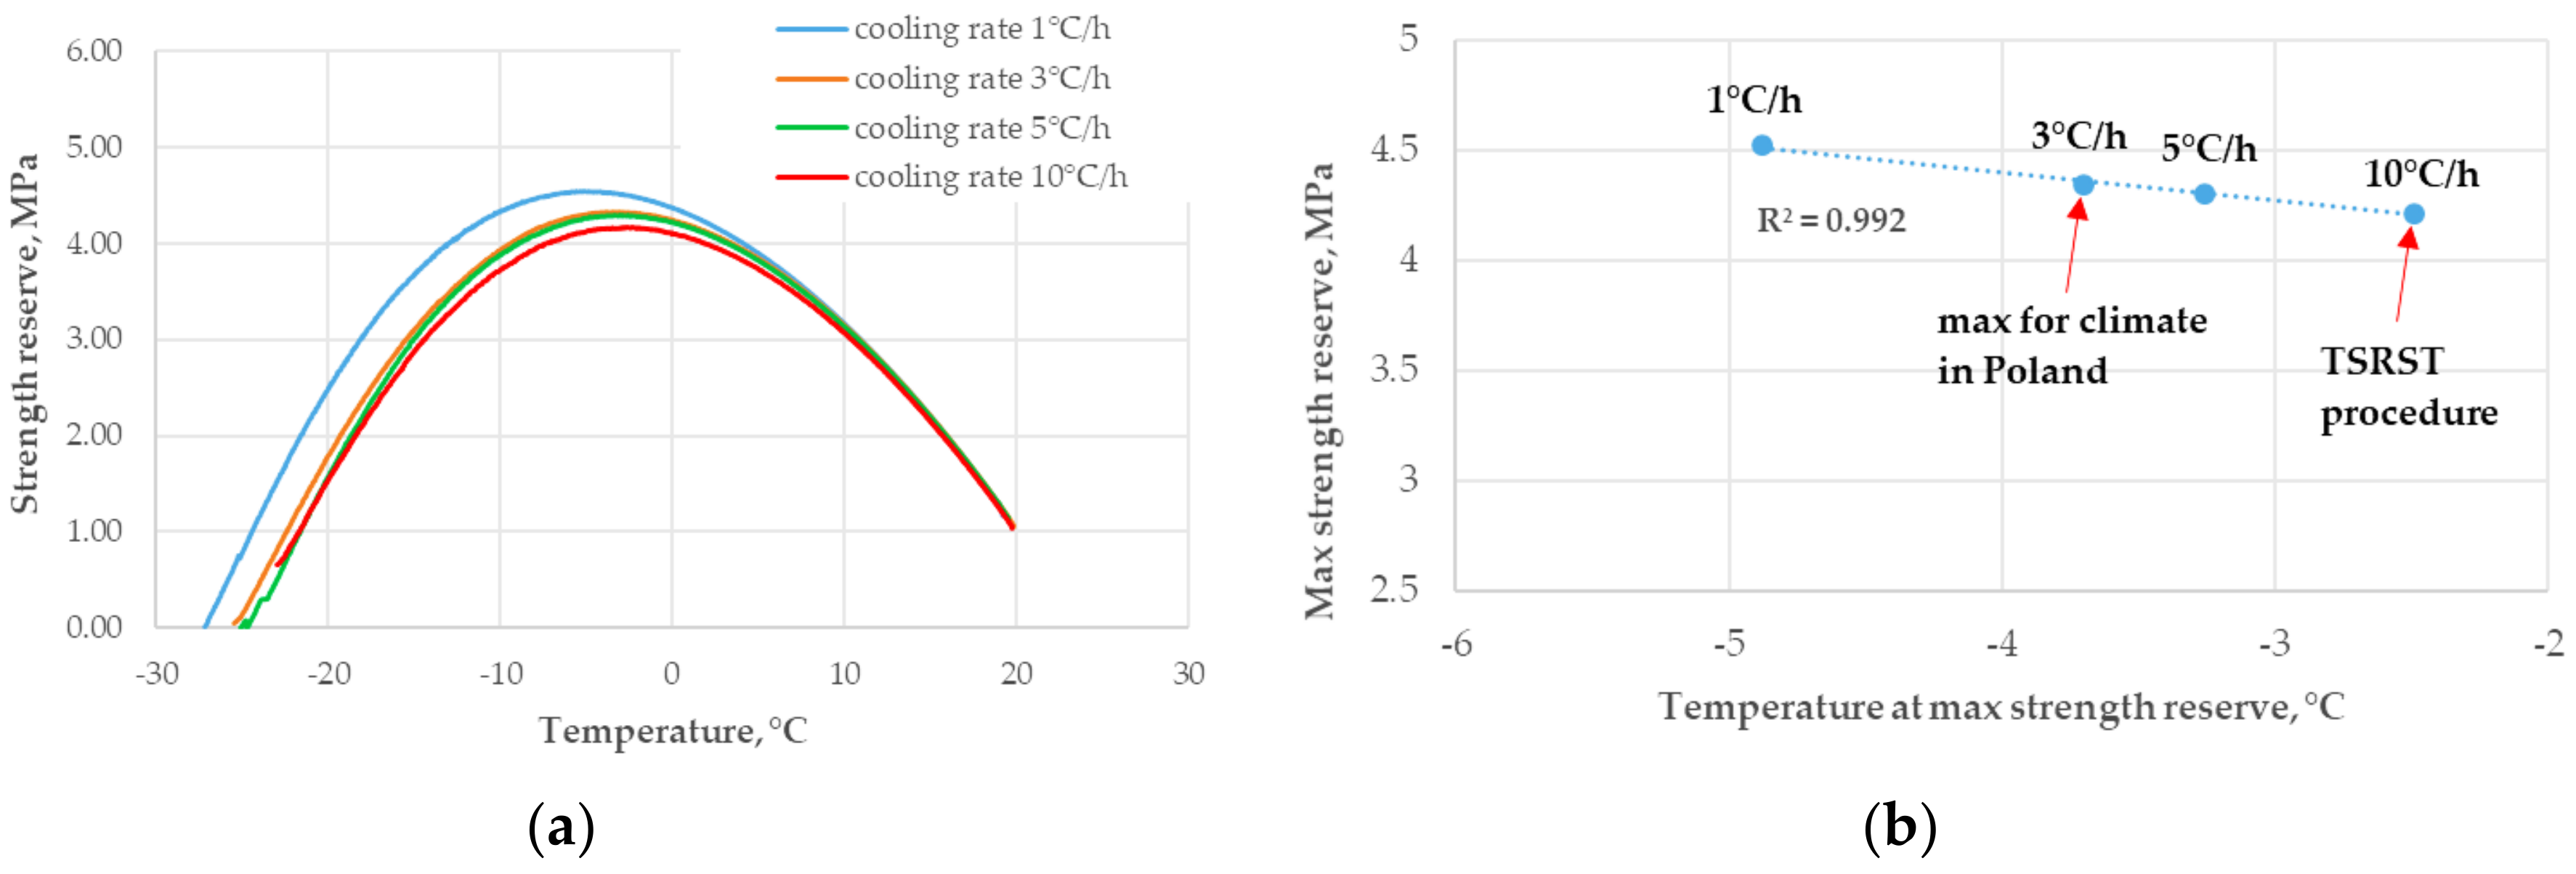
- After the cooling rate investigation, it was observed that the temperature at the maximum value of strength reserve for the cooling rate of 3 °C/h (that is the highest rate under real field conditions) was lower than for the cooling rate of 10 °C/h (which was used in the TSRST procedure).
- Analysis of correlation between strength results obtained from the UTST, BBT, and SCB indicates reasonably good correlations: 0.82 (UTST versus BBT), 0.94 (UTST versus SCB), and 0.94 (SCB versus BBT).
- The main limitation of the study was related to the methodology of test methods. The UTST and TSRST tests were conducted according to EN 12697-46 standard. In the UTST, the specimen was pulled with a constant strain rate at a constant temperature until failure. The influence of strain rate on tensile strength of asphalt mixtures at low temperatures will be the purpose of further research.
Author Contributions
Funding
Conflicts of Interest
References
- Stock, A.F.; Arand, W. Low temperature cracking in polymer modified binders. J. Assoc. Asph. Paving Technol. 1993, 62, 23–53. [Google Scholar]
- Burgers, B.A.; Kopvillem, O.; Young, F.D. Ste. Anne test—Relationships between predicted fracture temperatures and low temperature field performance. J. Assoc. Asph. Paving Technol. 1971, 40, 148–193. [Google Scholar]
- Marasteanu, M.; Zofka, A.; Turos, M.; Li, X.; Velasquez, R.; Li, X.; Buttlar, W.; Paulino, G.; Braham, A.; Dave, E.; et al. Investigation of Low Temperature Cracking in Asphalt Pavements; A Transportation Pooled Fund Study, Report No. MN/RC 2007-43; Minnesota Department of Transportation: Saint Paul, MN, USA, 2007. [Google Scholar]
- Marasteanu, M.; Buttlar, W.; Bahia, H.; Williams, C. Investigation of Low Temperature Cracking in Asphalt Pavements. National Pooled Fund Study—Phase II; Report No MN/RC 2012-23; Minnesota Department of Transportation: Saint Paul, MN, USA, 2012. [Google Scholar]
- Herb, W.; Velasquez, R.; Stefan, H.; Marasteanu, M.O.; Clyne, T. Simulation and characterization of asphalt pavement temperatures. Road Mater. Pavement Des. 2009, 10, 233–247. [Google Scholar] [CrossRef][Green Version]
- Rys, D.; Judycki, J.; Pszczola, M.; Jaczewski, M.; Melun, L. Comparison of low-temperature cracks intensity on pavements with high modulus asphalt concrete and conventional asphalt concrete bases. Constr. Build. Mater. 2017, 147, 478–487. [Google Scholar] [CrossRef]
- Pszczola, M.; Jaczewski, M.; Rys, D.; Jaskula, P.; Szydlowski, C. Evaluation of asphalt mixture low-temperature performance in bending beam creep test. Materials 2018, 11, 100. [Google Scholar] [CrossRef] [PubMed]
- Monismith, C.L.; Secor, G.A.; Secor, K.E. Temperature induced stresses and deformations in asphalt concrete. J. Assoc. Asph. Paving Technol. 1965, 34, 248–285. [Google Scholar]
- Jung, D.; Vinson, T.S. Low temperature cracking resistance of asphalt concrete mixtures. J. Assoc. Asph. Paving Technol. 1993, 62, 54–92. [Google Scholar]
- Pucci, T.; Dumont, A.G.; Di Benedetto, H. Thermomechanical and mechanical behaviour of asphalt mixtures at cold temperature: Road and laboratory investigations. Road Mater. Pavement Des. 2004, 5, 45–72. [Google Scholar] [CrossRef]
- CEN. EN 12697-46: Bituminous Mixtures—Test Methods for Hot Mix Asphalt—Part: 46: Low Temperature Cracking and Properties by Uniaxial Tension Tests; European Committee for Standardization CEN: Paris, France, 2012. [Google Scholar]
- Pszczoła, M.; Judycki, J. Comparison of calculated and measured thermal stresses in asphalt concrete. Baltic J. Road Bridge Eng. 2015, 10, 39–45. [Google Scholar] [CrossRef]
- Epps, A.L. A comparison of measured and predicted low temperature cracking conditions. J. Assoc. Asph. Paving Technol. 1998, 67, 277–296. [Google Scholar]
- Velasquez, R.; Labuz, J.F.; Marasteanu, M.O.; Zofka, A. Revising thermal stresses in the TSRST for low-temperature cracking prediction. J. Mater. Civ. Eng. 2009, 21, 680–687. [Google Scholar] [CrossRef]
- Bai, B.Q.; Anderson, K.O. An improved theoretical method for prediction of cracking temperatures in asphalt pavements. Proc. Can. Tech. Asph. Assoc. 1994, 39, 124–155. [Google Scholar]
- Steiner, D.; Hofko, B.; Dimitrov, M.; Blab, R. Impact of loading rate and temperature on tensile strength of asphalt mixtures at low temperatures. In Proceedings of the 8th RILEM International Conference on Mechanisms of Cracking and Debonding in Pavements, Nantes, France, 7–9 June 2016; pp. 69–74. [Google Scholar] [CrossRef]
- Blab, R.; Hofko, B. Performace-based hot asphalt mix and flexible pavement design—The European perspective. In Proceedings of the 1st IRF Asia Regional Congress, Bali, Indonesia, 17–19 November 2014. [Google Scholar]
- Gramuller, H.-K.; Plachkova-Dzhurova, P.; Hase, M.; Roos, R.; Worner, T. Additional knowledge of low temperature behavior of asphalt characterized by maximum indirect tensile strength reserve. In Proceedings of the 6th Eurasphalt & Eurobitume Congress, Prague, Czech Republic, 1–3 June 2016. [Google Scholar]
- Buttlar, W.G.; Roque, R. Development and evaluation of the strategic highway research program measurement and analysis system for indirect tensile testing at low temperatures. Transp. Res. Rec. 1994, 1454, 163–171. [Google Scholar]
- Teltayev, B.; Radovskiy, B. Predicting thermal cracking of asphalt pavements from bitumen and mix properties. Road Mater. Pavement Des. 2017. [Google Scholar] [CrossRef]
- Falchetto, A.C.; Marasteanu, M.O.; Balmurugan, S.; Negulescu, I.I. Investigation of asphalt mixture strength at low temperatures with the bending beam rheometer. Road Mater. Pavement Des. 2014, 15 (Suppl. 1), 28–44. [Google Scholar] [CrossRef]
- Marasteanu, M.; Ghosh, D.; Falchetto, A.C.; Turos, M. Testing protocol to obtain failure properties of asphalt binders at low temperature using creep compliance and stress-controlled strength test. Road Mater. Pavement Des. 2017, 18 (Suppl. 2), 352–367. [Google Scholar] [CrossRef]
- Velásquez, R.; Zofka, A.; Turos, M.; Marasteanu, M. Bending beam rheometer testing of asphalt mixtures. Int. J. Pavement Eng. 2011, 12, 461–474. [Google Scholar] [CrossRef]
- Falchetto, A.C.; Moon, K.H.; Wistuba, M.P. Development of a simple correlation between bending beam rheometer and thermal stress restrained specimen test low-temperature properties based on a simplified size effect approach. Road Mater. Pavement Des. 2017, 18, 339–351. [Google Scholar] [CrossRef]
- Judycki, J. Bending Test of asphaltic mixtures under statical loading. In Proceedings of the 4th International Symposium on the Role of Mechanical Tests for the Characterization, Budapest, Hungary, 23–25 October 1990; pp. 207–227. [Google Scholar]
- Zhou, F.; Newcomb, D.; Gurganus, C.; Banihashemrad, S.; Park, E.S.; Sakhaeifar, M.; Lytton, R.L. Experimental design for field validation of laboratory tests to assess cracking resistance of asphalt mixtures: An experimental design. Transp. Res. Board 2016, 399, 1–25. [Google Scholar]
- Mandal, T.; Bahia, H. Measuring cracking propagation of asphalt mixtures using notched samples in the TSRST. In Proceedings of the Sixth-Second Annual Conference of the Canadian Technical Asphalt Association (CTAA), Halifax, Nova Scotia, 12–15 November 2017. [Google Scholar]
- Szydłowski, C.; Górski, J.; Stienss, M.; Smakosz, Ł. Numerical simulation of asphalt mixtures fracture using continuum models, Computer Methods. In Proceedings of the 22nd International Conference on Computer Methods in Mechanics, Bern, Switzerland, 20–22 December 2018. [Google Scholar]
- Zhu, Y.; Dave, E.V.; Rahbar-Rastegar, R.; Daniel, J.S.; Zofka, A. Comprehensive evaluation of low-temperature fracture indices for asphalt mixtures. Road Mater. Pavement Des. 2017, 18, 467–490. [Google Scholar] [CrossRef]
- Polish Technical Guidelines WT-2 2014. The General Directorate for National Roads and Motorways; FAO: Rome, Italy, 2014. [Google Scholar]
- Szymanski, D. Assessment of the Low-Temperature Properties of Asphalt Mixtures Based on the TSRST, UTST and TCT Test Results. Master’s Thesis, Gdansk University of Technology, Gdańsk, Poland, 2018. (In Polish). [Google Scholar]
- Judycki, J.; Cyske, W.; Pszczola, M. Strength and stiffness at low temperature of asphalt concrete of increased resistance to rutting (in Polish). In Proceedings of the VII International Conference, Durable and Safe Pavement Structures, Kielce, Poland, 8–9 May 2001; pp. 83–90. [Google Scholar]
- Jaczewski, M.; Judycki, J.; Jaskuła, P. Low-temperature properties of high modulus asphalt concrete (AC-WMS) in three point bending test (in Polish). J. Civ. Eng. Environ. Arch. 2016, 33, 217–224. [Google Scholar] [CrossRef][Green Version]
- CEN. EN 12697-44: 2010 Bituminous Mixtures—Test Methods for Hot Mix Asphalt—Part 44: Crack Propagation by Semi-Circular Bending Test; European Committee for Standardization CEN: Paris, France, 2010. [Google Scholar]
- Arabani, M.; Ferdowsi, B. Evaluating the semi-circular bending test for HMA mixtures. Int. J. Eng. 2009, 22, 47–58. [Google Scholar]
- Artamendi, I.; Khalid, H.A. A comparison between beam and semi-circular bending fracture tests for asphalt. Road Mater. Pavement Des. 2011, 7, 163–180. [Google Scholar] [CrossRef]
- Birgisson, B.; Montepara, A.; Romeo, E.; Roque, R.; Tebaldi, G. Influence of mixture properties on fracture mechanisms in asphalt mixtures. Road Mater. Pavement Des. 2010, 11, 61–88. [Google Scholar] [CrossRef]
- Nsengiyumva, G.; You, T.; Kim, Y.-R. Experimental-statistical investigation of testing variables of a semicircular bending (SCB) fracture test repeatability for bituminous mixtures. J. Test. Eval. 2017, 45, 1–11. [Google Scholar] [CrossRef]
- Dave, E.V.; Buttlar, W.G. Low temperature cracking prediction with consideration of temperature dependent bulk and fracture properties. Road Mater. Pavement Des. 2010, 11, 33–59. [Google Scholar] [CrossRef]
- Pszczola, M.; Szydlowski, C.; Jaczewski, M. Influence of cooling rate and additives on low-temperature properties of asphalt mixtures in the TSRST. Constr. Build. Mater. 2018, in press. [Google Scholar]
- Apeagyei, A.K.; Dave, E.V.; Buttlar, W.G. Effect of cooling rate on thermal cracking asphalt concrete pavements. J. Assoc. Asph. Paving Technol. 2008, 77, 709–738. [Google Scholar]
- Alavi, M.Z.; Hajj, E.Y. Effect of cooling rate on the thermo-volumetric, thermo-viscoelastic, and fracture properties of asphalt mixtures. In Proceedings of the International Conference on Asphalt Pavements, Columbus, OH, USA, 30–31 October 2014; pp. 405–416. [Google Scholar]
- Pszczoła, M.; Judycki, J.; Ryś, D. Evaluation of pavement temperatures in Poland during winter conditions. Transp. Res. Procedia 2016, 14, 738–747. [Google Scholar] [CrossRef]


| Property | Type of Bitumen | ||||
|---|---|---|---|---|---|
| 35/50 | 50/70 | 70/100 | 45/80–55 | ||
| Penetration at 25 °C, 0.1 mm, acc. to PN-EN 1426 | Original | 45 | 54 | 81 | 60 |
| RTFOT * | 28 | 40 | 48 | 40 | |
| R&B Temperature, °C, acc. to PN-EN 1427 | Original | 53.0 | 50.8 | 47.8 | 68.6 |
| RTFOT | 57.8 | 57.8 | 53.4 | 67.4 | |
| Performance Grade, acc. to AASHTO M 320 | 70–16 | 64–22 | 58–22 | 70–22 | |
| Fraass Breaking Point Temperature, °C, acc. to PN-EN 12593 | Original | −6 | −14 | −16 | −16 |
| RTFOT | −3 | −12 | −10 | −15 | |
| Property | Types of Mixtures | ||
|---|---|---|---|
| Asphalt mixture | AC 11 S KR1 ÷ 2 | AC 11 S KR3 ÷ 4 | AC 11 W KR3 ÷ 4 |
| Type of layer | wearing course | wearing course | binder course |
| Type of traffic | low traffic (LT) | medium traffic (MT) | medium traffic (MT) |
| Bitumen type | 50/70 | 50/70 | 35/50 |
| 70/100 | 45/80–55 | ||
| Binder content (% by mass) | 5.8 | 5.6 | 5.6 |
| Aggregate type | crushed gravel | crushed gneiss/granite | crushed gneiss |
| Filler type | limestone | limestone | limestone |
| Sieve size (mm) | % Passing (by mass) | ||
| 16 | 100 | 100 | 100 |
| 11.2 | 97 | 98 | 98 |
| 8 | 83 | 77 | 83 |
| 5.6 | 71 | 62 | 65 |
| 4 | 60 | 52 | 54 |
| 2 | 40 | 39 | 43 |
| 0.125 | 11 | 11 | 12 |
| 0.063 | 8 | 7.2 | 7.4 |
| Asphalt Mixture and Bitumen Type | UTST | TSRST | BBM | SCB |
|---|---|---|---|---|
| AC 11S 70/100 LT | X | X | X | - |
| AC 11S 50/70 LT | - | X | X | X |
| AC 11S 50/70 MT | X | X | X | X |
| AC 11S 45/80/55 MT | X | X | X | X |
| AC 11W 35/50 MT | X | X | X | - |
| Asphalt Mixture and Bitumen Type | Tensile Strength βt, MPa | |||||
|---|---|---|---|---|---|---|
| −30 °C | −20 °C | −10 °C | +5 °C | +20 °C | ||
| AC 11W 35/50 MT | mean value | not tested | 4.773 | 5.277 | 3.815 | 1.080 |
| st. deviation | 0.312 | 0.022 | 0.064 | 0.049 | ||
| CV, % | 6.5 | 0.4 | 1.7 | 4.5 | ||
| AC 11S 50/70 MT | mean value | not tested | 4.881 | 5.538 | 4.097 | 0.871 |
| st. deviation | 0.120 | 0.098 | 0.162 | 0.075 | ||
| CV, % | 2.5 | 1.8 | 3.9 | 8.6 | ||
| AC 11S 70/100 LT | mean value | not tested | 4.675 | 5.290 | 3.269 | 0.589 |
| st. deviation | 0.122 | 0.152 | 0.030 | 0.043 | ||
| CV, % | 2.6 | 2.9 | 0.91 | 7.2 | ||
| AC 11S 45/80–55 MT | mean value | 6.747 | 7.292 | 6.642 | 3.457 | 0.868 |
| st. deviation | 0.154 | 0.316 | 0.367 | 0.135 | 0.033 | |
| CV, % | 2.3 | 4.3 | 5.5 | 3.9 | 3.8 | |
| Asphalt Mixture and Bitumen Type | Flexural Strength, MPa | Flexural Failure Strain, ‰ | |||
|---|---|---|---|---|---|
| −20 °C | +10 °C | −20 °C | +10 °C | ||
| AC 11W 35/50 MT | mean value | 8.01 | 3.27 | 0.91 | 9.13 |
| st. deviation | 1.24 | 0.27 | 0.09 | 0.73 | |
| CV, % | 15.5 | 8.4 | 9.8 | 8.0 | |
| AC 11S 50/70 MT | mean value | 7.57 | 2.64 | 0.89 | 13.12 |
| st. deviation | 0.59 | 0.26 | 0.21 | 2.12 | |
| CV, % | 7.9 | 10.0 | 24.1 | 16.2 | |
| AC 11S 70/100 LT | mean value | 7.35 | 1.74 | 0.88 | 22.07 |
| st. deviation | 0.81 | 0.41 | 0.14 | 6.23 | |
| CV, % | 11.0 | 23.4 | 16.0 | 28.2 | |
| AC 11S 45/80–55 MT | mean value | 9.13 | 2.37 | 1.19 | 30.40 |
| st. deviation | 0.54 | 0.33 | 0.21 | 5.60 | |
| CV, % | 5.9 | 13.7 | 17.8 | 18.4 | |
| Asphalt Mixture and Bitumen Type | Fracture Toughness KIC, N·mm−3/2 | |||||
|---|---|---|---|---|---|---|
| −20 °C | −10 °C | 0 °C | +10 °C | +20 °C | ||
| AC 11S 50/70 LT | mean value | 27.4 | 26.1 | 29.4 | 16.8 | 8.1 |
| st. deviation | 1.7 | 1.3 | 0.6 | 0.8 | 0.4 | |
| CV, % | 6.4 | 4.9 | 2.8 | 4.9 | 4.5 | |
| AC 11S 50/70 MT | mean value | 32.6 | 29.7 | 28.8 | 19.0 | 9.3 |
| st. deviation | 2.4 | 1.0 | 2.3 | 1.0 | 0.2 | |
| CV, % | 7.4 | 3.4 | 8.1 | 5.4 | 2.0 | |
| AC 11S 45/80–55 MT | mean value | 36.7 | 36.8 | 33.5 | 18.4 | 8.6 |
| st. deviation | 1.7 | 1.9 | 2.6 | 1.1 | 0.6 | |
| CV, % | 4.5 | 5.2 | 7.7 | 5.7 | 6.8 | |
© 2018 by the authors. Licensee MDPI, Basel, Switzerland. This article is an open access article distributed under the terms and conditions of the Creative Commons Attribution (CC BY) license (http://creativecommons.org/licenses/by/4.0/).
Share and Cite
Pszczola, M.; Szydlowski, C. Influence of Bitumen Type and Asphalt Mixture Composition on Low-Temperature Strength Properties According to Various Test Methods. Materials 2018, 11, 2118. https://doi.org/10.3390/ma11112118
Pszczola M, Szydlowski C. Influence of Bitumen Type and Asphalt Mixture Composition on Low-Temperature Strength Properties According to Various Test Methods. Materials. 2018; 11(11):2118. https://doi.org/10.3390/ma11112118
Chicago/Turabian StylePszczola, Marek, and Cezary Szydlowski. 2018. "Influence of Bitumen Type and Asphalt Mixture Composition on Low-Temperature Strength Properties According to Various Test Methods" Materials 11, no. 11: 2118. https://doi.org/10.3390/ma11112118
APA StylePszczola, M., & Szydlowski, C. (2018). Influence of Bitumen Type and Asphalt Mixture Composition on Low-Temperature Strength Properties According to Various Test Methods. Materials, 11(11), 2118. https://doi.org/10.3390/ma11112118