Impact of TiO2 Nanotubes’ Morphology on the Photocatalytic Degradation of Simazine Pollutant


 ,
,
Abstract
1. Introduction
2. Methodology
2.1. Materials and Catalyst Preparation Method
2.2. Catalyst Characterizations
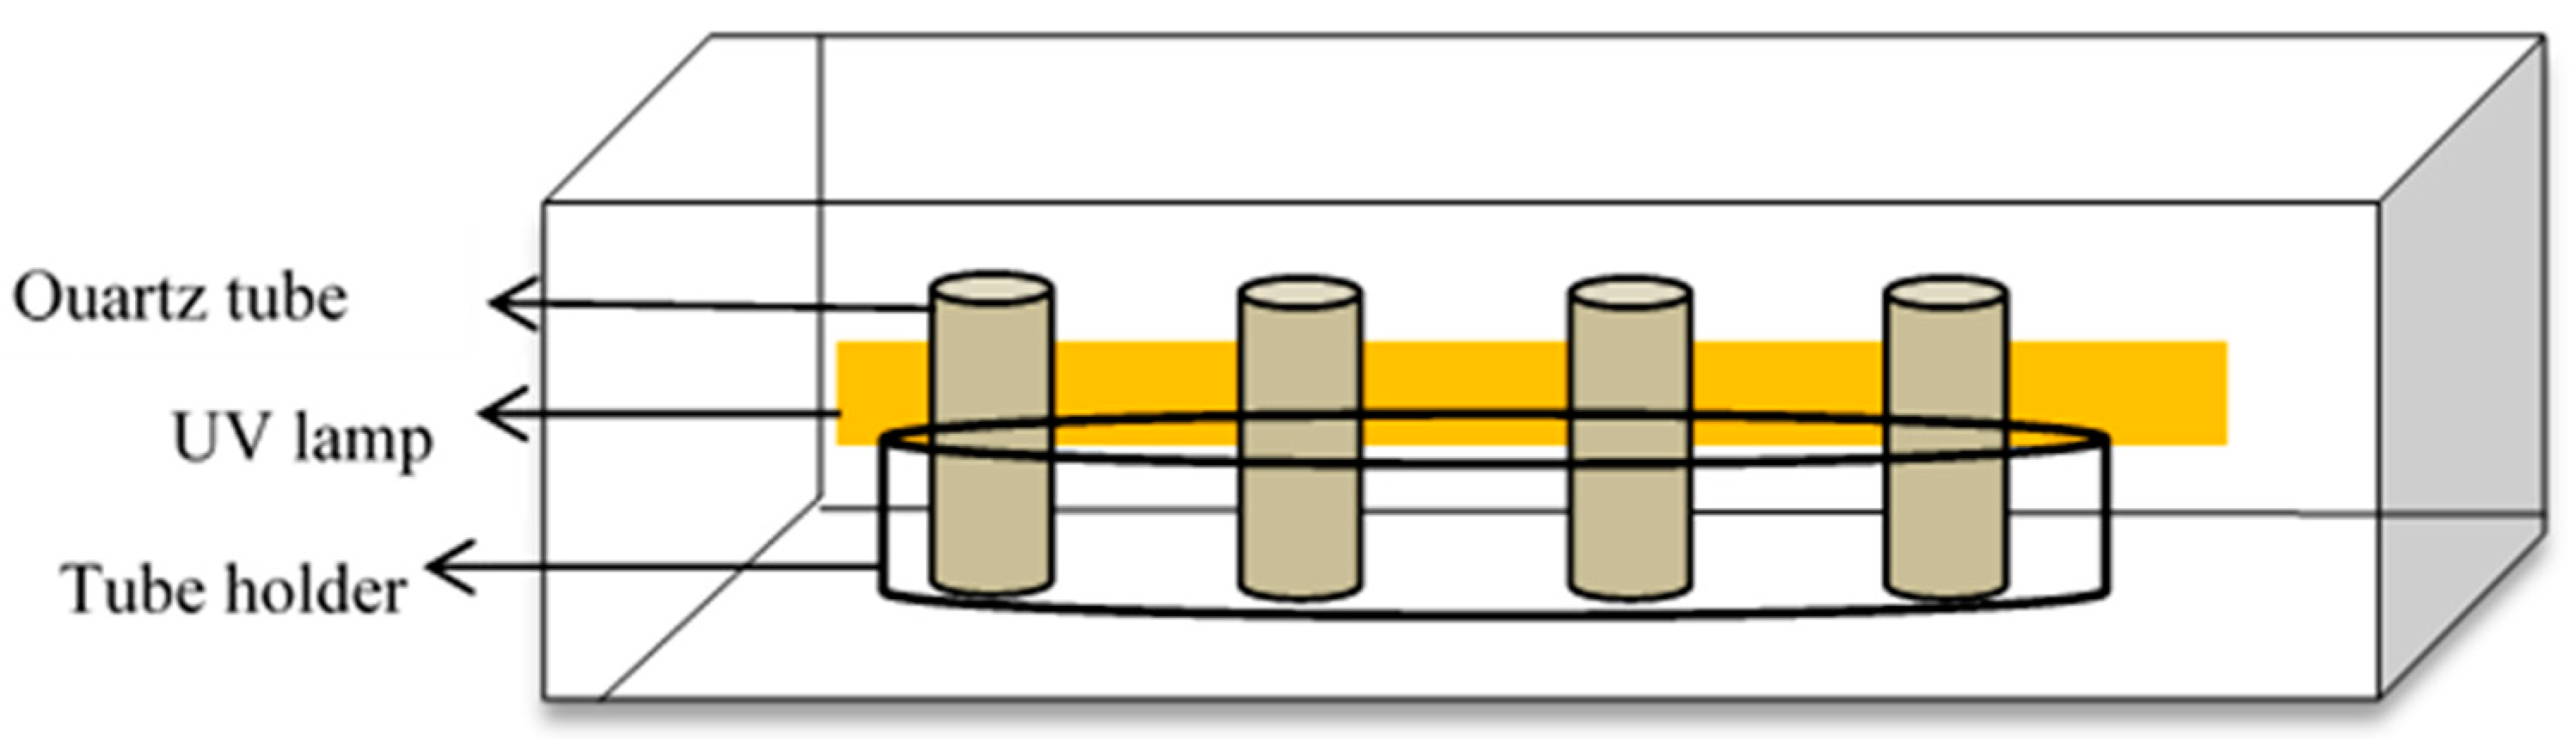
2.3. Photocatalytic Activity Evaluation
3. Results and Discussion
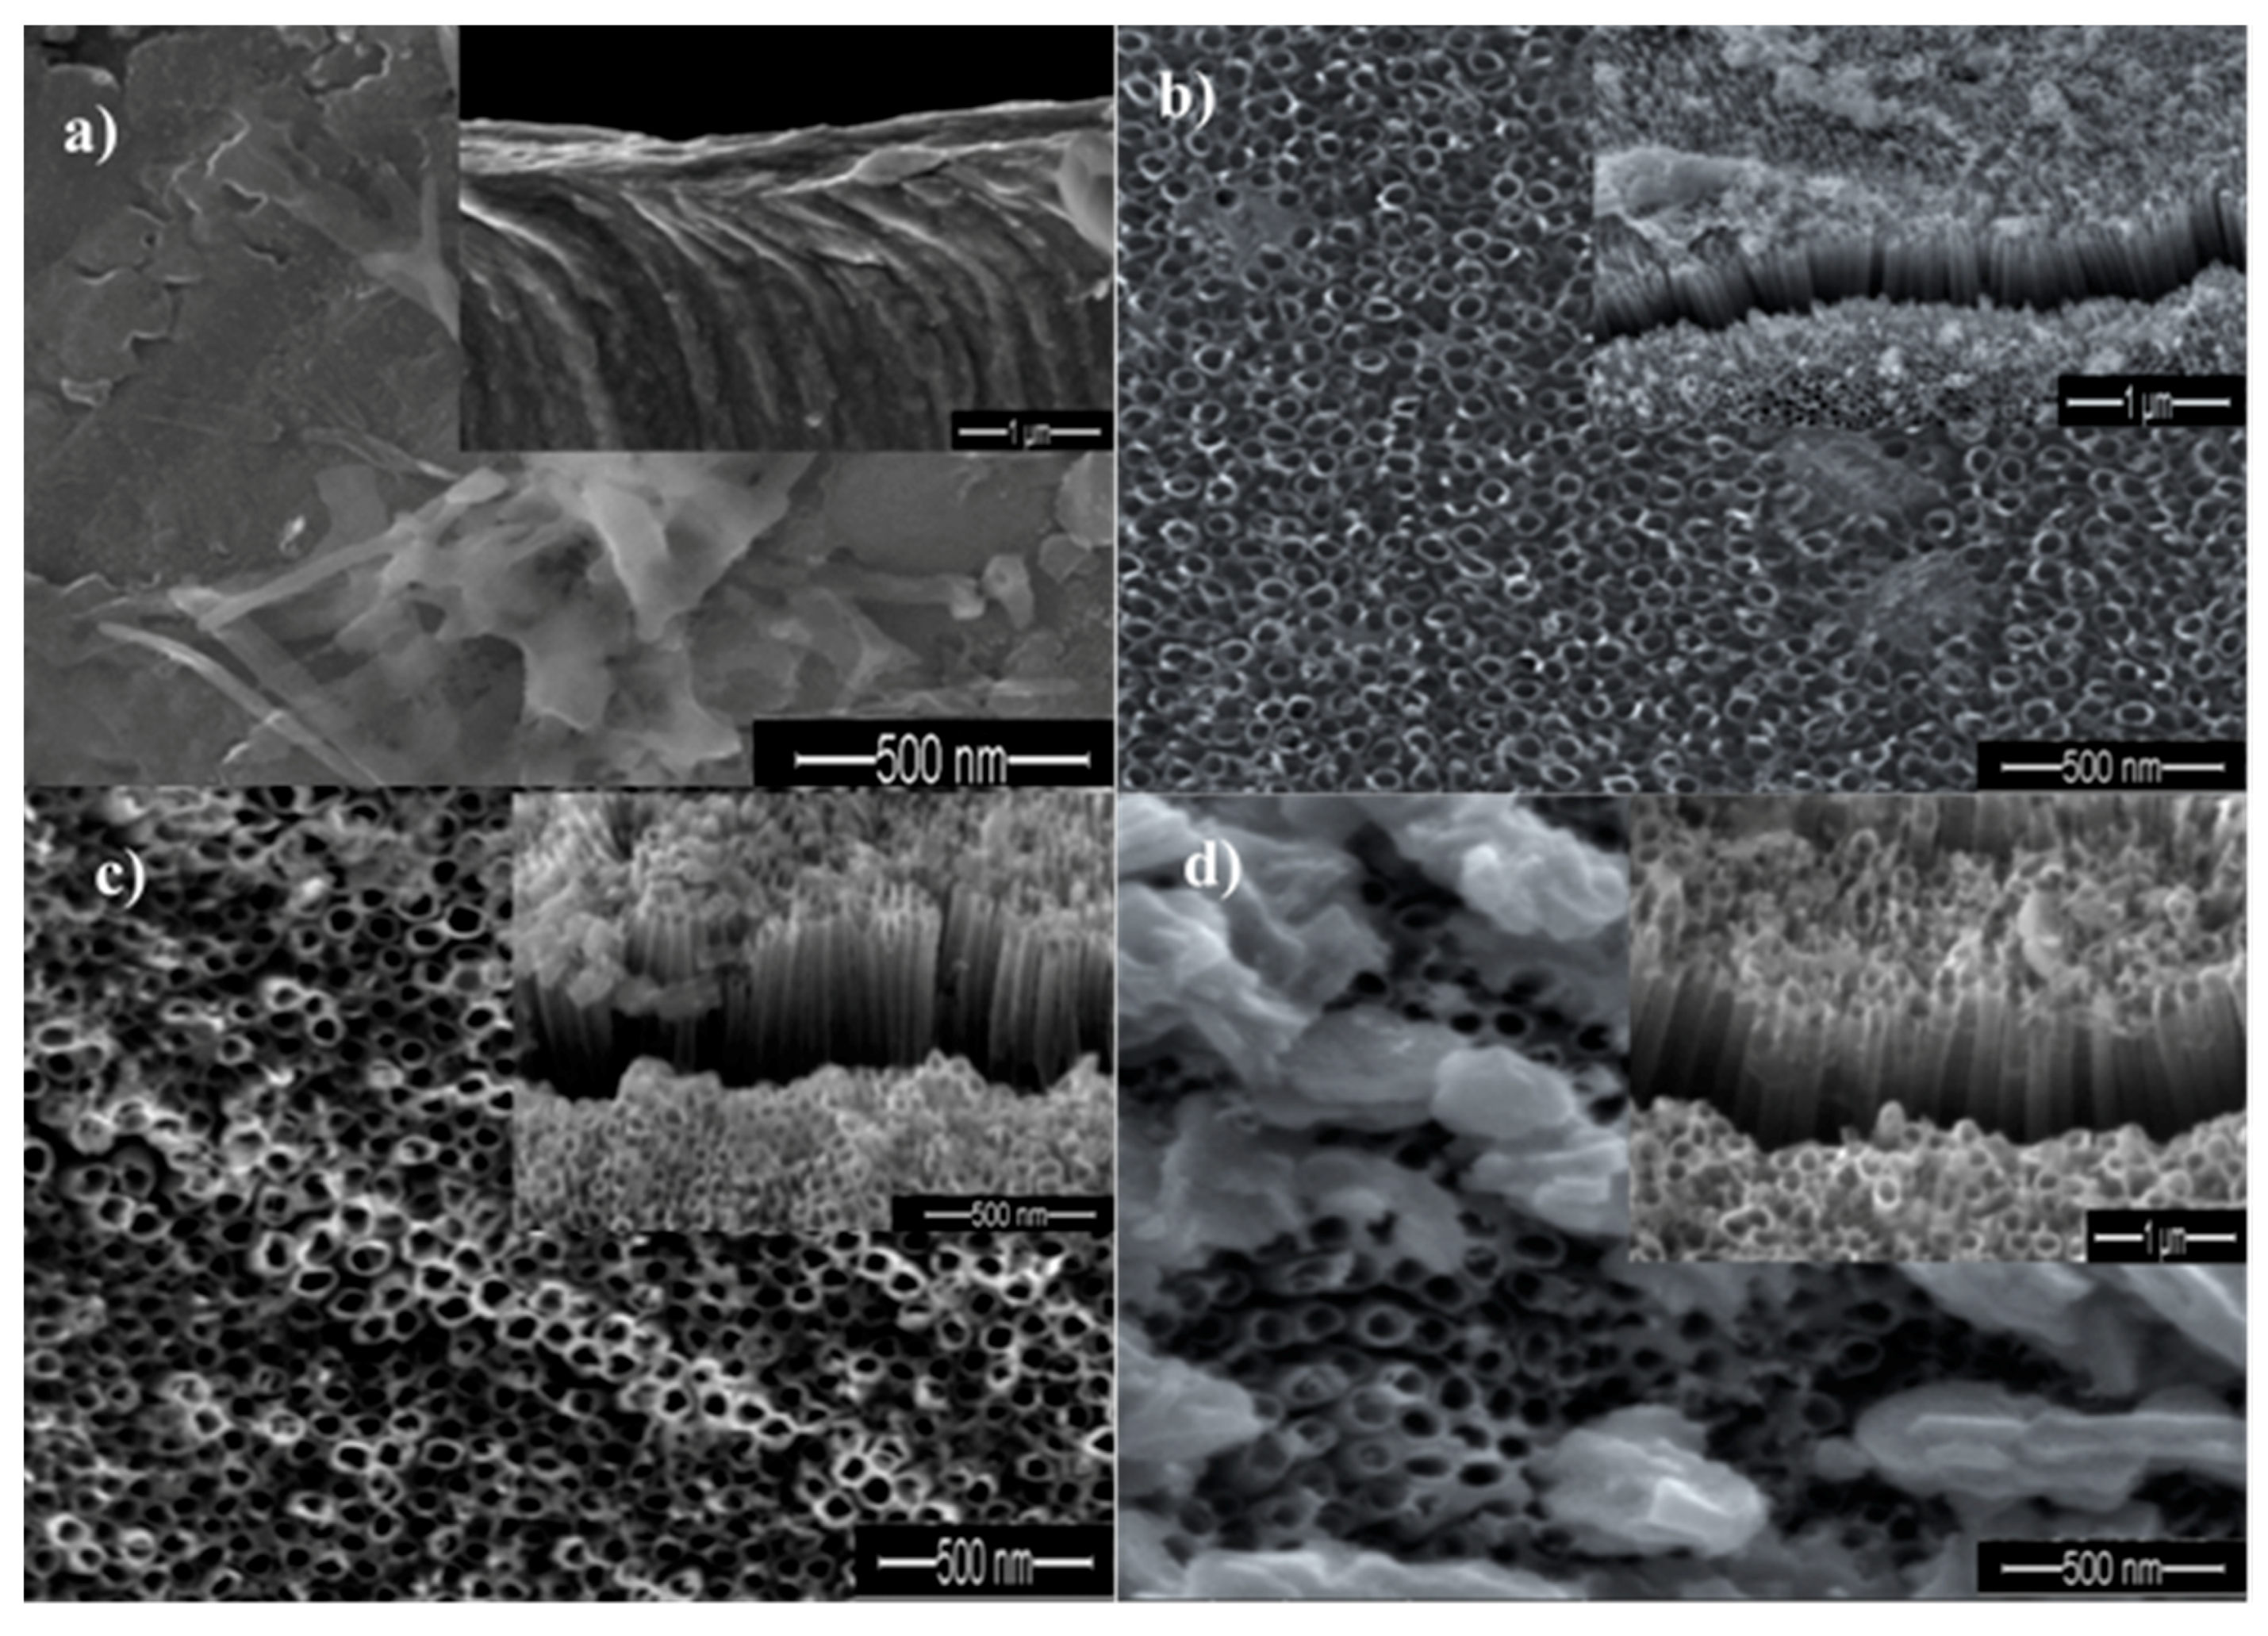
3.1. SEM Analysis
3.2. Elemental Analysis
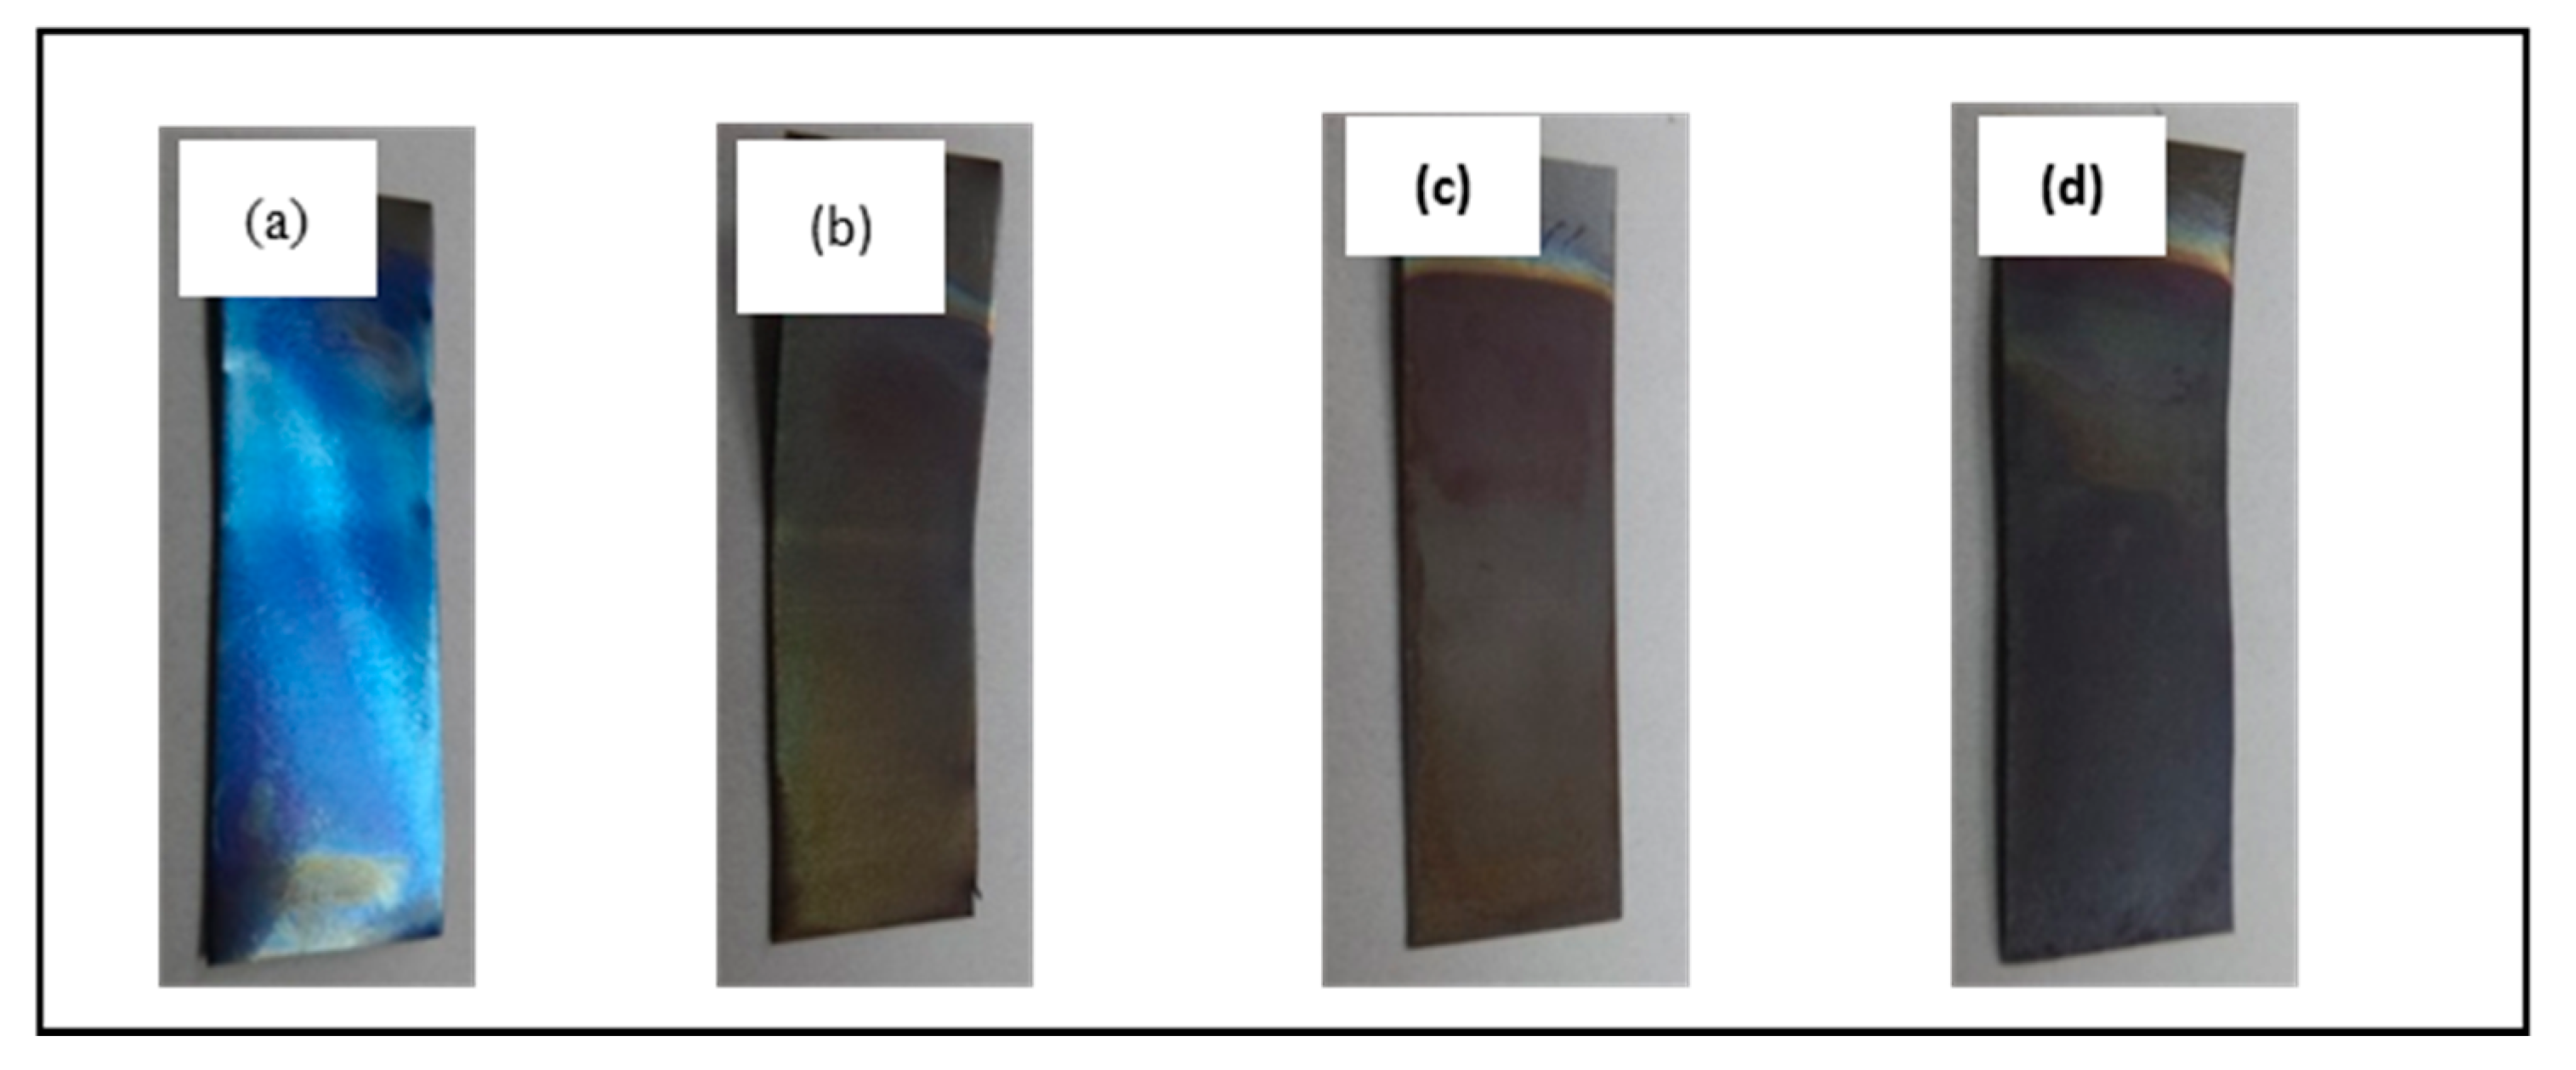
3.3. Physical Appearance
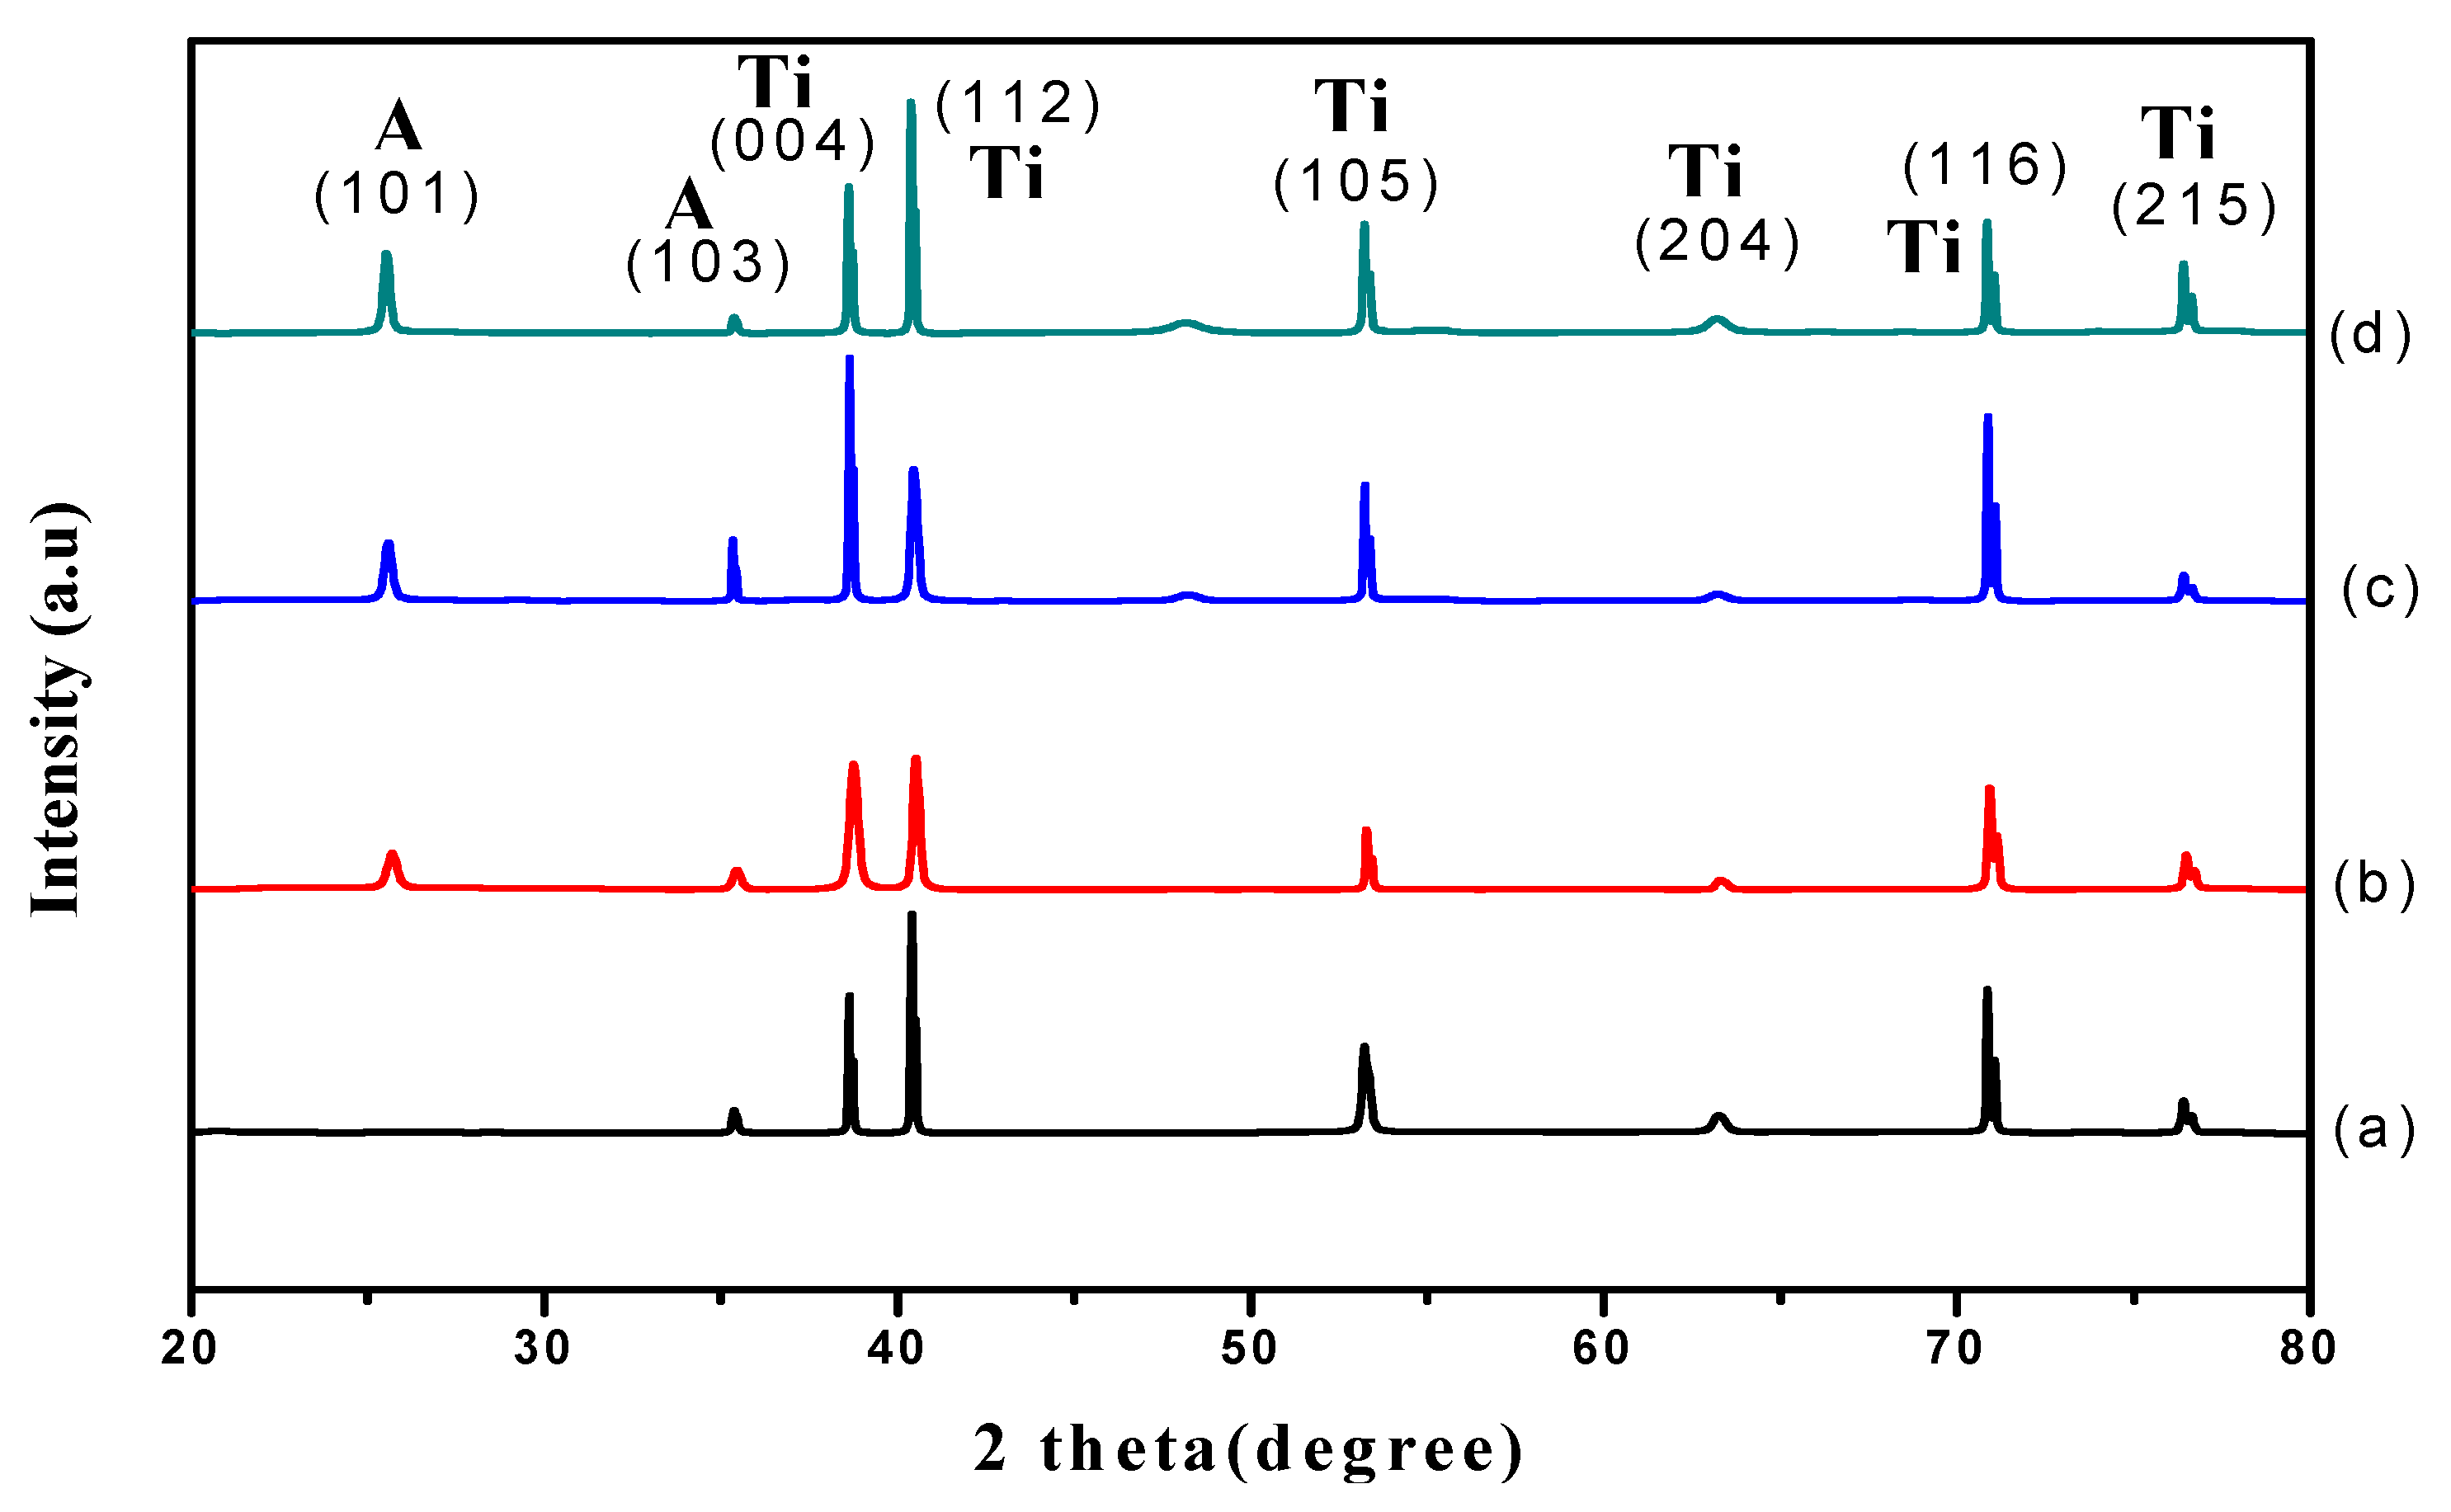
3.4. XRD Analysis
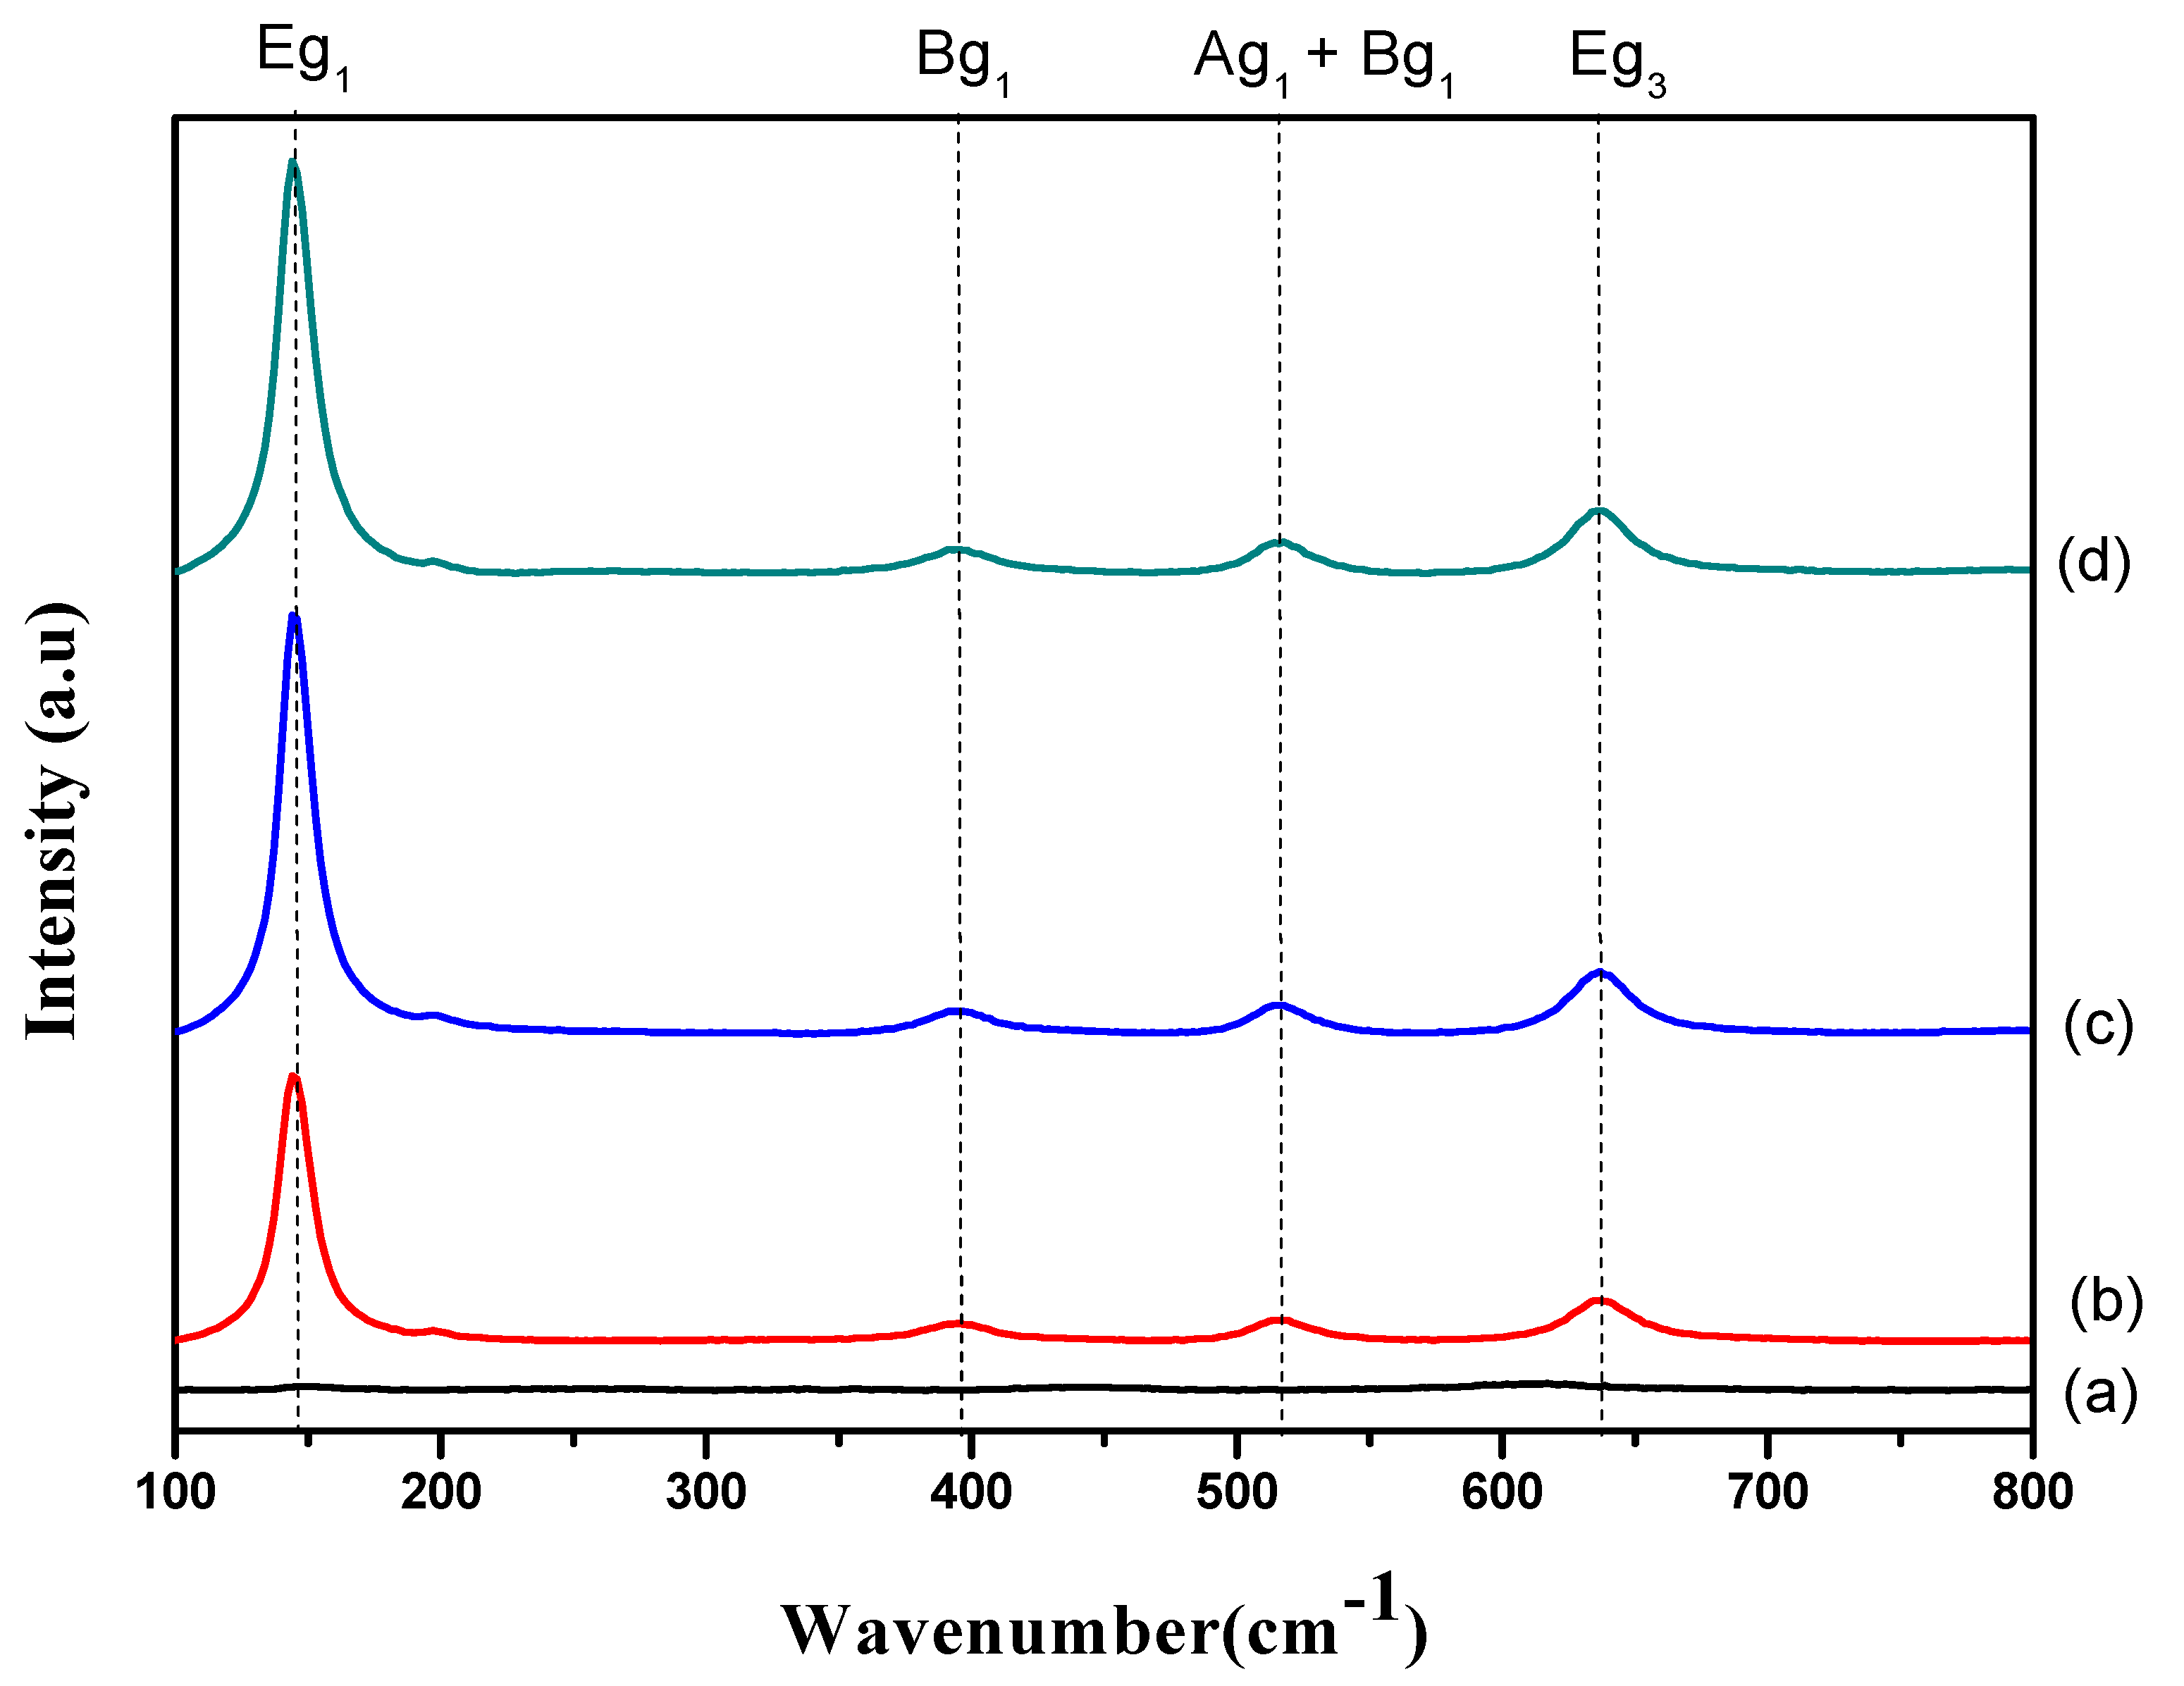
3.5. Raman Analysis
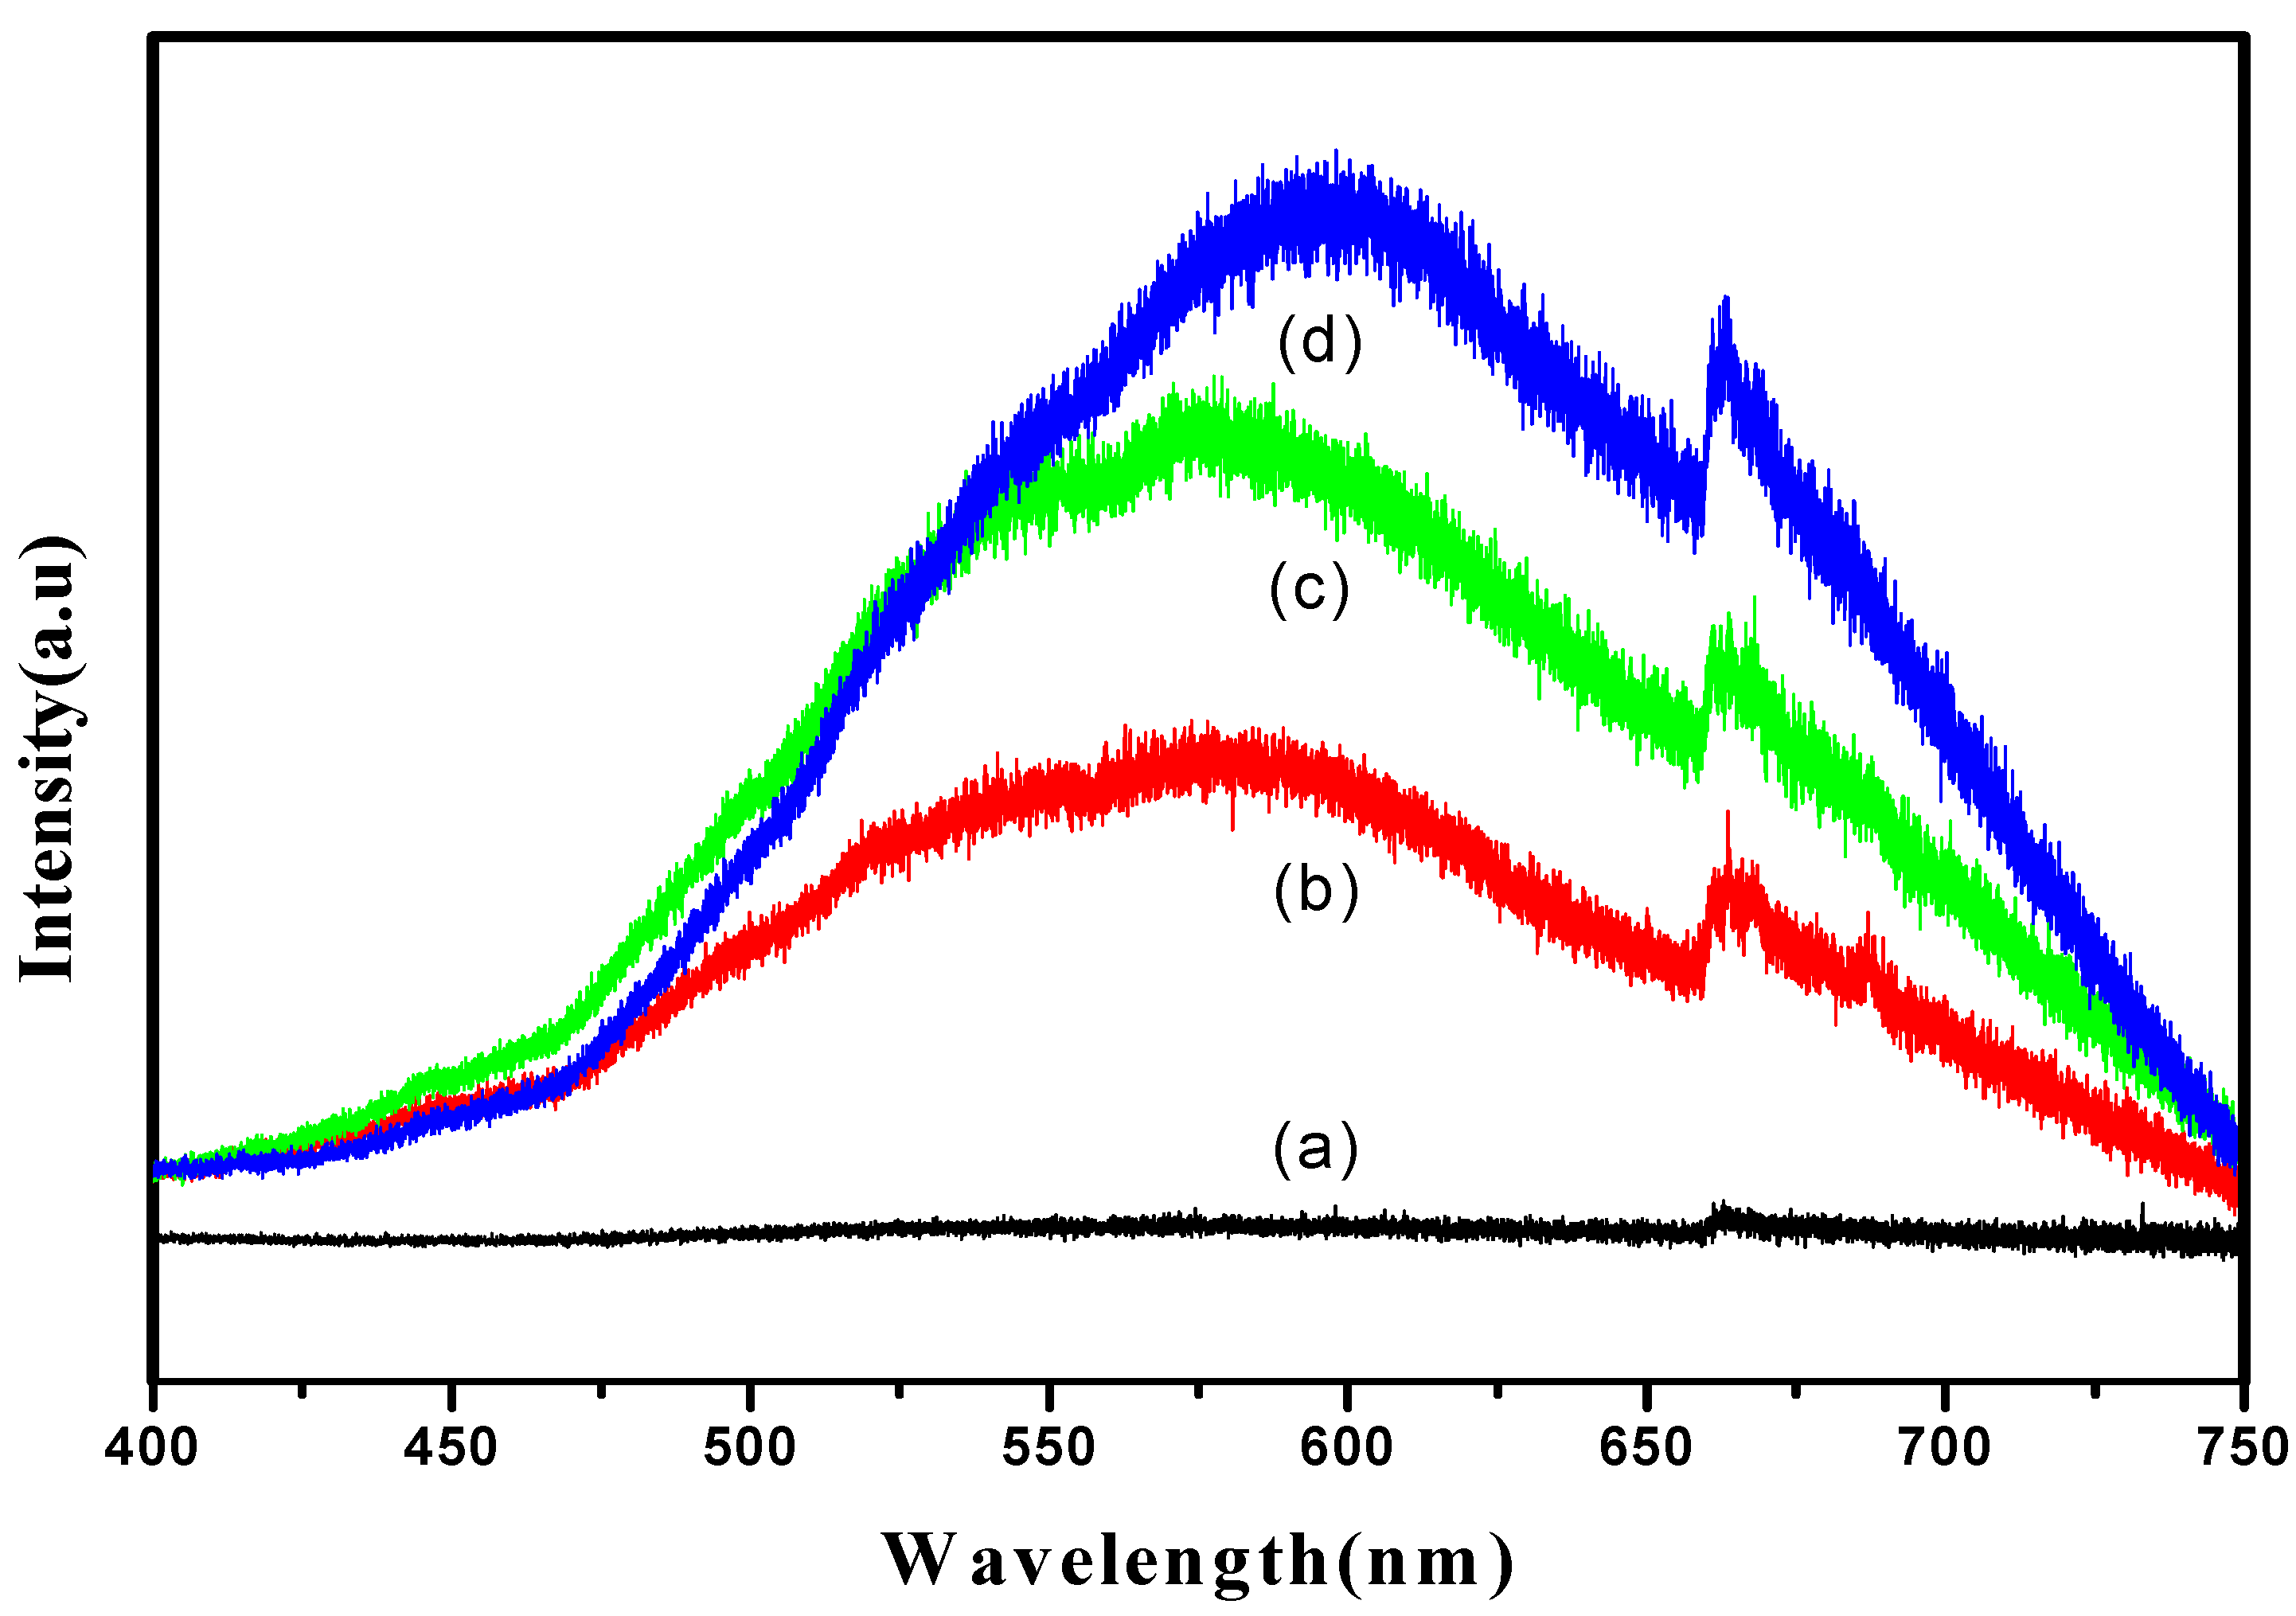
3.6. Photoluminescence (PL) Analysis
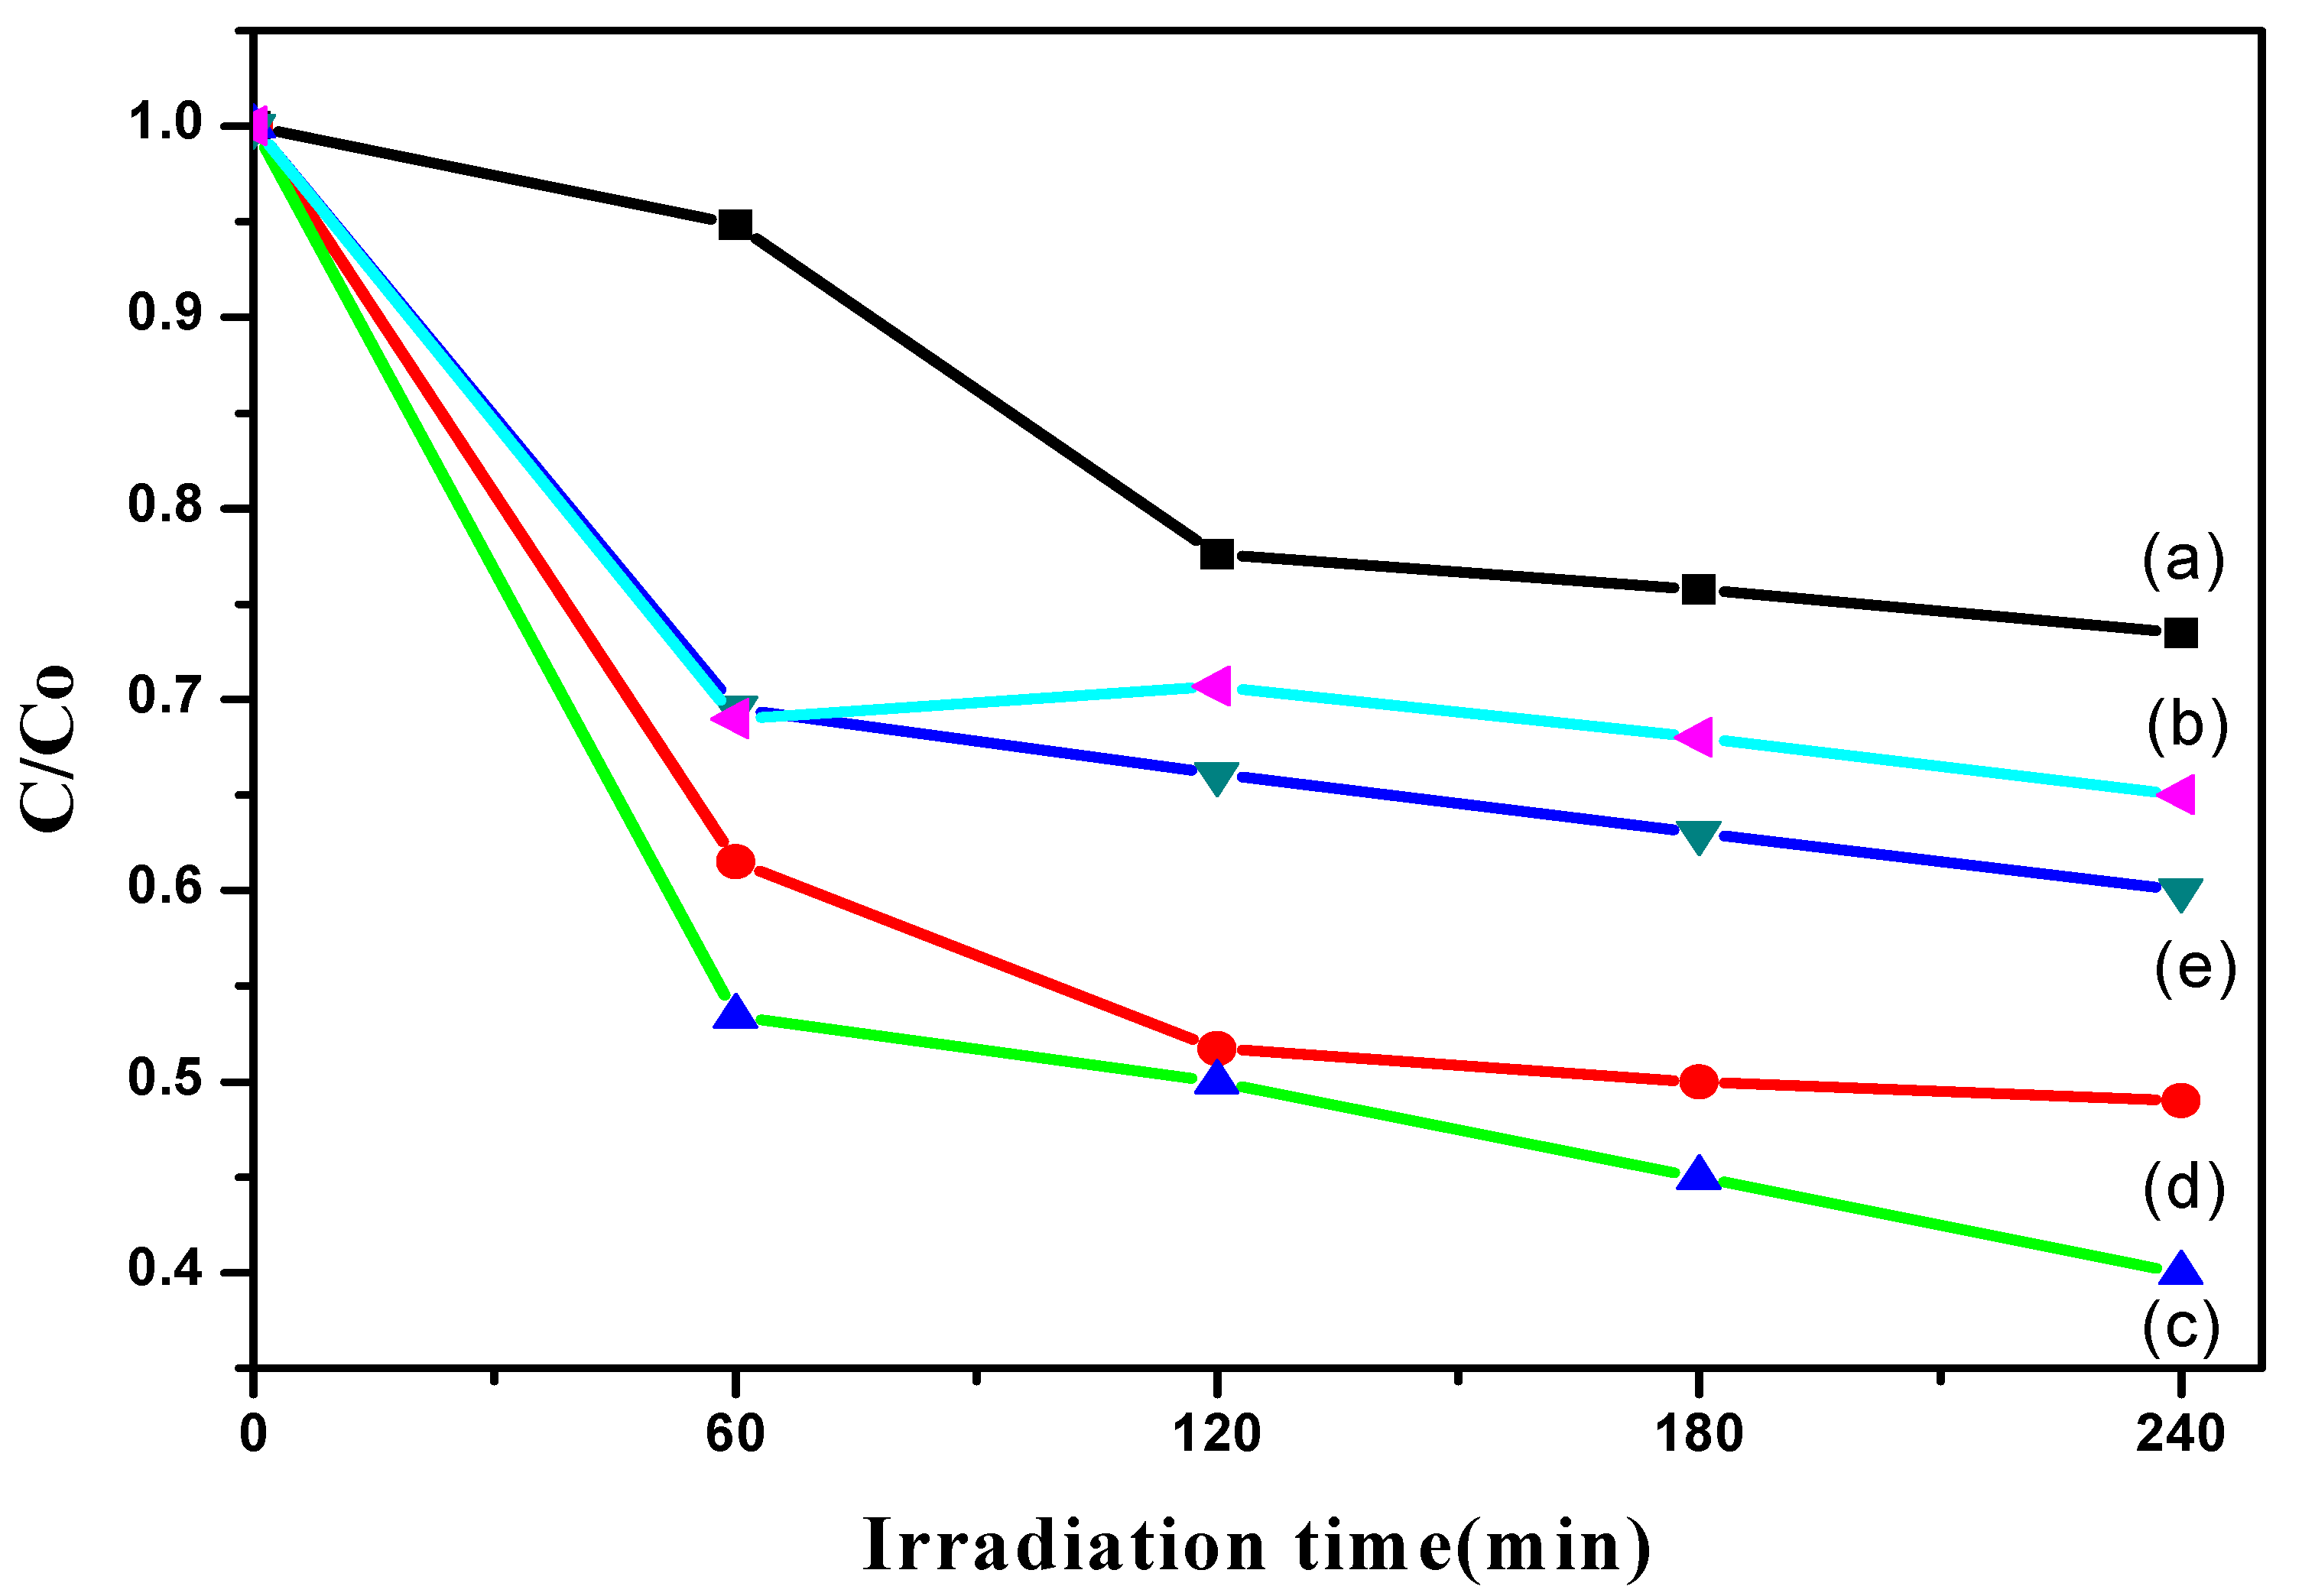
3.7. Photocatalytic Degradation Analysis
4. Conclusions
- (1)
- Prolonging the anodization time can engineer the structure or nanotubes, thereby significantly influencing their morphology and crystallinity. At a very short anodization time (30 s), no dense nanotubes were observed on the substrates. With elongated oxidation duration, a uniform oxide layer grew. However, too long an oxidation time resulted in damage because F− ions existing in electrolyte can erode the nanotubes. The optimum anodization time was found to be 10 min in this study.
- (2)
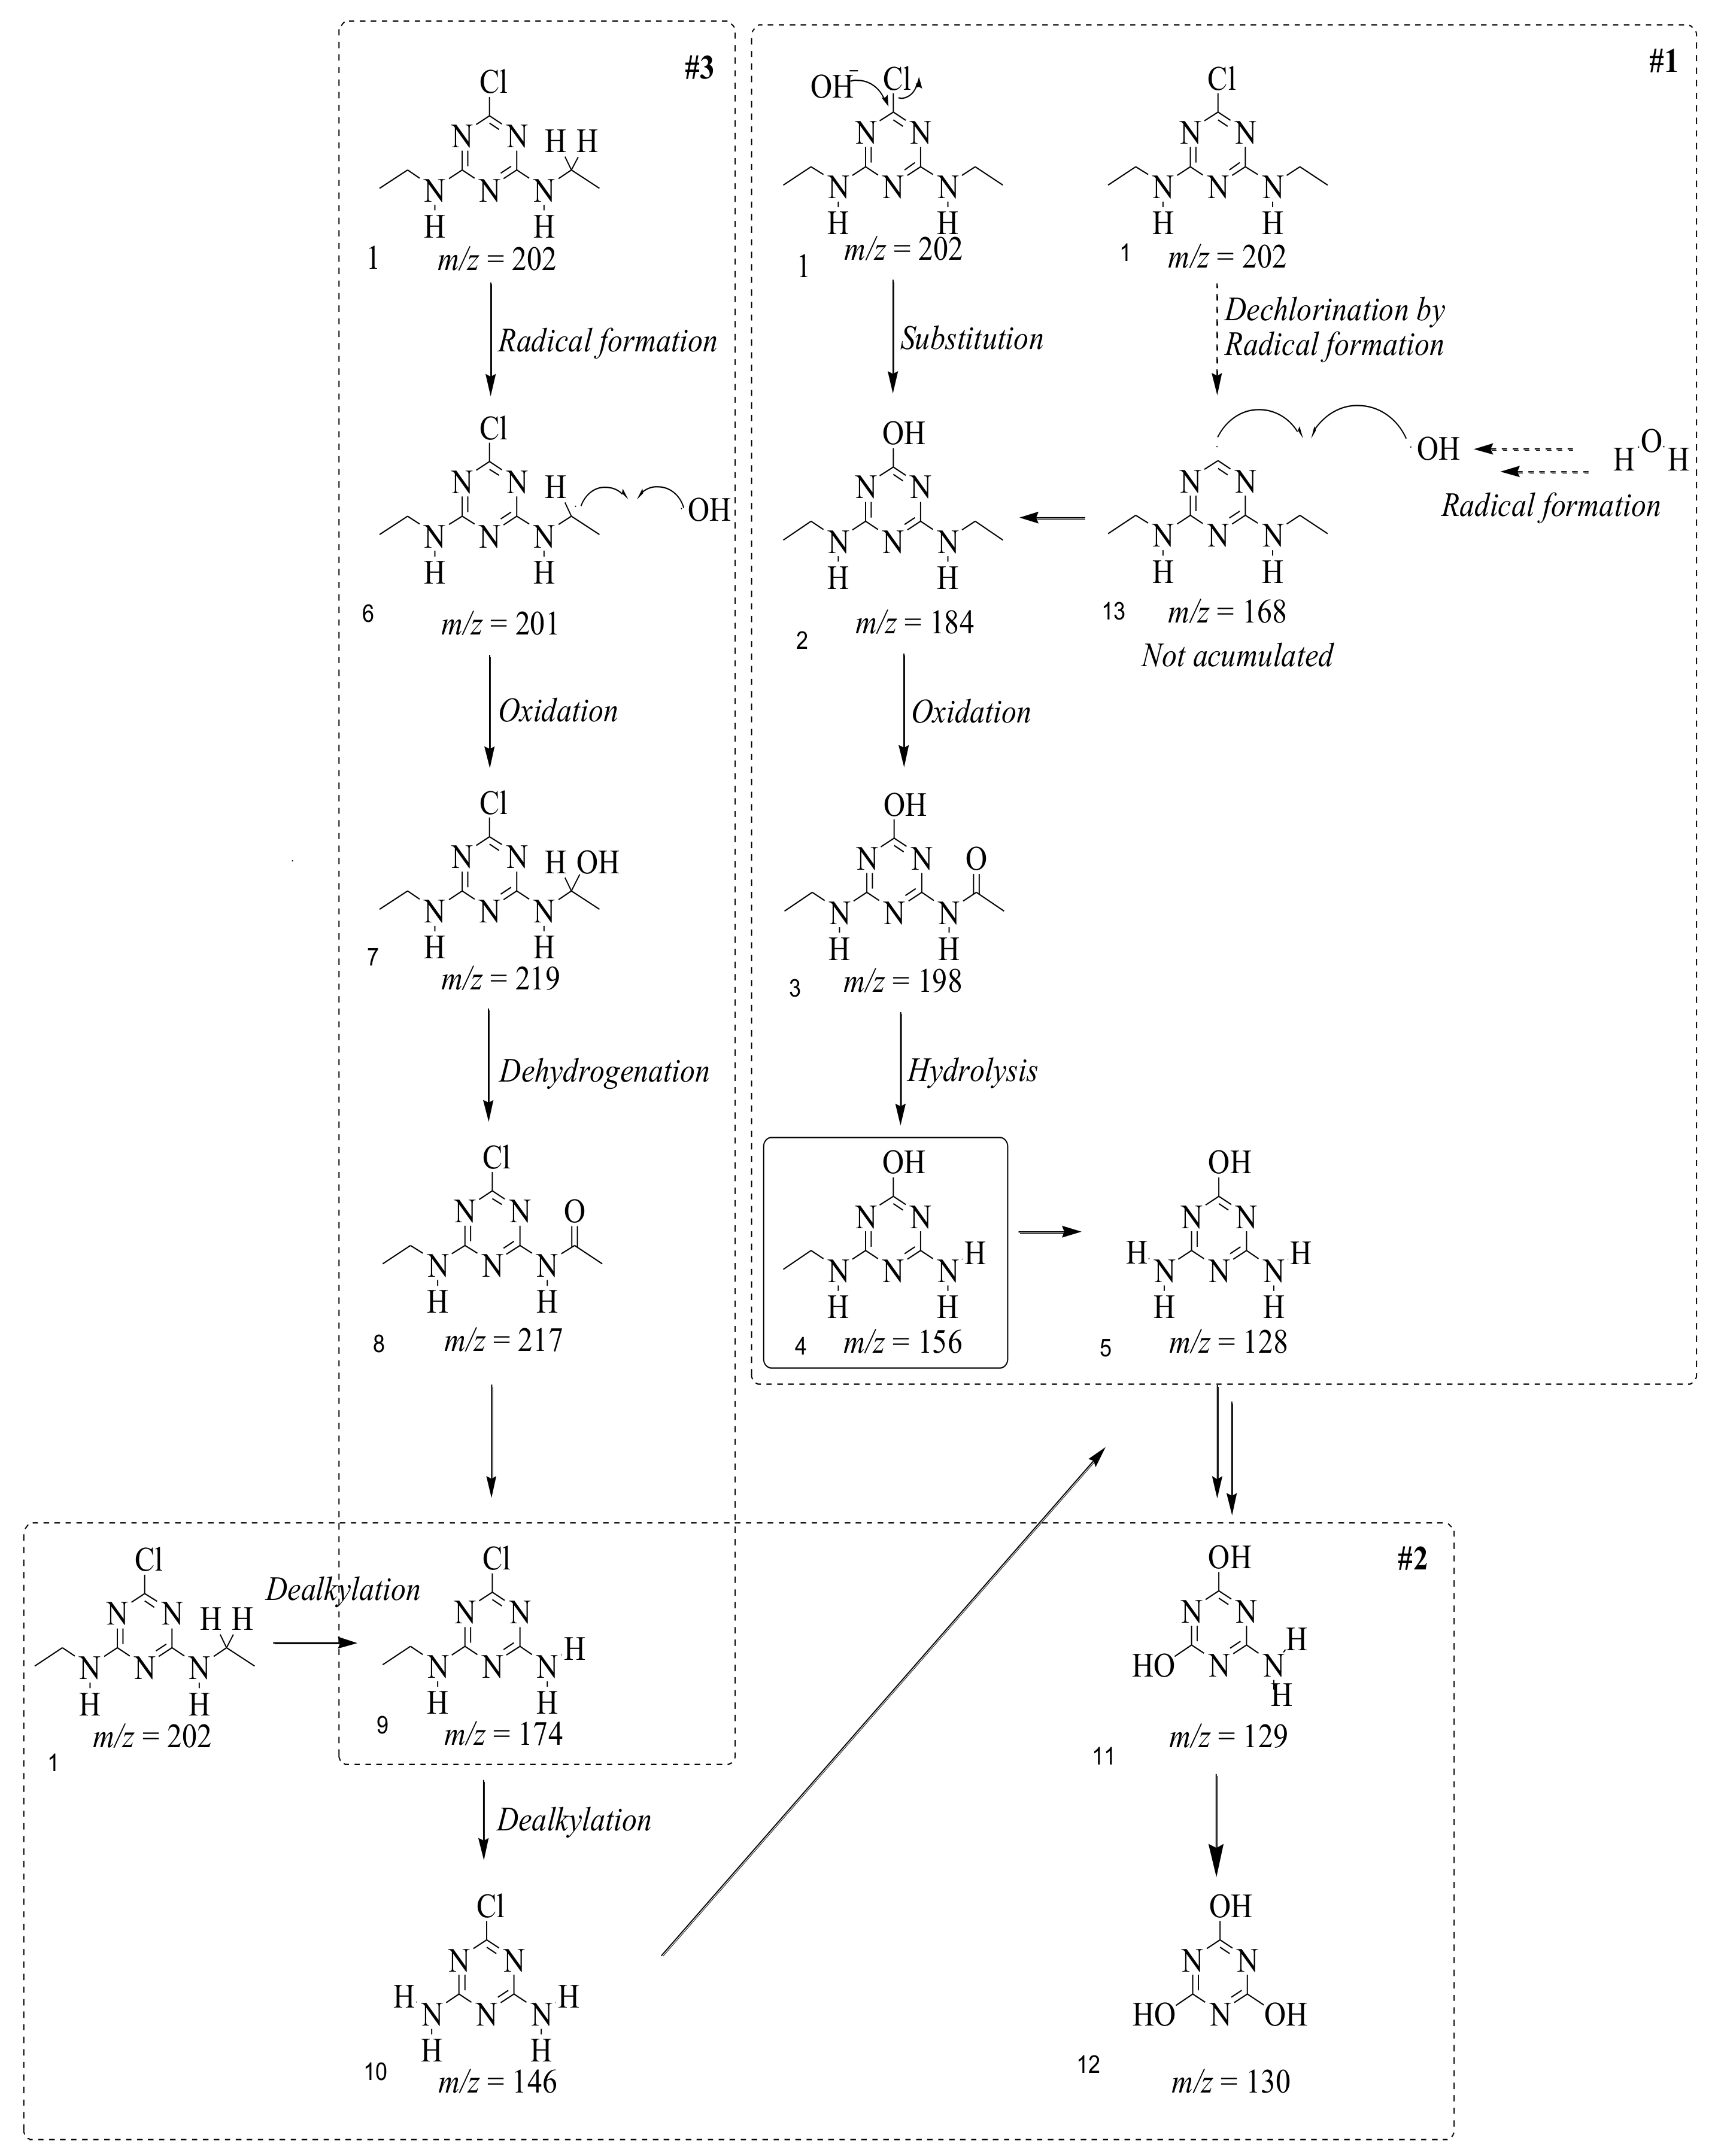
- The photodegradation of 1.0 ppm Simazine was successfully achieved by a TiO2 nanotubes photocatalyst. Interestingly, three photodegradation pathways are proposed in this study and non-toxic cyanuric acid is found to be the final product. LCMS/MS/MS analysis was used to identify the intermediates produced during the mineralization process. Identification of various intermediates will be beneficial for future advanced oxidation and water treatment processes.
Author Contributions
Acknowledgments
Conflicts of Interest
References
- Heap, I. Herbicide Resistant Weeds; Springer: Dordrecht, The Netherlands, 2014; pp. 281–301. [Google Scholar]
- Pérez, R.A.; Sánchez-Brunete, C.; Miguel, E.; Tadeo, J.L. Analytical methods for the determination in soil of herbicides used in forestry by GC-NPD and GC/MS. J. Agric. Food Chem. 1998, 46, 1864–1869. [Google Scholar] [CrossRef]
- Kumar, S.G.; Koteswara Rao, K.K.R. Comparison of modification strategies towards enhanced charge carrier separation and photocatalytic degradation activity of metal oxide semiconductors (TiO2, WO3 and ZnO). Appl. Surf. Sci. 2016, 391, 124–148. [Google Scholar] [CrossRef]
- Lu, X.Q.; Pu, F.; Xia, Y.; Huang, W.; Li, Z.L. Facile fabrication of porous thin films of Bi2O3/Bi2S3 nanocomposite semiconductors at gas/liquid interface and their photoelectrochemical performances. Appl. Surf. Sci. 2014, 299, 131–135. [Google Scholar] [CrossRef]
- Mazloom, J.; Ghodsi, F.E.; Golmojdeh, H. Synthesis and characterization of vanadium doped SnO2 diluted magnetic semiconductor nanoparticles with enhanced photocatalytic activities. J. Alloys Compd. 2015, 639, 393–399. [Google Scholar] [CrossRef]
- Wang, J.; Yu, N.F.; Zhang, Y.; Zhu, Y.S.; Fu, L.J.; Zhang, P.; Gao, L.; Wu, Y.P. Synthesis and performance of Cu2ZnSnS4 semiconductor as photocathode for solar water splitting. J. Alloys Compd. 2016, 688, 923–932. [Google Scholar] [CrossRef]
- Lee, C.P.; Chen, P.W.; Li, C.T.; Huang, Y.J.; Li, S.R.; Chang, L.Y.; Chen, P.Y.; Lin, L.Y.; Vittal, R.; Sun, S.S.; et al. ZnO double layer film with a novel organic sensitizer as an efficient photoelectrode for dye–sensitized solar cells. J. Power Sources 2016, 325, 209–219. [Google Scholar] [CrossRef]
- Trawka, M.; Smulko, J.; Hasse, L.; Granqvist, C.G.; Annanouch, F.E.; Ionescu, R. Fluctuation enhanced gas sensing with WO3-based nanoparticle gas sensors modulated by UV light at selected wavelengths. Sens. Actuators B Chem. 2016, 234, 453–461. [Google Scholar] [CrossRef]
- Gaya, U.I.; Abdullah, A.H. Heterogeneous photocatalytic degradation of organic contaminants over titanium dioxide: A review of fundamentals, progress and problems. J. Photochem. Photobiol. C Photochem. Rev. 2008, 9, 1–12. [Google Scholar] [CrossRef]
- Cao, C.B.; Zhang, G.S.; Ye, J.; Hua, R.M.; Sun, Z.Q.; Cui, J.B. Fast growth of self-aligned titania nanotube arrays with excellent transient photoelectric responses. Electrochim. Acta 2016, 211, 552–560. [Google Scholar] [CrossRef]
- Kang, X.W.; Chen, S.W. Photocatalytic reduction of methylene blue by TiO2 nanotube arrays: Effects of TiO2 crystalline phase. J. Mater. Sci. 2010, 45, 2696–2702. [Google Scholar] [CrossRef]
- Tatsuma, T.; Saitoh, S.; Ohko, Y.; Fujishima, A. TiO2-WO3 photoelectrochemical anticorrosion system with an energy storage ability. Chem. Mater. 2001, 13, 2838–2842. [Google Scholar] [CrossRef]
- Ni, M.; Leung, M.K.H.; Leung, D.Y.C.; Sumathy, L.K. A review and recent developments in photocatalytic water-splitting using TiO2 for hydrogen production. Renew. Sustain. Energy Rev. 2007, 11, 401–425. [Google Scholar] [CrossRef]
- Regonini, D.; Clemens, F.J. Anodized TiO2 nanotubes: Effect: of anodizing time on film length, morphology and photoelectrochemical properties. Mater. Lett. 2015, 142, 97–101. [Google Scholar] [CrossRef]
- Balakrishnan, M.; Narayanan, R. Synthesis of anodic titania nanotubes in Na2SO4/NaF electrolyte: A comparison between anodization time and specimens with biomaterial based approaches. Thin Solid Films 2013, 540, 23–30. [Google Scholar] [CrossRef]
- Chatterjee, S.; Ginzberg, M.; Gersten, B. Effect of anodization conditions on the synthesis of TiO2 nanopores. MRS Proceedings. MRS Online Proc. Libr. Arch. 2006, 951, E09-27. [Google Scholar]
- Yurddaskal, M.; Dikici, T.; Yildirim, S.; Yurddaskal, M.; Toparli, M.; Celik, E. Fabrication and characterization of nanostructured anatase TiO2 films prepared by electrochemical anodization and their photocatalytic properties. J. Alloys Compd. 2015, 651, 59–71. [Google Scholar] [CrossRef]
- Palmas, S.; Da Pozzo, A.; Delogu, F.; Mascia, M.; Vacca, A.; Guisbiers, G. Characterization of TiO2 nanotubes obtained by electrochemical anodization in organic electrolytes. J. Power Sources 2012, 204, 265–272. [Google Scholar] [CrossRef]
- Li, D.G.; Chen, D.R.; Wang, J.D.; Liang, P. Effect of acid solution, fluoride ions, anodic potential and time on the microstructure and electronic properties of self-ordered TiO2 nanotube arrays. Electrochim. Acta 2016, 20, 152–163. [Google Scholar] [CrossRef]
- Lai, C.W.; Sreekantan, S. Comparison of photocatalytic and photoelectrochemical behavior of TiO2 nanotubes prepared by different organic electrolyte. Optoelectron. Adv. Mater. Rapid Commun. 2012, 6, 82–86. [Google Scholar]
- Macák, J. Growth of Anodic Self-Organized Titanium Dioxide Nanotube Layers. Ph.D. Thesis, University of Erlangen-Nuremberg, Erlangen, Germany, 2008. [Google Scholar]
- Ranjitha, A.; Muthukumarasamy, N.; Thambidurai, M.; Velauthapillai, D.; Agilan, S.; Balasundaraprabhu, R. Effect of reaction time on the formation of TiO2 nanotubes prepared by hydrothermal method. Opt. Int. J. Light Electron Opt. 2015, 126, 2491–2494. [Google Scholar] [CrossRef]
- Tran, H.T.T.; Kosslick, H.; Ibad, M.F.; Fischer, C.; Bentrup, U.; Vuong, T.H.; Nguyen, L.Q.; Schulz, A. Photocatalytic performance of highly active brookite in the degradation of hazardous organic compounds compared to anatase and rutile. Appl. Catal. B Environ. 2017, 200, 647–658. [Google Scholar] [CrossRef]
- Lee, W.H.; Lai, C.W.; Hamid, S.B.A. One-step formation of WO3-loaded TiO2 nanotubes composite film for high photocatalytic performance. Materials 2015, 8, 2139–2153. [Google Scholar] [CrossRef]
- Poh, Z.; Vasilev, K.; Kant, K.; Sabzi, R.; Losic, D. Synthesis, nanostructure and crystallization of titania nanotube arrays fabricated by electrochemical anodization. In Proceedings of the 16th AINSE Conference, Sydney, Australia, 25–27 November 2009. [Google Scholar]
- Chu, W.; Rao, Y.F.; Hui, W.Y. Removal of simazine in a UV/TiO2 heterogeneous system. J. Agric. Food Chem. 2009, 57, 6944–6949. [Google Scholar] [CrossRef] [PubMed]


| Experimental Condition | Major Observation | References |
|---|---|---|
| Anodization duration: 5 min~2 h Electrolyte: 75 mL of EG + 3 mL of H2O + 0.3 g of NH4F Voltage: 30 V Annealing temp: 450 °C | Optimum anodization time: 20 min Extended anodizing time (1~2 h) causes some damage to the nanotubes Application: The incident photon to current efficiency (IPCE) | [14] |
| Anodization duration: 15 min, 30 min, 60 min, 120 min, 240 min. Electrolyte: Diff concentration of HF (0.25% HF, 0.5% HF, 1.0% HF, 2.0% HF) Voltage: 30 V Annealing temp: 500 °C | Optimum anodization time: 240 min The photocatalytic activity of the sample anodized for 240 min was the highest of all samples. Application: Degradation of methylene blue (MB) under UV light | [17] |
| Anodization duration: 0.5, 1, 2 and 4.5 h Electrolyte: 1 M Na2SO4 + 0.5 wt% NaF Voltage: 20 V Annealing temp: 600 °C | Optimum anodization time: 4.5 h Titanium anodized for 4.5 h is the best candidate for use in the human body due to its lower corrosion rate and absence of localized corrosion. Application: Corrosion resistance ability | [15] |
| Anodization duration: 1, 3 and 9 h Electrolyte: Set 1 (Glycerol 75%, H2O 25% and [F−] = 0.14 M) Set 2 (EG 98%, H2O 2%, [F−] = 0.14 M) Voltage: 20 V Annealing temp: 400 °C | Optimum anodization time: 9 h Anodization time appears much more effective at electrodes grown in ethylene glycol than at those grown in glycerol. Application: Water splitting | [18] |
| Anodizing Duration | Element | Weight % | Atomic % |
|---|---|---|---|
| 30 s | O | 25.21 | 50.23 |
| Ti | 74.79 | 49.77 | |
| 10 min | O | 37.41 | 64.16 |
| Ti | 62.59 | 35.84 | |
| 20 min | O | 33.32 | 59.94 |
| Ti | 66.68 | 40.06 | |
| 60 min | O | 38.36 | 65.07 |
| Ti | 61.64 | 34.93 |
| No | Compound Name | Structural Formula | Molecular Formula | Molecular Weight (m/z) |
|---|---|---|---|---|
| 1 | 6-chloro-N,N′-diethyl-1,3,5-triazine-2,4-diamine | C7H12ClN5 |  | 202.0871 |
| 2 | 6-hydroxy-N,N0-diethyl-1,3,5-triazine-2,4-diamine | C7H12N5OH |  | 184.1194 |
| 3 | 6-hydroxy-2-acetamido-4-ethylamino-1,3,5-triazine | C6H10N5COOH |  | 198.0987 |
| 4 | 6-hydroxy-2-amino-4-ethylamino-1,3,5-triazine | C5H8N5OH |  | 156.0884 |
| 5 | 6-hydroxy-2,4-diamino-1,3,5-triazine | C3H4N5OH |  | 128.0569 |
| 6 | 6-chloro-N2,N4-diethyl-1,3,5-triazine-2,4-diamine radical | C7H11ClN5 |  | 201.5509 |
| 7 | 1-((4-chloro-6-(ethylamino)-1,3,5-triazine-2-yl)amino)ethanol | C7H11ClN5OH |  | 219.3340 |
| 8 | N-(4-chloro-6-ethylamino-[1,3,5]triazine-2-yl)-acetamide | C7H11ClN5O |  | 217.0124 |
| 9 | 6-chloro-N-ethyl-[1,3,5]triazine-2,4-diamine | C5H8N5Cl |  | 174.1572 |
| 10 | 6-chloro-[1,3,5]triazine-2,4-diamine | C3H4N5Cl |  | 146.0225 |
| 11 | 2,6-dihydroxy-4-amino-1,3,5-triazine | C3H2N4(OH)2 |  | 128.5669 |
| 12 | 2,4,6-trihydroxy-1,3,5-triazine | C3N3(OH)3 |  | 130.1596 |
| 13 | N,N′-diethyl-1,3,5-triazine radical | C7H12ClN5 |  | 166.5097 |
© 2018 by the authors. Licensee MDPI, Basel, Switzerland. This article is an open access article distributed under the terms and conditions of the Creative Commons Attribution (CC BY) license (http://creativecommons.org/licenses/by/4.0/).
Share and Cite
Meriam Suhaimy, S.H.; Lai, C.W.; Tajuddin, H.A.; Samsudin, E.M.; Johan, M.R. Impact of TiO2 Nanotubes’ Morphology on the Photocatalytic Degradation of Simazine Pollutant. Materials 2018, 11, 2066. https://doi.org/10.3390/ma11112066
Meriam Suhaimy SH, Lai CW, Tajuddin HA, Samsudin EM, Johan MR. Impact of TiO2 Nanotubes’ Morphology on the Photocatalytic Degradation of Simazine Pollutant. Materials. 2018; 11(11):2066. https://doi.org/10.3390/ma11112066
Chicago/Turabian StyleMeriam Suhaimy, Syazwan Hanani, Chin Wei Lai, Hairul Anuar Tajuddin, Emy Marlina Samsudin, and Mohd Rafie Johan. 2018. "Impact of TiO2 Nanotubes’ Morphology on the Photocatalytic Degradation of Simazine Pollutant" Materials 11, no. 11: 2066. https://doi.org/10.3390/ma11112066
APA StyleMeriam Suhaimy, S. H., Lai, C. W., Tajuddin, H. A., Samsudin, E. M., & Johan, M. R. (2018). Impact of TiO2 Nanotubes’ Morphology on the Photocatalytic Degradation of Simazine Pollutant. Materials, 11(11), 2066. https://doi.org/10.3390/ma11112066