Article

Nanostructured ZnO in a Metglas/ZnO/Hemoglobin Modified Electrode to Detect the Oxidation of the Hemoglobin Simultaneously by Cyclic Voltammetry and Magnetoelastic Resonance

1
BCMaterials, Ibaizabal Bidea, Edificio 500, Parque Tecnológico de Bizkaia, 48160 Derio, Spain
2
Department of Materials Science, University of Patras, 26504 Patras, Greece
3
Foundation for Research and Technology Hellas, Institute of Chemical Engineering and High Temperature Chemical Processes, 26504 Patras, Greece
4
Department of Chemical Engineering, University of Patras, 26504 Patras, Greece
5
Department of Electricity and Electronics, Universidad del País Vasco/Euskal Herriko Unibertsitatea, 48080 Bilbao, Spain
*
Author to whom correspondence should be addressed.
Materials 2017, 10(8), 849; https://doi.org/10.3390/ma10080849
Submission received: 26 June 2017 / Revised: 20 July 2017 / Accepted: 21 July 2017 / Published: 25 July 2017
(This article belongs to the Special Issue Zinc Oxide Nanostructures: Synthesis and Characterization)

Abstract

:
In the present work, a nanostructured ZnO layer was synthesized onto a Metglas magnetoelastic ribbon to immobilize hemoglobin (Hb) on it and study the Hb’s electrochemical behavior towards hydrogen peroxide. Hb oxidation by H2O2 was monitored simultaneously by two different techniques: Cyclic Voltammetry (CV) and Magnetoelastic Resonance (MR). The Metglas/ZnO/Hb system was simultaneously used as a working electrode for the CV scans and as a magnetoelastic sensor excited by external coils, which drive it to resonance and interrogate it. The ZnO nanoparticles for the ZnO layer were grown hydrothermally and fully characterized by X-Ray Diffraction (XRD), Scanning Electron Microscopy (SEM) and photoluminescence (PL). Additionally, the ZnO layer’s elastic modulus was measured using a new method, which makes use of the Metglas substrate. For the detection experiments, the electrochemical cell was performed with a glass vial, where the three electrodes (working, counter and reference) were immersed into PBS (Phosphate Buffer Solution) solution and small H2O2 drops were added, one at a time. CV scans were taken every 30 s and 5 min after the addition of each drop and meanwhile a magnetoelastic measurement was taken by the external coils. The CV plots reveal direct electrochemical behavior of Hb and display good electrocatalytic response to the reduction of H2O2. The measured catalysis currents increase linearly with the H2O2 concentration in a wide range of 25–350 μM with a correlation coefficient 0.99. The detection limit is 25–50 μM. Moreover, the Metglas/ZnO/Hb electrode displays rapid response (30 s) to H2O2, and exhibits good stability and reproducibility of the measurements. On the other hand, the magnetoelastic measurements show a small linear mass increase versus the H2O2 concentration with a slope of 152 ng/μM, which is probably due to H2O2 adsorption in ZnO during the electrochemical reaction. No such effects were detected during the control experiment when only PBS solution was present for a long time.

1. Introduction

In order to fabricate a good biosensor, the supporting material for the target biomolecule of choice has to be biocompatible in order to immobilize it in a stable and functional way. Hydrogels, surfactants, biopolymers, conducting polymers, metal oxides and ionic liquids have been successfully used in the past as substrates for the immobilization of proteins or enzymes: they are nontoxic and provide favorable environmental conditions to examine and study the direct electrochemical activity of redox biomolecules as they allow the active redox center of the immobilized biomolecules to come into direct contact with the material [1,2].
In the last years, nanostructured materials are being intensively studied for applications in many different nanoscale functional devices. Semiconductor nanomaterials such as ZnO, SnO2, TiO2 and ZnS are good examples where the nano-structure affects their intrinsic physical and chemical properties [3,4,5] and the subsequently derived applications. In particular, the semiconductor ZnO is a good candidate for the construction of nanostructured functional devices because of its low toxicity, good biocompatibility and biodegradability, good thermal stability and oxidation resistance, large specific surface area and high electron mobility [6]. ZnO is a transparent semiconductor with a direct band gap (Eg = 3.37 eV) and a large exciton binding energy (60 meV), exhibiting near UV emission [7]. It is widely used in the chemical industry [8,9], for biomedical applications [10,11], or food technology [12] among others. ZnO nanostructures are being widely used as chemical gas sensors (based on conductance changes) and for biological agents detection purposes (by profiting of biocompatibility and low toxicity) [12,13,14]. ZnO nanoparticles and nanostructures with different size and growth morphologies can be prepared using a variety of techniques. The most popular fabrication processes include thermal evaporation, thermal decomposition and hydrothermal growth [15,16,17].
For materials scientists and engineers, the knowledge of the elastic properties of such nanostructured materials is a key factor, since elastic moduli are closely linked to the internal structure of solids at the atomic level [18,19]. The capability to measure those elastic moduli and their dependence under external influences, as temperature or mass load, unveils the utility of such nanostructured materials for oriented applications, as thin-film deposition growth control or deposition control of specific targets.
On the other hand, over the last 30 years there has been a great effort to develop new H2O2 electrochemical biosensors in order to understand the redox processes of enzymes and proteins and if these are maintained after their immobilization on electrodes surface. The protein’s structure and redox transformation of protein molecules are actually a preferential task devoted to give a deep insight into physiological electron transfer processes. H2O2 presents cytotoxic effects and associated tissue injury, but also plays a role in physiological and biomedical studies as well as when monitoring biological processes. H2O2 is also a side product of many oxidative biological reactions catalyzed by enzymes such as glucose oxidase (GOx), lactate oxidase (LOx, cholesterol oxidase (ChoOx) and many others [20]. Therefore, it is of high importance to be able to achieve sensitive determination of H2O2 presence in many biological processes and related applications. Additionally, it is also well known that, due to its intrinsic peroxidase activity, Hb is an excellent protein to fabricate H2O2 electrochemical biosensors (see, for example, works by Chen et al. [20] or Shamsipur et al. [21]).
Hb is a physiologically oxygen transfer protein with a well known and documented structure, of low cost and exhibiting relatively higher stability and intrinsic peroxidase activity [22]. Hb has four polypeptide chains, each with one electroactive iron heme group [23], as can be seen in Figure 1. It is a prototype molecule for studying biological electron transfer processes and therefore it has been extensively used as an ideal model enzyme to study biological electron transfer reactions, to evaluate materials for their choice to be used as substrates for the immobilization of biomolecules in an active configuration and it has already been used in the past for the fabrication of electrochemical biosensors and bioreactors (see, for example, works by Zhang et al. [24] or Duan et al. [1]).
Nevertheless, many of the fabricated sensors exhibit slow electron exchange due to the unfavorable orientation of Hb molecules onto electrode surfaces, and so efforts point towards the development of new immobilization methods and supporting materials to promote the direct electron transfer of Hb while maintaining its enzymatic activity. Among other possibilities, ZnO nanoparticles are good candidates for such purposes [2,21].
The experimental technique of CV can be used to monitor the electrochemical behavior of modified electrodes. On the other hand, magnetoelastic materials working in resonant conditions are known to be extremely sensitive to external parameters, such as mass load [25]. Magnetoelasticity is a property of ferromagnetic materials, which describes the efficient conversion of magnetic energy into elastic, and vice versa [26]. Amorphous metallic glass ribbons are among the best magnetoelastic materials known for such energy conversion processes, due to their almost null internal magnetocrystalline anisotropy and internal stresses appearing during their fabrication process [27]. Freestanding magnetoelastic ribbons can easily be induced to vibrate by exposure to an external, time varying magnetic field. Such ribbons exhibit a resonance frequency that depends upon factors such as sample geometry, mass load and elastic constants, which are (magnetic) field-dependent. The appearance of any mass load onto a magnetoelastic ribbon will immediately cause a decrease in its resonant frequency and this decrease can be used to determine the loaded mass value by comparing to calibration curves of known mass loads. Another important advantage of such a device is that the whole detection process is remote, thus eliminating the need for direct electrical connections which sometimes is a nuisance. These magnetoelastic resonant platforms can be converted into very selective microbalances by depositing on them nanostructured materials that can work as selective adsorbing layers. Thus, the detection of specific targets of biological or chemical origin is possible [28]. Additionally, the dependence of the resonance frequency of the magnetoelastic platform on the elastic modulus, allows the study of the elastic properties of the deposited nanostructured coatings.
With this purpose in mind, we have fabricated a biosensor to detect the oxidation of Hb by H2O2. The biosensor is composed of a thin-film of nanostructured ZnO deposited onto a magnetoelastic strip of commercial magnetoelastic material Metglas 2826MB (Fe40Ni38Mo4B18). The ZnO nanoparticles for the ZnO layer were prepared using the hydrothermal method and a layer of Hb was successfully immobilized on the ZnO layer. Adsorption of Hb on ZnO film results in the yellow-brown coloration of the film indicating the even distribution of the Hb molecules on its surface. As demonstrated in the past, the binding of Hb on metal oxide films such as ZnO and TiO2 is mainly electrostatic and controlled by the buffer pH, the protein surface charge, and the solution ionic strength [29]. The resultant three-layer sensor was used in two simultaneous detection techniques, as a working electrode (Metglas/ZnO/Hb) in CV and as the resonant platform in MR. The detection experiment consisted of a standard electrochemical cell composed of three electrodes, the sensor as the working electrode (WE), the Pt counter electrode (CE) and the Ag/AgCl reference electrode (RE). The cell was immersed in a PBS buffer solution where drops of H2O2 were added. An external coil was wrapped around the glass vial, which contained the electrolyte solution and the cell. A detailed scheme of the detection system is shown in Figure 2. The voltage V was scanned during the CV scans and the resulting current I was recorded. The external coils were controlled by a magnetoelastic resonator in order to drive the sensor to resonance.
The resulted CV scans exhibit the direct electrochemical behavior of the immobilized Hb and display good electrocatalytic responses to the reduction of H2O2. The catalysis currents increase linearly to the H2O2 concentration in a wide range of 25–350 μM with a correlation coefficient 0.99. The detection limit is 25–50 μM. Moreover, the Metglas/ZnO/Hb electrode displays rapid response (30 s) to H2O2, and possesses good stability and reproducibility. The magnetoelastic measurements show that the mass load of the sensor increases linearly with the concentration of the H2O2 reaching a mass of about 57 μg when the molar concentration of H2O2 was 375 μM. The corresponding slope is equal to 152 ng/μM. To our knowledge, this is the first time that the two methods of CV and MR have been used simultaneously for biodetection.

2. Materials and Methods

2.1. Reagents and Materials
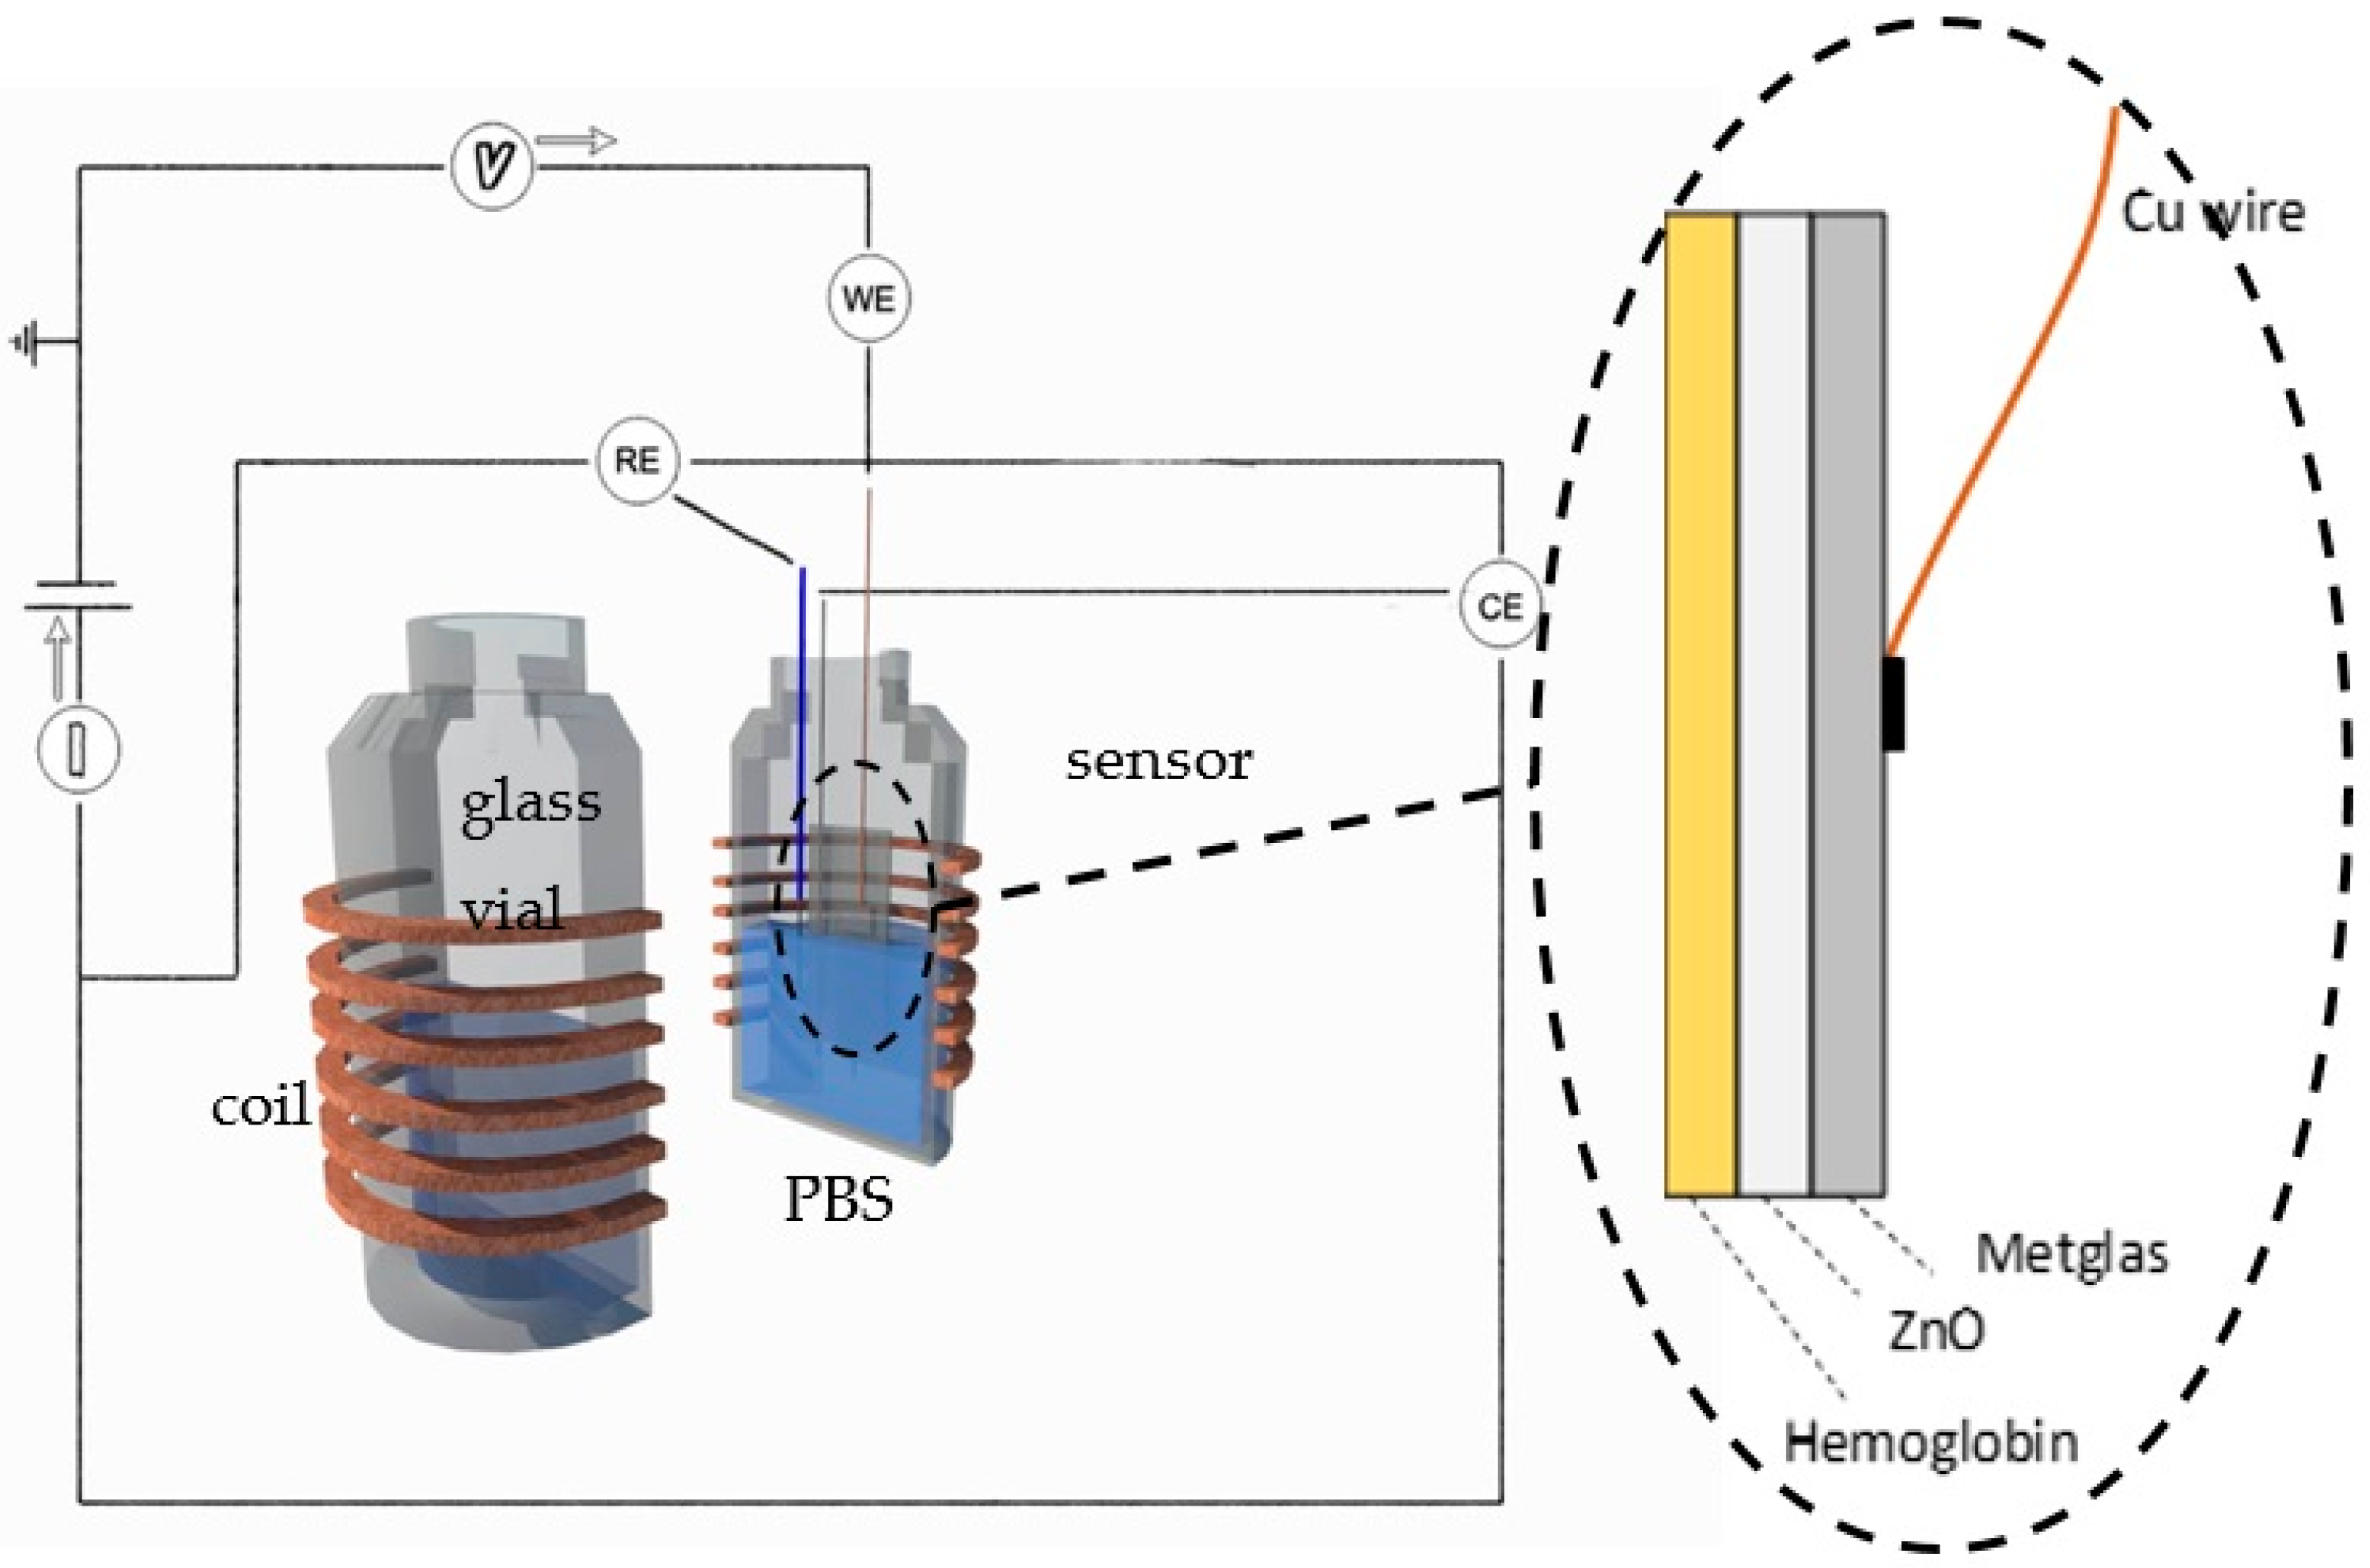
For the magnetoelastic measurements, a commercial ribbon of Metglas 2826MB (Fe40Ni38Mo4B18) purchased from Hitachi Metals Europe GmbH (Dusseldorf, Germany) was used as resonant platform. Magnetoelastic sensors are made of this ribbon by cutting strips of 2 cm length after applying a cleaning treatment with analytical grade acetone purchased from Sigma-Aldrich Chemie GmbH (Taufkirchen, Germany).
For the ZnO nanoparticle synthesis and later film deposition the reagents used were analytical-grade without further purification. Lithium hydroxide monohydrate [Li(OH)·H2O], zinc acetate dihydrate [Zn(CH3COO)2·H2O] and ethanol were purchased from Sigma.
Hb (MW 65,000), from Bovine blood was purchased from Sigma and was used without further purification. Sodium dihydrogen orthophosphate (0.01 M) from Sigma was used to prepare the supporting electrolyte, and its pH was adjusted to 7 using NaOH and was thoroughly deaerated by bubbling with Argon prior to the experiments. H2O2 (30% w/v solution) was purchased from Lach-Ner (Neratovice, Czech Republic), and was diluted. All solutions were prepared with deionized water.

2.2. Apparatus

The crystalline structure of the synthesized ZnO nanoparticles as well as the deposited ZnO layers were analyzed by X-ray diffraction (XRD) with a Bruker D8 advanced diffractometer (Bruker AXS GmbH, Karlsruhe, Germany) operated at 40 kV and 40 mA using CuKα radiation, with a scanning speed of 0.35 sec/step for 2θ in a range from 15° to 70°.
Morphology of the deposited ZnO layers was obtained by using scanning electron microscopy (SEM) and obtaining images with a Zeiss SUPRA 35VP instrument operated at 10 kV (Carl Zeiss SMT, Oberköchen, Germany). As a further proof of the quality of the ZnO layers obtained, the photoluminescence (PL) spectra were also recorded at room temperature with a Hitachi F2500 Fluorescence Spectrophotometer (Hitachi Ltd, Tokyo, Japan) from 350 to 600 nm at an excitation wavelength of 325 nm.
For the magnetoelastic resonance measurements, a microcontroller-controlled frequency generator drove a current amplifier connected to a single coil. The resulting alternating magnetic field induced elastic waves on the sensor due to its magnetoelastic properties, causing a mechanical vibration. When the frequency of this vibration matches with the natural frequency of the sensor, resonance occurs, and the maximum measured at that point is easily followed by our automated set-up. Extensive information about this can be found in a previous work of ours [28].
The detection experimental set-up was described in the Introduction and is shown in Figure 2. The glass vial is cylindrical with a height of 4.6 cm and a diameter of 2.3 cm. The electrochemical measurements were performed on an Autolab PGStat 101 Potentiostat (Metrohm Autolab, Utrecht, The Netherlands) with a conventional three-electrode system. The Metglas/ZnO/Hb was used as the working electrode, a platinum wire as a counter electrode, and a Ag/AgCl as a reference electrode. Simultaneously, magnetoelastic resonance detection was performed by using a magnetoelastic resonator made by Sentec which was driving a homemade coil (N = 24 turns, R = 0.6 Ω, L = 6.9 µH) which was wrapped around the glass vial.

3. Experimental

3.1. ZnO Nanoparticle Synthesis and Film Deposition

3.1.1. Synthesis of the ZnO Nanoparticles

The preparation of the ZnO nanoparticles for the seeding procedure has been performed by using all chemicals as analytical-grade reagents without further purification. This synthesis was carried out by following a standard hydrothermal procedure: 0.4 g of lithium hydroxide monohydrate [Li(OH)·H2O] was suspended in 100 mL absolute ethanol under magnetic stirring. This suspension was added into 50 mL ethanoic solution of zinc acetate dihydrate [Zn(CH3COO)2·H2O] 0.1 M, again under magnetic stirring. The obtained solution was then sealed in an autoclave reactor and kept at 100 °C for 3 h, followed by normal cooling down to room temperature. The obtained particles were centrifuged at 4000 rpm for 10 min, washed after resuspension in water, and centrifugation (those two last steps repeated three times) and finally dried at 80 °C. Afterwards and for the subsequent ZnO layer deposition, a suspension was prepared with 100 mg of those ZnO nanoparticles in ethanol under magnetic stirring and sonication.

3.1.2. ZnO Film Deposition onto the Magnetoelastic Resonant Platform

A commercial ribbon of Metglas 2826MB (Fe40Ni38Mo4B18) was used as the magnetoelastic resonant platform. Equal strips of 2 cm length were cut and cleaned in acetone for 15 min under sonication. For the ZnO layer deposition procedure, the Metglas strips were placed in a petri dish with the rough side facing upwards and 2 mL of the above-mentioned ZnO nanoparticle solution were added. Finally, the petri dish was left in the oven at 85 °C until all the solvent was totally evaporated, giving as a result the Metglas + ZnO layer product. This procedure was repeated several times for each sensor, and after each step the structure and morphology of the deposited product was analyzed. In addition, at each step, a measurement of the total mass and the resonance frequency of the composite strip was taken to determine the elastic modulus of the deposited ZnO thin-film, as it will be shown below.

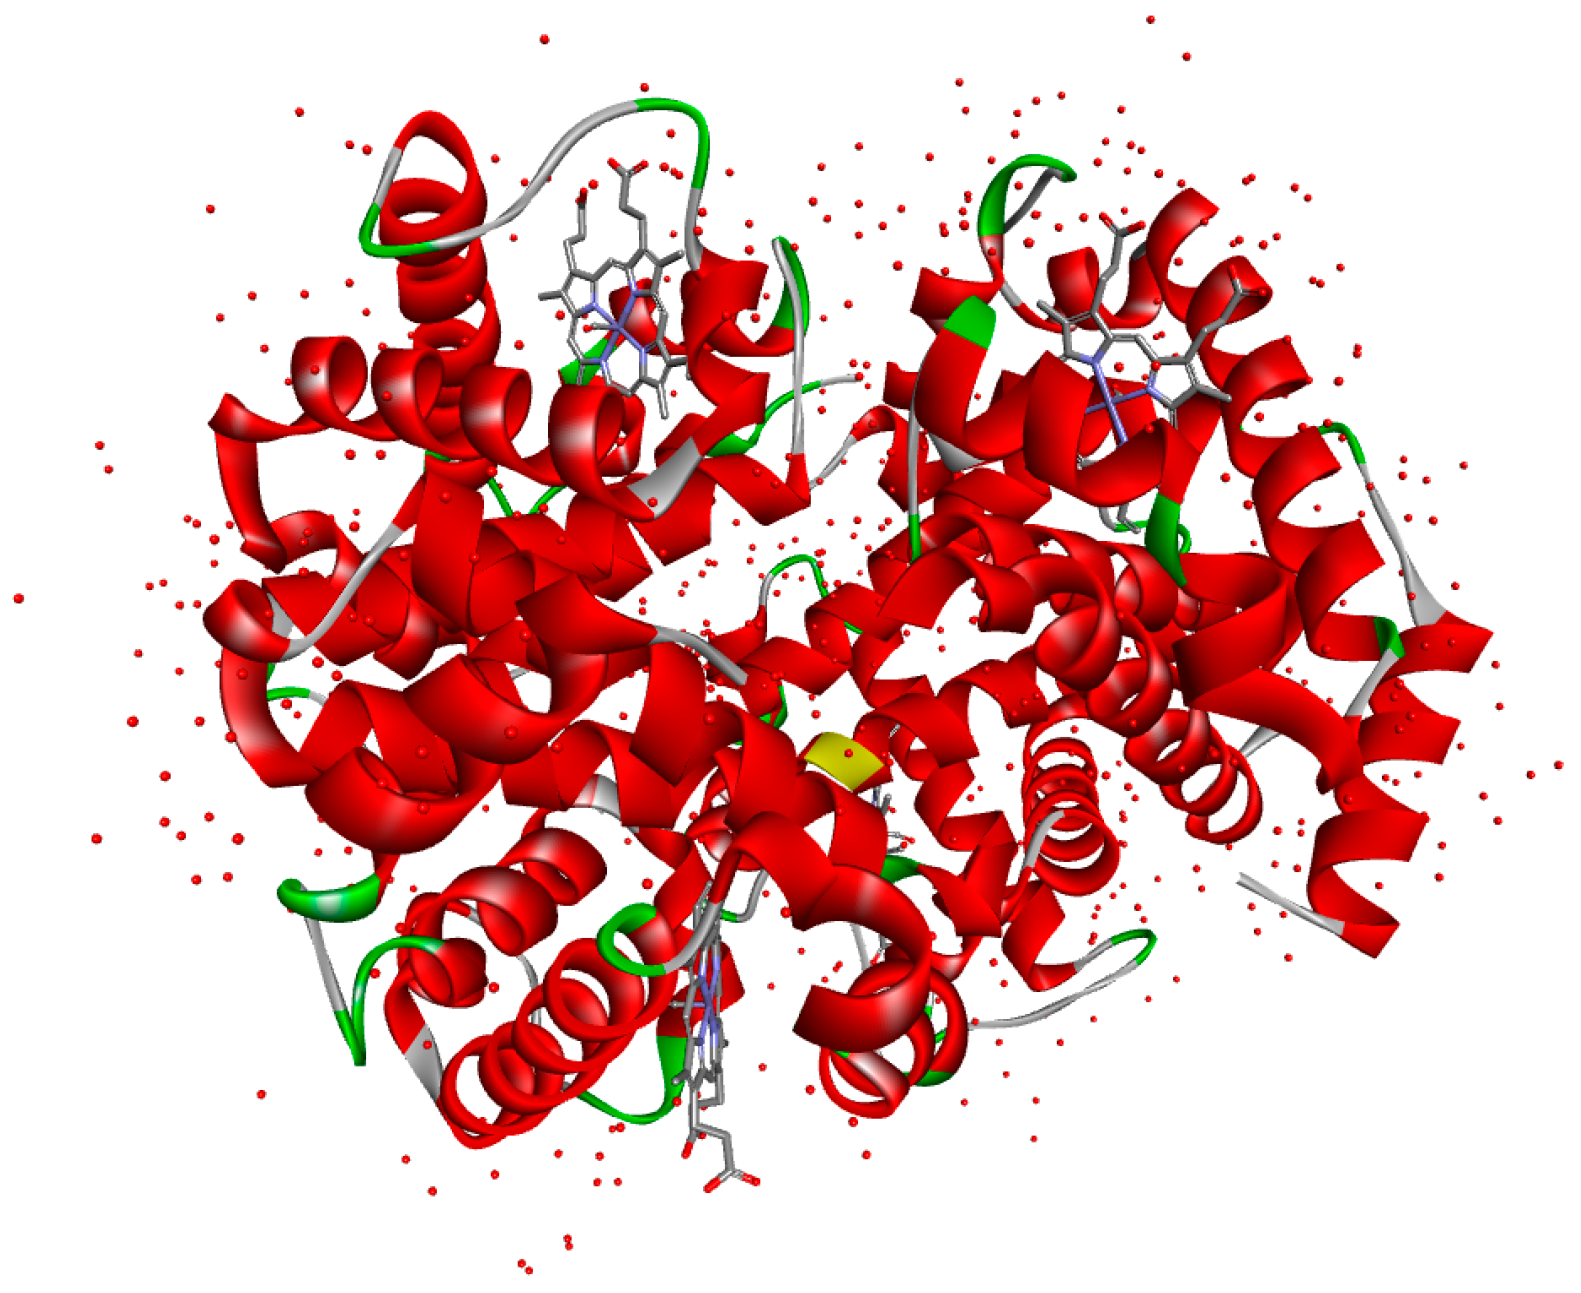
3.2. Hemoglobin Immobilization

The Metglas/ZnO/Hb electrode was fabricated following the procedure described above for the Metglas/ZnO film, plus the immobilization of Hb on its surface. For the Hb immobilization, a 20 μM Hb solution was prepared using 0.01 M Phosphate Buffer Solution (PBS), pH 7 and stored at 4 °C. Hb was deposited on the surface of the Metglas/ZnO by dropping 5 μL of Hb solution on the surface of the material and allowing it to dry at 30 °C for 30 min. Prior to all electrochemical measurements, the Metglas/ZnO/Hb electrode was rinsed with PBS to remove any non-immobilized Hb from its surface.

4. Results and Discussion

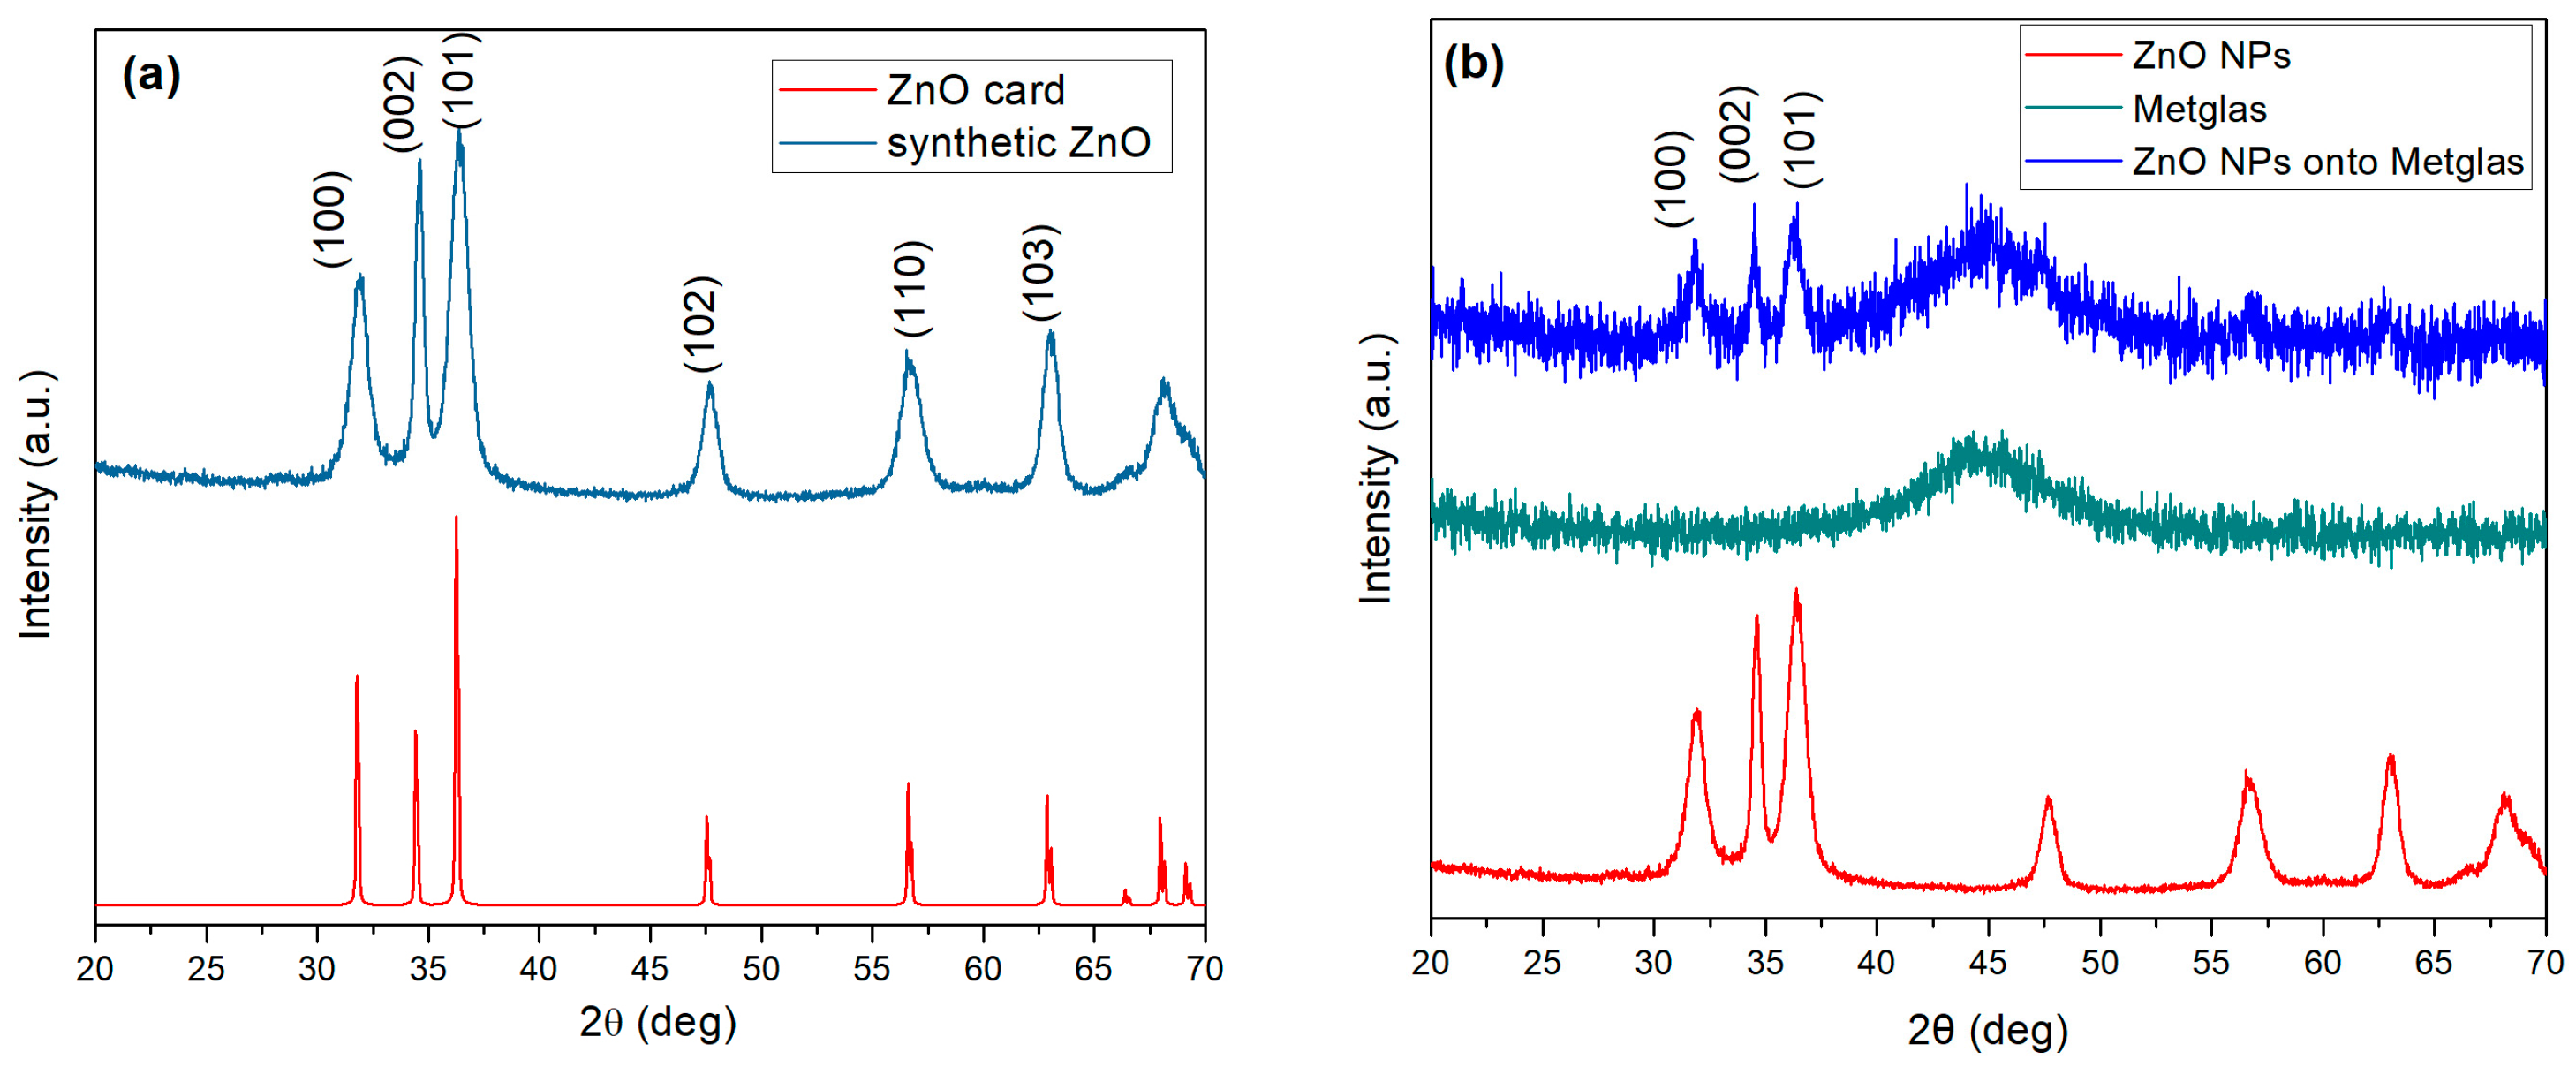
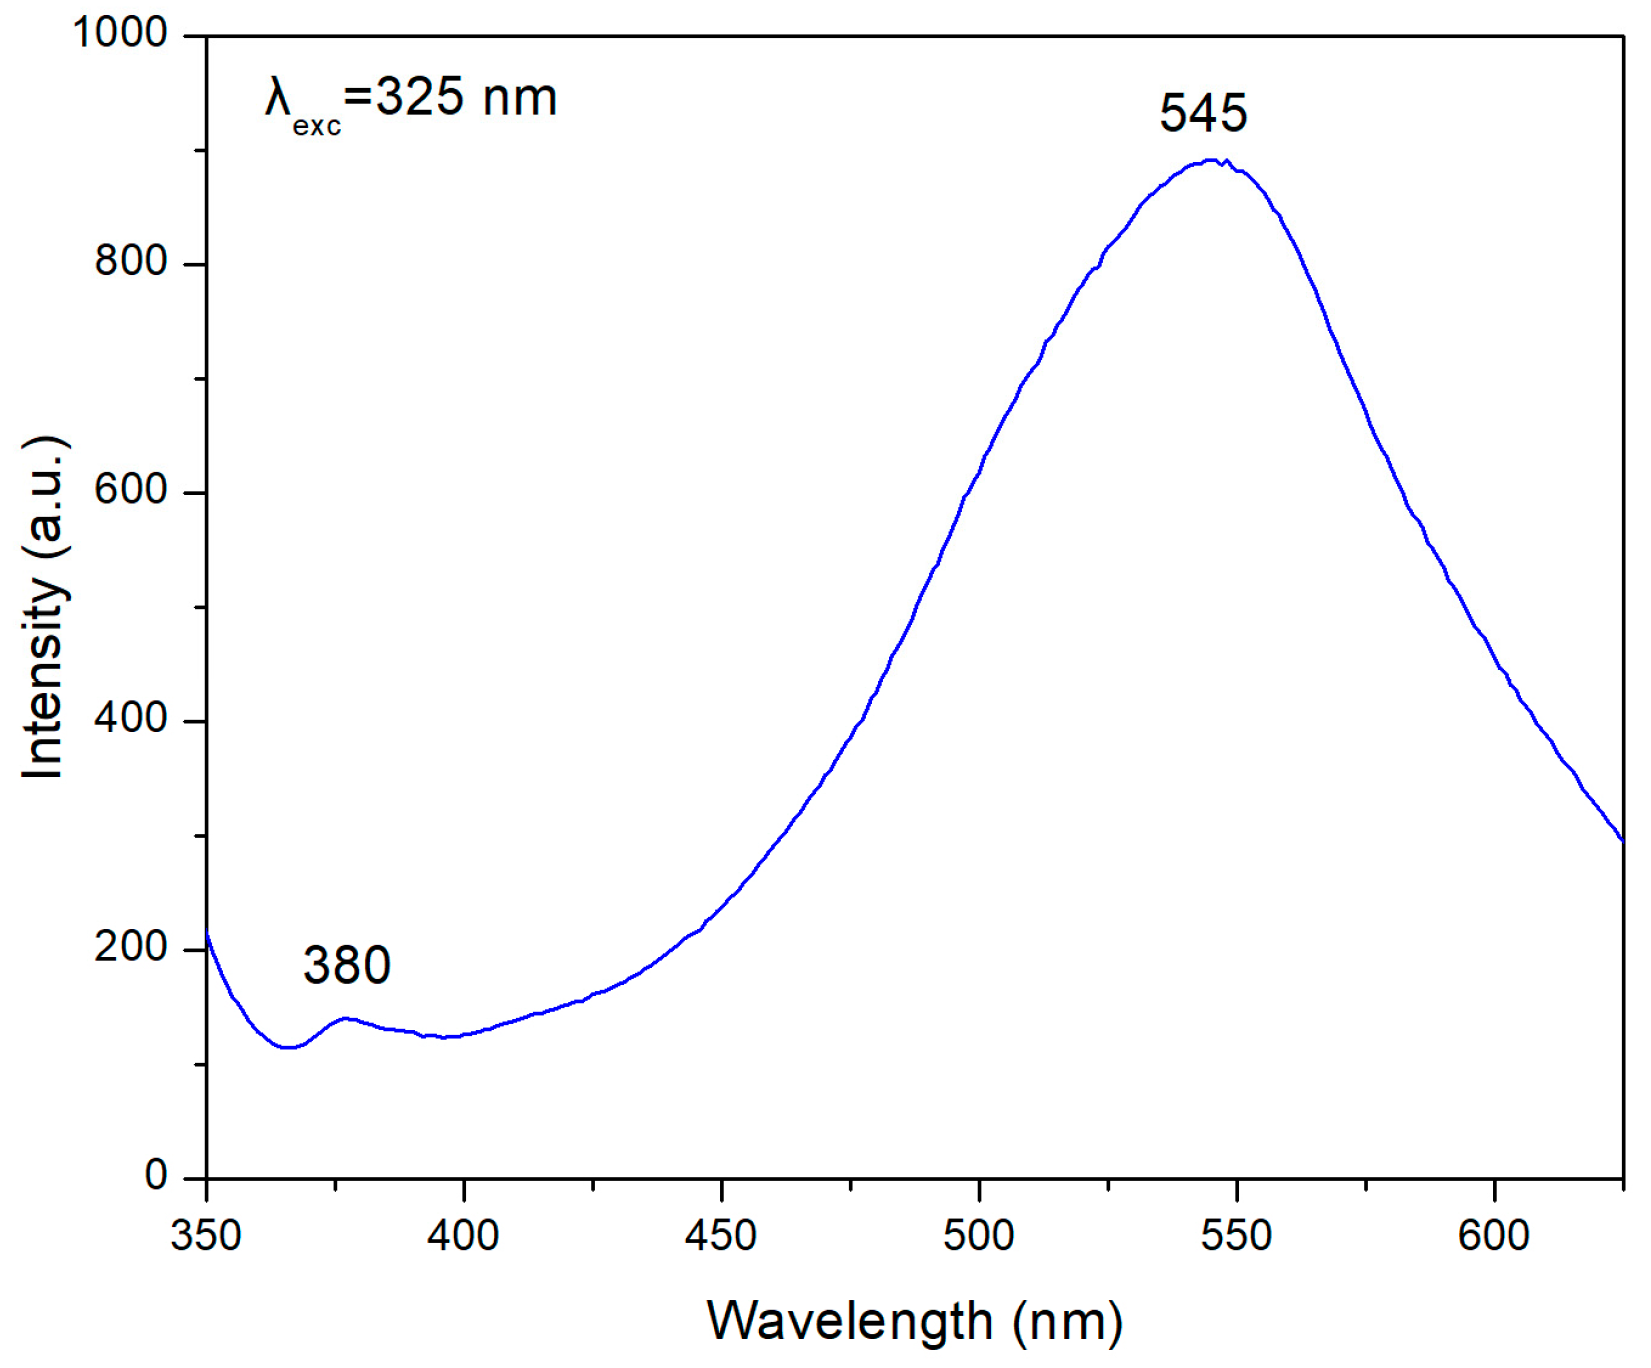
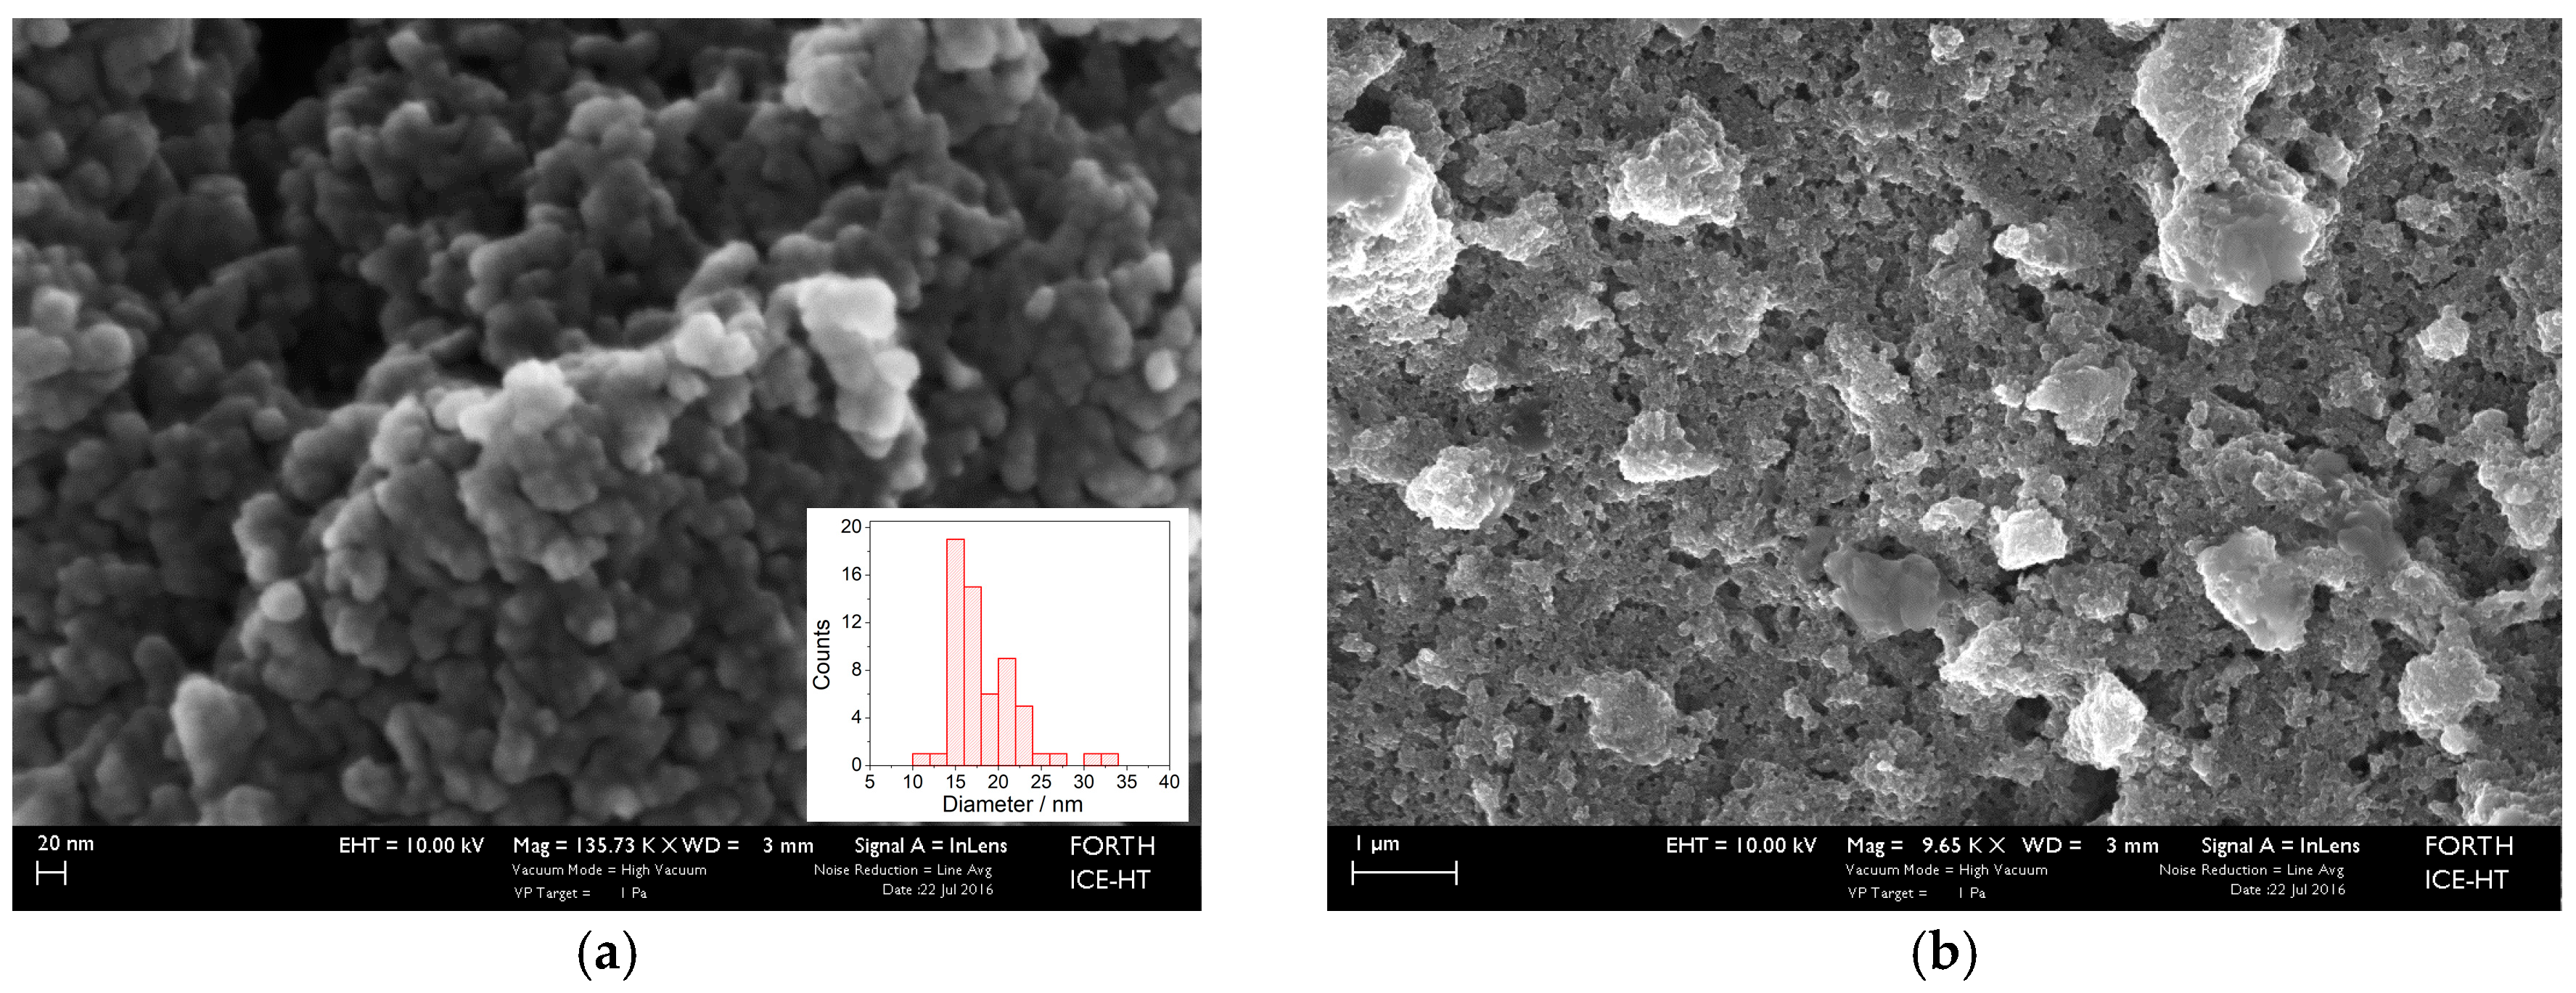
4.1. Characterization of ZnO Nanoparticles and Film

Figure 3a shows the XRD results for the synthetic ZnO nanoparticles. The measured diffraction pattern is compared to the standard JCPDS card for ZnO (No 36-1451) which corresponds to the wurtzite crystal No 36-1451 structure of ZnO. The observed experimental peaks are fitted to the standard card values corresponding to the ZnO reflections from (100), (002), (101), (102), (110) and (103) planes.
The average particle size was estimated using the Scherrer’s formula:
d = k · λ β · c o s θ
where d is the average crystallite size, k is the Scherrer constant taken equal to 0.9. λ is the wavelength of the X-ray radiation, β is the full width at half-maximum and θ is the diffraction angle. It was found that the average particle size is 9.0, 20.7 and 9.3 nm corresponding to the (100), (002) and (101) diffraction lines, respectively.
Figure 3b shows the different XRD patterns observed for the ZnO nanoparticles, the Metglas substrate and the same substrate with the ZnO nanoparticles deposited on it. The comparison of the three XRD patterns proves that no impurities were involved during the synthesis process, which confirms the purity of our obtained product. As the Metglas strip is an amorphous material, the XRD pattern gives a noisy and broad signal with a wide peak from 40° to 50°. While peak positions for ZnO nanoparticles and film are coincident (reflections (100), (002), and (101)), the intensity is much lower for this last one, which make us affirm that we have actually a quite thin film of ZnO nanoparticles deposited onto the Metglas strip. Further discussion about the thickness of the deposited film will be given in a following section.
The SEM micrographs in Figure 4 show the morphology of the ZnO layer onto the Metglas substrate. It can be seen that the particles are found as aggregates composed of individual nanoparticles of spherical shape (Figure 4a). The size of nanoparticles was measured using the ImageJ software (National Institutes of Health, Bethesda, USA). The size ranged from 11 to 32 nm with a mean value of 18.3 ± 4.0 nm. The deposited ZnO layer covers entirely the surface of the metallic ribbon (Figure 4b).
Figure 5 shows photoluminescence spectra of the ZnO layer. A small peak appears at 380 nm, which can be attributed to the near band edge emission, arising from the recombination of free excitons. However, the spectrum is dominated by a broad band with a maximum around λmax = 545 nm (2.32 eV) which is known as green emission and has a full width at half maximum of ΔE1/2 = 330 meV.
Previous works [30,31] have shown that the green luminescence is caused by electronic transitions between shallow donors and deep acceptors (VZn), or transitions from the conduction band to VZn-levels. That is, the maximum of the green luminescence band located at 2.35 ± 0.05 eV corresponds to the case of zinc vacancies being responsible for the observed luminescence. Since the synthesis of our ZnO nanoparticles and subsequent films occurs in air atmosphere, there is an excess of oxygen, which probably causes zinc vacancies in the ZnO structure [32].

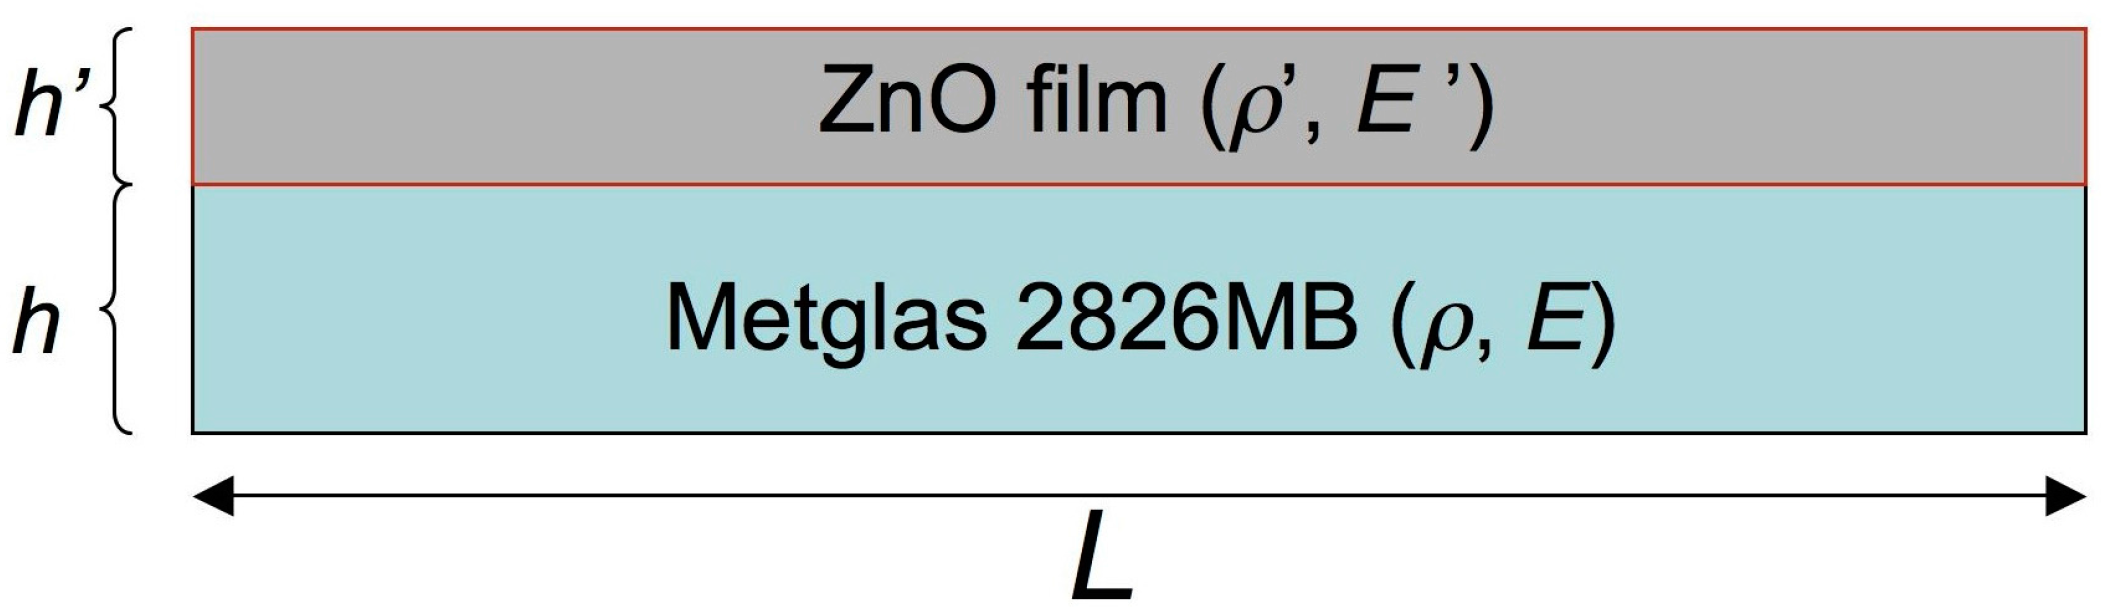
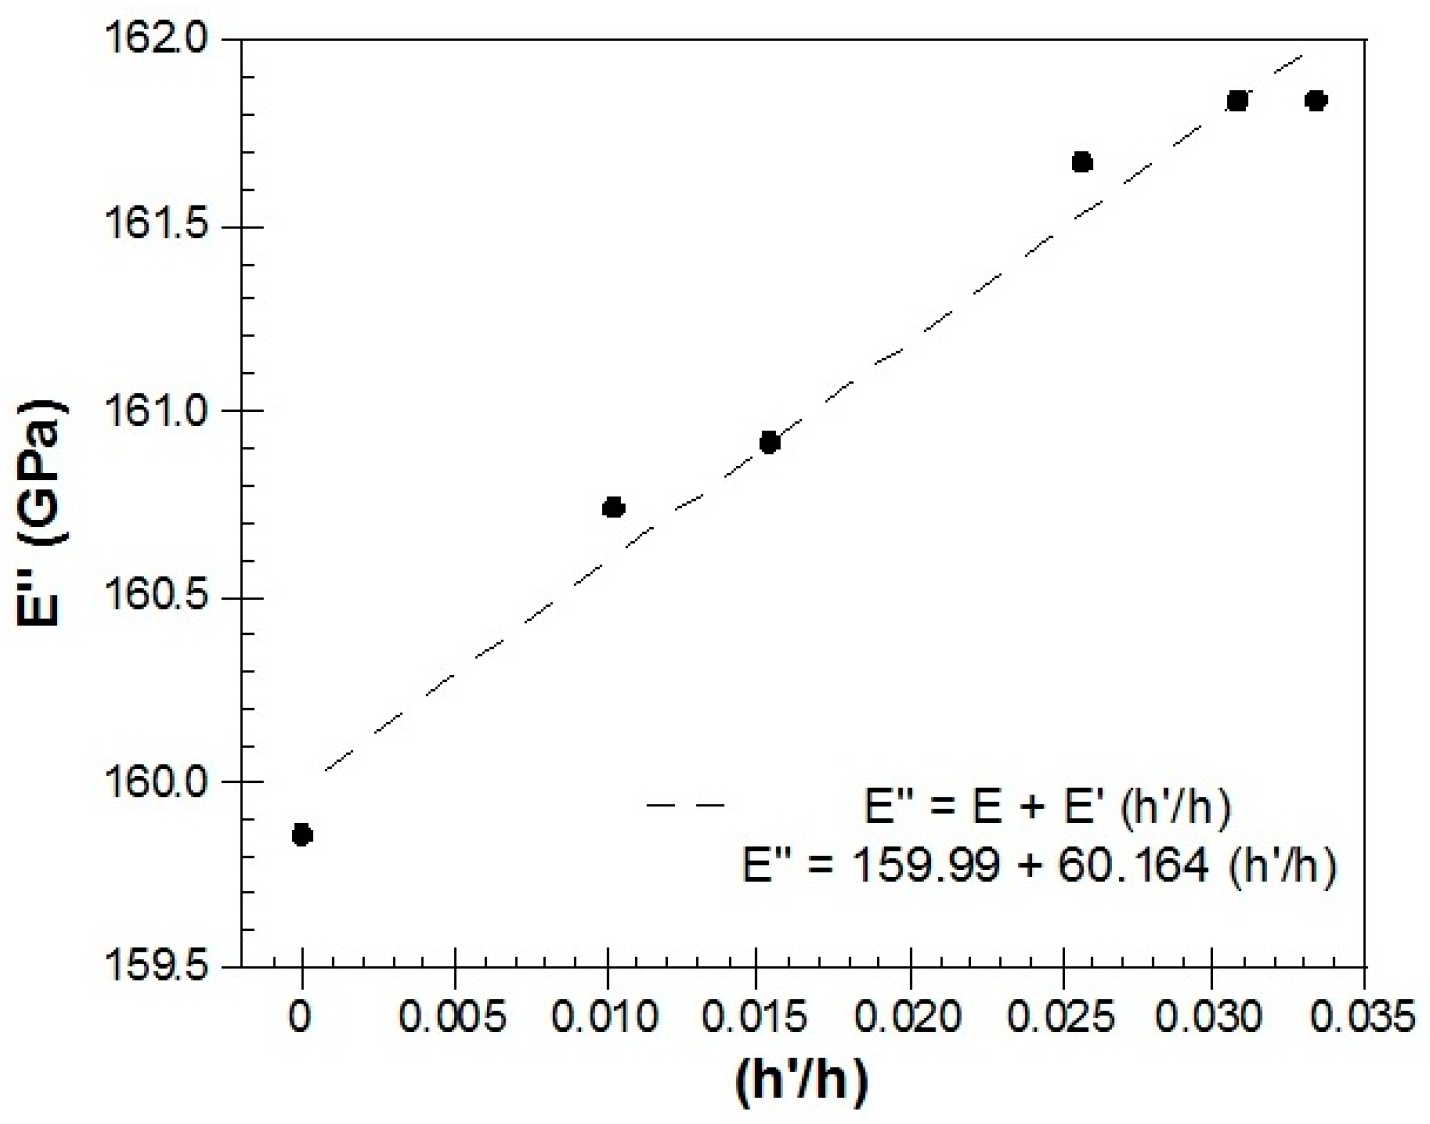
4.2. ZnO Deposited Film Elastic Modulus Determination

In this section, we will show that it is possible to determine the elastic Young's modulus of the deposited ZnO film onto the Metglas substrate, following a method that has been described in detail previously [33,34]. The knowledge of the elastic parameters of such a thin film turns out to be of great importance in the design and fabrication of sensing devices that use this kind of material. The usual technique of the uniaxial tensile testing to measure Young’s modulus of bulk materials is almost impossible to apply when dealing with thin films and nanoscales, where manipulation of the material and application of the force and accurate measurement of the displacement is extremely difficult. Thus, the possibility to perform in situ experiments at the nanoscale becomes a necessary tool in order to obtain not only quantitative but also qualitative information about nanosized materials [35]. The fundamental resonance frequency of a single flat layer, stress free ribbon of length L, density ρ , and elastic Young modulus E is given by the well-known relationship [36,37]:
f R = 1 2 L E ρ
According to this method, when dealing with two layers, as in our case with the Metglas and ZnO layers shown schematically in Figure 6, the above formula needs to be modified to:
f R = 1 2 L E ρ = 1 2 L E + E h h ρ + ρ h h
where E = E + E ( h / h ) , ρ = ρ + ρ ( h / h ) , the un-primed parameters refer to the Metglas 2826MB strip alone and the primed parameters refer to the ZnO layer. As shown in the Figure 6, h and h are the thicknesses of the two layers.
According to the method, if a series of similar films with different thicknesses h can be synthesized, then a plot of the E parameter of the bilayer system (extracted numerically from the resonance frequency) versus h will be a straight line with a slope equal to the value of the Young's modulus E of the film. Additionally, the Young’s modulus E of the substrate layer can be extracted from the y -intercept. In our case, a thickness of h 30   µ m was measured for the Metglas 2826MB layer ( ρ = 7900   kg / m 3 ), while the thickness h of the ZnO layer was estimated assuming a uniform film, given its mass, dimensions and the (bulk) density value of ZnO ρ = 5606   kg / m 3 . For this purpose, six different and successive depositions of the ZnO solution were performed onto the Metglas strips, with the final one resulting to the thickest ZnO solid film of about 1 µm thickness. Figure 7 shows the obtained results and the corresponding linear fit for one of our resonant platforms. The good linearity reveals the validity of the aforementioned method. From the y -intercept, a Young’s modulus of 160 GPa is estimated for the bare Metglas strip, in good agreement with previous results [34]. From the slope, a Young’s modulus value of 60 GPa is calculated for the ZnO film (estimated error from mean Young’s modulus values about ±2%).
The Young’s modulus of bulk ZnO is ≈140 GPa, a value that is generally accepted and was calculated by Kobiakov [38] starting from elastic constants for ZnO crystal. The range of experimental values measured when dealing with ZnO at the nanoscale, is quite diverse depending not only on the geometry of the material but also on the experimental process used for its measurement (see, for example, Table 1 in [35]). Thus, for ZnO nanowires, Song et al. [39] gave a value of 29 GPa determined by AFM bending measurements and Desai et al. [40] obtained a value of 21 GPa measured by using a MEMS test-bed to perform uniaxial tensile experiments. On the other hand, Ji et al. [41] have reported values of Young’s modulus as high as 117 GPa and 232 GPa for ZnO nanowires with diameters of 100 nm and 30 nm, respectively, by studying the buckling of the nanowires with nanoindentation. For ZnO nanobelts, Bai et al. [42] gave a Young's modulus value of 50 GPa, and Wang obtained a value of 52 GPa [43], in both cases by measuring the dynamic response of the specimen in an alternating electrostatic field inside a TEM. Considering all the previously reported values, our observations agree most with those obtained for nanobelt shaped samples, and we can infer that our ~ 1   µ m thickness ZnO film on the Metglas 2826MB strip, behaves like a wide nanobelt with Young’s modulus of about 60 GPa.

4.3. Simultaneous Electrochemical and Magnetoelastic Detection of H2O2 Using a Metglas/ZnO/Hemoglobin Electrode-Sensor

Hb is an auto-oxidating protein where heme iron atoms easily oxidize from ferrous Fe (II) to ferric Fe (III) and reduce from Fe (III) to Fe (II). The reaction scheme for the electrochemical reduction and oxidation of Hb can be written as follows:
HbFe(III) + H+ + e ⇆ HbHFe(II)
An excellent and complete graphical representation of all involved reactions in this reduction and oxidation of Hb can be found in Figure 1 of [44]. It is well known that the Hb molecule can catalyze the reduction of H2O2 [1,2,5,6,7,44] and accordingly Hb has been extensively used to construct H2O2 biosensors. As shown in Figure 8, the enzymatic reaction mechanism can be described as follows [45,46,47]:
2HbHFe(II) + H2O2 + 2H+ → 2HbFe(III) + 2H2O

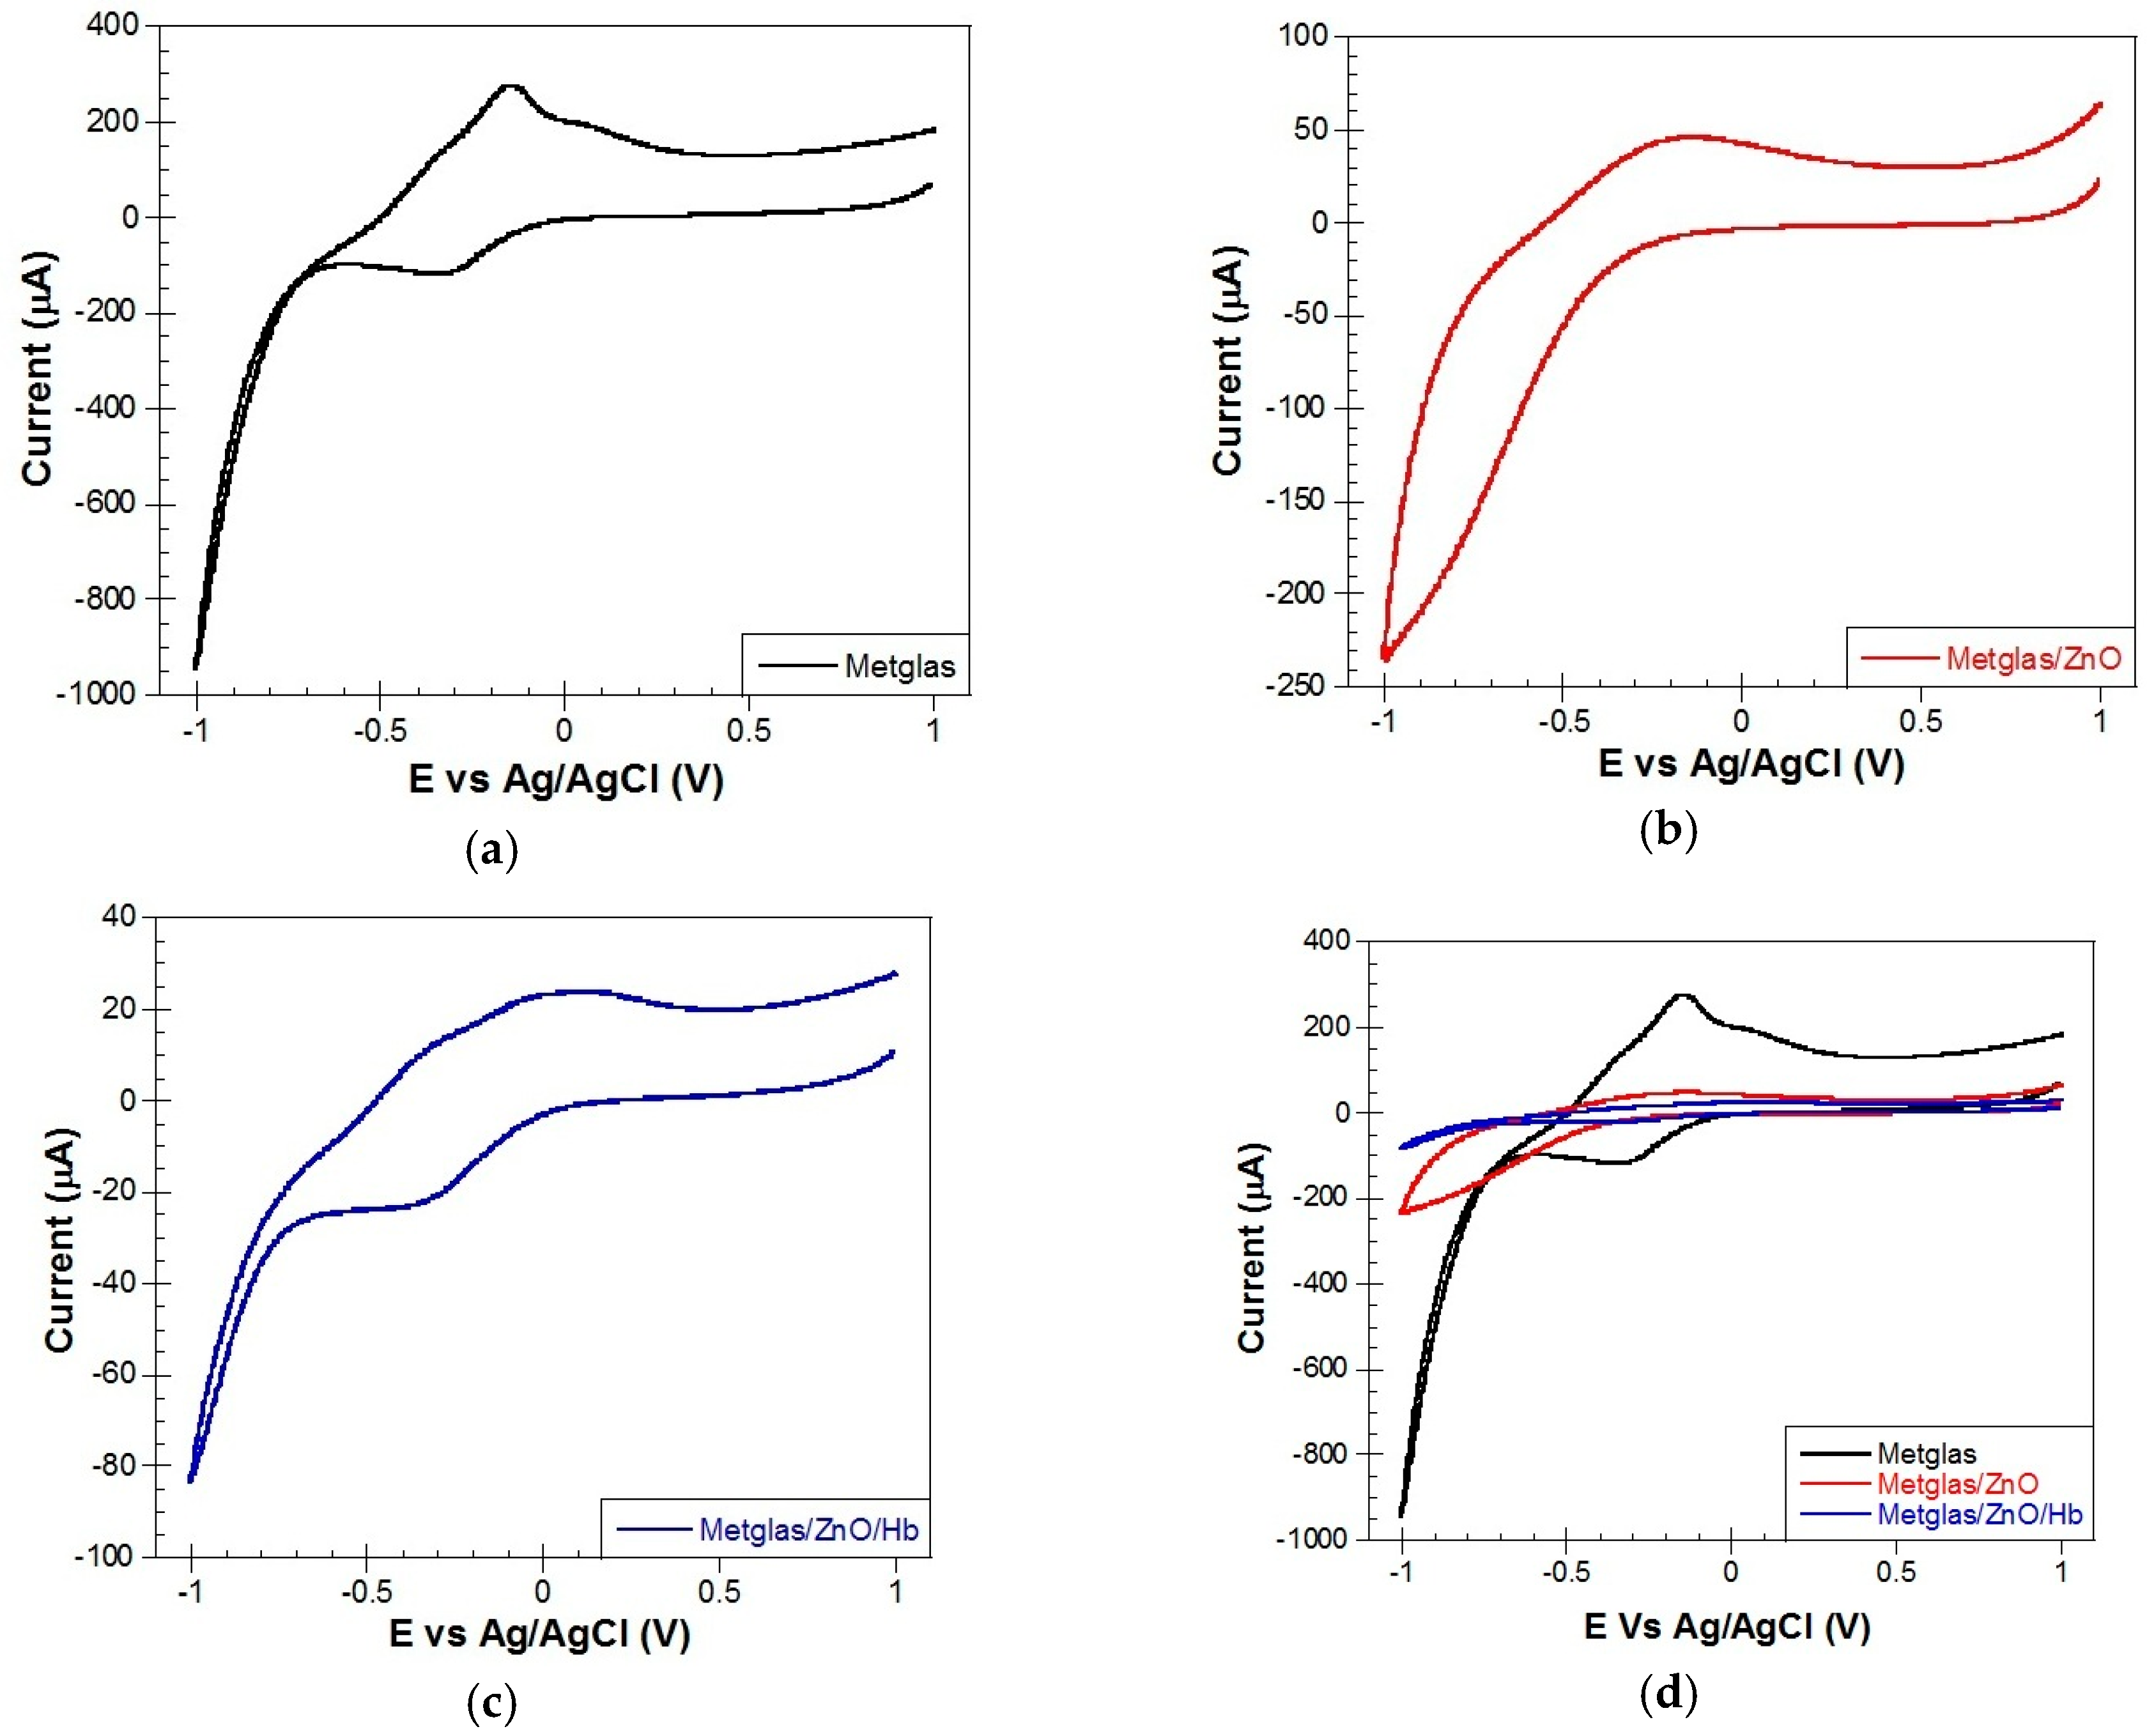
4.3.1. Electrochemical Behavior of Metglas, Metglas/ZnO, Metglas/ZnO/Hb Film Electrodes

When using CV, the potential is scanned from a certain initial voltage to a certain final potential to charge the capacitor and again scanned back in the reverse direction in order to discharge it. This allows the tracking of the electrochemical properties of the modified electrodes. The resulting current is plotted against the applied potential with respect to a reference electrode. The CV curve of an electric double layer capacitor (such as Metglas/ZnO) would be of a rectangular shape, in absence of a faradic reaction. In the presence of faradic redox reactions, the CV curve should exhibit peak currents, which are due to the effect of pseudo-capacitance exhibited by the electrode material.
All CV experiments were carried out in a Hb-free, 10 mM aqueous PBS electrolyte solution of pH 7 at room temperature. Figure 9 shows the CV curves of (a) Metglas 2826MB; (b) Metglas/ZnO and (c) Metglas/ZnO/Hb electrodes at a scan rate of 0.1 V/s.
The Metglas monolayer is exhibiting high peak redox currents, which are shown in the CV (Figure 9a). This Metglas is exhibiting a very interesting electrochemical behavior, seems likely to be a diffusion-controlled system with charge transfer phenomena in play. The Metglas film shows a characteristic reduction peak at −0.35 V and a (re)oxidation peak at −0.15 V in aqueous electrolyte solution. The voltage range is taken from −1 V to +1 V because in this range the Metglas electrode is effectively working without any breakdown. These peaks (reversible process) could be possibly due to the high content of iron in Metglas which is an amorphous metallic material and thus the iron atoms can occur in both oxidizing states Fe(II) and Fe(III), depending on their local neighborhood in the amorphous atomic framework. Thus, depending on the applied potential, iron can be oxidized and reduced easily. These peaks could be a sum of contribution of various oxidation processes of iron to form divalent or trivalent species [47]. In addition, the metallic Metglas gives back a greater and broader current when compared to the semiconducting Metglas/ZnO, due to its conducting nature.
The Metglas/ZnO film (Figure 9b) shows the characteristic charging/discharging currents assigned to electron injection into sub-band gap/conduction band states of the ZnO film. The charging of the ZnO film as seen in Figure 9b starts at −0.16 V, which is around the same value reported at previous studies in literature [48]. Over the potential range examined, for potentials more positive to −0.16 V, the ZnO is insulating and serves only as a support for the immobilization of biomolecules.
The CV of the Metglas/ZnO/Hb electrode in PBS solution is shown in Figure 9c. It was used to estimate the midpoint redox potential of the immobilized Hb. As the applied potential was ramped from 1.0 V to −1.0 V and reversed vs Ag/AgCl, the Metglas/ZnO/Hb electrode exhibits in addition to the film charging currents, nearly reversible, but not equivalent well-defined reduction (−0.35 V) and oxidation(+0.15 V) peaks. These peaks are assigned to Hb reduction Fe (II) and re-oxidation Fe (III). The Fe (III)/Fe (II) redox chemistry of heme is termed quasi-reversible as the peak-to-peak separation was > 60 mV and the peak oxidation current was typically much less than the reduction peak current [48]. These peaks are clearly absent from the CVs of the same electrode before the immobilization of Hb. It clearly demonstrates that the immobilized protein is electroactive and could be used for the sensing of H2O2.
Figure 9d shows all the above-mentioned different curves of the three electrodes, plotted together for direct comparison. It is evident in the plot that the metallic Metglas gives back a greater and broader current with respect to the other two electrodes.

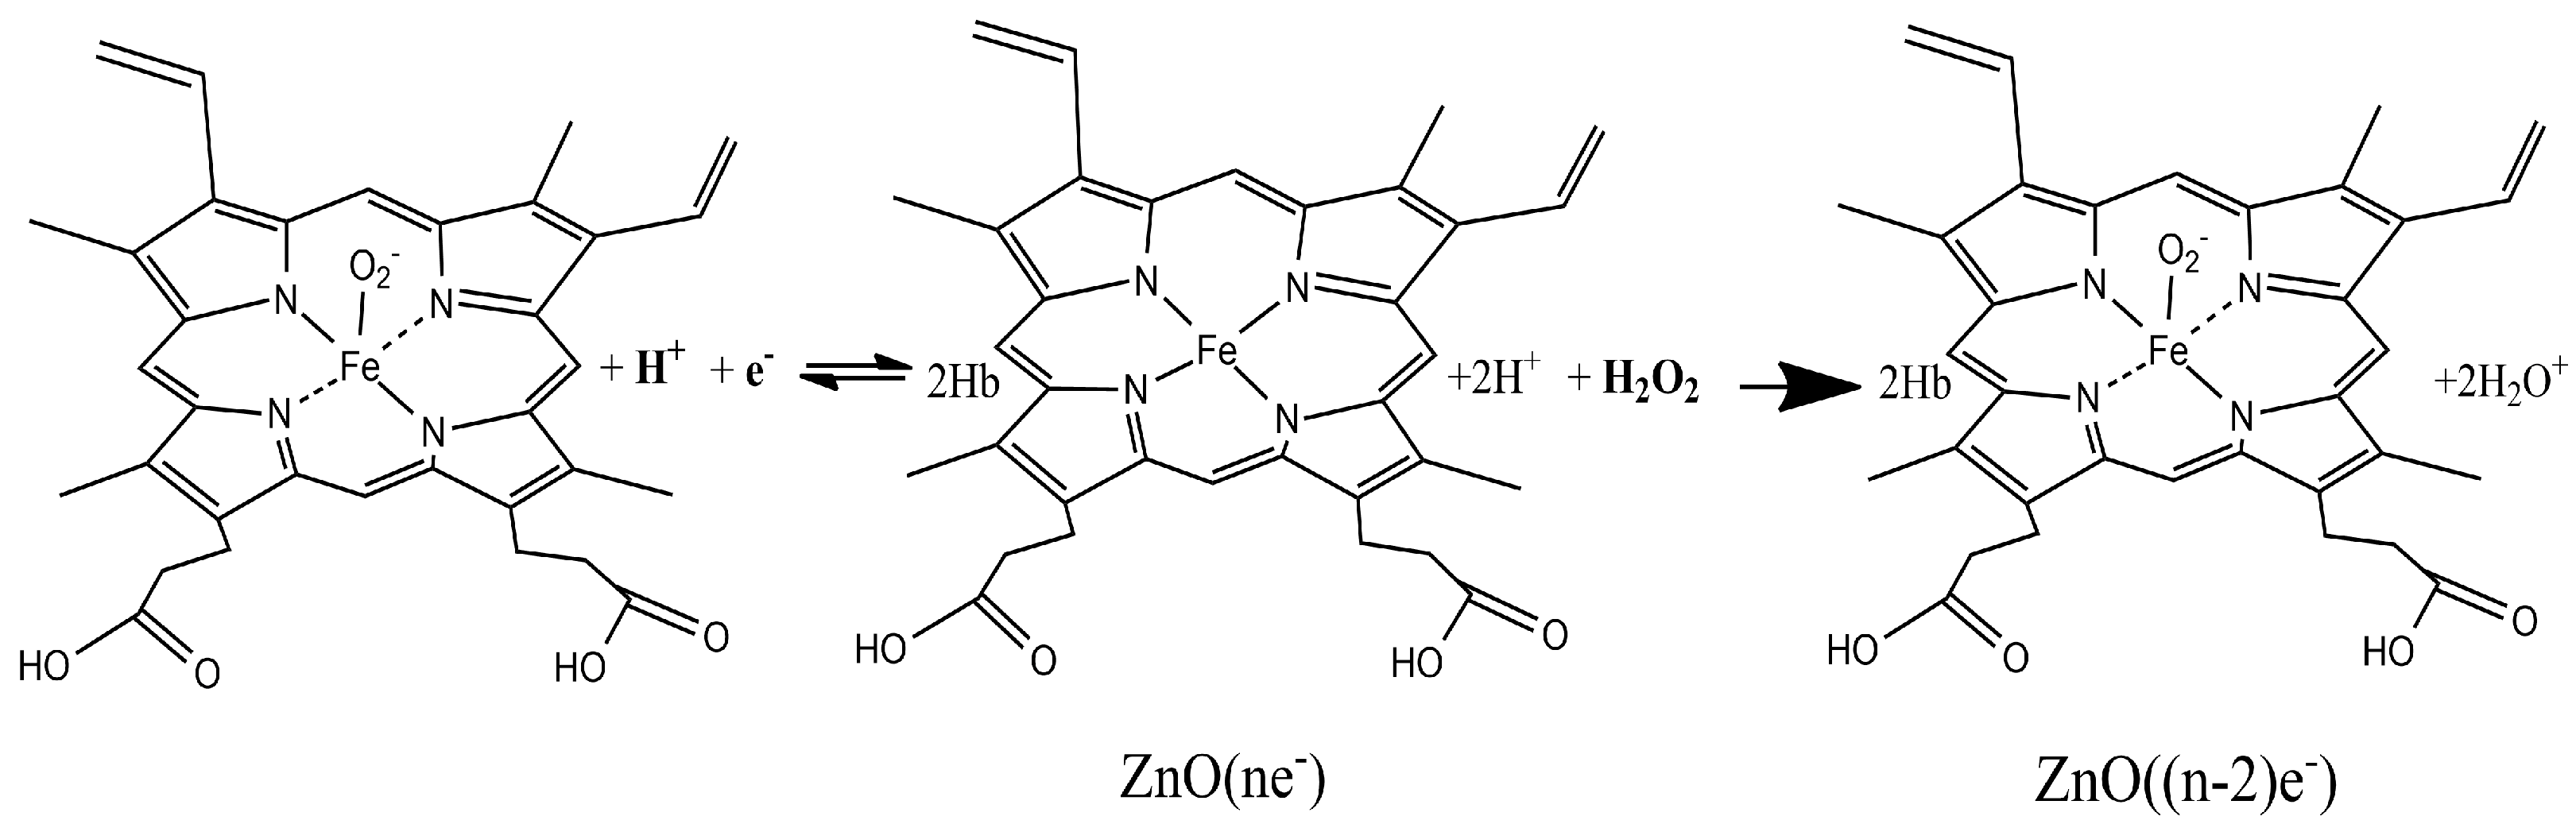
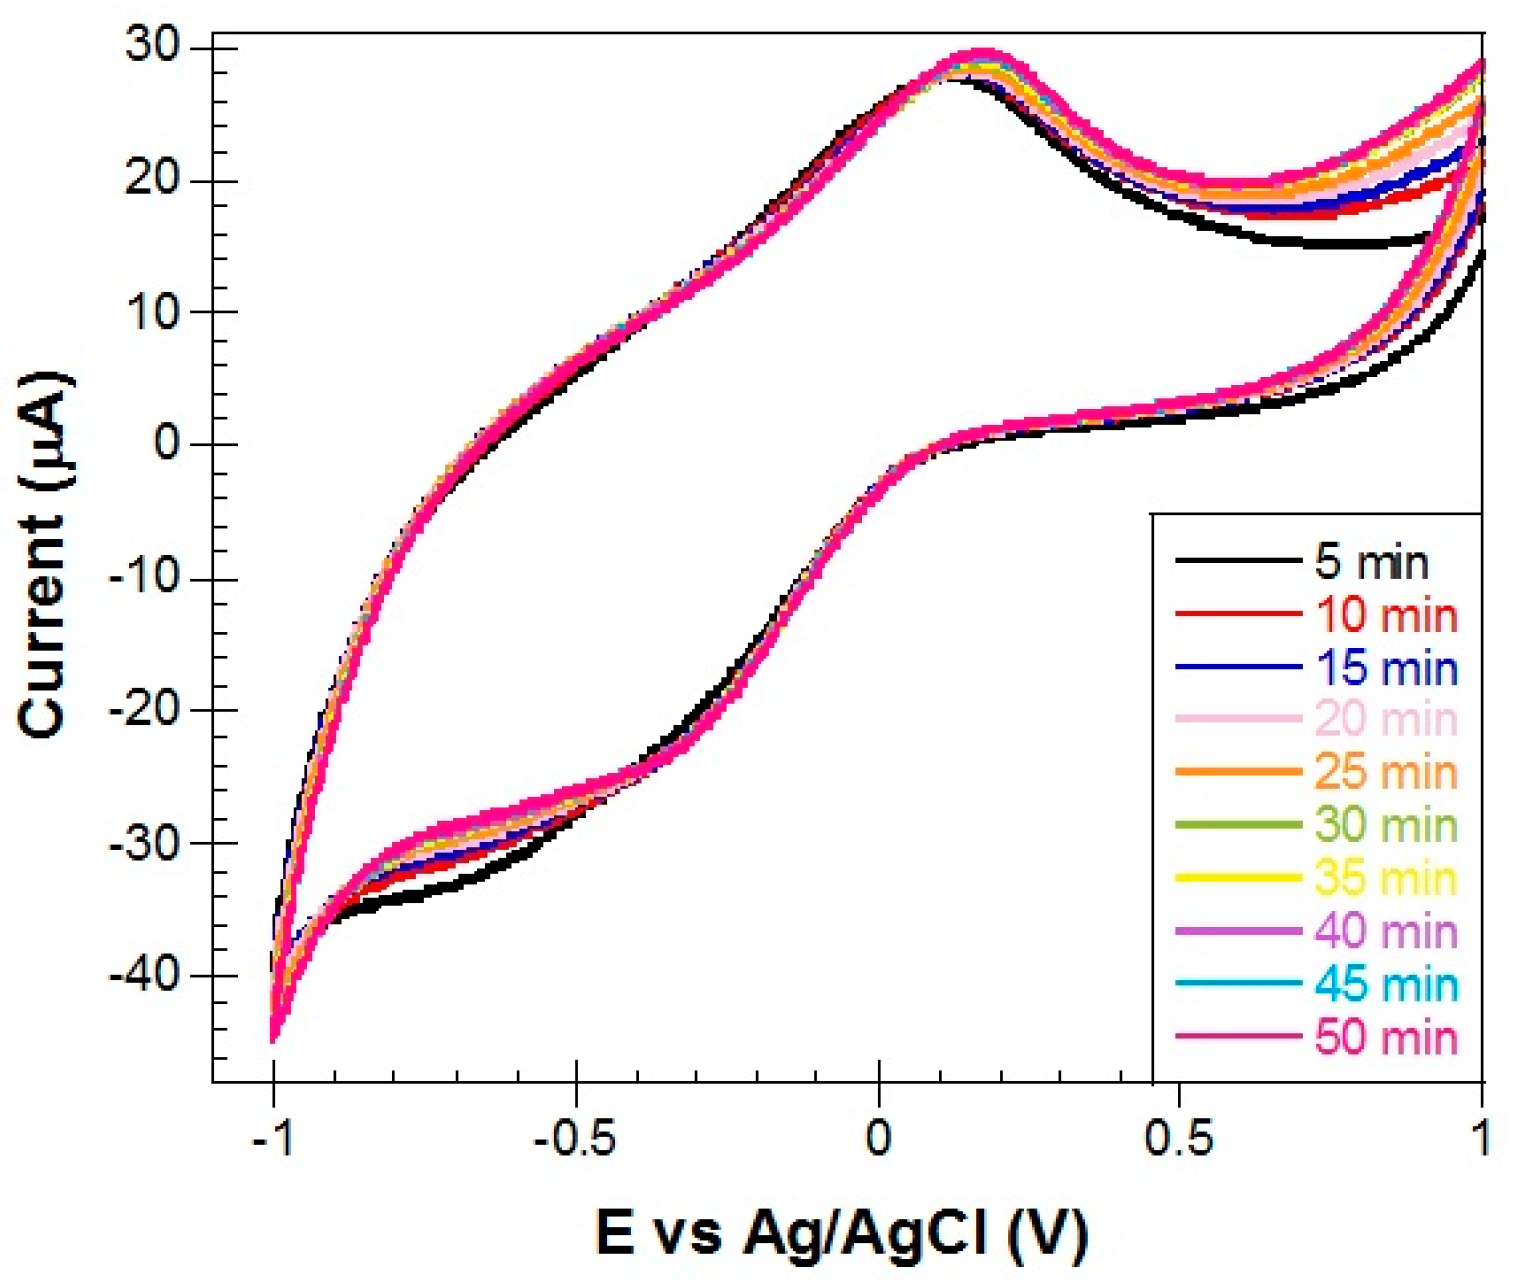
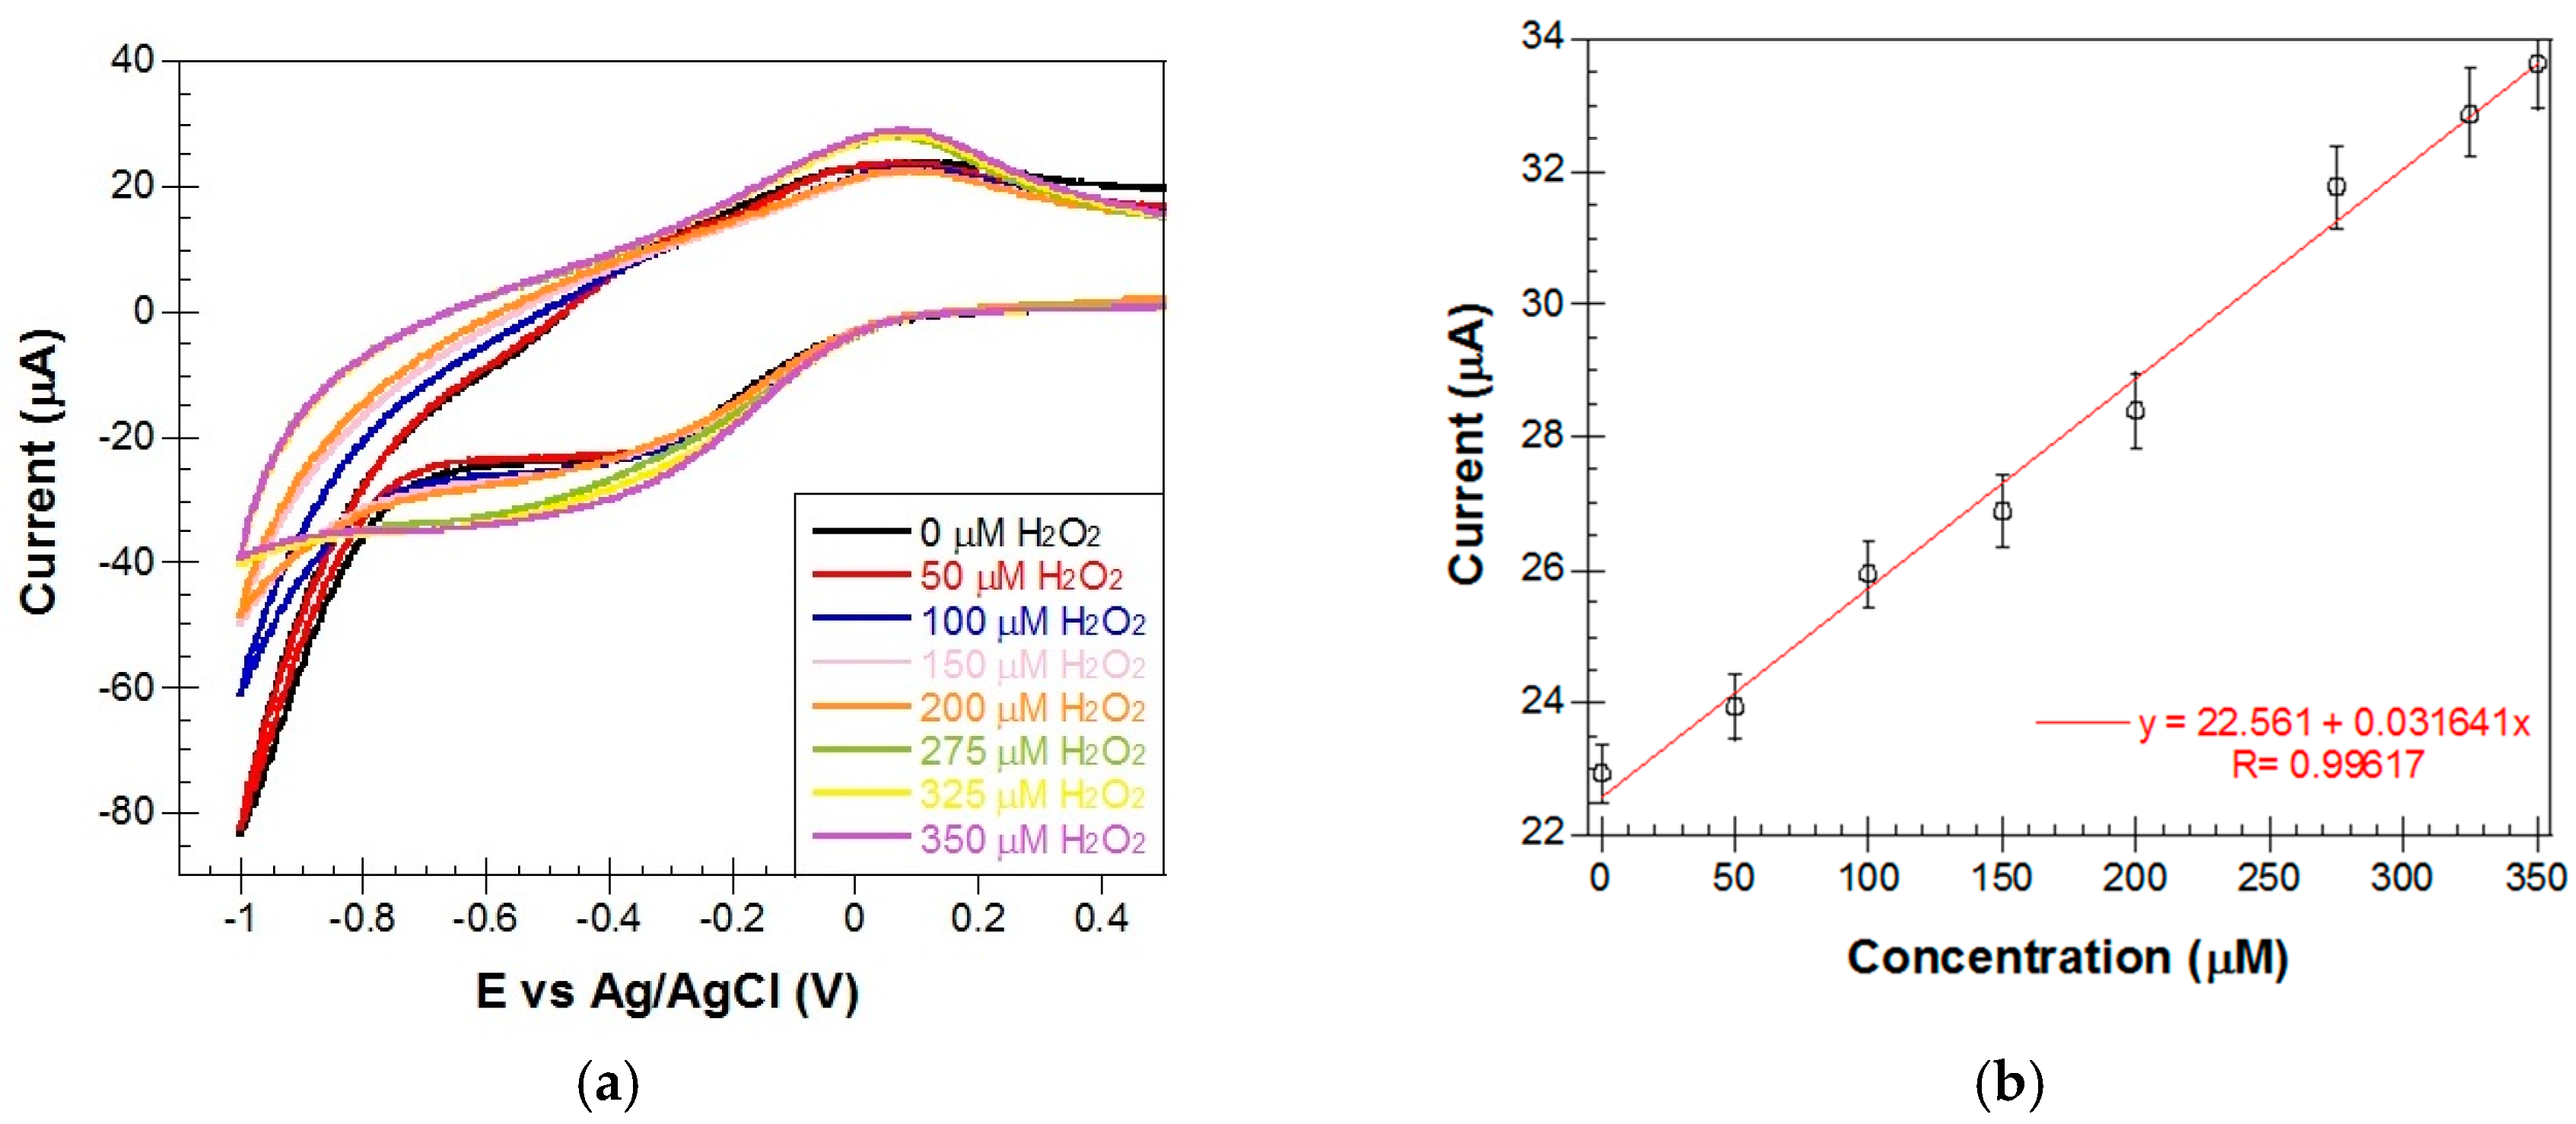
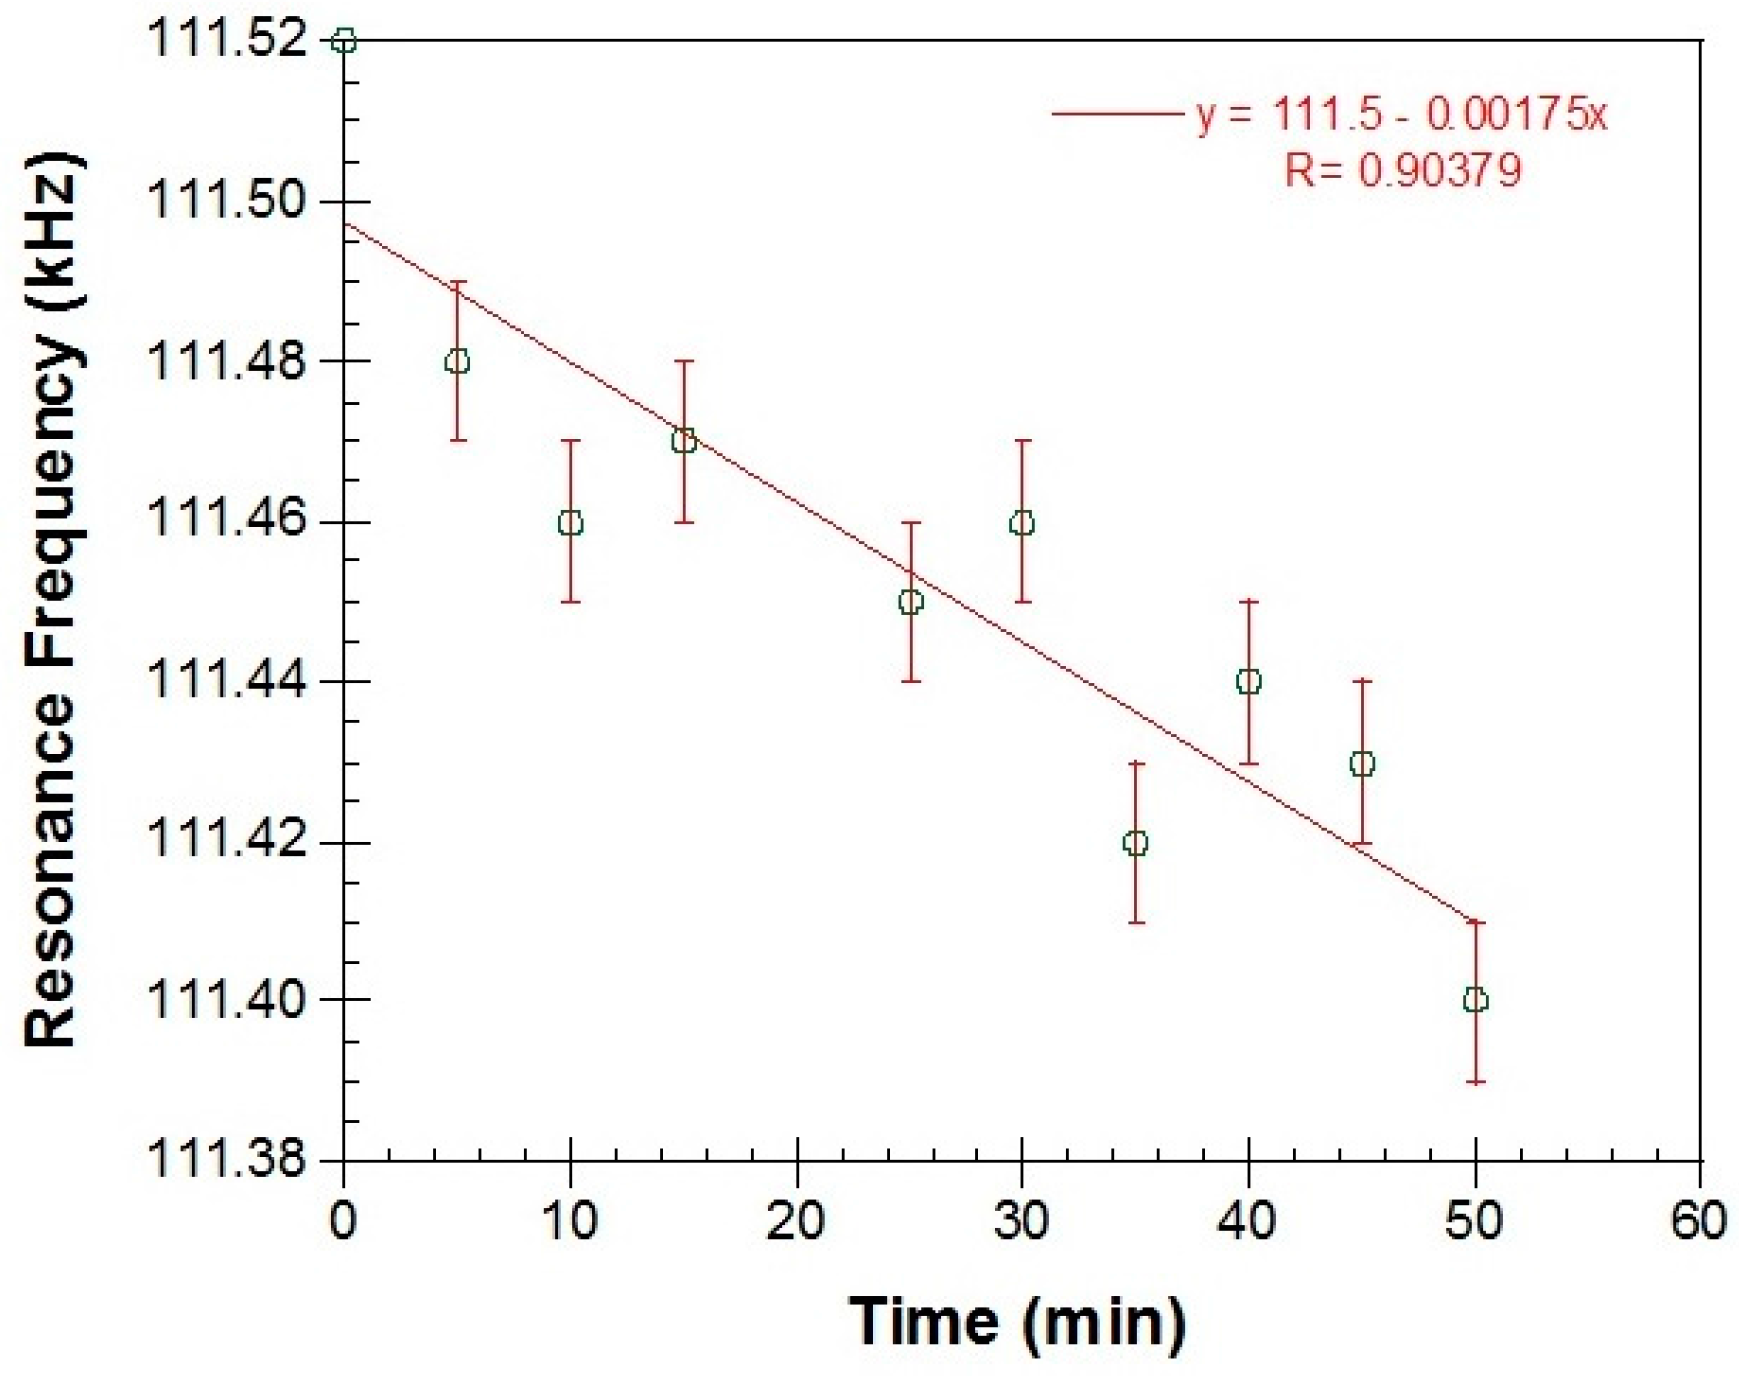
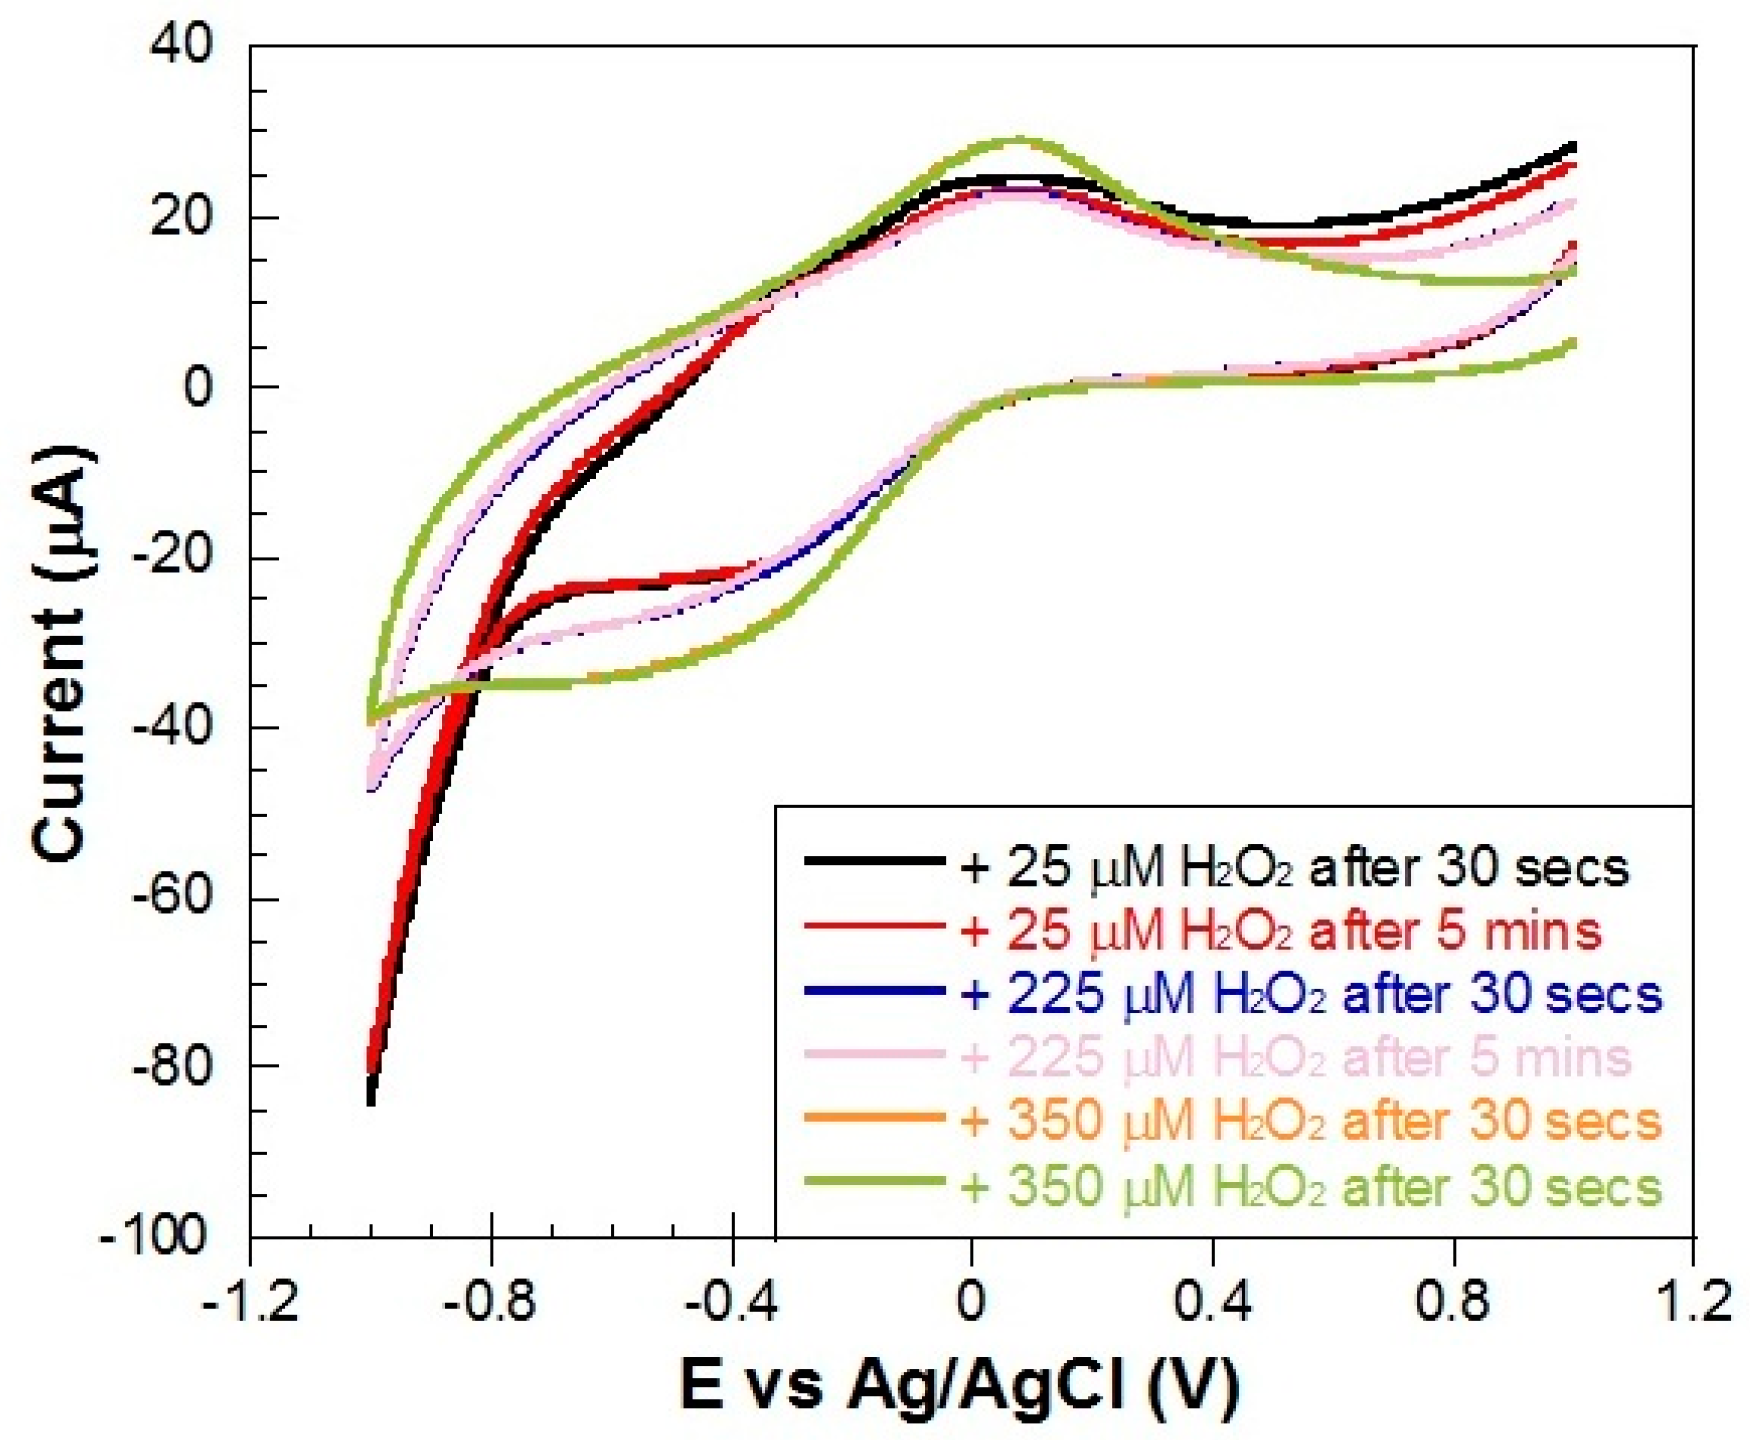
4.3.2. Simultaneous Electrochemical and Magnetoelastic Resonant Detection of H2O2

• Control curves for the two methods
To be certain that the detection signal which was obtained in our measurements (see next section) was due to the oxidation of immobilized Hb by H2O2, we performed control experiments without the presence of H2O2, in plain PBS solution. Shown in Figure 10 are the CV scans taken every 5 min in a total time period of 50 min. It is evident that there is no much activity during these 50 min as expected, except for a small initial 10–15 min transition to the final stable state. It is not clear to us what caused this transition but similar control experiments with bare Metglas strips in PBS solution did not show such a behavior (the signal was stable within some noise). In subsequent measurements, the system was given enough time in the stable state of Figure 11b before H2O2 was added in PBS and no transition states were observed. From long-term stability data, we know that the detection limit of our magnetoelastic resonator is ± 0.01   kHz , as shown by the error bars in Figure 11b.
Shown in Figure 11 are the magnetoelastic resonance measurements. Figure 11a is a typical resonance signal (amplified coil voltage in mV) which is received when the Metglas/ZnO/Hb electrode is immersed in the PBS solution. The continuous line is a Gaussian fit to the data and the resonance frequency is extracted by the x-value at the peak. In Figure 11b, different resonance frequencies are received for different times with the Metglas/ZnO/Hb electrode immersed in PBS solution, in the absence of H2O2. It is clear that the curve is quite flat with an error of about 0.02 kHz.
• Performance in the detection of H2O2
To test the electrochemical reaction between Hb and H2O2, we added successively in the cell where the Metglas/ZnO/Hb electrode was immersed in PBS buffer, 5 μL aliquots of 30 µM H2O2 solution each time to increase the H2O2 concentration by 25 μM at each step. Each amount was added at time intervals of 5 min and CV scans were obtained right afterwards (30 seconds) and shortly before the end of the interval (5 min). CV scans at 50 μM step additions of H2O2 are shown in Figure 12a. This plot reveals an intense electrochemical activity (electrocatalytic responses), as expected, since it is well known that Hb can catalyze the reduction of H2O2 [1,2,44]. Hb was immobilized in the mesopores of the ZnO film in a stable and functional way and was able to interact with the semi-conducing substrate as well as the aqueous electrolyte solution. When the H2O2 molecules were added to the electrolyte solution in the cell, they could easily enter the mesopores of the ZnO film, interacted there with the immobilized molecules of Hb and were reduced by the four bound iron atoms on each of the heme molecules of Hb. In Figure 12a these interactions between the immobilized Hb and the added H2O2 are displayed by the gradual increase of the current peaks and their gradual shift to the right (to less negative biases) Figure 12b shows the peak current versus the H2O2 concentration with a good linear correlation (R = 0.99). This plot proves that the CV method is not only sensitive enough to detect the electrochemical changes that take place between Hb and H2O2 but also that the corresponding signals produce a linear calibration plot that could be used as a H2O2 biosensor.
For comparison, the peak current of these curves, is plotted in Figure 13 as solid circles, together with the corresponding signal (solid triangles), which is received when H2O2 is added in the solution. The control experiment produces a flat response with a small error of about 0.5 μA and it is obvious that the changes brought up by the electrochemical reaction of H2O2 with the Hb, produce a big enough sensing signal of about 8 μA in variation, much larger than the above error. Thus, CV method is a sensitive enough method to detect the electrochemical reactions caused by the addition of H2O2.
Shown in Figure 14 are the magnetoelastic data, which show that the resonance frequency of the sensor has a linear drop versus time as the H2O2 concentration increases. Additionally, the total change of 0.075 KHz is larger than the error of 0.02 kHz observed at the control experiment and thus the change should be related to the H2O2 concentration. As it was mentioned in the introduction, the magnetoelastic sensors are used as microbalances since the resonance frequency depends on the mass load. For the particular Metglas ribbon used, calibration with known small mass loads gives a calibration factor of −1.4 kHz/mg. From this factor and the maximum H2O2 concentration of 350 μM, we conclude that there was a corresponding mass increase on the sensor of 152 ng/μM, which is probably due to H2O2 adsorption in the mesopores of the ZnO film during the electrochemical reaction.
We have also tested if the time interval between the addition of H2O2 aliquots and the electrochemical detection has any influence in the sensing results. We have tested three different cases (three different concentrations of H2O2 and two different time intervals, 30 s and 5 min, after each addition of H2O2). The results are shown in Figure 15. Comparing the obtained CV scans at each time interval, it can be clearly seen that the detection happens instantly, so we can affirm that there is no time dependence in the electrochemical detection process.

5. Conclusions

For the first time, we have shown the fabrication of a simultaneous electrochemical magnetoelastic biosensor for studying Hb electrochemical behavior towards H2O2. To achieve this, we first succeeded in fabricating good quality ZnO nanoparticles, and depositing them as a film onto a magnetoelastic ribbon of Metglas 2826MB, which helped us determine the ZnO film Young’s modulus of about 60 GPa. Next, Hb molecules were deposited onto the surface of the Metglas/ZnO bilayer, thus making both a sensitive modified voltammetry electrode and a magnetoelastic biosensor. This way we were able to monitor the reaction of the immobilized protein with specific aliquots of H2O2 by using simultaneously cyclic voltammetry and magnetoelastic detection procedures, which reveal a mass increase of about 152 ng/μM, which is probably due to H2O2 adsorption in the mesopores of the ZnO film during the electrochemical reaction.

Acknowledgments

Ariane Sagasti wants to thank BCMaterials and the European Erasmus+ Program for financial support. A. Sagasti and J. Gutiérrez also would like to thank the financial support provided by the Basque Government under the MICRO4FAB (ELKARTEK program) and Research Groups IT711-13 projects.

Author Contributions

Nikolaos Bouropoulos, Dimitris Kouzoudis, Jon Gutiérrez and Emmanuel Topoglidis conceived and designed the experiments; Ariane Sagasti and Apostolos Panagiotopoulos performed the experiments; Nikolaos Bouropoulos, Dimitris Kouzoudis, Emmanuel Topoglidis, Apostolos Panagiotopoulos, Ariane Sagasti and Jon Gutiérrez analyzed the data; Nikolaos Bouropoulos, Dimitris Kouzoudis and Emmanuel Topoglidis contributed reagents/materials/analysis tools; Jon Gutiérrez, Ariane Sagasti, Dimitris Kouzoudis, Emmanuel Topoglidis and Nikolaos Bouropoulos wrote the paper.

Conflicts of Interest

The authors declare no conflict of interest.

References

  1. Duan, G.; Li, Y.; Wen, Y.; Ma, X.; Wang, Y.; Ji, J.; Wu, P.; Zhang, Z.; Yang, H. Direct electrochemistry and electrocatalysis of Hemoglobin/ZnO-Chitosan/nano-Au modified glassy carbon electrode. Electroanalysis 2008, 20, 2454–2459. [Google Scholar] [CrossRef]
  2. Rifkind, J.; Nagababu, E.; Ramasamy, S.; Ravi, L.B. Hemoglobin redox reactions and oxidative stress. Redox Rep. 2003, 8. [Google Scholar] [CrossRef] [PubMed]
  3. Liu, J.F.; Roussel, C.; Lagger, G.; Tacchini, P.; Girault, H.H. Antioxidant sensors based on DNA-modified electrodes. Anal. Chem. 2005, 77, 7687–7694. [Google Scholar] [CrossRef] [PubMed]
  4. Jing, Z.H.; Zhan, J.H. Fabrication and gas sensing properties of porous ZnO nanoplates. Adv. Mater. 2008, 20, 4547–4551. [Google Scholar] [CrossRef]
  5. Fang, X.; Bando, Y.; Liao, M.; Gautam, U.K.; Zhi, C.; Dierre, B.; Liu, B.; Zhai, T.; Sekiguchi, T.; Koide, Y.; et al. Single-crystalline ZnS nanobelts as ultraviolet-light sensors. Adv. Mater. 2009, 21, 2034–2039. [Google Scholar] [CrossRef]
  6. Wei, A.; Xu, C.X.; Sun, X.W.; Huang, W.; Lo, G.Q. Field emission from hydrothermally grown ZnO nanoinjectors. J. Display Technol. 2008, 4, 9–12. [Google Scholar]
  7. Wang, Z.L. Towards self-powered nanosystems: From nanogenerators to nanopiezotronics. Adv. Funct. Mater. 2008, 18, 3553–3567. [Google Scholar] [CrossRef]
  8. Qi, Q.; Zhang, T.; Liu, L.; Zheng, X.J.; Yu, Q.J.; Zeng, Y.; Yang, H.B. Selective acetone sensor based on dumbbell-like ZnO with rapid response and recovery. Sens. Actuators B 2008, 134, 166–170. [Google Scholar] [CrossRef]
  9. Solanki, P.R.; Kaushik, A.; Ansari, A.A.; Sumana, G.; Malhotra, B.D. Zinc oxide-chitosan nanobiocomposite for urea sensor. Appl. Phys. Lett. 2008, 93, 163903. [Google Scholar] [CrossRef]
  10. Zhang, Y.; Nayak, T.R.; Hong, H.; Cai, W. Biomedical applications of zinc oxide nanomaterials. Cur. Mol. Med. 2013, 13, 1633–1645. [Google Scholar] [CrossRef]
  11. Mirzaei, H.; Darroudi, M. Zinc oxide nanoparticles: Biological synthesis and biomedical applications. Ceram. Int. 2017, 43, 907–914. [Google Scholar] [CrossRef]
  12. Wei, A.; Pan, L.; Huang, W. Recent progress in the ZnO nanostructure-based sensors. Mater. Sci. Eng. B 2011, 176, 1409–1421. [Google Scholar] [CrossRef]
  13. Dar, G.N.; Umar, A.; Zaidi, S.A.; Baskoutas, S.; Hwang, S.W.; Abaker, M.; Al-Hajry, A.; Al-Sayari, S.A. Ultra-high sensitive ammonia chemical sensor based on ZnO nanopencils. Talanta 2012, 89, 155–161. [Google Scholar] [CrossRef] [PubMed]
  14. Mehta, S.K.; Singh, K.; Umar, A.; Chaudhary, G.R.; Singh, S. Ultra-high sensitive hydrazine chemical sensor based on low-temperature grown ZnO nanoparticles. Electrochim. Acta 2012, 69, 128–133. [Google Scholar] [CrossRef]
  15. Chrissanthopoulos, A.; Baskoutas, S.; Bouropoulos, N.; Dracopoulos, V.; Tasis, D.; Yannopoulos, S.N. Novel ZnO nanostructures grown on carbon nanotubes by thermal evaporation. Thin Solid Films 2007, 515, 8524–8528. [Google Scholar] [CrossRef]
  16. Baskoutas, S.; Giabouranis, P.; Yannopoulos, S.N.; Dracopoulos, V.; Toth, L.; Chrissanthopoulos, A.; Bouropoulos, N. Preparation of ZnO nanoparticles by thermal decomposition of zinc alginate. Thin Solid Films 2007, 515, 8461–8464. [Google Scholar] [CrossRef]
  17. Baruah, S.; Dutta, J. Hydrothermal growth of ZnO nanostructures. Sci. Technol. Adv. Mater. 2009, 10, 013001. [Google Scholar] [CrossRef] [PubMed]
  18. Morkoç, H.; Özgur, Ü. Chapter I: General properties of ZnO. In Zinc Oxide: Fundamentals, Materials and Device Technology; WILEY-VCH Verlag GmbH & Co.: Weinheim, Germany, 2009; pp. 1–76. [Google Scholar]
  19. Polarz, S.; Roy, A.; Lehmann, M.; Driess, M.; Kruis, F.E.; Hoffmann, A.; Zimmer, P. Structure–property–function relationships in nanoscale oxide sensors: A case study based on zinc oxide. Adv. Funct. Mater. 2007, 17, 1385–1391. [Google Scholar] [CrossRef]
  20. Chen, W.; Cai, S.; Ren, Q.Q.; Wen, W.; Zhao, Y.D. Recent advances in electrochemical sensing for hydrogen peroxide: A review. Analyst 2012, 137, 49–58. [Google Scholar] [CrossRef] [PubMed]
  21. Shamsipur, M.; Pashabadi, A.; Molaabasi, F. A novel electrochemical hydrogen peroxide biosensor based on hemoglobin capped gold nanoclusters-chitosan composite. RSC Adv. 2015, 5, 61725–61734. [Google Scholar] [CrossRef]
  22. Xu, Y.; Hu, C.; Hu, S. A hydrogen peroxide biosensor based on direct electrochemistry of hemoglobin in Hb-Ag sol films. Sens. Actuators B 2008, 130, 816–822. [Google Scholar] [CrossRef]
  23. Weissbluth, M. Hemoglobins (Cooperativity and Electronic Properties); Springer: Berlin/Heidelberg, Germany, 1974; ISBN 3-540-06582-2. [Google Scholar]
  24. Zhang, C.L.; Liu, M.C.; Li, P.; Xian, Y.Z.; Chang, Y.X.; Zhang, F.F.; Wang, X.L.; Jin, L.T. Fabrication of ZnO nanorods modified electrode and its application to the direct electrochemical determination of hemoglobin and cytochrome c. Chin. J. Chem. 2005, 23, 144–148. [Google Scholar] [CrossRef]
  25. Stoyanov, P.G.; Grimes, C.A. A remote query magnetostrictive viscosity sensor. Sens. Actuators A 2000, 80, 8–14. [Google Scholar] [CrossRef]
  26. Van der Burgt, C.M. Dynamical physical parameters of the magnetostrictive excitation of extensional and torsional vibrations in ferrites. Philips Res. Rep. 1953, 8, 91–132. [Google Scholar]
  27. Luborsky, F.E. Chapter 6: Amorphous ferromagnets. In Handbook of Magnetic Materials; North-Holland Publishing: Amsterdam, The Netherlands, 1980; ISBN 978-0-444-85311-0. [Google Scholar]
  28. Bouropoulos, N.; Kouzoudis, D.; Grimes, C. The real-time, in situ monitoring of calcium oxalate and brushite precipitation using magnetoelastic sensors. Sens. Actuators B 2005, 109, 227–232. [Google Scholar] [CrossRef]
  29. Topoglidis, E.; Astuti, Y.; Duriaux, F.; Gratzel, M.; Durrant, J.R. Direct electrochemistry and nitric oxide interaction of heme proteins adsorbed on nanocrystalline tin oxide electrodes. Langmuir 2003, 19, 6894–6900. [Google Scholar] [CrossRef]
  30. Reynolds, D.C.; Look, D.C.; Jogai, B. Fine structure on the green band in ZnO. J. Appl. Phys. 2001, 89, 6189–6191. [Google Scholar] [CrossRef]
  31. Chen, H.; Gu, S.; Tang, K.; Zhu, S.; Zhu, Z.; Ye, J.; Zhang, R.; Zheng, Y. Origins of green band emission in high-temperature annealed N-doped ZnO. J. Lumin. 2011, 131, 1189–1192. [Google Scholar] [CrossRef]
  32. Borseth, T.M.; Svenson, B.G.; Kuznetsov, A.Y.; Klason, P.; Zhao, Q.X.; Willander, M. Identification of oxygen and zinc vacancy optical signals in ZnO. Appl. Phys. Lett. 2006, 89, 262112. [Google Scholar] [CrossRef]
  33. Schmidt, S.; Grimes, C.A. Elastic modulus measurement of thin films coated onto magnetoelastic ribbons. IEEE Trans. Mag. 2001, 37, 2731–2733. [Google Scholar] [CrossRef]
  34. Baimpos, T.; Giannakopoulos, I.G.; Nikolakis, V.; Kouzoudis, D. Effect of gas adsorption on the elastic properties of faujasite films measured using magnetoelastic sensors. Chem. Mater. 2008, 20, 1470–1475. [Google Scholar] [CrossRef]
  35. Manoharan, M.P.; Desai, A.V.; Neely, G.; Haque, M.A. Synthesis and elastic characterization of zinc oxide nanowires. J. Nanomater. 2008, 1. [Google Scholar] [CrossRef]
  36. Landau, L.D.; Lifshitz, E.M. Theory of Elasticity. In A Course of Theoretical Physics, 2nd ed.; Pergamon Press: Oxford, UK, 1970. [Google Scholar]
  37. Livingston, J.D. Magnetomechanical properties of amorphous metals. Phys. Stat. Sol. A 1982, 70, 591–596. [Google Scholar] [CrossRef]
  38. Kobiakov, I.B. Elastic, piezoelectric and dielectric properties of ZnO and CdS single crystals in a wide range of temperatures. Solid State Commun. 1980, 35, 305–310. [Google Scholar] [CrossRef]
  39. Song, J.; Wang, X.; Riedo, E.; Wang, Z.L. Elastic property of vertically aligned nanowires. Nano Lett. 2005, 5, 1954–1958. [Google Scholar] [CrossRef] [PubMed]
  40. Desai, A.V.; Haque, M.A. Mechanical properties of ZnO nanowires. Sens. Actuators A 2007, 134, 169–176. [Google Scholar] [CrossRef]
  41. Ji, L.W.; Young, S.J.; Fang, T.H.; Liu, C.H. Buckling characterization of vertical ZnO nanowires using nanoindentation. Appl. Phys. Lett. 2007, 90, 033109. [Google Scholar] [CrossRef]
  42. Bai, X.D.; Gao, P.X.; Wang, Z.L.; Wang, E.G. Dual-mode mechanical resonance of individual ZnO nanobelts. Appl. Phys. Lett. 2003, 82, 4806–4808. [Google Scholar] [CrossRef]
  43. Wang, Z.L. Zinc oxide nanostructures: Growth, properties and applications. J. Phys. Condens. Matter 2004, 16, R829–R858. [Google Scholar] [CrossRef]
  44. Mollan, T.L.; Alayash, A.I. Redox reactions of Hemoglobin: Mechanism of toxicity and control. Antioxid. Redox Signal. 2013, 18, 2251–2253. [Google Scholar] [CrossRef] [PubMed]
  45. Gonga, C.; Shena, Y.; Chena, J.; Songa, Y.; Chena, S.; Songa, Y.; Wanga, L. Microperoxidase-11@PCN-333 (Al)/three-dimensional microporous carbon electrode for sensing hydrogen peroxide. Sens. Actuators B-Chem. 2017, 239, 890–897. [Google Scholar] [CrossRef]
  46. Topoglidis, E.; Cass, A.E.G.; O’Regan, B.; Durrant, J.R. Immobilization and bioelectrochemistry of proteins on nanoporous TiO2 and ZnO films. J. Electroanal. Chem. 2001, 517, 20–27. [Google Scholar] [CrossRef]
  47. Altube, A.; Pierna, A.R. Thermal and electrochemical properties of cobalt containing Finemet type alloys. Electrochem. Acta 2004, 49, 303–311. [Google Scholar] [CrossRef]
  48. Bard, A.J.; Faulkner, L.R. Electrochemical Methods Fundamentals and Applications, 2nd ed.; John Wiley & Sons: New York, NY, USA, 2001. [Google Scholar]
Figure 1. Ribbon diagram of Bovine Hemoglobin showing the position of the four hemes (blue) taken from the RCSB Protein Data Bank and plotted on BIOvia Discovery Studio Visualizer.
Materials 10 00849 g001
Figure 2. The detection experiment consisted of three electrodes, the sensor working electrode (WE), the Pt counter electrode (CE) and the Ag/AgCl reference electrode (RE), all immersed in a PBS buffer solution inside a glass vial on which a coil was wrapped externally.
Materials 10 00849 g002
Figure 3. XRD patterns: (a) Synthetic ZnO nanoparticles and the standard ZnO wurtzite structure; and (b) synthetic ZnO nanoparticles (NPs), a clean strip of Metglas and the ZnO coated Metglas strip.
Materials 10 00849 g003
Figure 4. SEM images: (a) high magnification showing individual ZnO nanocrystals; and (b) a surface view of the obtained ZnO layer, after six depositions. Insert in image (a) shows particle size distribution.
Materials 10 00849 g004
Figure 5. PL spectrum recorded by using an excitation wavelength at 325 nm over the ZnO film deposited onto the Metglas 2826MB strip.
Materials 10 00849 g005
Figure 6. Schematic representation of the Metglas 2826MB and ZnO layers layout in our resonant devices.
Materials 10 00849 g006
Figure 7. Total Young’s modulus (E″) measured as a function of the ratio h′/h (width of the deposited ZnO layer/width of Metglas 2826MB strip).
Materials 10 00849 g007
Figure 8. Reaction scheme for the direct reduction and oxidation of the immobilized hemes of Hb and the electrocatalytic reduction of H2O2 on the sensor (created on Chemdraw).
Materials 10 00849 g008
Figure 9. Cyclic voltammetry curves of different electrodes at a scan rate of 0.1 V/s: (a) Metglas 2826MB; (b) Metglas/ZnO; (c) Metglas/ZnO/Hb; and (d) all three curves plotted together, for comparison purposes.
Materials 10 00849 g009
Figure 10. CVs of a Metglas/ZnO/Hb electrode at a scan rate of 0.1 V/s at specific time intervals (5–50 min) (no H2O2 present).
Materials 10 00849 g010
Figure 11. Magnetoelastic resonance measurements: (a) a typical resonance signal received when the Metglas/ZnO/Hb electrode is immersed in the PBS solution. The continuous line is a Gaussian fit to the data; and (b) resonance frequency versus time when the electrode is immersed in PBS solution.
Materials 10 00849 g011
Figure 12. (a) CVs obtained for a Metglas/ZnO/Hb electrode in PBS buffer before and after the addition of increasing amounts (50–350 μM) of H2O2 at a scan rate of 0.1 V/s (sensing signals measured 30 s after each addition of H2O2); and (b) a plot of peak current values vs. H2O2 concentration. Error bars were determined from repeating the measurements on the same electrode at least three times.
Materials 10 00849 g012
Figure 13. Comparison of the control peak current (circles) obtained from the CVs of a Metglas/ZnO/Hb electrode in PBS solution and the corresponding sensing current (triangles) when H2O2 is added in the solution.
Materials 10 00849 g013
Figure 14. Magnetoelastic resonance data of a Metglas/ZnO/Hb electrode measured 5 min after the addition of increasing aliquots of H2O2.
Materials 10 00849 g014
Figure 15. CVs of a Metglas/ZnO/Hb electrode at a scan rate of 0.1 V/s after the addition of three different concentrations of H2O2 measured after 30 s and 5 min after each addition.
Materials 10 00849 g015

