
Multilevel Index Decomposition of Energy-Related Carbon Emissions and Their Decoupling from Economic Growth in Northwest China


Abstract
:1. Introduction
2. Methodology and Date
2.1. Methodology
2.1.1. Energy-Related CO2 Emissions Estimation Approach
2.1.2. Multilevel Index Decomposition Analysis
2.1.3. Decoupling Measurement of CO2 Emissions and Economic Growth
2.2. Data
3. Results and Discussion
3.1. Trajectory of CO2 Emissions
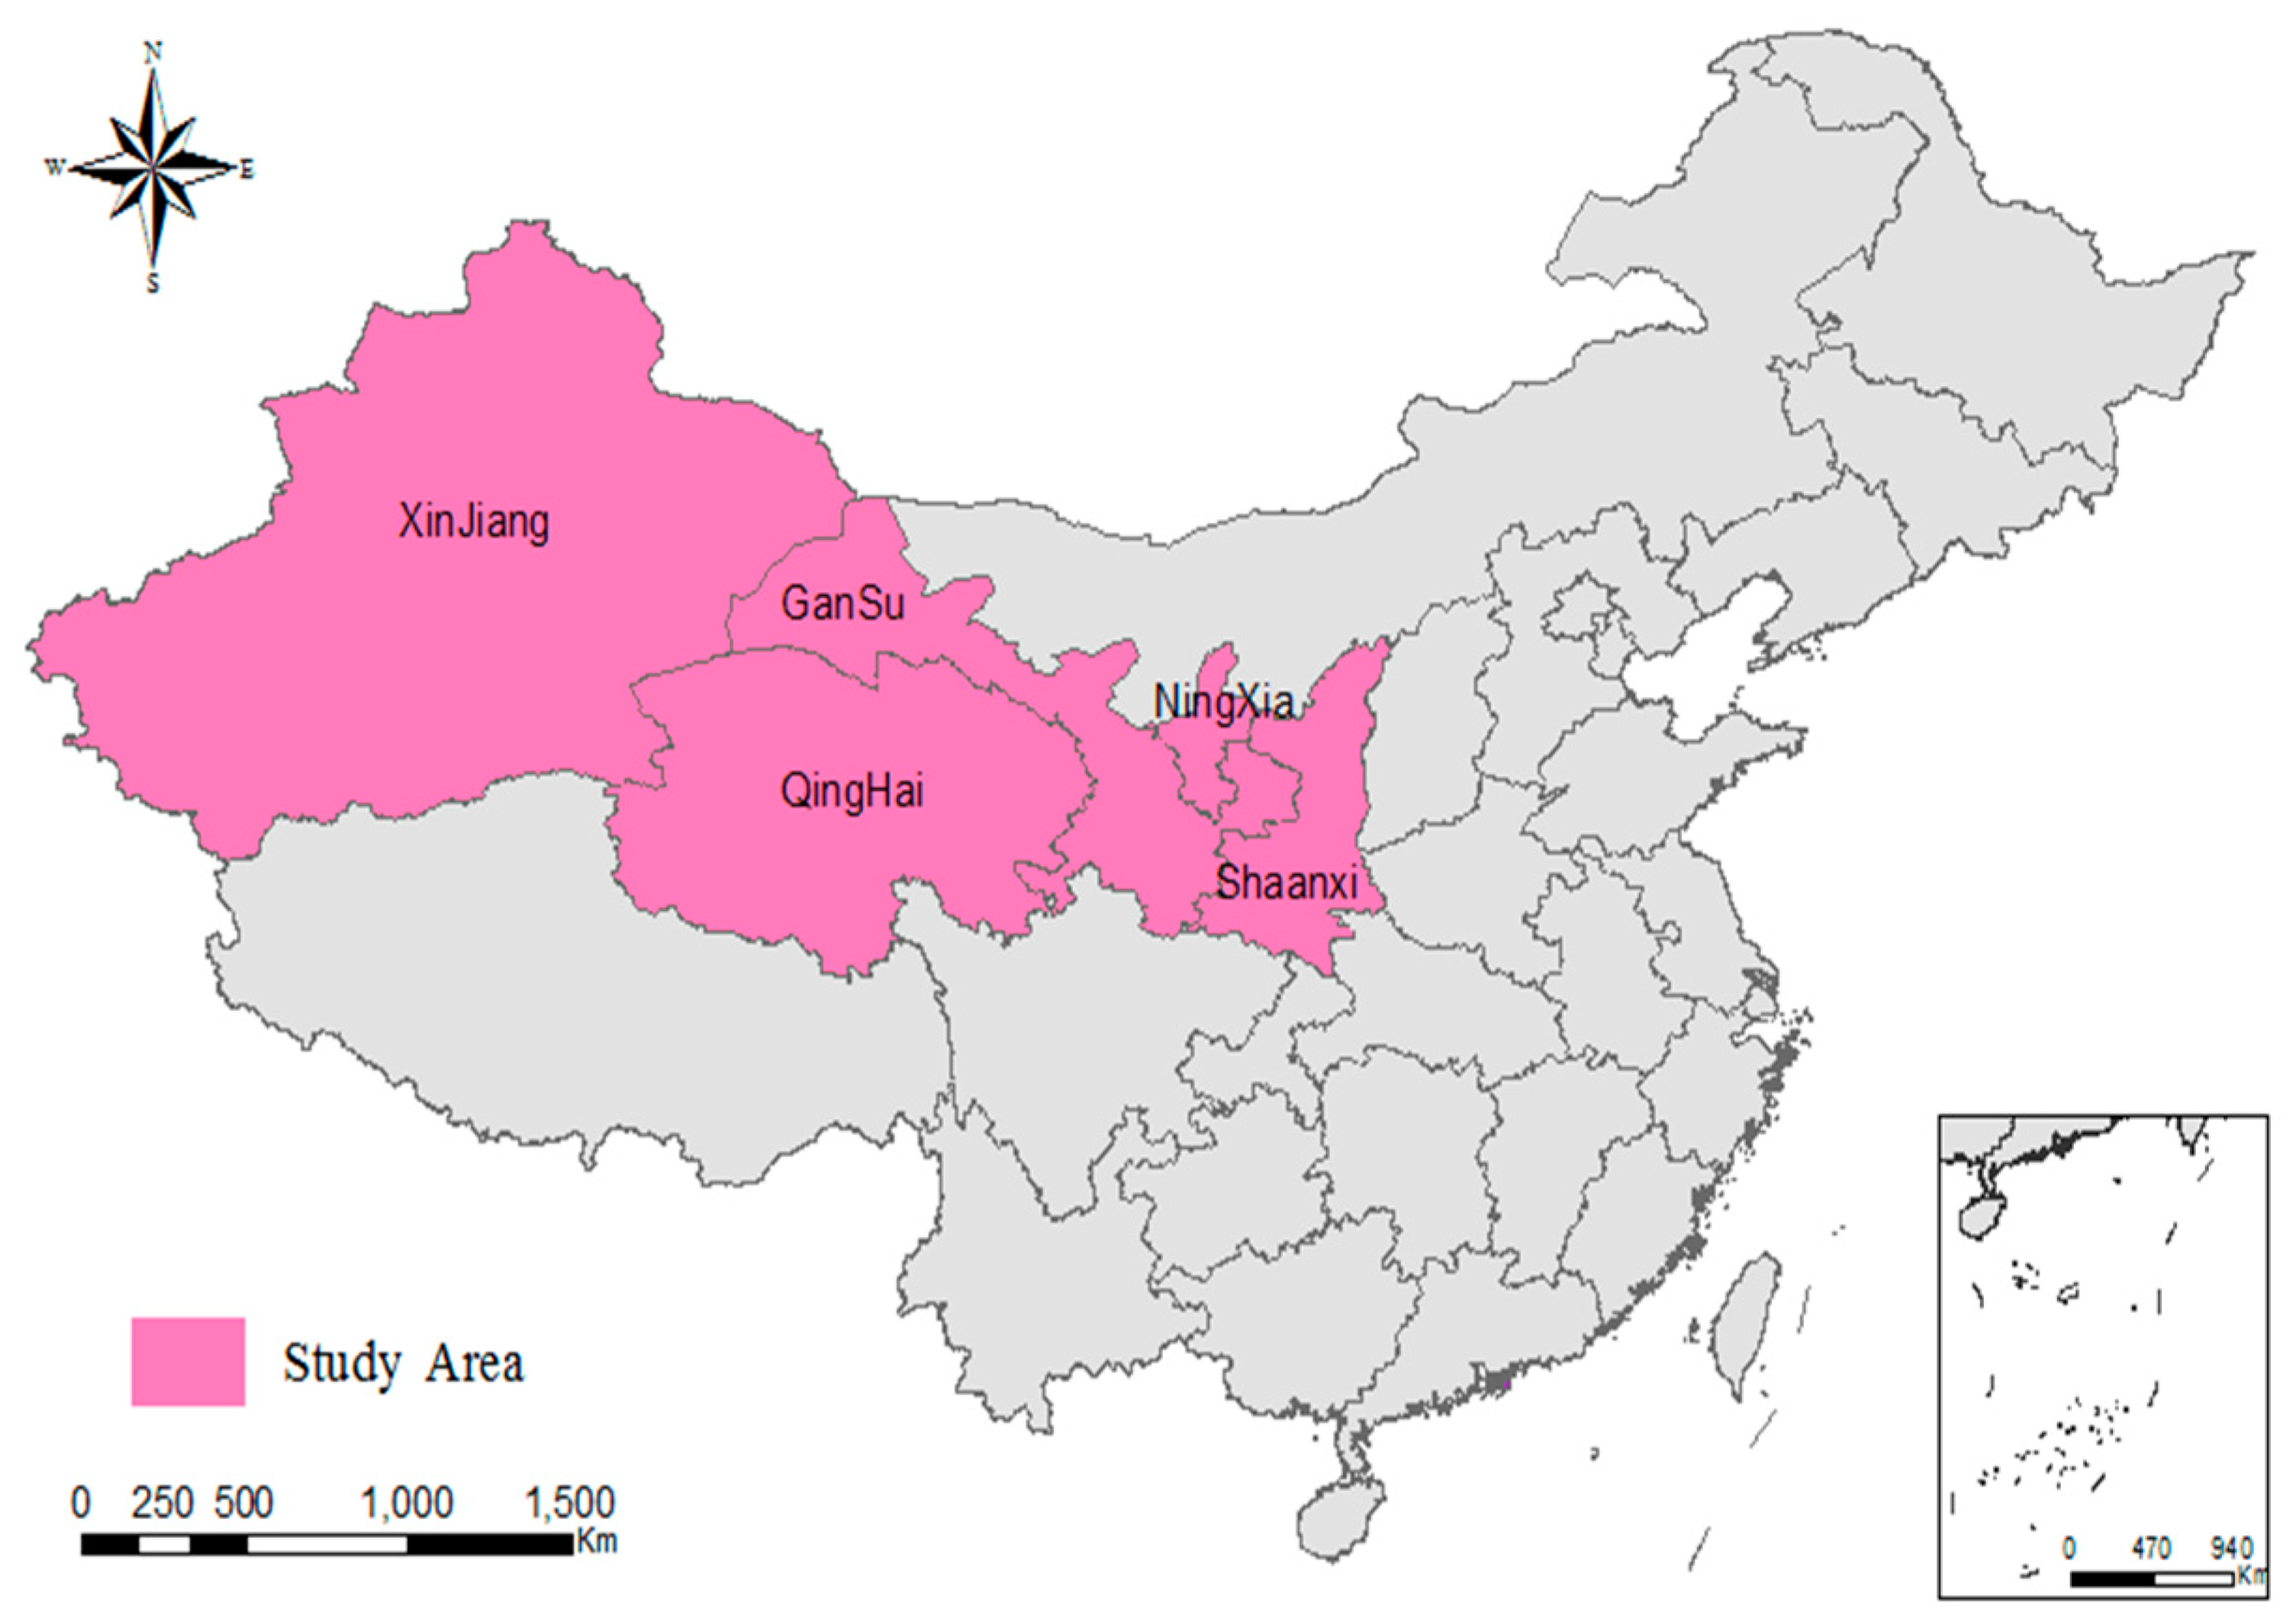
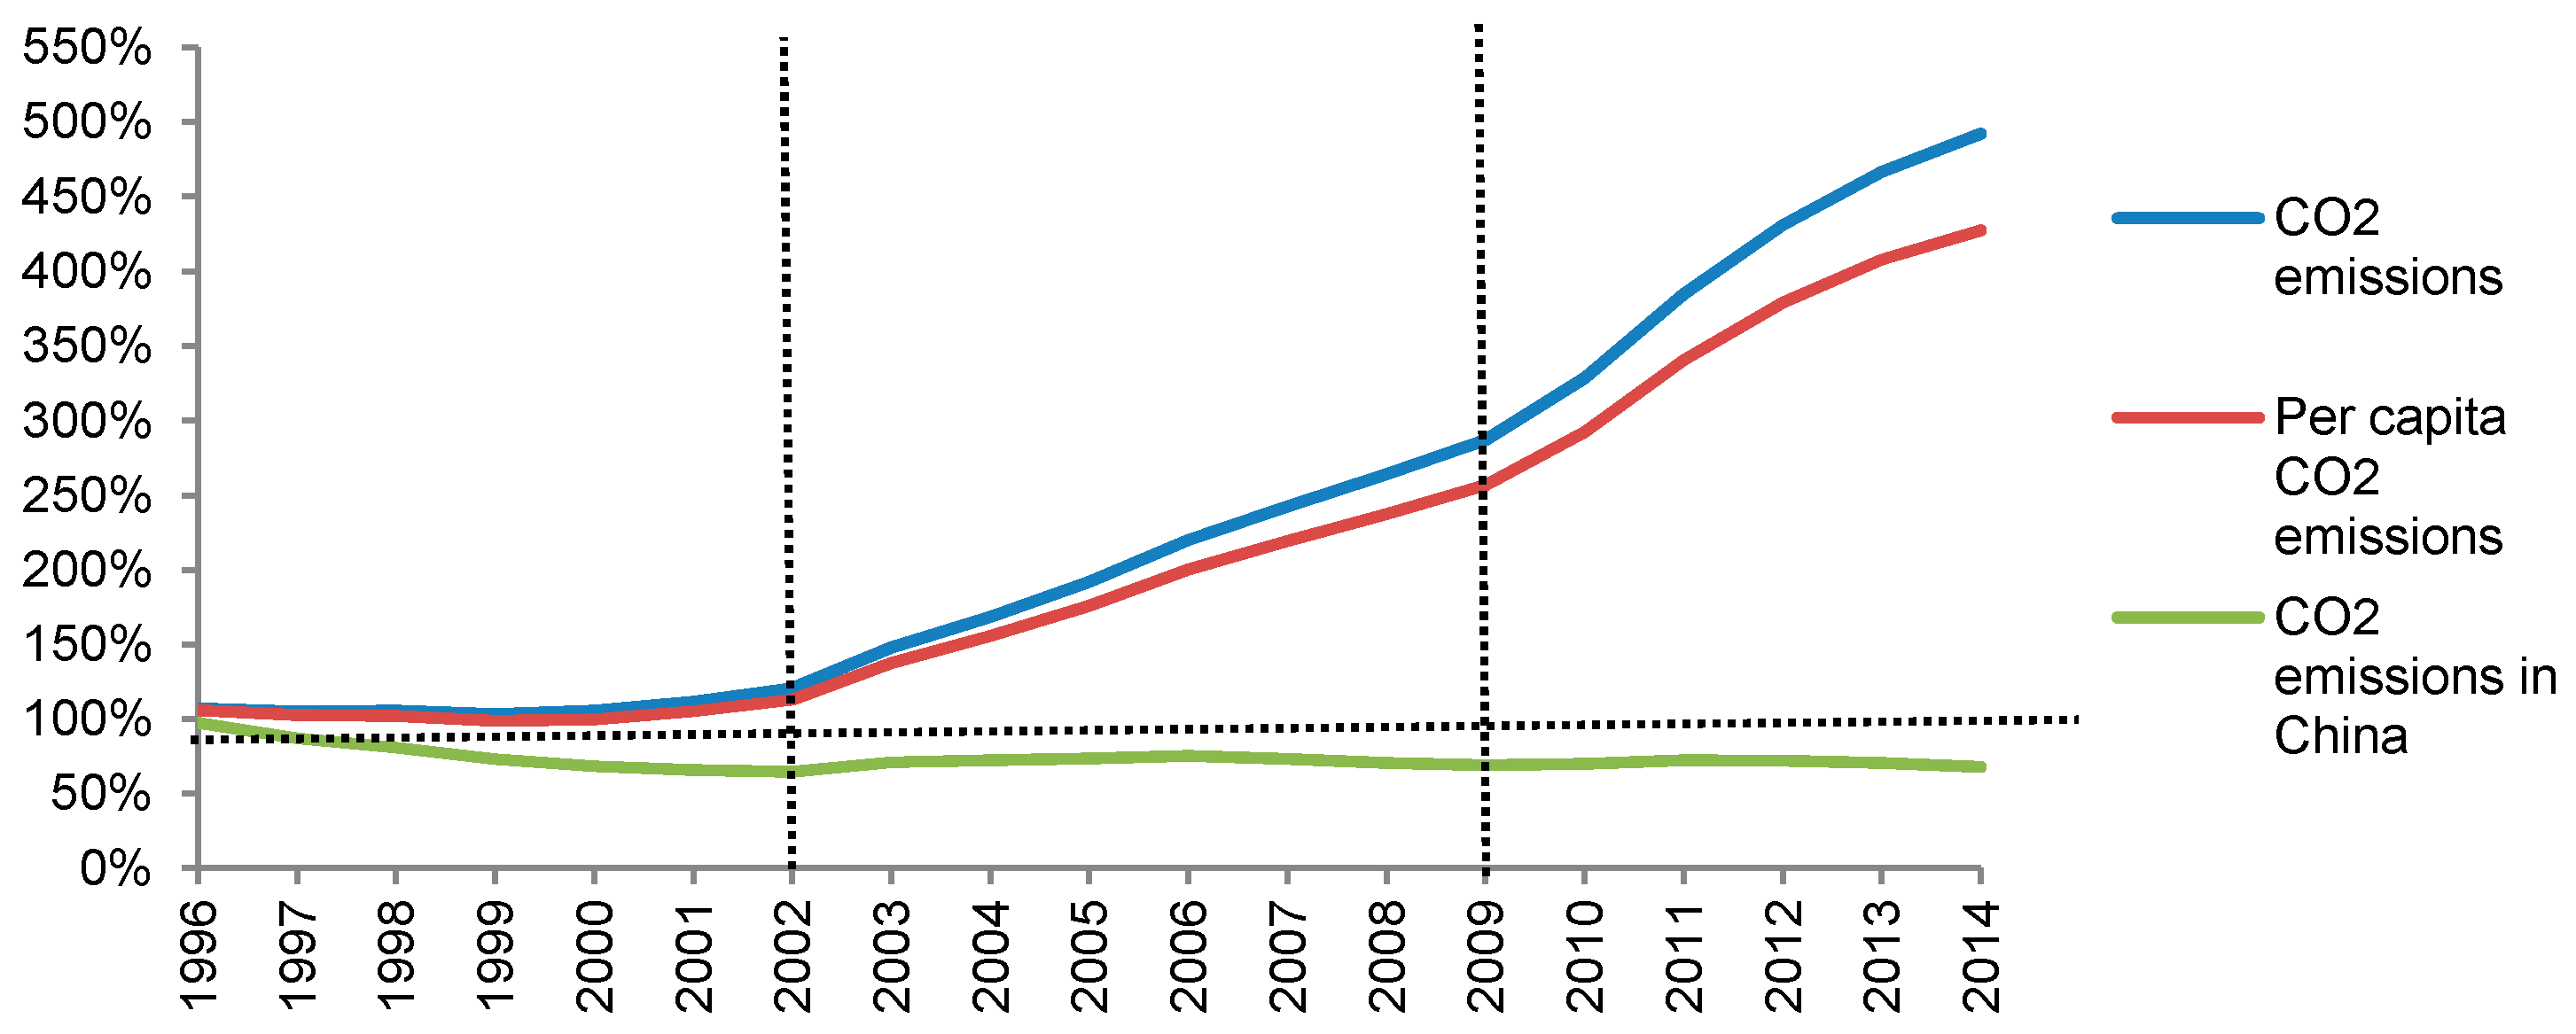
3.1.1. Features of CO2 Emissions in Northwest China
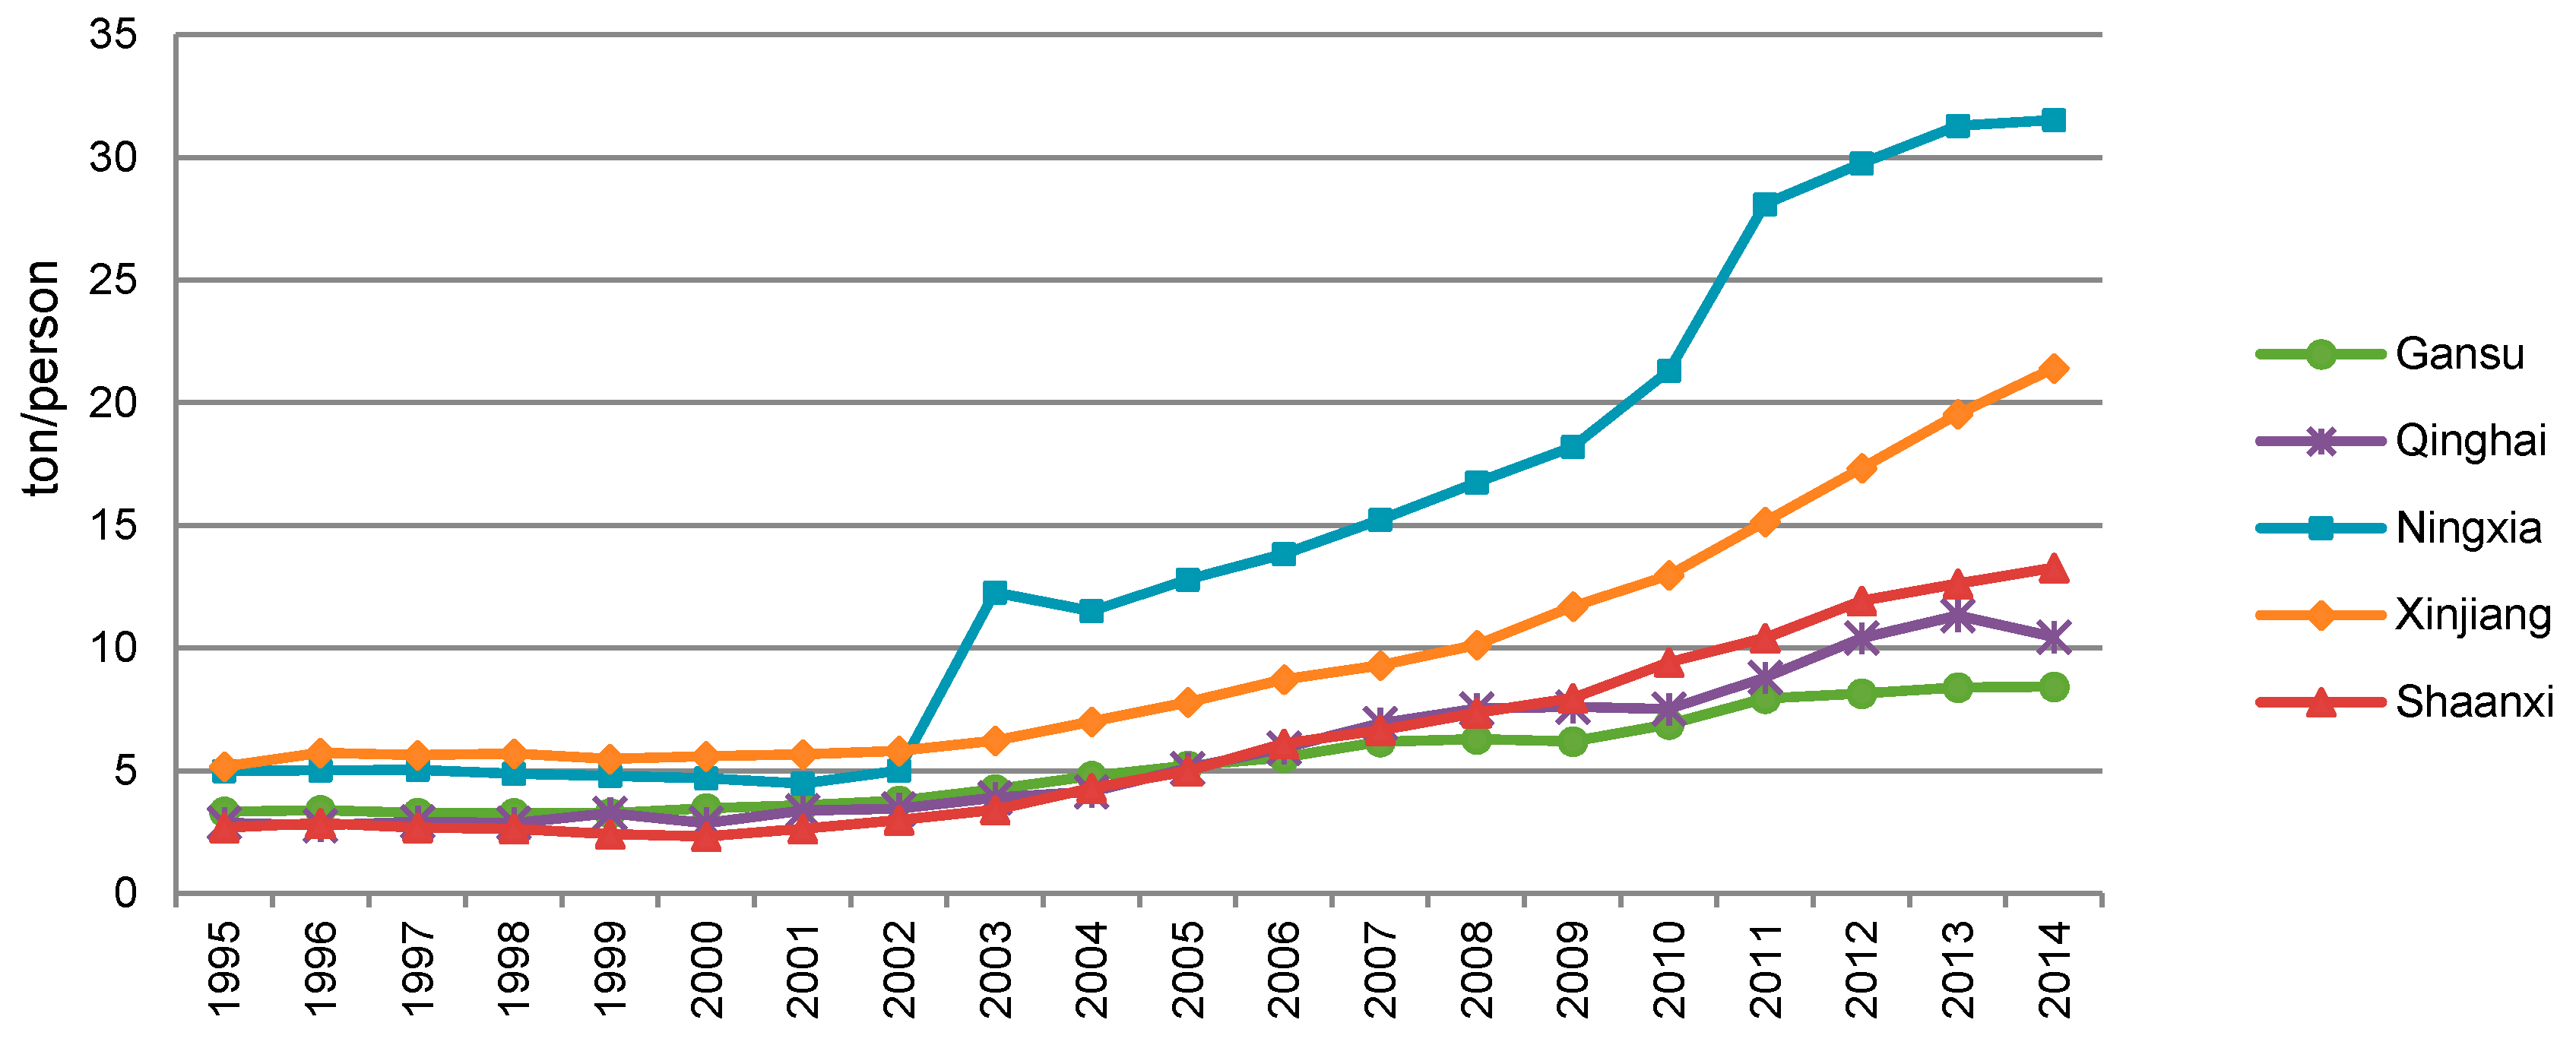
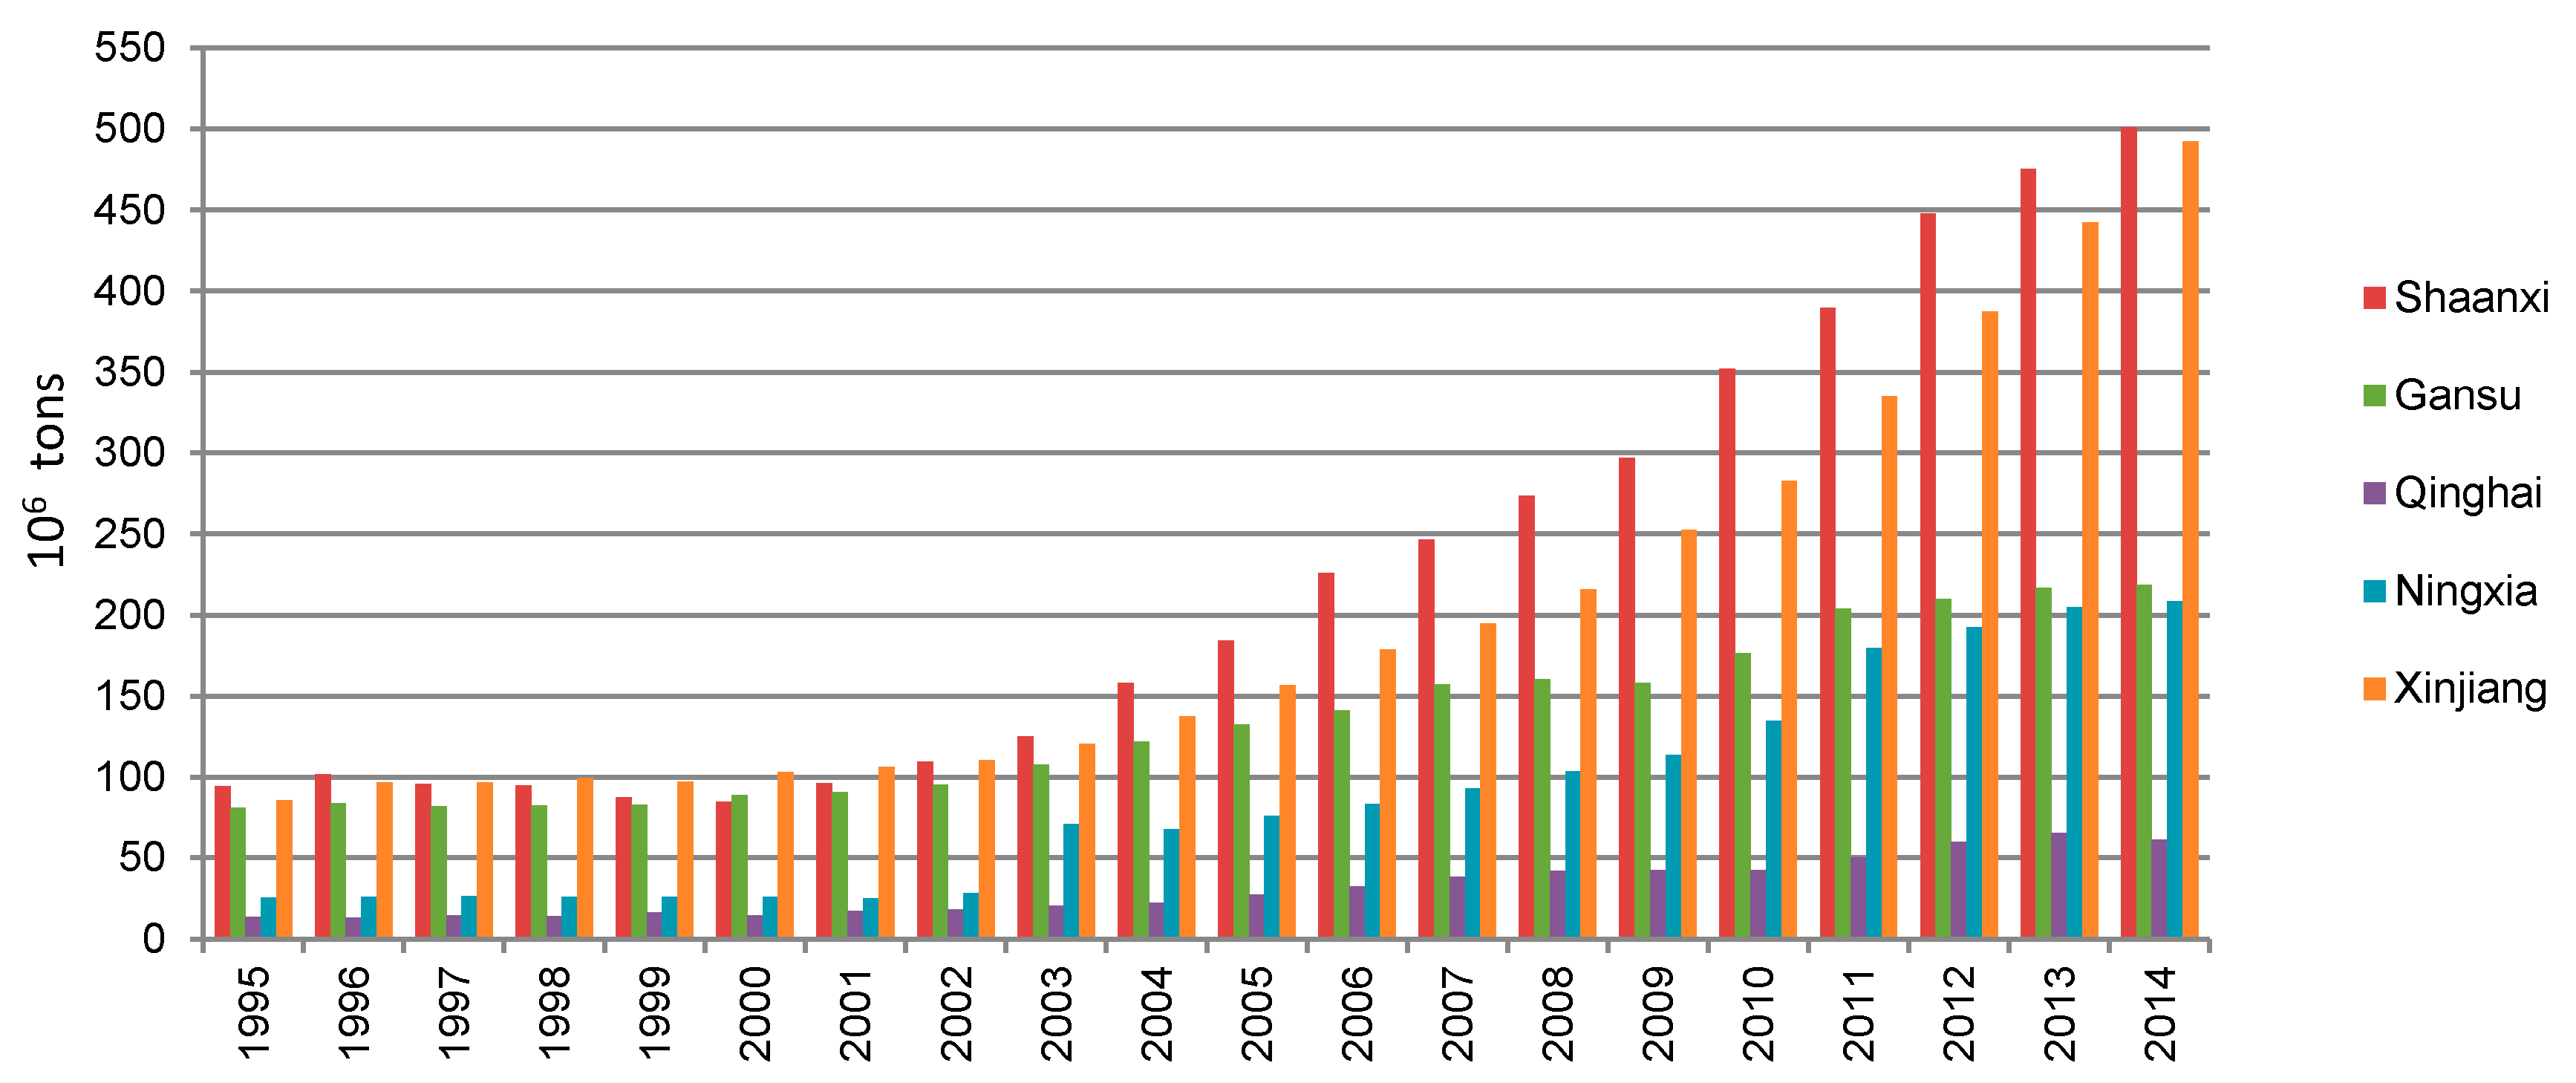
3.1.2. Features of CO2 Emissions in Each Province
3.2. Decomposition Results of CO2 Emissions
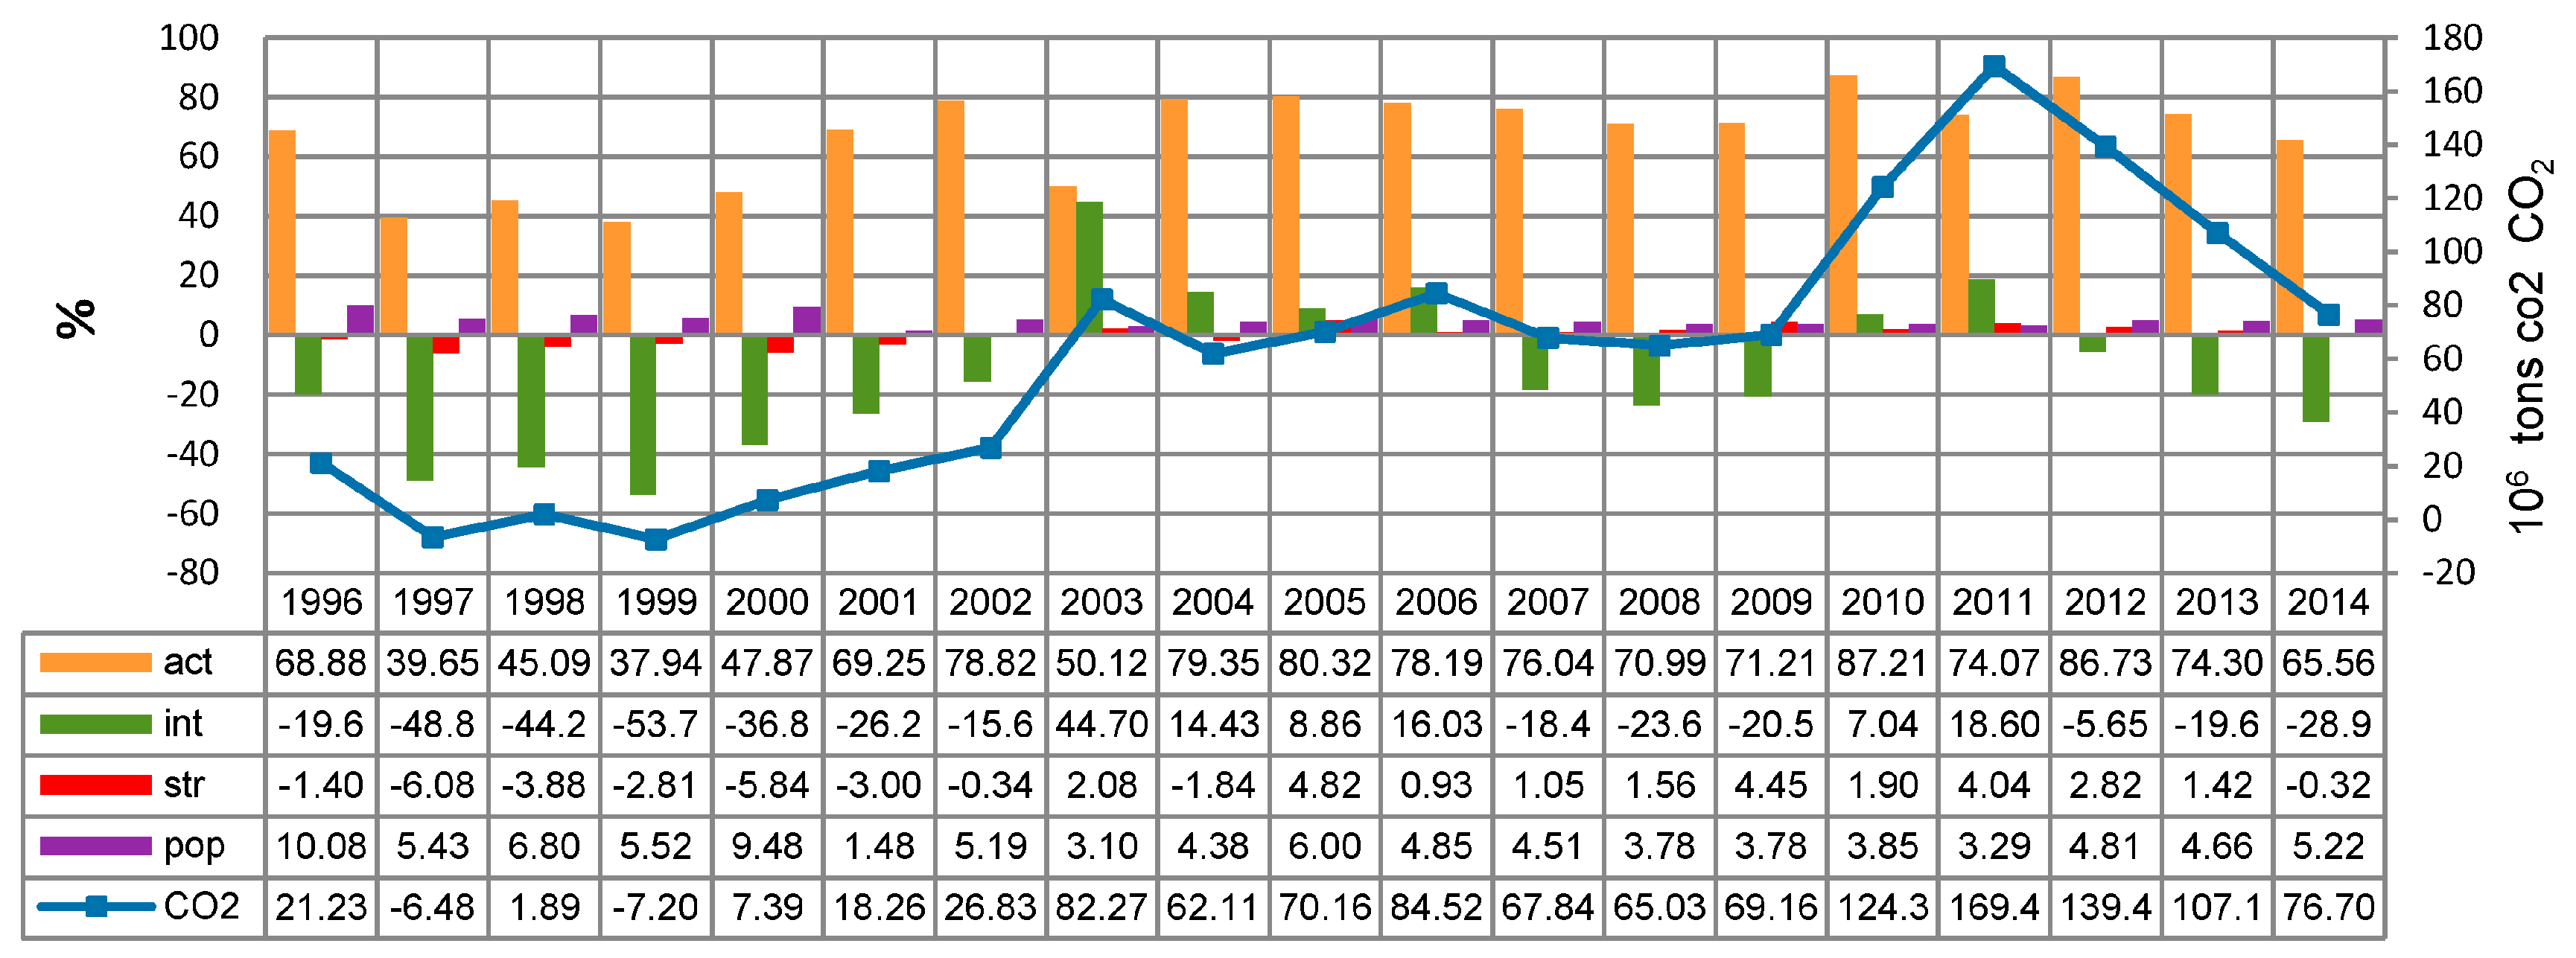
3.2.1. Additive Decomposition Results of CO2 Emission Changes at Regional Level
3.2.2. Multiplicative Decomposition Results of CO2 Emission Changes at Provincial Level
3.3. Decoupling State in Northwest China
4. Conclusions and Policy Implications
4.1. Conclusions
- In Northwest China, total CO2 emissions and per capita CO2 emissions increased rapidly during 1996–2014. In 2014, these two indicators were 4.9 times and 4.3 times their 1995 levels. At the same time, the trend of the CO2 emission intensity is more complicated. From 1996 to 2002, it decreased slowly. Then, it increased with the average annual rate of 1.0% during 2002–2009. After 2009, it almost unchanged. Specifically at the provincial level, although the trends of the total CO2 emissions, per capita CO2 emissions, and CO2 emission intensity were similar in the provinces, variations of these indicators were different among provinces.
- The results derived from the additive decomposition of CO2 emissions at the regional level show the following. The economic activity proves to be an overwhelming contributor to CO2 emissions increase, which accounts for 67.5% of the total emissions during the study period. At the same time, the population also contributes to CO2 emissions with the contribution rate of 5.1%. Conversely, the energy intensity partially offsets emission growth, with the contribution rate of −13.3%. Moreover, the energy structure has a marginal effect with the rate of only about −0.02%.
- Comparative analysis of the multiplicative decomposition results for the five provinces indicates that the population effect in Ningxia and Xinjiang is more significant than that in the other provinces. At the same time, the contributions of the economic growth to carbon emissions are more remarkable in Shannxi and Gansu. Moreover, the intensity effect was weak in Xinjiang, whereas it was very strong in Gansu. In addition, the structural effect varies significantly among provinces, ranging from −4.2% in Shannxi to 2.0% in Xinjiang.
- According to the decoupling index, the “relative decoupling effort” and “no decoupling effort” are the main characteristics during the examined period. Specifically, in 1996, 1998, 2000–2002 and 2007–2009, the decoupling state is characterized as “relative decoupling”, while during 2003–2006, 2010–2013, the decoupling state is characterized as “no decoupling”. Also, there was “strong decoupling” in 1997 and 1999.
4.2. Policy Implications
- More attention should be paid to the environmental impact of the Western Development Strategy. To achieve low-carbon development in Northwest China, the government should continually change economic growth patterns. In particular, the government should increase its investments in energy-related technologies, while restricting transfers of backward production capacities to Northwest China. For other underdeveloped regions, it is equally important to change the mode of economic growth. Underdeveloped areas should obtain more technology spillovers from advanced areas, but not as pollution havens, aimed to boost the economy without considering the environment and only relying on a large number of resources consumption.
- Readjusting the energy use structure is urgently required. From the national point of view, the energy use structure significantly inhibited CO2 emissions in recent years [10,18]. On the contrary, it increased CO2 emissions since 2005 in Northwest China. This indicates that optimization of the energy use structure in Northwest China, where the proportion of coal consumption continued to be at around 60.0%, clearly lags behind the rest of the country. The government must strictly control coal consumption caps, and continuously reduce the proportion of coal in the total primary energy consumption mix. Furthermore, policy makers should seize the opportunities of the “One Road, One Belt” initiative, strengthen energy cooperation with Central Asia, and increase the proportion of clean and renewable energy. In addition, there are many efficacious energy innovation policy tools and energy innovation organizations, such as energy development plan, preferential taxes, subsidies, and public procurement which can be used to invite investment in clean and renewable energy technology.
- Energy efficiency should be persistently improved. Northwest China is a major energy and chemical industry base. Since 2000, the central government began to implement the Western Development Strategy. Financial support and preferential policies were provided to promote growth of economy, especially industries. However, the progress in developing energy utilization technologies in Northwest China lags far behind the national average. Accordingly, the government should focus more on research and development of advanced energy technologies, eliminating backward production capacities to improve energy efficiency. Moreover, given that technology inequity exists between developed and undeveloped regions, the central government has to make significant efforts to balance the development of carbon emission reduction technology through removing technology barrier between regions.
Acknowledgments
Author Contributions
Conflicts of Interest
Abbreviations
| LMDI | Logarithmic Mean Divisia Index |
| BTH | Beijing-Tianjin-Hebei |
| YRD | Yangtze River Delta |
References
- Francey, R.J.; Trudinger, C.M.; Schoot, M.V.D.; Law, R.M.; Krummel, P.B.; Langenfelds, R.L.; Steele, L.P.; Allison, C.E.; Stavert, A.R.; Andres, R.J.; et al. Atmospheric verification of anthropogenic CO2 emission trends. Nat. Clim. Chang. 2013, 3, 520–524. [Google Scholar]
- Wang, Q.; Chen, X. Energy policies for managing China’s carbon emission. Renew. Sustain. Energy Rev. 2015, 50, 470–479. [Google Scholar]
- Jain, N.; Arora, P.; Tomer, R.; Mishra, S.V.; Bhatia, A.; Pathak, H.; Chakraborty, D.; Kumar, V.; Dubey, D.S.; Harit, R.C.; et al. Greenhouse gases emission from soils under major crops in northwest India. Sci. Total Environ. 2016, 542, 551–561. [Google Scholar]
- Wang, Q.; Li, R.R. Journey to burning half of global coal: Trajectory and drivers of China’s coal use. Renew. Sustain. Energy Rev. 2016, 58, 341–346. [Google Scholar]
- Wang, Q.; Li, R.R. Natural gas from shale formation: A research profile. Renew. Sustain. Energy Rev. 2016, 57, 1–6. [Google Scholar]
- Wang, Q.; Li, R.R. Impact of cheaper oil on economic system and climate change: A SWOT analysis. Renew. Sustain. Energy Rev. 2016, 54, 925–931. [Google Scholar]
- CO2 Emissions from Fuel Combustion Highlights. International Energy Agency. Available online: http://www.iea.org/statistics/relateddatabases/co2emissionsfromfuelcombustion/ (accessed on 25 October 2015).
- BP Statistical Review of World Energy. Available online: http://www.bp.com/en/global/corporate/energy-economics/statistical-review-of-world-energy.html (accessed on 25 October 2015).
- Wang, Q. China should aim for a total cap on emissions. Nature 2014, 512, 115. [Google Scholar]
- Kang, J.D.; Zhao, T.; Liu, N.; Zhang, X.; Xu, X.S.; Lin, T. A multi-sectoral decomposition analysis of city-level greenhouse gas emissions: Case study of Tianjin, China. Energy 2014, 68, 562–571. [Google Scholar]
- Wang, Q. China has the capacity to lead in carbon trading. Nature 2013, 493. [Google Scholar] [CrossRef]
- Tunç, G.I.; Türüt-Aşık, S.; Akbostanci, E. A decomposition analysis of CO2 emissions from energy use: Turkish case. Energy Policy 2009, 37, 4689–4699. [Google Scholar]
- Ozturk, I.; Acaravci, A. CO2 emissions, energy consumption and economic growth in Turkey. Renew. Sustain. Energy Rev. 2010, 14, 3220–3225. [Google Scholar]
- Wang, Q.; Li, R.R. Cheaper Oil: A turning point in Paris climate talk? Renew. Sustain. Energy Rev. 2015, 52, 1186–1192. [Google Scholar]
- Valeria, A.; Stefano, G. Drivers in CO2 emissions variation: A decomposition analysis for 33 world countries. Energy 2016, 103, 27–37. [Google Scholar]
- Al-Mulali, U.; Fereidouni, H.G.; Lee, J.Y.M.; Che, N.B.C.S. Exploring the relationship between urbanization, energy consumption, and CO2 emission in MENA countries. Renew. Sustain. Energy Rev. 2013, 23, 107–112. [Google Scholar]
- Wang, Q.; Jha, A.N.; Chen, X.; Dong, J.F.; Wang, X.M. The future of nuclear safety: Vital role of geoscientists? Renew. Sustain. Energy Rev. 2015, 43, 239–243. [Google Scholar]
- Zhang, Y.J.; Da, Y.B. The decomposition of energy-related carbon emission and its decoupling with economic growth in China. Renew. Sustain. Energy Rev. 2015, 41, 1255–1266. [Google Scholar]
- Karmellos, M.; Kopidou, D.; Diakoulaki, D. A decomposition analysis of the driving factors of CO2 (Carbon dioxide) emissions from the power sector in the European Union countries. Energy 2016, 94, 680–692. [Google Scholar]
- González, P.F.; Moreno, B. Analyzing driving forces behind changes in energy vulnerability of Spanish electricity generation through a Divisia index-based method. Energy Convers. Manag. 2015, 92, 459–468. [Google Scholar]
- Stelling, P. Policy instruments for reducing CO2 emissions from the Swedish freight transport sector. Res. Trans. Bus. Manag. 2014, 12, 47–54. [Google Scholar]
- Wang, Q.; Chen, X. China’s electricity market-oriented reform: From an absolute to a relative monopoly. Energy Policy 2012, 51, 143–148. [Google Scholar]
- Shahbaz, M.; Khraief, N.; Jemaa, M.M.B. On the causal nexus of road transport CO2 emissions and macroeconomic variables in Tunisia: Evidence from combined cointegration tests. Renew. Sustain. Energy Rev. 2015, 51, 89–100. [Google Scholar]
- Huo, J.W.; Yang, D.G.; Zhang, W.B.; Wang, F.; Wang, G.L.; Fu, Q. Analysis of influencing factors of CO2 emissions in Xinjiang under the context of different policies. Environ. Sci. Policy 2015, 45, 20–29. [Google Scholar]
- Wang, Q.; Chen, X. Regulatory failures for nuclear safety—The bad example of Japan—Implication for the rest of world. Renew. Sustain. Energy Rev. 2012, 16, 2610–2617. [Google Scholar]
- Yu, S.W.; Zhang, J.J.; Zheng, S.H.; Sun, H. Provincial carbon intensity abatement potential estimation in China: A PSO-GA-optimized multi-factor environmental learning curve method. Energy Policy 2015, 77, 46–55. [Google Scholar]
- Xu, B.; Lin, B.Q. How industrialization and urbanization process impacts on CO2 emissions in China: Evidence from nonparametric additive regression models. Energy Econ. 2015, 48, 188–202. [Google Scholar]
- Aydin, G. The Development and Validation of Regression Models to Predict Energy-related CO2 Emissions in Turkey. Energy Source B 2015, 10, 176–182. [Google Scholar]
- Komal, R.; Abbas, F.; Komal, R.; Abbas, F. Linking financial development, economic growth and energy consumption in Pakistan. Renew. Sustain. Energy Rev. 2015, 44, 211–220. [Google Scholar]
- Wang, Q.; Chen, Y. Energy saving and emission reduction revolutionizing China’s environmental protection. Renew. Sustain. Energy Rev. 2010, 14, 535–539. [Google Scholar]
- Hasanbeigi, A.; Price, L.; Fino-Chen, C.; Lu, H.; Ke, J. Retrospective and prospective decomposition analysis of Chinese manufacturing energy use and policy implications. Energy Policy 2013, 63, 562–574. [Google Scholar]
- Xie, S.C. The driving forces of China’s energy use from 1992 to 2010: An empirical study of input-output and structural decomposition analysis. Energy Policy 2014, 73, 401–415. [Google Scholar]
- Wang, Q.; Chen, Y. Status and outlook of China’s free-carbon electricity. Renew. Sustain. Energy Rev. 2010, 14, 1014–1025. [Google Scholar]
- Inglesi-Lotz, R.; Pouris, A. Energy efficiency in South Africa: A decomposition exercise. Energy 2012, 42, 113–120. [Google Scholar]
- Wang, Z.H.; Yang, L. Delinking indicators on regional industry development and carbon emissions: Beijing-Tianjin-Hebei economic band case. Ecolo. Indic. 2015, 48, 41–48. [Google Scholar]
- Wang, W.; Liu, R.; Zhang, M.; Li, H. Decomposing the decoupling of energy-related CO2 emissions and economic growth in Jiangsu Province. Energy Sustain. Dev. 2013, 17, 62–71. [Google Scholar]
- Zhang, M.; Mu, H.; Ning, Y. Accounting for energy-related CO2 emission in China, 1991–2006. Energy Policy 2009, 37, 767–773. [Google Scholar]
- Xu, X.Y.; Ang, B.W. Index decomposition analysis applied to CO2 emission studies. Ecol. Econ. 2013, 93, 313–329. [Google Scholar]
- Ang, B.W. Decomposition of industrial energy consumption: The energy intensity approach. Energy Econ. 1994, 16, 163–174. [Google Scholar]
- Ang, B.W.; Choi, K.H. Decomposition of Aggregate Energy and Gas Emission Intensities for Industry: A Refined Divisia Index Method. Energy J. 1997, 18, 59–74. [Google Scholar]
- Ang, B.W.; Lee, S.Y. Decomposition of industrial energy consumption: Some methodological and application issues. Energy Econ. 1994, 16, 83–92. [Google Scholar]
- Su, B.; Ang, B.W. Structural decomposition analysis applied to energy and emissions: Some methodological developments. Energy Econ. 2012, 34, 177–188. [Google Scholar]
- Sheinbaum-Pardo, C. Decomposition analysis from demand services to material production: The case of CO2 emissions from steel produced for automobiles in Mexico. Appl. Energy 2016, 174, 245–255. [Google Scholar]
- Cansino, J.M.; Román, R.; Ordóñez, M. Main drivers of changes in CO2 emissions in the Spanish economy: A structural decomposition analysis. Energy Policy 2016, 89, 150–159. [Google Scholar]
- Conte Grand, M. Carbon emission targets and decoupling indicators. Ecol. Indic. 2016, 67, 649–656. [Google Scholar]
- Cruz, L.; Dias, J. Energy and CO2 intensity changes in the EU-27: Decomposition into explanatory effects. Sustain. Cities Soc. 2016. [Google Scholar] [CrossRef]
- Schandl, H.; Hatfield-Dodds, S.; Wiedmann, T.; Geschke, A.; Cai, Y.; West, J.; Newth, D.; Baynes, T.; Lenzen, M.; Owen, A. Decoupling global environmental pressure and economic growth: Scenarios for energy use, materials use and carbon emissions. J. Clean. Prod. 2016, 132, 45–56. [Google Scholar] [CrossRef]
- IPCC. Greenhouse Gas Inventory: IPCC Guidelines for National Greenhouse Gas Inventories; United Kingdom Meteorological Office: Bracknell, UK, 2006. [Google Scholar]
- Lin, B.; Ouyang, X. Analysis of energy-related CO2 (carbon dioxide) emissions and reduction potential in the Chinese non-metallic mineral products industry. Energy 2014, 68, 688–697. [Google Scholar] [CrossRef]
- National Bureau of Statistics of China (NBSC). Chinese Energy Statistics Yearbook, 1996–2014; NBSC: Beijing, China, 2014.
- Song, R.P.; Yang, S.; Sun, M. GHG Protocol Tool for Energy Consumption in China (Version 2.1), 2013; World Resources Institute: Beijing, China, 2013. [Google Scholar]
- Ang, B.W. Decomposition analysis for policymaking in energy: Which is the preferred method? Energy Policy 2004, 32, 1131–1139. [Google Scholar] [CrossRef]
- Kaya, Y.; Yokoburi, K. Environment, Energy, and Economy: Strategies for Sustainability, 1st ed.; United Nations University Press: Tokyo, Japan, 1997; pp. 16–26. [Google Scholar]
- Wang, Q.; Chen, Y. Barriers and opportunities of using the clean development mechanism to advance renewable energy development in China. Renew. Sustain. Energy Rev. 2010, 14, 1989–1998. [Google Scholar] [CrossRef]
- Ang, B.W. The LMDI approach to decomposition analysis: A practical guide. Energy Policy 2005, 33, 867–871. [Google Scholar] [CrossRef]
- Ang, B.W. LMDI decomposition approach: A guide for implementation. Energy Policy 2015, 86, 233–238. [Google Scholar] [CrossRef]
- Zhao, M.; Tan, L.R.; Zhang, W.G.; Ji, M.H.; Liu, Y.; Yu, L.Z. Decomposing the influencing factors of industrial carbon emissions in Shanghai using the LMDI method. Energy 2010, 35, 2505–2510. [Google Scholar] [CrossRef]
- Wang, Q. Effective policies for renewable energy—The example of China’s wind power—Lessons for China’s photovoltaic power. Renew. Sustain. Energy Rev. 2010, 14, 702–712. [Google Scholar] [CrossRef]
- Ang, B.W.; Zhang, F.Q.; Choi, K.H. Factorizing changes in energy and environmental indicators through decomposition. Energy 1998, 23, 489–495. [Google Scholar] [CrossRef]
- Ang, B.W.; Liu, N. Handling zero values in the logarithmic mean Divisia index decomposition approach. Energy Policy 2007, 35, 238–246. [Google Scholar] [CrossRef]
- Tapio, P. Towards a theory of decoupling: Degrees of decoupling in the EU and the case of road traffic in Finland between 1970 and 2001. Transp. Policy 2005, 12, 137–151. [Google Scholar] [CrossRef]
- Diakoulaki, D.; Mandaraka, M. Decomposition analysis for assessing the progress in decoupling industrial growth from CO2 emissions in the EU manufacturing sector. Energy Econ. 2007, 29, 636–664. [Google Scholar] [CrossRef]
- Vehmas, J.; Luukkanen, J.; Kaivo-oja, J. Linking analyses and environmental Kuznets curves for material flows in the European Union 1980–2000. J. Clean. Prod. 2007, 15, 1662–1673. [Google Scholar] [CrossRef]
- National Bureau of Statistics of China (NBSC). China Statistical Yearbook, 1996–2014; NBSC: Beijing, China, 2015.
- National Bureau of Statistics of China (NBSC). China Compendium of Statistical, 1949–2008; NBSC: Beijing, China, 2009.
- National Bureau of Statistics of China (NBSC). China Population Statistics Yearbook, 1996–2014; NBSC: Beijing, China, 2015.
- Zhang, M.; Mu, H.L.; Ning, Y.D.; Song, Y.C. Decomposition of energy-related CO2 emission over 1991–2006 in China. Ecol. Econ. 2009, 68, 2122–2128. [Google Scholar] [CrossRef]
- Wang, Q.; Chen, X. Rethinking and reshaping the climate policy: Literature review and proposed guidelines. Renew. Sustain. Energy Rev. 2013, 21, 469–477. [Google Scholar] [CrossRef]
- Liu, N.; Ma, Z.J.; Kang, J.D. Changes in carbon intensity in China’s industrial sector: Decomposition and attribution analysis. Energy Policy 2015, 87, 28–38. [Google Scholar] [CrossRef]
- Notice of State Council on Printing and Distributing the Ten Key Energy Efficiency Projects in 11th Five-Year Plan. National Development and Reform Commission. Available online: http://bgt.ndrc.gov.cn/zcfb/200608/t20060802_499358.html (accessed on 25 October 2015).
- Notice of the Implementation of Energy Saving for Thousands of Enterprises. National Development and Reform Commission. Available online: http://www.sdpc.gov.cn/rdzt/jsjyxsh/200604/t20060413_66114.html (accessed on 25 October 2015).
- Cansino, J.M.; Sánchez-Braza, A. Driving forces of Spain’s CO2 emissions: A LMDI decomposition approach. Renew. Sustain. Energy Rev. 2015, 48, 749–759. [Google Scholar] [CrossRef]
- Wang, S.J.; Fang, C.L.; Wang, Y. Spatiotemporal variations of energy-related CO2 emissions in china and its influencing factors: An empirical analysis based on provincial panel data. Renew. Sustain. Energy Rev. 2016, 55, 505–515. [Google Scholar] [CrossRef]
- Wang, Q.; Chen, X.; Jha, A.N.; Rogers, H. Natural gas from shale formation—The evolution, evidences and challenges of shale gas revolution in United States. Renew. Sustain. Energy Rev. 2014, 30, 1–28. [Google Scholar] [CrossRef]
- Wang, Q.; Chen, X.; Xu, Y. Accident like the Fukushima unlikely in a country with effective nuclear regulation: Literature review and proposed guildlines. Renew. Sustain. Energy Rev. 2013, 17, 126–146. [Google Scholar] [CrossRef]
- Nie, J.B. China’s one-child policy, a policy without a future pitfalls of the “common good” argument and the authoritarian model. Camb. Q. Healthc. Ethics 2014, 23, 272–287. [Google Scholar] [CrossRef] [PubMed]
- Wang, Q.; Li, R.R. Drivers for energy consumption: A comparative analysis of China and India. Renew. Sustain. Energy Rev. 2016, 62, 954–962. [Google Scholar] [CrossRef]
- Voigt, S.; Cian, E.D.; Schymura, M.; Verdolini, E. Energy intensity developments in 40 major economies: Structural change or technology improvement? Energy Econ. 2014, 41, 47–62. [Google Scholar] [CrossRef]
- Wang, Q. Cheaper oil-challenge and opportunity for climate change. Environ. Sci. Technol. 2015, 49, 1997–1998. [Google Scholar] [CrossRef] [PubMed]
- Ozturk, M.; Yuksel, Y.E. Energy structure of turkey for sustainable development. Renew. Sustain. Energy Rev. 2016, 53, 1259–1272. [Google Scholar] [CrossRef]
- Wang, Q. China’s citizens must act to save their environment. Nature 2013, 497. [Google Scholar] [CrossRef] [PubMed]
- Wang, W.W.; Zhang, M.; Zhou, M. Using LMDI method to analyze transport sector CO2 emissions in China. Energy 2011, 36, 5909–5915. [Google Scholar] [CrossRef]


| Fuel Type | LCV a (KJ/kg or KJ/m3) | Oxidation Rate b | Potential Carbon Content c (kgC/GJ) | CO2 EF d (tCO2/ton or 103 m3) |
|---|---|---|---|---|
| Raw coal | 20,908 | 0.918 | 26.37 | 1.981 |
| Coke | 28,435 | 0.928 | 29.5 | 2.860 |
| Crude oil | 41,816 | 0.979 | 20.1 | 3.020 |
| Gasoline | 43,070 | 0.986 | 18.9 | 2.925 |
| Kerosene | 43,070 | 0.980 | 19.6 | 3.033 |
| Diesel oil | 42,652 | 0.982 | 20.2 | 3.096 |
| Fuel oil | 41,816 | 0.985 | 21.1 | 3.170 |
| Natural gas | 38,931 | 0.990 | 15.3 | 2.162 |
| IDA Identity | ||
| Total Effect | Additive decomposition | Multiplicative decomposition |
| Effect by Factor | ||
| Effect | Province | 1996–2000 | 2001–2005 | 2006–2010 | 2011–2014 | 1996–2014 |
|---|---|---|---|---|---|---|
| Population | Shannxi | 1.0372 | 1.0126 | 1.0122 | 1.0107 | 1.0745 |
| Gansu | 1.0509 | 0.9934 | 1.0058 | 1.0121 | 1.0627 | |
| Qinghai | 1.0732 | 1.0515 | 1.0373 | 1.0346 | 1.2111 | |
| Ningxia | 1.0818 | 1.0753 | 1.0615 | 1.0458 | 1.2913 | |
| Xinjiang | 1.1132 | 1.0870 | 1.0851 | 1.0536 | 1.3833 | |
| Economic Activity | Shannxi | 1.5329 | 1.7316 | 1.9207 | 1.5484 | 7.8943 |
| Gansu | 1.4796 | 1.6697 | 1.6898 | 1.5096 | 6.3020 | |
| Qinghai | 1.4169 | 1.6795 | 1.7395 | 1.4896 | 6.1661 | |
| Ningxia | 1.5207 | 1.5657 | 1.7029 | 1.4159 | 5.7405 | |
| Xinjiang | 1.3190 | 1.4774 | 1.5228 | 1.4529 | 4.3114 | |
| Energy Intensity | Shannxi | 0.6042 | 1.2412 | 0.9780 | 0.8901 | 0.6528 |
| Gansu | 0.7152 | 0.8917 | 0.7754 | 0.8109 | 0.4010 | |
| Qinghai | 0.7102 | 1.0667 | 0.8596 | 0.9399 | 0.6120 | |
| Ningxia | 0.6295 | 0.9308 | 0.9700 | 1.0426 | 0.5926 | |
| Xinjiang | 0.8366 | 0.9570 | 1.0516 | 1.1180 | 0.9413 | |
| Energy Structure | Shannxi | 0.9368 | 0.9973 | 1.0045 | 1.0217 | 0.9588 |
| Gansu | 0.9831 | 1.0090 | 1.0113 | 0.9990 | 1.0021 | |
| Qinghai | 0.9881 | 0.9933 | 0.9845 | 0.9945 | 0.9609 | |
| Ningxia | 0.9894 | 1.0140 | 1.0070 | 1.0031 | 1.0134 | |
| Xinjiang | 0.9786 | 0.9866 | 1.0390 | 1.0168 | 1.0200 | |
| Total Effect | Shannxi | 0.8999 | 2.1706 | 1.9098 | 1.4231 | 5.3092 |
| Gansu | 1.0932 | 1.4923 | 1.3328 | 1.2378 | 2.6062 | |
| Qinghai | 1.0670 | 1.8713 | 1.5269 | 1.4406 | 4.3920 | |
| Ningxia | 1.0247 | 1.5891 | 1.7657 | 1.5485 | 4.4522 | |
| Xinjiang | 1.2020 | 1.5162 | 1.8054 | 1.7402 | 5.7257 |
| Time Period | δ | δpop | Δint | Δstr | Decoupling State |
|---|---|---|---|---|---|
| 1995–1996 | 0.1591 | −0.1464 | 0.2851 | 0.0204 | Relative decoupling |
| 1996–1997 | 1.2483 | −0.1369 | 1.2318 | 0.1534 | Strong decoupling |
| 1997–1998 | 0.9162 | −0.1509 | 0.9810 | 0.0861 | Relative decoupling |
| 1998–1999 | 1.3446 | −0.1455 | 1.4160 | 0.0741 | Strong decoupling |
| 1999–2000 | 0.6929 | −0.1981 | 0.7690 | 0.1220 | Relative decoupling |
| 2000–2001 | 0.4011 | −0.0214 | 0.3792 | 0.0433 | Relative decoupling |
| 2001–2002 | 0.1370 | −0.0659 | 0.1986 | 0.0043 | Relative decoupling |
| 2002–2003 | −0.9952 | −0.0619 | −0.8919 | −0.0414 | No decoupling |
| 2003–2004 | −0.2138 | −0.0553 | −0.1818 | 0.0232 | No decoupling |
| 2004–2005 | −0.2451 | −0.0747 | −0.1104 | −0.0600 | No decoupling |
| 2005–2006 | −0.2789 | −0.0620 | −0.2051 | −0.0119 | No decoupling |
| 2006–2007 | 0.1689 | −0.0593 | 0.2420 | −0.0138 | Relative decoupling |
| 2007–2008 | 0.2585 | −0.0532 | 0.3336 | −0.0219 | Relative decoupling |
| 2008–2009 | 0.1731 | −0.0530 | 0.2887 | −0.0625 | Relative decoupling |
| 2009–2010 | −0.1467 | −0.0441 | −0.0807 | −0.0218 | No decoupling |
| 2010–2011 | −0.3501 | −0.0445 | −0.2511 | −0.0546 | No decoupling |
| 2011–2012 | −0.0228 | −0.0555 | 0.0651 | −0.0325 | No decoupling |
| 2012–2013 | 0.1822 | −0.0628 | 0.2640 | −0.0191 | No decoupling |
| 2013–2014 | 0.3659 | −0.0796 | 0.4408 | 0.0048 | Relative decoupling |
© 2016 by the authors; licensee MDPI, Basel, Switzerland. This article is an open access article distributed under the terms and conditions of the Creative Commons Attribution (CC-BY) license (http://creativecommons.org/licenses/by/4.0/).
Share and Cite
Dong, J.-F.; Deng, C.; Wang, X.-M.; Zhang, X.-L. Multilevel Index Decomposition of Energy-Related Carbon Emissions and Their Decoupling from Economic Growth in Northwest China. Energies 2016, 9, 680. https://doi.org/10.3390/en9090680
Dong J-F, Deng C, Wang X-M, Zhang X-L. Multilevel Index Decomposition of Energy-Related Carbon Emissions and Their Decoupling from Economic Growth in Northwest China. Energies. 2016; 9(9):680. https://doi.org/10.3390/en9090680
Chicago/Turabian StyleDong, Jie-Fang, Chun Deng, Xing-Min Wang, and Xiao-Lei Zhang. 2016. "Multilevel Index Decomposition of Energy-Related Carbon Emissions and Their Decoupling from Economic Growth in Northwest China" Energies 9, no. 9: 680. https://doi.org/10.3390/en9090680