1. Introduction
A key component of the European Union (EU) Bioeconomy Strategy [
1,
2] is to stimulate research and development activities which can identify and enhance knowledge of best practice in biomass usage across different end uses (i.e., food, feed, energy, industrial applications), thereby helping policymakers to reconcile the broad societal goals of (inter alia) wealth generation, employment, food security, environmental preservation and a sustainable low carbon economy. According to Eurostat [
3], biomass is defined as the “biodegradable fraction of products, waste and residues from agriculture (including vegetal and animal substances), forestry and related industries, as well as the biodegradable fraction of industrial and municipal waste”. For example, within the EU’s Renewable Energy Directive, biomass is mooted as a part solution in achieving the goal of clean sustainable energy supply. Similarly, the “greening” of the EU’s Common Agricultural Policy (CAP) is already focused toward achieving a more environmentally responsible, yet competitive, biomass production system. In addition, the 2020 climate and energy package seeks to promote greater usage of renewable sources of growth. Casual observation reveals, however, that EU biomass policies are fragmented, which, in the context of the aforementioned societal goals, potentially leads to policy conflicts. Thus, the key challenge is one of “policy coherence”, which, it is recognized, must allow for, “...fair competition between the various uses of biomass resources (across competing sectors)”, although even the interpretation of “fair” remains open to debate [
4] (p. 7).
Examining the relevant literature, a number of EU funded quantitative “foresight studies” of “traditional” bio-based activities (i.e., agriculture, forestry) focus on very narrow aspects relating to land use [
5], food security [
6,
7] and agri-food market trends [
8], or take a broader qualitative stance on the current and possible future state of the EU bioeconomy [
9]. A common theme in all of these types of studies is the design of medium to long-term alternate future pathways, which characterize diverse socio-political and socio-economic visions governing the cognitive processes behind policy making. To the best of our knowledge, in the academic literature there are no quantitative foresight studies which explicitly capture a comprehensive range of biomass sources (i.e., energy crops, pellets, residues etc.) and contemporary technological applications of biomass (especially in energy and industrial sectors) within the broader macroeconomy. In large part, this is attributed to a dearth of published secondary data estimates, which constitutes a source of value added in the current study.
Thus, this study tackles head-on how competing uses of biomass across a diverse collective of bio-based activities contribute toward a utopian vision of a low carbon, environmentally sustainable, competitive economy. In recognition of the need to find urgent policy solutions to preserve even the current environmental status quo, a more immediate time frame is adopted. Moreover, to understand the influence of public policy initiatives in achieving said goals, a portfolio of relevant policy instruments is employed to design two contrasting narratives which are compared with a business as usual baseline. An explicit aim is to quantify the relative strength of each policy driver in shaping bio-based market trends within each narrative and to highlight the potential policy conflicts referred to above.
From a methodological standpoint, quantitative foresight assessments [
5,
6,
8] resort to a neoclassical multi-region Computable General Equilibrium (CGE) representation. This class of mathematical simulation model has become a de facto toolbox of choice, since it recognizes (and accommodates) the need to fully embed bio-based activities as a component part of economy-wide and global market activities. This paper employs a state-of-the-art CGE model variant with a detailed contemporary scenario design for each of the narratives, whilst as noted above, significant enhancements to the model database now capture additional sources of biomass supply and demand which go way beyond the standard national account definitions typically used in CGE model datasets.
The rest of this paper is structured as follows:
Section 2 describes the methodology and scenario design.
Section 3 presents the results.
Section 4 and
Section 5 provide some policy discussion and concludes.
2. Methodology and Scenario Design
2.1. Model and Data
With its global coverage, the ninth incarnation of the Global Trade Analysis Project (GTAP) database [
10] represents production technologies through intermediate- and primary factor usage and private, public and investment demands—at agents and market prices—for 140 regions. In addition, the “input-output” data is supplemented by and reconciled with, detailed gross bilateral trade, transport and border protection data. As a point of departure for the modelling work, the neoclassical multi-region GTAP model [
11] is employed, which relies on mathematical representations of constrained optimization and additional model parameters to calibrate and enumerate demand and supply behavior. Subject to a series of exogenous variable shocks (i.e., tax rates, productivity, or factor endowments), prices and outputs endogenously adjust subject to the underlying market clearing and Keynesian macroeconomic accounting equations to ensure a new “equilibrium” (i.e., supply equals demand, zero profits, macro aggregates balance).
To the standard GTAP data classification of bio-based activities (i.e., agriculture, forestry, textiles etc.), sector splits are applied to relevant parent industry activities and intermediate and final commodity sales (domestic and foreign markets) to depict different sources of biomass supply in detail: among residue energy crops (biomass using dedicated woody or grassy energy crops such as eucalyptus, poplar, switch-grass and miscanthus) and pellets and first generation biofuels (from sugar, starch and oil crops). Furthermore, further sector splits are implemented to characterize “new” technologies which, hitherto, are still in their infancy but may be expected to play a key role in the medium term. More specifically, second generation biofuels produced from lignocellulosic biomass (forestry and agricultural residues, energy crops, pellets), bioelectricity purchased by the electricity generation sector and biochemical activities using conventional agricultural crops and lignocellulose biomass, which are supplied to the GTAP sector denominated as “chemicals, rubbers and plastics”. Two technologies are chosen to characterize second generation biofuels: a thermochemical technology based on the gasification of lignocellulose biomass; and, secondly, a biochemical technology employing hydrolysis of lignocellulose biomass and fermentation of sugars to ethanol.
To support such an undertaking, significant data on production volumes, conversion efficiencies, cost structures, trade flows and transport costs were collected for the benchmark year of 2007 based on output from specialist biophysical models, previous research and expert opinion (see
Table A1 and
Table A2 of the annex and [
12], (p. 62)). The result is a new subset of data linkages between existing GTAP sectors and new bio-based sectors.
Figure 1 provides a schematic illustration, where the colored boxes represent new bio-based sectors and the grey boxes are existing GTAP sectors. The arrows indicate the direction of the biomass, bio-based energy and chemicals flows.
To this database, an advanced recursive dynamic variant of the GTAP model, known as the Modular Applied GeNeral Equilibrium Tool (MAGNET) [
13] is calibrated. The MAGNET model provides flexibility to choose from a list of non-standard modules to address the most pertinent aspects of the study at hand. As the main source of biomass generation, the MAGNET version employed here explicitly treats the specificities of agricultural markets via explicit substitution possibilities for feed and fertilizer inputs, heterogeneous land transfer between different agricultural activities and relative wage and rent differentials between agricultural and non-agricultural labor and capital, respectively. In addition, given the time dimension of the study, the model captures changes in the revised pattern of (agri-food) income demand elasticities resulting from structural economic change [
13] (p. 73). It is assumed that the joint production of principal commodities and associated residues in agriculture and forestry changes in equal proportion (i.e., Leontief technology). Moreover, the prices of residue by-products are subject to an asymptotic residue supply function [
14]. Production of oilcake and distiller’s dried grains and soluble (DDGS) feed by-products from first generation biodiesel and bioethanol sectors, respectively, are also treated using a Leontief technology.
To complement the key aim of understanding the relationship between public policy in meeting the challenges of (inter alia) resource usage, competitiveness and environmental responsibility, this study borrows from the latest developments in the literature. Modelling of the CAP [
15] accounts for coupled and decoupled Pillar 1 (market support) payments, Pillar 2 (rural development) expenditures and intra-EU budgetary transfers which constitute the common budget. To examine the role of biomass usage in first- and second-generation biofuels as an alternative to traditional carbon based fuels, a fiscally neutral approach is adopted [
16] where endogenous taxes on end users of “blended” fuels provide finance to subsidize the biofuel usage necessary to meet exogenously targeted EU mandates. Exogenous greenhouse gas (GHG) emissions reductions are targeted in the model by endogenous carbon tax rises on the relevant emissions drivers (i.e., output and input usage) [
17]. To model trade policy, exogenous shocks to applied ad valorem tariff rates are applied both directly within the model and through the use of the specialist tariff tool called Tariff Analytical and Simulation Tool for Economists (TASTE) [
18].
2.2. Aggregation and Closure
The database is disaggregated into 49 tradables, of which 39 are bio-based (
Table 1). To more adequately characterize the interlinkages between bio-based activities with the rest of the economy, specific non-bio-based inputs are also included—i.e., feeds and fertilizers [
19] and fossil fuels. With an EU focus, the regional aggregation includes the largest EU member states, as well as EU regions where bioeconomic activity (primarily, agriculture) is relatively important (i.e., Ireland and Poland). Further EU member state disaggregation reflects pragmatic modelling considerations to incorporate the rebate mechanism of the CAP budget [
15], whilst Croatia is separated to explicitly model its entry to the CAP budget mechanism. For the non-EU regions, “large players” (both net exporters and importers) and impoverished partners on world bio-based markets are identified. All residual trade and output flows are captured within a Rest of the Word (ROW) region.
A standard neoclassical closure rule is employed where the balance on the trade account and the capital account net to zero. In EU regions with additional intra-community CAP payments flows, adjustments are made to regional savings to ensure that the general equilibrium circular flow condition of the data remains intact.
2.3. Scenario Design
The baseline (BL) design is spread over three time intervals (2007–2013; 2013–2020; 2020–2030) which are chosen to coincide with the EU’s multiannual financial framework, Croatia’s EU accession and the EU’s climate and energy package 2020. The BL encompasses past and “foreseeable” future market developments based on economic drivers (i.e., projections—see below) and the EU’s main bio-based policy drivers (i.e., CAP, trade policy; biofuel mandates and GHG reductions). The first period (2007–2013) captures the main historical market trends (
Table A3 of the annex), whilst a detailed description of each of the groups of shocks to characterize the 2013 to 2030 timeframe are described in
Table 2. It should be noted that the baseline scenario does not contemplate the UK’s withdrawal from the EU. In the absence of any current detail regarding the time frame for withdrawal, or the type of trading arrangement (from an array of possibilities), no attempt is made to speculate on the magnitude of the trade shocks to capture this unprecedented event.
Projections of population and real GDP growth (
Table A4 in the annex) are taken from a status quo scenario [
8]. In MAGNET, labor endowments mimic population changes (fixed employment rates), capital shadows real GDP trends (fixed medium to long-run capital-output ratio), whilst natural resources are assumed to grow at one-quarter the rate of the capital stock. Expected developments in fossil fuel prices are taken from the World Bank [
20] (
Table A5 in the annex).
As a departure from the BL, two paradigms are identified for the decade 2020–2030 which take polar paths to epitomize different visions of the EU within a hypothetical world order. These alternate narratives are characterized by policy variations on the four pillars of “CAP”, “trade”, “biofuels” and “GHGs”. The ethos underlying each narrative reflects the relative importance EU policymakers lend to the barometers of economic performance (i.e., growth and employment); reduced fossil fuel dependence (i.e., biofuel policy); environmental protection, biodiversity and green growth (i.e., GHG emissions limits, CAP Policy); and even philanthropic concepts of poverty reduction (e.g., improve the incomes of poorer countries through “fairer” trade).
In the outward-looking (OL) narrative, the EU behaves as an altruistic leader on the world stage by leading the fight on reducing GHG emissions in the absence of any concrete binding commitments at the 2015 United Nations Climate Change Conference in Paris in December 2015, only previously proposed EU reductions in GHGs are implemented and championing a “greener” vision for the CAP. In addition, energy policy supplants traditional fossil fuels with bio-based alternatives as a part-solution toward a low-carbon economy, whilst the EU has an instrumental role in forging a multilateral trade deal to alleviate world poverty. In contrast to this vision, an inward-looking (IL) narrative is proposed, which takes a more introspective approach to EU policy making. Taking a more single-minded approach to economic growth, there are increasing moves toward existing fossil fuel technologies, whilst trade policy is based upon the forging of strategic alliances. Finally, agricultural policy follows a more market oriented approach. A full description of each of the narratives is provided in
Table 3.
3. Results
The focus is strictly on the performance of the EU bio-based sectors, where in large part, comparisons are drawn between the IL and OL policy narratives with the BL in the decade 2020–2030. To aid the exposition, the paper employs the results of a decomposition method of “subtotals” [
22]. More specifically, this method calculates the part-worth of the resulting endogenous variable change that corresponds to a pre-specified group of exogenous shocks. More specifically, for a simplistic function
Z =
F(
X,
Y), where
Z is endogenous and
X and
Y are exogenous, one calculates the change (δ
Z/δ
X)d
X and (δ
Z/δ
Y)d
Y within the total derivative d
Z, accumulated over all the steps specified within the model algorithm. The part-worth of each exogenous variable is calculated on the assumption that the rate of progression in the set of exogenous shocks along the solution path is proportionally linear. In the results section, the abbreviations for each group of exogenous shocks (i.e., “Proj”, “WP”, “CAP” etc.) used in
Table 4,
Table 5 and
Table 6 are defined in
Table 2 and
Table 3 above. Accordingly, on comparing the scenarios with the baseline, the comparative “part-worth” importance of the four exogenous policy drivers—measured in percentage point differences—are evaluated to understand the degree of influence of EU policies.
3.1. Baseline 2013–2030
As a basis for comparison,
Table 4 gives an overview of the main EU bio-based sector output, macro growth and real income trends in the baseline (BL), over the period 2013–2030. The index change from 2013 to 2030 is decomposed by the six categories on the right of the dotted line. These results reveal, unsurprisingly, that output change is mainly driven by the exogenous macroeconomic projections (proj) vis-à-vis the four groups of policy shocks. Under conditions of Keynesian macroeconomic closure, accumulating labor and capital endowments increase factor incomes, output and expenditures in the EU. Secondly, in primary agriculture, the slow rate of growth reflects lower income elasticities on final demands for agricultural products (mostly horticultural crops), whilst higher land productivities in non-EU regions erodes EU trade competitiveness. The larger bio-based sectors perform relatively weakly compared with non-bio-based sectors. Under the assumption of slower relative EU GDP population and GDP growth (vis-à-vis non-EU regions), the resulting erosion in EU competitiveness damages the prospects of “open” bio-based sectors such as textiles, apparel, leather and wood products.
Examining the policy drivers, the biofuels mandates have clear positive output implications for biomass supply and biofuel (both first and second generation) sectors, whilst simultaneously diverting biomass away from (alternate) biochemical usage. Production of bioelectricity remains affected by the biofuel mandates. In the absence of any official subsidy support, it is assumed that its input share in electricity generation is assumed fixed. Also, under the assumption that EU GHG emissions cuts are relatively steeper compared with non-EU regions, resulting carbon tax increases act as an additional economic constraint on EU output. Emissions reductions shocks have negative impacts on fossil fuel and energy sectors (which negatively affect demands for blended biofuels, biochemical and bioelectricity inputs) as well as the agricultural sector. It should be noted that, with a relatively high concentration of non CO2 emissions and their associated higher global warming potential arising from (inter alia) enteric fermentation, manure management and methane from rice cultivation, the agricultural sector is more acutely affected by this set of shocks. As relatively less environmentally prejudicial sectors, EU bio-based activities such as forestry, apparel and wood products benefit from this shock via second round inter-sector resource reallocations.
3.2. EU Bio-Based Growth, Macro Growth and Real Income
For the decade 2020–2030, columns one and two of
Table 5 reveal the impacts on EU macro growth, real incomes and bio-based sectorial output comparing between the inward-looking (IL) scenario and the BL (upper segment) and the outward-looking (OL) scenario and the BL (lower segment). On a sector-by-sector basis, the last column of
Table 5 reports the total percentage point difference between the IL and the BL (upper segment) and the OL and the BL (lower table segment), which is decomposed by the six groups of market drivers. In the IL scenario (
Table 5—upper part), it is clear that the survival of the biofuel sector is dependent on the mandate. The removal of this policy and its associated fiscal support leads to a 91.4% contraction in biofuel output, as well as a −49.6% reduction in the supply of biomass. This policy shock also generates further negative ripple effects for adjacent bioenergy feedstock and residue supply sectors (i.e., agriculture, forestry). The biochemical sector benefits (19%) as a (now) more attractive alternative source of biomass usage, whilst the large aggregate fossil fuels and energy sector and the macro-economy expands as primary resources are reallocated to the EU’s non bio-based sectors. These economic mechanisms motivate the positive impact of removing biofuel mandates on real macro growth (0.2%) and per capita utility (0.4%).
As the majority of the CAP Pillar 1 (market support) is largely decoupled from production, its removal in the IL scenario has a minor impact on EU agriculture and food output. The EU’s more cautious approach to trade policy appears to pay small dividends for “open” activities such as textiles, leather and apparel, whilst EU agriculture and food sectors are only mildly affected. In part, the muted impacts of trade reflect the (already) low relative applied tariff protection.
Comparing the OL scenario with the BL (
Table 5—lower part), the implication of increasing the biofuel mandate is to increase output in biomass supply (68%) and bioenergy (45%) activities, as well as in residue and feedstock supplies from agriculture and forestry. In addition, there is a multiplier effect in those downstream sectors that employ agriculture (food) and forestry (wood) products. On the other hand, this policy draws resources away from the non-bio-based component of the EU economy resulting in lower macro growth (−0.6%) and real per capita income (−1.3%). Importantly, in comparing the BL and the IL scenario, a more environmentally conscious EU CAP in the OL scenario appears to be compatible with maintaining agricultural and food output (i.e., EU food security).
In addition, the multilateral trade deal within the OL scenario provides an opportunity for moderate EU economic growth (0.1%), although this is not beneficial for more highly protected (i.e., agriculture, food) or more open (textiles, apparel and leather) bio-based activities. The repercussions of additional EU GHG emissions reductions are felt particularly strongly in the fossil fuels and energy (−9.6%) sector. By way of its backward linkage with upstream sectors, the negative impact on petroleum refining has a detrimental effect on bioenergy demand (−7.5%), biomass supply (−9.8%) and agriculture and forestry residue and feedstock supply. As primary resources are reallocated into relatively “cleaner” sectors (subject to the economic growth assumptions inherent within the baseline), textiles, apparel, leather and biochemical sectors undergo output improvements. With emissions reductions in the OL scenario, there is a rise in the EU28 carbon tax to €95/ton CO2e (not shown), compared with the carbon tax of €15/ton CO2e in the BL (not shown). These cost increases act as a further brake on EU macroeconomic growth (−1.0%), although the real income effect is less than that generated by the biofuel mandate since GHG reductions are accompanied by tax revenue increases.
Although unchanged from the BL, the isolated impacts of projections (proj) and world fossil fuel price (WP) shocks bring significant incremental impacts for bioenergy activity (
Table 5). Indeed, with greater available land resources and expectations of relatively higher rates of land productivity and economic growth in non-EU countries (i.e., Mercosur and North America), there is more spare capacity for non-EU biofuels production in response the changes in EU policy. In the IL scenario, the loss of subsidy support to EU biofuels leads to greater reliance on relatively cheaper non-EU sources, whilst fossil fuel alternatives become relatively cheaper. In the OL scenario, a more ambitious EU biofuel blending mandate pushes up the price of biomass and biofuels (in particular second generation), which isolated from the other scenario shocks, implies that crude oil prices are now relatively cheaper and therefore a more attractive prospect for petroleum refining.
3.3. Bio-Based Sector Employment Trends
Employment data for the base year is taken from Eurostat [
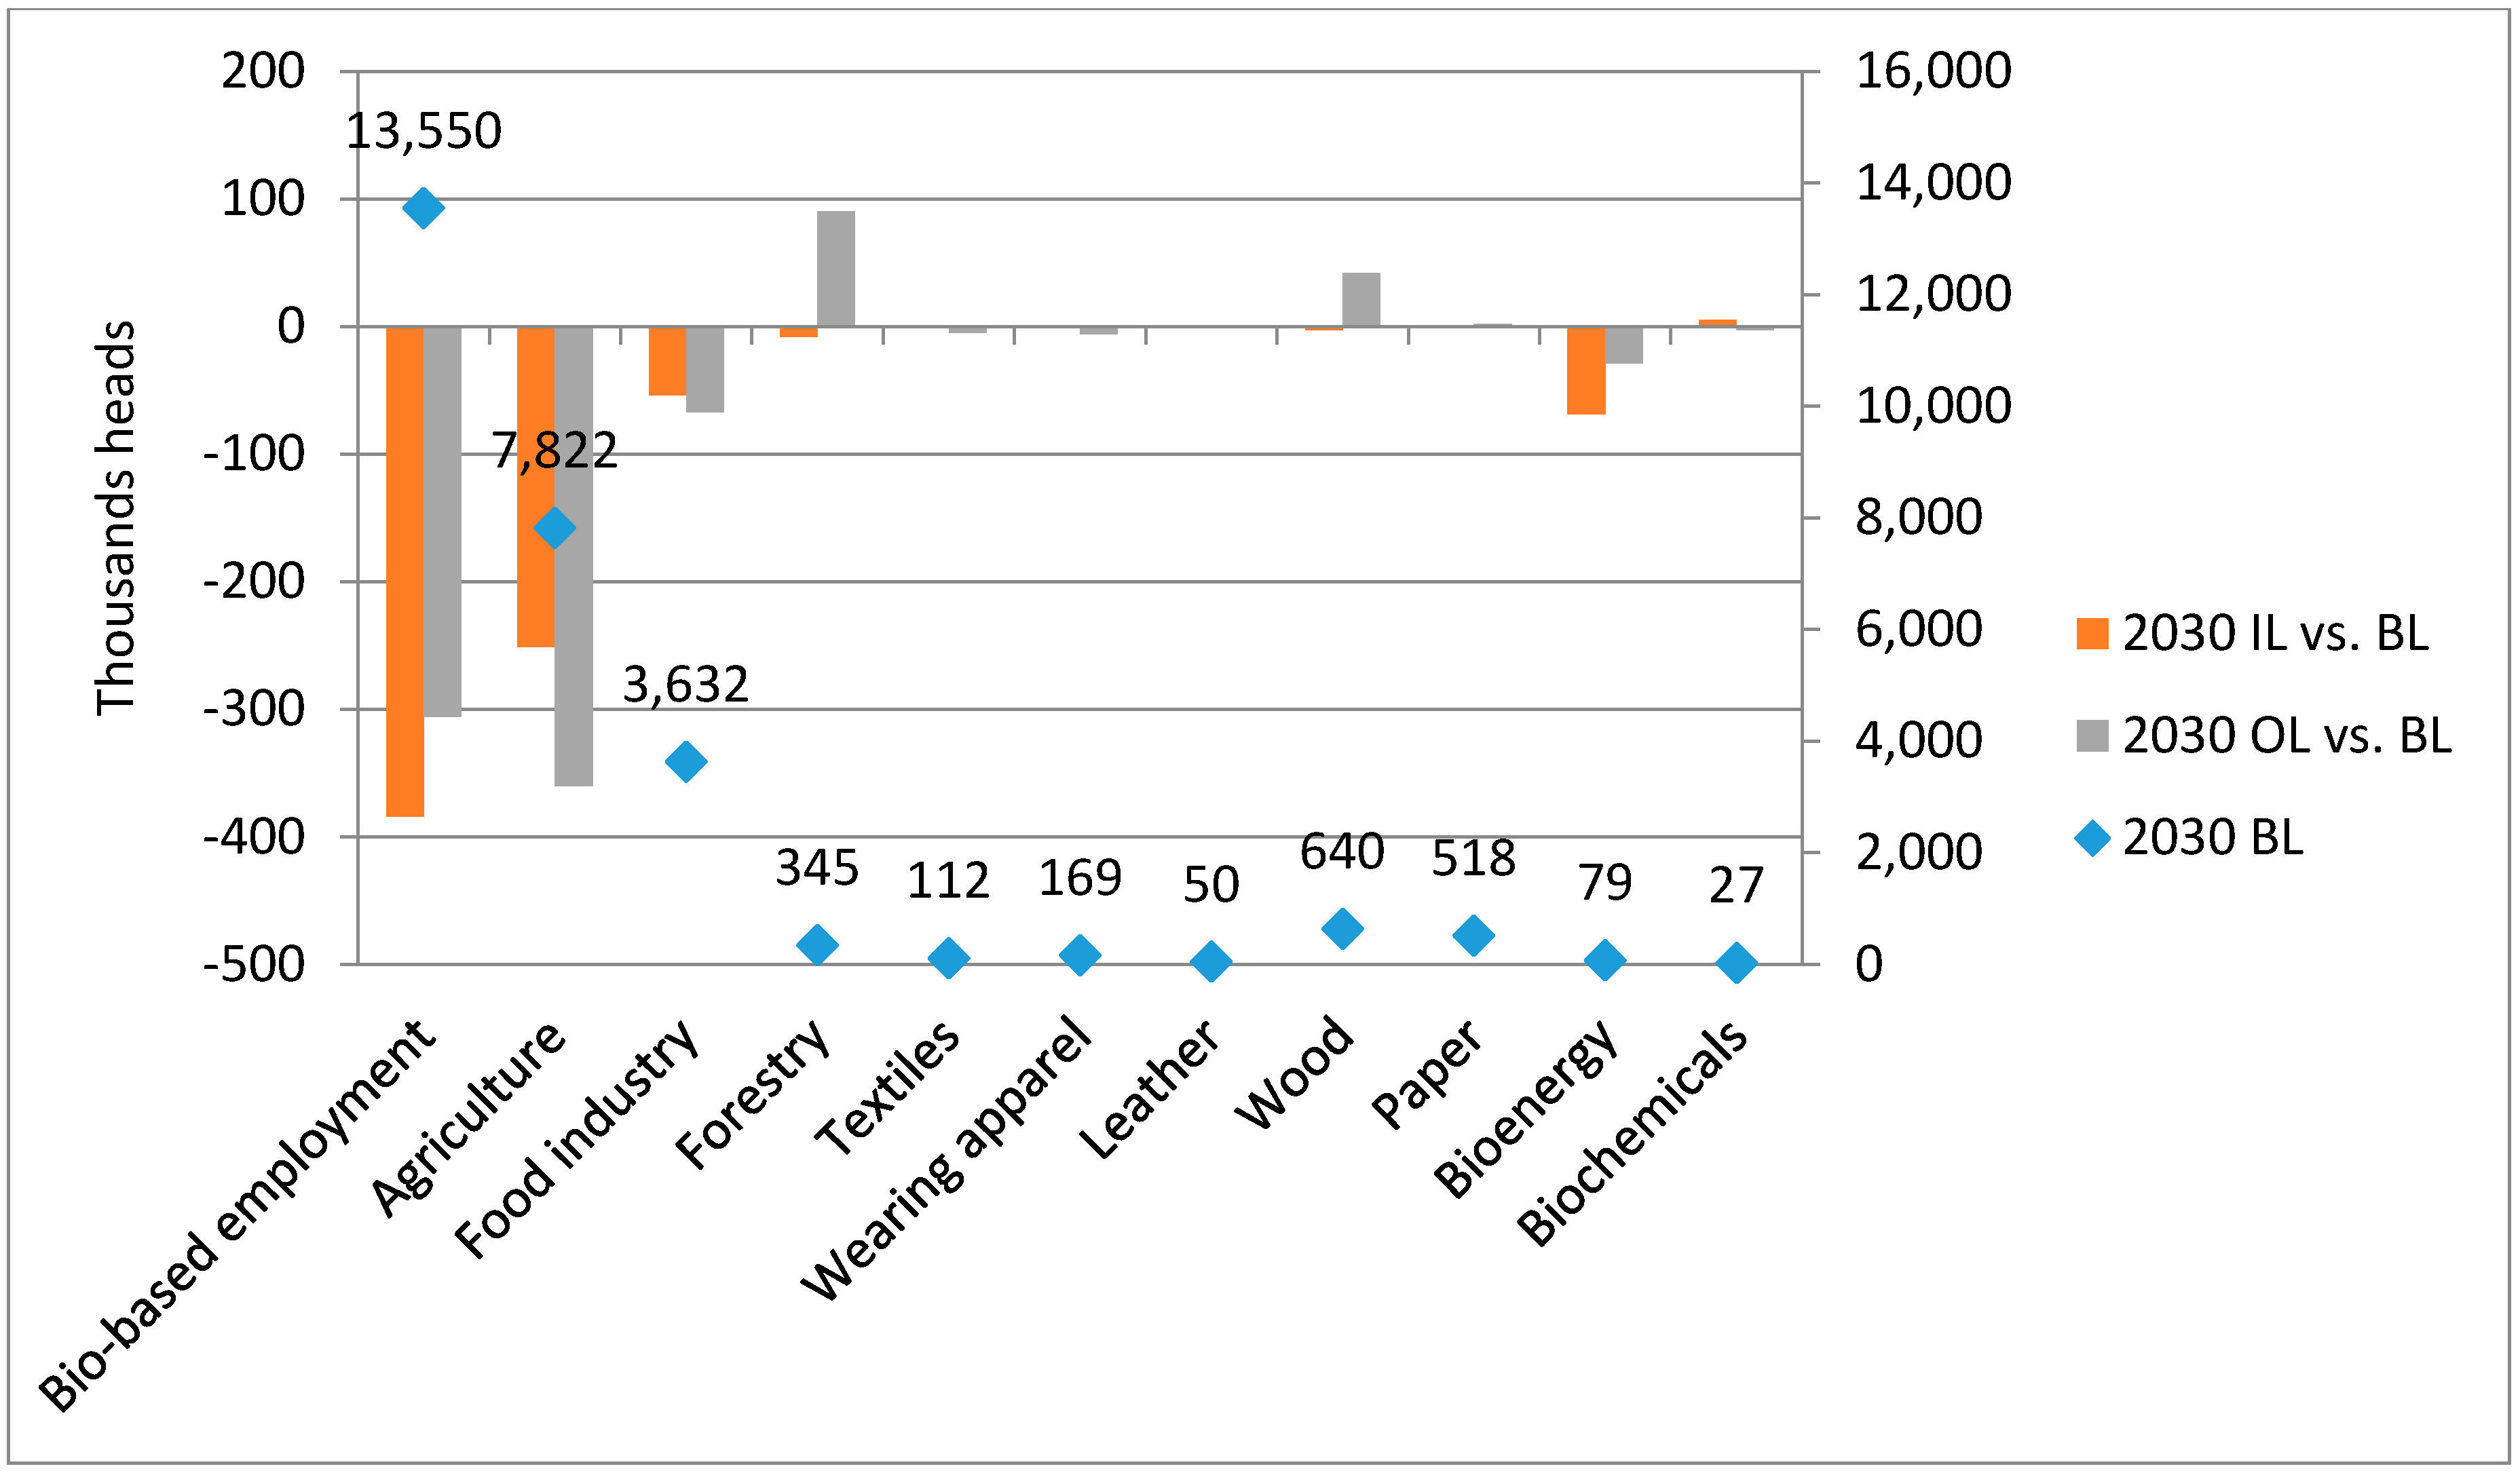
23]. In the biofuels sector, a 2011 estimate of 19,000 workers is employed. Whilst it is further assumed that 5% of the chemical sector workforce is dedicated to biochemicals. The extrapolated employment data (thousands of head) for 2030 are calculated based on percentage changes from 2013 taken from the model results. The square dots in
Figure 2 show EU bio-based sector employment in 2030 (measured on the right hand side axis), whilst the bars report the relative impacts on the number of employees by 2030 (measured on the left hand side axis) when comparing the IL and OL scenarios with the baseline. Despite a very different combination of policy shocks in the IL and OL scenarios, the share of total EU employment dedicated to bio-based activities falls to 5.6% in both policy narratives (compared with 5.7% in the BL).
The sector trends are driven by the output volume changes reported in
Section 3.2. A significant proportion of bio-based employment is based in the agriculture and food sectors, which in the IL scenario contracts by 251,000 and 54,000 workers, respectively. This resulting loss of employment from EU agri-food production explains much of the fall in overall EU bio-based sector employment. It should be noted that we do not claim that our coverage of bio-based activity is comprehensive (see discussion section), whilst no plausible employment data were available for the EU bioelectricity sector. In addition, prospects in the bioenergy sector are also reduced significantly (−69,000 workers) in the IL scenario, which are not compensated by the small employment increases in traditional sectors such as textiles and apparel, as well as the biochemical sector (
Figure 2).
Under the OL scenario, primary agriculture sheds even more workers (approximately 360,000). Based on the output drivers (
Section 3.2), this is from a combination of (in order of magnitude) unilateral EU GHG emissions reductions, the multilateral trade deal and CAP policy. Some job growth is recorded in the forestry and wood products sectors, whilst in the bioenergy sector, despite the higher mandate, there is a loss of 29,000 workers compared with the BL owing to the drop in derived demand from the downstream petroleum (blending) sector, largely motivated by additional EU GHG reductions (
Figure 2).
3.4. Bioenergy Markets
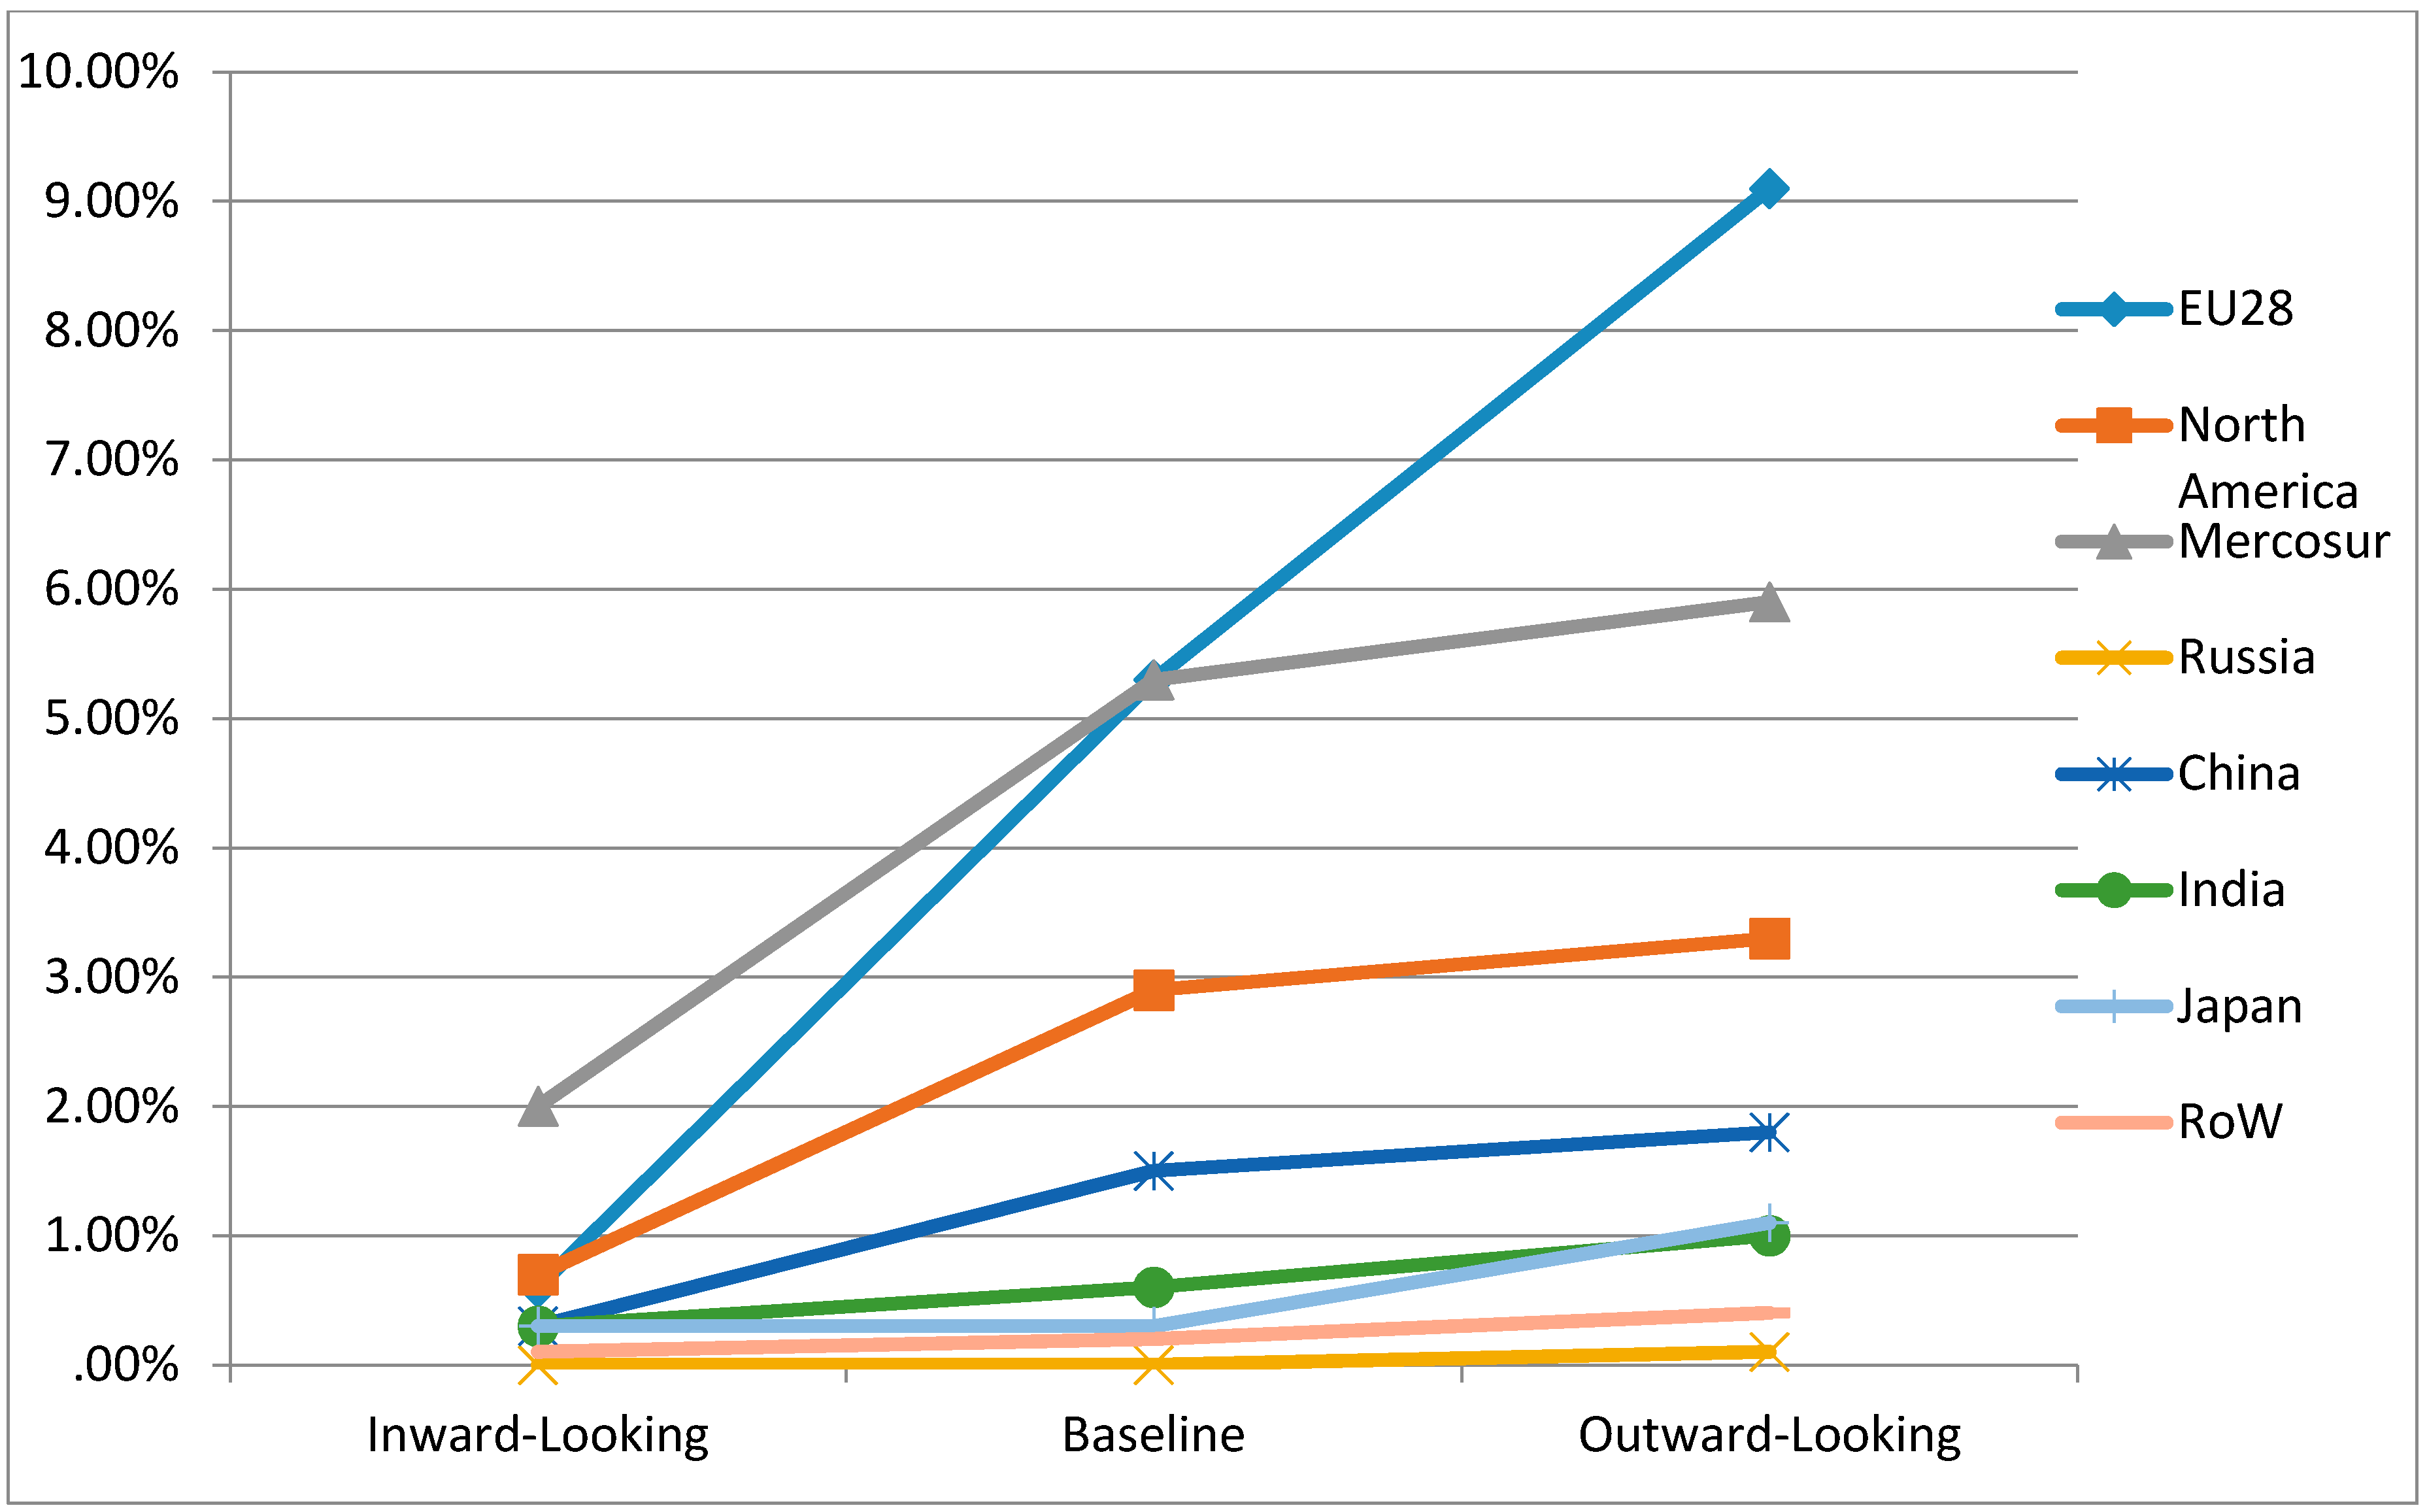
By virtue of the scenario designs underlying the three realities in our experiments,
Figure 3 clearly shows that by 2030, there is a rise in the output share of bioenergy in total EU energy production as one moves from the IL to the baseline to the OL. In the BL, EU biofuels command an ever increasing value share of energy production, rising from 1.8% in 2013 to 5.3% by 2030 (
Figure 3). To supplement internal EU demand, non-EU bioenergy output shares also rise toward 2030 (particularly Mercosur and North America). With the removal of the mandate (IL scenario), the EU bioenergy output share drops to 0.6% by 2030, which also impacts negatively on non-EU bioenergy production. In the OL scenario, relatively higher blending mandates in the 2020–2030 period exacerbate the BL trend even further as even higher internal EU demand further increases Mercosur and North American bioenergy production shares.
As expected, the EU’s biofuel mandate shock has an important relative impact on EU internal bioenergy and petroleum prices. In the IL scenario (
Table 6—top half), the loss of the blending subsidy increases the relative market price of petroleum by 1.5%, whilst the resulting reduction in blending demand deflates the relative price of (first generation) biodiesel and bioethanol and second generation biofuels (−26%). As biomass prices fall, bioelectricity prices also fall in the EU. In the OL scenario (
Table 6—bottom half), aggressive blending targets (raised from 1.5% to 5%—see
Table 3) are mandated for second-generation biofuels, which generates significant market price increases compared with the baseline as a result of supply bottlenecks in upstream energy crops, pellets and residues sectors. On the other hand, the resulting rise in the blending subsidy to meet mandated targets reduces petroleum prices.
In the OL scenario, the need for higher carbon taxes to meet additional GHG reductions, increases the EU’s energy bill for final consumers of electricity (7.8%), gas (7.0%) and petroleum (3.1%), compared with the BL. The resulting output contraction in these energy refining and processing industries reduces derived demand for bio-based (and fossil) energy inputs, thereby depressing market prices.
3.5. Biofuel Land Usage
Benchmark estimates of land use by each region (in km
2) are taken from a biophysical model known as IMAGE [
24]. Examining the BL, it is clear to see that the EU mandate leads to a steady increase in the share of total land where, by 2030, 3.3% of total available land is dedicated to first generation biofuels (
Table 7). In the IL scenario, the elimination of the EU biofuel regime wipes out a large proportion of land dedicated to first generation biofuel production, again supporting the notion that without fiscal support, this EU bio-based sector remains uncompetitive. As discussed above, in the non-EU regions, the cessation of EU biofuel mandates also reduces biofuel land usage in Mercosur (from 2.7% to 1.1%) and North America (from 6.3% to 1.5%), compared to the BL.
In the OL scenario, a priori one might expect to find increased land shares devoted to biofuel production with policy induced increases in the blending mandates. As discussed above (
Section 3.2), the impact of additional EU GHG emissions reduces the EU’s macroeconomic performance, which (inter alia) lowers EU internal demand for bio-based fuels by the blending (petroleum) sector, leading to lower land usage compared with the BL. With lower EU import demands for biofuels, North America’s first generation land use shares also decline slightly compared with the baseline, although Mercosur performs more or less the same, largely due to the greater opening of global markets under the agreed multilateral trade negotiations.
4. Discussion
The use of biomass as a part-solution for achieving a sustainable model of growth is an attractive prospect, although as a biologically-renewable input, it is restricted by the availability and quality of land and water resources. This implies that economic choices must be made on optimal uses of biomass, which are governed by fragmented policies. The results show that policies, in isolation from one another, can achieve singular aims such as lower carbon energy technologies (biofuel policies), environmentally responsible production techniques (CAP “greening”), or reduced greenhouse gas (GHG) emissions (environmental policy).
There is even limited evidence that biomass policy can achieve multiple societal goals. For example, the “greening” of EU agriculture, by shifting payments from market support (Pillar 1) to rural development (Pillar 2), maintains rural incomes and promotes greater extensification in production (i.e., environmental protection), whilst only carrying a relatively small cost in terms of lost output (and by extension, employment and EU food security).
The experience of bioenergy policy is, however, very much less successful in this regard. As a limited biologically renewable resource, available biomass provision, even when buttressed by EU fiscal support mechanisms and ready access to imports from Mercosur and North America, cannot keep pace in support of overly ambitious first and second generation EU blending mandates. The emergence of biomass supply “bottlenecks” consequently leads to economic inefficiencies in the supply chain which compromises the goal of EU macroeconomic growth. In addition, there is also an imbalance in biomass policy priorities, with the result that biofuel mandates crowd-out other bio-based activities (i.e., biochemicals) which, it has been argued [
25], may potentially generate higher value added to the economy.
The picture is further complicated when adding environmental policy considerations into the mix. Whilst policy induced reductions in GHGs penalize environmentally prejudicial fossil based energy industries, this measure clashes with the biofuel mandate owing to the negative impact of higher GHG cuts on the scale of the petroleum (blending) industry. On a broader level, comparing the OL and BL scenarios, policy induced reductions in GHGs have a similarly detrimental impact on a number of bio-based activities, which is greater than the (average) impact on EU GDP. For example, in the case of a key biomass provider such as primary agriculture, it is clear that GHG emissions are of a disproportionately higher intensity due to the emission of non-CO2 gases with higher global warming potentials. For policy makers, this presents a fundamental incompatibility between biomass provision and environmental policy goals.
These observations underline the need to develop a fully coherent policy framework for responsible and efficient biomass allocation. A holistic notion of a “cascading” principle of biomass usage has been mooted [
26], which advocates higher value added applications of biomass, prior to subsequent reuse and recycling of residues and waste for lower value added uses. From the perspective of energy markets, this framework places bioenergy at the bottom of the cascade which contradicts current EU biomass policy priorities. A further point is how to practically implement this “one-size-fits-all” framework, since different EU regions may have contrasting visions of what constitutes “high value” [
27], which has given rise to ongoing work at the European Commission to systematically generate a co-ordinated survey and cataloguing of different biomass uses [
28].
On a broader level, it is recognized by [
29] that any attempt to forge a sustainable economic system must be accompanied by a societal change in attitudes toward the importance, contribution and limits of biomass usage. More specifically, [
29] points out the need for increased dialogue to inform consumers and producers of the dangers of over-consumption (e.g., food waste) and logistical supply chain leakages, which are wholly compatible with the cascade principle.
This section closes with some caveats. Neoclassical computable general equilibrium (CGE) frameworks, in common with any modelling approach, have limitations. In approximating “reality”, we must resort to stylized assumptions to characterize the optimizing behavior of economic agents (i.e., consumers, producers, investors). Moreover, CGE models suffer from parametric uncertainty, which is central to the response of said agents to price signals; a weakness which can only be partially overcome by recourse to relatively scant estimates in the econometric literature.
With respect to the focus of this study, the sectoral coverage of bio-based activity goes far beyond the traditional definitions in the national accounts data, although there is space for future improvement. As an important component of the Member State National Renewable Energy Action Plans (NREAPs), biomass for heat should be contemplated in future research, although some careful consideration of different bioheat sources (industrial heat, private heat) and technologies is necessary. In addition, further coverage of biochemicals (base chemicals, polymers and specialty—e.g., paints, dyes, lubricants, lacquers, etc.—and consumer-chemicals—e.g., perfumes) would also help provide a more complete picture. Moreover, the study does not fully accommodate the environmental impact of indirect land use changes (ILUC) induced by (biofuels) policy, land usage between forestry and agricultural activities and the spatial variety of the agro-ecological land types across region. These issues constitute key priorities for further research.


