Abstract
The power generation capacity of piezoelectric energy harvesters (PEHs) is not only related to the properties of the piezoelectric material, the vibration magnitude and the subsequent conditioning circuit, but also to the fixation modes and adjustment methods. In this paper, a commercial piezoelectric ceramic plate (PCP) in simply supported beam fixation mode and cantilever beam fixation mode were analyzed through finite element simulations and experiments, and furthermore, two ways of adjusting the natural frequency of PCP are studied and compared. As a result, some guidelines are proposed for the application of PCPs according to the simulation and experimental results which showed that: (1) the simply supported beam fixation mode is suitable for environments in which the exciting frequency exceeds 50 Hz, while the cantilever beam fixation mode fits the circumstance where the exciting frequency is below 50 Hz; (2) the maximum generation power a PCP produces in simply supported beam fixation mode is larger than that in cantilever beam fixation mode; (3) adjusting the weight of the mass block affixed on the PCP can change the natural frequency of PCP more efficiently than length-width ratio does.
1. Introduction
In recent years, the fast development of microelectronics and wireless communication technology has promoted the wide use of wireless sensor networks (WSNs), however, batteries are needed to power the wireless sensor nodes, and must be recharged or replaced when their capacity is low, which is a prominent drawback in the development of WSNs. Many scholars have prosed ways to scavenge energy from the ambient environment to powerwireless sensor nodes, which represents a reasonable solution to the problem. Nowadays, studies on ambient energy scavenging technology are developing very fast [1]. These energy capture technologies include solar energy capture technology, wind energy capture technology, electromagnetic energy capture technology and vibration energy capture technology, etc. [2]. Among these technologies, solar energy capture and wind energy capture technologies have been studied for decades, and great developments have been achieved [3,4], however, these two important energy harvesting methods require certain conditions (i.e., sunlight or wind must exist), besides, the volume of devices used by these two energy harvesting methods are relatively large in size, causing inconvenience in some application areas, such as mine data acquisition and other dark sealed places. Electromagnetic energy is spread almost everywhere around the world, but its energy density is rather low and unstable [5,6]. Vibration energy harvesting is a fast developing field due to the wide availability of vibration sources and various ways of harvesting them, and relatively high conversion efficiency [7]. Nowadays, three methods to collect the vibration energy are considered to be most promising, namely, the capacitive method, the electromagnetic induction method and the piezoelectric method [8]. A comprehensive comparison of these three different methods suggests that the piezoelectric method is simple, the devices are easy to manufacture and they have high output voltages, which makes it the most reasonable choice in the vibration energy harvesting field [9]. So far, many scholars have done a lot of work and made incredible achievements in the piezoelectric energy harvesting field. As early as 2001, Shenck et al. [10] from the Massachusetts Institute of Technology successfully developed electrical power generating sports shoes utilizing a piezoelectric plate. Ottman [11] studied the performance of a variety of subsequent conditioning circuits for piezoelectric energy harvesters. In 2010, the Linear Technology Company designed and produced the integrated LTC3588 chip, which is specially designed for micro energy collection in the ambient environment. Zhou et al. [12,13,14] abandoned the conventional way of using mechanical vibrations as the excitation source and adopted wind or a flowing fluid to excite PCPs, which expands the PCP application field. Xu et al. [15,16,17] adjusted the structure aspects of the PCP in order to maximize the power generation capacity. Abdelkefi et al. [18] studied through theoretical analysis and finite element method simulations a special electromechanical model in which the piezoelectric sheet does not cover the whole substrate beam. By quantifying the compromise between the length of the piezoelectric material, the load resistance, and the excitation frequency, the performance of beam-mass system was optimized. Abdelkefi et al. also designed a new structure which can produce both bending and torsion in PCPs to enhance their power generation, and the results showed that the harvested power can be increased by as much as 30% compared with sedigns where beam only undergoes bending [19]. Sharpes et al. [20,21] created a totally new zigzag-dimensional beam with a low volume and compared its power generation capacity with that of a conventional beam. It turned out that the new zigzag-dimensional beam can provide a significant increase in power. Tang and Abdelkefi et al. [22,23,24] proposed and studied a new PCP structure with a magnet. With the help of the magnet, a broad operating bandwidth of the energy harvester was studied, especially in low frequency. As shown above, no matter what the excitation source is, mechanic vibration or fluid vibration, cantilever beams for PCPs are the most commonly used fixation mode, while the simply supported beam fixation mode is rarely adopted. Gafforelli et al. [25] displayed a bridge-shaped energy harvest which actually is a PCP in simply supported beam fixation mode, but they did not study the influence(s) of the mass block and length-width ratio on the power generation of the PCP in simply supported beam fixation mode, and no comparisons between bridge-shaped PCPs and ordinary PCPs in cantilever beam fixation mode were discussed. Besides, adding a mass block on a PCP is often adopted to change its natural frequency, but other methods such as changing the length-width ratio of PCP are scarcely reported. Both the simply supported beam fixation and the influence of length-width ratio have not been comprehensively studied, so in this paper finite element simulations and experiments were performed to figure out how the fixation mode and the adjustment method influence the power generation capacity of a PCP.
2. Model Parameters
A commercial PCP was adopted as the simulation model. As shown in Figure 1, this PCP is composed of a copper plate and two piezoelectric patches. The two piezoelectric patches are affixed on the two sides of the copper plate via glue, making the PCP produce twice the quantity of electrical power as the design with only one piezoelectric patch does, thus the PCP parallel connection method is often selected to produce large currents in practical applications.
The parameters of each material in the PCP are shown in the Table 1. The copper plate material is copper CW617N, and the mass block is nickel. The material parameters of the copper plate and mass block include Young’s modulus, Poisson ratio and density, and the material parameters of piezoelectric patch include elastic coefficient matrix, piezoelectric matrix and dielectric constant matrix [26]. Element solid45 is taken to mesh the copper plate and mass block in ANSYS, meanwhile, coupled field element solid5 is selected to mesh the piezoelectric patch.
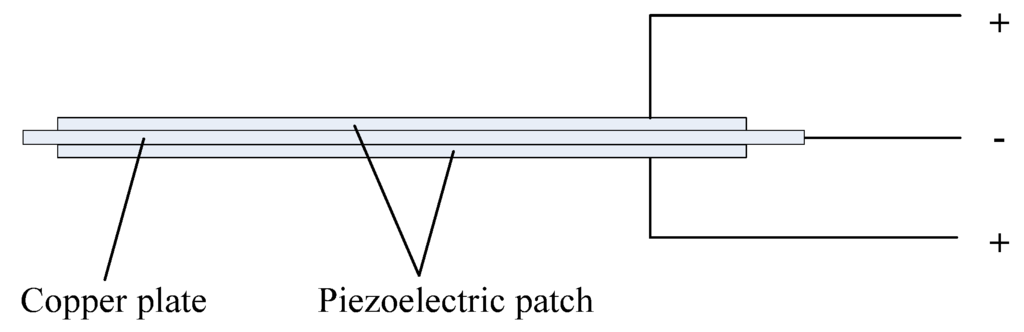
Figure 1.
Structure of PCP.
Figure 1.
Structure of PCP.


Table 1.
Parameters of the device materials.
| Parameter | Copper Plate | Piezoelectric Patch | Mass Block |
|---|---|---|---|
| Young’s modulus (GPa) | 110 | – | 180 |
| Poisson ratio | 0.324 | – | 0.3 |
| Density (kg/m3) | 8300 | – | 8900 |
| Elastic coefficient matrix | – | D | – |
| Piezoelectric matrix | – | e | – |
| Dielectric constant matrix | – | ε | – |
In Table 1, D, e, ε is elastic coefficient matrix, piezoelectric matrix and dielectric constant matrix respectively and their values are as follows:
In the simulation part, modal analysis was carried out first to get each order natural frequency of the PCP, and then harmonic response analysis was adopted to get the voltages generated by the PCP under the harmonic force. Before starting the harmonic response analysis, the harmonic force and frequency range need to be defined. The harmonic force was set to 0.5 N in every harmonic response analysis and frequency range was keeping near the natural frequency of PCP acquired in modal analysis. With the help of harmonic response analysis, the information of stress, displacement and voltage, etc. at any position of the PCP can be obtained after calculation. Voltages on the top side of the piezoelectric patch are recorded during each harmonic response analysis in this paper. The process of acquiring voltage is as follows: first, each side of the piezoelectric patch is coupled to be completely in voltage. Next, the voltage on the bottom side is set to 0 V as GND. Finally, the voltage on the top side is extracted via command NSOL (a command stream in ANSYS) after calculation and displayed versus exciting frequency.
3. Simulation of Simply Supported Beam Fixation Mode
For the convenience of simulations and experiments, only one end of the PCP in simply supported beam fixation mode is fully restricted, and the other end is restricted in the Y and Z directions in order to produce larger horizontal movements when the PCP deforms. Figure 2 displays the model switch of the simply supported beam model.
Two adjustment methods, mass block affixed on the PCP and length-width ratio of the PCP, are analyzed in our simulation under simply supported beam fixation mode. In the simulation of simply supported beam fixation mode, the size of the piezoelectric patch is 50 mm × 50 mm, and it remains constant during the simulation process. First, the weight of the mass block affixed on the center of PCP works as the variable to study the influence of the mass block. Then, the ength-width ratio of the piezoelectric patch is taken as variable to study its influence, and during this step, no mass block is affixed on the PCP. Each order natural frequency of PCP can be acquired through modal analysis and the first order was selected as the natural frequency of PCP. Maximum output voltages corresponding to specific weights of mass block or length-width ratios can be obtained via harmonic response analysis. The harmonic force exerted on the node located in the center of the PCP is 0.5 N in the harmonic response analysis and exciting frequency range is set near the natural frequency of PCP gained in modal analysis. Figure 3 shows the models after meshing and defining constraints in simply supported beam fixation mode.
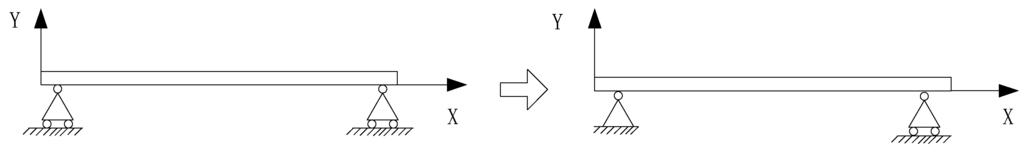
Figure 2.
Model switch of simply supported beam model.
Figure 2.
Model switch of simply supported beam model.

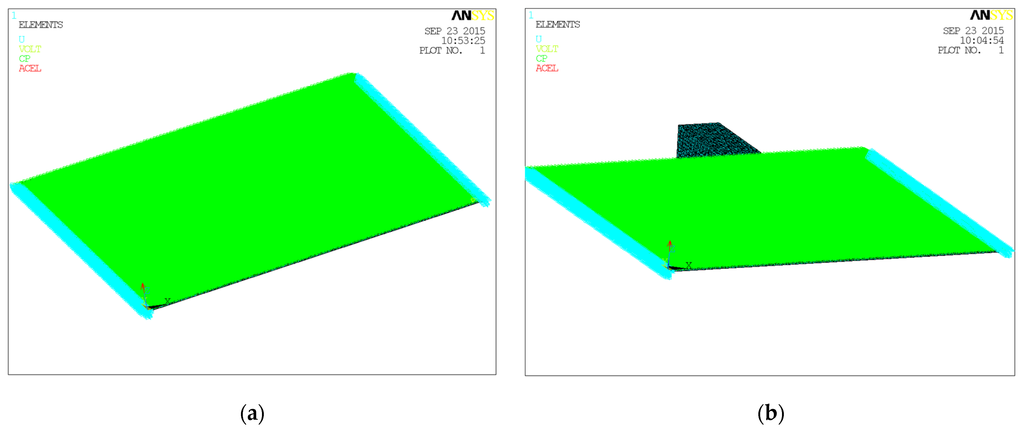
Figure 3.
Models after meshing and defining constraints in simply supported beam fixation mode: (a) With mass block; (b) Without mass block.
Figure 3.
Models after meshing and defining constraints in simply supported beam fixation mode: (a) With mass block; (b) Without mass block.

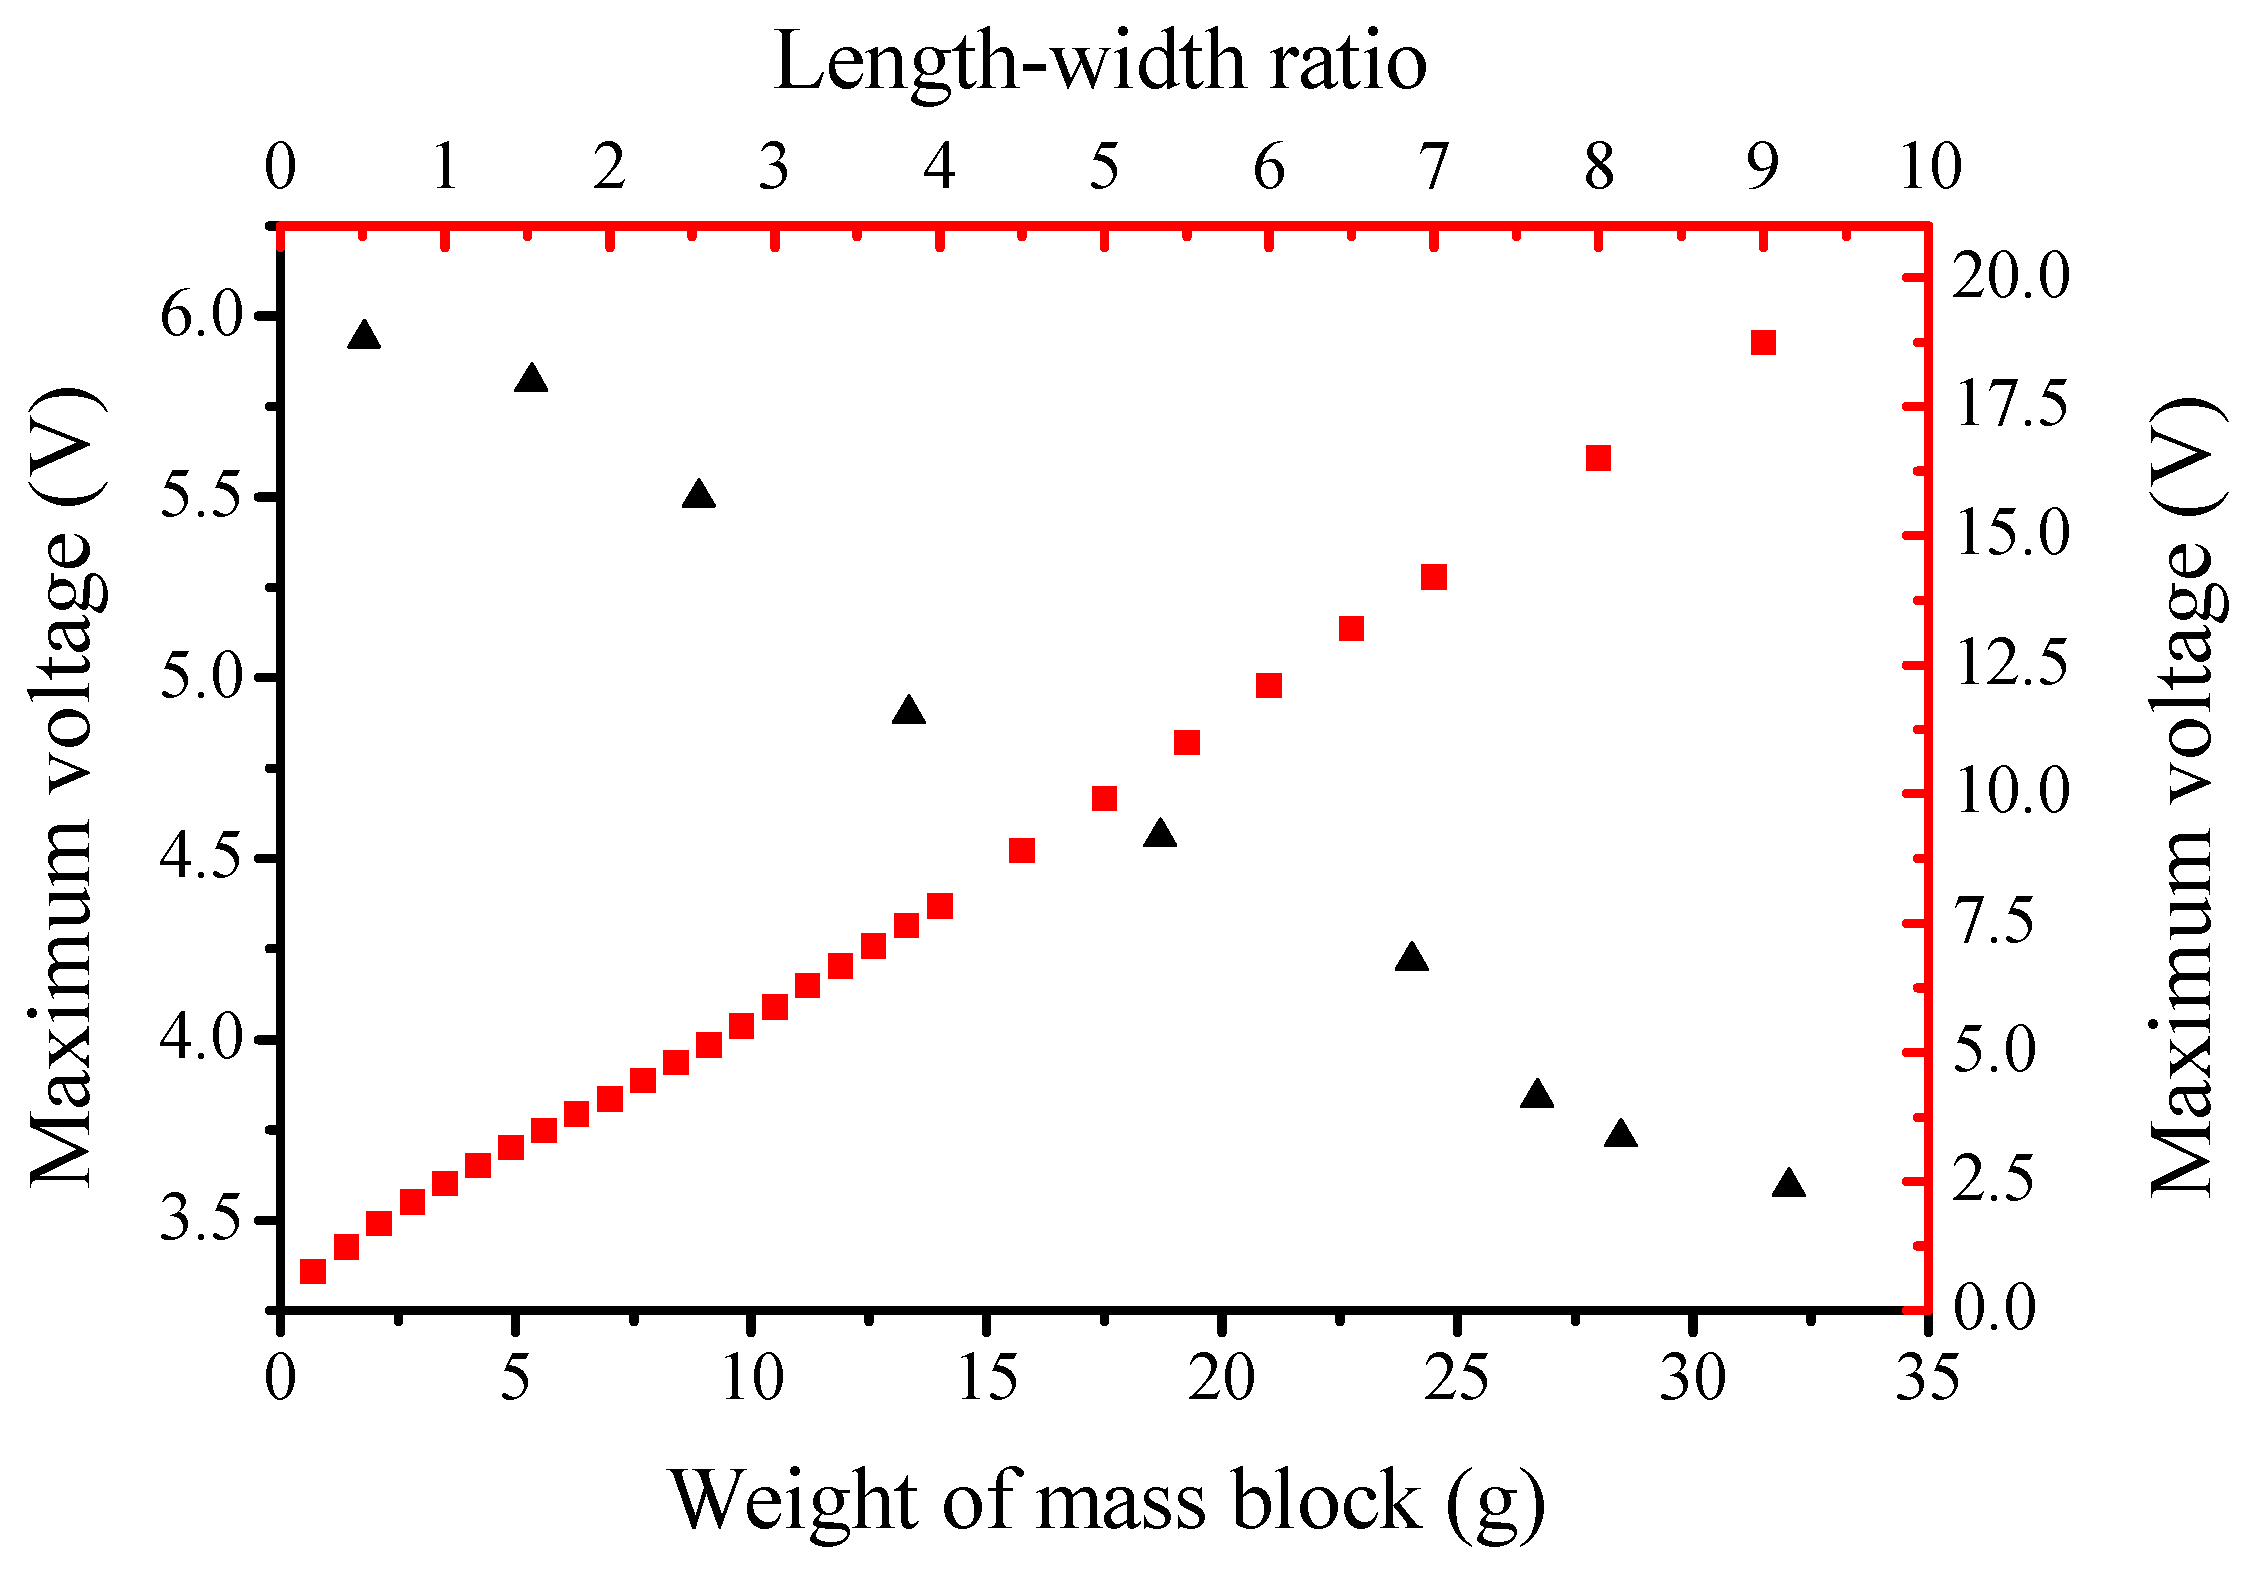
From Figure 4, it is obvious that both of the natural frequency of PCP and exciting frequency at maximum voltage decrease with the increase of weight of mass block. As shown in Figure 5, the natural frequency of the PCP and the excitation frequency at maximum voltage also drop rapidly with the increase of length-width ratio when the length-width ratio is below 1, and flattens out gradually if the length-width is more than 1. Figure 4 and Figure 5 indicate that the exciting frequencies at maximum voltage of each PCP affixed with different mass block coincide well with the natural frequencies of the PCPs. Therefore, the exciting frequency should be set nearby the natural frequency of the PCP to obtain maximum voltage. Figure 6 demonstrates that with the rise of weight of the mass block affixed on the PCP, the maximum voltage keeps falling. Conversely, maximum voltage goes up with the increase of length-width ratio of PCP. By comparing the influences of weight of mass block and length-width ratio on power generation performance of PCP in simply supported beam fixation mode, we can conclude that: (1) It is more effective to change length-width ratio of the PCP than weight of the mass block for adjusting the natural frequency of the PCP in simply supported beam fixation mode; (2) A wider range of generated voltage can be obtained by changing the length-width ratio compared with altering the weight of mass block.
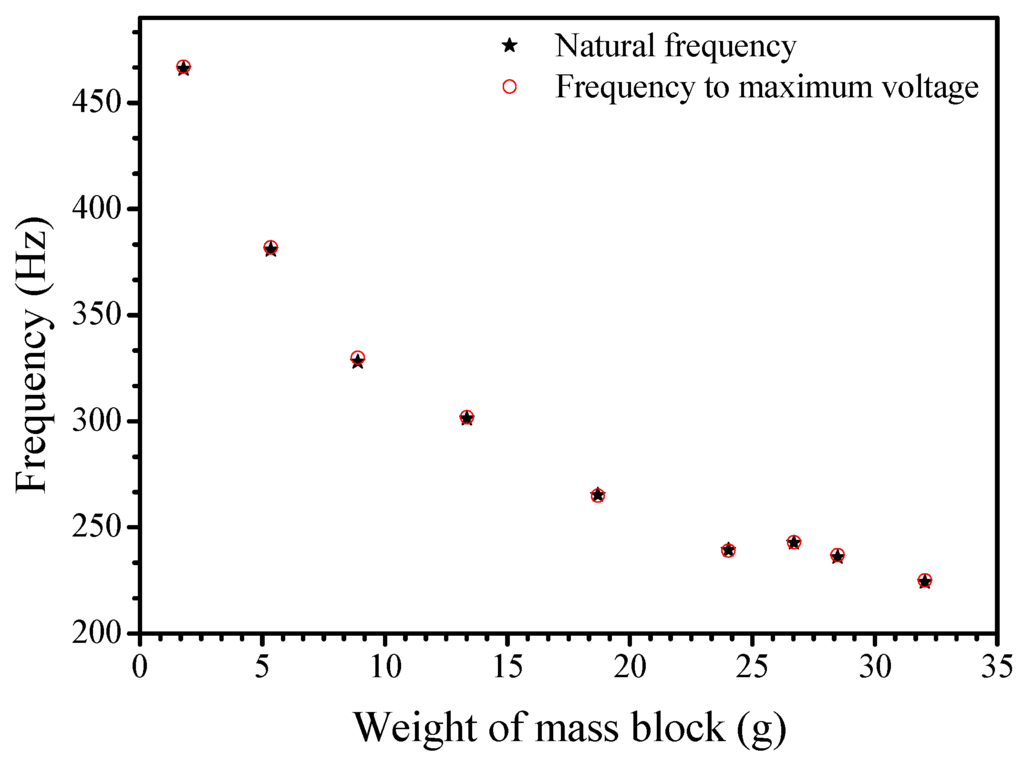
Figure 4.
Weight of mass block versus natural frequency of PCP and exciting frequency at maximum voltage in simply supported beam fixation mode.
Figure 4.
Weight of mass block versus natural frequency of PCP and exciting frequency at maximum voltage in simply supported beam fixation mode.
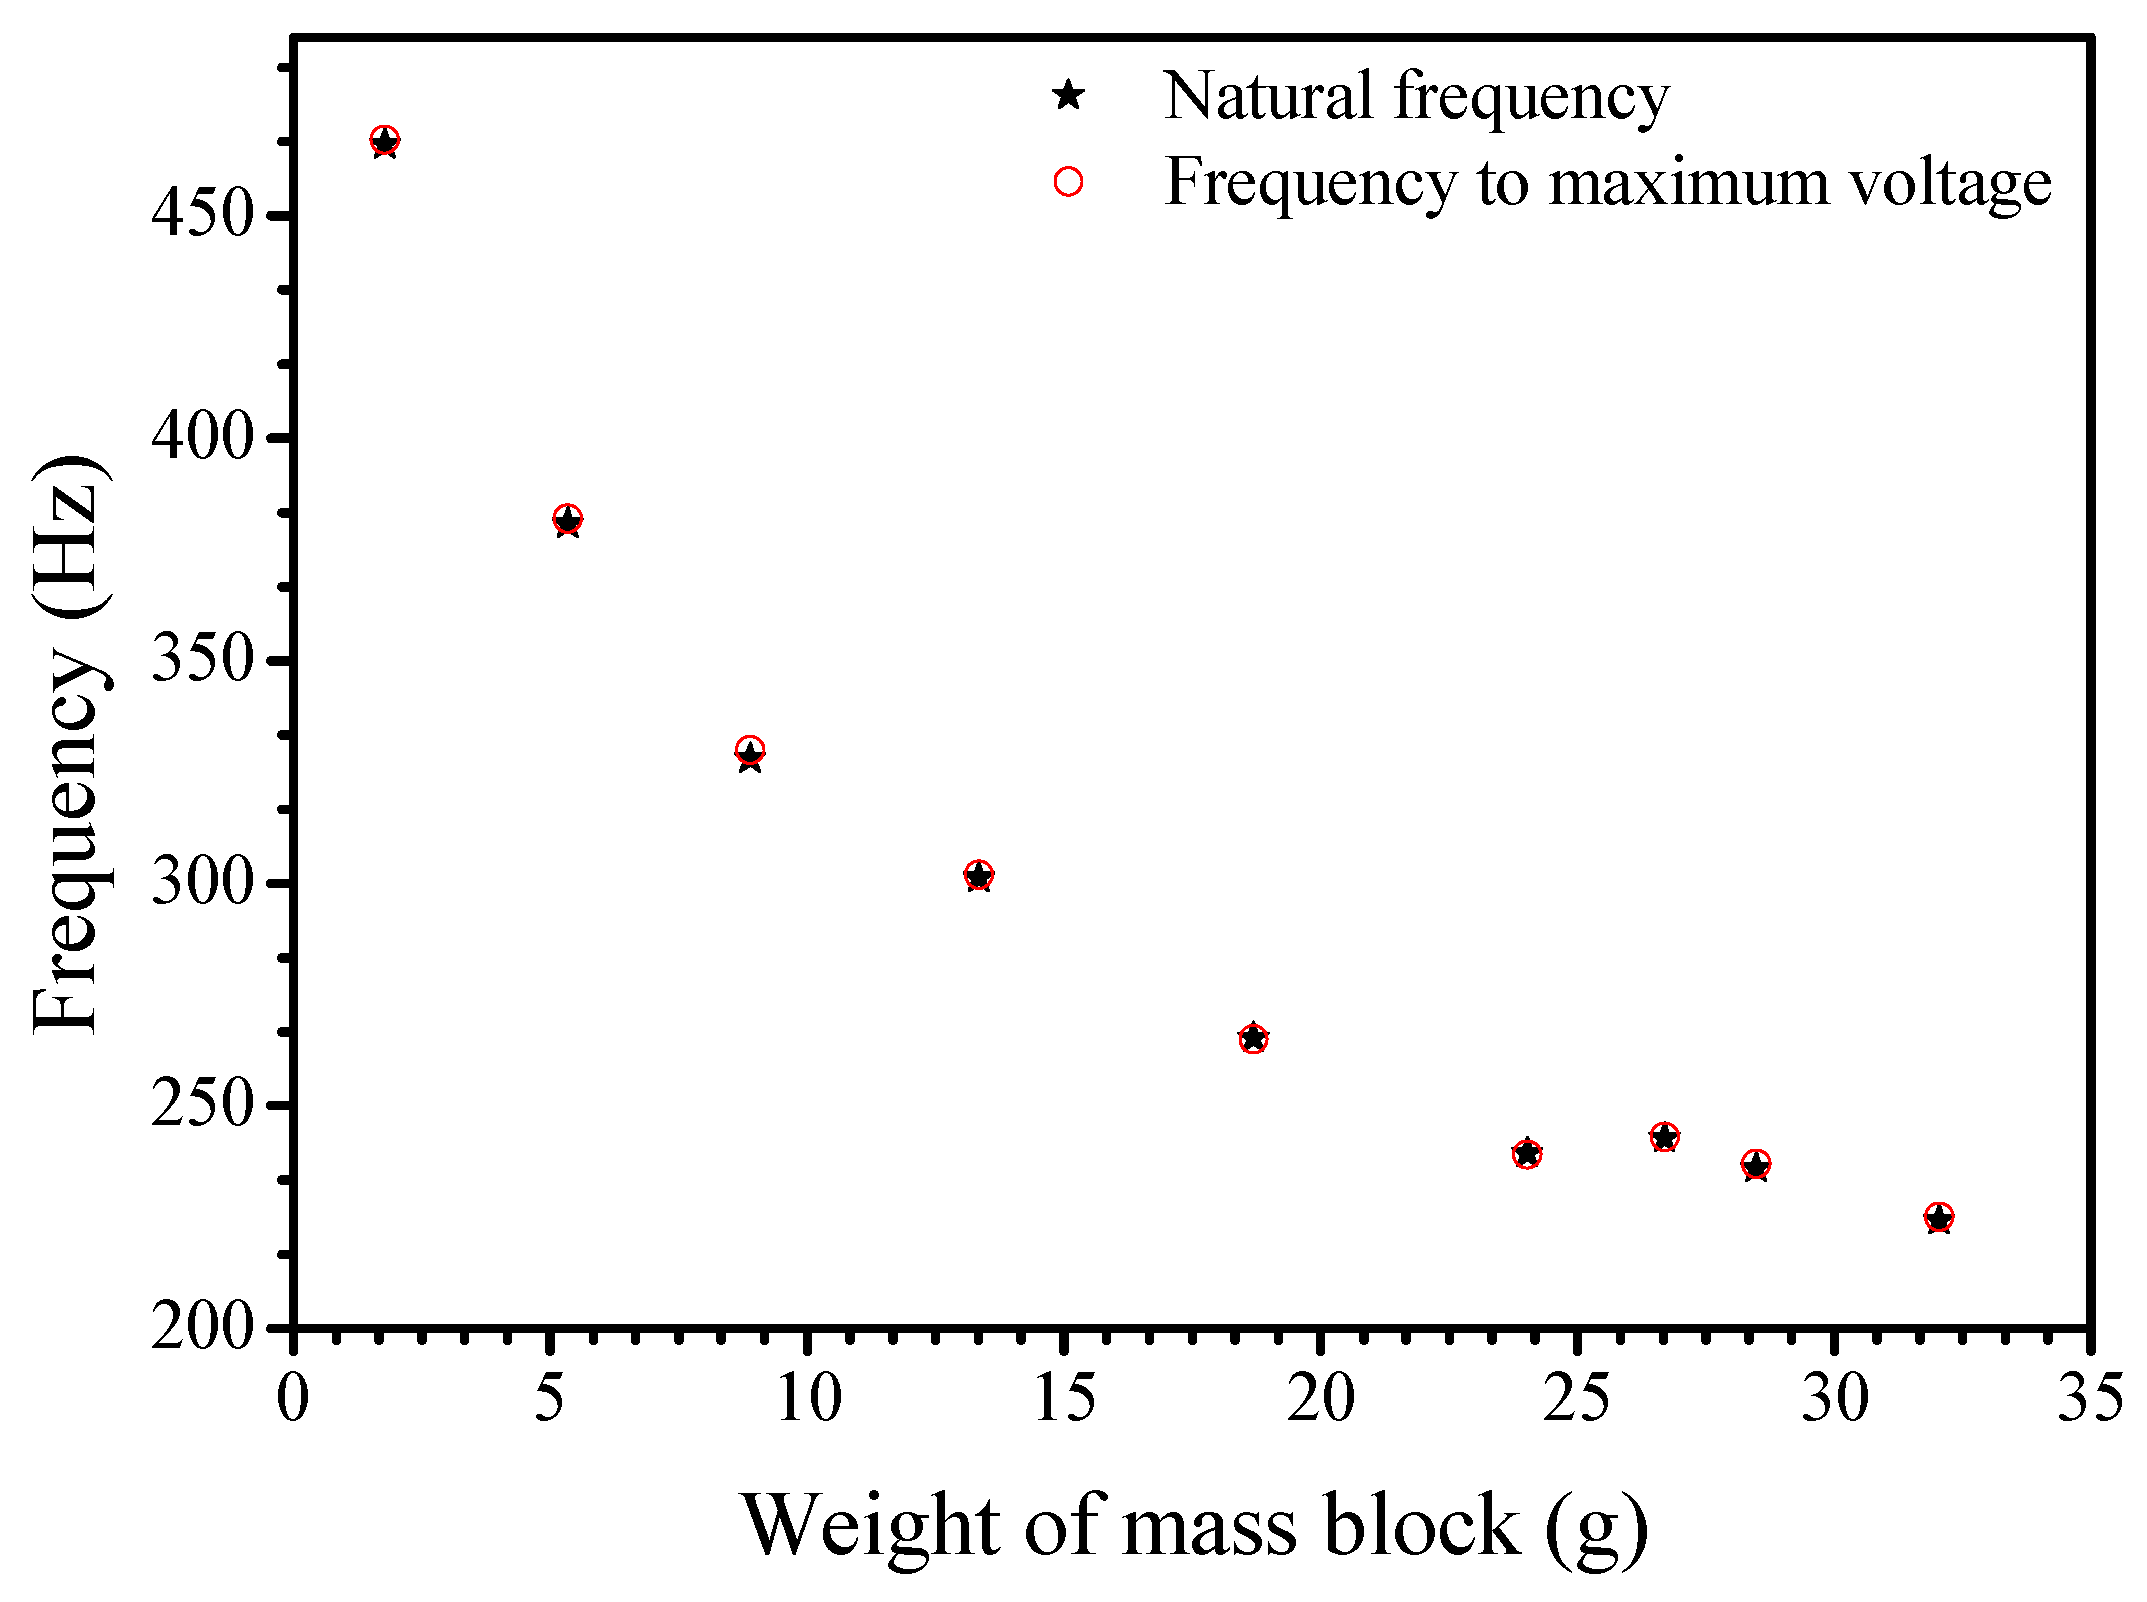
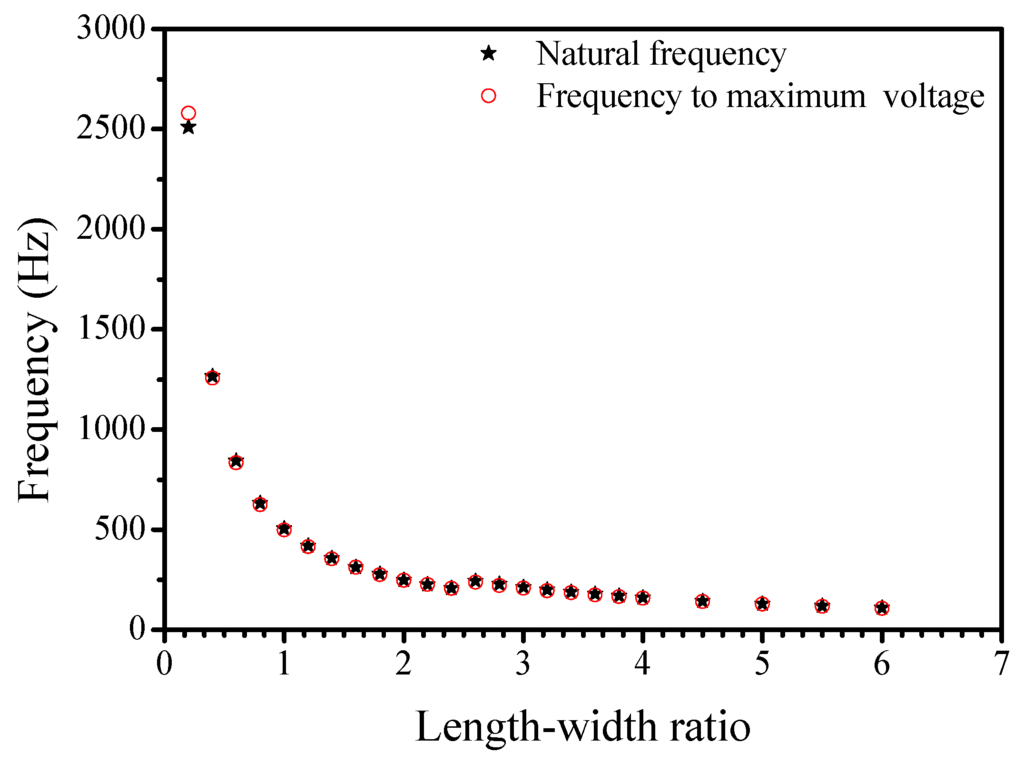
Figure 5.
Length-width ratio versus natural frequency of PCP and exciting frequency at maximum voltage in simply supported beam fixation mode.
Figure 5.
Length-width ratio versus natural frequency of PCP and exciting frequency at maximum voltage in simply supported beam fixation mode.
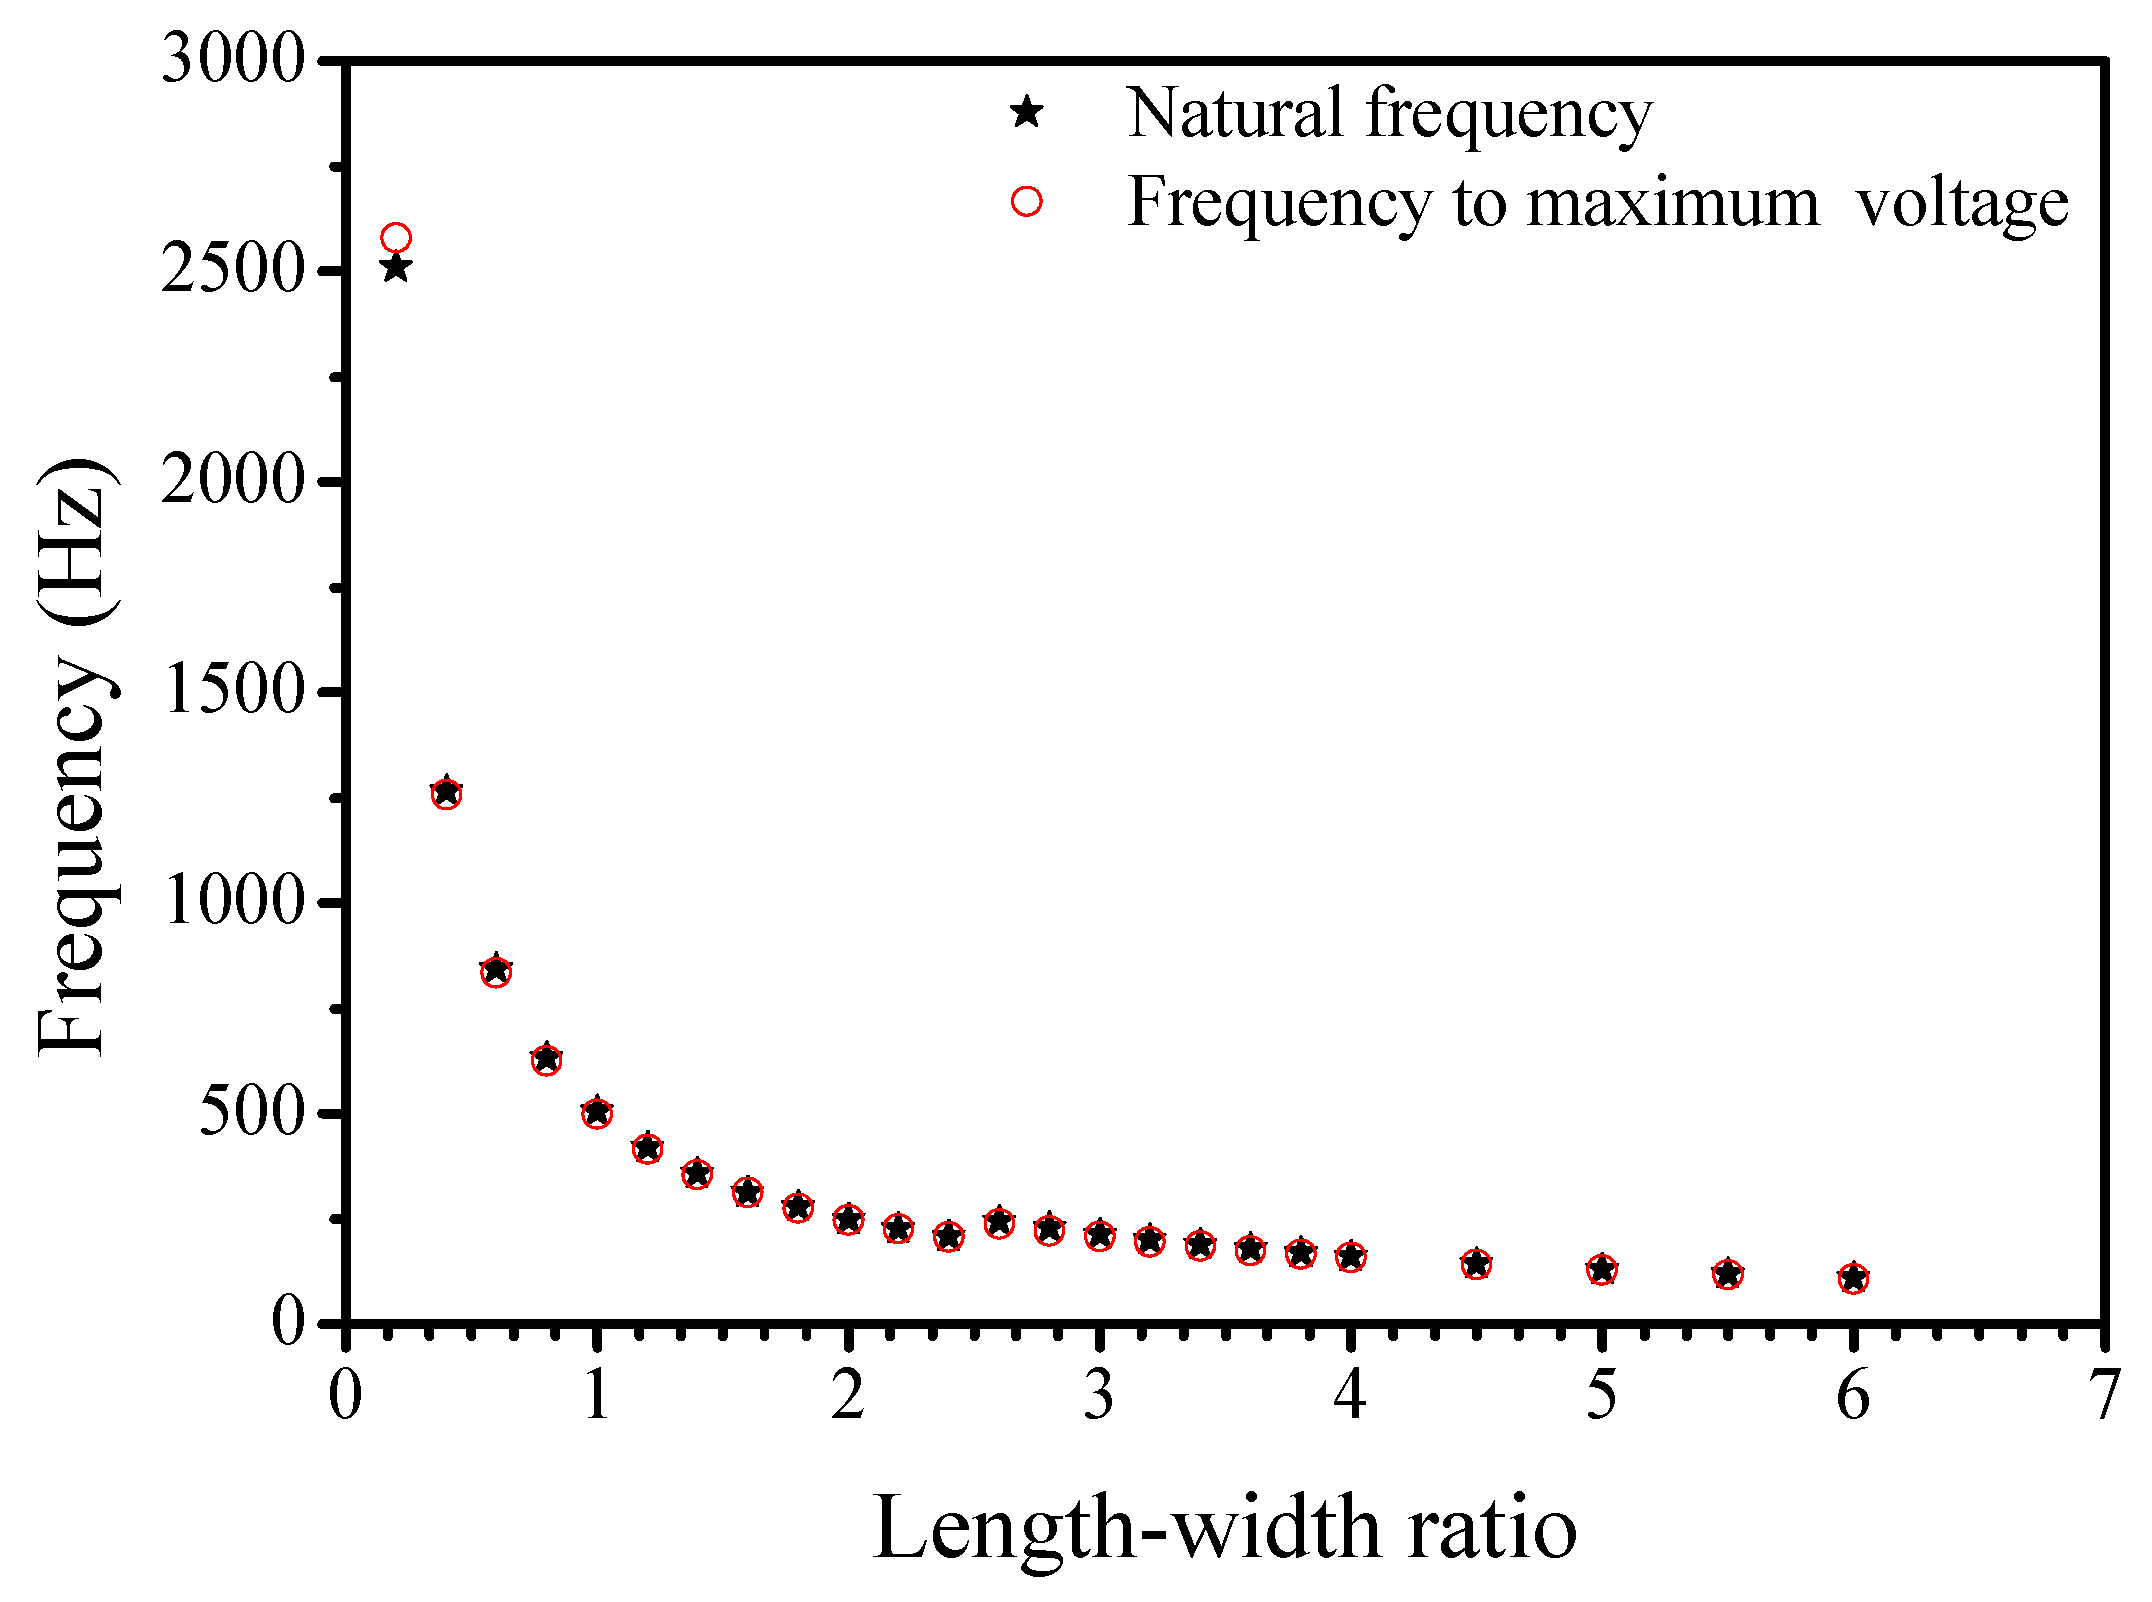

Figure 6.
Weight of mass block and length-width ratio versus maximum voltage in simply supported beam fixation mode.
Figure 6.
Weight of mass block and length-width ratio versus maximum voltage in simply supported beam fixation mode.
4. Simulation of Cantilever Beam Fixation Mode
The cantilever beam is a frequently used method compared with simply supported beam as only one end of it needs to be fixed; however, it places high demands on the material properties of the beam as it usually has a large deformation. In the simulation of simply supported beam fixation mode, the majority of the settings are consistent with the settings in a simply supported beam fixation mode, except that the mounting position of the mass block is adjusted to the unfixed end of PCP, and the harmonic force of 0.5 N is imposed on a node from the edge center of the unfixed end of the PCP. Figure 7 shows the models after meshing and defining constraints in cantilever beam fixation mode.
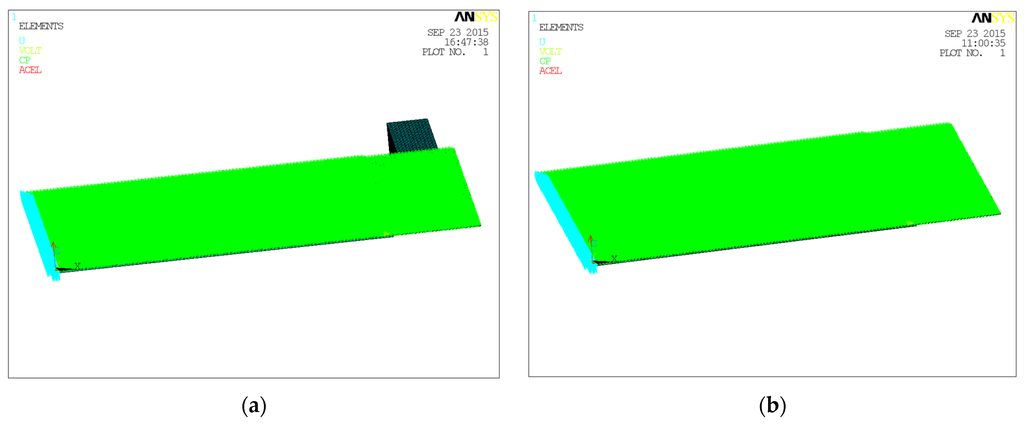
Figure 7.
Models after meshing and defining constraints in cantilever beam fixation mode: (a) With mass block; (b) Without mass block.
Figure 7.
Models after meshing and defining constraints in cantilever beam fixation mode: (a) With mass block; (b) Without mass block.

Figure 8 indicates similar results that both of the natural frequency of PCP and excitation frequency at maximum voltage decrease with the increase of weight of the mass block. As revealed in Figure 9, the natural frequency of the PCP and the excitation frequency at maximum voltage drop rapidly with the increase of length-width ratio when the length-width ratio is below 4, and gradually reach a plateau when the length-width ratio is greater than 4. Figure 8 and Figure 9 illustrate the same conclusion that the exciting frequencies at maximum voltage of each PCP accord well with the natural frequencies of the PCPs.

Figure 8.
Weight of mass block versus natural frequency of PCP and exciting frequency at maximum voltage in cantilever beam fixation mode.
Figure 8.
Weight of mass block versus natural frequency of PCP and exciting frequency at maximum voltage in cantilever beam fixation mode.
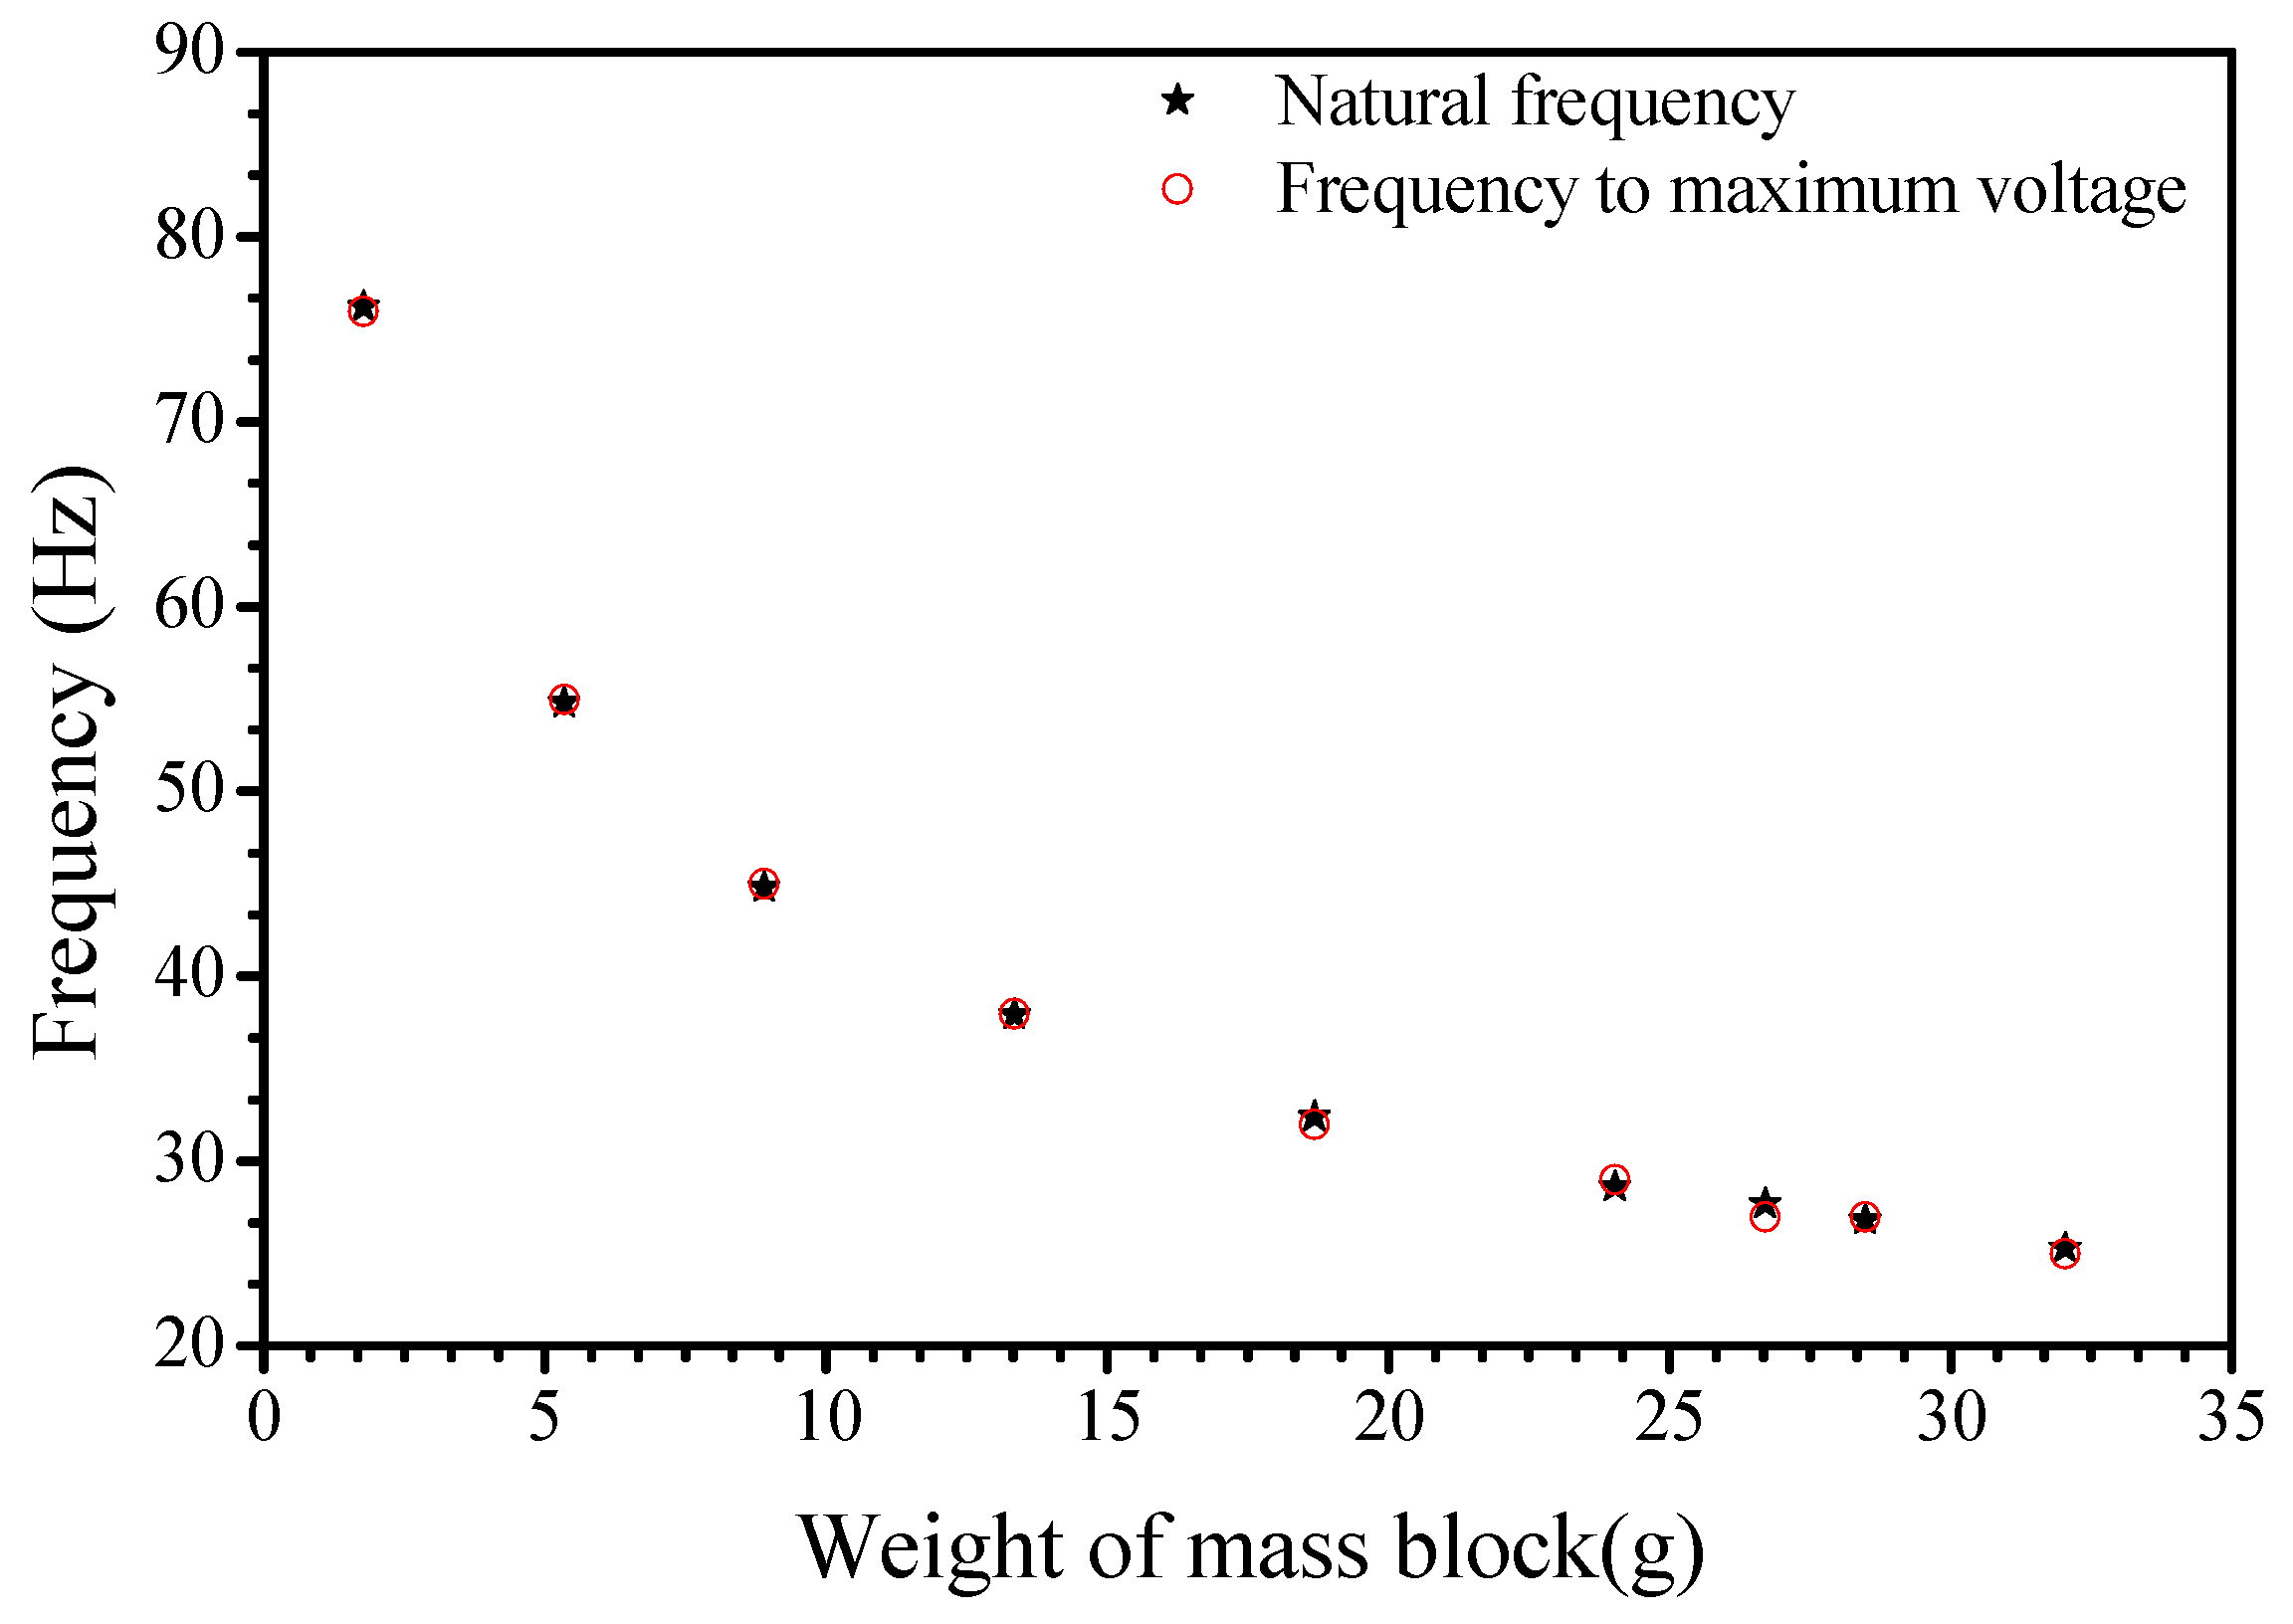
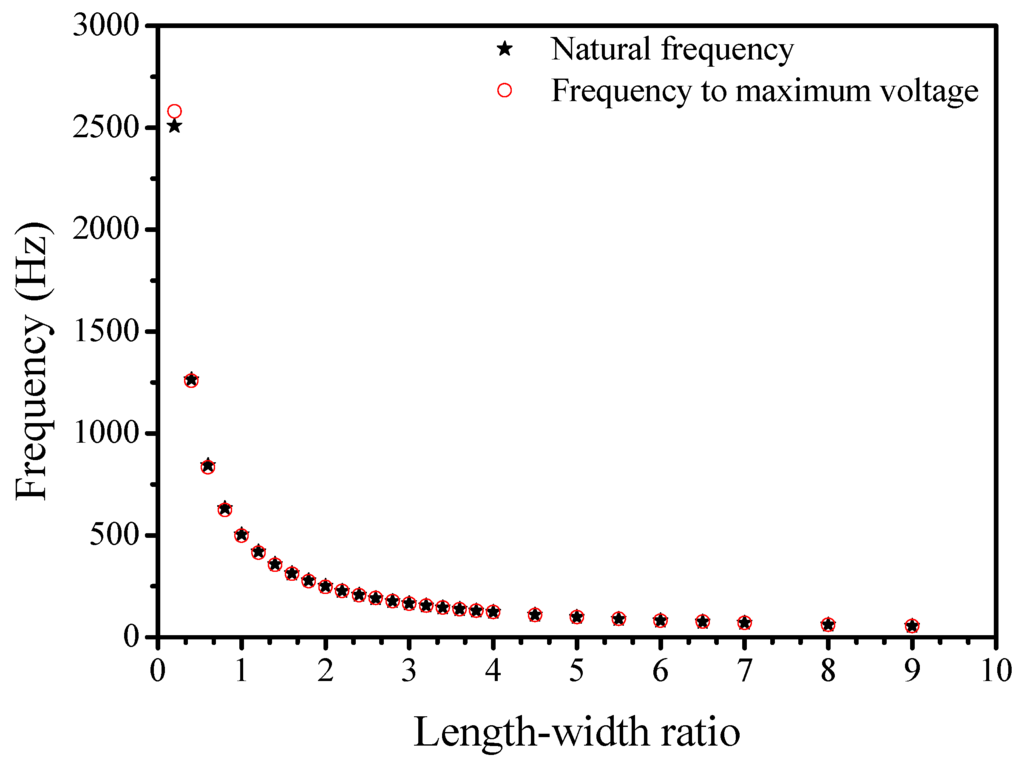
Figure 9.
Length-width ratio versus natural frequency of PCP and exciting frequency at maximum voltage in cantilever beam fixation mode.
Figure 9.
Length-width ratio versus natural frequency of PCP and exciting frequency at maximum voltage in cantilever beam fixation mode.

Figure 10 shows that with the increase in weight of the mass block affixed on the PCP, the maximum voltage keeps falling. The maximum voltage also rises with the increase of the PCP length-width ratio. By comparing the influences of mass block and length-width ratio in cantilever beam fixation mode, conclusions can be summarized as follows:
- (1)
- It is more effective to change length-width ratio of the PCP than weight of the mass block for adjusting the natural frequency of the PCP in cantilever beam fixation mode.
- (2)
- A wider range of generated voltage can be achieved by changing the length-width ratio compared with altering the weight of mass block.
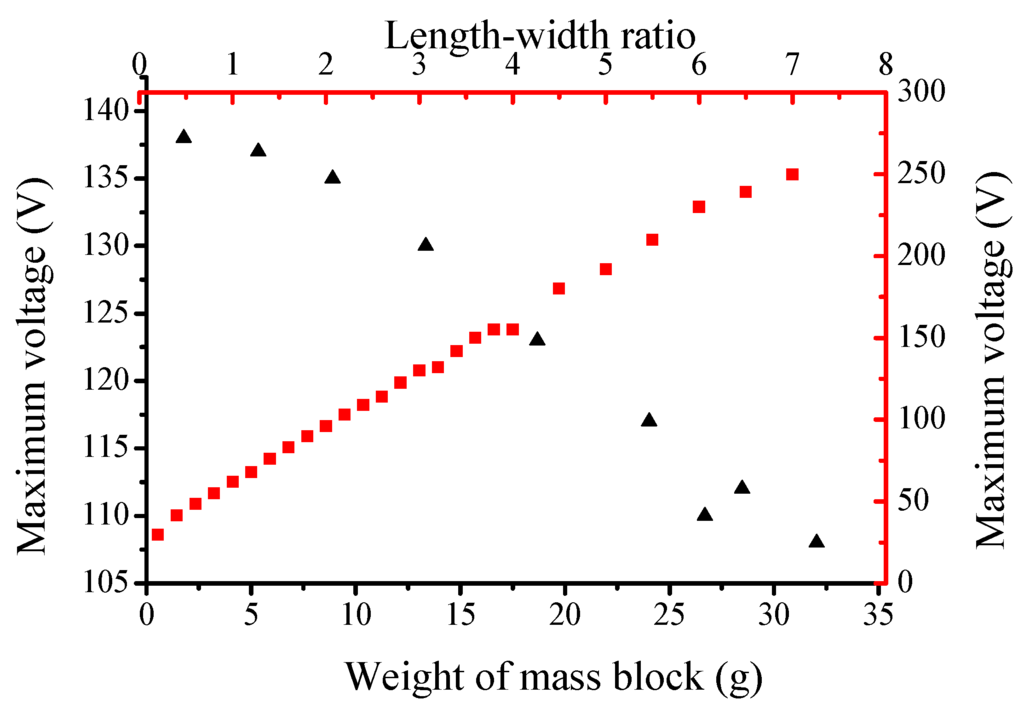
Figure 10.
Weight of mass block and length-width ratio versus maximum voltage in cantilever beam fixation mode.
Figure 10.
Weight of mass block and length-width ratio versus maximum voltage in cantilever beam fixation mode.

5. Experimental Studies
Experiments with PCPs affixed with a mass block in simply supported beam and cantilever beam fixation mode were carried out by using a vibration test rig. As shown in Figure 11, the vibration test rig is composed of upper computer software, signal controller, vibration amplifier and vibrator. Among these parts, the signal controller generates signals and transmits them to the vibration amplifier, which will drive the vibrator to work. The upper computer software can set the exciting frequency, amplitude and working mode of the vibration test rig and oscilloscope is adopted to observe the voltage generated by PCP. Figure 12 shows the PCPs fixed in simply supported beam and cantilever beam fixation mode.

Figure 11.
Vibration test rig.
Figure 11.
Vibration test rig.
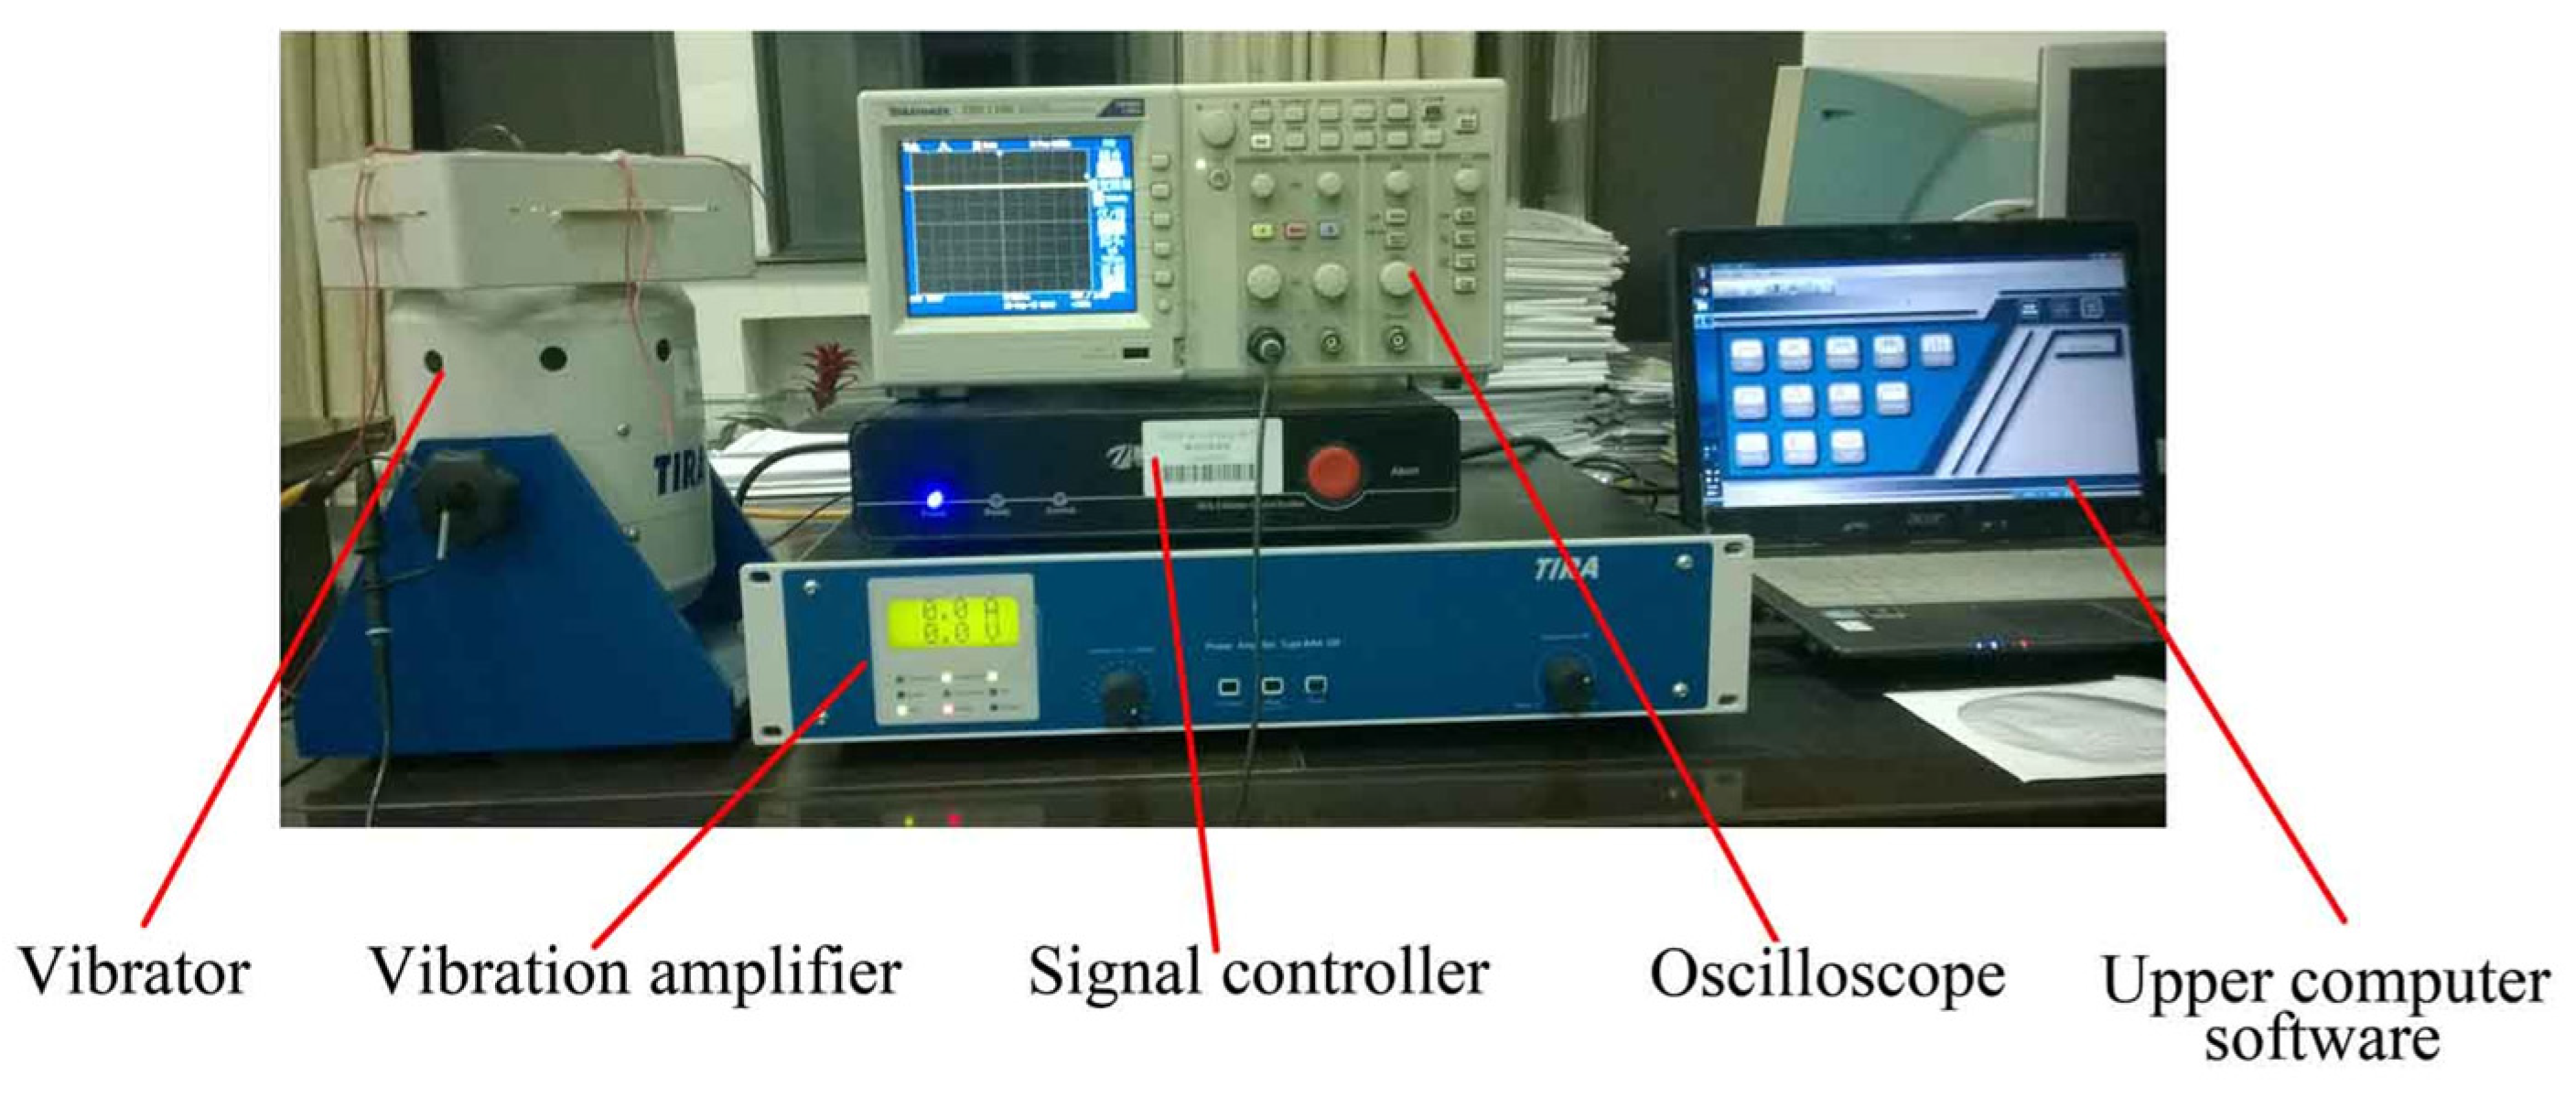
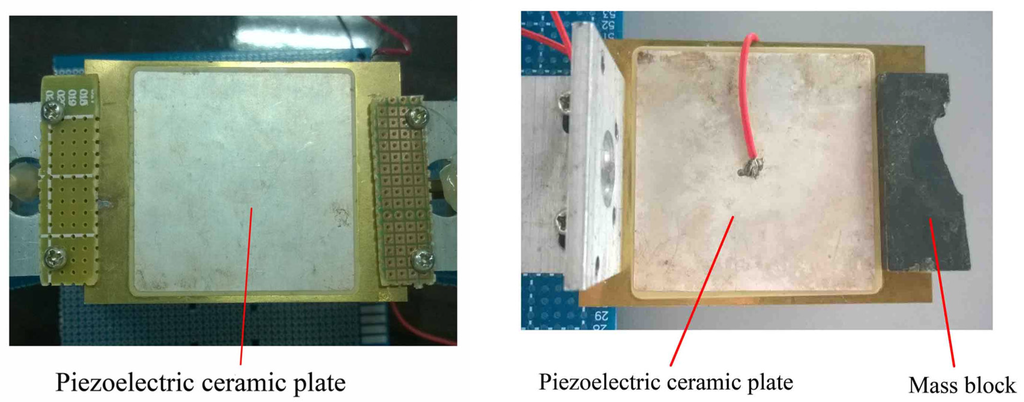
Figure 12.
Piezoelectric energy harvester.
Figure 12.
Piezoelectric energy harvester.

The harmonic force settings are a little bit different in the experiment as the vibrator test rig can not produce a programmable harmonic force measured by value of the force. If the settings of harmonic force in experiments strictly follow the settings in simulations, the characteristics of the PCP would be few as the position where the force exerted at is fixed with the vibrator. In order to get similar results to the simulation, we directly equipped the PCP with the vibrator in simply supported beam fixation mode and cantilever beam fixation mode. Then the piezoelectric model can be a simply supported beam or cantilever beam again. Data like natural frequency and maximum voltage can be acquired again. After several tries, the exciting force amplitude is set to 1 mm in the experiments and accompanied by a wide exciting frequency range since the natural frequency of the PCP model is unknown to us at first.
The electric energy generated by a PCP usually cannot power ordinary loads (such as a microcontroller unit) due to its high voltage and ultra-low current, so the methods of using a load resistance to consume electric power or storing electric energy with a reservoir like a capacitor are the two main techniques to calculate the quantity of electricity. In this paper, a super capacitor was adopted to store the electric energy generated by PCP due to its high energy density, stable performance, fast-charging speed and high efficiency [27]. The alternating current (AC) needs to be stabilized by rectifying, filtering and regularizing before charging the super capacitor. For the aim to reduce electric energy loss, the step of regularizing the AC was removed. Figure 13 displays the circuit schematic diagram and its circuit board. The capacitance of the adopted super capacitor is 0.1 F.
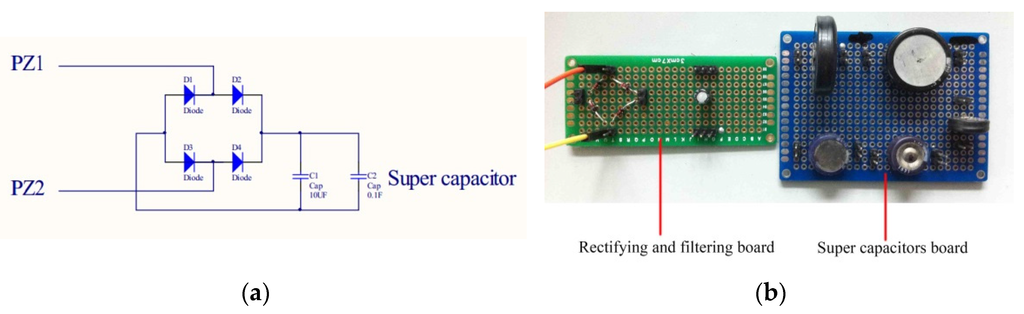
Figure 13.
(a) Circuit schematic for rectifying and filtering AC; (b) Rectifying and filtering board, super capacitor board.
Figure 13.
(a) Circuit schematic for rectifying and filtering AC; (b) Rectifying and filtering board, super capacitor board.

The way to calculate the electric energy stored in super capacitor are deduced as follows. Equations (1) and (2) are the expression of power and electric energy, respectively:
And the expression of electric energy can develop to another form as follows:
where: .
As the capacitance of a super capacitor is constant, the quantity of electric energy that the capacitor stored can be obtained if the initial and final voltages are known. In the experiments, the time to charge the super capacitor was set to 2 min and the voltage of super capacitor was recorded at the beginning and the end of the test. Then the electric energy quantity that super capacitor stored in 2 min can be acquired through calculation of Equation (3), which can also indicate the average generation power of PCP in the 2 min.
5.1. Simply Supported Beam Fixation Mode
In this part, we first set the vibration test rig to sweep the frequency working mode to obtain the maximum voltage and its corresponding exciting frequency of each PCP in the simply supported beam fixation mode. According to the simulation results, the exciting frequency value is just the natural frequency value of the PCP when the generated voltage reaches its peak. In order to get the maximum power of each PCP, then we use the natural frequency (or exciting frequency that makes the voltage reach its peak) of each PCP as the excitation frequency to excite each PCP for 2 min and the exciting force amplitude is set to 1 mm. With the help of a rectifying and filtering board and a super capacitors board, the maximum power generation of every PCP with different mass block weights is recorded.
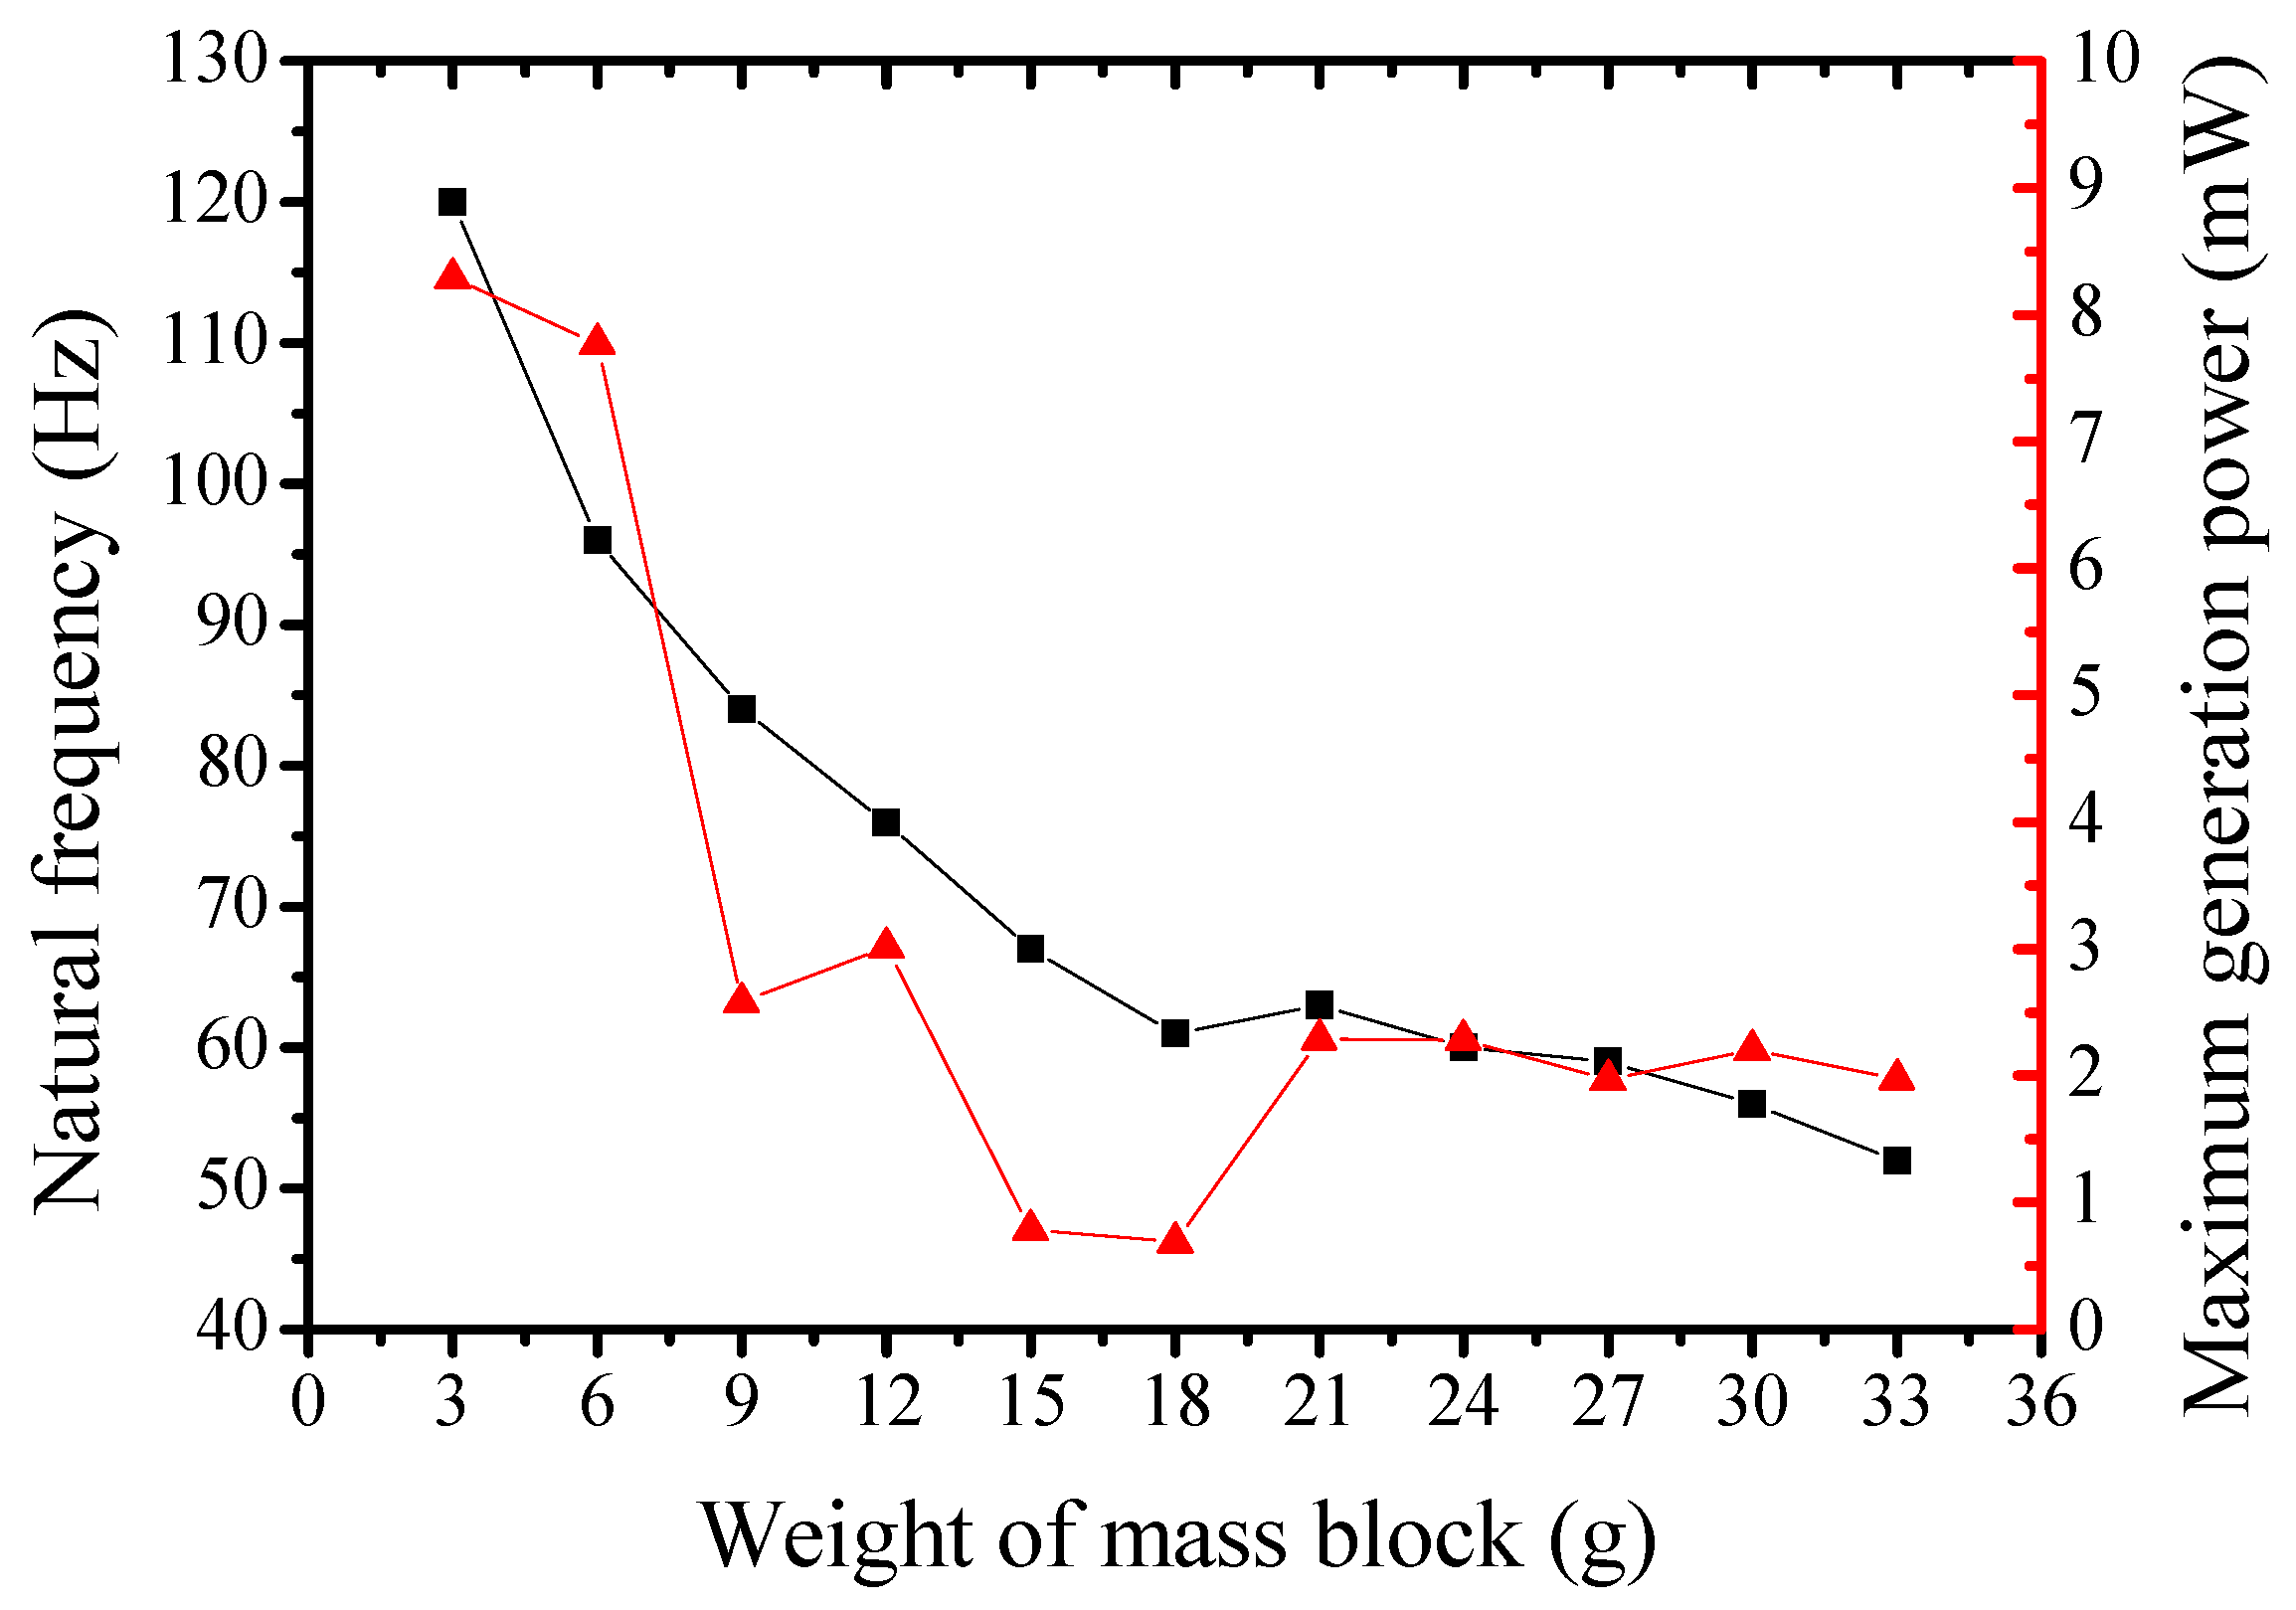
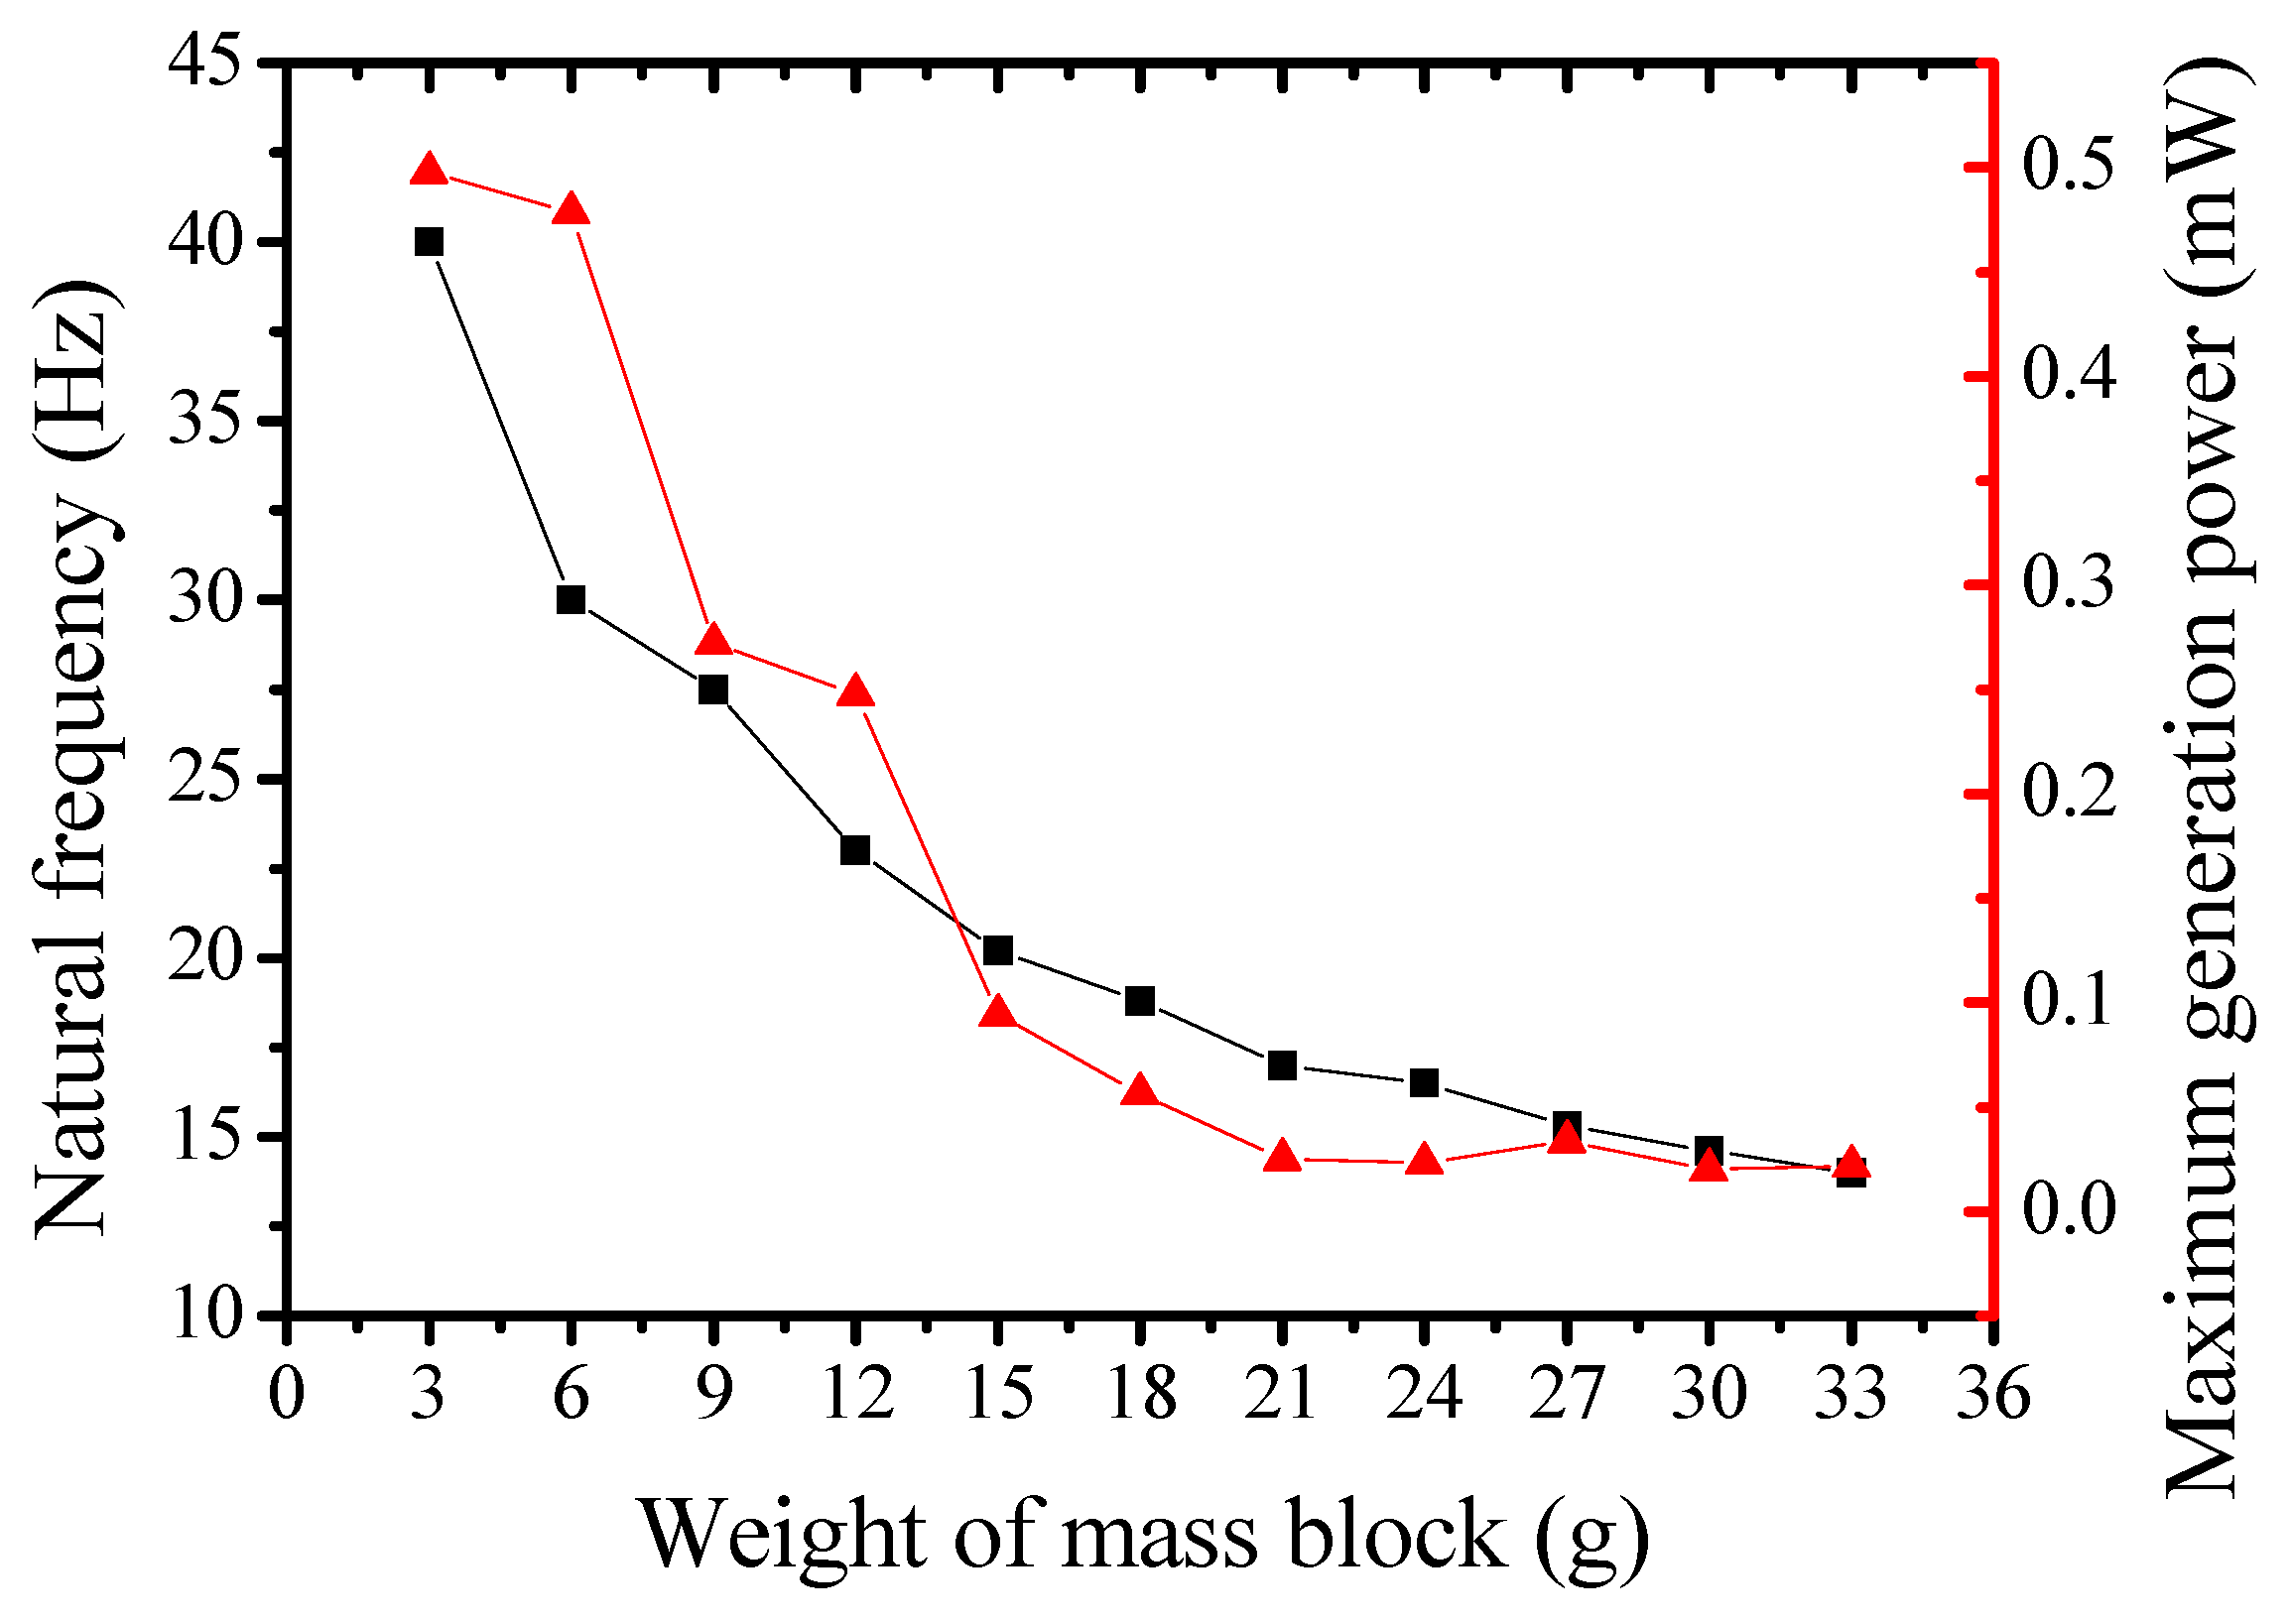
As displayed in Figure 14, the maximum voltages of 12 groups of PCPs affixed with different mass blocks all remain between 18 V and 31 V. Compared with Figure 6 in Section 3, the voltages in both the simulations and experiments decrease with the increase of weight of the mass block, though the dropping speed of the maximum voltage in the experiments is slower than that in the software simulation. Figure 15 indicates that excitation frequencies at the maximum voltage generated by the PCP decrease with the increase of weight of the mass block affixed on the PCP. Compared with Figure 4 in Section 3, these results coincide well with each other. Figure 15 also demonstrates that the natural frequency has a great impact on the maximum generation power of a PCP, because the maximum generation power of the PCP drops very rapidly with the decrease of natural frequency. As for the unsmooth part of the maximum generation power when the weight of the mass block equals 15 g and 18 g in Figure 15, the glue between PCP and mass block could be the reason for that as it can changed the characteristics of the PCP.
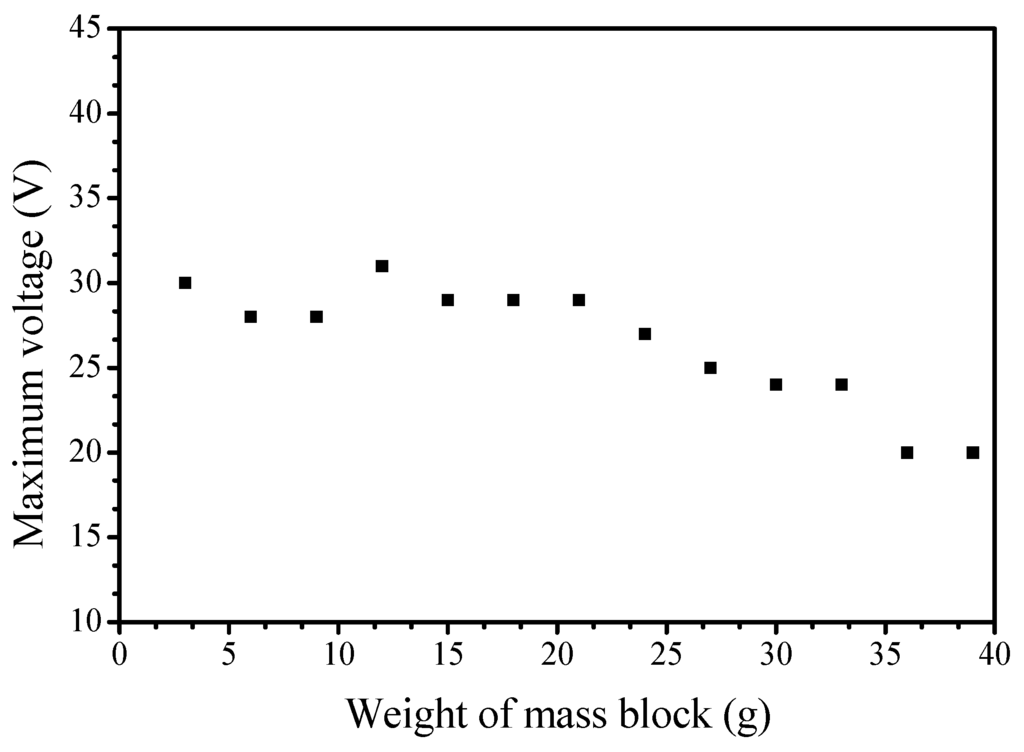
Figure 14.
Weight of mass versus maximum voltage in simply supported beam fixation mode.
Figure 14.
Weight of mass versus maximum voltage in simply supported beam fixation mode.

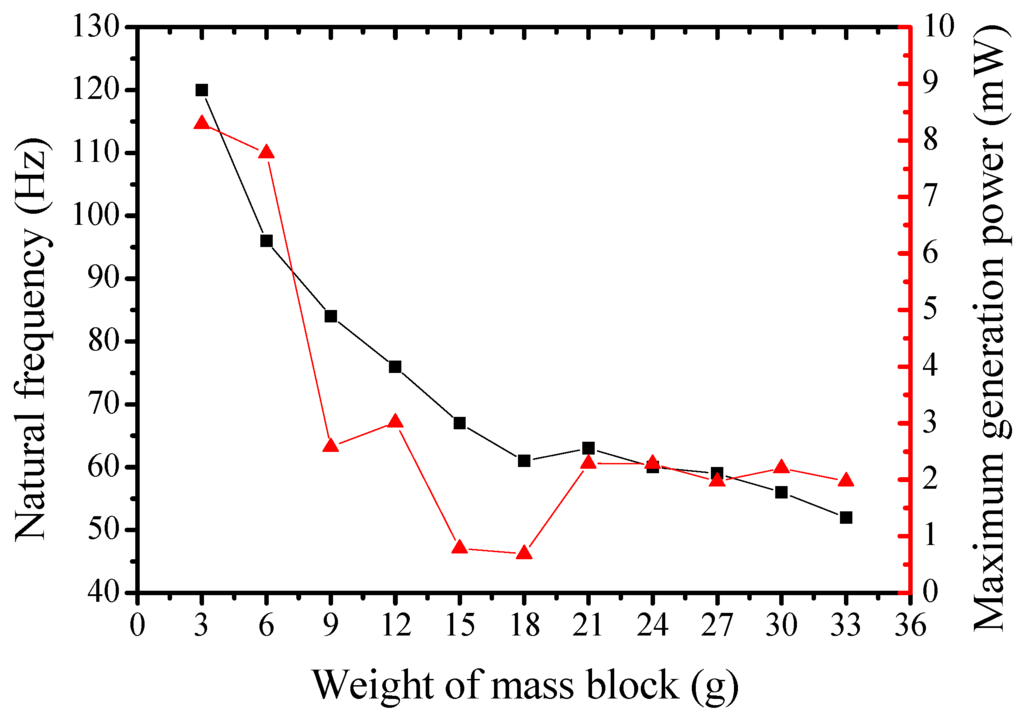
Figure 15.
Weight of mass block versus natural frequency and maximum power of PCP in simply supported beam fixation mode.
Figure 15.
Weight of mass block versus natural frequency and maximum power of PCP in simply supported beam fixation mode.
5.2. Cantilever Beam Fixation Mode
Settings in this part are consistent with the above settings, maximum voltage and its corresponding exciting frequency, maximum generation power are all obtained. As shown in Figure 16, the maximum voltage of the selected commercial PCP can reach 40 V and the voltages generated by 12 groups of PCPs affixed with different mass blocks all ranged from 35 V to 40 V. Compared with Figure 10 in Section 4, their variation ranges are both small. As for the lower voltage in the experiments, manufacture limitations and experimental errors are the main reasons. Figure 17 demonstrates that the excitation frequencies at maximum voltage generated by the PCPs decrease with the increase of weight of the mass block affixed on the PCP. Compared with Figure 8, their variation trends are almost the same. Therefore, the results from experiments in cantilever beam fixation mode are similar to the simulation results. At the same time, the excitation frequency corresponding to the maximum voltage in the experiment can be treated as the natural frequency of PCP model as well.
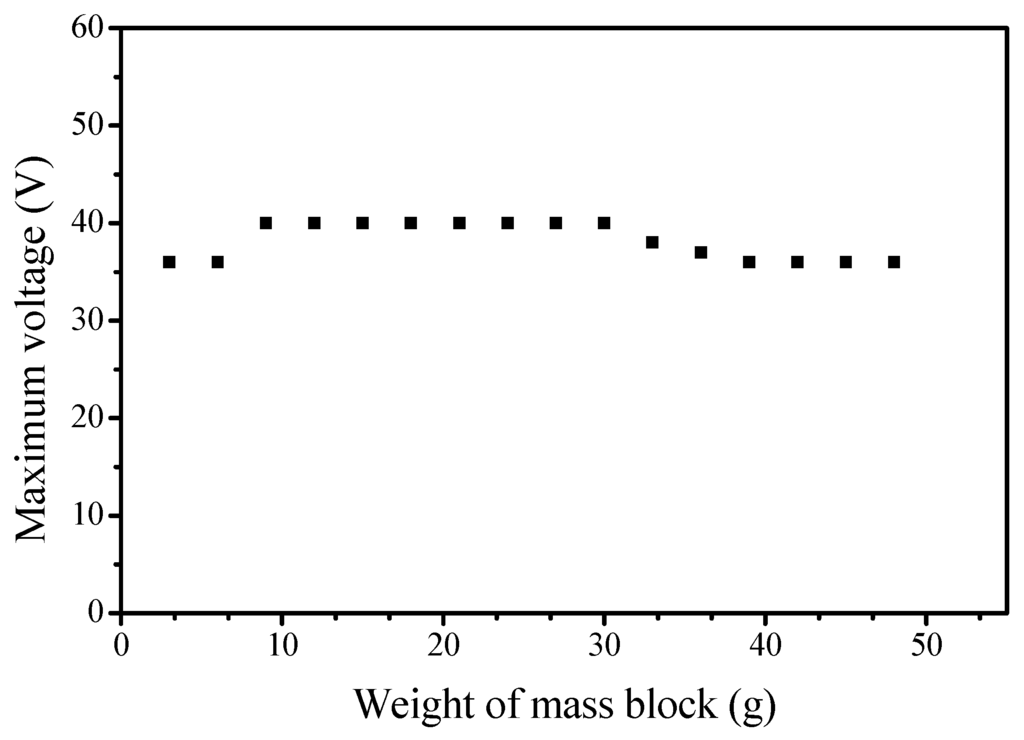
Figure 16.
Weight of mass versus maximum voltage in cantilever beam fixation mode.
Figure 16.
Weight of mass versus maximum voltage in cantilever beam fixation mode.

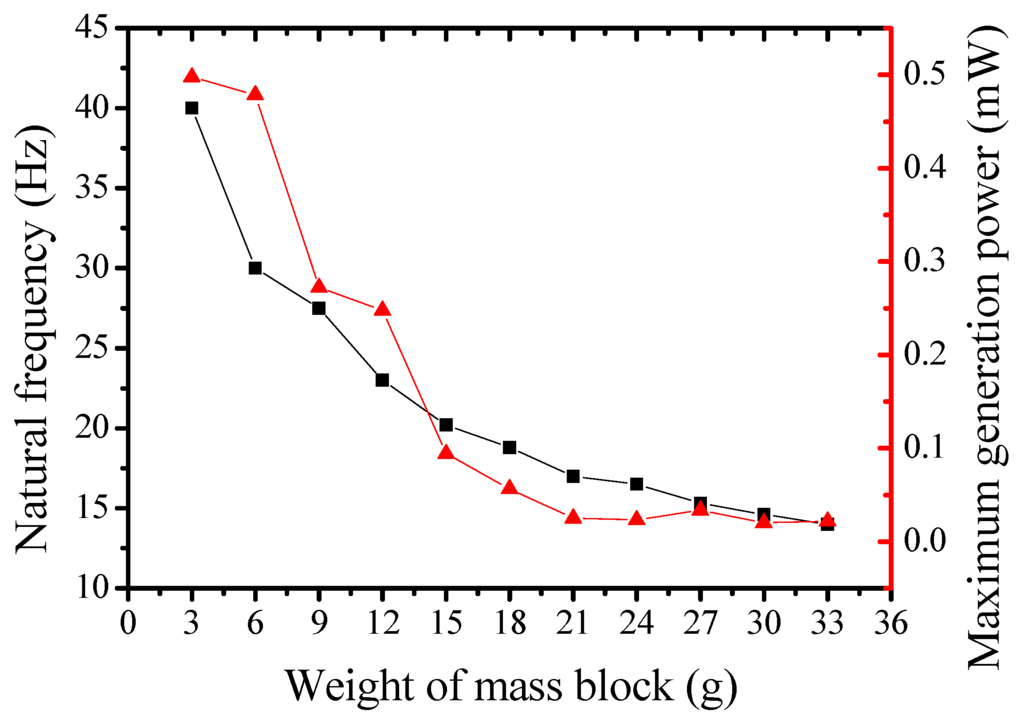
Figure 17.
Weight of mass block versus natural frequency and maximum power of PCP in cantilever beam fixation mode.
Figure 17.
Weight of mass block versus natural frequency and maximum power of PCP in cantilever beam fixation mode.
In addition, comparing the maximum generation power in simply supported beam and cantilever beam fixation mode, the following conclusions can be made:
- (1)
- The natural frequency of the PCP in simply supported beam mode is larger than that in cantilever beam fixation mode.
- (2)
- The maximum generation power is much higher than that in cantilever beam fixation mode.
- (3)
- The natural frequency determines the maximum generation power of a PCP.
- (4)
- During the experiments, we noticed that the maximum generation power and maximum voltage in simply supported beam fixation mode are very sensitive to the exact excitation frequency as a small deviation in excitation frequency may cause it to generate far from the maximum power, but the excitation frequency range in cantilever beam fixation mode is wider.
6. Comparison Results and Guidelines for Application of PCP
According to the simulation and experimental statistics described above, the natural frequency of the PCP in simply supported beam fixation mode is higher; the natural frequencies of PCPs affixed with mass block range were 200–400 Hz in simulations and 50–120 Hz in experiments. Furthermore, the deformations of PCPs in simply supported beam fixation mode are relatively small, causing the maximum voltages generated by PCPs to be relatively low, but the maximum generation power in experiments astonished us; the maximum generation power from every PCP in simply supported beam fixation mode is larger than that in cantilever beam fixation mode. However, experiments in simply supported beam fixation mode showed that maximum generation power and maximum voltage are very sensitive to the exact excitation frequency, because a small deviation can result in an ultra-low generation power compared with the maximum generation power.
As for the cantilever beam fixation mode, the natural frequencies of PCPs are relatively low. Most of the natural frequencies of PCPs with different length-width ratios are no more than 50 Hz in both simulations and experiments, nevertheless the deformations of PCPs are relatively large, resulting in a great increase in generated voltage; the maximum voltages generated by PCPs can reach as high as 138 V in simulations and a peak voltage of 40 V in experiments. Beside, the excitation force frequency for achieving maximum voltage and maximum power generation is wider. However, attention should be paid on the strength of the PCP since a large deformation may break it. Compared with PCPs in simply supported beam fixation mode, the maximum generation power by PCPs in cantilever beam fixation mode is pretty low; most of the maximum generation powers in cantilever beam fixation mode are no more than 0.01 mW, but the majority of maximum generation powers in simply supported beam fixation mode exceed 1 mW.
Wireless sensor nodes could be placed anywhere in our daily life, for the aim to make it work properly with a long working lifespan, fixation mode and adjusting method must fit the exciting source to generate maximum capacity. As shown in Table 2, the frequencies of exciting source in popular use range at 60–200 Hz, and the accelerations range at 0.5–10 m2/s, which can provide instructions for practical applications of PCP [2].
Table 2.
Parameters of each material.
| Vibration Source | Frequency (Hz) |
|---|---|
| Car engine compartment | 200 |
| Base of 3-axis machine tool | 70 |
| Blender casing | 121 |
| Clothes dryer | 121 |
| Person nervously tapping their heel | 1 |
| Car instrument panel | 13 |
| Door frame just after door closes | 125 |
| Small microwave oven | 121 |
| HVAC vents in office building | 60 |
| Windows next to a busy road | 100 |
| CD on notebook computer | 75 |
| Second story floor of busy office | 100 |
Therefore, cantilever beam fixation mode is a reasonable choice in practical applications when the excitation frequency is variable and below 50 Hz. The length-width ratio is a good parameter to rectify the natural frequency of PCPs for the aim of achieving resonance and optimal power generating capacity. At the same time, attention should be paid to the strength of the PCP as higher power generation capacity means larger deformation and being easier to break. When the excitation frequencies are higher than 50 Hz, the simply supported beam fixation mode is a better choice as it is easier to resonate. Its output voltage may be low, but its maximum generation power is much higher. Adjusting the length-width ratio can be also adopted to modify the natural frequencies of PCPs to obtain the maximum power generation capacity. Furthermore, the deformation of the PCP adopting simply supported beam fixation mode is relatively small, which provides a long-time and stable operation. Thus, wireless sensor nodes with piezoelectric energy harvester in simply supported beam fixation mode can have a longer working lifespan. Also, we must pay attention to the excitation force frequency, because a small deviation from the exact excitation frequency may cause unexpected low power generation efficiency.
Acknowledgments
The material presented in this paper is based upon work supported by National Natural Science Foundation of China (No. 51575513), Fundamental Research Funds for the Central Universities (No. 2015QNA37), Program for Changjiang Scholars and Innovative Research Team in University (No. IRT1292), as well as Priority Academic Program Development of Jiangsu Higher Education Institutions.
Author Contributions
All the authors have contributed their efforts to make sure the paper is qualified. Gongbo Zhou designed and supervised the work. Zhixiang Li conducted the simulation and experiment parts. Zhencai Zhu and Wei Li discussed the experiment results.
Conflicts of Interest
The authors declare no conflict of interest.
References
- Zhou, G.; Huang, L.; Li, W.; Zhu, Z. Harvesting Ambient Environmental Energy for Wireless Sensor Networks: A Survey. J. Sens. 2014, 2014. [Google Scholar] [CrossRef]
- Roundy, S.; Wright, P.K.; Rabaey, J. A study of low level vibrations as a power source for wireless sensor nodes. Comput. Commun. 2003, 26, 1131–1144. [Google Scholar] [CrossRef]
- Souliotis, M.; Singh, R.; Papaefthimiou, S.; Lazarus, I.J.; Andriosopoulos, K. Integrated collector storage solar water heaters: Survey and recent developments. Energy Syst. 2015, 7, 1–24. [Google Scholar] [CrossRef]
- Leung, D.Y.C.; Yang, Y. Wind energy development and its environmental impact: A review. Renew. Sustain. Energy Rev. 2012, 16, 1031–1039. [Google Scholar] [CrossRef]
- Nishimoto, H.; Kawahara, Y.; Asami, T. Prototype implementation of ambient RF energy harvesting wireless sensor networks. In Proceedings of the 2010 Sensors, Kona, HI, USA, 1–4 November 2010; pp. 1282–1287.
- Jabbar, H.; Song, Y.; Jeong, T. RF energy harvesting system and circuits for charging of mobile devices. IEEE Trans. Consum. Electron. 2010, 56, 247–253. [Google Scholar] [CrossRef]
- Mathuna, C.O.; O’Donnell, T.; Martinez-Catala, R.V.; Rohan, J.; O’Flynn, B. Energy scavenging for long-term deployable wireless sensor networks. Talanta 2008, 75, 613–623. [Google Scholar] [CrossRef] [PubMed]
- Yang, B.; Lee, C.; Xiang, W.; Xie, J.; Han He, J.; Kotlanka, R.K.; Low, S.P.; Feng, H. Electromagnetic energy harvesting from vibrations of multiple frequencies. J. Micromech. Microeng. 2009, 19. [Google Scholar] [CrossRef]
- Anton, S.R.; Sodano, H.A. A review of power harvesting using piezoelectric materials (2003–2006). Smart Mater. Struct. 2007, 16, R1–R21. [Google Scholar] [CrossRef]
- Shenck, N.S.; Paradiso, J.A. Energy scavenging with shoe-mounted piezoelectrics. IEEE Micro 2001, 21, 30–42. [Google Scholar] [CrossRef]
- Ottman, G.K.; Hofmann, H.F.; Bhatt, A.C.; Lesieutre, G.A. Adaptive piezoelectric energy harvesting circuit for wireless remote power supply. IEEE Trans. Power Electron. 2002, 17, 669–676. [Google Scholar] [CrossRef]
- Zhou, G.; Wang, H.; Zhu, Z.; Huang, L.; Li, W. Performance Analysis of Wind-Induced Piezoelectric Vibration Bimorph Cantilever for Rotating Machinery. Shock Vib. 2015, 2015, 1–10. [Google Scholar] [CrossRef]
- Zhang, C.; He, X.F.; Li, S.Y.; Cheng, Y.Q.; Rao, Y. A wind energy powered wireless temperature sensor node. Sensors 2015, 15, 5020–5031. [Google Scholar] [CrossRef] [PubMed]
- Song, R.; Shan, X.; Lv, F.; Xie, T. A study of vortex-induced energy harvesting from water using PZT piezoelectric cantilever with cylindrical extension. Ceramics Int. 2015, 41, S768–S773. [Google Scholar] [CrossRef]
- Xu, J.W.; Shao, W.W.; Kong, F.R.; Feng, Z.H. Right-angle piezoelectric cantilever with improved energy harvesting efficiency. Appl. Phys. Lett. 2010, 96. [Google Scholar] [CrossRef]
- Ben Ayed, S.; Abdelkefi, A.; Najar, F.; Hajj, M.R. Design and performance of variable-shaped piezoelectric energy harvesters. J. Intell. Mater. Syst. Struct. 2013, 25, 174–186. [Google Scholar] [CrossRef]
- Rosa, M.; De Marqui, C., Jr. Modeling and analysis of a piezoelectric energy harvester with varying cross-sectional area. Shock Vib. 2014, 2014, 1–9. [Google Scholar] [CrossRef]
- Abdelkefi, A.; Barsallo, N.; Tang, L.; Yang, Y.; Hajj, M.R. Modeling, validation, and performance of low-frequency piezoelectric energy harvesters. J. Intell. Mater. Syst. Struct. 2013, 25, 1429–1444. [Google Scholar] [CrossRef]
- Abdelkefi, A.; Najar, F.; Nayfeh, A.H.; Ayed, S.B. An energy harvester using piezoelectric cantilever beams undergoing coupled bending–torsion vibrations. Smart Mater. Struct. 2011, 20. [Google Scholar] [CrossRef]
- Sharpes, N.; Abdelkefi, A.; Priya, S. Comparative Analysis of One-Dimensional and Two-Dimensional Cantilever Piezoelectric Energy Harvesters. Energy Harvest. Syst. 2014, 1, 209–216. [Google Scholar] [CrossRef]
- Sharpes, N.; Abdelkefi, A.; Priya, S. Two-dimensional concentrated-stress low-frequency piezoelectric vibration energy harvesters. Appl. Phys. Lett. 2015, 107. [Google Scholar] [CrossRef]
- Tang, L.; Yang, Y. A nonlinear piezoelectric energy harvester with magnetic oscillator. Appl. Phys. Lett. 2012, 101. [Google Scholar] [CrossRef]
- Abdelkefi, A.; Barsallo, N. Comparative modeling of low-frequency piezomagnetoelastic energy harvesters. J. Intell. Mater. Syst. Struct. 2014, 25, 1771–1785. [Google Scholar] [CrossRef]
- Abdelkefi, A.; Barsallo, N. Nonlinear analysis and power improvement of broadband low-frequency piezomagnetoelastic energy harvesters. Nonlinear Dyn. 2016, 83, 41–56. [Google Scholar] [CrossRef]
- Gafforelli, G.; Corigliano, A.; Xu, R.; Kim, S.-G. Experimental verification of a bridge-shaped, nonlinear vibration energy harvester. Appl. Phys. Lett. 2014, 105. [Google Scholar] [CrossRef]
- Wang, X.M.; Wang, J.Z.; Gao, Z.Y.; Zhu, X.J. Simulation and experimental study on active vibration control of piezoelectric smart plate based on ANSYS. In Proceedings of the 2010 2nd International Conference on Advanced Computer Control (ICACC), Shenyang, China, 27–29 March 2010; pp. 257–260.
- Conway, B.E. Similarities and Differences between Supercapacitors and Batteries for Storing Electrical Energy. In Electrochemical Supercapacitors; Springer US: New York, NY, USA, 1999; pp. 11–31. [Google Scholar]
© 2016 by the authors; licensee MDPI, Basel, Switzerland. This article is an open access article distributed under the terms and conditions of the Creative Commons by Attribution (CC-BY) license (http://creativecommons.org/licenses/by/4.0/).