Abstract
Wind power generation reduces our reliance on fossil fuels and can thus reduce environmental pollution. However, rapid wind power development has caused various issues related to power grid restructuring. A high proportion of the generating capacity of northeast China is based on combined heat and power (CHP), whose inflexible response to the peak regulation of power grids hinders the ability to accommodate wind power; thus, wind power curtailment is prevalent. Electric boilers can directly consume the excess wind power to supply heat during low load periods and thus mitigate the heat supply stress of CHP units. Therefore, electric boilers improve the power grid’s ability to accommodate additional wind power. From a regional power grid perspective, this paper discussed the feasibility of such a strategy for increasing the ability to accommodate wind power during the heat supply season. This paper analysed the optimum electric boiler capacity configuration of a regional power grid based on various constraint conditions, such as the heat-power balance, with the objective of maximising the associated social benefits. Using the Beijing-Tianjin-Hebei power grid as an example, the optimum electric boiler capacity of the studied power grid is approximately 1100 MW.
1. Introduction
Large-scale wind power production can help solve energy and environmental issues [1,2]. Global wind power development has rapidly increased in recent years. Identifying the most efficient method for accommodating intermittent wind power represents a significant challenge faced by power systems [3,4]. China has the largest installed wind power capacity in the world. Significant wind power curtailment is occurring in northern China and must be resolved quickly [5]. Grid capabilities for accommodating large-scale wind power in China were evaluated in [6,7].
Combined heat and power (CHP) units provide centralised heat supplies that can improve energy efficiency compared to traditional methods such as decentralised heating and centralised boiler heat supplies. The Chinese government has advocated retrofitting conventional power generator units into CHP units, which would supply heat to metropolitan areas of northern China [8].
The power system will require greater regulation ability to accommodate wind power with increasing installed wind power generation capacity. However, the peak regulation ability of CHP units is inferior to that of conventional thermal power generators. The grid regulation ability decreases as CHP installations increase. Wind power curtailment has become increasingly serious because of the continuously increasing peak regulation pressures faced by the power system [9,10]. Furthermore, the ability to accommodate wind power is extremely limited during the lower load period of the heating season in northern China, where CHP units supply most of the electric power [11]. Installing electric boilers in a power system to supply heat during the low load period can increase the flexibility of the power system to accommodate greater wind power in terms of both the supply side and the demand side. This not only increases the load consumed on the power system but also generates heat to replace a proportion of the CHP units heat output, thereby improving the peak regulation ability of the CHP units and increasing the ability to accommodate wind power in the system.
Both supply-side and demand-side measures for increasing the flexibility of a power system to enable high levels of renewable energy have been discussed [12,13,14]. Heat pump technology and electric boilers represent the two main methods used to increase wind power accommodation at the supply side [15,16,17]. The portfolios consisting of high heat pump deployment in conjunction with high wind penetration scenarios for the future German electricity system were evaluated in [18]. In [19], wind energy to thermal and cold storage scenarios were examined for their ability to enable high wind integration through converting renewable electricity excess into thermal or cooling energy.
In [20], electric vehicles, heat pumps, and electric boilers were discussed in terms of accommodating wind power. A conclusion was drawn in [21] that heat pumps and electric boilers can reduce the operating costs of the Danish grid system. The economic value of using electric boilers and heat pumps as wind power integration measures to reduce the link between heat and power production in CHP plants was analysed in [22]. In [23] the volume of electric heating and heat storage considering wind power accommodation were discussed, and an algorithm for managing the heat supply and wind power heating was proposed in [24]. In [25] the feasibility and economics of such a strategy were studied but details of the electric boiler capacity configuration were not analysed.
Achieving an optimum electric boiler configuration is important for power grid security where a relatively high wind power capacity and CHP units are installed; furthermore, an optimum configuration facilitates energy savings and emissions reductions. We attempt to establish an optimum electric boiler capacity configuration model that maximises comprehensive social benefits for a regional power grid. The optimum electric boiler capacity configuration for wind power accommodation in the Beijing-Tianjin-Hebei (BTH) power grid is analysed as an example.
The following of the paper consists of three sections: the principle and method of wind power accommodation with the installation of electric boilers is discussed in Section 2. A case considering the BTH grid is presented to illustrate the proposed method in Section 3, followed by conclusions in Section 4.
2. Principle and Method
2.1. Principle of Wind Power Accommodation with the Installation of Electric Boilers for CHP
The peak regulation ability of CHP is inferior to that of conventional thermal power generators. The peak power grid regulation ability is relatively lacking in regions with excessively large CHP capacities, thus their potential for accommodating wind power is limited. Electric boilers can consume electric power to supply heat during a low load period to better accommodate wind power. We assume that the electric boiler will run only when wind power curtailment occurs, and that it consumes at most as much electricity as would otherwise be curtailed.
Electric boilers can be deployed near wind farms or CHP units. However, electric boilers require a heat grid to distribute the heat. Hence, their localisation near wind farms might be difficult. We assume that the electric boilers are installed near CHP plants and within the context of CHP plant processes. The conceptual electric boiler installation model is shown in Figure 1.
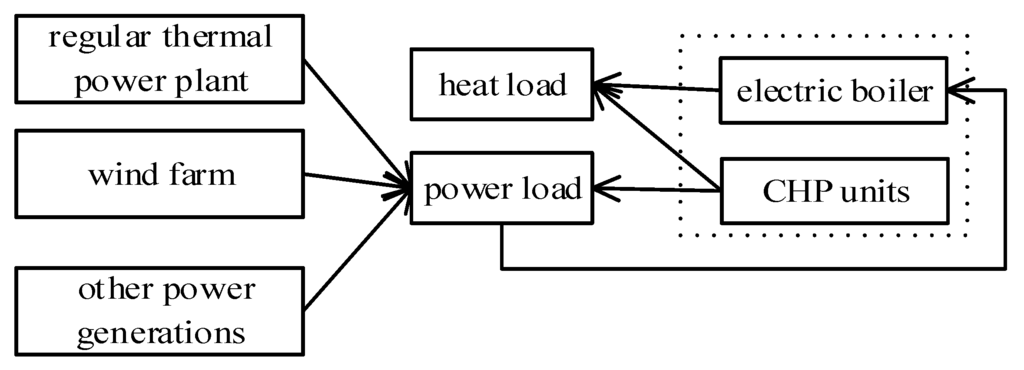
Figure 1.
The conceptual electric boiler installation model.
With electric boilers installed in power systems to supply heat, the CHP units can run at a lower heat load, so they have higher peak regulation ability to response to the power grid, enabling a better wind power accommodation. Electric boilers consume electricity produced by wind farms, thereby reducing the fossil fuel consumption of the power system. The electric boiler capacity needs to be determined firstly. If the installed capacity is insufficient, then wind power curtailment cannot be adequately resolved. However, an excessive electric boiler installation capacity will lead to investment waste.
2.2. Model for Optimum Electric Boiler Capacity
The estimation of the electric boiler capacity for a regional power grid serves as a reference for power system planning. Thus, in this study, some of the data have been approximated to simplify the calculations. We use one set of winter season heat supply data to simulate an annual scenario consisting of a power system with electric boilers installed. The annual benefits obtained by the installation of electric boilers and the annual amortised costs of their initial investments calculated using the levelised cost of energy method are exploited to model the optimum capacity.
2.2.1. Objective Function
The objective function is used to maximise the comprehensive social benefits, including economic benefits and environmental benefits reduced by annual cost, as shown in Equation (1):
where is the economic benefit of the heat supply season with electric boiler capacity , is the environmental benefit of the heat supply season with electric boiler capacity , and C is the fixed investment cost distributed throughout each year, which is calculated using Equation (5).
A. Economic benefit evaluating model
We define the coal-saving benefit, which results from increased wind power accommodation, as the economic benefit. The additional wind power accommodated by the power grid is composed of two key parts. The first part is the wind power consumed while using electric boilers as a heat supply. This portion of the heat supply can replace the heat supplied by the CHP. The second part is the extra wind power accommodated for a higher peak regulation ability of power system with lower heat supply from CHP units. Therefore, the coal-saving benefit of this project is also composed of two parts. The first part is the amount of coal saved by replacing heat supplied by CHP with heat supplied by wind power. The second part is the amount of coal saved by replacing electricity supplied by CHP with wind power. The amount of coal saved during this project is given by:
where is the electric boiler installation capacity; is the capacity utilisation of the electric boilers at time t; is the duration of every segment, namely, 15 min; is the average coal consumption of heat generated via CHP; is the amount of increased wind power accommodation; α is the average coal consumption of heat generated via CHP; t = 1,…T; ; and d is the number of days in the heat season.
The economic benefit evaluation model is as follows:
where is the price of a tonne of coal equivalent.
B. Environmental benefit evaluation model
The environmental benefit is associated with the external and social benefit evaluations compared with the economic benefit based on coal costs in this system. The extra wind power accommodated by the power grid will replace a certain amount of thermal power generation. We define the reduction in pollutant and CO2 emissions as the environmental benefit.
The environmental benefit of this project is based on increasing (coal consumption decreasing) after the project is implemented. The environmental benefit evaluation model is given by:
where is the pollutant emission cost per ton of coal, is the CO2 emissions per tonne coal, and is the carbon emission cost.
C. Fixed investment cost evaluating model
The cost evaluation model is given by:
where is the electric boiler cost per capacity, is the average bank lending rates, is the lifetime of the electric boiler, and is the electric boiler annual maintenance cost ratio.
2.2.2. Constraint Conditions
The objective function of the model aims to maximise the comprehensive social benefits of the project while satisfying various system operation constraints:
A. Power load balancing constraint:
where is the output from the conventional thermal power generator unit i at time t; is the output from the CHP unit j at time t; is the output from the wind farm k at time t; and is the power load at time t.
B. Heat load balancing constraint:
where is the heat supplied by CHP unit j at time t, is the heat supplied by the electric boiler at time t, and is the heat load demand at time t.
C. Conventional thermal power generation unit output constraint:
where is the minimum output of the conventional thermal power generator unit i at time t and is the maximum output of the conventional thermal power generator unit i at time t.
D. CHP unit output constraint:
where is the minimum load output of CHP j at time t when supplying an amount of heat and is the maximum load output of CHP j at time t when supplying an amount of heat .
According to [26], feasible operating area of a CHP unit are determined by corner points, and , are the lower and upper load bound of this feasible operating area given a certain heat output, and they can be calculated by the method proposed in [26]. We only use and of CHP units to estimate the grid’s peak regulation interval, thus to calculate the extra wind power accommodating ability of the grid besides the wind power consumed by electric boilers.
E. Wind farm output constraint:
where is the maximum output of the wind farm k at time t.
F. Spare capacity constraint:
where is the maximum output of the conventional thermal power generator unit i at peak time, is the maximum output of the CHP unit j at peak time, is the maximum output of wind farm k at peak time, is the power load at valley time, is the electric boiler input power at a low load period, is the reserve capacity at peak time, m is the number of conventional thermal power generator units, n is the number of CHP units, and h is the number of wind farms.
G. Peak regulation tolerance during the low load period constraint:
where is the minimum output of conventional thermal power generator unit i during a low load period, is the minimum output of CHP unit j during a low load period, is the power load during a low load period, is the electric boiler operating power during a low load period, and is the peak regulation tolerance during a low load period.
H. Generation unit ramp-rate constraint:
Power units are constrained by the ramp-up and ramp-down rates of the generation units. Therefore, a constraint relationship exists between the output at a given time and at a prior time:
where is the maximum ramp-down rate of conventional thermal power generator unit i in unit time, is the maximum ramp-up rate of conventional thermal power generator unit i in unit time, is the maximum ramp-down rate of CHP unit j in unit time, is the maximum ramp-up rate of CHP unit j in unit time, and is the length of each time segment.
I. Electric boiler capacity constraint:
where is the capacity utilisation of the electric boiler at time t.
3. Case Study
3.1. Data Sources and Hypothesis
The 2015 BTH grid is analysed in this paper. The power service area covers the whole BTH grid, i.e., all of the region of Beijing, Tianjing and northern Hebei Province is included. However the heat service only covers the metropolitan areas, where the heat grid spreads. The installed conventional thermal power generator capacity is 22,000 MW, and the peak regulation interval is 55%~100%. The installed CHP capacity is assumed to be 28,000 MW in the coming years, slightly higher than 2015.
Regarding heat supply, we consider the CHP units and electric boilers as one system. We assume that the heat supply requirement of this system is a constant during one whole heat supply season, which means the heat supply from this system is the same as heat supply from CHP units without electric boilers. The heat supply abatement of CHP units will be replaced by the heat supply of electric boilers. The upper and lower limits of the CHP units are 21,000 MW and 18,000 MW, respectively, when the CHP heat supply ratio (here, we define the CHP unit heat supply ratio as the actual heat load divided by the rated heat load) is assumed to be 90%.
The installed wind power capacity is 9000 MW, and the output at the peak time is set to 1000 MW as considerable uncertainty is involved.
We set 52,000 MW as the maximum power grid load. The reserve capacity at the peak time must exceed 2000 MW, and the regulation tolerance during the low load period must be greater than 600 MW.
A total of 10,000 MW of external electricity are purchased by the BTH grid; the external electricity is assumed to have been generated by conventional thermal power generating units.
According to the value of the peak regulation interval of conventional thermal power generators, we can see that the sum of the minimum output of conventional thermal power generators and external electricity is 17,600 MW. Hence, the minimum output of the BTH grid excluding wind power is 35,600 MW.
The difference between the actual load and the minimum output of the BTH grid, excluding wind power, is the wind power accommodation margin. In addition, 600 MW of regulation tolerance must be subtracted during the low load period.
The power grid load and wind power data were calculated based on the average daily values from the 2013 and 2014 heat supply seasons, which were used as baseline data. The electric power load baseline data of seven typical days are shown in Figure 2.

Figure 2.
The Beijing-Tianjin-Hebei (BTH) power grid electric power load baseline data (from seven typical days). Data source: BTH power grid.
The historical wind speed data were fitted using a two-parameter Weibull distribution. The fitted ratio parameter is 8.9, and the shape parameter is 2.3. The fitting result is shown in Figure 3.
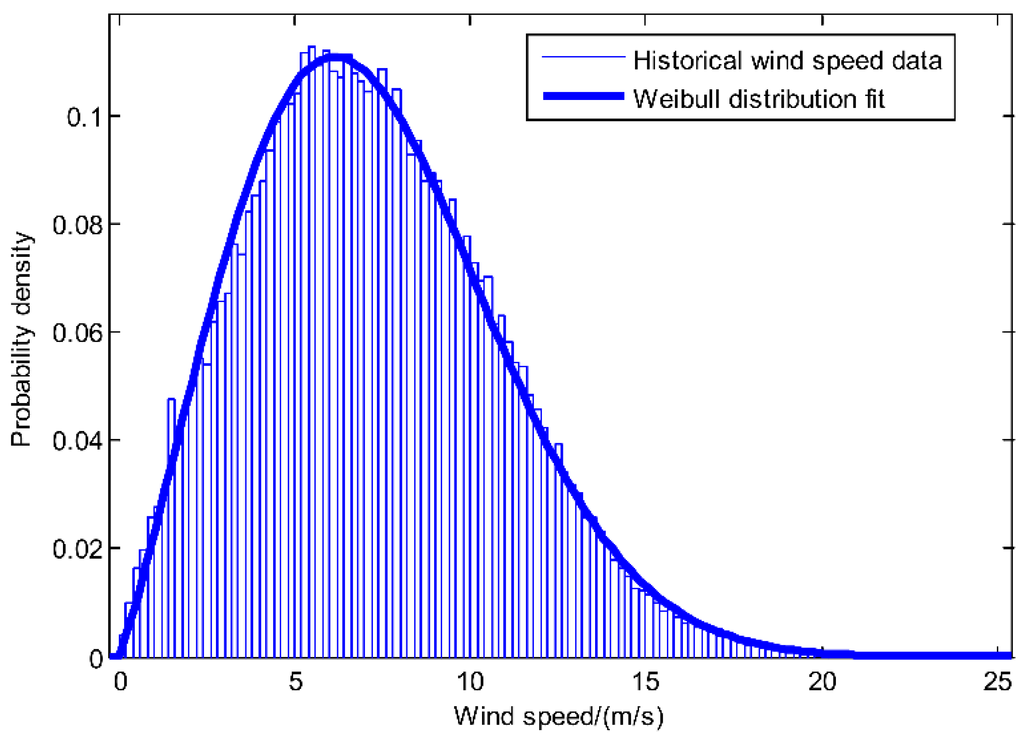
Figure 3.
Weibull distribution fitting of historical wind speed data.
The cut-in wind speed , rated wind speed , and cut-out wind speed are set as 3, 12, and 25 m/s, respectively, based on the actual wind farms in the BTH power grid region.
The wind-speed-power-curve relationship is as follows:
where is the rated wind power.
A total of 30 virtual wind farms with 300 MW capacities were simulated in this study. A Monte Carlo simulation was conducted to simulate the wind speed at each wind farm. Then, the output of each wind farm was obtained based on the wind speed-power function and then summed to obtain the total wind power output.
Wind power outputs in one heat supply seasons were simulated via Monte Carlo and are shown in Figure 4.

Figure 4.
Simulated wind power outputs.
Additional model parameter values for the calculations are listed in Table 1.

Table 1.
Model calculation parameters.
3.2. Wind Power Curtailment Analysis
Based on the restriction provided by the constraint conditions, the installed electric boiler capacity in the thermal power plant is set to 0, and the wind power curtailment is calculated for each time segment based on the original conditions.
Five simulations are conducted because of the variations of load and wind speed in Monte Carlo simulation. There are tiny differences between these simulations, so we take the fifth simulation as an example to show the wind power curtailment. The results are shown in Figure 5.
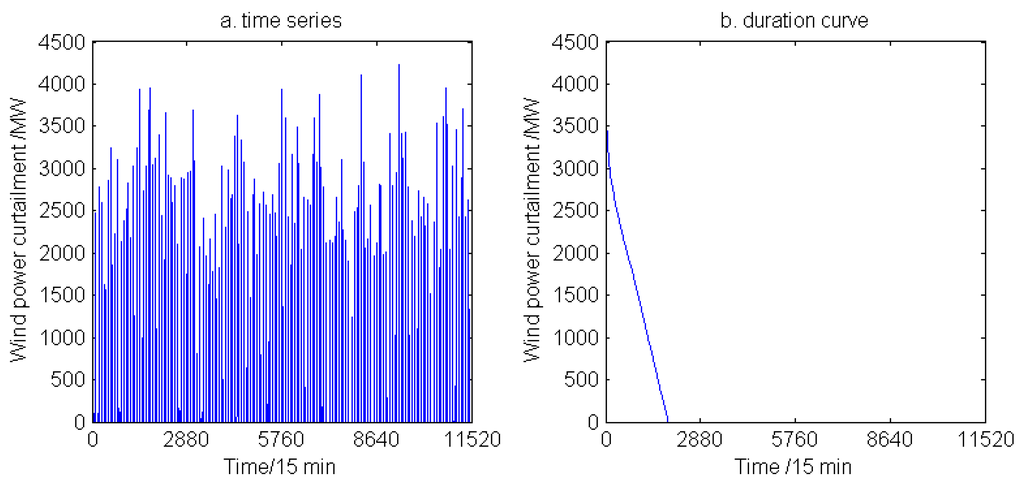
Figure 5.
Wind power curtailment in the BTH power grid under the original conditions.
The wind power curtailment and curtailment rate of the BTH power grid were obtained from the simulations, as listed in Table 2. Table 2 illustrates that the average wind power curtailment rate of the BTH power grid is approximately 7.65%.
Table 2.
The Beijing-Tianjin-Hebei (BTH) power grid wind power curtailment and wind power curtailment rate.
Seven days were selected for a more detailed analysis of the wind power curtailment, as shown in Figure 6. Figure 6 shows that the wind power curtailment of the BTH power grid mainly occurs between midnight and 6 a.m., during the low load period.
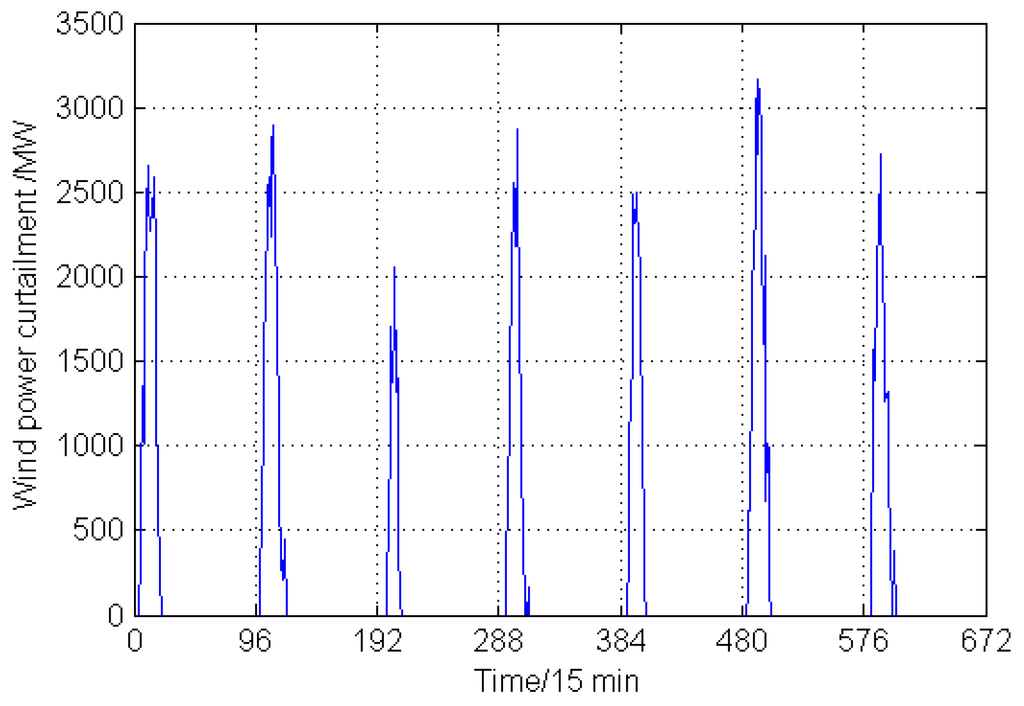
Figure 6.
The Beijing-Tianjin-Hebei (BTH) power grid wind power curtailment.
3.3. Optimum Electric Boiler Capacity Calculation
Optimum installed electric boiler capacity can be calculated using the proposed model. The comprehensive benefits were calculated separately for each of the above five simulations, as shown in Figure 7. The comprehensive benefits all rapidly increase with increasing installed capacity. The comprehensive benefits reach a maximum value when the installed capacity reaches approximately 1100 MW. Then, the comprehensive benefits begin to decrease. The comprehensive benefits become negative when the installed capacity reaches 2200 MW. Thus, the optimum installed electric boiler capacity should be approximately 1100 MW to maximise the comprehensive benefits.

Figure 7.
Capacity and benefit analysis.
The wind power curtailment is calculated again for each time segment with the optimum electric boiler installation capacity. The results are shown in Figure 8.

Figure 8.
Wind power curtailment in the BTH power grid with optimum electric boiler installation capacity.
We can see that the duration of wind power curtailment in Figure 8b is much lower than it in Figure 5b; thus, the installation of electric boilers helps to accommodate wind power. The wind power curtailment and wind power curtailment rate are listed in Table 3. The wind power curtailment and wind power curtailment rate of the BTH power grid significantly decrease after optimum electric boiler capacity installation, as shown in Table 3.
Table 3.
The wind power curtailment and wind power curtailment rate after optimum electric boiler capacity installation.
3.4. Sensitivity Analysis
Sensitivity analysis of coal price and electric boiler price is conducted, and the results are shown in Figure 9 and Figure 10.
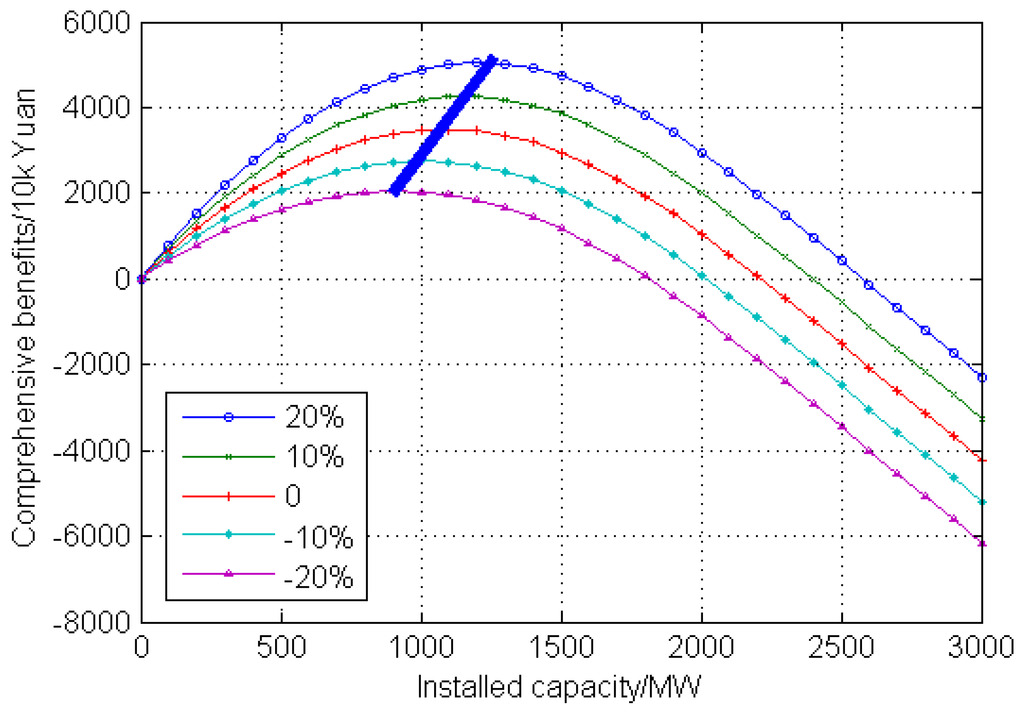
Figure 9.
Sensitivity analysis of coal price.

Figure 10.
Sensitivity analysis of electric boiler price.
Figure 9 and Figure 10 show that the comprehensive benefits vary with the coal price and electric boiler price; the straight line shows the variation of the optimum capacity. The optimum electric boiler installation capacity has a roughly linear relation to coal price (positive correlation) and electric boiler price (negative correlation).
4. Conclusions and Future Work
This paper analyzed an optimum electric boiler capacity installation for a regional power grid with a relatively high proportion of CHP units and wind power installation capacity. The goals of this project are to increase wind power accommodation and to maximise the comprehensive social benefits.
An optimum electric boiler capacity installation model was established, and the BTH power grid was used to validate this model. The results indicate that installing electric boilers in CHPs can increase the ability to accommodate wind power. Simulations show that this project has outstanding environmental and economic benefits. The optimum electric boiler installation capacity of the BTH power grid is approximately 1100 MW.
With sensitive analysis, we find that the optimum electric boiler capacity has a positive linear correlation to coal price and a negative linear correlation to electric boiler price.
However, the case study analysed in this paper only provides a rough estimation. Various heat supply season parameters, such as wind power output, power load, and heat supply curves of CHP units, could be more realistic, resulting in a more accurate optimum system configuration. The lowest power load during the Spring Festival is as 3/4 of the low load in normal days [28], thus wind power curtailment in these days is higher than usual. But this extreme status lasts less than one week. Comparing with 120 days of the whole heat supply seasons, the impact of Spring Festival is less than 5%, therefore it is neglected in this research.
The government can use investment subsidies and tax preferences to encourage the owners of CHP units to install electric boilers in their plants. The rule of first come, first served holds until reaching the optimum electric boiler installation capacity. In this paper, we modelled the CHP with the electric boiler as one system; thus, the capacity utilisation of the electric boiler was not analysed. The only consideration is the response flexibility of this system to heat demand and power load demand.
In addition, this paper analysed the project from a macroscopic viewpoint, which did not consider the costs and benefits for various parties involved in the project. In future research, game theory can be introduced to analyse how to guide all the participants to act as needed.
Acknowledgments
This work was supported by the National Natural Science Foundation of China (NSFC) (70901025), the Social Science Funding Project of Beijing (13JDJGC055) and the Fundamental Research Funds for the Central Universities (2014ZD22).
Author Contributions
Da Liu conceived and designed the experiments; Guowei Zhang. performed the experiments and analyzed the data; Baohua Huang and Weiwei Liu contributed materials and helped to analyze the data; Da Liu and Guowei Zhang wrote the paper.
Conflicts of Interest
The authors declare no conflict of interest.
References
- Zakeri, B.; Rinne, S.; Syri, S. Wind Integration into Energy Systems with a High Share of Nuclear Power—What Are the Compromises? Energies 2015, 8, 2493–2527. [Google Scholar] [CrossRef]
- Kang, C.; Chen, X.; Xu, Q.; Ren, D.; Huang, Y.; Xia, Q. Balance of power: Toward a more environmentally friendly, efficient, and effective integration of energy systems in China. IEEE Power Energy Mag. 2013, 11, 56–64. [Google Scholar] [CrossRef]
- Göransson, L.; Johnsson, F. Dispatch modeling of a regional power generation system—Integrating wind power. Renew. Energy 2009, 34, 1040–1049. [Google Scholar] [CrossRef]
- Albadi, M.H.; El-Saadany, E.F. Overview of wind power intermittency impacts on power systems. Electr. Power Syst. Res. 2010, 80, 627–632. [Google Scholar] [CrossRef]
- Yuan, J.; Sun, S.; Shen, J.; Xu, Y.; Zhao, C. Wind power supply chain in China. Renew. Sustain. Energy Rev. 2014, 39, 356–369. [Google Scholar] [CrossRef]
- He, Y.X.; Xia, T.; Liu, Z.Y.; Zhang, T.; Dong, Z. Evaluation of the capability of accepting large-scale wind power in China. Renew. Sustain. Energy Rev. 2013, 19, 509–516. [Google Scholar] [CrossRef]
- Li, C.B.; Shi, H.Q.; Cao, Y.J.; Wang, J.H.; Kuang, Y.H.; Tan, Y. Comprehensive review of renewable energy curtailment and avoidance: A specific example in China. Renew. Sustain. Energy Rev. 2015, 41, 1067–1079. [Google Scholar] [CrossRef]
- Li, Y.; Fu, L.; Zhang, S. Technology application of district heating system with Co-generation based on absorption heat exchange. Energy 2015, 90, 663–670. [Google Scholar] [CrossRef]
- Long, H.; Xu, K.; Xu, R.; He, J. More wind power integration with adjusted energy carriers for space heating in Northern China. Energies 2012, 5, 3279–3294. [Google Scholar] [CrossRef]
- Burke, D.J.; O’Malley, M.J. Factors Influencing Wind Energy Curtailment. IEEE Trans. Sustain. Energy 2011, 2, 185–193. [Google Scholar] [CrossRef]
- Zhang, N.; Lu, X.; McElroy, M.B.; Nielsen, C.P.; Chen, X.; Deng, Y. Reducing curtailment of wind electricity in China by employing electric boilers for heat and pumped hydro for energy storage. Appl. Energy 2015. [Google Scholar] [CrossRef]
- Lund, P.D.; Lindgren, J.; Mikkola, J.; Salpakari, J. Review of energy system flexibility measures to enable high levels of variable renewable electricity. Renew. Sustain. Energy Rev. 2015, 45, 785–807. [Google Scholar] [CrossRef]
- Hirth, L.; Ziegenhagen, I. Balancing power and variable renewables: Three links. Renew. Sustain. Energy Rev. 2015, 50, 1035–1051. [Google Scholar] [CrossRef]
- Atwa, Y.M.; El-Saadany, E.F. Optimal Allocation of ESS in Distribution Systems with a High Penetration of Wind Energy. IEEE Trans. Power Syst. 2010, 25, 1815–1822. [Google Scholar] [CrossRef]
- Waite, M.; Modi, V. Potential for increased wind-generated electricity utilization using heat pumps in urban areas. Appl. Energy 2014, 135, 634–642. [Google Scholar] [CrossRef]
- Hedegaard, K.; Münster, M. Influence of individual heat pumps on wind power integration—Energy system investments and operation. Energy Convers. Manag. 2013, 75, 673–684. [Google Scholar] [CrossRef]
- Chen, L.; Xu, F.; Wang, X.; Min, Y.; Ding, M.; Huang, P. Implementation and effect of thermal storage in improving wind power accommodation. Proc. Chin. Soc. Electr. Eng. 2015, 35, 4283–4290. [Google Scholar]
- Papaefthymiou, G.; Hasche, B.; Nabe, C. Potential of heat pumps for demand side management and wind power integration in the German electricity market. IEEE Trans. Sustain. Energy 2012, 3, 636–642. [Google Scholar] [CrossRef]
- Xydis, G. Wind energy to thermal and cold storage—A systems approach. Energy Build. 2013, 56, 41–47. [Google Scholar] [CrossRef]
- Kiviluoma, J.; Meibom, P. Influence of wind power, plug-in electric vehicles, and heat storages on power system investments. Energy 2010, 35, 1244–1255. [Google Scholar] [CrossRef]
- Nielsen, M.G.; Morales, J.M.; Zugno, M.; Pedersen, T.E.; Madsen, H. Economic valuation of heat pumps and electric boilers in the Danish energy system. Appl. Energy 2015. [Google Scholar] [CrossRef]
- Meibom, P.; Kiviluoma, J.; Barth, R.; Brand, H.; Weber, C.; Larsen, H.V. Value of electric heat boilers and heat pumps for wind power integration. Wind Energy 2007, 10, 321–337. [Google Scholar] [CrossRef]
- Gill, S.; Dolan, M.J.; Frame, D.; Ault, G.W. The Role of Electric Heating and District Heating Networks in the Integration of Wind Energy to Island Networks. Int. J. Distrib. Energy Resour. 2011, 7, 245–263. [Google Scholar]
- Wu, C.B.; Huang, G.H.; Li, W.; Zhen, J.L.; Ji, L. An inexact fixed-mix fuzzy-stochastic programming model for heat supply management in wind power heating system under uncertainty. J. Clean. Prod. 2016, 112, 1717–1728. [Google Scholar] [CrossRef]
- Sun, R.; Zhang, T.; Liang, J. Evaluation and application of wind power integration capacity in power grid. Autom. Electr. Power Syst. 2011, 35, 70–76. [Google Scholar]
- Chen, X.; Kang, C.; O’Malley, M.; Xia, Q. Increasing the Flexibility of Combined Heat and Power for Wind Power Integration in China: Modeling and Implications. IEEE Trans. Power Syst. 2015, 30, 1848–1857. [Google Scholar] [CrossRef]
- Qinhuangdao seaborne coal market. Available online: http://www.cqcoal.com/Trade/Price/ (accessed on 20 January 2016).
- Liu, D.; Niu, D.; Li, Y. Mid-term load forecasting optimization model based on multi-factor influence of season and holiday. In Proceedings of the 2006 China International Conference on Electricity Distribution (CICED 2006), Beijing, China, 17–20 September 2006; p. 239.
© 2016 by the authors; licensee MDPI, Basel, Switzerland. This article is an open access article distributed under the terms and conditions of the Creative Commons by Attribution (CC-BY) license (http://creativecommons.org/licenses/by/4.0/).