Article

Evaluating Bypass Distribution and Part-Load Optimization for Condensing Tail Turbines in Swedish Combined Heat and Power Plants with Geared Main Turbines


by
Abu Al-Soud Mohammed
* and
Genrup Magnus
M-Building, Energy Sciences, Lund University, 22100 Lund, Sweden
*
Author to whom correspondence should be addressed.
Energies 2026, 19(9), 2036; https://doi.org/10.3390/en19092036
Submission received: 13 March 2026 / Revised: 11 April 2026 / Accepted: 13 April 2026 / Published: 23 April 2026
(This article belongs to the Section F1: Electrical Power System)

Abstract

With the expected further electrification of society, a greater electricity demand is to be expected, requiring improved flexibility. One proposal that meets these demands is the adaptation of the current district heating power plants by adding condensing tail turbines. Condensing tail turbines allow for further expansion of steam. A simple economic analysis showed that implementing a condensing tail with the ability to bypass 50% of the district heating resulted in an additional 2.36 million SEK (215 thousand €) in income per winter. The condensing tail turbine lacks research, especially its control strategy, leading to the novel part-load study for both a 100% and 50% capacity condensing tail of both a single- and double-flow type. For the full-load condensing tail, each bypass fraction above 0.6, meaning a 60% reduction in district heating load, showed a clear optimum which would give up to 173.5 kW gain in electricity production from adjusting the control strategy. The total gain in power from bypassing 90% of steam from the condensers amounted to 3.13 MW and 3.17 MW for the single- and double-flow turbines, respectively. A 50% capacity condensing tail showed a smaller difference, resulting in 1.7 MW for both.

1. Introduction

Energy systems and industries are facing a rapid transformation driven by the increasing installed capacity of renewable energy, specifically wind power. While these improve the grid in terms of decarbonization, their variability increases difficulties in maintaining stability while ensuring sufficient supply in periods of low wind. To manage these fluctuations, power systems require complementary energy sources that are capable of providing both a fast response and sustained generation. Battery installations have significantly expanded in recent years and provide valuable fast-frequency services [1]. However, they lack rotational inertia and do not provide the ability to manage prolonged backup generation during low-wind periods.
Two prominent conventional back-up resources for prolonged operation are the gas turbines and hydropower. These are fast and reliable but have been limited in their capacity. The Swedish gas turbine fleet is aging while operating with a high fuel cost at low efficiency, leading to higher electricity prices. Hydropower, while providing cheaper electricity and continuously receiving modernization, is constrained in its fleet expansion due to environmental regulations. This leaves a growing need for alternate solutions with the ability to support long-term fluctuations in the power grid.
In Sweden, district heating power plants have been built up since the 1960s [2]. This has accumulated a large fleet of power plants that operate according to heat demand, rather than electricity price. As a consequence, these plants regularly reduce their load to match the district heating load, even during high electricity prices. Five methods have previously been proposed to improve operational flexibility. The first is extraction steam throttling, which provides a temporary increase in the power output by limiting the steam sent to the feedwater heaters [3,4,5]. The second method is the implementation of thermal energy storage, where energy is stored by heating salt during periods of low electricity prices and is subsequently released during high-price periods to provide additional power without overfiring the boiler [6]. The third method operates on a similar principle but instead stores steam in steam accumulators [7,8]. The fourth approach employs hot water tanks, charged during off-peak operation, to improve the boiler’s start-up performance [9]. The final method utilizes electrically powered feedwater preheaters to reduce the minimum load of the boiler [10]. In addition, a recent study has investigated hydrogen combustion within the power plant to increase power output [11]. Although these methods enable rapid increases in electricity production, their operation remains constrained by the district heating condensers and limited operating duration.
Condensing tail (CT) turbines address the main limitation by enabling a partial or full bypass of district heating condensers. This allows for the steam to expand further, providing additional power. This increases the freedom of operators to more efficiently plan and operate, based on the district heating demand. Furthermore, CT turbines provide the grid with rotational inertia to improve stability. Historically used in Sweden but later phased out, CT turbines have recently regained relevance due to increasing renewable variability and new policy incentives aimed at boosting electricity production from existing thermal assets.
While CT turbines are recognized for their potential, no prior work has systematically analyzed the impact of bypass distribution and turbine geometry on part-load performance. This gap leads to the research question of how condensing tail turbines can be optimally controlled at part-load to maximize electricity production during high-price or low-heat-demand periods. That is answered by providing a detailed thermodynamic analysis of bypass-distribution behavior showcasing the impact of control strategies. As the capacity of renewable energy increases, the planned flexible power will become increasingly valuable.

Benefits with Condensing Tail Turbines

CT turbines can provide meaningful operational and economic benefits for district heating power plants, though the extent of these benefits depends strongly on the plant’s role in the district heating system. In this study, two representative plant types are considered: a base-load plant and a peak-load plant, both operating with a boiler rated at 97 MW of heat input.
For base-load power plants that typically operate at or close to the full district heating demand load during the winter season, the economic potential is limited. The district heating revenue is generally greater than the value of the additional electricity produced through the condensing operation. This effect has become more severe with rising biomass fuel prices, reaching 350 SEK/MWh in early 2024 [12]. The fuel is chosen as biomass, as this is the fuel that most new power plants are built to combust. In such cases, the implementation of CT turbines become infeasible unless done with support from subsidies from either the transmission system operator (TSO) or the government. One indication of a shift towards such a support system is the proposal from the Swedish government to provide subsidies amounting to 250 million SEK in 2025, with plans to increase the budget to 1 billion SEK in 2028 [13]. The intended beneficiaries of these subsidies are utility companies that intend to increase their electricity production.
In contrast, the peak-load power plants present a more favorable case. These plants are dimensioned to cover the gap in district heating demand when it is at its highest. This means that the power plant will operate at part-load daily. For these power plants, there is no replacement of the district heating income with electricity. Instead, there is only gain from increasing the electricity output, providing incentives without external financing.
Furthermore, implementing a condensing tail turbine can reduce or even avoid frequent cycling of the boiler and main turbine to meet variable demand. When combined with an expanded accumulator system, the condensing tail enables increased production of district heat during periods of low electricity prices and enhanced condensing operation during high-price periods. This approach minimizes the need for load reduction, as observed during the 2023/2024 and 2024/2025 winter peaks, when only about 12–31% of the available capacity in district heating power plants was utilized [14,15].
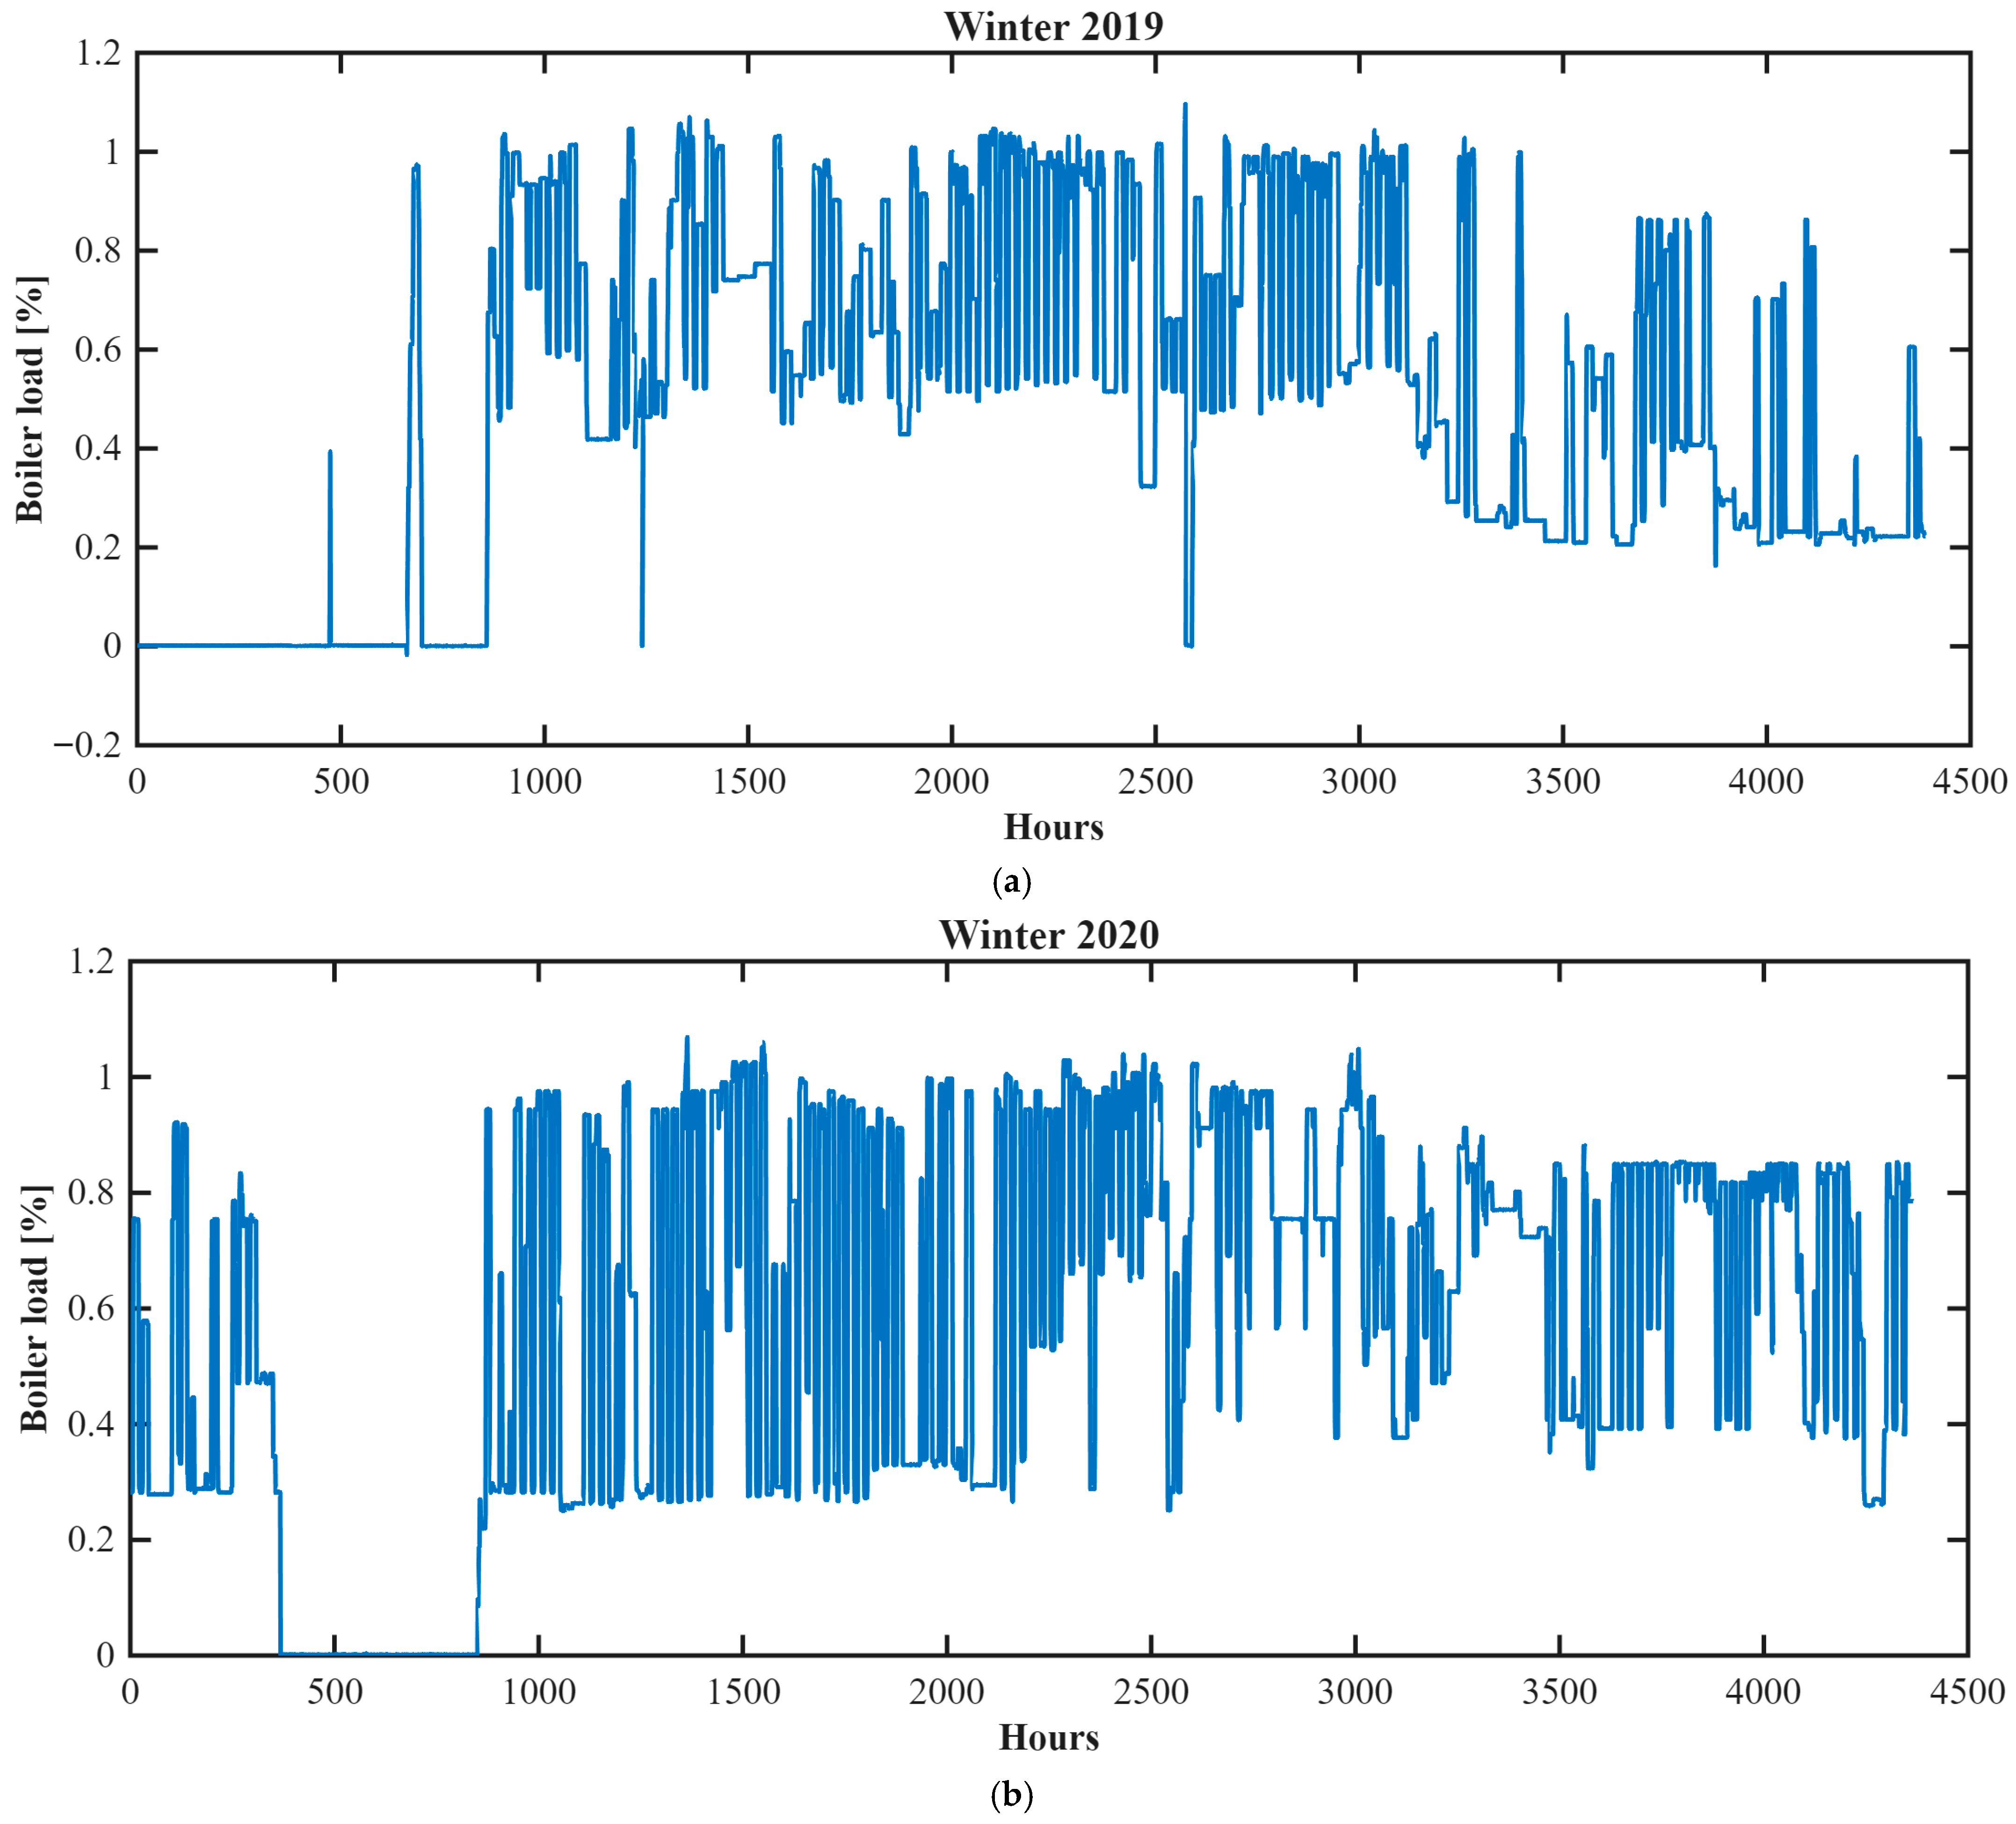
Using historical operational data for a power plant for the winters of 2019/2020 and 2020/2021 (seen in Figure 1) between 1 October and 31 March, a simplified economic assessment showed that there is potential to, on average, increase the yearly income by up to 2.36 million SEK/year (215 thousand €) with a 50% capacity turbine. This does not take into account the operational cost nor fuel and is instead the total income from increasing power output. The minimum flow is chosen as 30%, with analysis primarily focusing on the cost of electricity in Swedish bidding zone SE3 (from 2024), where most of the district heating capacity is located. Doing a scenario-based sensitivity analysis on electricity prices showed that:
  • Increasing the electricity price by 20% increases the income by 3.33 million SEK/year (300 thousand €).
  • Decreasing electricity prices by 20% lower electricity prices reduce the total income to 1.75 million SEK/year (160 thousand €).
Performing the same analysis on fuel prices showed that:
  • Increasing the fuel price by 100 SEK/MWh to 450 SEK/MWh reduces the income to 1.32 million SEK/winter (120 thousand €).
  • Reducing fuel prices to 250 SEK/MWh increases the income to 4.78 million SEK/year (440 thousand €).
This shows the heavy dependence of the income on both electricity and fuel prices. The dependence on the fuel price makes the solution very favorable for waste-fired plants, where fuel can instead provide a compensation rate of up to 200 SEK/MWh (18.4 €). Applying a condensing tail turbine on waste incineration power plant data between January and June in 2025 facilitates additional revenue exceeding 9 million SEK (830 thousand €). This is significant but can be reduced due to heavily depending on the availability of the permitted waste throughput. The calculations do not account for the installation cost nor the capital cost, but rather they are based purely on the income that can be gained.
While a full LCOE analysis is beyond the scope, preliminary estimates can be done by assuming the values of the installation, cost of the turbine, and its balance of plant. Thunder Said Energy (an energy consulting firm) published data on steam cycles where the costs can be roughly estimated [16]. The condensing tail preliminary and conservative net present value, accounting for quadruple the capital cost due to small size, shows an estimated 18-year payback. In addition, 25% and 50% coverage from grants reduce the number of years to 13.5 and 9 years, respectively. The quadrupling of capital cost can possibly be an over- or underestimate, as it is a relatively small unit operating at a significantly lower temperature.
Apart from direct financing from grants that support investments in the added capacity, another source of continuous income is:
  • Capacity reserve.
  • Island-mode capability and inertia.
  • mFRR.
Following the termination of the old power reserve contract in the winter of 2024/2025, uncertainty has increased because the main power plant was found to exceed the regulated cost limits. Maintaining the cost limit will leave a gap in the required reserve capacity that needs to be covered by other production units. Of the 350 MW of reserve power contracted in 2025/2026, an additional condensing power plant provided 20 MW. If not solved, this situation could possibly indicate a shift toward greater involvement of other plants.
Even without the compensation from being a part of the capacity reserve, there are other compensation opportunities that include payments for providing inertia, island-mode capability and mFRR capacity. Inertia is the rotational energy that is stored within the generator and turbine. Island-mode operation is the ability to sustain a smaller local grid that is temporarily decoupled from the transmission network, enabling continued operation during disturbances. One condensing thermal power plant has been granted such a contract in recent years. The third service, mFRR, is a part of frequency restoration reserve and is activated when there is an insufficient supply of electricity. This provides a passive income stream. During the winter of 2024/2025, the average monthly mFRR price varied from 20 €/MW to 100 €/MW in SE3 and SE4 [17].
By increasing the installed capacity and flexibility, CT turbines enhance the ability of the power plant to participate in being granted these additional revenues.

2. Thermodynamic Model

This section presents the thermodynamic model developed to evaluate the part-load performance of a Swedish district heating (DH) combined heat and power (CHP) plant equipped with a condensing tail (CT) turbine. The analysis is based on a detailed simulation of the steam cycle, incorporating validated turbine and heat-exchanger models. The objective is to quantify the effects of bypass distribution on the DH condensers, as well as on the main turbine and CT turbine.

2.1. Cycle Configuration and Modeling Framework

To enable off-design simulations, the model employs component-specific equations implemented in IPSEpro version 8.0 [18]. IPSEpro is a simulation tool developed by SimTech GmBH (Graz, Austria). The software solves the governing equations using Jacobian-based iterative methods, where initial estimates are used to compute derivatives, which are then employed to update the state variables iteratively until convergence is reached. The governing equations of individual components can be independently customized, enabling full control of the model. This includes classifying variables either as calculated quantities or as parameters. Its short computational time, compatibility with MATLAB (version R2022a) through a COM API interface, and its ability—compared to other heat balance softwares—to freely modify component equations rendered IPSEpro well suited for the present study. For further information on the software, the reader is referred to the technical papers describing the solution method, the development of its predecessor, and the software’s overall architecture and features [19,20,21].
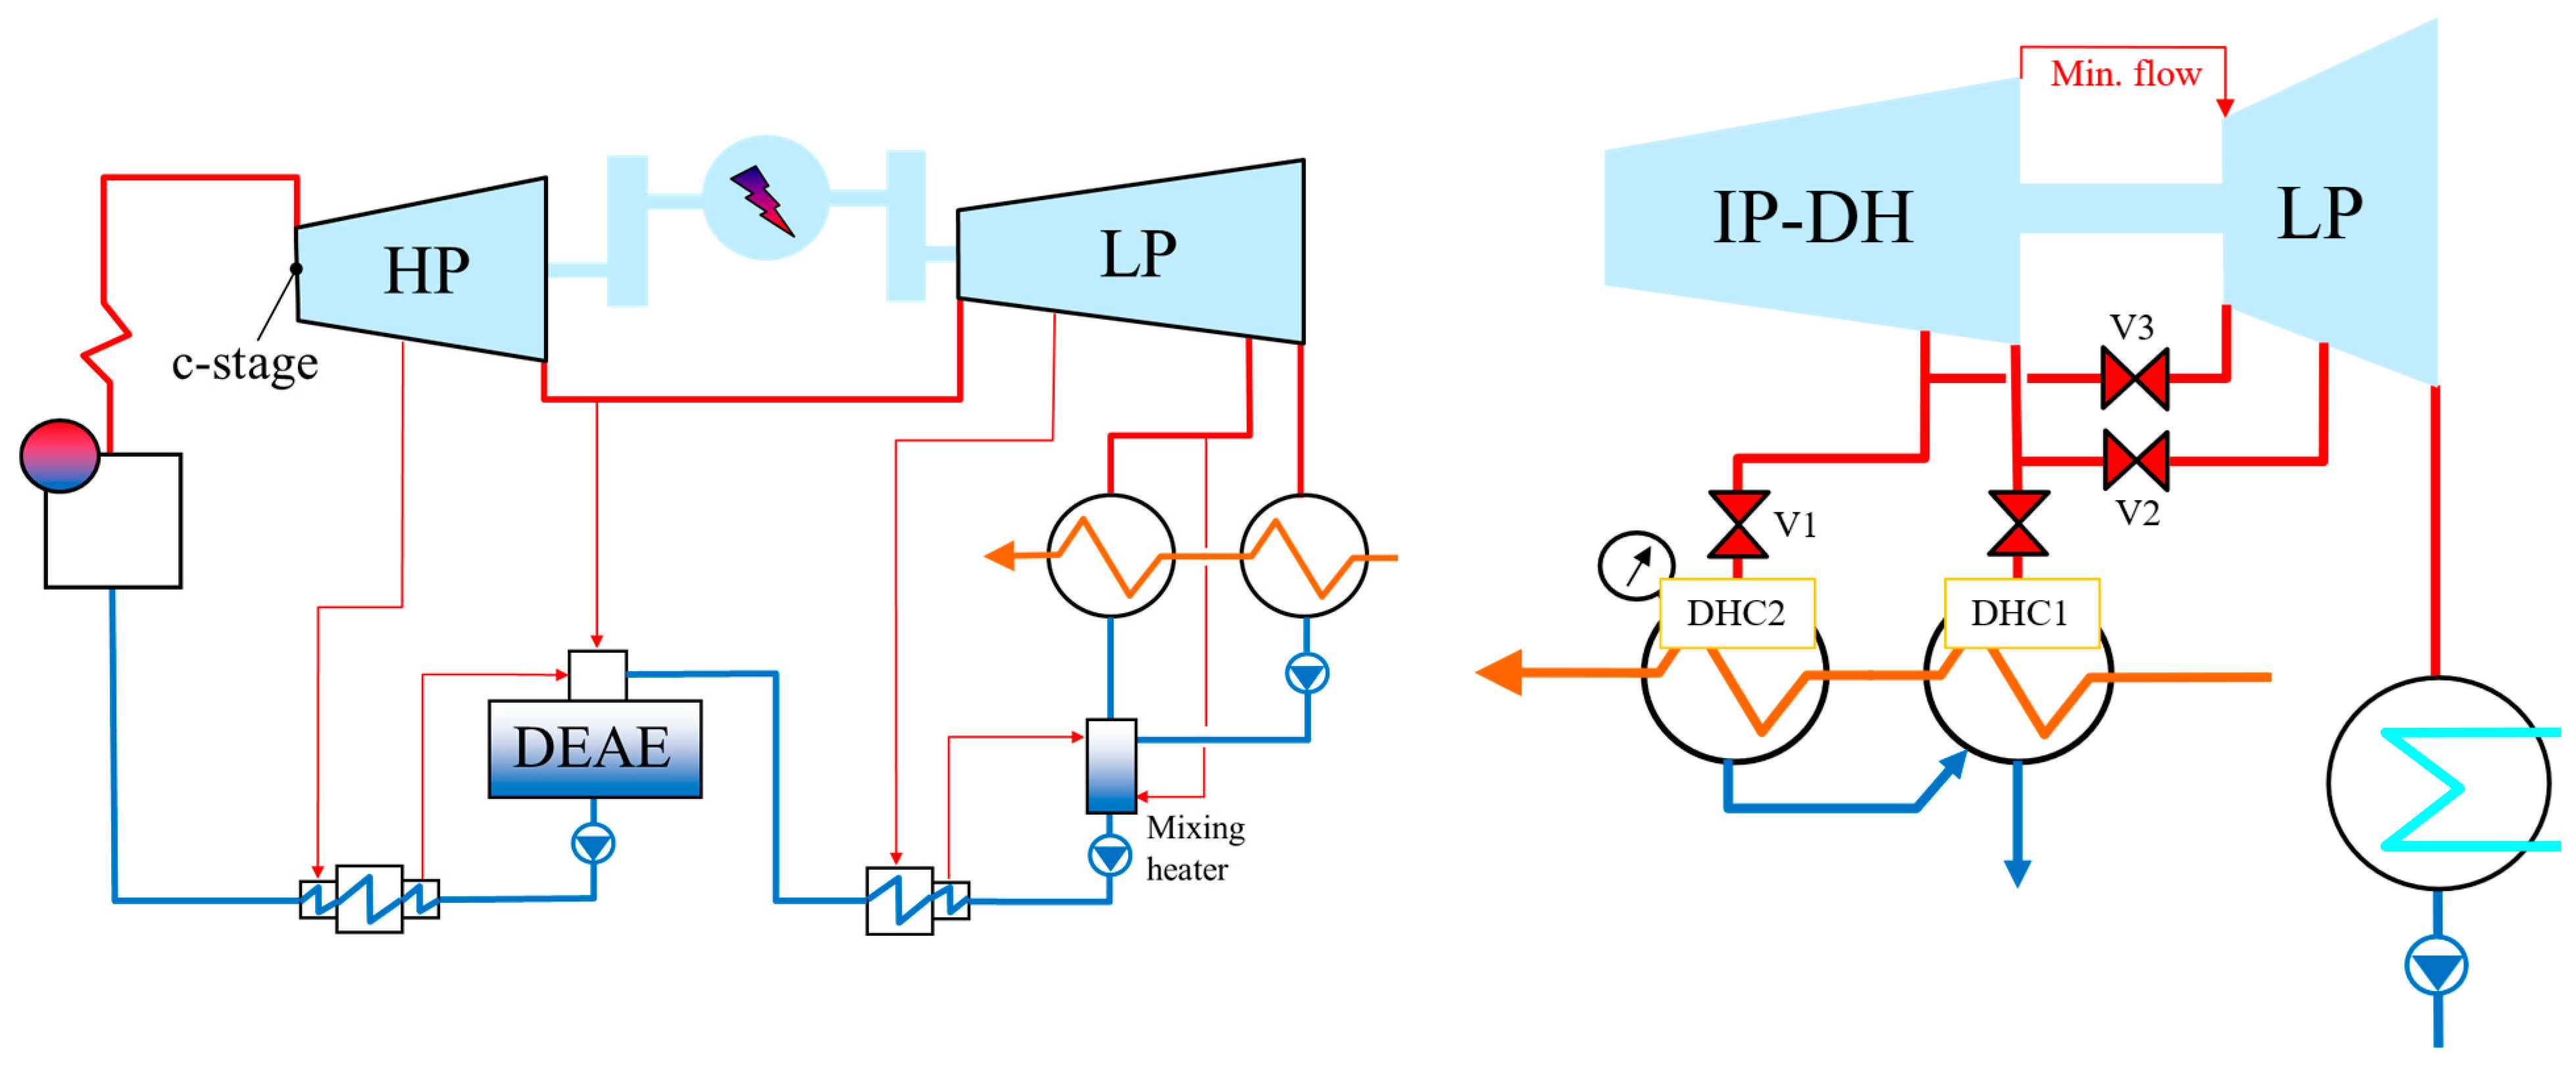
The reference steam-cycle model represents a generalized Swedish CHP plant, illustrated on the left in Figure 2. As the model is based on site-specific plant data, the exact locations of the facility cannot be disclosed. The cycle includes four preheaters (high-pressure feed water heater, deaerator, low-pressure feed water heater, and a mixing heater for the two DH condenser condensates), and a high-pressure (HP) and low-pressure (LP) turbine connected with a gearbox. The LP part of the turbine has two extraction levels for the condensers.

2.2. Turbine Modeling and Configurations

Within the software framework, the main turbine is modeled as a simple turbine. The turbine state properties are continuously updated through an iterative coupling with an external in-house turbine through-flow developed by Siemens Energy. Owing to its extensive application and validation, this approach enables an accurate representation of the stage efficiencies, swallowing capacities, and extraction behavior.
The CT turbine, which is installed downstream of the LP turbine, is also modeled using the same external solver. A schematic representation of the condensing tail setup is seen in the right part of Figure 2.
The turbine model requires geometric and operational inputs such as rotational speed, stage count, and boundary conditions. Turbine losses are calculated using empirically derived correlations that have been validated against the Siemens fleet, with losses historically having been modified through testing.
The main turbine is a set design based on an existing CHP plant, while the CT turbine is not. Two types of ungeared CT turbine configurations are evaluated:
  • Single-flow CT turbine—Steam from the high-pressure DH condenser enters the turbine first; steam from the lower-pressure condenser is injected at a later stage, where mixing occurs.
  • Double-flow CT turbine—Steam from each DH condenser extraction expands separately down to the CT condenser pressure.
Decoupling the CT turbine shafts enables the double-flow configuration to operate asymmetrically by allowing one inlet to be closed. In Figure 2, this corresponds to closing valve V2 while keeping V3 open (or vice versa), thereby enabling one condenser to be off-loaded while the other remains at a nominal load. Such asymmetric operation is beneficial for CHP plants where additional combustion or steam flow to the condensers is present, as seen in [11].
In contrast, coupling the shafts requires the minimum flow to be maintained in both flow paths, which reduces the asymmetric advantage of the double-flow turbine, as both turbine configurations show a similar minimum load. For the double-flow turbine, the minimum loads of the high-pressure and low-pressure condenser bypasses are 32.6% (4.21 kg/s) and 29.0% (4.32 kg/s), respectively. For the single-flow turbine, the corresponding minimum load is approximately 29.9% (8.2 kg/s), shared by both the high-pressure and low-pressure side. When both inlets are operating, the double-flow turbine provides improved rotor force balancing.
As a consequence of the turbine minimum load constraint, a minimum DH load reduction is required to operate a condensing tail turbine. Since these plants are primarily operated during the winter season, a certain minimum DH demand will always remain. This creates the possibility of implementing a 50%-capacity CT turbine, which can accommodate a wider operating load range. As this operating range lies above the lower load limit of boilers, the cycle can retain its ability to operate in island-mode, decoupled from the district heating grid while maintaining flexibility during strong load fluctuations.
The initial turbine designs are optimized for even heat distribution at full load. A secondary design effort is made to further reduce the backpressure of the main turbine by employing an uneven distribution. Applying the uneven distribution for a full DH load capacity CT turbine would raise the backpressure excessively at close to full load, making it unsuitable for further consideration.

2.3. Heat Exchanger Modeling

2.3.1. District Heating Condensers

DH condenser performance strongly influences part-load behavior because of the large variations in steam flow during reductions in the DH load. The equations implemented for the DH condensers are based on empirical correlations that relate the overall heat transfer coefficient to the cooling-water mass flow and temperatures [22].

2.3.2. Condensing Tail Turbine Condenser

The CT turbine exhaust is cooled in an air-cooled condenser (ACC). This is selected due to CHP plants being placed inland, where large water sources can be scarce. Due to the absence of suitable empirical models, a model for the overall heat transfer coefficient is made based on the overall heat transfer coefficient formula, and:
  • Film-condensation correlations by Shah for the steam/water side are stated to work for both vertical and horizontal flows [23].
  • Cross-flow air-side correlations from the Holman’s heat-transfer handbook [24].
Testing the applicability of these models is done by estimating the Reynolds number of both the steam and air, using the available component information and properties of steam and air from steam cycle calculations. From industrial guidelines and recommendations, the tube diameter (25 mm) and inlet velocities (steam: 20 m/s, air: 5 m/s) can be found [25,26,27]. These resulted in the steam’s Reynolds number varying between ~30 and 2000, while air-side Reynolds numbers varied between 8000 and 9000, which is within the defined range of the models.
The overall heat transfer coefficient, neglecting tube material resistance, is calculated based on the following:
1 U = 1 α i + 1 α o
where U is the overall heat transfer coefficient and α the heat transfer coefficient, where subscript i is the inner tube side and o the outer tube side. The overall heat transfer coefficient can be expressed as a ratio with the design case (‘des’) overall heat transfer coefficient, as seen below.
U d e s U = 1 1 C + 1 · α o , d e s α o + 1 C + 1 · α i , d e s α i
where C is given as follows:
C = α i , d e s α o , d e s
C is a constant based on the design operating point, requiring tabulation. The ratio of the heat transfer coefficients, combined with the empirical models above, results in the final expressions of (4) and (5).
α o , des α o = m ˙ o , des m ˙ o 0.98 ρ i ρ i , des 0.38
α i , des α i = x x des · m ˙ i , des m ˙ i 0.8 · μ μ des 0.4 · C 1 , des C 1
where m is the mass flow rate, μ is the dynamic viscosity, x is the vapor fraction, ρ is the density, and C1 is an additional constant (and value) that is dependent on the inlet vapor fraction and pressure.
Cooling with ambient air will lead to wind-induced performance fluctuations. Due to modeling complexity and lack of reliable 1D correlations, these are excluded.
To sustain moisture levels within limits during part-load ACC operation, a variable speed fan is employed to sustain constant backpressure. This follows the principles demonstrated in previous ACC dynamic-control research by Yi Zhang et al. [28]. Moisture at the outlet should not exceed the moisture limitations, which are generally around 8–12% for optimum performance [29]. The maximum limit, however, is 15%.

2.3.3. Preheaters

The equations used for the closed-type preheaters are empirical, based on operational experience. They relate the part-load TTD (Terminal Temperature Difference) to its value at the design point. Validations of the preheaters have previously been made, but they are excluded, as deviations from their full-load behavior are insignificant for the present analysis.

2.3.4. Bypass Logic and CT Turbine Operation

The fraction of steam bypassed to the condensing tail turbine is determined by the DH load reduction. For a given DH load fraction (e.g., 60%), the remaining 40% reduction is distributed between the two DH condensers, using a weighting factor that determines how much reduction is applied to each condenser. The weighting factor formula is seen in (6)–(8).
Q ˙ r e d = Q ˙ D H , d e s 1 f r a c
Q ˙ D H C 1 = Q ˙ D H C 1 , d e s w e i g h t · Q ˙ r e d
Q ˙ D H C 2 = Q ˙ D H C 2 , d e s ( 1 w e i g h t ) · Q ˙ r e d
DHC denotes the district heating condenser, where index 1 refers to the lower-pressure condenser and index 2 to the higher pressure condenser. The variable frac represents the heat output to be achieved, which is expressed as a fraction of the total heat load (e.g., 60%). A higher weighting factor implies that a larger share of the DH load reduction is achieved by bypassing the lower-pressure DHC. In this case, the bypass valve of the lower-pressure DHC (V2) is relatively more open than the bypass valve of the higher-pressure DHC (V3).
Because the DHC and CT turbines operate simultaneously, two distinct throttling regimes occur, depending on the amount of bypassed steam.
  • Low bypass flows: CT pressure is below condenser pressure → throttling at CT inlet valves.
  • High bypass flows: CT pressure exceeds condenser pressure → throttling switches to condenser inlet valves and CT turbine sets the backpressure of the main turbine.
This is crucial for accurately reproducing CHP plant behavior.

2.4. Performance Indicators

Two of the performance indicators used in this study are the electric cycle efficiency, given as (9), and the utilization factor (EUF), given as (10).
η e l = P n e t Q ˙ i n
E U F = P n e t + Q ˙ D H Q ˙ i n

3. Validation

3.1. ACC Validation

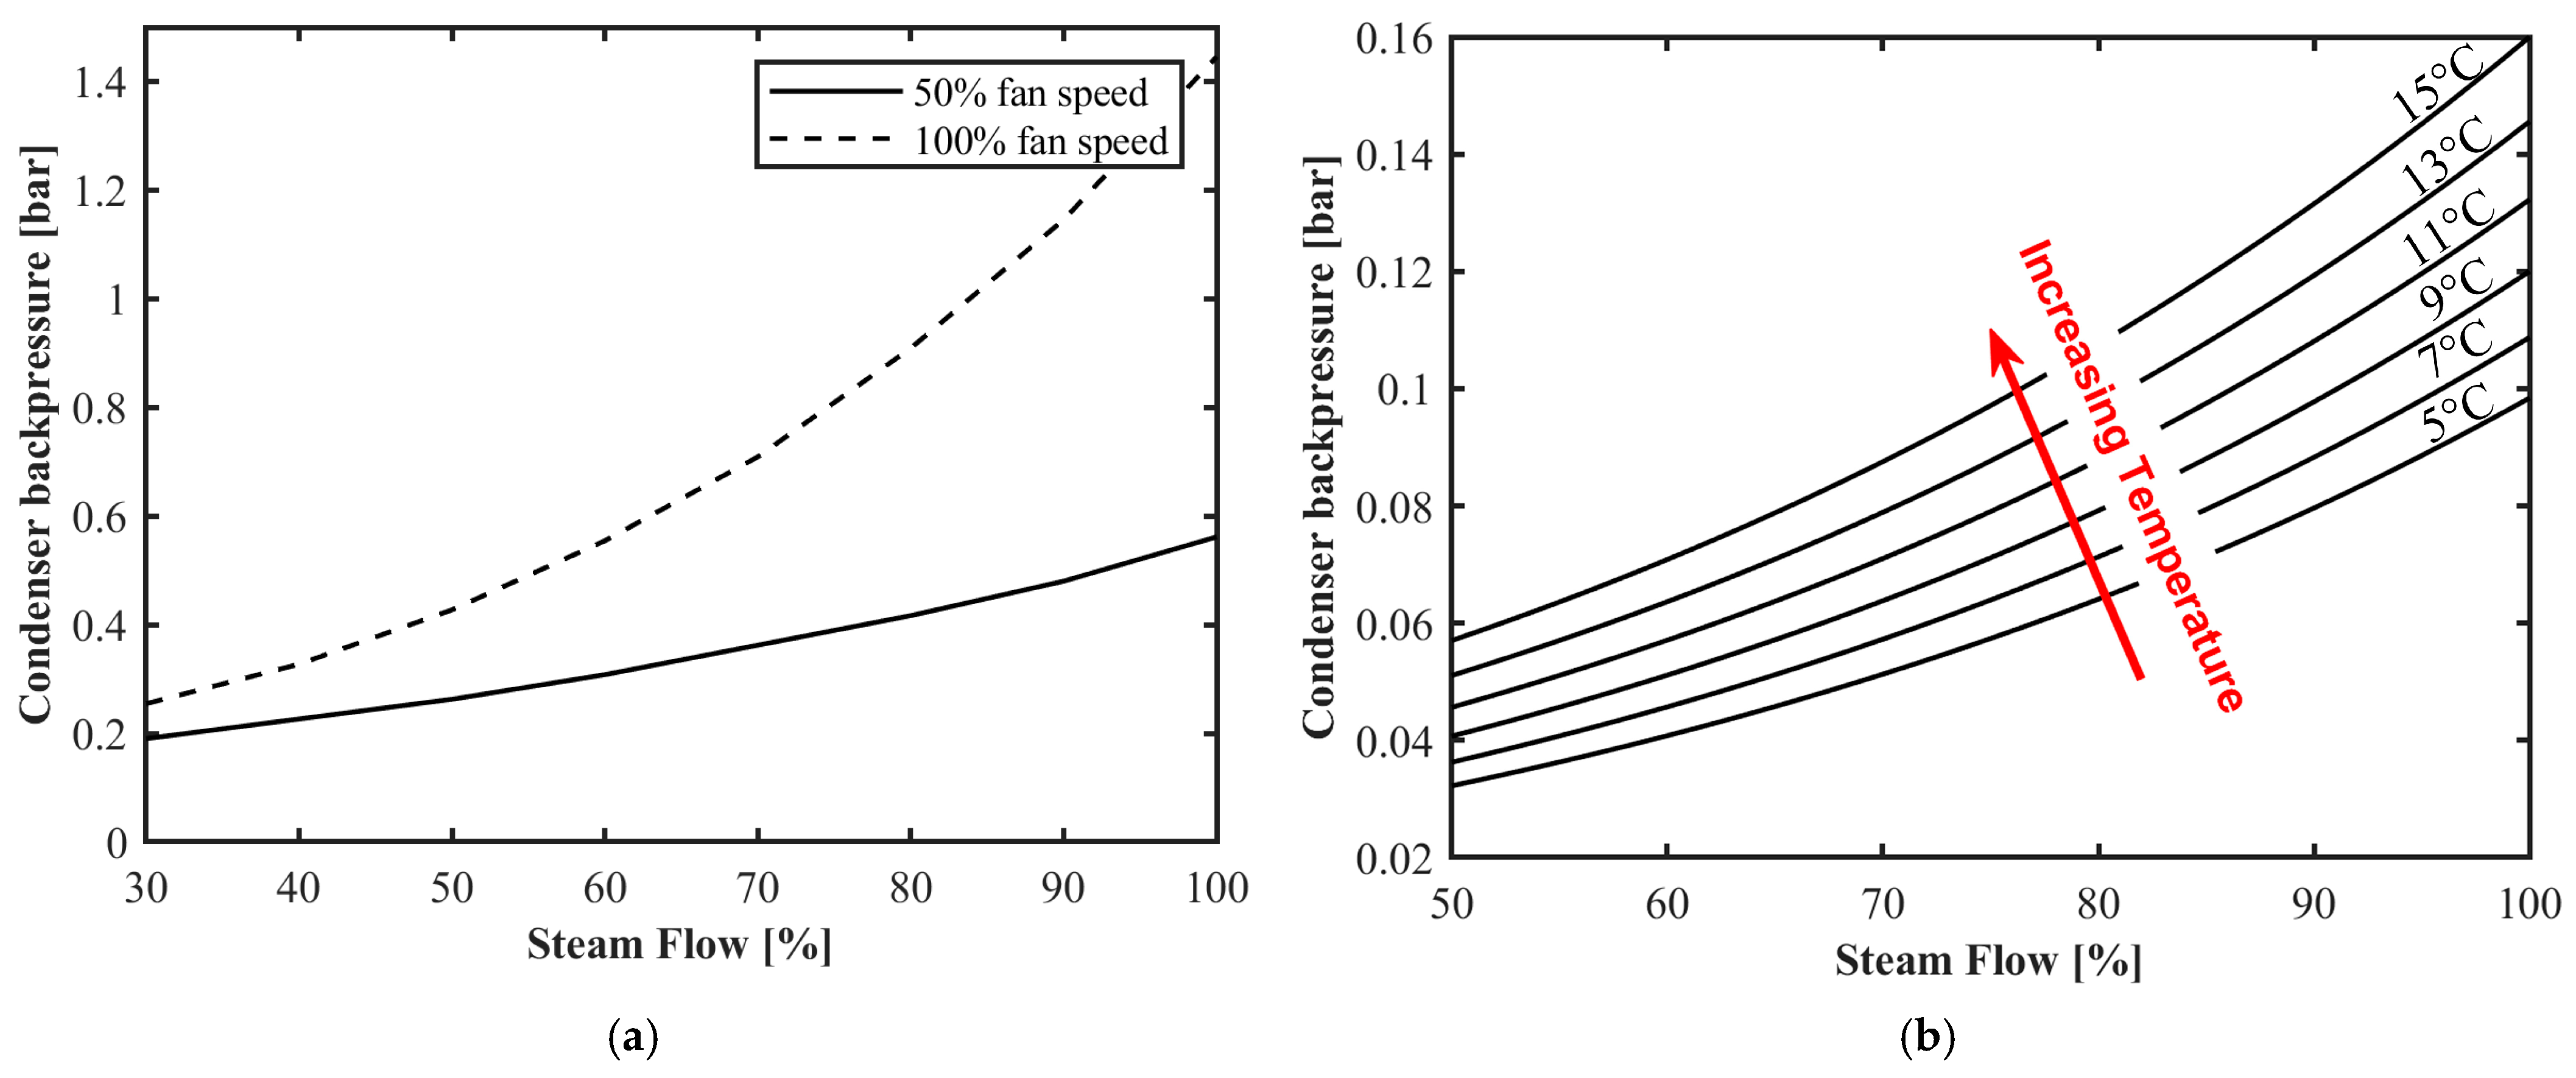
The part-load behavior of the ACC is validated against published data showing the dependence of the condenser pressure on an ambient temperature, steam flow, and fan speed. The resulting part-load model behavior is shown in Figure 3. The model exhibits good agreement with the reference curvers reported by S. Bracco et al. and Ghettini, Simone et al. [30,31].

3.2. Turbine and Condenser Validation

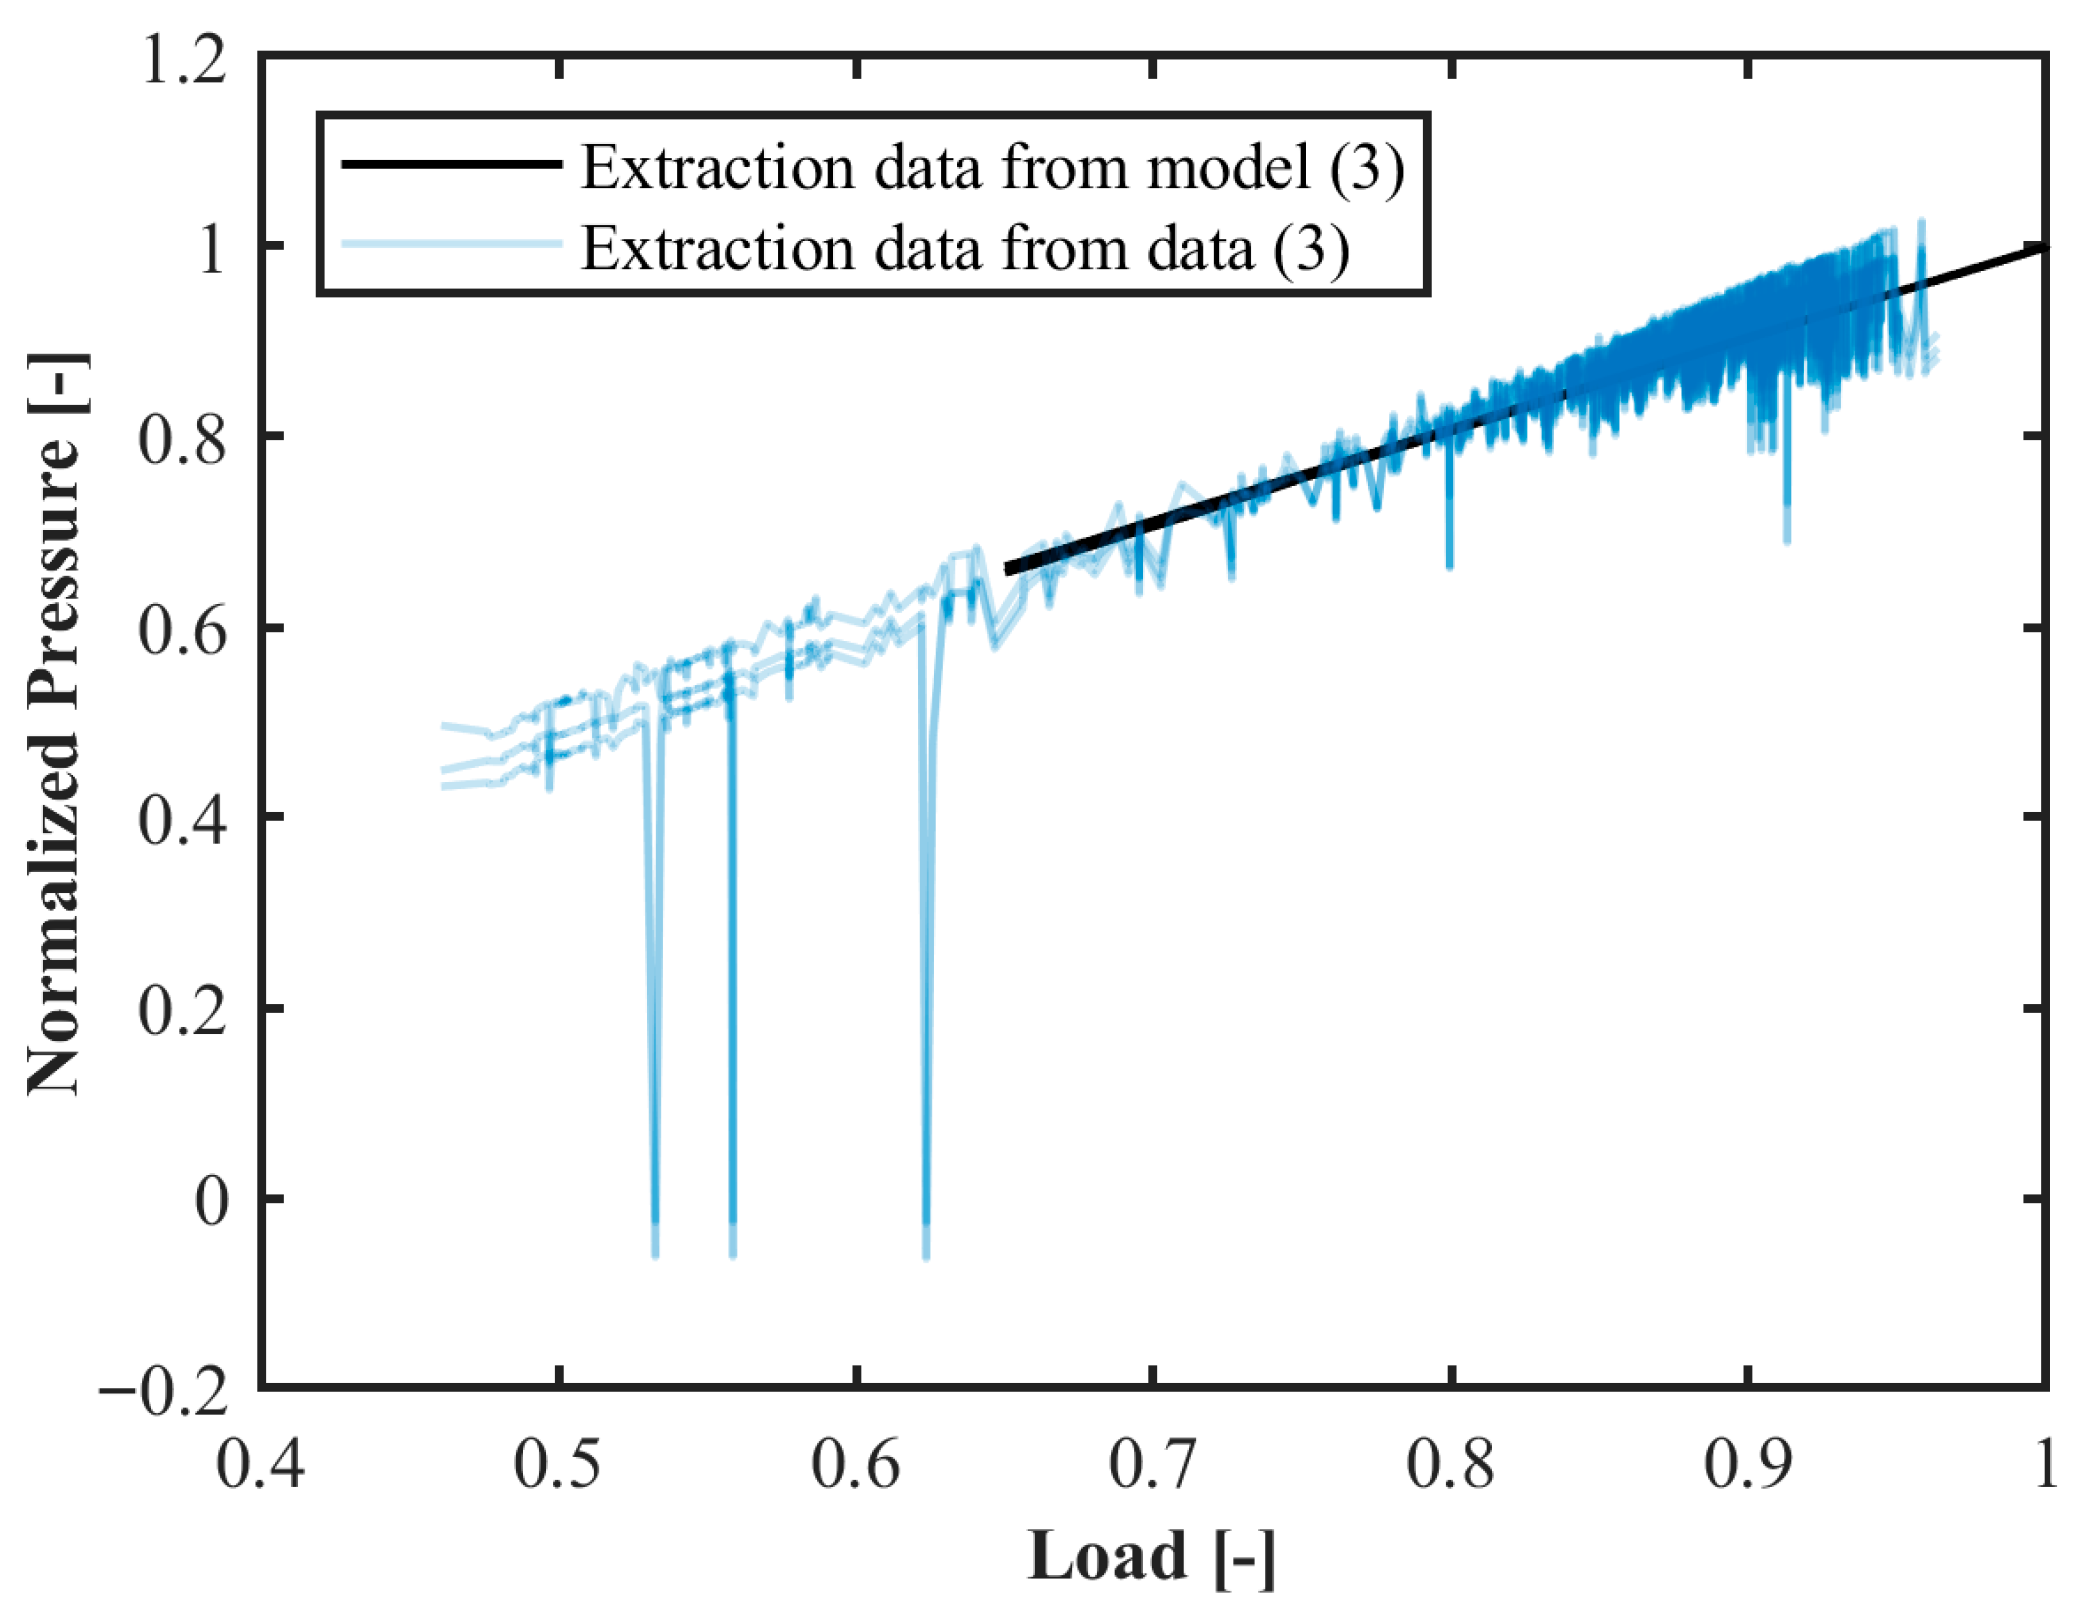
The turbine extraction pressures were normalized and compared with the fleet data. The comparison between the model results and power plant measurements is presented in Figure 4. The model reproduces the linear relationship between normalized extraction pressure and mass flow, which is consistent with the standard correlation reported in the literature (Equation (11)).
m ˙ i o = C T , i o p i 2 p o 2 p i v i
here, CT denotes the turbine constant, p is the pressure, and v the specific volume; the subscript i refers to the inlet, while o denotes the outlet.
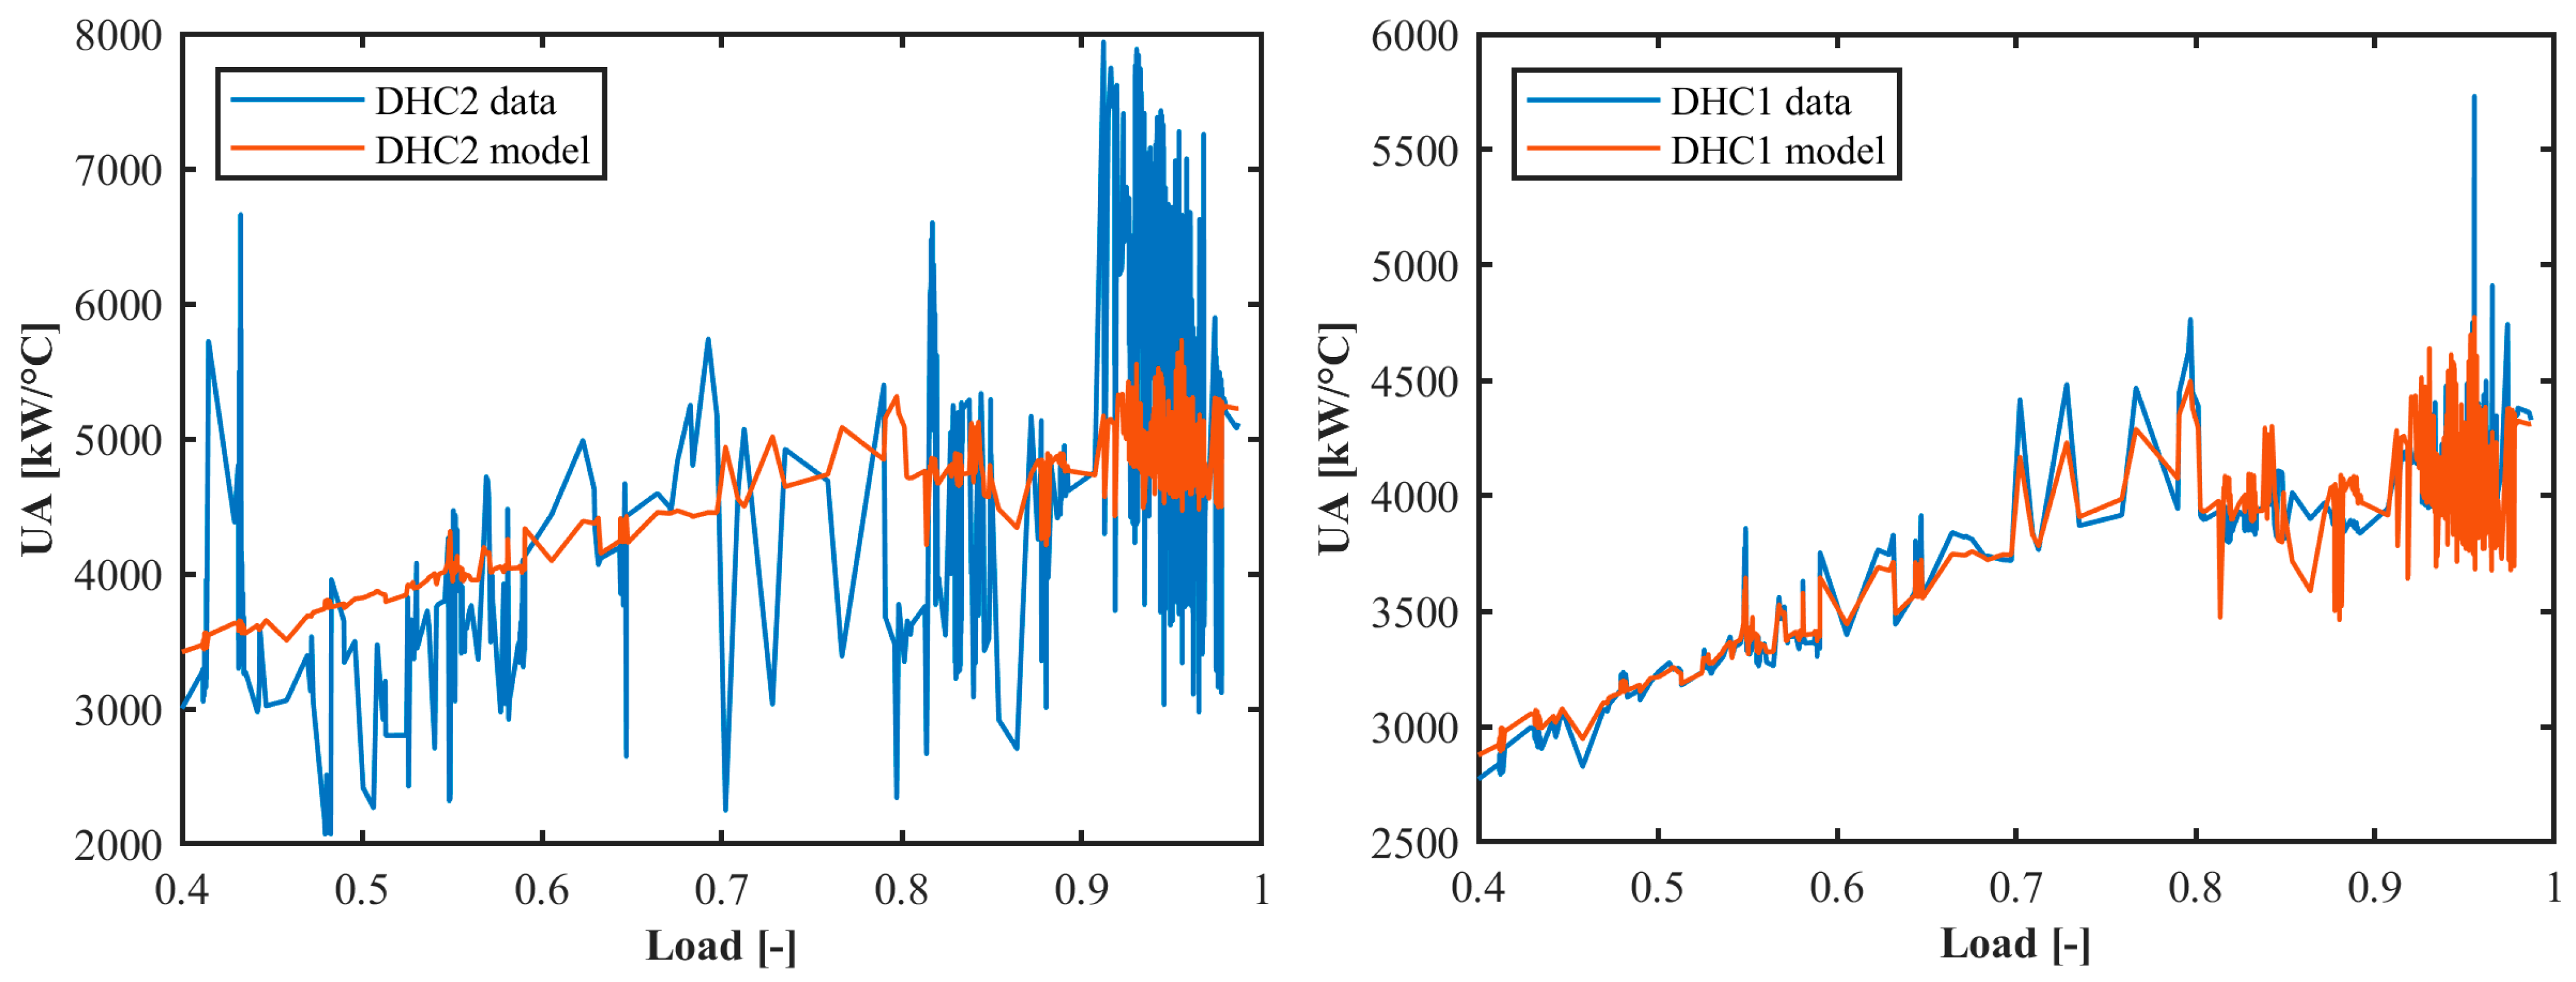
The overall heat-transfer coefficient of the DHC was compared with the measurement data. The results, presented in Figure 5, show the overall heat transfer coefficient, including the heat transfer area. The model reproduces the general trend observed in the CHP plant’s DH condensers. The observed spikes are caused by small temperature differences in the calculation of the LMTD, which may arise from measurement uncertainties or abrupt load changes. The agreement is particularly good for the lower-pressure DHC. The higher-pressure DHC shows larger deviations; however, the overall behavior and dominant trends are adequately captured.

3.3. Boundary Conditions

The boundary conditions are presented in Table 1, including the inlet steam conditions (≈140 bar, 540 °C), total mass flow (≈40 kg/s), HP LP crossover pressure (8 bar), and thermal parameters such as terminal temperature differences and condenser subcooling values.

4. Assumptions and Limitations

For the full-load condensing tail turbine, the DH load is varied between 50% and 90%. Operation at lower loads results in convergence difficulties in the through-flow solver, which is primarily caused by exponential loss behavior related to turn-up and incidence.
At part-load, the incidence downstream of the nozzles changes significantly, leading to increased profile and secondary loss. Imposing a fixed outlet pressure to limit the moisture content at part-load reduces the pressure ratios across downstream stages, which may ultimately lead to turn-up conditions. The combined effect of these phenomena introduces an operational limit in the turbine calculations, beyond which computed efficiency becomes negative. Because the gains associated with varying the weighting factor are small, increasing the inaccuracy solution may result in incorrect conclusions. In contrast, at high bypass fractions, the ability to vary the weighting factor is limited, resulting in isolated operating points that are not considered further.
Condenser cooling of the CT turbine outlet steam, provided by ambient air, is subject to wind-induced performance fluctuations. Due to the modeling complexity and lack of reliable 1D correlations, these effects are excluded from the present analysis. When the condenser pressure is set, a sensitivity analysis of the air-cooled condenser will primarily affect the fan power, which is not considered here as it was relatively small. For cases with unconstrained backpressure and constant fan speed, wind-induced variations lead to momentary changes in heat transfer, influencing the outlet properties of the CT turbine. If these transient effects cause the outlet properties to exceed the operational limits, the operating range of the CT turbines will consequently be reduced.
The pump efficiencies are assumed to be constant at 70% throughout all simulations. The pumps most affected by part-load DH condenser operation are the condenser pump after the lower-pressure DHC and the pump after the ACC. The remaining pumps operate close to their design point, with negligible change in their operation. The pressure ratio of the two pumps is approximately two, resulting in a relatively insignificant contribution to the overall plant power consumption.

5. Results and Discussion

The section presents the results of the thermodynamic simulations, focusing on the influence of the bypass fraction, weighting factor, and turbine configuration on the overall cycle performance. The analysis evaluates power, electric cycle efficiency (9), EUF (10), and turbine stage behavior to identify the operating conditions that maximize the benefit of the CT turbine. Results are presented for both the full-load CT turbine and the 50%-capacity CT turbine.

5.1. Full-Load Condensing Tail Turbine

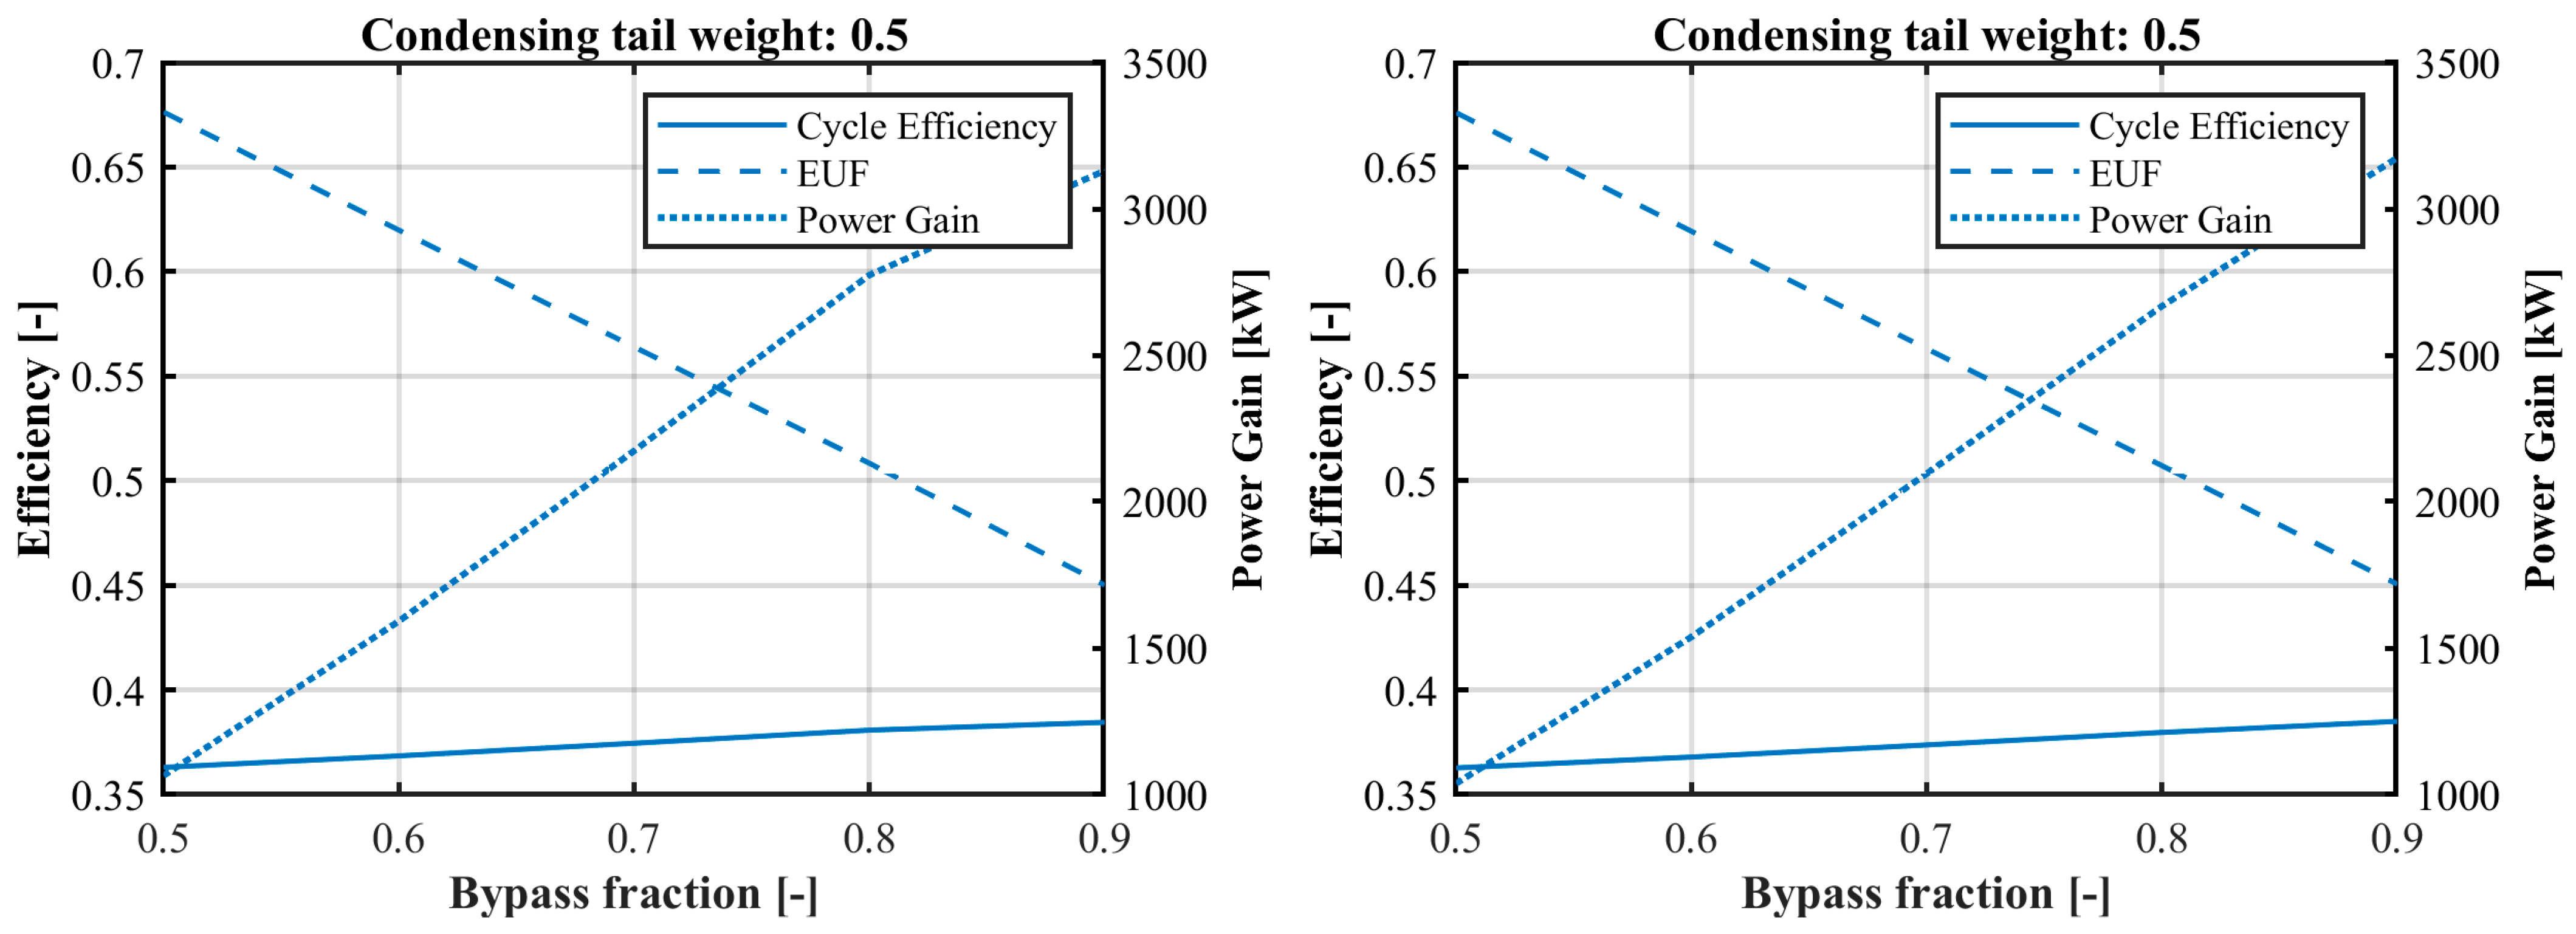
The total power and efficiencies for both the single-flow and double-flow CT turbine are presented in Figure 6. For the single-flow CT turbine, a bypass fraction of 0.9 results in an increase in the power output of 3130 kW with an EUF of 45.0%, compared to values exceeding 90% for a full DH load. The corresponding values for the double-flow CT turbine are 3174 kW and an EUF of 45.0%, respectively.

5.1.1. Variation in Weighting Factor

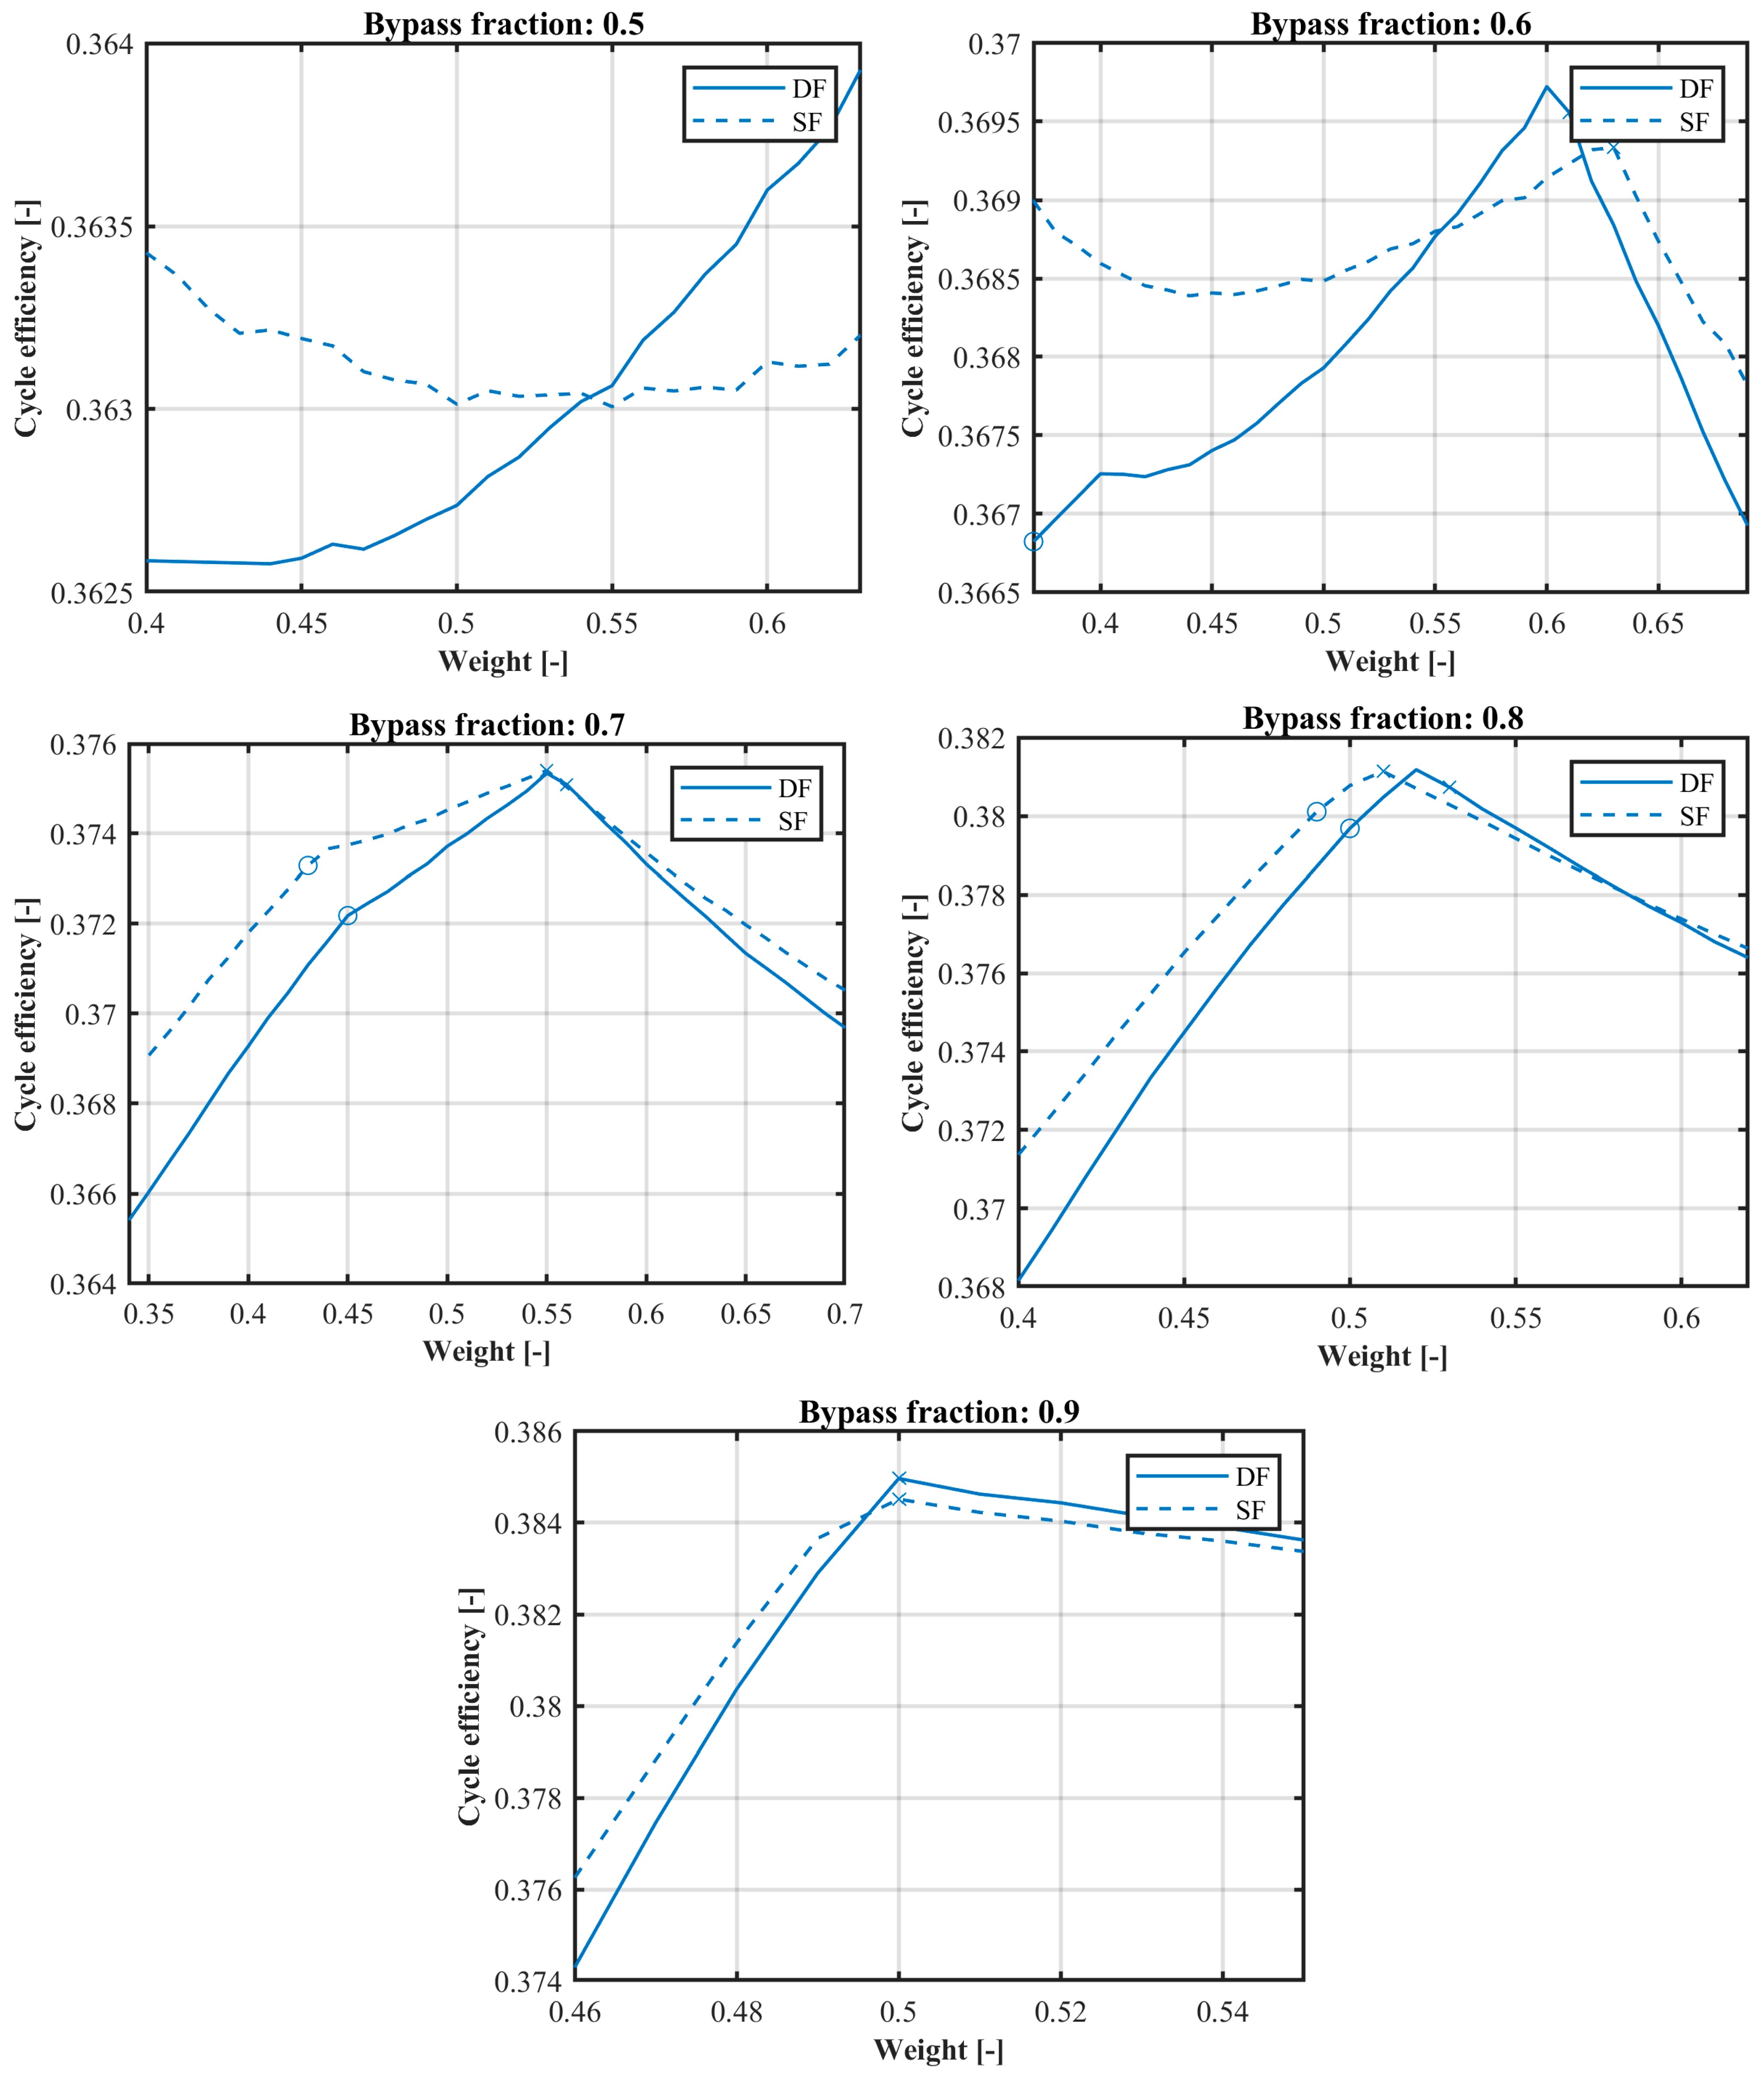
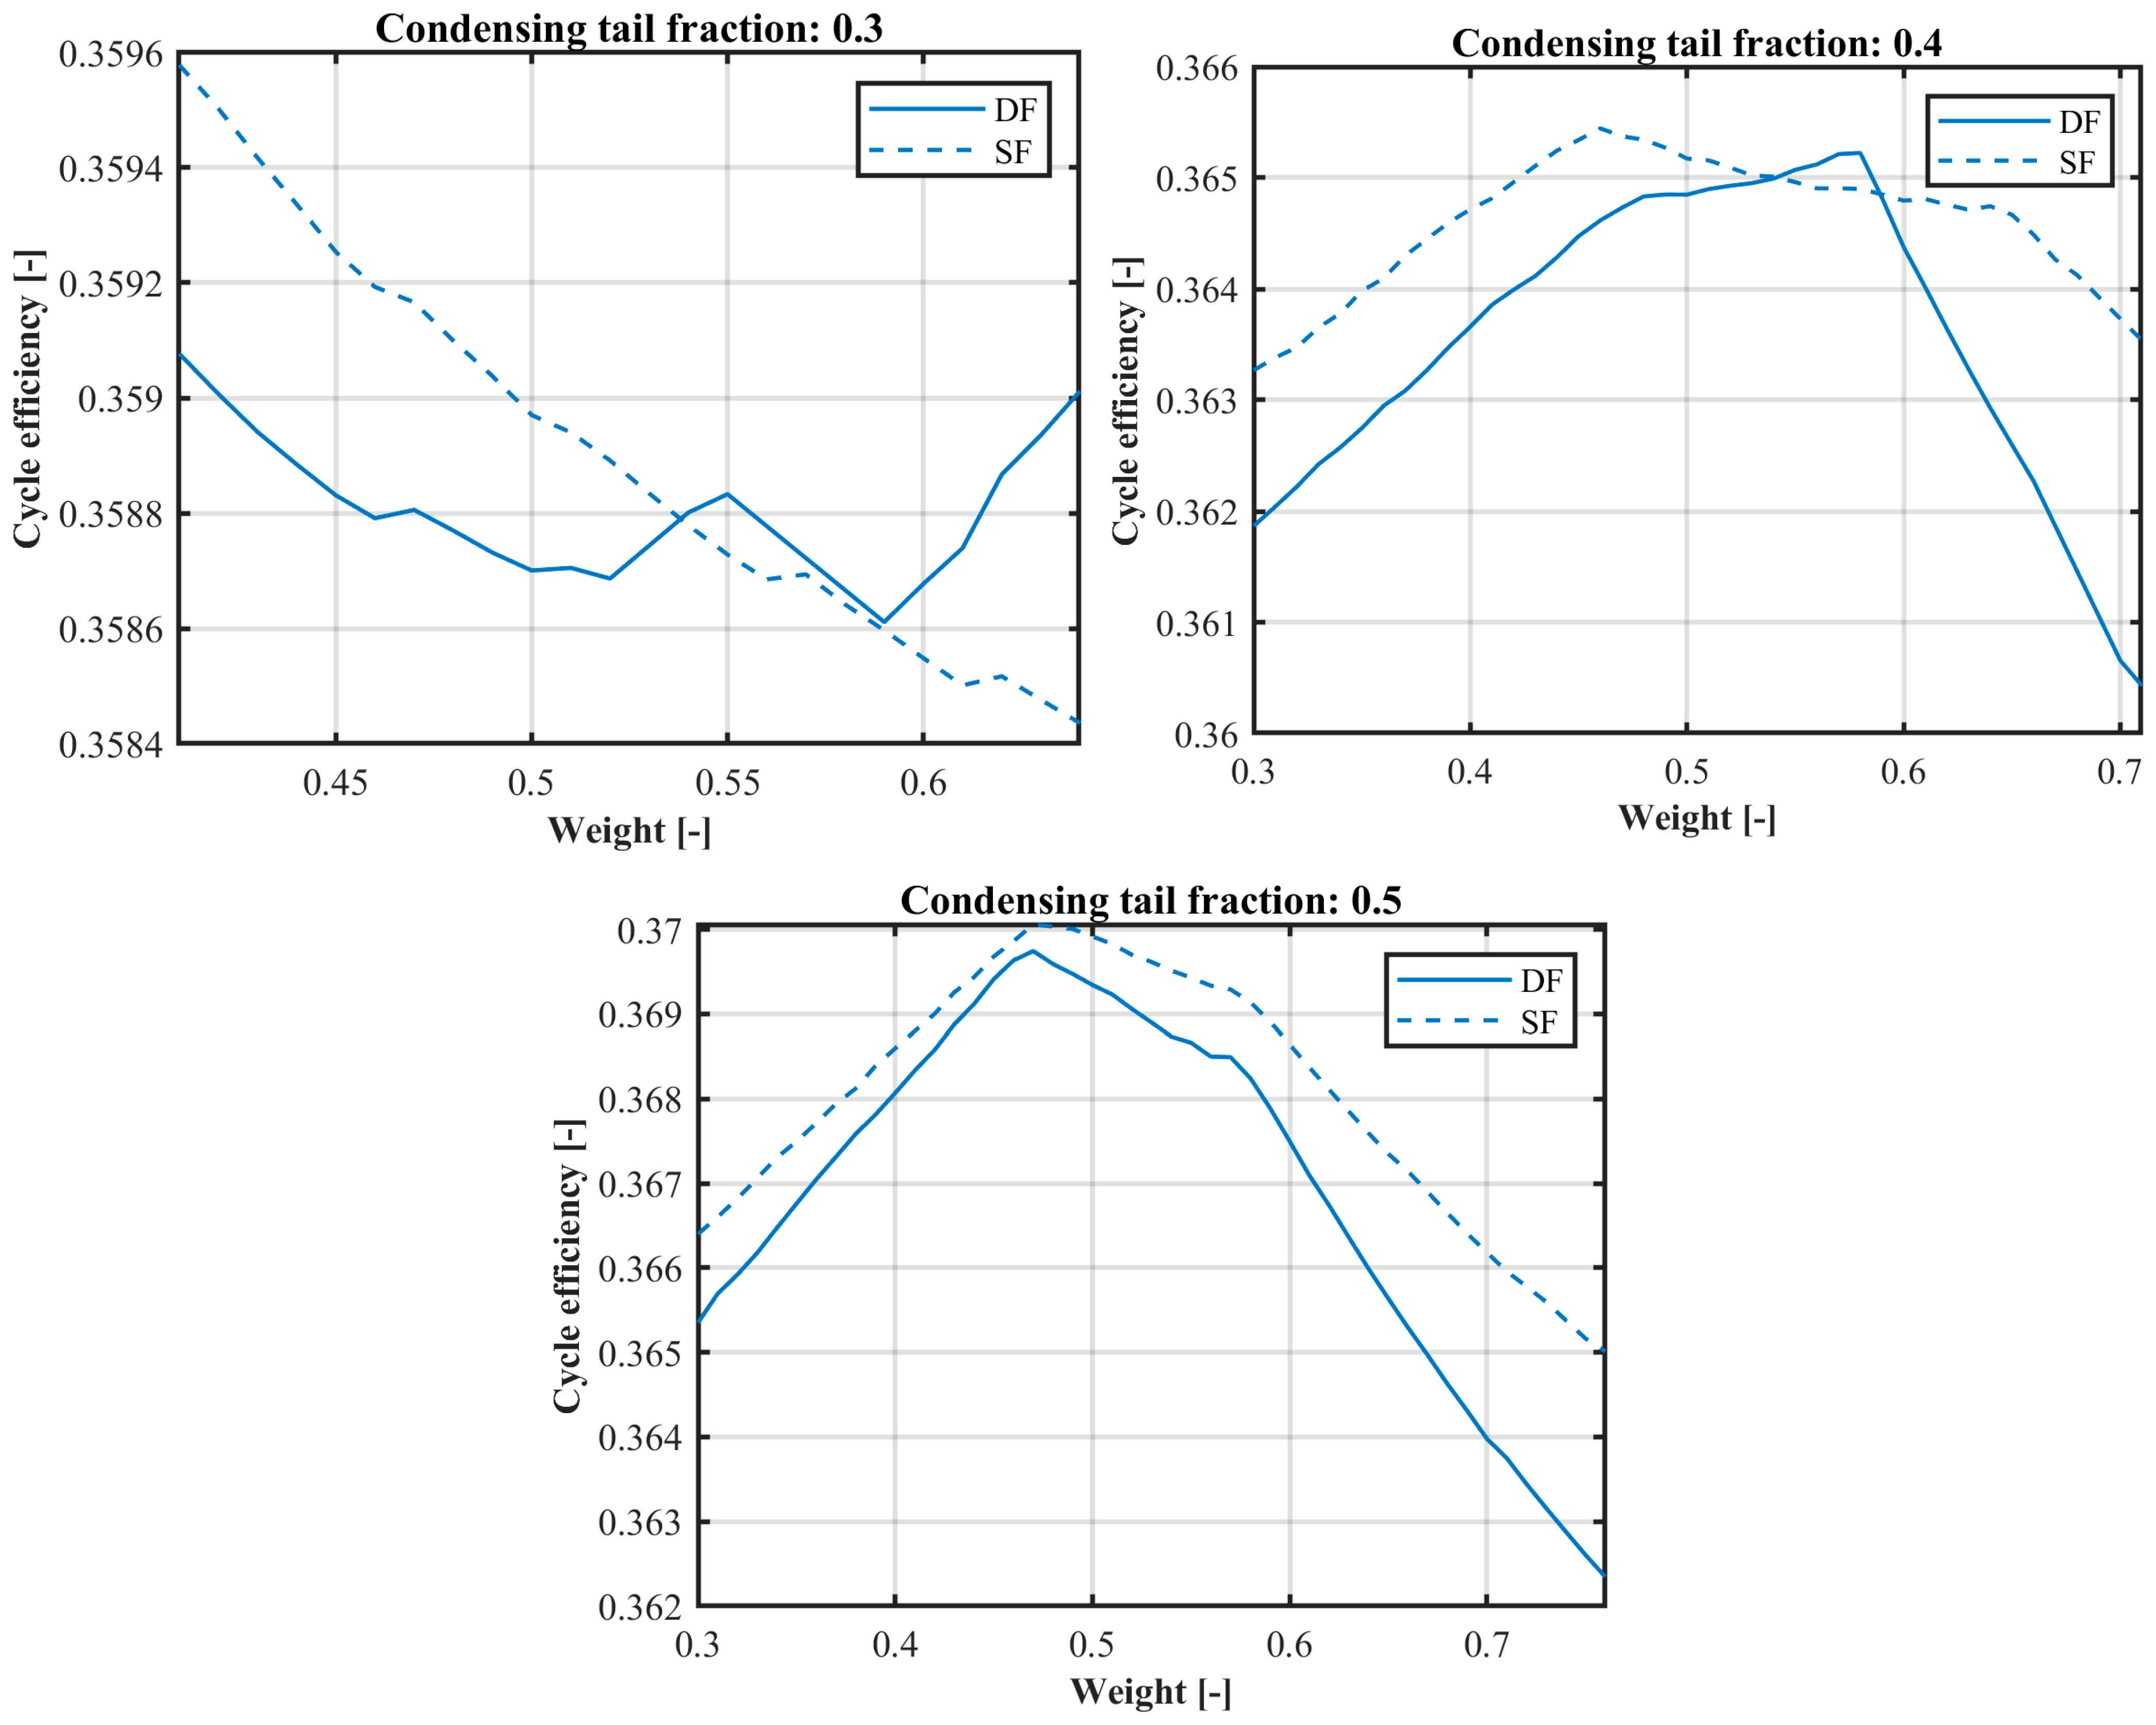
Varying the weighting factor for different bypass fractions resulted in Figure 7. At a bypass fraction of 0.5, an increase in the electric cycle efficiency is observed on both sides of the minimum efficiency point. When the bypass fraction increases to 0.6, a distinct efficiency peak appears for both the single- and double-flow CT turbines, occurring at weighting factors of approximately 0.56 and 0.64, respectively. At higher bypass fractions, the peak becomes more pronounced and occurs at weighting factors that gradually shift toward a more even heat-load distribution.
Despite the higher electric cycle efficiency at low bypass fractions, low weighting fractions are not recommended due to the increased risk of exceeding backpressure limitations, which restricts the achievable reduction in the district heating load.

5.1.2. Comparison of Single- and Double-Flow CT Turbines

At a bypass fraction and weighting factor of 0.5, the single-flow configuration exhibits an electric cycle efficiency that is 0.0276%-points higher than the double-flow case. This corresponded to a marginal increase of 26.73 kW in power output. At the same weighting factor but at a bypass fraction of 0.9, the difference increases to 0.0451%-points and 43.76 kW in favor of the double-flow turbine.
Depending on the weighting factor, either turbine configuration may outperform the other. At higher CT loads and weighting factors above 0.5, the double-flow turbine shows a marginal performance advantage. In contrast, at lower weighting factors, the single-flow configuration performs better at both high and low CT loads. A comparison of the performance gains is presented in Table 2.
From the figures and tables presented, the double-flow turbine demonstrates higher efficiency and power output at a low CT load operation, while also exhibiting the greatest sensitivity in variations in weighting factor.
The double-flow turbine requires four sets of stages, which increases the manufacturing complexity and costs. However, due to the shorter final stages of the double-flow CT turbine, it is difficult to determine whether the overall manufacturing cost would clearly exceed that of the single-flow configuration. Further optimization of the design point is possible, to optimize the design point further with an additional stage at the cost of a reduced load range.
In all cases, the pressure of the higher-pressure DHC remains approximately constant to maintain the forward temperature, leading to nearly constant extraction pressure during CT turbine throttling. The moisture content in the simulated cases increased from 0.120 to 0.141. This range remains within the lower erosion limit.

5.1.3. Single- and Double-Flow CT Turbine Optimization Gains

At peak efficiency, the gain of the double-flow turbine is approximately equal to that of the single-flow configuration at a bypass fraction of 0.7. For a bypass fraction of 0.8, the peak difference remains marginal, although it occurs for different values of weighting factors (single flow: 0.51, double flow: 0.52). At a bypass fraction of 0.9, both configurations reach their efficiency peaks at a weighting factor of 0.5.
For the single-flow turbine, changing the control strategy from a weighting factor of 0.5 to the optimal value yields additional gains in the electric cycle efficiency of 0.068%-points, 0.085%-points, 0.088%-points, 0.036%-points and 0%-points for the bypass fractions ranging from 0.5 to 0.9. These efficiency improvements correspond to increases in power output of 65.53 kW, 82.29 kW, 84.87 kW, 34.96 kW and 0 kW in power. At a bypass fraction of 0.5, higher weighting factors are selected to minimize control complexity.
For the double-flow turbine, the peak gains in the electric cycle efficiency, relative to the even heat-load distribution are 0.119%-points, 0.179%-points, 0.162%-points, 0.150%-points and 0% for bypass fractions from 0.5 to 0.9. These correspond to increases in the power output of 136.2 kW, 173.5 kW, 157.0 kW, 145.0 kW and 0 kW.

5.1.4. Thermodynamic Mechanisms Behind Bypass-Induced Gains

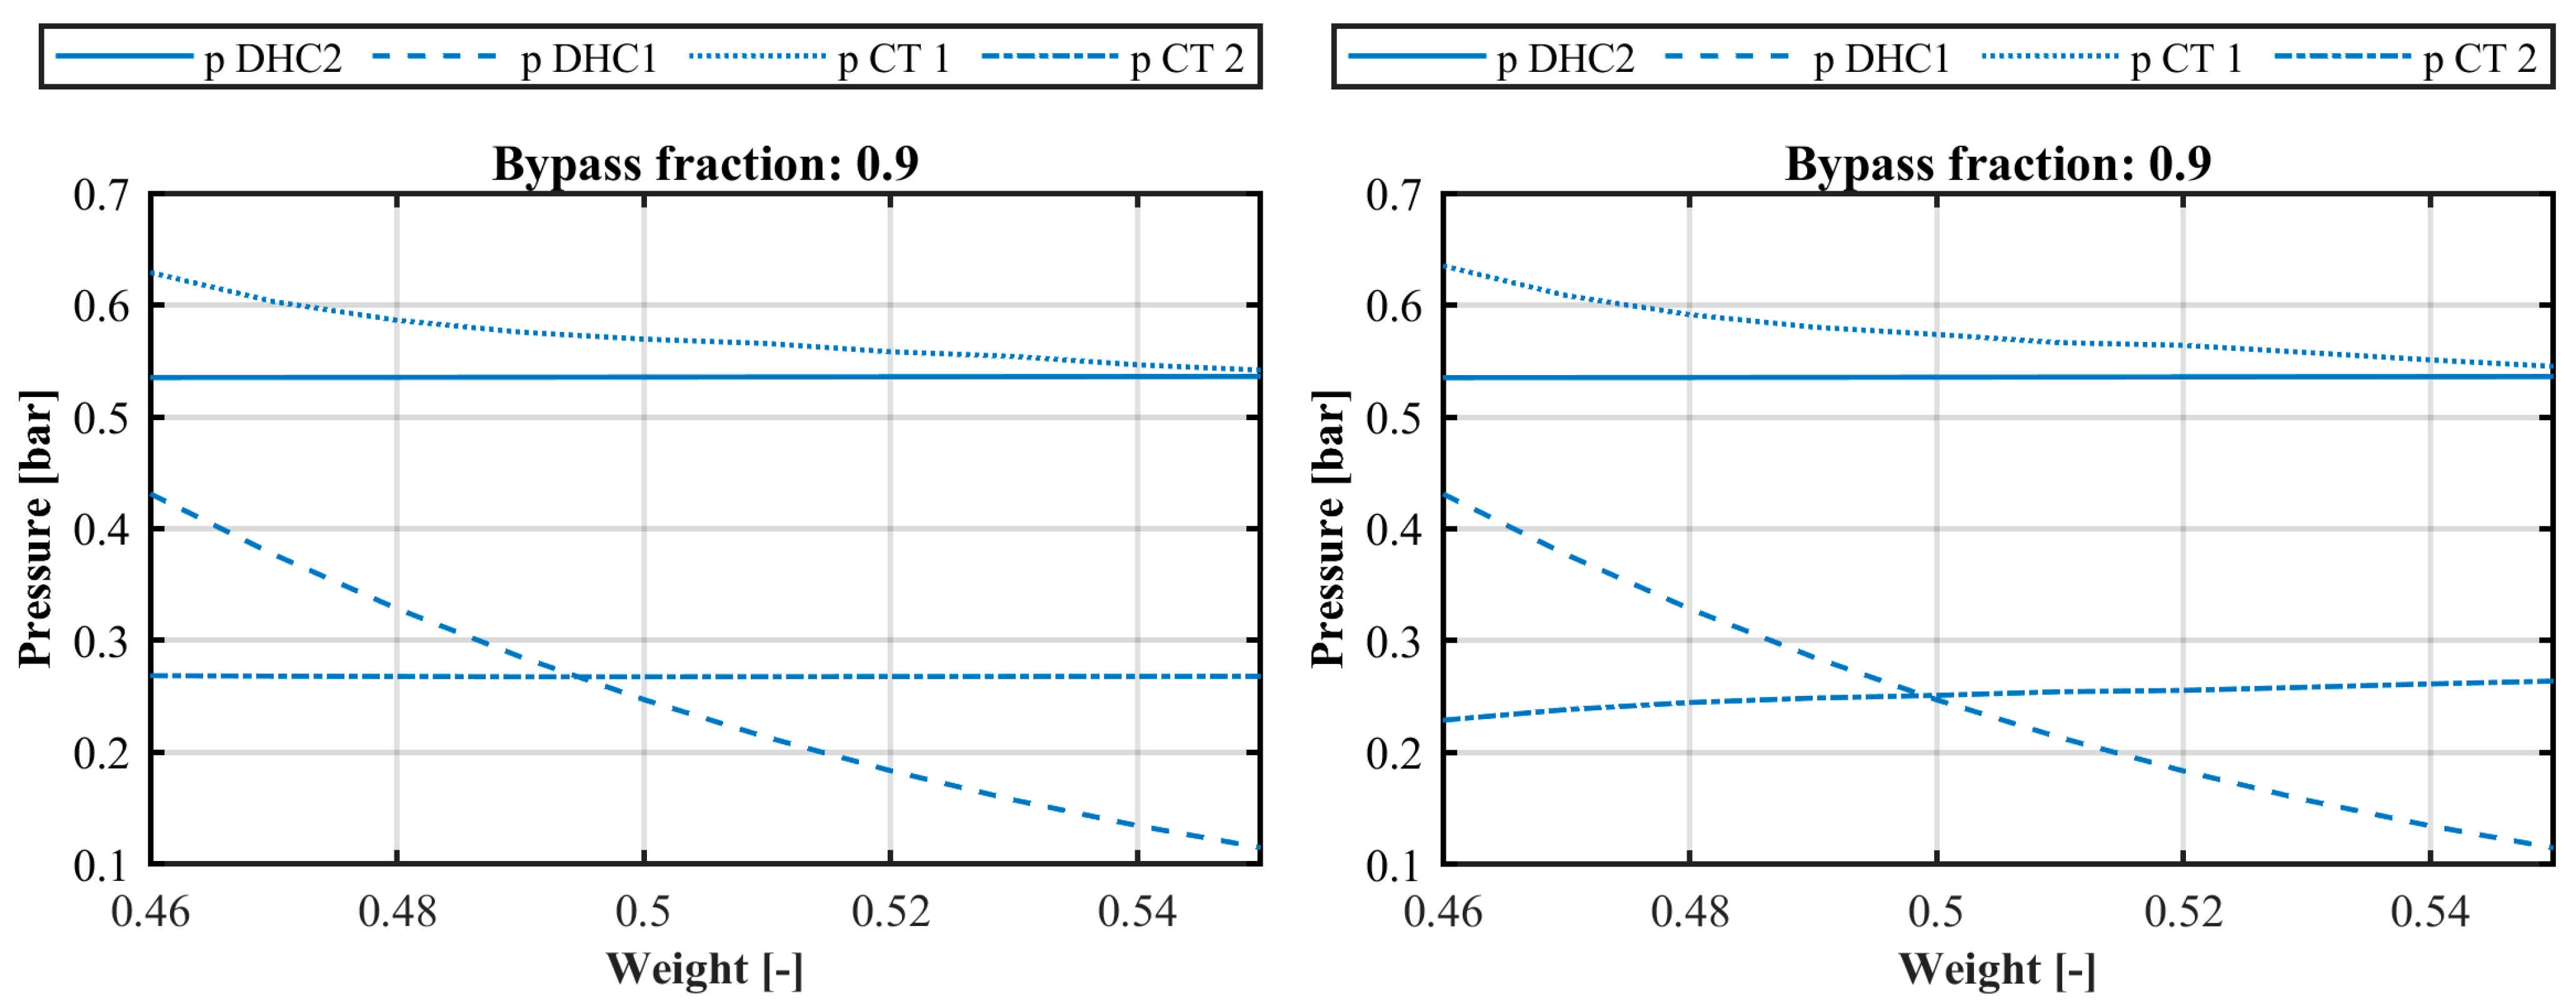
The appearance of the electric cycle efficiency is the resulting balance of turbine efficiencies, pressure ratios and throttling losses. Throttling losses can be interpreted as the pressure difference between the DHC and corresponding CT turbine in Figure 8.
At a given bypass fraction, the single-flow CT turbine operates with a constant mass flow downstream of the lower-pressure DHC injection. A constant mass flow leads to a nearly constant pressure and pressure ratio, resulting in an almost constant turbine efficiency. Under these conditions, variations in the weighting factor primarily affect the last stage of the main turbine and the first section of the CT turbine. Reducing the weighting factor increases the mass flow from the higher-pressure DHC, thereby raising the upstream pressure of the CT turbine and increasing its efficiency while reducing the throttling losses at the DHC2 bypass valve.
Shifting the heat-load toward DHC1 increases the backpressure of the main turbine. This back pressure increase reduces the efficiency of the last stage of the main turbine and increases the throttling losses of the DHC1 bypass valve. At low bypass fractions (0.5 and 0.6), the gain associated with the increased pressure ratio and improved efficiency of the first CT turbine section outweighs the losses caused by increased backpressure and throttling. This balance results in the upward trend observed on the left-hand side of the figures. At a bypass fraction of 0.6, the gain is initially insufficient to compensate for these losses. However, beyond a certain point, it becomes temporarily dominant, leading to the formation of small efficiency peaks.
The increase in electric cycle efficiency at higher weighting factors and a low bypass fraction stems from the improved turbine efficiency and pressure ratio of the last stage of the main turbine. The increased pressure ratio is a consequence of the heat-load being offset towards DHC2, which reduces the steam flow bypassing it and the DHC1 pressure. The gains associated with the improved performance of the main turbine outweigh the losses caused by the reduced pressure ratio and lower efficiency in the first section of the CT turbine. This balance will lead to the formation of efficiency peaks at bypass fractions above 0.6. Once the main turbine backpressure is fixed by the CT turbine, the source of the efficiency gain is removed, leaving increasing losses with further changes in the weighting factor.
In contrast to the single-flow CT turbine, variations in the weighting factor affect both expansion paths in the double-flow configuration. Higher weighting factors improve the performance of the first CT turbine section, while lower weighting factors benefit the second section. As in the single-flow case, higher weighting factors reduce the backpressure of the main turbine until it becomes fixed, which is a behavior that is also shown in Figure 8. The double-flow turbine therefore allows for a balance to be achieved in which each side of the weighting factor spectrum favors a different section of the CT turbine, with both simultaneously influencing the main turbine performance.
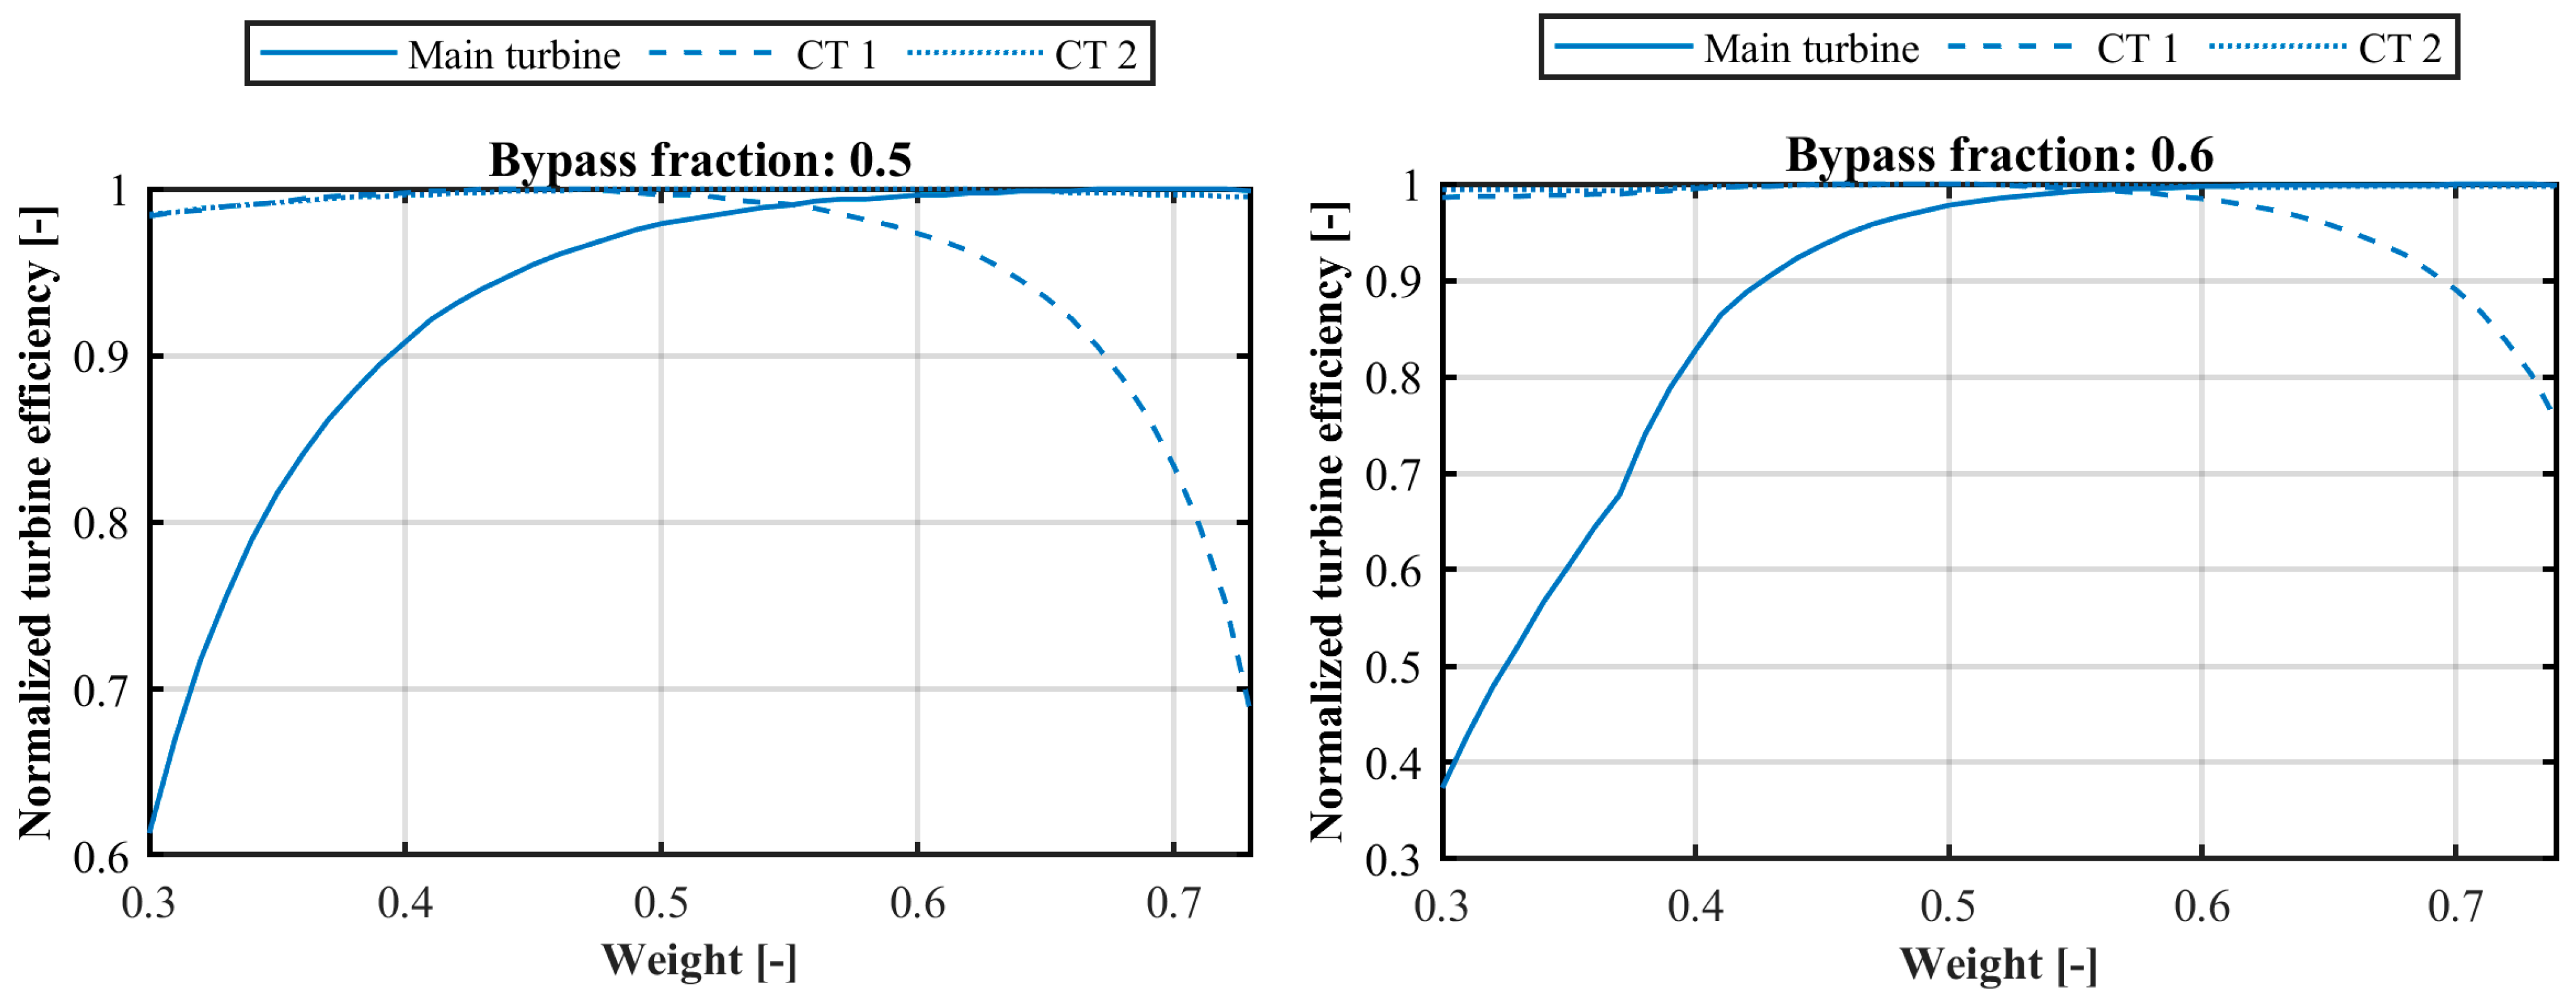
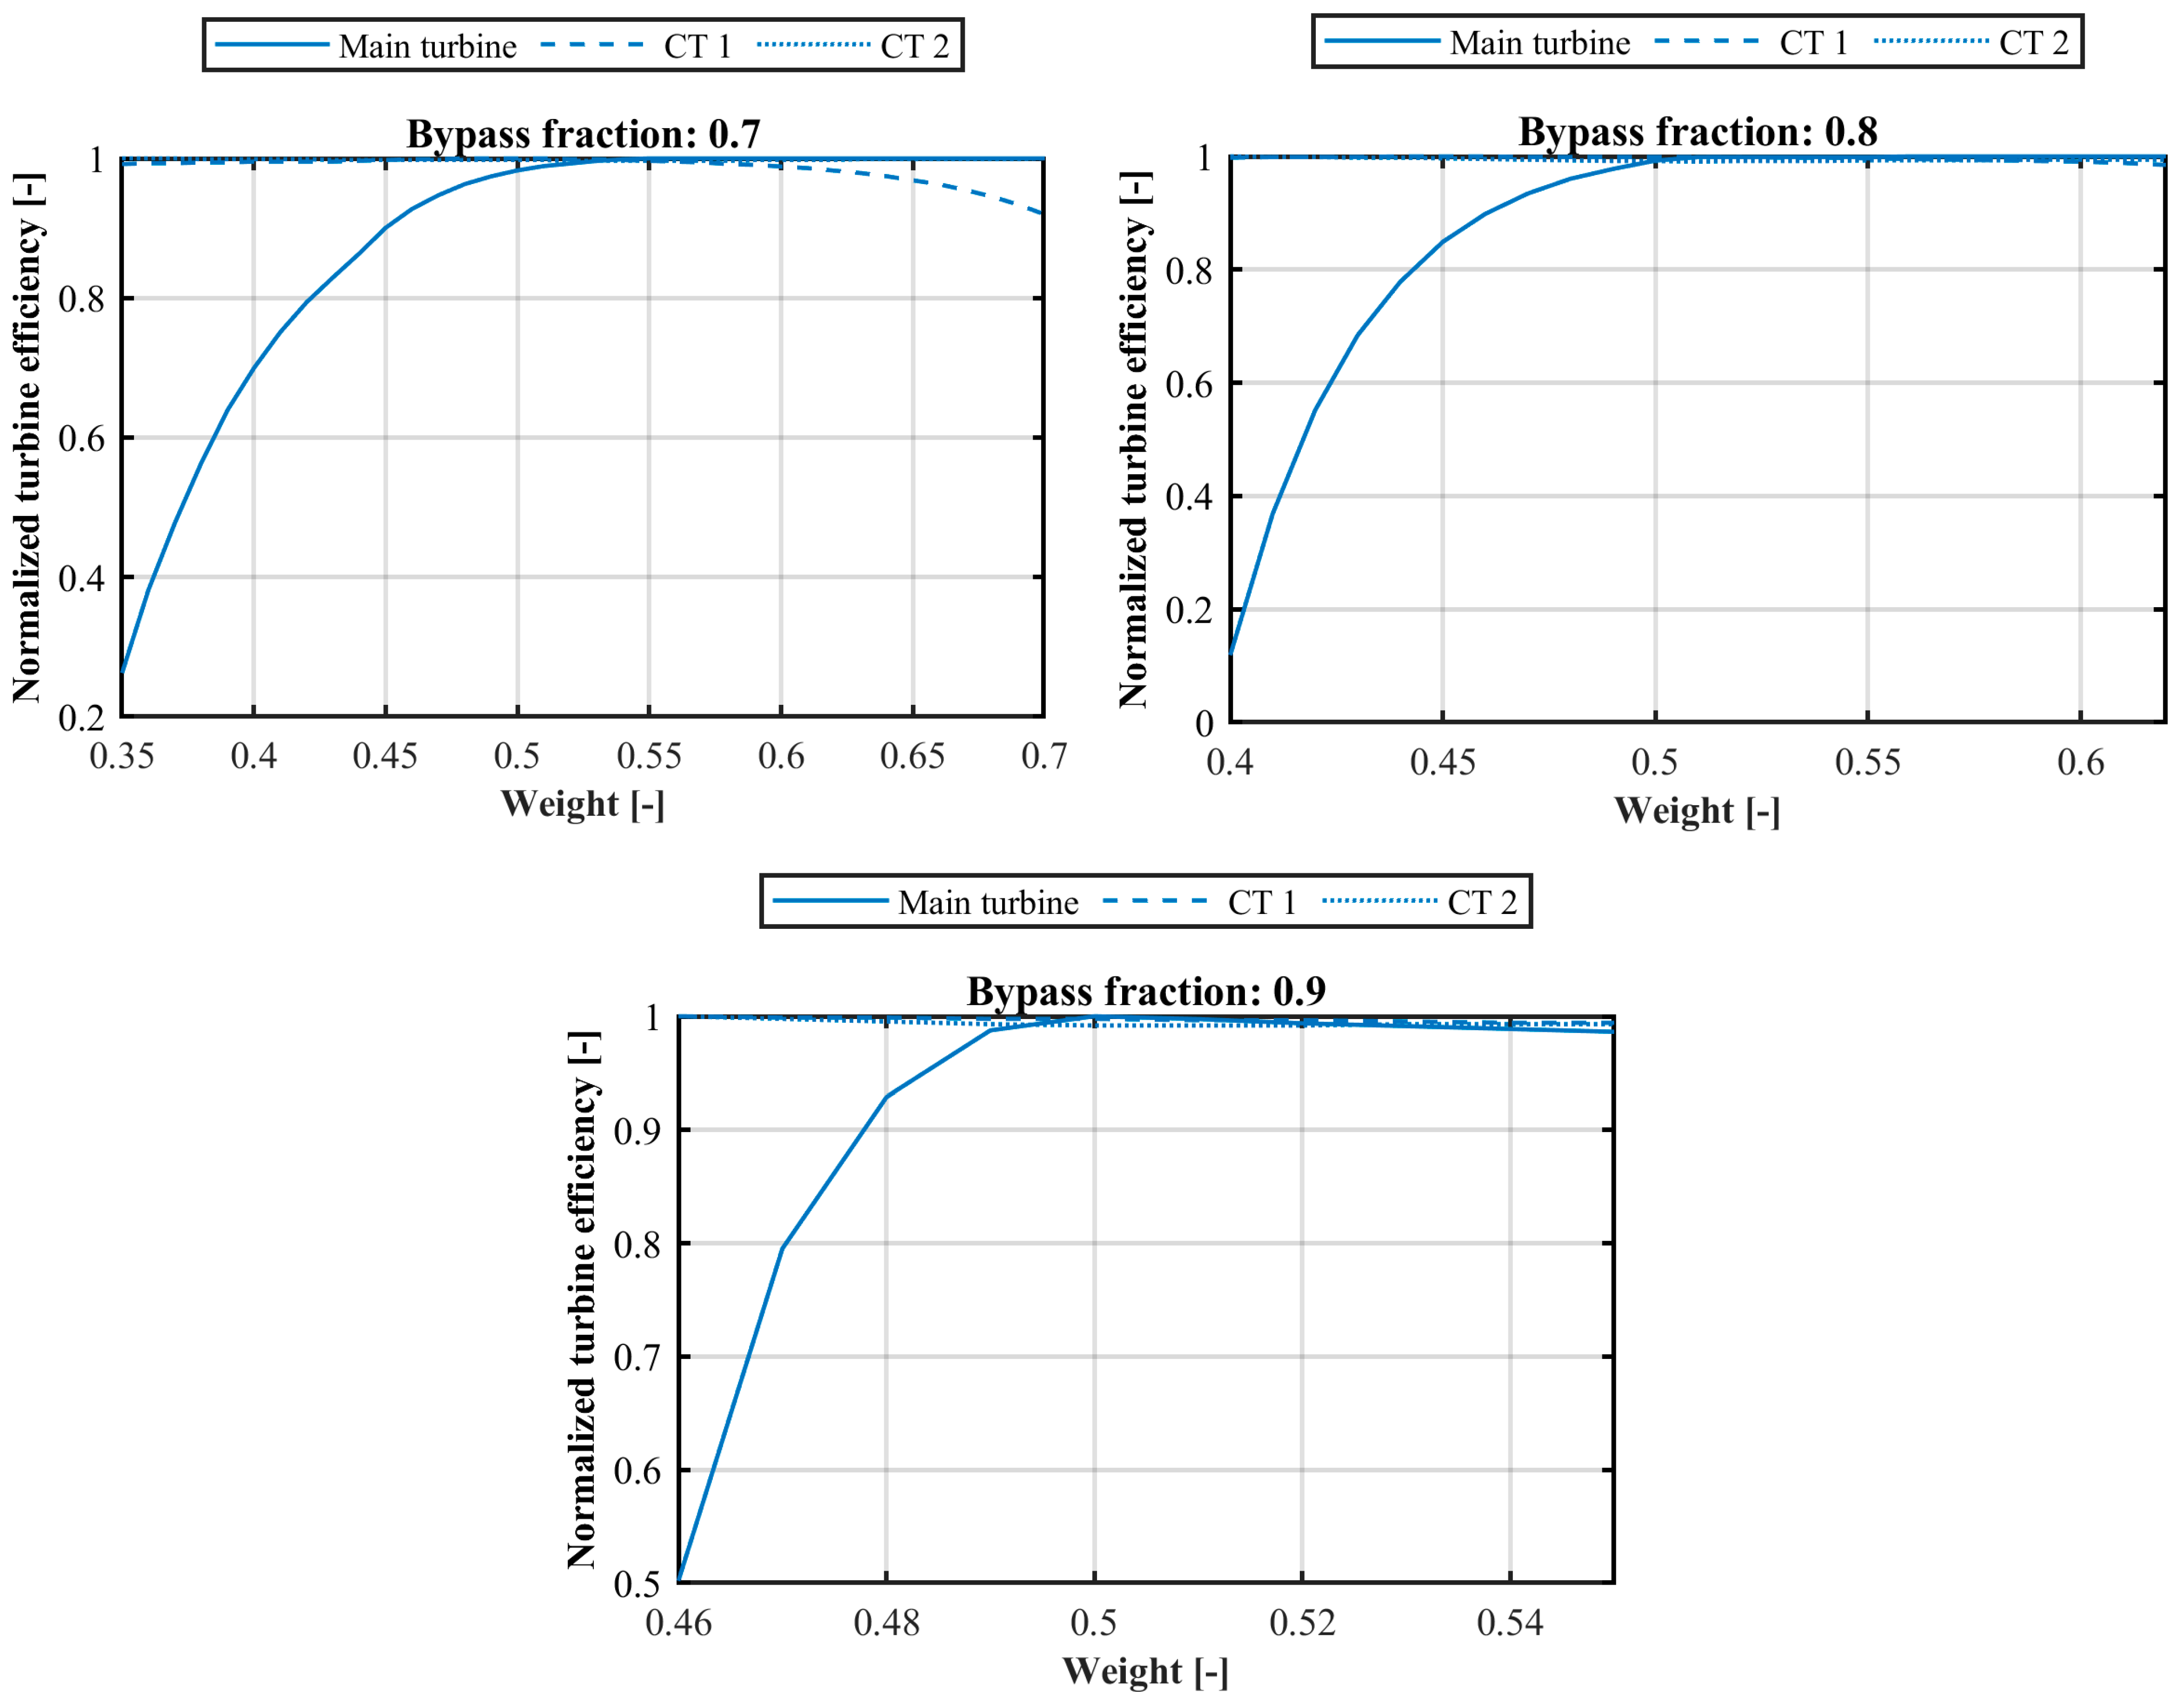
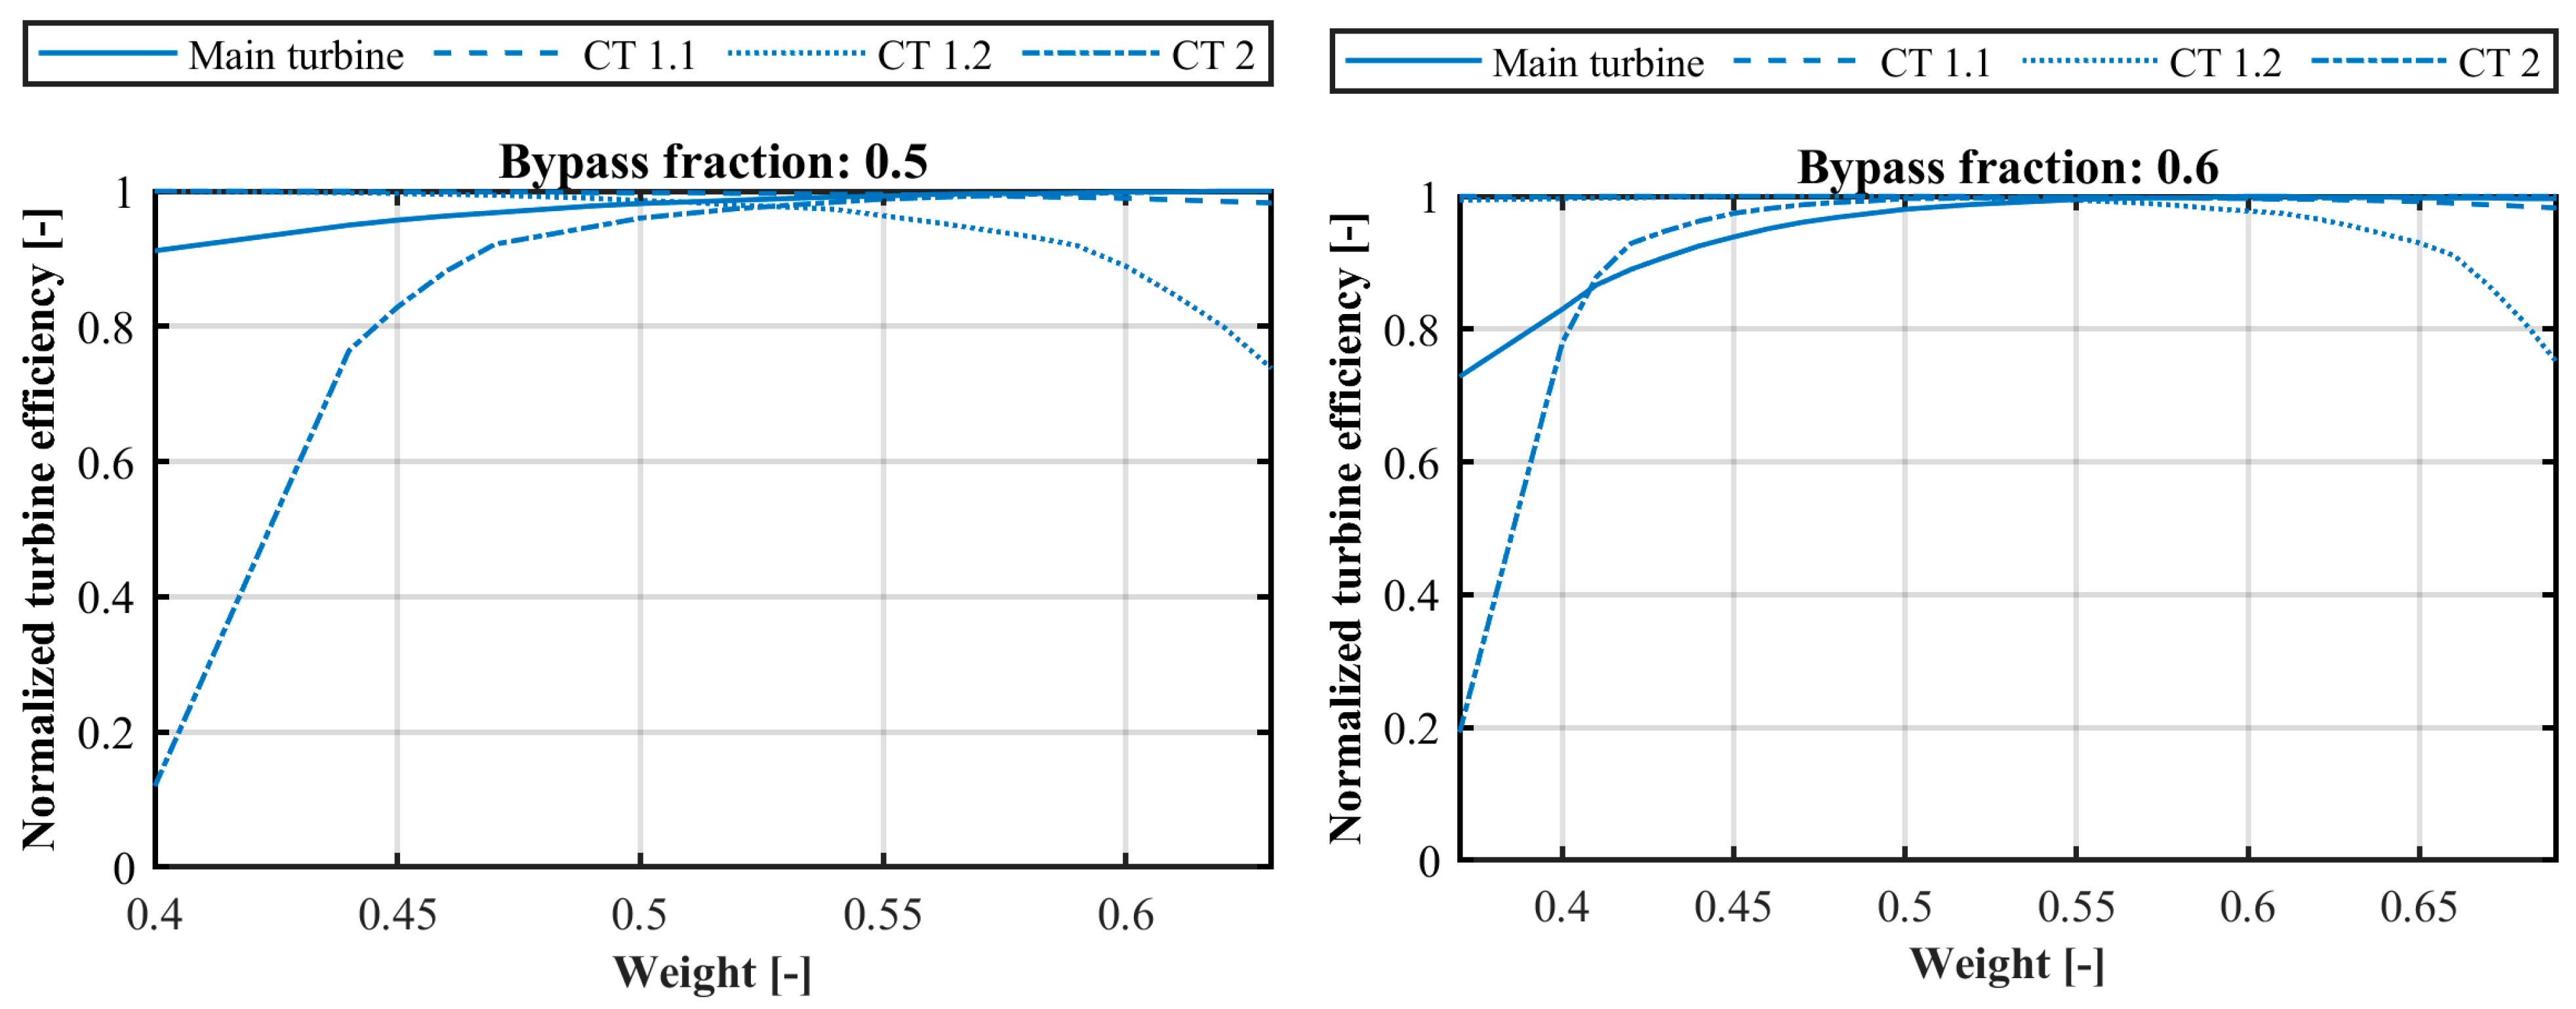
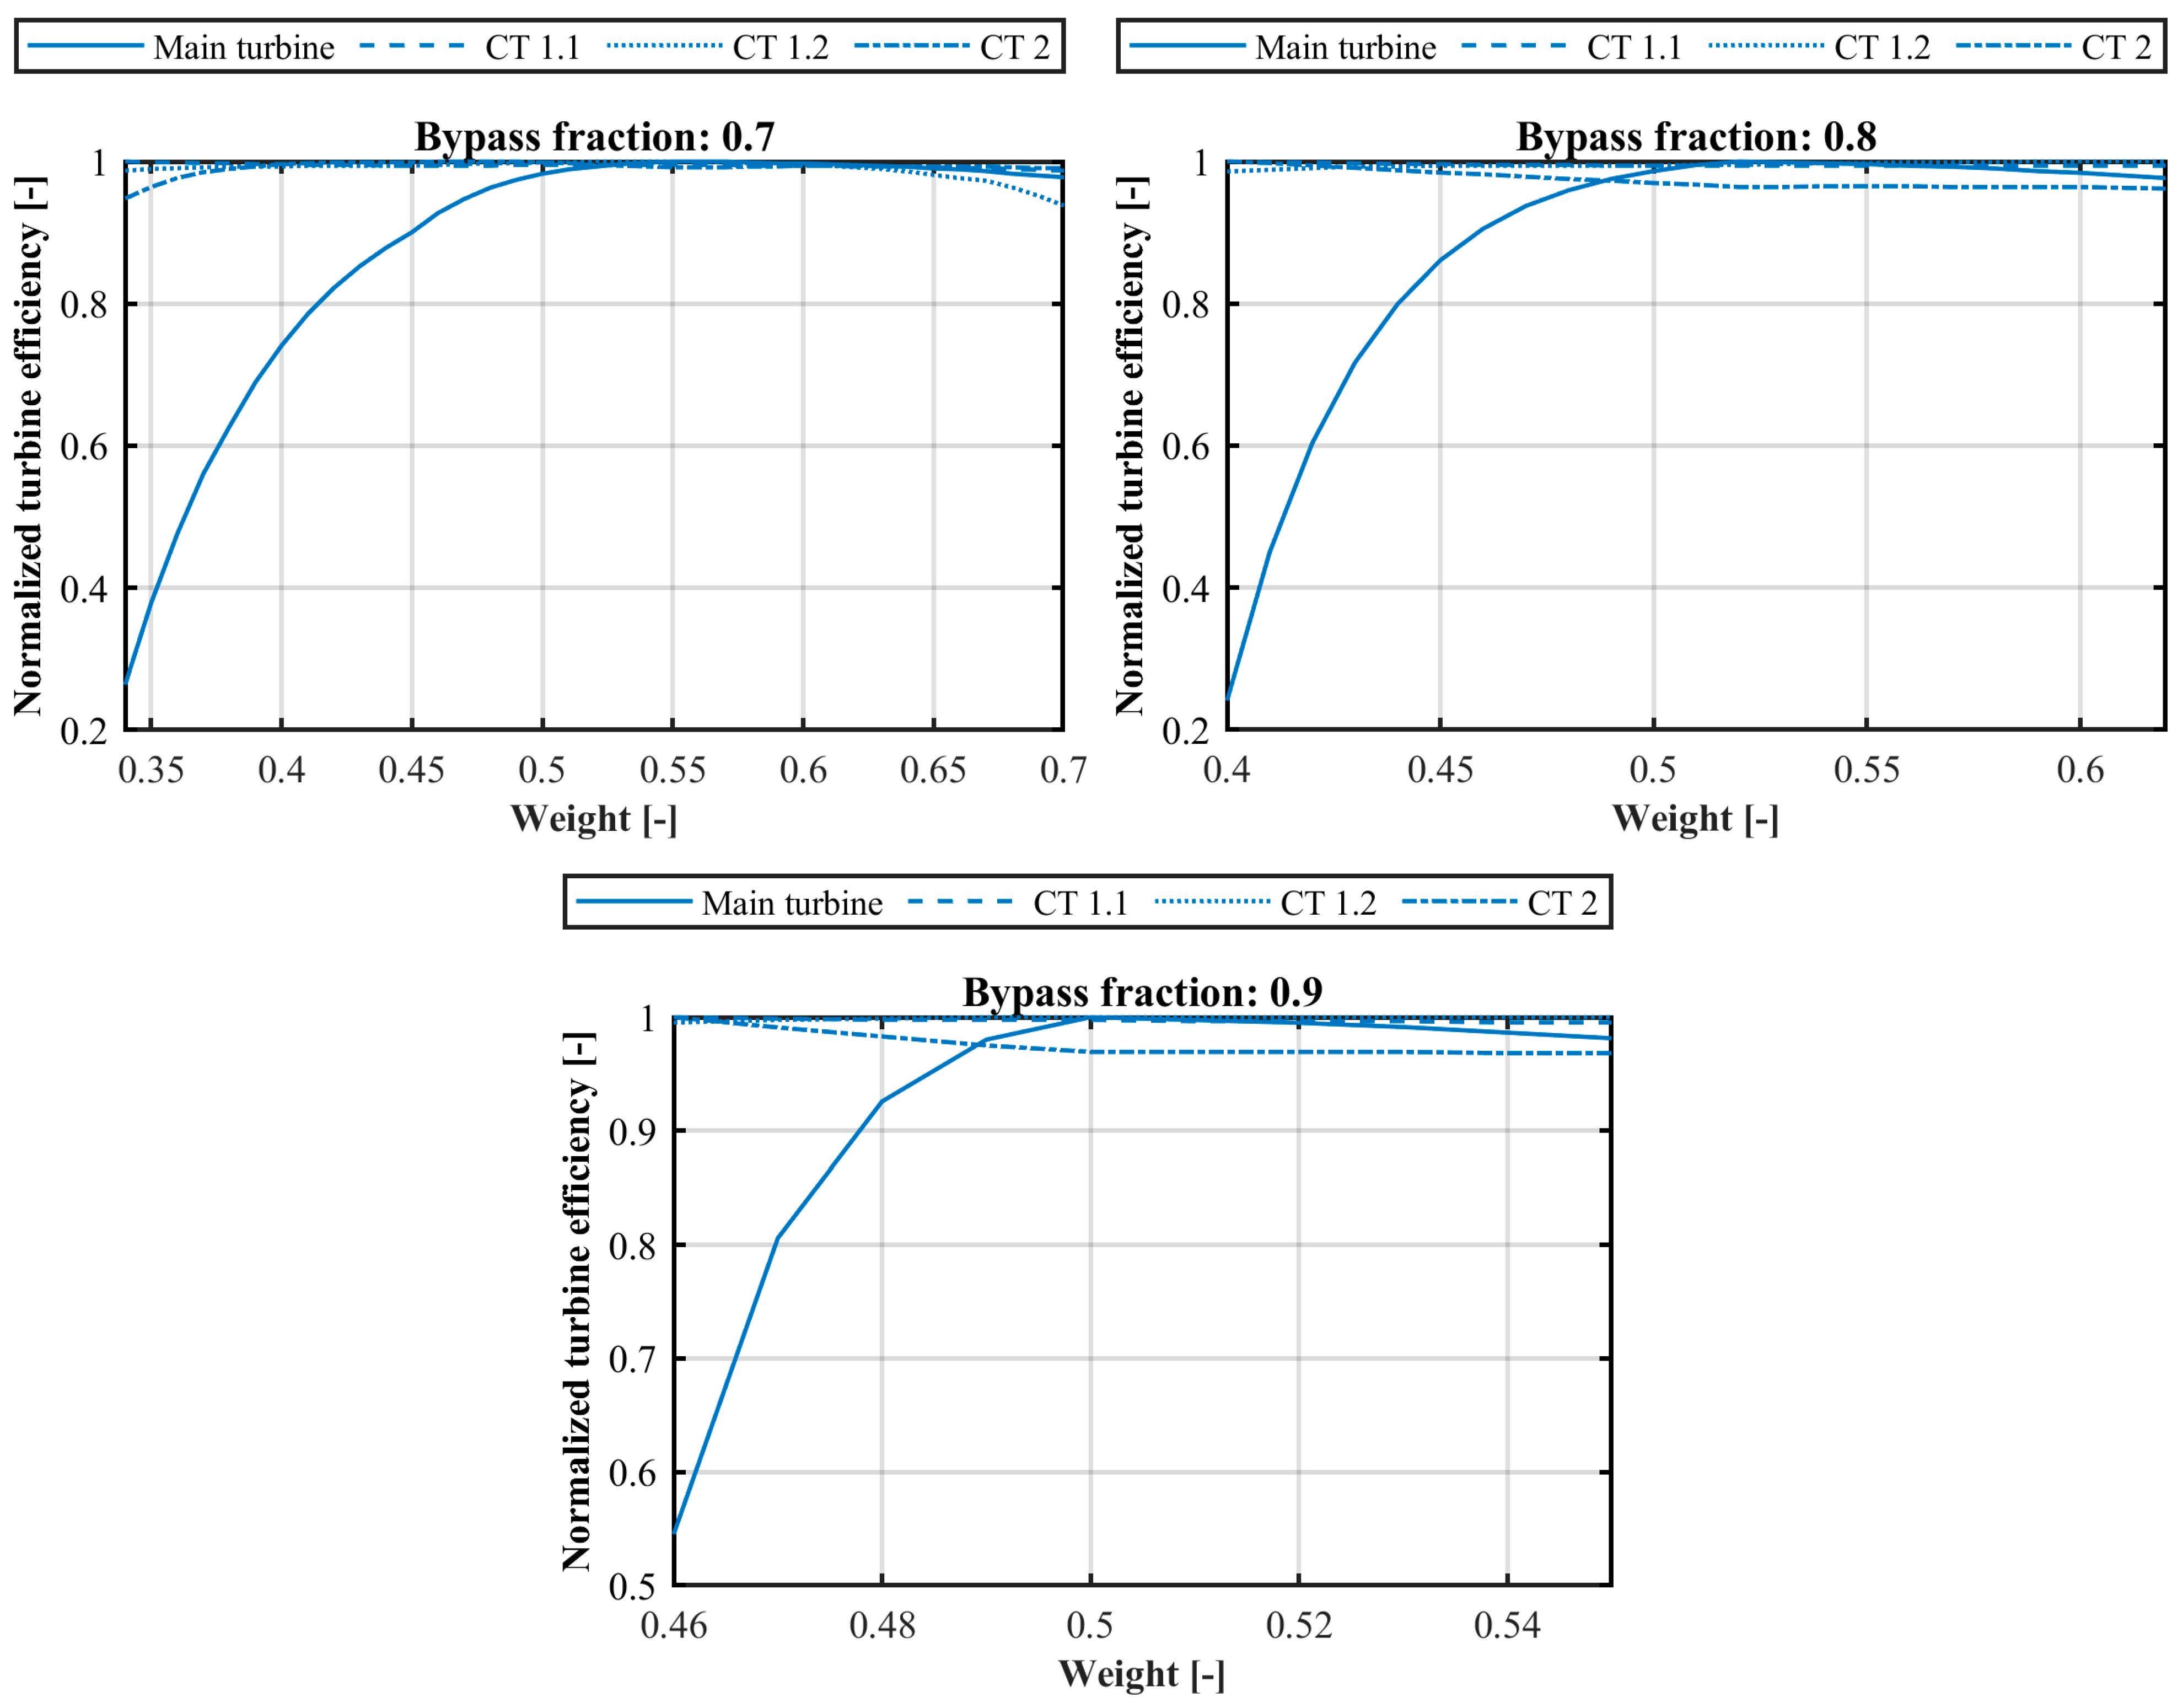
The plots of normalized turbine efficiency for both configurations can be found in Appendix A.

5.2. The 50% Boiler Capacity Condensing Tail Turbine

5.2.1. Even Heat-Load Distribution at Design

The variation in bypass fractions and weighting factor was also evaluated for the 50%-capacity CT turbine, with the resulting performance shown in Figure 9. Similar to the full-capacity CT turbine cases, an efficiency peak appears at bypass fractions above 0.3. In this operating range, the performance difference between the two turbine configurations is small, with both the single-flow and double-flow turbines interchangeably achieving the highest electric cycle efficiency at low CT loads. At higher CT loads, however, the single-flow configuration consistently exhibits superior performance. Consequently, the single-flow turbine emerges as the preferred option for a 50%-capacity CT application, due to its simpler construction, unless a strong requirement for load balancing motivates the selection of a double-flow configuration.

5.2.2. Alternate Weighting Factor at Design

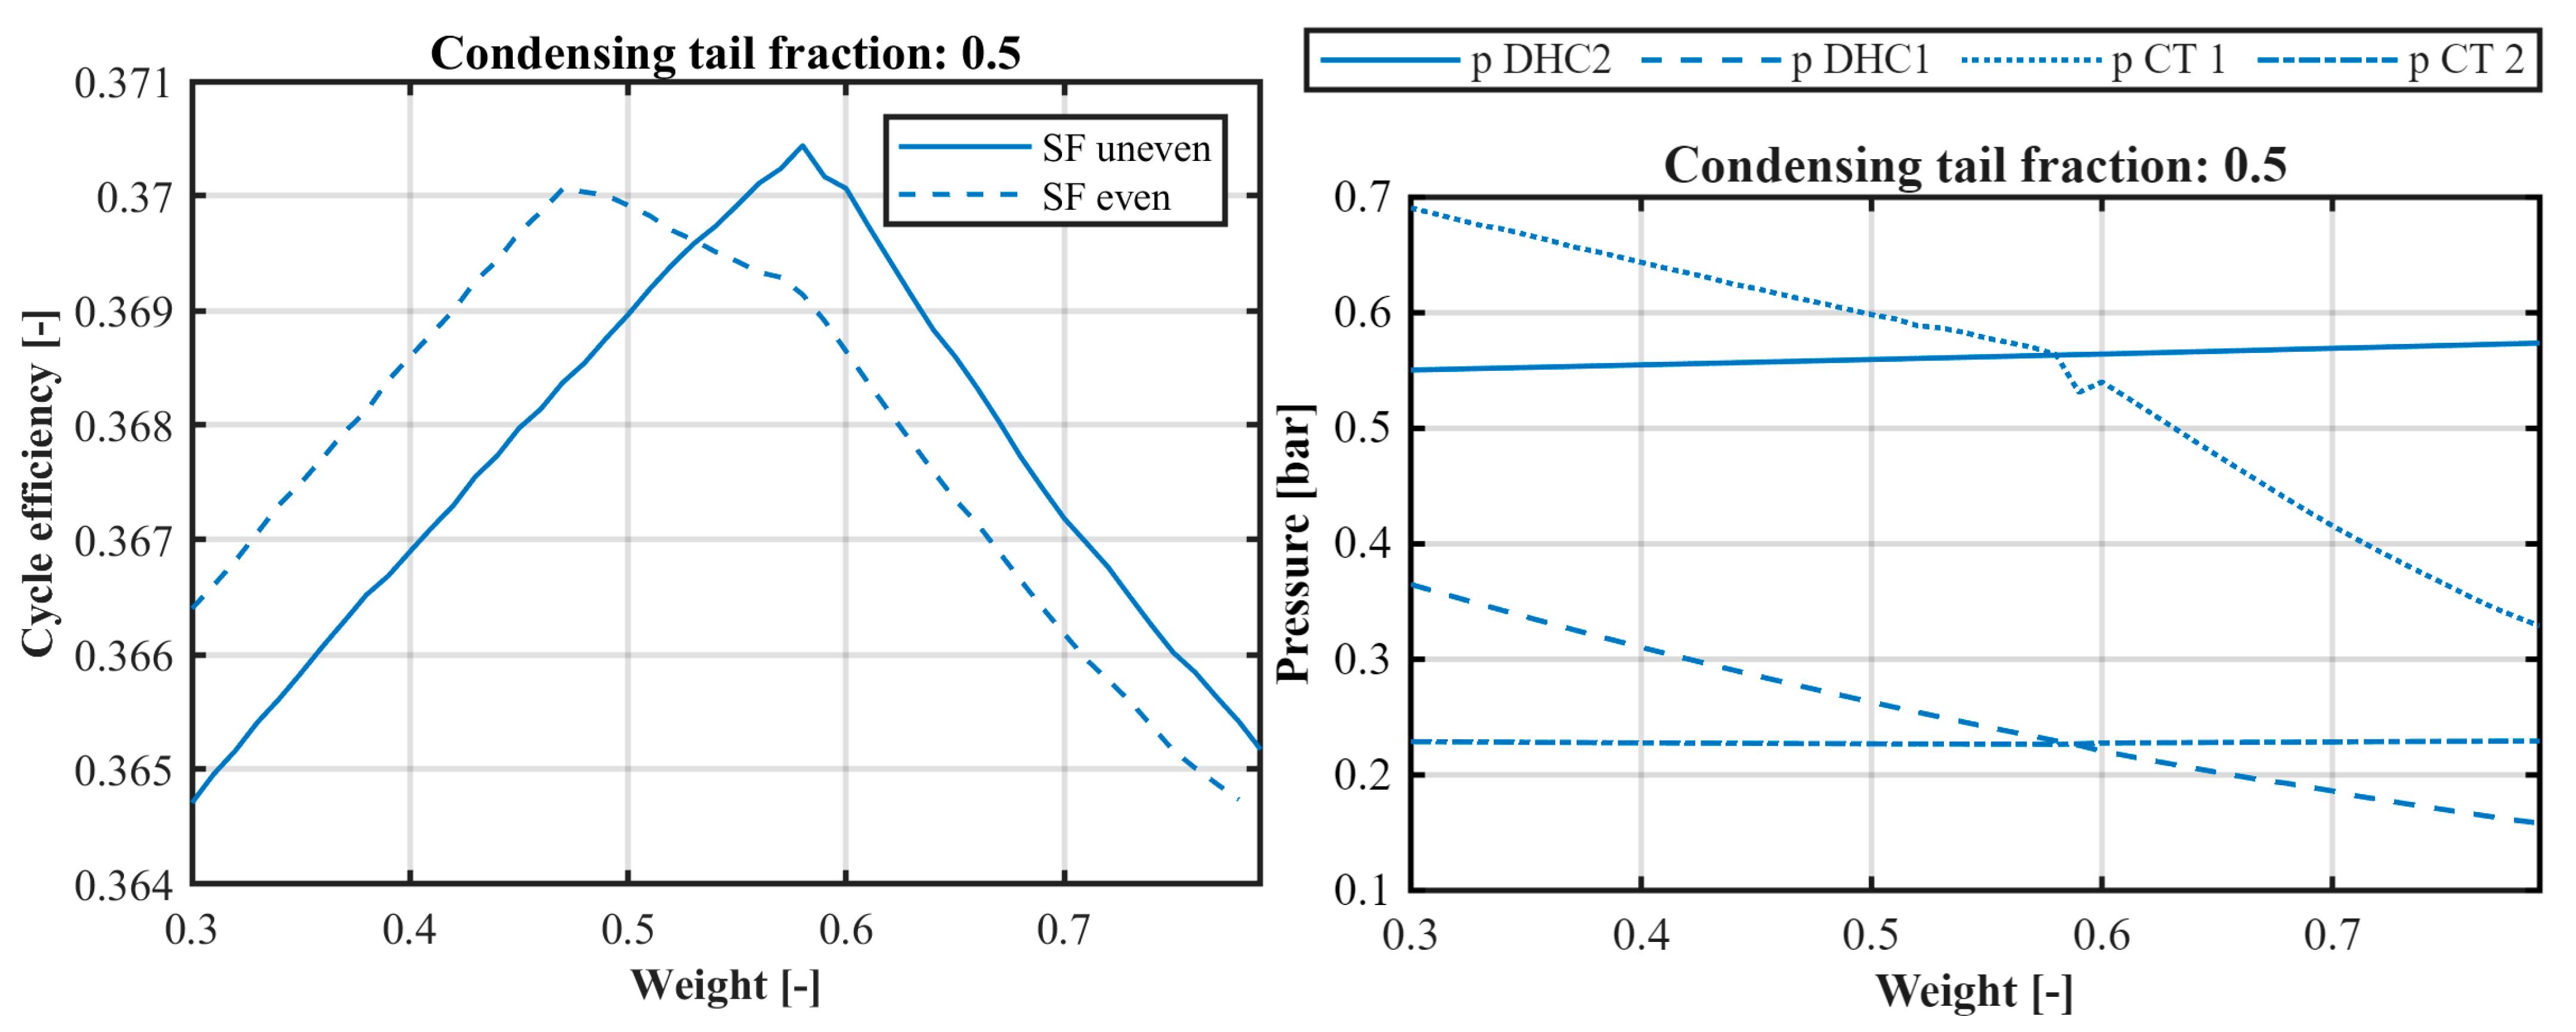
The simpler single-flow part-load CT turbine is chosen to investigate an alternative design strategy. The objective is to reduce the extraction pressure at DHC1 by employing a larger secondary section in the CT turbine. In the final design, the number of CT turbine stages is reduced from four to three. This reduction slightly decreases the overall efficiency of the condensing tail turbine.
The resulting performance compared to the reference CT turbine at a bypass fraction of 0.5 is presented in Figure 10. The same figure also presents the corresponding pressure levels for the uneven case. Relative to the evenly distributed configuration, the DHC2 extraction pressure is reduced from 0.564 bar, while the DHC1 extraction pressure decreases from 0.276 bar to 0.226 bar. This reduction increases the pressure ratio of the stage upstream of both extractions, resulting in a 335 kW increase in the main turbine power output and a 297 kW decrease in the CT turbine power output.
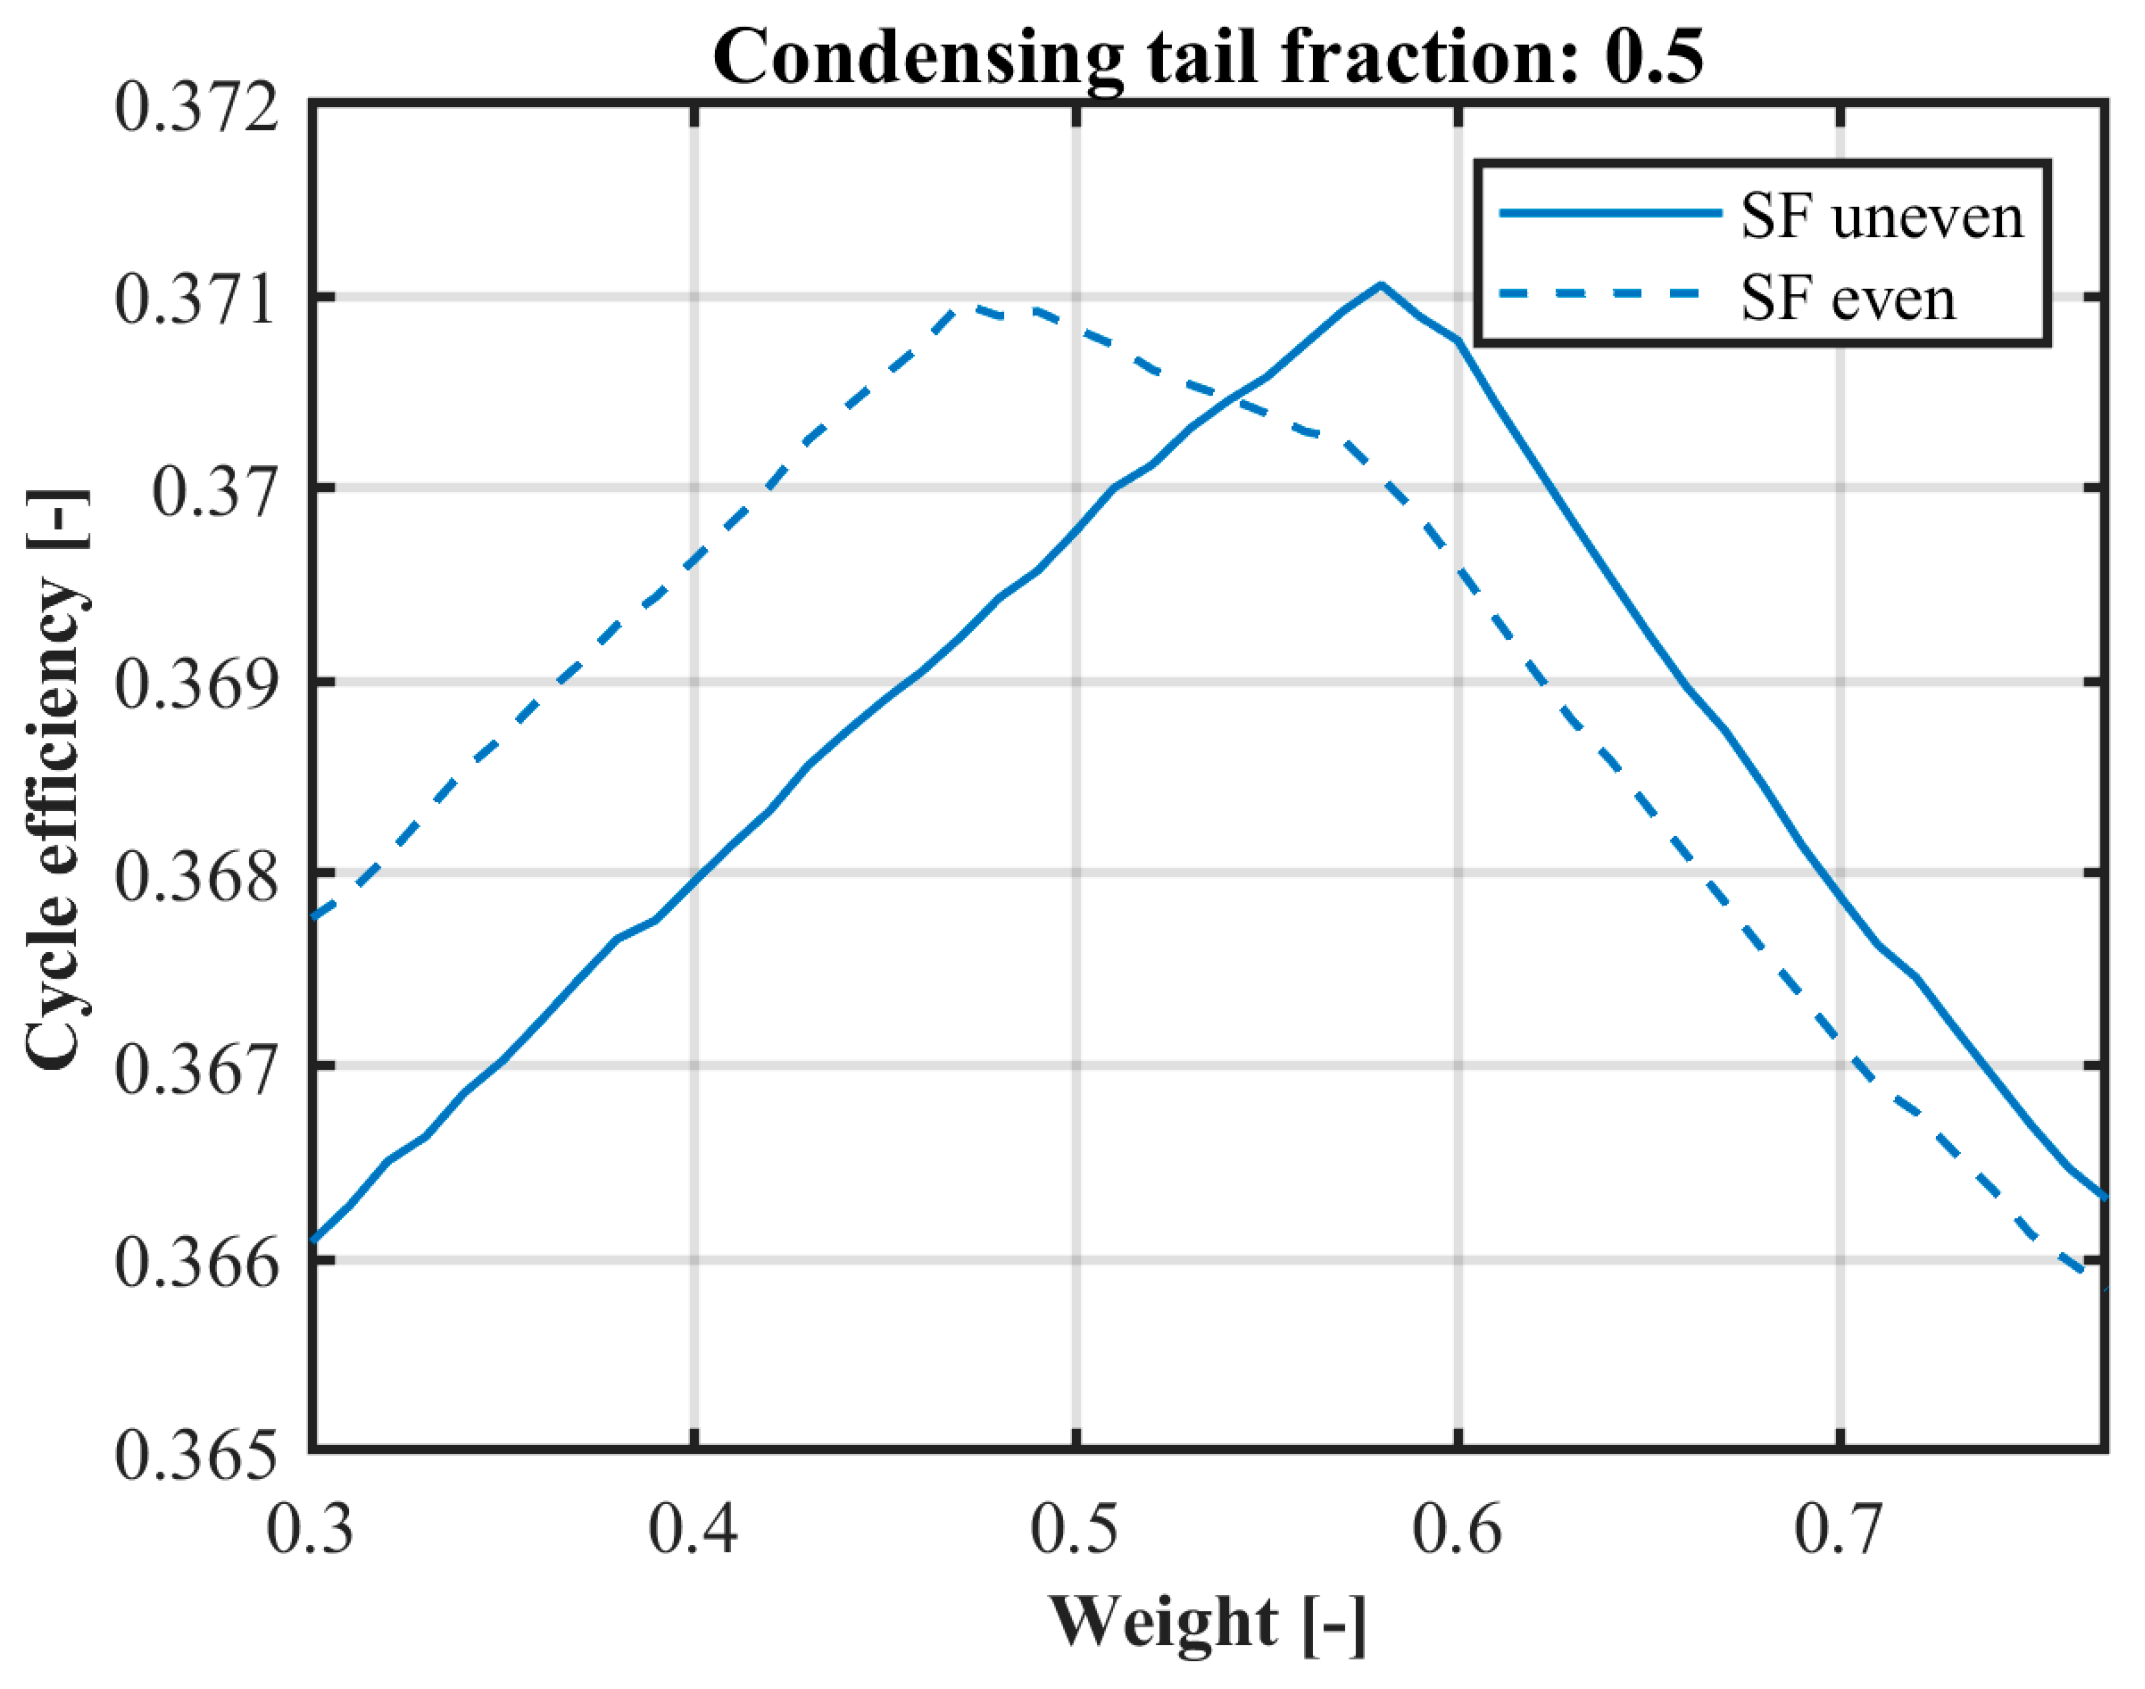
The main effect is attributed to the relatively low efficiency of the last stage of the main turbine, which may be constrained by stress limitations or manufacturing considerations. Neglecting these restrictions and optimizing the last stage in the main turbine to an efficiency comparable to the CT turbine resulted in the plot seen in Figure 11. This indicates that the additional gain observed for the uneven heat-load distribution is case-dependent and not a consistent phenomenon across all turbine setups.

5.3. Additional Operational Aspects and Future Work

Valves are generally characterized by linearized relationships between the flow rate and opening position, which implies that implementation would not require significant effort, as it effectively corresponds to one valve being opened at a relatively faster rate than the other. It can further be noted that it is simpler to operate at one end of the weighting factor range, rather than frequently adjusting it. A practical strategy would therefore be to apply higher weighting factors at low CT loads and then gradually reduce the weighting factor as the CT load increases. This approach closely resembles conventional valve-opening sequences.
Conventional valve opening during normal CT operation has been shown to not exhibit noticeably greater wear compared to other valves at the power plant. In addition, the transition from the DH load towards the CT load was reported to be relatively fast, almost instantaneous. This was explained in a short discussion with an operator, Björn Bursell (personal communication, 31 March 2026), who previously worked at a CT turbine facility in Norrköping that has since been demolished. The rapid transition to CT operation was further supported by Magnus Allmyr (personal communication, 8 April 2026), who previously worked at another facility in Västerås with a CT turbine. The time required for full-load transition was reported to range from 1 to 10 min during emergency operation and 20–30 min during normal operation. The long transition times were applied conservatively to reduce the risk of exposing components to unnecessary operation stress. This indicates that operating valves more aggressively than in previous practice—such as to respond to rapid changes in demand—could enable faster ramping but may also result in increased wear compared to that observed in these plants.
Bursell, B., elaborated that the main operational challenge was associated with heat generation in the CT turbine low-flow operation at synchronous speed, requiring continuous cooling. Future facilities equipped with large CT turbines should therefore consider an SSS-coupling connected to the same generator as the main turbine, avoiding the capital cost and mechanical wear associated with cycling a standalone generator.
An SSS-coupling is a component that has seen limited deployment in conventional CHP plants, which has contributed to operator skepticism regarding its implementation. The use of an SSS-coupling enables the CT turbines to remain connected during periods of highly fluctuating demand without requiring the prolonged and controlled ramp-up to synchronous speed. During extended periods of expected downtime due to the prioritization of DH demand, the CT turbine can be disconnected.
When connected, the CT turbine must be supplied with the minimum steam flow, drawn from the condensers, to limit the heat generation in the final turbine stages. Consequently, a CT turbine that can operate safely at lower loads will consume less steam and auxiliary system energy during periods of low electricity prices.
These approaches can be considered to extend the operating range and mitigate this effect. The first involves increasing the pressure ratio of the DHC1 bypass stage by intentionally reducing its flow area. This results in higher main turbine backpressure at a full CT load, thereby transferring the negative impact to the main turbine. The second approach is to reduce the number of stages in the DHC2 bypass path. Both of these options lead to reduced overall efficiency.
A third, more complex solution, briefly mentioned previously, enables asymmetric operation by splitting and decoupling the shafts in the CT turbine. In a single-flow configuration, this would permit asymmetric off-loading of only the DHC1 bypass stage to maintain condenser pressure. However, this configuration provides no practical benefit, as it requires the same minimum load as a configuration with shared shaft. In contrast, a double-flow allows for the option of selecting to implement the ability of individual bypassing of either DHC2 or DHC1. Although the solution entails a substantially higher cost and increased complexity, it enables a greater range of operation, with a reduction in steam consumption, potentially justifying the investment. These trade-offs warrant further investigation in future work.
Additional areas that require further investigation include mechanical stress and ramping rates. The primary operational limitation for steam turbines is the thermal stress associated with rapid load changes. Commonly, the allowable rate of load change is constrained by a manufacturer-defined limit on temperature variation per unit time, applied primarily to the inlet stages where the highest steam temperatures occur. In contrast to conventional steam turbines, the operating temperatures of the CT turbine lie in the range of 65–90 °C, resulting in comparatively low thermal stress. Future work should therefore focus on quantitively evaluating a tailor-made allowable load-change rate that accounts for economic considerations, such as valve and turbine wear, to enable comparison with other flexible generation technologies.

6. Conclusions

This study investigated the economic potential and part-load behavior of CT turbines in district heating-combined heat and power plants. The main conclusions are as follows:
  • The implementation of a CT turbine increases operational flexibility and enables participation in island-mode operation and m-FRR markets.
  • A 50% capacity CT turbine can generate an average additional income of approximately 2.36 million SEK (215 thousand €) per winter, with strong sensitivity to electricity and fuel price levels.
  • Part-load operation of CT turbines shows distinct performance optima, making valve control strategy important for maximizing the power output.
  • Optimal control of bypass distribution can yield power gains of up to 173.5 kW under the investigated operating conditions.
  • Single-flow and double-flow CT turbine configurations exhibit similar overall performance. At a bypass fraction of 90%, the double-flow configuration produced approximately 46 kW higher power output than the single-flow case.
  • For lower capacity CT turbine applications corresponding to a 50% nominal DH heat-load, the single-flow CT turbine is the preferred configuration.
  • For a 50%-capacity CT turbine, adjusting the heat-load distribution at the design-point can further increase the total turbine output.
Future work should focus on mechanical and operational aspects, including valve wear, thermal stress, ramp-rate limitations, and long-term operational reliability, to complement the thermodynamic findings presented in this study.

Author Contributions

Conceptualization, A.A.-S.M.; methodology, A.A.-S.M.; software, A.A.-S.M. validation, A.A.-S.M.; formal analysis, A.A.-S.M.; investigation, A.A.-S.M.; resources, G.M.; data curation, A.A.-S.M.; writing—original draft preparation, A.A.-S.M.; writing—review and editing, A.A.-S.M.; visualization, A.A.-S.M.; supervision, G.M.; project administration, G.M.; funding acquisition, G.M. All authors have read and agreed to the published version of the manuscript.

Funding

This research was funded by the Government institution: Energimyndigheten. Grant number P2022-00785.

Data Availability Statement

Data for the turbine cannot be shared due to confidentiality. All other data, both in terms of cycle and modeling, will be made available upon request.

Conflicts of Interest

No conflicts of interest are present in this paper.

Abbreviations

The following abbreviations, symbols and subscripts are used in this manuscript:
Abbreviations and symbols
ACCAir-cooled Condenser
CConstant 1
C1Constant 2
CtTurbine Constant
CTCondensing Tail
DFDouble-flow
DHDistrict Heating
DHCDistrict Heating Condenser
EUFEnergy Utilization Factor
HPHigh Pressure
LPLow Pressure
m ˙ Mass Flow Rate [kg/s]
m-FRRManual Frequency Restoration Reserve
PPower [kW]
pPressure [bar]
Q ˙ Heat Transfer Rate [kW]
ReReynolds Number [-]
SFSingle-flow
TTurbine
TSOTransmission System Operator
TTDTerminal Temperature Difference [K]
UOverall Heat Transfer Coefficient [kW/m2K]
vSpecific Volume [m3/kg]
xVapor Fraction [-]
Greek Symbols
αHeat Transfer Coefficient [kW/m2K]
ηEfficiency [-]
μDynamic Viscosity [Pa-s]
ρDensity [kg/m3]
ΔDelta
Subscripts
desDesign
elElectric
fracFraction
iIn
oOut
redReduction

Appendix A

Normalized Efficiencies of the Turbines at Part-Load

Figure A1. The normalized turbine efficiency for bypass fractions from 0.5 to 0.9 when adjusting the weighting factor for the single-flow CT turbines. CT 1 is the condensing tail turbine part where DHC2 flow expands, while CT 2 represents the turbine where flow from the CT 1 and DHC1 expands.
Energies 19 02036 g0a1aEnergies 19 02036 g0a1b
Figure A2. The normalized turbine efficiency for bypass fractions from 0.5 to 0.9 when adjusting the weighting factor for the single-flow CT turbines. CT 1.1 is the first expansion part of the flow from the DHC2, while CT 1.2 is the second part. CT 2 represents the turbine where flow from DHC1 expands.
Energies 19 02036 g0a2aEnergies 19 02036 g0a2b

References

  1. Bodecker Partners, A.B. Batterilagring Och Framtidens Hybridparker; Svensk Vindenergi: Stockholm, Sweden, 2024; Available online: https://greenpowersweden.se/rapporter/batterilagring-och-framtidens-hybridparker-bodecker-partners-20240619/ (accessed on 16 March 2026).
  2. Wickström, J. Sveriges Första Fjärrvärmeverk Firar 75 År; Tidningen Energi: Stockholm, Sweden, 2023; Available online: https://www.energi.se/artiklar/2023/september-2023/sveriges-forsta-fjarrvarmeverk-firar-75-ar/ (accessed on 16 March 2026).
  3. Zhou, Y.; Wang, D. An improved coordinated control technology for coal-fired boiler-turbine plant based on flexible steam extraction system. Appl. Therm. Eng. 2017, 125, 1047–1060. [Google Scholar] [CrossRef] [Scilit]
  4. Wang, Z.; Liu, M.; Yan, H.; Yan, J. Optimization on coordinate control strategy assisted by high-pressure extraction steam throttling to achieve flexible and efficiency operation of thermal power plants. Energy 2022, 244, 122676. [Google Scholar] [CrossRef] [Scilit]
  5. Lausterer, G.K. Improved maneuverability of power plants for better grid stability. Control. Eng. Pract. 1998, 6, 1549–1557. [Google Scholar] [CrossRef] [Scilit]
  6. Richter, M.; Oeljeklaus, G.; Görner, K. Improving the load flexibility of coal-fired power plants by the integration of a thermal energy storage. Appl. Energy 2019, 236, 607–621. [Google Scholar] [CrossRef] [Scilit]
  7. Stevanovic, V.D.; Petrovic, M.M.; Milivojevic, S.; Ilic, M. Upgrade of the thermal power plant flexibility by the steam accumulator. Energy Convers. Manag. 2020, 223, 113271. [Google Scholar] [CrossRef] [Scilit]
  8. Ding, H.; Ding, S.; Tan, Q.; Zhang, C.; Fang, Q.; Yang, T. Improving power ramp rate of a coal-fired power plant by a bypass steam accumulator. Heliyon 2024, 10, e32412. [Google Scholar] [CrossRef] [Scilit]
  9. Trojan, M.; Taler, D.; Dzierwa, P.; Taler, J.; Kaczmarski, K.; Wrona, J. The use of pressure hot water storage tanks to improve the energy flexibility of the steam power unit. Energy 2019, 173, 926–936. [Google Scholar] [CrossRef] [Scilit]
  10. Polski, C.; Polski, T.R.J.; Wróblewski, R.B.J.; Ceran, B. A novel concept to improve the flexibility of steam power plants using an electric feedwater heater. Appl. Therm. Eng. 2024, 236, 121661. [Google Scholar] [CrossRef] [Scilit]
  11. Al-Soud, M.A.; Jonshagen, K.; Genrup, M. Four methods of hydrogen combustion within combined heat and power plants to increase power output. Results Eng. 2025, 28, 107233. [Google Scholar] [CrossRef] [Scilit]
  12. Vinterbäck, J. Fortsatt Kraftig Prisökning På Trädbränsle Under 2024; Energimyndigheten: Stockholm, Sweden, 2025. Available online: https://www.energimyndigheten.se/nyhetsarkiv/2025/fortsatt-kraftig-prisokning-pa-tradbransle-under-2024/ (accessed on 16 March 2026).
  13. Widell, M. Pressmeddelande Från Klimat—Och Näringslivsdepartementet. Regeringskansliet, Stockholm, Kraftlyftet Förstärks med Ytterligare Medel. Available online: https://www.regeringen.se/pressmeddelanden/2025/09/kraftlyftet-forstarks-med-ytterligare-medel/ (accessed on 16 March 2026).
  14. Kraftnät, S. Kraftbalansen På den Svenska Elmarknaden, Rapport 2023; Svenska Kraftnät: Sundbyberg, Sweden, 2023.
  15. Kraftnät, S. Kraftbalansen På Svenska Elmarknaden, Rapport 2025; Svenska Kraftnät: Sundbyberg, Sweden, 2025.
  16. Thunder Said Energy. Steam Generation: Capex Costs? Thunder Said Energy, 18 September 2025. Available online: https://thundersaidenergy.com/downloads/steam-generation-capex-costs/ (accessed on 27 March 2026).
  17. Kraftnät, S. Månadsrapport mFRR EAM—September 2025; Svenska Kraftnät: Sundbyberg, Sweden, 2025.
  18. SimTech GmbH. Products. SimTech. 2026. Available online: https://simtechnology.com/products/ipsepro-process-simulation-and-heat-balance-software (accessed on 8 April 2026).
  19. Perz, E. A Computer Method for Thermal Power Cycle Calculation. J. Eng. Gas Turbines Power 1991, 113, 184–189. [Google Scholar] [CrossRef] [Scilit]
  20. Perz, E. Computer Aided Analysis of Thermal Power Processes. In ASME Cogen Turbo; American Society of Mechanical Engineers: New York, NY, USA, 1993. [Google Scholar]
  21. Perz, E.W.; Riesel, U.; Schinagl, H.A. A new Approach for Modelling Energy Systems. In ASME Cogen Turbo; American Society of Mechanical Engineers: New York, NY, USA, 1995. [Google Scholar]
  22. Genrup, M. On Degradation and Monitoring Tools for Gas and Steam Turbines; Lund University: Lund, Sweden, 2005. [Google Scholar]
  23. Shah, M.M. A general correlation for heat transfer during film condensation inside pipes. Int. J. Heat Mass Transf. 1979, 22, 547–556. [Google Scholar] [CrossRef] [Scilit]
  24. Holman, J.P. Heat Transfer, 10th ed.; McGraw-Hill: New York, NY, USA, 2010. [Google Scholar]
  25. Summers, C. Air Cooled Heat Exchangers. Thermopedia, 2 February 2011. Available online: https://www.thermopedia.com/content/551/ (accessed on 15 April 2025).
  26. Sarco, S. Pipes and Pipe Sizing for Steam Distribution. Available online: https://www.spiraxsarco.com/learn-about-steam/steam-distribution/pipes-and-pipe-sizing?sc_lang=en-GB (accessed on 11 April 2025).
  27. Acül, H. Air Cooled Condensers and Their Effect on Energy Efficiency; Friterm: Demirciler, Türkiye, 2008. [Google Scholar]
  28. Zhang, Y.; Liu, J.; Yang, T.; Liu, J.; Shen, J.; Fang, F. Dynamic modeling and control of direct air-cooling condenser pressure considering couplings with adjacent systems. Energy 2021, 236, 121487. [Google Scholar] [CrossRef] [Scilit]
  29. Tanuma, T. Advances in Steam Turbines for Modern Power Plants; Woodhead Publishing: Cambridge, MA, USA, 2022. [Google Scholar]
  30. Bracco, S.; Caligaris, O.; Trucco, A. Mathematical models of air-cooled condensers. Energy Sustain. 2009, 121, 399–410. [Google Scholar]
  31. Ghettini, S.; Sorce, A.; Sacile, R. Data-Driven Air-Cooled Condenser Performance Assessment: Model and Input Variable Selection Comparison. In E3S Web of Conferences 198; EDP Sciences: Rome, Italy, 2020. [Google Scholar]
Figure 1. The loading distribution for a power plant between 1 October and 31 March: (a) shows the winter of 2019/2020 while (b) shows the year 2020/2021.
Energies 19 02036 g001
Figure 2. A general district heating power plant in Sweden (left) and the condensing tail configuration that will be added to it (right).
Energies 19 02036 g002
Figure 3. The air-cooled condenser pressure at part-load for different: (a) fan speeds and (b) ambient temperatures.
Energies 19 02036 g003
Figure 4. The comparison of the normalized pressures for the extractions when comparing the model data, plotted with black, and fleet data, plotted with transparent blue. Both include 3 sets of extraction points.
Energies 19 02036 g004
Figure 5. The comparison between the overall heat transfer coefficient calculated from data and the model. Both the higher-pressure district heating condenser (left) and the lower pressure district heating condenser (right) are included in this comparison.
Energies 19 02036 g005
Figure 6. The electric cycle efficiency, EUF and power gain for the single-flow (left) and double-flow (right) CT turbine cases for different bypass fractions at a weighting factor of 0.5.
Energies 19 02036 g006
Figure 7. The electric cycle efficiency for the bypass fraction of all bypass fractions from 0.5 to 0.9 when changing the weighting factor for the single- (dashed) and double-flow CT turbines. The switch when the CT turbine sets the DHC extraction pressure is also marked with ‘x’ (DHC1) and ‘o’ (DHC2).
Energies 19 02036 g007
Figure 8. The pressures for the single-flow (left) and double-flow (right) configuration. This is plotted for the bypass fraction of 0.9. CT 1 is the condensing tail turbine part where DHC2 flow expands, while CT 2 represents the turbine part where flow from the CT 1 and DHC1 expands.
Energies 19 02036 g008
Figure 9. The electric cycle efficiency when adjusting the weighting factor for a 50% capacity condensing tail turbine. The single-flow (SF) case is also included as a dashed line.
Energies 19 02036 g009
Figure 10. The electric cycle efficiency plot (left) of the even and uneven heat-load distribution for a 50% capacity CT turbine at its full load. The (right) figure shows the pressures for the DHC and CT for the uneven case. CT 1 is the condensing tail turbine part where DHC2 flow expands, while CT 2 represents the turbine part where flow from the CT 1 and DHC1 expands.
Energies 19 02036 g010
Figure 11. The electric cycle efficiency plot of the even and uneven heat-load distribution for a 50% capacity CT turbine at its full load with an improved main turbine last stage.
Energies 19 02036 g011
Table 1. The boundary conditions for the cycle in the case study.
ParameterValue
Inlet pressure~140 bar
Inlet temperature540 °C
Mass flow inlet40 kg/s
HP-LP crossover pressure8 bar
All component TTD2.8 °C
Preheater drain cooling approach5.5 °C
Condenser subcooling temperature1 °C
Condenser 1 DH inlet temperature47 °C
Condenser 1 DH outlet temperature65 °C
Condenser 2 DH outlet temperature83 °C
Pump efficiencies70%
Table 2. The efficiency and power output for the single- and double-flow turbine at different values of bypass fraction and weighting factor. Efficiency is evaluated as electric efficiency, while the net gain power is the total power with both the pump work and the design net power output subtracted.
VariablesSingle-FlowDouble-Flow
Bypass FractionWeighting Factorηel [%]ΔPgain [kW]ηel [%]ΔPgain [kW]
0.50.436.3431104.836.2591023.4
0.536.3011064.836.2741038.1
0.636.3131075.836.3601121.4
0.70.437.1811909.836.9651664.8
0.537.4532173.137.3722095.2
0.637.3582081.337.3322056.7
0.90.4637.6252329.937.4302140.3
0.538.4523130.638.4973174.3
0.5538.3373019.838.3623043.9
Disclaimer/Publisher’s Note: The statements, opinions and data contained in all publications are solely those of the individual author(s) and contributor(s) and not of MDPI and/or the editor(s). MDPI and/or the editor(s) disclaim responsibility for any injury to people or property resulting from any ideas, methods, instructions or products referred to in the content.