1. Introduction
The accelerated deployment of variable renewable energy sources and the electrification of end-use sectors are increasing the need for flexibility in energy systems at multiple scales, from consumers “behind the meter” to distribution grids and system-level balancing [
1,
2,
3]. SES is widely recognized as a key technology as it can mitigate PV variability, increase self-consumption, reduce peak demand and provide ancillary services [
4]. However, storage technologies vary significantly in their cost structure, efficiency, resource requirements and environmental footprint, and these trade-offs depend strongly on operating conditions, cyclicity profile, electricity prices, the carbon intensity of electricity supply, and policy restrictions on exports or self-consumption.
Li-ion batteries currently dominate many stationary storage systems due to their high efficiency, favorable power density and rapid cost reduction [
5,
6]. In parallel, the expansion of electric mobility is creating a growing stream of electric vehicle (EV) batteries that are reaching end-of-life criteria, typically defined by a residual capacity threshold, while remaining technically viable for less demanding stationary applications [
7,
8,
9,
10]. Repurposing such packages as “second-life batteries” has the potential to reduce the effective environmental burden per kWh delivered, improve resource efficiency and delay recycling, thereby enhancing circular economy outcomes [
11,
12,
13,
14,
15,
16]. However, second-life pathways introduce additional uncertainties related to residual health, safety, refurbishment processes and the distribution of production and end-of-life impacts across multiple phases of use [
17,
18]. Pb-acid batteries remain a suitable benchmark for stationary storage, as they rely on mature production routes, and high collection and recycling rates supported by long-standing infrastructure [
19]. Their lower charge–discharge efficiency and shorter cycle life compared to Li-ion batteries can be partially compensated by strong circular performance and well-characterized end-of-life management [
20,
21,
22,
23]. Hydrogen-based storage systems, typically implemented as PtH
2P circuits using an electrolyzer, storage tank, and fuel cell (FC), represent a fundamentally different option [
24,
25,
26]. Although they typically exhibit lower charge–discharge efficiency, they offer scalable energy capacity and may become attractive for long-term storage or applications requiring extended autonomy [
27,
28,
29]. A robust comparison of these technologies requires integrating operational performance with both economic and environmental assessment [
30,
31,
32]. Many studies report either techno-economic indicators, such as LCOS, or environmental indicators, such as GWP, but often without consistent functional units, harmonized boundaries, or dispatching strategies tailored to market signals [
33,
34,
35,
36]. Furthermore, circularity mechanisms, especially explicit recycling credits and second-life allocation, are not always modeled transparently, which can significantly affect comparative conclusions.
This study provides an integrated techno-economic and environmental assessment of stationary storage options based on second-life Li-ion batteries originating from electric vehicle applications, lead-acid batteries as a mature and highly recyclable baseline, and hydrogen PtH2P systems. We use a dispatching and sizing framework based on optimization driven by measured PV load profiles and time-resolved market electricity prices, and evaluate the results using a unified functional unit PV (per MWh of electricity delivered to the load) over the entire system lifecycle. The life-cycle model explicitly includes end-of-life recycling credits and second-life credits, allowing for a circularity-aware comparison alongside operational metrics such as autonomy, self-consumption and round-trip efficiency.
The main contributions of this work are a harmonized comparison of second-life Li-ion, lead-acid and hydrogen energy storage under identical input data and constraints; a related optimization and evaluation workflow that links dispatching decisions to LCOS and life-cycle assessment (LCA) metrics; an explicit representation of recycling and second-life credits in environmental accounting; and scenario and sensitivity analyses that quantify how the conclusions change with key policy and economic parameters such as preferential remuneration and discount rate.
Based on the identified research gaps, this study addresses the following central research question:
“How does the integration of a harmonized techno-economic (LCOS) and environmental (LCA) framework affect the comparative assessment of stationary energy storage technologies under realistic market conditions?”
To answer this question, a unified modeling framework is developed, combining optimization-based dispatch, discounted LCOS, and cradle-to-grave LCA within a consistent functional unit and system boundary.
2. Literature Review
The rapid growth of EV is accelerating the deployment of Li-ion batteries and therefore increasing the volume of end-of-life packs suitable for reuse in SES systems [
4,
5,
6,
7]. The use of second-life batteries has been widely discussed as a way to increase asset value, reduce the lifecycle impact of delivered kWh, and support grid flexibility through distributed storage. At the same time, established stationary solutions such as Pb-acid batteries remain relevant due to mature recycling chains and high collection rates, while PtH
2P systems are increasingly being considered for long-term and seasonal balancing, albeit with lower efficiency in bidirectional use and more complex infrastructure.
2.1. Second-Life Li-Ion Batteries for Stationary Applications
The central theme of this study is the technical feasibility and value proposition of reusing electric vehicle batteries for stationary services, e.g., increasing self-consumption and reducing peak loads, backup and ancillary services [
10,
11,
12]. The technical studies highlight that the state of charge (SoC), cell heterogeneity, degradation history and safety constraints strongly influence the achievable capacity, power limitations and lifetime during reuse. Practical implementation of second-life requires screening/diagnostics, module reconfiguration, adaptation of the battery management system (BMS) and compliance with stationary standards; these steps introduce additional costs and environmental burdens that need to be consistently considered in the techno-economic frameworks and LCA. Several recent reviews summarize EV battery repurposing workflows, including screening/diagnostics, BMS adaptation, safety constraints, and cost drivers [
4,
6]. In addition to conventional screening based on residual capacity, internal resistance, and pack-level state-of-health indicators, recent studies show that rapid identification of micro-health parameters can substantially improve the classification and regrouping of retired EV batteries for second-life use. In particular, micro-health parameters associated with electrode active material and electrolyte condition provide a more informative representation of the battery’s internal state than capacity-only grading, which may otherwise fail to guarantee consistency among regrouped cells or modules. This is important because inconsistency within repurposed battery assemblies can accelerate imbalance and degradation during stationary operation, thereby increasing operational risk and repurposing cost. Fast identification approaches based on reduced electrochemical models have therefore been proposed as a way to shorten testing time while providing a multidimensional basis for second-life battery sorting and reuse decision-making [
5].
The performance of second-life lithium-ion batteries depends not only on residual capacity but also on prior usage history, degradation pathways, and cell chemistry. For example, LFP batteries typically exhibit longer cycle life and improved thermal stability but lower energy density, while NMC batteries provide higher energy density but may experience faster degradation under certain operating conditions. Furthermore, heterogeneity introduced by first-life usage patterns and regrouping processes can lead to accelerated imbalance and reduced effective lifetime in stationary applications. These factors introduce significant uncertainty in second-life performance and must be considered when interpreting techno-economic and environmental results.
In addition to performance and cost considerations, second-life lithium-ion batteries introduce specific safety and reliability challenges. Due to heterogeneous degradation histories, regrouped cells may exhibit mismatch in capacity, internal resistance, and thermal behavior, which can lead to imbalance during operation. This increases the risk of accelerated degradation, local overheating, and, in extreme cases, thermal runaway.
Compared to new Li-ion systems, second-life batteries generally exhibit higher uncertainty in performance and reliability, as well as greater sensitivity to operating conditions. In contrast, Pb-acid batteries rely on well-established chemistries and exhibit more predictable failure modes, although they involve other environmental and safety concerns related to lead handling.
In the present study, this module-to-module heterogeneity is not modeled through an explicit electrochemical–mechanical degradation framework. Instead, its system-level effect is approximated through conservative derating of round-trip efficiency, shortened effective lifetime, and an increased replacement frequency, which together represent the impact of post-recombination dispersion in residual capacity and internal resistance.
2.2. LCA of Battery Systems and the Role of Cascading Use
From a life-cycle perspective, “cascading” or “secondary use” can reduce the intensity of storage impacts by spreading production burdens over a larger amount of delivered energy over multiple service lives [
35,
36]. The seminal LCA work on cascading Li-ion battery life cycles emphasizes that the net benefit depends on the technology displaced, the additional impacts of refurbishment, and the operating mix of electricity during the second life [
37,
38,
39]. The review of Li-ion battery life cycles explicitly states the importance of accounting for cascading trade-offs in the life cycle and summarizes key early evidence on this topic [
8,
9,
10,
11,
12,
13].
More recent studies on LCA and life-cycle costs of stationary battery storage systems highlight that the results are highly sensitive to the definition of the functional unit (FU), cycling models, life-cycle assumptions and the carbon intensity of the electricity used for charging [
40,
41]. A study combining LCA and life-cycle costs for large-scale battery storage further reinforces the need to harmonize methodological choices such as system boundaries, modeling of use phases, replacement assumptions when comparing new versus second-life technologies or configurations.
2.3. Pb-Acid Systems, Circularity and End-of-Life Efficiency
Lead-acid batteries remain an important benchmark as they are supported by long-standing collection and recycling infrastructures. High levels of collection and closed-loop material recovery can significantly change comparative conclusions when circularity is reflected through end-of-life credits or recycled content modeling. Industry reports continue to highlight that lead-acid batteries are among the most recycled consumer products, which underpins their circularity concept and motivates their inclusion in comparative studies, alongside emerging pathways for second-life Li-ion batteries.
In parallel, policy frameworks increasingly formalize battery sustainability requirements and targets, including collection, recycling efficiency and recycled content, creating a moving baseline for future LCA and techno-economic comparisons across the EU.
2.4. Hydrogen Energy Storage (HES) as Challenges for Long-Term Storage and Comparison
HES-based storage pathways are typically proposed for long-term and seasonal applications due to scalable energy capacity, via storage tanks/caves, and the potential for cross-sector connectivity. However, PtH2P configurations typically suffer from lower bidirectional switching efficiency and higher plant-balancing complexity compared to electrochemical storage, making costs and environmental performance highly dependent on component size, utilization rate, electricity prices, and the emission intensity of electricity charging. Due to these sensitive factors, the literature increasingly recommends scenario-based comparisons (e.g., market price structures, feed-in tariff conditions, discount rates, and policy constraints) combined with robustness checks rather than single-point assessments.
In addition to system-level efficiency considerations, hydrogen energy storage systems face important technical challenges at the component level, particularly in electrolyzers and fuel cells. Proton exchange membrane (PEM) fuel cells are subject to gradual performance degradation during long-term operation, driven by multiple mechanisms such as catalyst degradation, loss of electrochemically active surface area, membrane thinning or mechanical failure, and sensitivity to dynamic operating conditions. These degradation effects lead to reduced efficiency, lower power output, and shortened system lifetime, thereby increasing maintenance and replacement costs.
Similarly, electrolyzers experience degradation due to electrode aging, catalyst degradation, and operational stress factors such as current density fluctuations and temperature variations. These processes can reduce hydrogen production efficiency and increase the energy required per unit of hydrogen produced over time.
These degradation mechanisms are critical when evaluating hydrogen systems for long-duration storage, as they directly affect both techno-economic performance (LCOS) and environmental impact (through increased energy demand and component replacement). Recent studies have proposed advanced data-driven approaches, including transformer-based models, for predicting fuel cell degradation and improving lifetime estimation accuracy.
Advanced temperature control, particularly liquid cooling strategies, can effectively mitigate key degradation mechanisms in PEM fuel cells, including catalyst degradation, membrane thinning, and thermal stress [
41]. Their results show that optimized temperature control improves system efficiency and significantly extends operating life, especially under dynamic loading conditions. These findings are of great importance for PtH
2P systems, where intermittent operation can accelerate degradation, and highlight the importance of temperature control in improving both system and LCOS performance.
This indicates that degradation mitigation is not only a materials challenge but also a system-level control problem.
While the present study represents these effects through aggregated efficiency and lifetime parameters, incorporating detailed degradation models remains an important direction for future work.
Beyond stationary applications, similar challenges related to component sizing, utilization rate, and efficiency under variable load conditions have been extensively studied in the context of fuel cell electric vehicles (FCEVs). In such systems, energy management strategies and powertrain sizing play a critical role in maintaining efficiency, durability, and system performance under highly dynamic operating conditions.
These studies demonstrate that optimal sizing of fuel cell systems, hybridization with auxiliary energy storage, and load management strategies are essential for achieving high efficiency and extending system lifetime. Importantly, these challenges are not specific to mobile applications but reflect fundamental characteristics of hydrogen-based energy systems across domains.
For example, recent work on FCEV energy management and sizing optimization highlights the importance of balancing efficiency, degradation, and dynamic response under variable load profiles [
42]. This cross-domain perspective reinforces the generality of the optimization challenges considered in this study.
2.5. Research Gaps and Positioning of This Study
Despite the rapid growth of research on remanufactured electric vehicle batteries, three methodological gaps remain relevant for stationary storage decision-making. First, published assessments often rely on inconsistent functional units and system boundaries, which limits comparability between technologies and may bias conclusions for a particular use case [
43,
44]. Second, many works do not explicitly link time-resolved operational dispatch (driven by PV load variability and electricity prices) to techno-economic (e.g., LCOS) and life-cycle (e.g., GWP) performance metrics, even though operational decisions can strongly influence both cost and environmental performance [
45,
46]. Third, circularity aspects are often treated in a non-transparent or non-harmonized way, with recycling and second-life credits either omitted, aggregated into one parameter, or reported without clearly stated allocation rules, making it difficult to interpret the true contribution of circularity measures. In this context, a unified framework is still needed that aligns FU/boundaries, integrates dispatching with LCOS-LCA assessment and transparently reports circularity credits [
47,
48,
49,
50].
This study addresses these gaps by proposing a unified assessment framework that ensures methodological consistency across techno-economic and environmental dimensions, enabling a more robust and transparent comparison of storage technologies.
3. Materials and Methods
The present model considers energy-based market participation, where storage systems optimize dispatch based on time-varying electricity prices and export remuneration. Other potential value streams, such as ancillary services (e.g., frequency regulation), capacity payments, or congestion management, are not explicitly modeled, in order to maintain a transparent and comparable baseline across technologies.
Safety and reliability aspects of second-life batteries are represented implicitly through scenario-based parameters, including reduced usable lifetime, conservative efficiency assumptions, and increased replacement frequency. These parameters serve as a proxy for degradation variability, cell mismatch, and safety-related uncertainties in repurposed battery systems.
The optimization model, LCOS formulation, and LCA analysis are integrated within a single framework designed to answer the central research question, rather than being treated as independent analytical components.
The degradation of battery systems is represented using aggregate system-level parameters (e.g., round-trip efficiency, lifetime throughput, and operational constraints), rather than explicit electrochemical–mechanical modeling. This abstraction is commonly adopted in techno-economic and LCA studies, where detailed cell-level modeling is computationally prohibitive.
Recycling efficiencies are based on literature values and current industrial practice. Lead-acid batteries are assumed to achieve recovery rates above 95%, reflecting well-established closed-loop recycling systems with high material recovery efficiency. The recovery-rate assumptions are therefore used as literature-based baseline values rather than fixed universal constants, and are interpreted as scenario-representative parameters consistent with current industrial practice.
For Li-ion batteries, recovery rates are more variable and depend on battery chemistry and recycling technology. In particular, NMC-based systems typically achieve higher recovery of valuable metals such as nickel and cobalt, while LFP batteries exhibit lower economic recovery potential due to the absence of high-value metals. As a result, recovery efficiencies for Li-ion systems are subject to higher uncertainty and are treated as approximate values in the present study.
To reflect this uncertainty more transparently, chemistry-dependent recovery assumptions are also considered within the broader policy and sensitivity analysis, particularly when evaluating recycled-content requirements and circularity-related regulatory conditions.
Operational and maintenance (O&M) costs include routine servicing, system monitoring, and safety-related expenditures. For battery systems, this includes battery management systems (BMSs), thermal management, and safety monitoring required to mitigate risks such as thermal runaway. For hydrogen systems, O&M costs include maintenance of fuel cell stacks, balance-of-plant components, and periodic servicing associated with performance degradation.
These costs are represented as aggregated annual values within the LCOS framework, providing a tractable approximation of real-world operational expenses.
The environmental assessment in this study assumes a constant grid emission factor as a simplifying approximation. While this enables consistent comparison across technologies, it does not capture temporal variations in grid carbon intensity, which may significantly influence real-world emissions.
While hourly operational dispatch is optimized using time-resolved demand, PV generation, and electricity price signals, the environmental accounting is based on an average grid emission factor in the present study. This choice improves comparability across technologies and keeps the LCA formulation tractable, but it does not capture the potential interaction between dispatch timing and time-varying grid carbon intensity. A full coupling of dispatch optimization with time-resolved carbon-intensity data is therefore identified as an important direction for future research.
The comparison between storage technologies is based on a harmonized functional unit defined as the total delivered energy (MWh) over the system lifetime. This approach ensures consistency across technologies with different power ratings, storage durations, and operational characteristics.
3.1. Goal and Scope Definition
This study compares three stationary electricity storage options under identical operating conditions, second-life Li-ion sourced from electric vehicles, Pb-acid, and HES (H2: electrolyzer–tank–FC). The analysis targets their techno-economic and environmental performance in grid-connected, PV-assisted applications.
FU: 1 MWh of electricity delivered to the load across the system lifetime. Temporal boundary: 10 years, parameterized to 20 years in sensitivity analyses. System boundary cradle-to-grave, including production, transportation, operation (grid imports/exports, auxiliaries), operation and maintenance (O&M), end-of-life (EoL), and credits (recycling and second-life substitution). All energy and material flows are consistently mapped to the FU [
51].
To ensure strict comparability across technologies, identical system boundaries are applied to all storage options, following a cradle-to-grave approach. All systems include production, transportation, operation (including all conversion losses and auxiliary energy consumption), operation and maintenance, and end-of-life stages, with recycling and second-life credits reported explicitly.
Special attention is given to ensuring that all intermediate energy conversions are fully accounted for. In particular, for hydrogen systems, the full electricity → hydrogen → electricity chain is explicitly modeled, including electrolyzer conversion, hydrogen storage, and fuel cell reconversion, as well as all auxiliary energy demands (compression, cooling, standby loads, and balance-of-plant consumption). These energy flows are consistently mapped to the functional unit.
3.2. Data Sources and Pre-Processing
The analysis uses real hourly measurements from a PV load site behind the meter, located near the city of Plovdiv (Bulgaria). The dataset covers a continuous 30-day period (1 April 2025, 00:00 to 30 April 2025, 23:00), which is equivalent to 720 hourly samples with Δt = 1 h. The time series include electricity consumption [kWh], PV generation [kWh], net electricity exchange from the grid (positive for import and negative for export) and the corresponding hourly electricity price signal [BGN/kWh].
Before optimization, the dataset is harmonized with a consistent hourly time base and checked for completeness. Minor measurement artifacts are handled with conservative preprocessing rules; PV production values below zero are capped at 0; missing values, if any, are handled by linear interpolation with short intervals, while longer intervals trigger shutdown of the affected hours; and all signals are converted to consecutive units (kWh per hour, equivalent to kW at Δt = 1 h) to match the dispatching model formulation. The input price of electricity can take negative values under market conditions with negative settlement prices, and a contractual service fee of 3.9 BGN/MWh is added to the import price in the cost calculations.
Technology parameters: Nominal round-trip efficiencies, depth-of-discharge (DoD), cycle life, and auxiliary consumptions follow manufacturer-typical ranges and are scenario-parameterized. For Li-ion, second-life specific parameters reflect reduced state-of-health (SoH), re-packaging/testing overheads, and reduced energy-component CAPEX (CAPEX) via a discount factor
[
52].
For second-life Li-ion batteries, a CAPEX reduction factor αSL is applied to the energy component to account for the lower cost of repurposed EV battery packs. In the baseline scenario, αSL = 0.5 is assumed, corresponding to a 50% reduction in energy-related CAPEX compared to new Li-ion systems. In sensitivity analysis, αSL is varied within the range [0.4–0.7] to reflect uncertainty in second-life battery costs depending on market conditions and refurbishment processes.
This value reflects typical ranges reported in the literature, where second-life battery costs are reduced due to avoided manufacturing costs but still include expenses related to testing, repackaging, and system integration.
Economic inputs: Import price and export price , where is the feed-in factor. CAPEX is split into energy and power components for batteries, and into electrolyzer/FC/tank for H2. Annual fixed O&M is included.
3.3. System Operation and Sizing Models
We solve a linear program (LP) that co-optimizes power/energy sizing and hourly dispatch over a representative period of T hours, repeated R times to represent the lifetime.
3.3.1. Battery Model
Decision variables: battery energy
C [MWh], charge/discharge power caps
, time-varying charge
, discharge
, grid import
, export
, curtailment
, and state of charge (SoC)
. Dynamics and constraints:
To prevent pure arbitrage grid/export,
. When a duration constraint is imposed,
with
H in hours. Objective (lifetime net present value (NPV) of costs):
where
r is the discount rate and
y(
t) are the calendar year at time
t. Replacements of the energy component are added over the cycle life; a salvage adjustment is applied at the end.
It is important to note that the analyzed technologies are inherently suited for different storage durations. Li-ion and Pb-acid batteries are typically optimized for short- to medium-duration applications, while hydrogen systems are designed for long-duration and seasonal storage. Therefore, the comparison reflects performance under a unified energy delivery basis rather than identical storage durations. This benchmark therefore reflects equivalent delivered service rather than equal nominal storage duration or equal installed storage capacity, which would otherwise bias the comparison in favor of technologies optimized for fundamentally different use regimes.
3.3.2. Hydrogen Model
Decision variables: electrolyzer and FC power caps
, hydrogen storage
, hourly
, and stock
. Hydrogen balance and auxiliaries:
with compression/cooling and standby loads included. Minimum energy duration at the nominal power of the fuel cell is imposed by
. The objective function is analogous to the battery (CAPEX_EL + FC + Tank, O&M, energy costs/revenues).
We use Operator Splitting Quadratic Program (OSQP) (polish, tight tolerances), with automatic fallback to Embedded Cone Solver (ECOS)/Splitting Conic Solver (SCS) on “optimal_inaccurate” warnings.
In contrast to battery systems, hydrogen storage involves multiple sequential energy conversion steps. Electricity is first converted into hydrogen via electrolysis, stored as compressed hydrogen, and later reconverted into electricity using a fuel cell. The reference PtH2P configuration considered here is based on compressed gaseous hydrogen storage; liquefaction is not included because it falls outside the scope of the analyzed stationary system configuration. Each stage introduces efficiency losses and additional auxiliary energy consumption, including compression, cooling, and standby operation.
To ensure comparability with battery-based systems, all conversion losses and auxiliary consumptions are explicitly included in both the dispatch optimization and the life-cycle assessment. This guarantees that the resulting performance metrics (LCOS and GWP) fully reflect the cumulative impact of the entire conversion chain.
Fuel cell performance has a significant influence on the overall efficiency of hydrogen energy storage systems, particularly in bidirectional operation. In practice, the performance of proton exchange membrane fuel cells (PEMFCs) depends on multiple electrochemical parameters and operating conditions, and uncertainty in parameter estimation may lead to deviations between modeled and actual system behavior.
In this context, advanced parameter estimation methods for PEM fuel cell models, such as high-accuracy identification approaches based on voltage modeling, can improve the reliability of performance prediction and system optimization. For example, recent work has demonstrated that improved parameter estimation can significantly enhance the accuracy of PEMFC models and reduce uncertainty in system-level simulations [
53].
In the present study, fuel cell behavior is represented using aggregated efficiency parameters to maintain computational tractability within the optimization framework. However, incorporating detailed parameter estimation and dynamic fuel cell models represents an important direction for future research.
Auxiliary energy consumption in the hydrogen system includes contributions from compression, cooling, and balance-of-plant (BoP) components. These loads are modeled as a combination of load-dependent and constant terms.
Compression energy is assumed proportional to the hydrogen production rate:
where
ecomp [kWh/kg] is the specific compression energy and
is the hydrogen production rate.
In addition, auxiliary electrical loads are modeled as a fraction of device power:
where
kEL and
kFC represent auxiliary load fractions for the electrolyzer and fuel cell, respectively.
A constant standby consumption Pstandby is also included to account for idle system operation.
While auxiliary loads in real hydrogen systems may exhibit non-linear dependence on operating conditions (e.g., part-load efficiency effects and dynamic thermal management), the present formulation adopts a linearized representation to ensure tractability within the optimization framework.
The hydrogen storage pathway (PtH2P) includes all major conversion stages, including electrolysis, hydrogen compression, storage, and reconversion via fuel cells. Energy consumption associated with compression and balance-of-plant components is explicitly included in the model through auxiliary load assumptions.
3.4. Economic Assessment: Discounted LCOS
LCOS is calculated as:
where
. For batteries, replacements are predicted from actual cycles extracted from the optimal solution [
54].
Annual O&M cost is represented in aggregated form as:
where the applicable terms depend on the technology. For second-life battery systems, these terms include battery management, thermal supervision, inspection, and safety-related monitoring. For hydrogen systems, they include scheduled maintenance of fuel cell stacks, compressors, cooling equipment, and other balance-of-plant components.
Under certain market conditions, LCOS may take negative values when revenues from electricity export exceed total discounted costs. In this case, LCOS can be interpreted as net revenue per unit of delivered energy, rather than a pure cost metric.
3.5. LCA and Credits
The net life-cycle emissions are estimated as:
where
. Recycling credit
is set modularly (battery modules/BMS; electrolyzer/FC/tank). Second-life credit
applies to Li-ion only and reflects the substituted “new stationary Li-ion” for equivalent service (system expansion). GWP to FU:
. Additionally, we report Cumulative Energy Demand (CED), acidification potential (AP), eutrophication potential (EP) and abiotic resource depletion (ARD) as sensitivity indicators (calculated consistently with respect to energy imports) [
55,
56,
57].
Second-life lithium-ion batteries are treated using an explicit allocation rule to avoid double counting between the EV and second (stationary) applications [
58,
59]. In the baseline, we adopt an extension/substitution logic: the second-life application receives a credit proportional to the production impact that would be required to provide an equivalent service to a stationary battery, adjusted for the remaining SoH upon reuse, the assumed second-life duration, and a substitution factor reflecting the partial displacement of a new stationary battery [
60]. Formally:
where
α is the share of first-life production impact allocated to the second-life system,
YSL is the second-life duration, u is the utilization factor, and
s is the substitution factor. In the baseline case, the substitution factor is set to
s = 1.0, representing full displacement of an equivalent new stationary Li-ion battery under the system-expansion interpretation. In the sensitivity analysis,
s is varied within the range [0.5–1.0], and alternative allocation rules (cut-off and 50/50 split) are also tested to assess robustness. For recycling, end-of-life impacts are modeled using an explicit recycling credit, representing the avoided primary production of materials recovered at end of life (reported as a negative contribution in the impact breakdown).
All environmental impacts are normalized to the same functional unit (1 MWh of electricity delivered to the load), ensuring equivalence across technologies regardless of internal conversion complexity. For multi-stage systems such as hydrogen storage, all upstream and intermediate energy inputs required to deliver the functional unit are included, thereby preserving functional equivalence and avoiding bias in the comparative assessment.
For transparency, the baseline values and tested ranges for second-life credit parameters are summarized in
Section 4 and
Section 3.7.7, while alternative allocation rules are assessed separately as robustness checks.
3.6. Scenarios and Policy Constraints
To assess techno-economic and environmental performance under realistic operating conditions, we evaluate a structured set of scenarios and enforce policy-relevant constraints directly in the optimization problems. Unless noted otherwise, all scenarios use hourly time series of demand, PV generation, grid carbon intensity, and market prices. Results are reported per FE (1 MWh delivered to the load) over the lifetime horizon.
3.6.1. Scenario Axes
We impose a fixed energy-to-power ratio
H (
h) on batteries:
with
(baseline
H = 4 h). This controls short- vs. long-duration behavior without changing dispatch resolution.
Import prices are scaled by a multiplier
to reflect low/high wholesale conditions. Export prices follow a feed-in factor
f relative to import:
We vary the real discount rate while keeping a nominal energy price escalation of 5% unless otherwise stated.
Sensitivity of electrolyzer and FC performances: . The auxiliary loads (compression/Balance of Plant (BoP)) are included.
We distinguish recycling credit and second-life credit for Li-ion. Credits are modeled as avoided burdens and reported explicitly in the LCA breakdown, independent of the operational emissions.
We consider symmetric export = import pricing (f = 1), penalized export (f < 1), and premium export (f > 1), to mimic net-billing and feed-in-tariff variants.
3.6.2. Operational Constraints
Energy balance holds each hour for every technology. No grid-arbitrage: grid import cannot be directly re-exported in the same interval (prevents fictitious profits).
Export capacity limit: , when applicable.
Minimum self-consumption:
with
α {0.6, 0.8} by scenario.
A curtailment variable is allowed and penalized only through lost revenue; no explicit curtailment cost is assumed.
Battery SoC dynamics include charging/discharging efficiencies; SoC bounds are hard, and an optional cyclic condition is tested for robustness.
A battery duration constraint (when sweeping H) is enforced as an equality linking energy and discharge power.
Hydrogen storage duration: a minimum discharge hours constraint may be imposed, , ensuring seasonal or multi-day capability where relevant.
Auxiliary power for electrolyzer/fuel cell and standby consumption are modeled explicitly.
3.6.3. Baseline and Reporting
The baseline case uses H = 4 h (batteries), f = 1.0, r = 7%, . Outputs include LCOS (discounted cash flow (DCF) with replacements/salvage), GWP with category contributions (production, transport, operation, O&M, EoL) and explicit recycling and second-life credits, plus an operational key performance indicator (KPI) (round-trip efficiency, autonomy share, PV self-consumption/export/curtailment, losses). Comparisons are presented as heatmaps (LCOS background with GWP contours) across the price–duration and feed-in–discount planes, and as bar panels for key KPI.
Export price and network charges: The export remuneration is modeled via a feed-in factor applied to the import price time series, i.e., . In the baseline scenario we use , representing a conservative export compensation relative to retail import prices. To reflect grid service charges, a volumetric network fee is applied to imported electricity (and optionally to exported energy depending on the regulatory interpretation). In the baseline, is added to imports. All monetary results are reported in real BGN.
To prevent artificial profitability through pure grid-to-grid arbitrage, the optimization enforces an explicit constraint that export cannot exceed on-site generation and/or storage discharge. For batteries, export is limited to PV surplus after serving the load and charging, while grid import is restricted to supplying the load and charging only. An analogous constraint is applied to the H2 system. This avoids loopholes in which the optimizer could buy from the grid and resell at comparable prices.
Negative LCOS values may occur only under tariff configurations in which discounted export revenues exceed the discounted sum of CAPEX, OPEX, and import costs over the system lifetime. Because this outcome is policy driven rather than physically intrinsic to the storage technologies, the baseline uses conservative export remuneration and network charges. In addition, a no-export-revenue LCOS variant is reported as a robustness check.
This design isolates the mechanisms behind cost convergence (e.g., fixed-cost dilution in long-duration hydrogen) while keeping policy levers (export pricing, minimum self-consumption) transparently embedded in the optimization.
3.7. Sensitivity and Robustness Checks
To quantify how modeling choices and uncertain inputs affect the results, we implement a multi-layer sensitivity and robustness protocol that combines local elasticities, global multi-factor sweeps, stochastic resampling, and solver/constraint diagnostics. All checks are performed on the full optimization workflow so that interactions between sizing, dispatch, economics, and LCA are preserved.
In addition to techno-economic parameters, policy-related variables can significantly influence system performance. Carbon pricing, for example, directly affects the effective cost of grid electricity and associated emissions, which is particularly relevant for hydrogen systems due to their higher energy intensity. An increase in carbon price would penalize energy-intensive pathways, potentially improving the relative competitiveness of high-efficiency storage technologies.
Similarly, regulatory requirements for minimum recycled material content can influence both environmental and economic performance. Higher recycled content targets may favor technologies with established recycling infrastructure, such as Pb-acid batteries, while introducing additional uncertainty for Li-ion systems depending on battery chemistry and recycling process efficiency.
3.7.1. Local (One-at-a-Time) Elasticities
For each scalar input
x we compute the normalized elasticity of an output metric
y ∈ {LCOS, GWP}:
using symmetric ±10% perturbations around the baseline
x0. Reported parameters:
Economics: CAPEX (energy/power for batteries; EL/FC/tank for H2), operating expenditure (OPEX), discount rate r, price escalation.
Operation: charging/discharging efficiencies (Li-ion/Pb-acid), , auxiliary loads, standby.
Circularity: recycling rates and second-life credit magnitude (share of packs eligible × avoided production burden).
Use case: C/P duration H, feed-in factor f, minimum self-consumption α.
We rank and visualize with a tornado plot (separate for LCOS and GWP).
3.7.2. Global Multi-Factor Sweeps
We run structured grids to capture interactions: battery duration × price level, H ∈ [2, 8] h × price multiplier mp ∈ [0.6, 1.3] (export = fimp). Output: heatmap with LCOS background and GWP contours for Li-ion and Pb-acid. Feed-in × discount rate, f ∈ [0.6, 1.1], r ∈ [3%, 15%] for all technologies. Output: three juxtaposed heatmaps (Li-ion, Pb-acid, H2). H2 performance space, . LCOS/GWP bivariate response, Pareto overlay to identify economic frontiers.
For each grid we compute fractions of cases where a technology is cost-preferred (min LCOS), impact-preferred (min GWP), and joint-preferred (non-dominated). These shares are reported to indicate domain robustness, not single-point optimality.
3.7.3. Stochastic Uncertainty and Data Robustness
To account for input uncertainty despite the limited measurement horizon, we generate 1000 synthetic annual profiles of load, PV generation, and electricity prices using block bootstrap resampling of contiguous weekly segments from the measured dataset. The optimization is solved for each draw, and the 5th, 50th, and 95th percentiles of LCOS and GWP are reported for each technology. Additional robustness checks include zero-mean autoregressive perturbations of import prices, calibrated to historical intraday variability, and adverse stress scenarios in which PV generation is reduced by 30% and peak load is increased by 20% for 10 consecutive days. Export remuneration follows the feed-in factor f.
3.7.4. Degradation and Circularity Sensitivity
Battery life and replacements: vary cycle life ±30% and depth-of-discharge constraints, propagate to replacement schedule and salvage.
Second-life uptake: vary the share of EV packs eligible for second-life (0–100%) and the associated credit (avoided production × residual life factor).
Recycling: vary recovery rates and credit allocation (substitution vs. cut-off) to bracket LCA method choices.
H2 stack and BoP: impose annual efficiency fade (0–1%/yr) and auxiliary growth (0–0.5%/yr) and quantify LCOS/GWP impact.
3.7.5. Constraint and Solver Diagnostics
All runs enforce feasibility checks and solver cross-validation, No-arbitrage and minimum self-consumption constraints are monitored via max residuals; runs with residuals >10 −6 (in native units) are flagged.
We solve each problem with OSQP and fall back to ECOS/SCS if necessary; we record residuals and state codes using the Karush-Kuhn-Tucker (KKT) method. The results presented in the paper use solutions with primal/dual residuals < 10−5; otherwise, they are excluded from the summary statistics.
Cyclic boundary test: re-solve with to ensure results are not artifacts of boundary conditions.
3.7.6. Robust Preference Statements
Where we claim a technology advantage (e.g., Li-ion favored at short duration), we verify the advantage holds in ≥70% of bootstrap resamples, remains under the top-3 elasticities varied to their adverse ends, and persists after excluding export revenues from LCOS (conservative net-billing view).
3.7.7. Second-Life Uncertainty Analysis
To account for uncertainties specific to second-life lithium-ion batteries, an additional sensitivity analysis is performed focusing on degradation-related and operational parameters. The following factors are varied: residual state-of-health at second-life entry, SoH ∈ [0.7, 0.9]; second-life duration, YSL ∈ [5, 10] years; round-trip efficiency, perturbed by ±5% to reflect chemistry-dependent performance differences, including those between LFP and NMC systems; cycle life, varied by ±30%; and utilization factor, u ∈ [0.7, 0.95].
These variations are propagated through the optimization and life-cycle assessment calculations to evaluate their influence on both the levelized cost of storage (LCOS) and the global warming potential (GWP) results.
To represent recombination-induced heterogeneity in second-life battery packs, an additional robustness treatment is introduced in which effective lifetime is reduced by up to 30%, round-trip efficiency is perturbed by ±5%, and replacement frequency is increased relative to the baseline. Although this parameterization does not resolve cell-level degradation dynamics explicitly, it provides a tractable system-level proxy for mismatch-driven aging, imbalance effects, and reliability-related derating in repurposed battery systems.
The results indicate that second-life uncertainties can lead to variations of approximately 10–25% in LCOS and 5–15% in GWP, depending on the parameter combination considered. Nevertheless, the relative ranking of the technologies remains stable in most tested scenarios, indicating that the overall comparative conclusions are robust despite uncertainty in second-life battery behavior.
3.7.8. Policy Sensitivity: Carbon Price and Recycled-Content Constraints
To evaluate the influence of policy-related uncertainty on the comparative performance of the analyzed storage technologies, an additional sensitivity analysis is performed considering two policy variables: carbon price and recycled-content requirements. These factors are particularly relevant because they can affect both the economic and environmental performance of battery and hydrogen-based storage systems.
Carbon price is varied in the range of 0–150 EUR/tCO2_22e to represent different regulatory conditions associated with greenhouse gas emissions. In the model, this parameter is introduced as an additional cost associated with grid electricity consumption, thereby affecting technologies with higher electricity demand per delivered unit of energy, particularly power-to-hydrogen-to-power systems.
In parallel, recycled-content requirements are represented through a technology-specific compliance factor reflecting the economic and environmental implications of using secondary raw materials. This factor is applied as an additional scenario-based adjustment to material-related cost and recycling credit assumptions. The objective is not to reproduce a specific regulatory scheme, but rather to test the robustness of the comparative results under plausible circular economy policy constraints.
The policy sensitivity analysis shows that higher carbon prices disproportionately penalize electricity-intensive pathways, especially PtH2_22P systems, due to conversion losses and the associated upstream electricity demand. By contrast, stricter recycled-content requirements tend to improve the relative position of technologies with mature recycling chains, particularly lead-acid batteries, while the effect on lithium-ion batteries remains chemistry-dependent because of the differences between NMC- and LFP-based recovery pathways.
Overall, although policy variables modify the absolute LCOS and GWP values, they do not alter the main comparative conclusions of the study in the majority of tested scenarios. These findings indicate that the ranking of the considered storage technologies remains robust under a broad range of plausible regulatory conditions. These policy scenarios are treated as robustness checks rather than as deterministic forecasts of future regulation.
3.8. Software and Reproducibility
The implementation is in Python 3.10. The script reads comma-separated value (CSV)/Excel input data, writes aggregated CSV tables and figures, and exposes all scenario data as machine-readable files. A configuration file fixes package versions and parameters for reproducibility.
Second-life Li-ion batteries are modeled as repurposed EV packs entering a stationary service phase with remaining capacity quantified by the end-of-EV state of health (SoH_end). Circularity benefits are accounted for via explicit credits reported separately from the production, transport, operation, O&M and end-of-life contributions. In the base case, we adopt a system-expansion approach whereby second-life deployment substitutes a fraction of new stationary storage production, controlled by a substitution ratio and adjusted for utilization and second-life duration. Refurbishment is treated as an additive burden (testing, reconfiguration and logistics) and is included to avoid over-crediting. A cut-off allocation is additionally tested in sensitivity analysis, where no avoided-production credit is assigned to second-life packs.
The present framework does not explicitly model electrochemical micro-health parameter identification during the repurposing stage; instead, second-life suitability is represented at system level through scenario-based assumptions on residual SoH, usable lifetime, and second-life credits. Incorporating micro-health-aware screening and regrouping models would improve the realism of second-life battery qualification and is identified as an important extension of the proposed workflow.
Degradation effects in hydrogen system components (electrolyzer and fuel cell) are represented at an aggregated level through efficiency and lifetime parameters, rather than detailed electrochemical degradation models.
The impact factors used for calculating CED, AP, EP, and ARD are summarized in
Table 1. These factors are based on literature values and represent simplified proxies derived from typical electricity mix characteristics. They are applied consistently across all technologies to ensure comparability. While this approach provides a transparent and computationally efficient estimation, full integration with detailed LCA databases (e.g., ecoinvent or ELCD) is identified as future work. The selected values correspond to typical European electricity mix conditions. Exact values may vary depending on electricity mix and database selection.
The values in
Table 1 are used as simplified proxy coefficients for comparative screening purposes and should not be interpreted as technology-specific inventory factors from a full process-based LCA database.
3.9. Conceptual Framework and Analytical Structure
To improve the interpretability of the proposed methodology, a conceptual framework is introduced to explicitly describe the model-based relationships between the main variables and modeling components.
The system is structured around three main layers:
Input layer: This includes exogenous variables such as photovoltaic (PV) generation, load demand, and electricity market prices.
Decision layer: Based on these inputs, an optimization-based dispatch model determines the optimal charging/discharging schedules and grid interactions for each storage technology.
Outcome layer: The resulting energy flows define both economic and environmental performance through LCOS and LCA calculations.
The key model-implied relationships can be summarized, as PV generation and load profiles determine the availability of surplus or deficit energy. Market prices influence the economic attractiveness of charging or discharging actions. The optimization model translates these inputs into operational decisions. These decisions define energy exchanges with the grid and storage cycling. Energy flows directly determine total costs (LCOS) and environmental impacts (GWP, CED, etc.).
Thus, LCOS and LCA indicators are not independent metrics but are jointly determined by the dispatch decisions within the model structure, which in turn depend on system inputs and constraints.
This structured representation ensures that all analytical components are coherently linked within a unified framework aligned with the central research question.
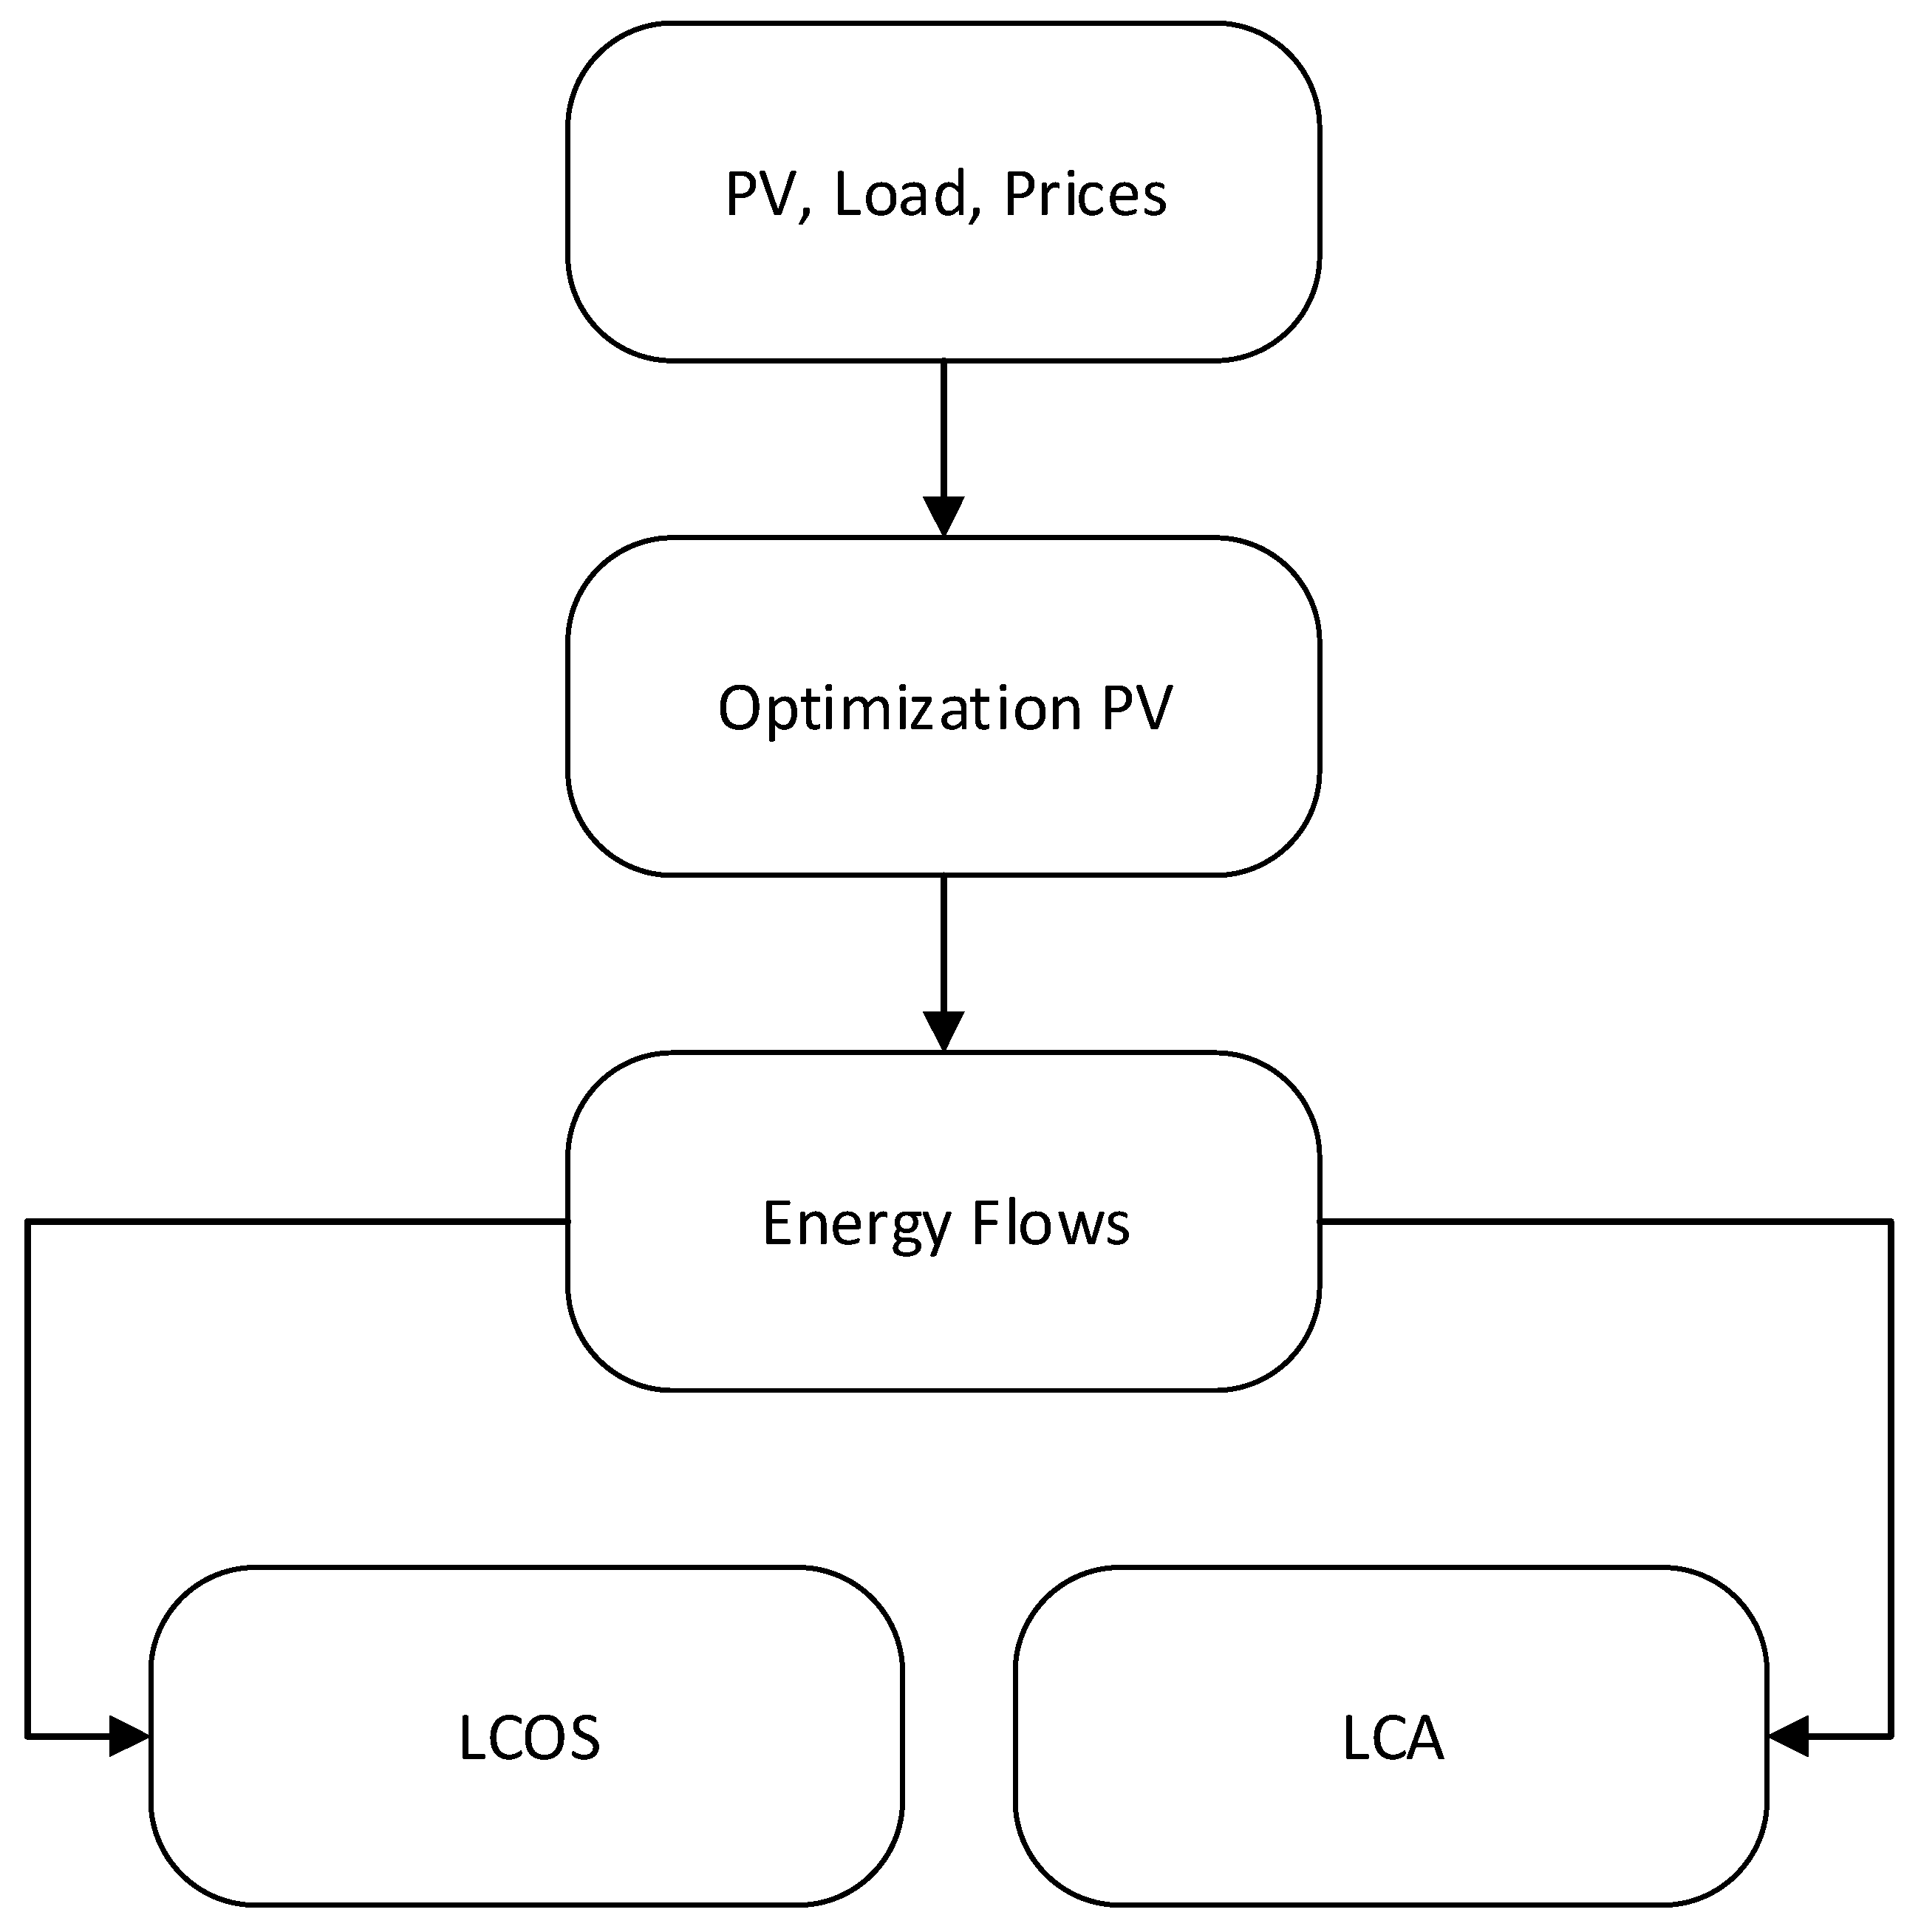
Figure 1 illustrates the conceptual model of the proposed framework. The diagram shows the analytical flow from input variables (PV, load, prices) to optimization-based dispatch decisions, followed by energy flows and resulting techno-economic (LCOS) and environmental (LCA) outcomes.
The figure highlights that both economic and environmental indicators are derived from the same operational decisions, ensuring methodological consistency.
The causal relationship between operational decisions and performance metrics can be formally described within the proposed framework. Specifically, the techno-economic and environmental indicators are expressed as functions of the resulting energy flows. LCOS is defined as a function of the energy flow vector, CAPEX, OPEX, and system lifetime, while GWP is formulated as a function of the same energy flows and the corresponding emission factors. In this context, the energy flow vector Eflow represents the central linking variable between system operation and performance outcomes. It is determined by solving an optimization problem, where the objective is to minimize the total cost function subject to system constraints, including power limits, state-of-charge dynamics, and energy balance conditions. Consequently, both economic and environmental performance indicators are not independent quantities but are derived from the optimal dispatch decisions within the proposed analytical framework, which are themselves driven by input conditions such as photovoltaic generation, load demand, and electricity market prices.
3.10. Variable Definition and Operationalization
To improve conceptual clarity, the main variables in the proposed framework are categorized into three groups: independent (input) variables, decision variables, and dependent (output) variables.
Independent variables represent exogenous inputs to the system and are not controlled by the optimization model. These include PV generation, load demand, and electricity market prices, all represented as time-series data.
Decision variables are determined by the optimization model and define the operational behavior of the storage system. These include charging and discharging power, grid import/export, and the SoC trajectory of the storage system. These variables are obtained by solving the optimization problem under system constraints.
Dependent variables correspond to performance indicators derived from the resulting energy flows. These include techno-economic metrics such as LCOS and environmental indicators such as GWP, CED, AP, and EP. These variables are computed in post-processing based on the optimized dispatch results.
The key linking construct in the model is the energy flow vector, which connects decision variables to performance outcomes. In this way, the framework ensures a clear analytical structure linking inputs, decisions, and economic and environmental results. This classification ensures a clear separation between exogenous drivers, control variables, and outcome indicators.
3.11. Control Variables and Model Assumptions
To ensure a consistent and unbiased comparison across storage technologies, a set of control variables is defined and kept consistent across all scenarios. These variables represent key drivers of system performance and are selected based on their known influence on both economic and environmental outcomes.
The main control variables include electricity price profiles that determine the economic value of charging and discharging solutions, feed-in tariff levels that affect export revenues and overall system profitability, the discount rate that affects the present value of costs and revenues in LCOS calculations, and the energy-to-power ratio (C/P) that determines storage duration and operational flexibility.
These variables are chosen because they capture the dominant external conditions affecting storage system performance, while allowing for a fair comparison between technologies with different physical characteristics.
Potential confounding factors, such as degradation variability, second-life uncertainty, and auxiliary energy consumption, are not treated as fixed control variables but are instead explored through sensitivity analysis and scenario variations. This approach ensures that the results reflect a range of realistic operating conditions rather than a single deterministic configuration.
Overall, this combination of fixed control variables and sensitivity-based analysis provides a balanced approach between model tractability and robustness of conclusions.
4. Technical Description of the Systems
This section describes the three storage systems modeled in this work, second-life Li-ion, Pb-acid and hydrogen (H
2: electrolyzer–tank–fuel cell), and the simulation scenarios used for their techno-economic and environmental comparison. The description follows the modeling framework already presented in
Section 3 (sizing and dispatching based on LP, DCF-LCOS and cradle-to-grave LCA with explicit recycling and second-life credits) and clarifies the physical meaning of the decision variables, component interactions and scenario controls used in the numerical experiments.
Table 2 summarizes the dataset provenance, functional unit (FU), and financial assumptions. All time-series signals are processed at hourly resolution and are used consistently within the dispatch optimization and subsequent LCOS/LCA post-processing.
4.1. System Architectures and Energy Flow Logic
All systems are evaluated in a grid-connected configuration coupled with photovoltaic generation and driven by the same hourly time series of load Pload(t) and PV generation Ppv(t), using a time step of Δt = 1 h. At each hour, electricity demand must be satisfied through a combination of direct PV supply, discharge from the storage system, and grid imports. Any excess PV generation is either curtailed or exported to the grid, depending on the scenario settings.
Table 3 presents the technology-specific model parameters, sizing limits, input costs and aggregated LCA inventory conditions used to calculate the GWP of FU. Recycling and secondary life credits are applied as negative contributions, ensuring transparent accounting of the benefits of the circular economy.
The optimization jointly determines both the component sizes and their dispatching during the period, and the resulting period is repeated to represent the performance over the entire life cycle.
We use a total FU of 1 MWh of electricity delivered to the load over the entire life cycle, ensuring that the environmental and economic performance remains comparable between the different technologies.
4.2. Battery-Based Systems: Li-Ion and Pb-Acid
4.2.1. Components and Variables for Sizing
Both battery technologies are represented by the same structural model, differing only in the parameterization efficiency, DoD and cost assumptions. The battery system includes:
The battery sizing is performed endogenously within user-defined limits, allowing the LP to choose the optimal combination of energy and power for the given scenario.
4.2.2. Variables and Constraints for Dispatching Services
The hourly decision variables include charging power Pch(t), discharging power Pdis(t), grid import Pgrid(t), export Pexp(t), limitation Pcurt(t) and state of charge SoC(t). The battery dynamics are driven by:
SoC evolution (charging/discharging efficiency ηch, ηdis);
SoC limits 0 ≤ SoC(t) ≤ C;
Power limits 0 ≤ Pch(t) ≤ Pch,cap, 0 ≤ Pdis(t) ≤ Pdis,cap;
Hourly energy balance between load flows, PV systems, grid and storage;
No-arbitrage constraint to prevent artificial grid-to-export profit (grid imports cannot be immediately re-exported without serving load/charging needs).
An optional cyclic condition SoC(T) = SoC(0) is applied to avoid boundary artifacts in the simulated period, and policy constraints may limit the export power or impose a minimum self-consumption of PV batteries.
4.2.3. Second-Life Modeling for Li-Ion Batteries
The Li-ion case represents electric vehicle packs reconfigured for stationary operation. In the technical model, the second life is reflected primarily through modified economic parameters, such as reduced capital costs for the energy component compared to new Li-ion batteries and an explicit second-life credit in the LCA, parameterized by residual state and second-life usage assumptions. The operational LP remains identical, ensuring that performance differences arise from realistic parameter changes and not from structural modeling.
4.3. Hydrogen System: Electrolyzer–Tank–Fuel Cell (H2)
4.3.1. Components and Sizing Variables
The hydrogen storage chain is represented as a power-to-gas-to-power system with three main sizing variables:
Electrolyzer capacity PEL,cap [kW];
Fuel cell capacity PFC,cap [kW];
Hydrogen storage capacity mcap [kg].
Hydrogen conversion uses the lower heating value (LHV) of H2 and constant conversion efficiencies ηEL and ηFC.
4.3.2. Dispatching Variables and Constraints
The hourly dispatching includes electrolyzer power PEL(t), fuel cell power PFC(I), grid import/export, curtailment and hydrogen stocks m(t). The hydrogen mass balance is implemented as:
Production power proportional to electrolyzer input;
Consumption power proportional to fuel cell output;
Tank limits 0 ≤ m(t) ≤ mcap.
The balance equations also include auxiliary loads, plant balance fractions, compression electricity produced per kg H2 and optional reserve consumption. These additions are crucial because they increase the effective energy input to the grid and strongly influence both LCOS and life-cycle impact.
A minimum duration constraint is introduced to ensure that the tank provides a certain number of hours of discharge at the nominal power of the fuel cells, useful for studying the storage behavior under long-term/seasonal storage.
4.4. Design of the Scenarios Used in the Simulations
To compare the technologies under steady-state conditions while revealing key trade-offs, the simulations use a structured set of scenario controls. A battery duration constraint is introduced, H = C/P (hours), imposed by coupling the energy capacity and the discharge power, to ensure short- to medium-term behavior while keeping the dispatch resolution unchanged. Scaling of import price and export price is defined by preferential feed-in factor f to import price, representing net billing/preferential financing policy options. Discount rate ranges used in DCF-LCOS price escalation scenarios for electricity costs can be included. Electrolyzer and fuel cell efficiencies ηEL, ηFC and auxiliary consumption assumptions: optional export restrictions and minimum self-consumption requirements implemented as linear constraints to remain compatible with LP/QP solvers.
The same time series, boundary conditions and reporting definitions are applied across all scenarios, ensuring that observed differences arise from the technological characteristics and scenario parameters and not from inconsistent modeling assumptions.
The analysis is based on a case study using real measured time-series data from a single site. While this approach enables detailed and realistic modeling of system behavior, it does not represent a statistically sampled population. Therefore, the results should be interpreted as representative of a specific class of applications (small and medium-sized enterprises with PV systems), rather than as universally generalizable outcomes. Accordingly, the findings should be interpreted as analytical case-study evidence for a defined application class, rather than as population-level statistical inference. Site-specific characteristics, such as load profile, solar resource, and market conditions, may influence the results.
5. Results and Comparison
In this section, we present the quantitative results of the optimization framework for the three storage technologies considered (Li-ion, Pb-acid and H2), evaluated on a real hourly load profile and photovoltaic generation. We first show the dimensionality and operational energy flows to the load (PV → Load, Storage/FC → Load, Grid → Load), then compare the techno-economic efficiency via discounted LCOS and the climate footprint via GWP per functional unit. We complete the environmental picture with CED, ARD, AP and EP, as well as a circularity indicator (CP), accompanied by operational metrics (round-trip efficiency (RTE), autonomy). Finally, we separate the recycling and second-life contributions as separate credits to distinguish the end-of-life effect from production and operational emissions, and synthesize a comparison across all criteria.
To improve transparency and reproducibility, this section reports not only headline indicators (GWP and LCOS) but also the underlying contributions that drive them. First, we summarize the operational energy pathways (PV-to-load, storage-to-load, and grid-to-load) and the magnitude of circularity-related credits (recycling and second-life). Next, we present the net GWP and LCOS across technologies, followed by supporting breakdowns that separate life-cycle phases (production, operation, end-of-life) and economic components (CAPEX, O&M, import cost, export revenues, and replacements). Finally, we provide a concise robustness note to contextualize point estimates under tariff and parameter variability.
These results are consistent with the conceptual framework, where performance metrics are determined by optimization-driven energy flows under given input conditions. This alignment between model structure and observed outcomes supports the internal consistency of the proposed framework.
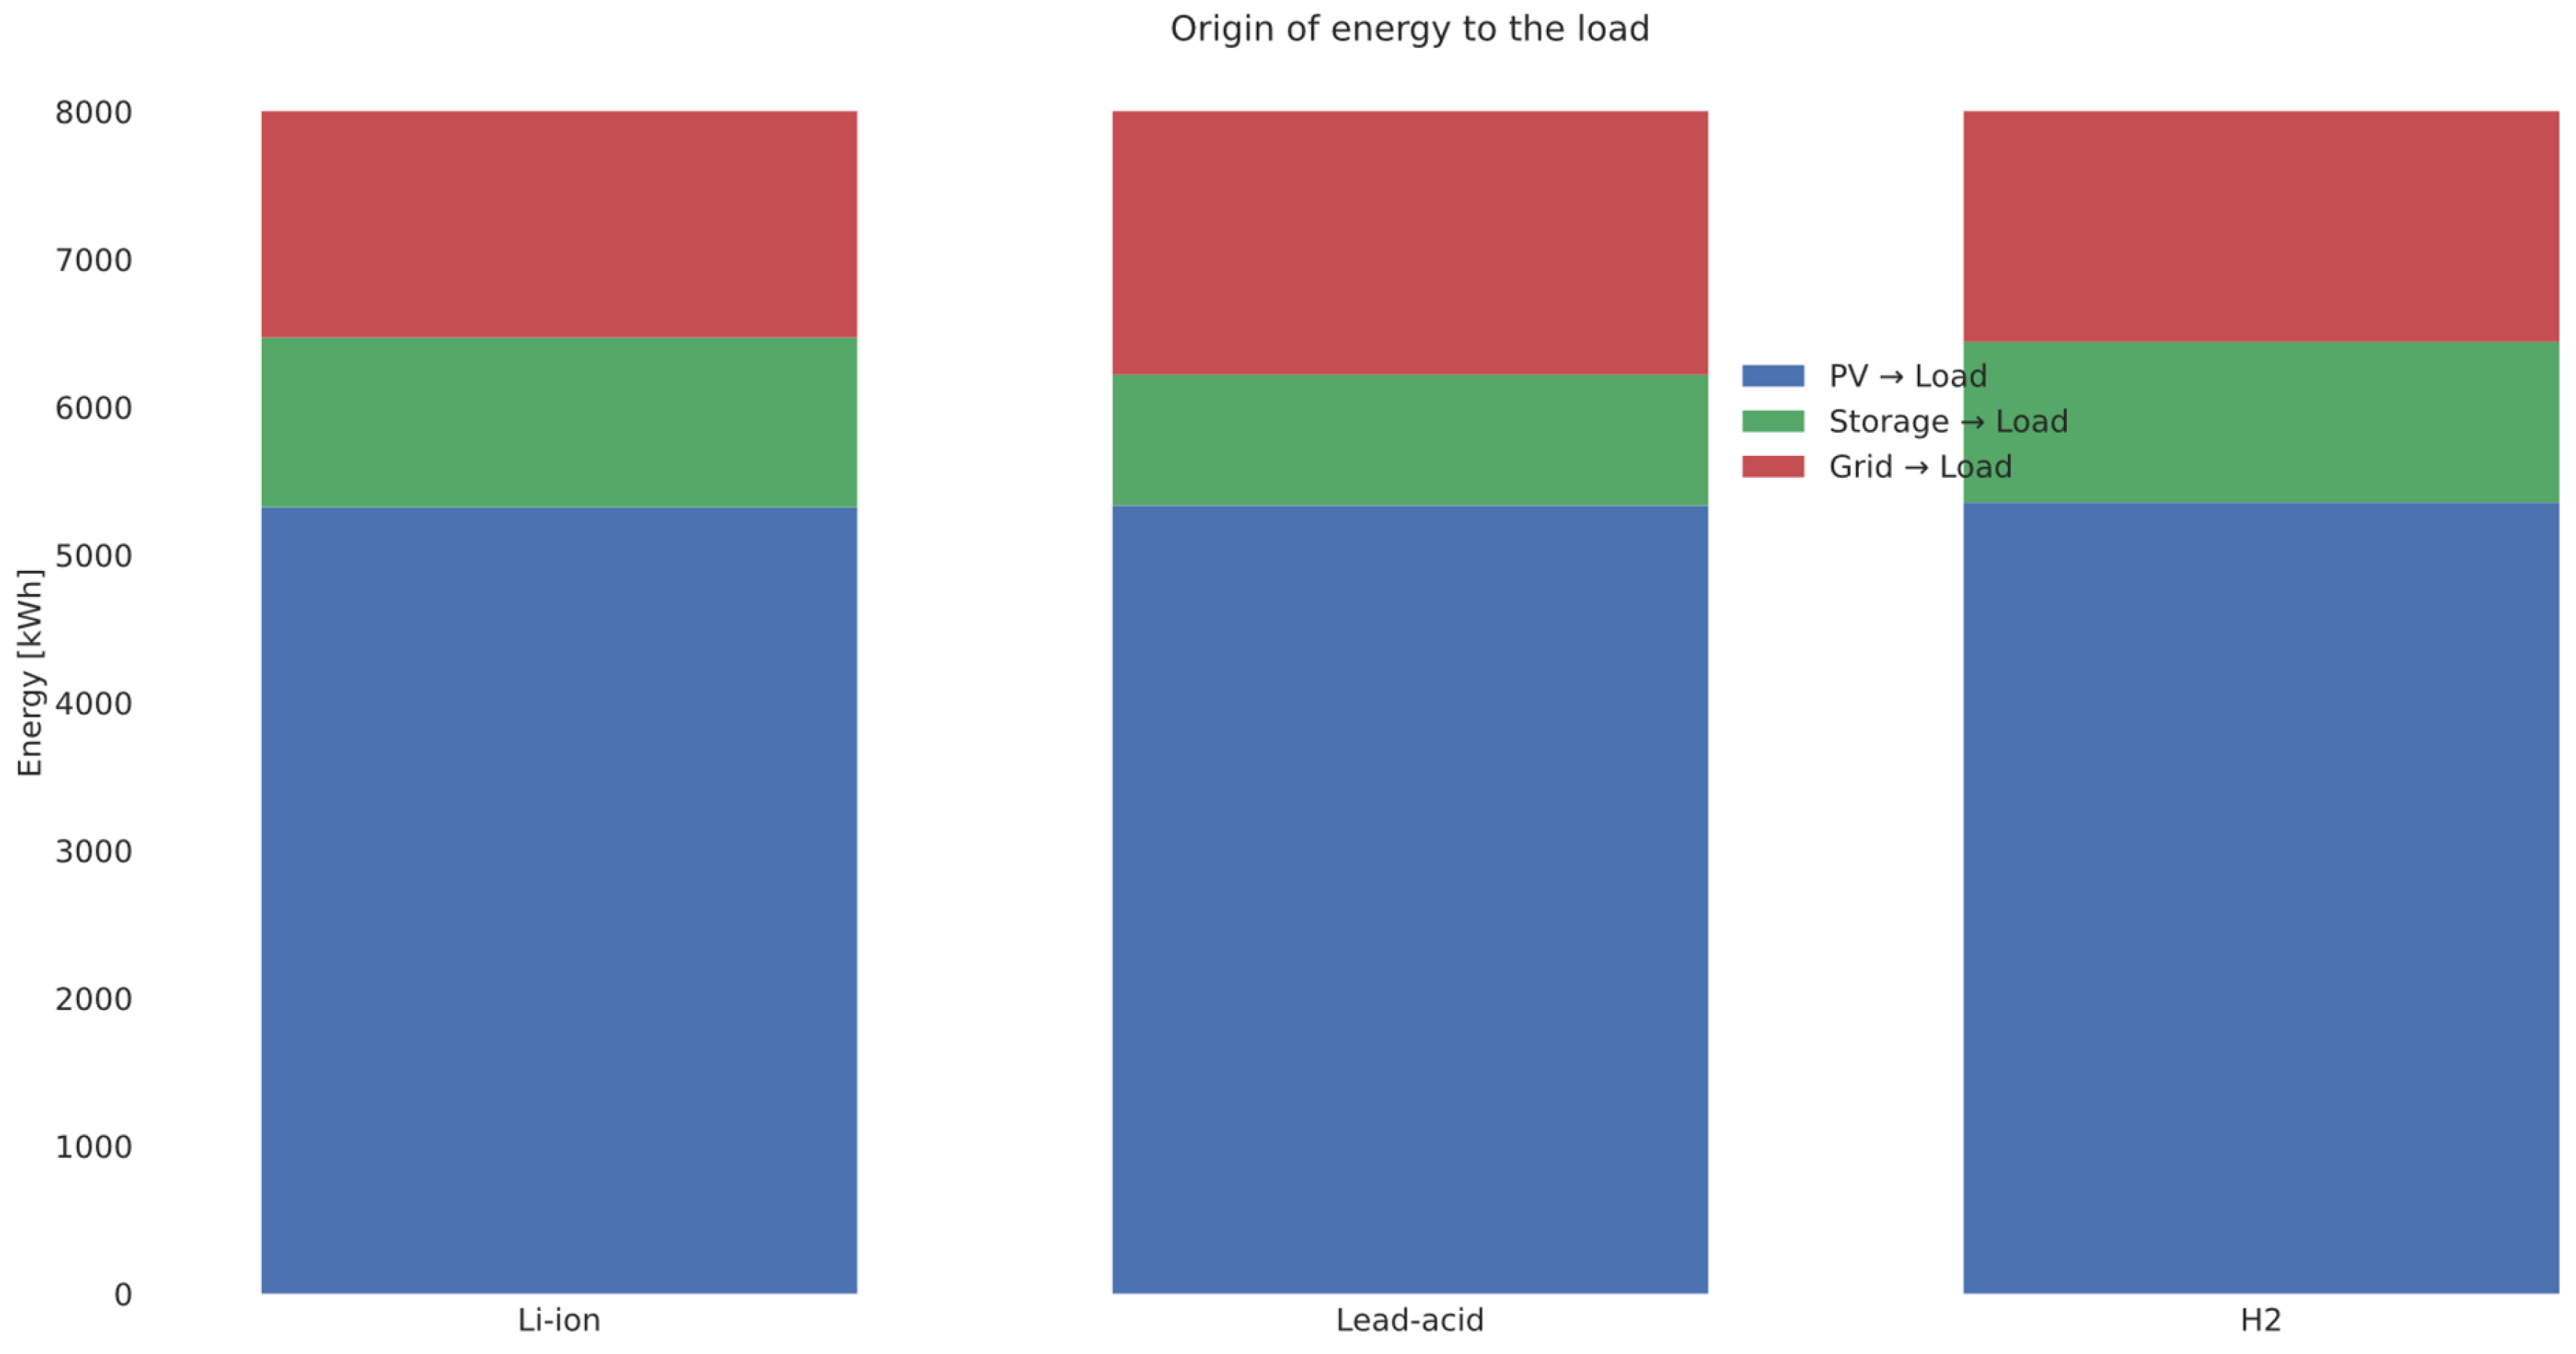
Figure 2 presents the three technologies (Li-ion, Pb-acid and H
2) that distribute the total energy to the load into three components: PV → Load, Storage/FC → Load and Grid → Load. This shows what share of the demand is covered directly by photovoltaics, what share is “shifted” in time by storage and what remains to be supplemented by the grid.
The optimization gives a similar baseline PV supply for the three scenarios; Li-ion demonstrates the largest contribution of storage to the load (higher RTE), Pb-acid the smallest green segment (limited efficiency/depth of discharge), while H2 has an intermediate contribution of FC to the load, but a similar residual share from the grid due to its own consumers and conversion losses.
The terms ‘production offsets’ and ‘fixed offsets’ refer to dispatch-independent life-cycle burdens (manufacturing, transport, O&M, and end-of-life). Their numerical values and sources are explicitly reported in
Table 2 to ensure full traceability.
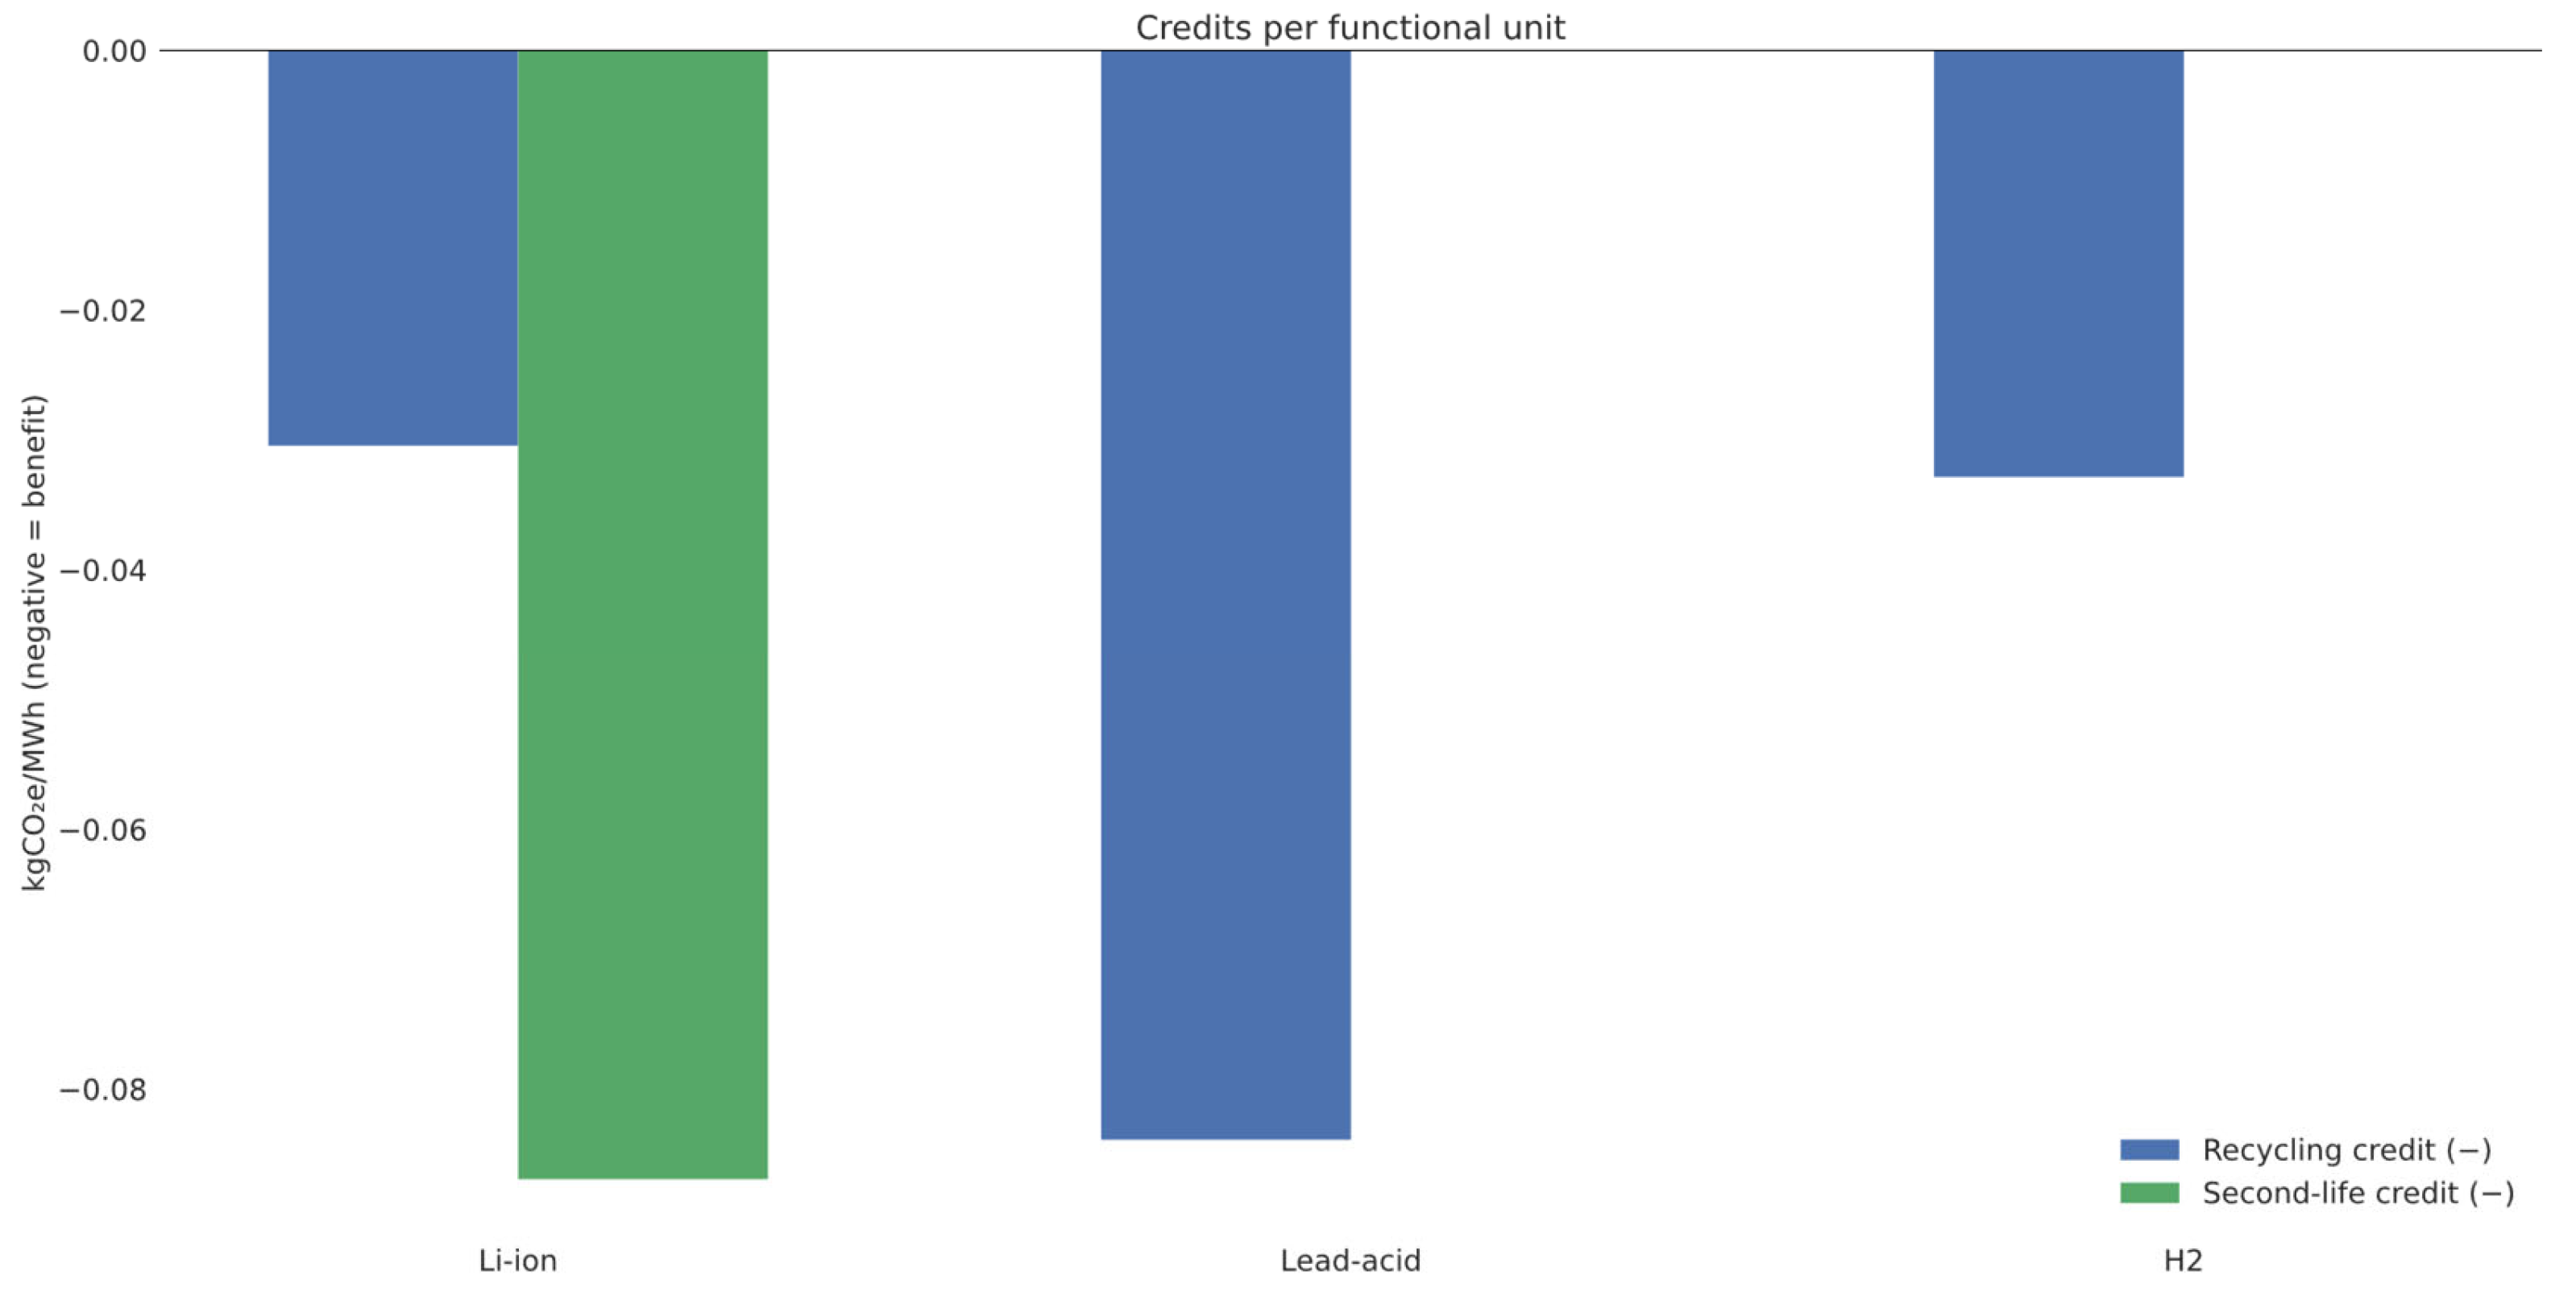
Figure 3 compares the three technologies with two separate life-cycle credits per unit of energy delivered: recycling credit and second-life credit. Li-ion receives both types of benefits: a moderate recycling credit (~−0.03 kgCO
2e/MWh) and a larger second-life credit (~−0.09 kgCO
2e/MWh) due to the reuse of EV modules in stationary applications. Pb-acid shows a significant recycling credit (~−0.084 kgCO
2e/MWh) but no second-life credit. H
2 has a small recycling credit (~−0.033 kgCO
2e/MWh) and no second-life credit.
Figure 2 makes clear the contribution of end-of-life strategies to the overall GWP: reuse for Li-ion enhances the decarbonization effect beyond recycling, while recycling dominates for Pb-acid, and the benefit for H
2 is limited.
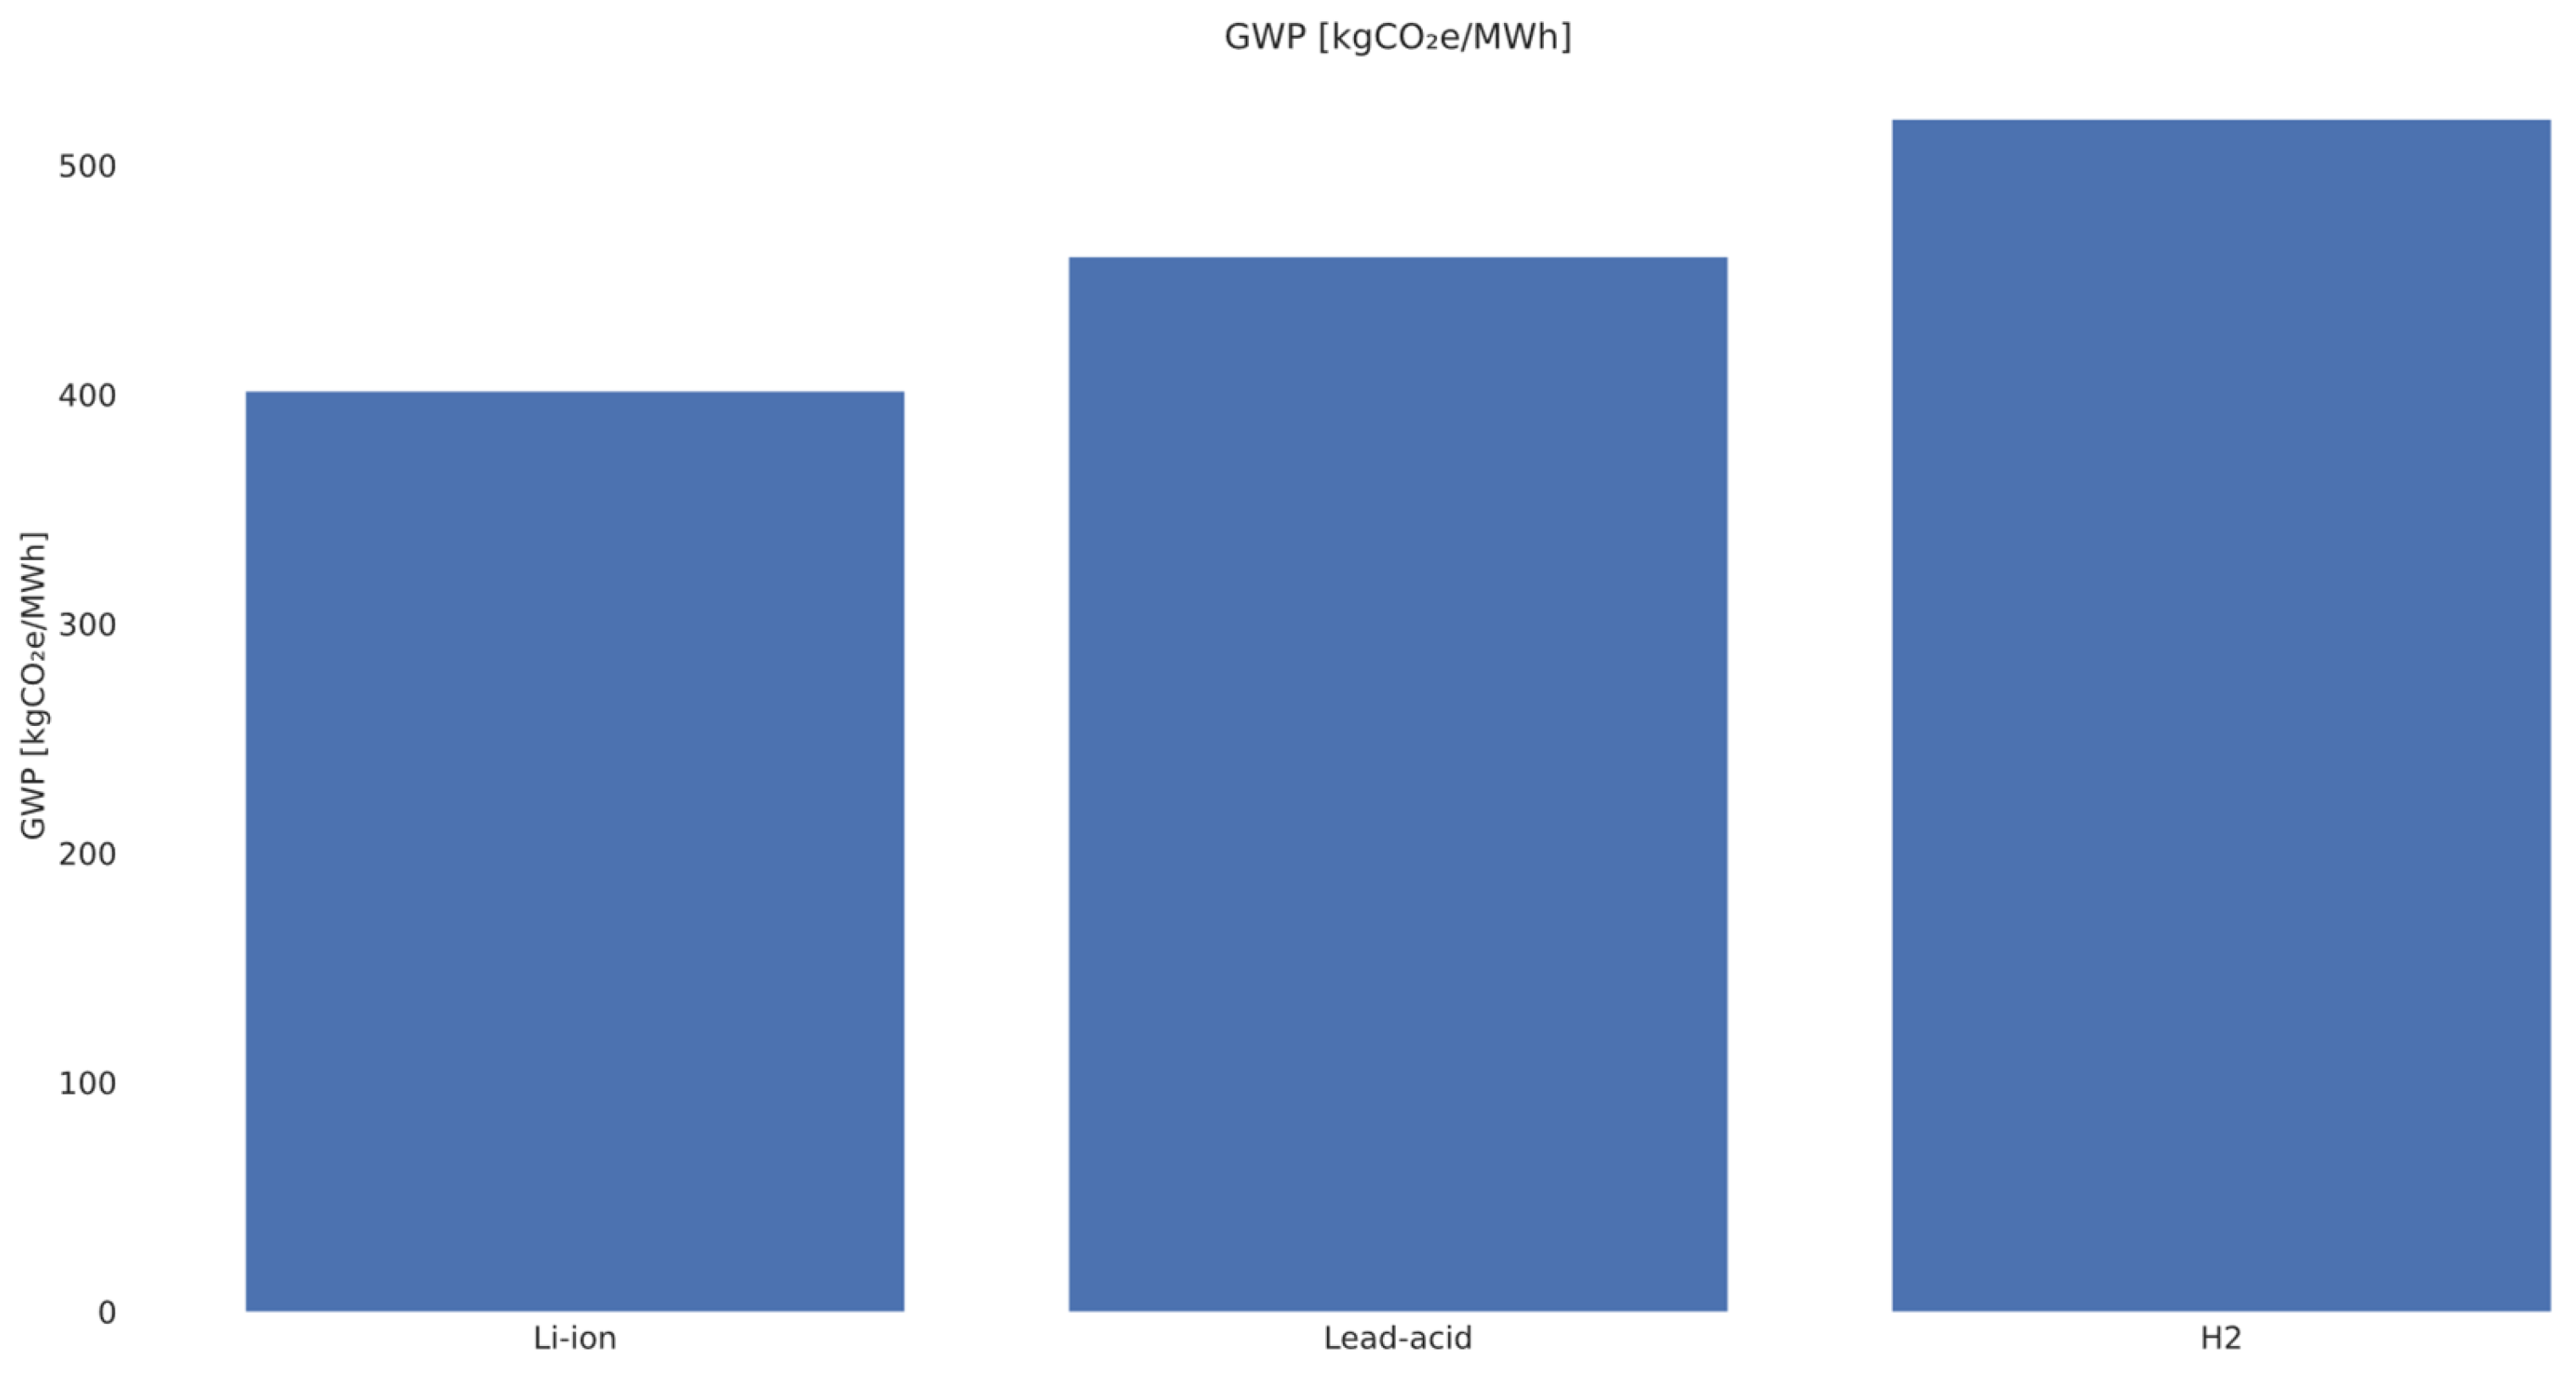
Figure 4 compares the life-cycle emissions per unit of energy supplied. The results for the baseline scenario are ordered as follows: Li-ion ≈ 401 kgCO
2e/MWh < Pb-acid ≈ 460 kgCO
2e/MWh < H
2 ≈ 520 kgCO
2e/MWh. Li-ion has the lowest GWP, as the high RTE and available end-of-life credits (recycling + second-life) reduce the emission intensity of the energy supplied. Pb-acid is higher than Li-ion due to its lower RTE and higher operational emissions, despite the significant recycling credit. H
2 shows the highest GWP, dominated by electricity imports for electrolysis and additional auxiliary consumers; the recycling credit is limited and the second-life credit does not apply.
Figure 3 synthesizes the net effect of production, operation and credits, clearly showing that under the assumptions considered, Li-ion is the most favorable from a GWP perspective.
As
Figure 4 reports net GWP values,
Table 2 provides the phase-level breakdown that supports interpretation. In the baseline configuration, the operational component linked to grid electricity dominates the net footprint for all technologies, while the magnitude of recycling and second-life credits remains comparatively small on a per-MWh basis. This breakdown is important because it makes explicit whether observed differences between technologies stem primarily from operational electricity needs (and associated emission factors) or from upstream manufacturing and end-of-life assumptions.
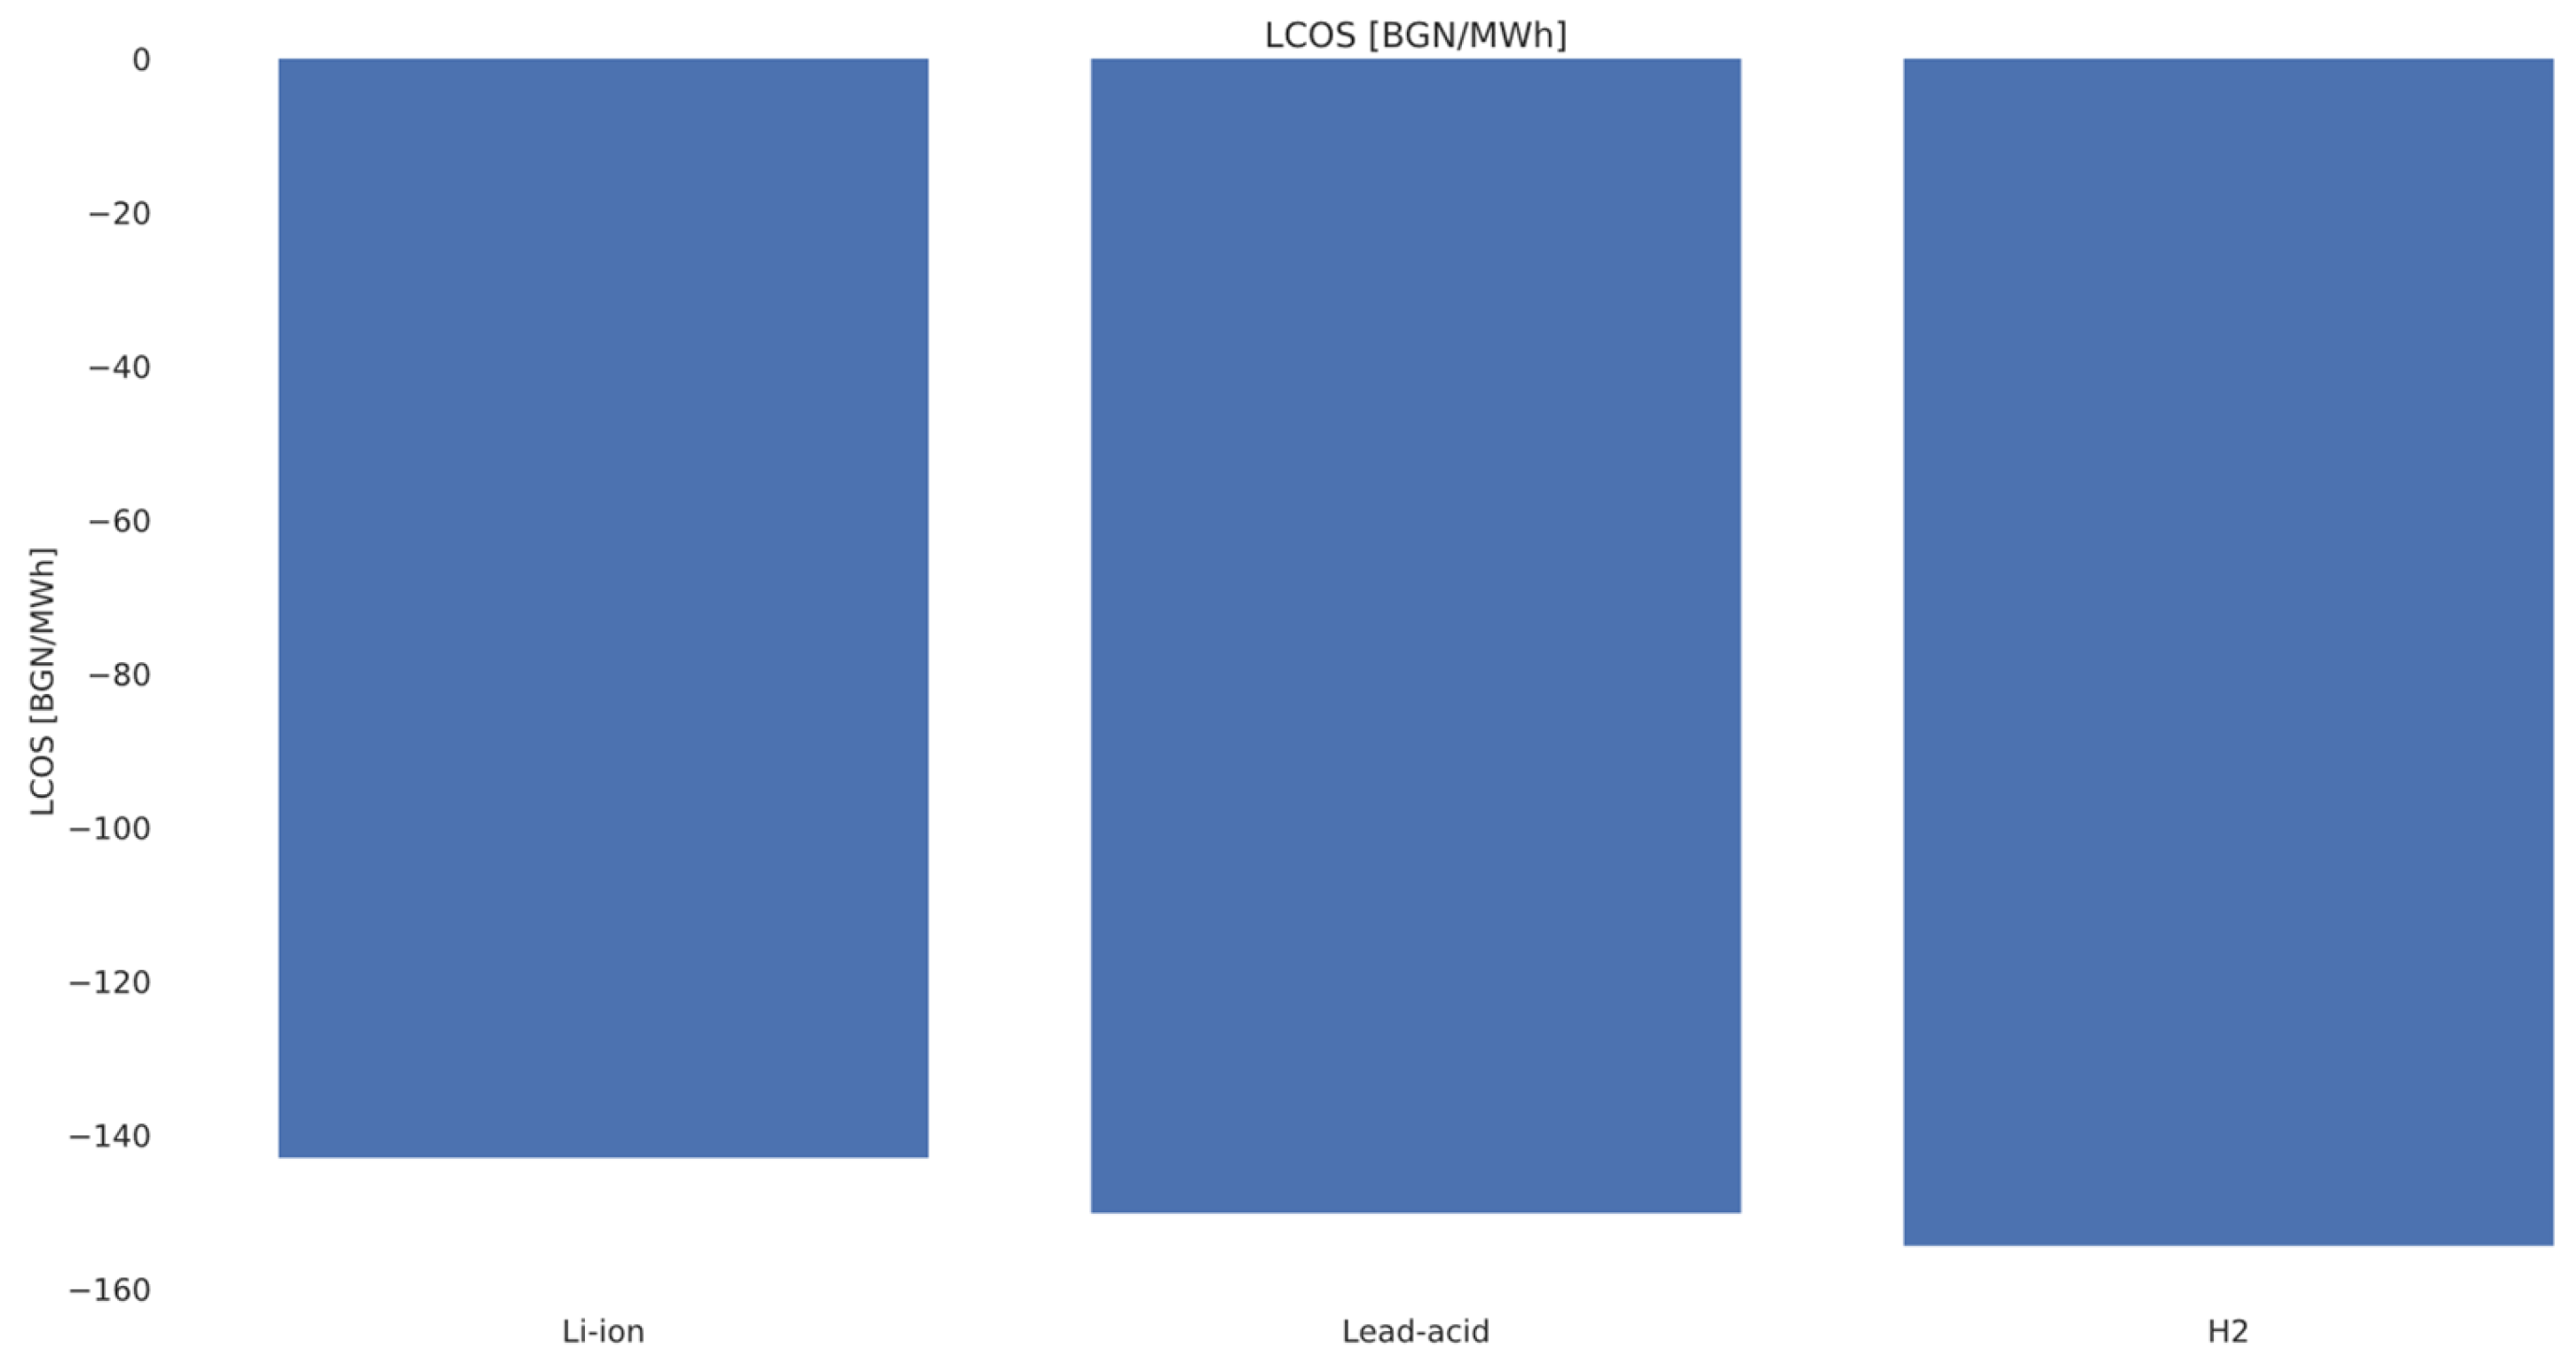
Figure 5 compares the discounted LCOS for the baseline scenario (10 years life, 5% electricity price escalation). We obtain negative LCOS for all technologies, as the export/compensation revenues exceed the sum of energy costs and capital under the optimized dispatch. The order is: H
2 ≈ −154 BGN/MWh < Pb-acid ≈ −150 BGN/MWh < Li-ion ≈ −143 BGN/MWh, where lower = better economics in this scenario. H
2 turns out to have the lowest LCOS due to the greater potential for using low prices in electrolysis production and realizing revenues at higher prices through the fuel cell. Pb-acid is close to H
2 thanks to its low CAPEX and high recycling share, but the lower RTE increases operating costs. Li-ion has a slightly higher LCOS due to its higher CAPEX, despite its very good RTE. Negative LCOS is a function of the price arbitrage environment and feed-in factors. At a lower feed-in tariff/higher discount rate, the differences may narrow or reverse, highlighting the need for sensitivity to political and market parameters. Negative values indicate net revenue (export revenues exceeding total costs) under the assumed tariff conditions.
Figure 5 shows that LCOS becomes negative under the tested tariff structure because export revenues can exceed the combined CAPEX, O&M, and import costs over the functional unit.
Table 3 makes this accounting transparent by explicitly listing export revenues as a negative LCOS component and by reporting the import electricity cost separately (including the contractual service fee). This breakdown also helps prevent misinterpretation of negative LCOS as a modeling artifact, as it clearly reveals the economic driver (policy/tariff remuneration) rather than an implicit arbitrage loophole.
This behavior is consistent across scenarios, where higher system efficiency is associated with improved techno-economic performance under the assumed model conditions.
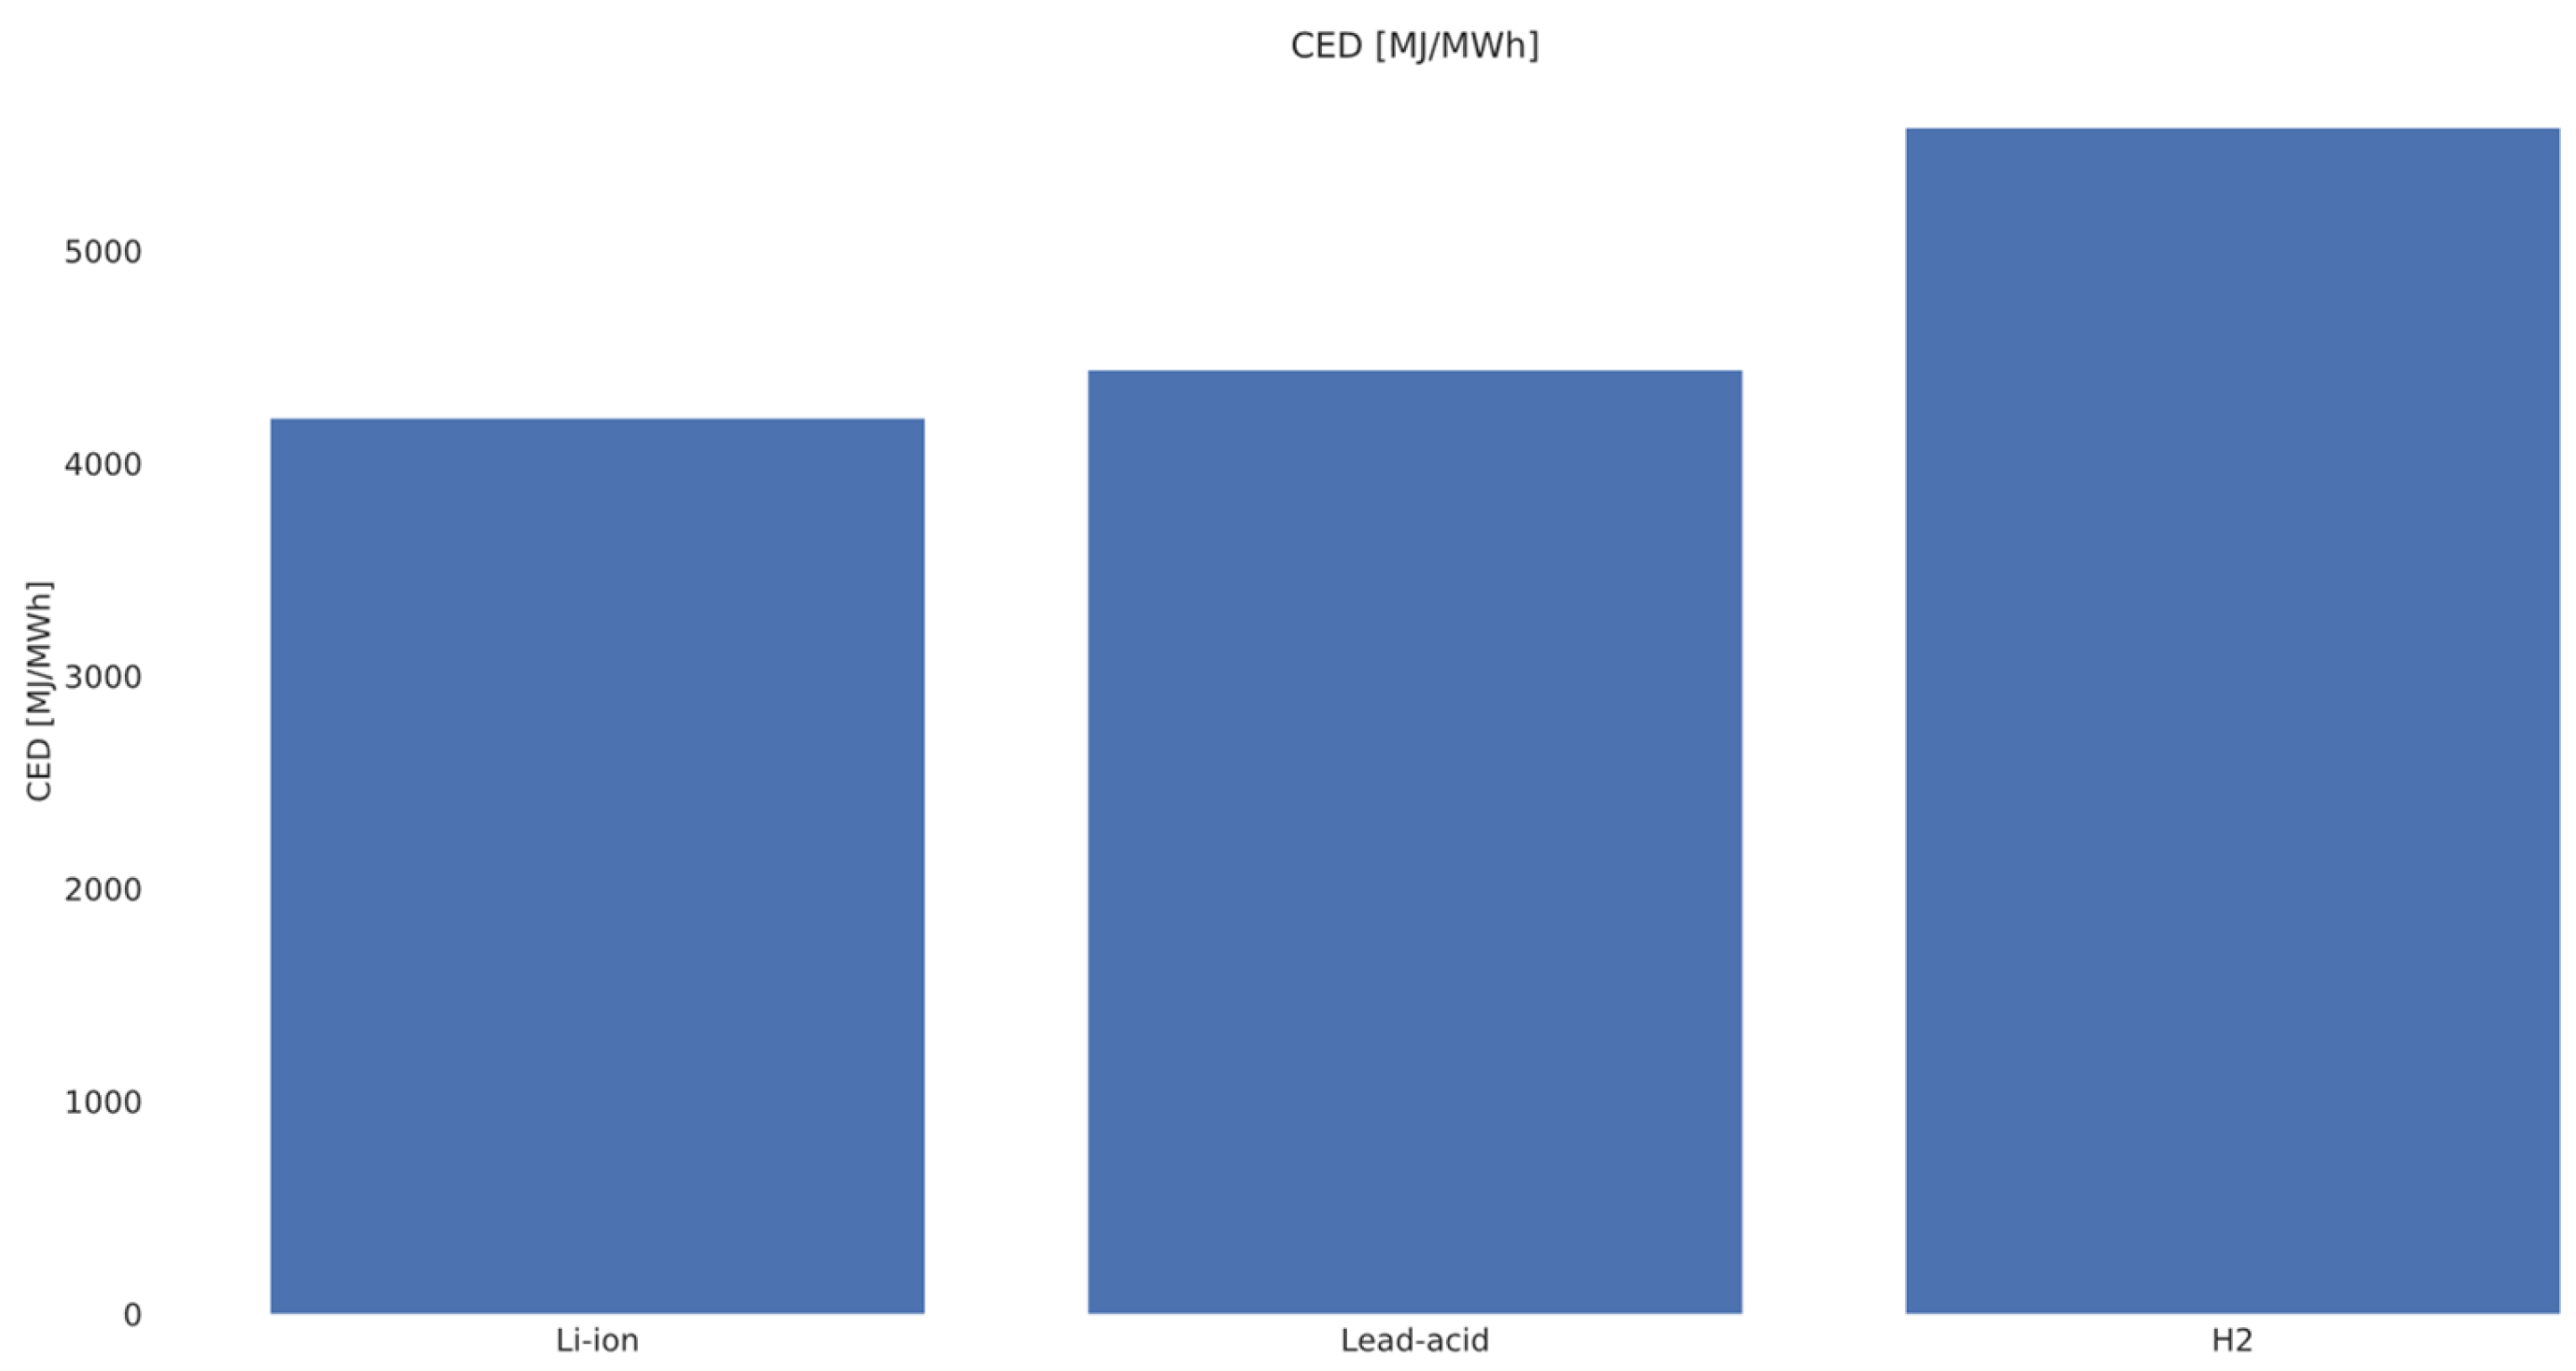
Figure 6 compares the estimated CED for the three technologies, aggregated by the electricity import during operation converted to MJ/MWh of delivered energy and fixed “production offsets” reflecting the energy input into the system fabrication. The resulting order is: Li-ion ≈ 4.21 × 10
3 MJ/MWh < Pb-acid ≈ 4.44 × 10
3 MJ/MWh ≪ H
2 ≈ 5.58 × 10
3 MJ/MWh, where lower = lower cumulative energy demand.
Li-ion stands out with the lowest CED due to its high RTE and relatively moderate production offsets. Pb-acid is close to Li-ion, but the lower RTE increases the operational energy contribution of the FU. H2 has the highest CED due to the energy-intensive electrolysis/compression/auxiliary loads/fuel cell steps, although some of the needs are compensated by the possibility of flexible charging at low prices.
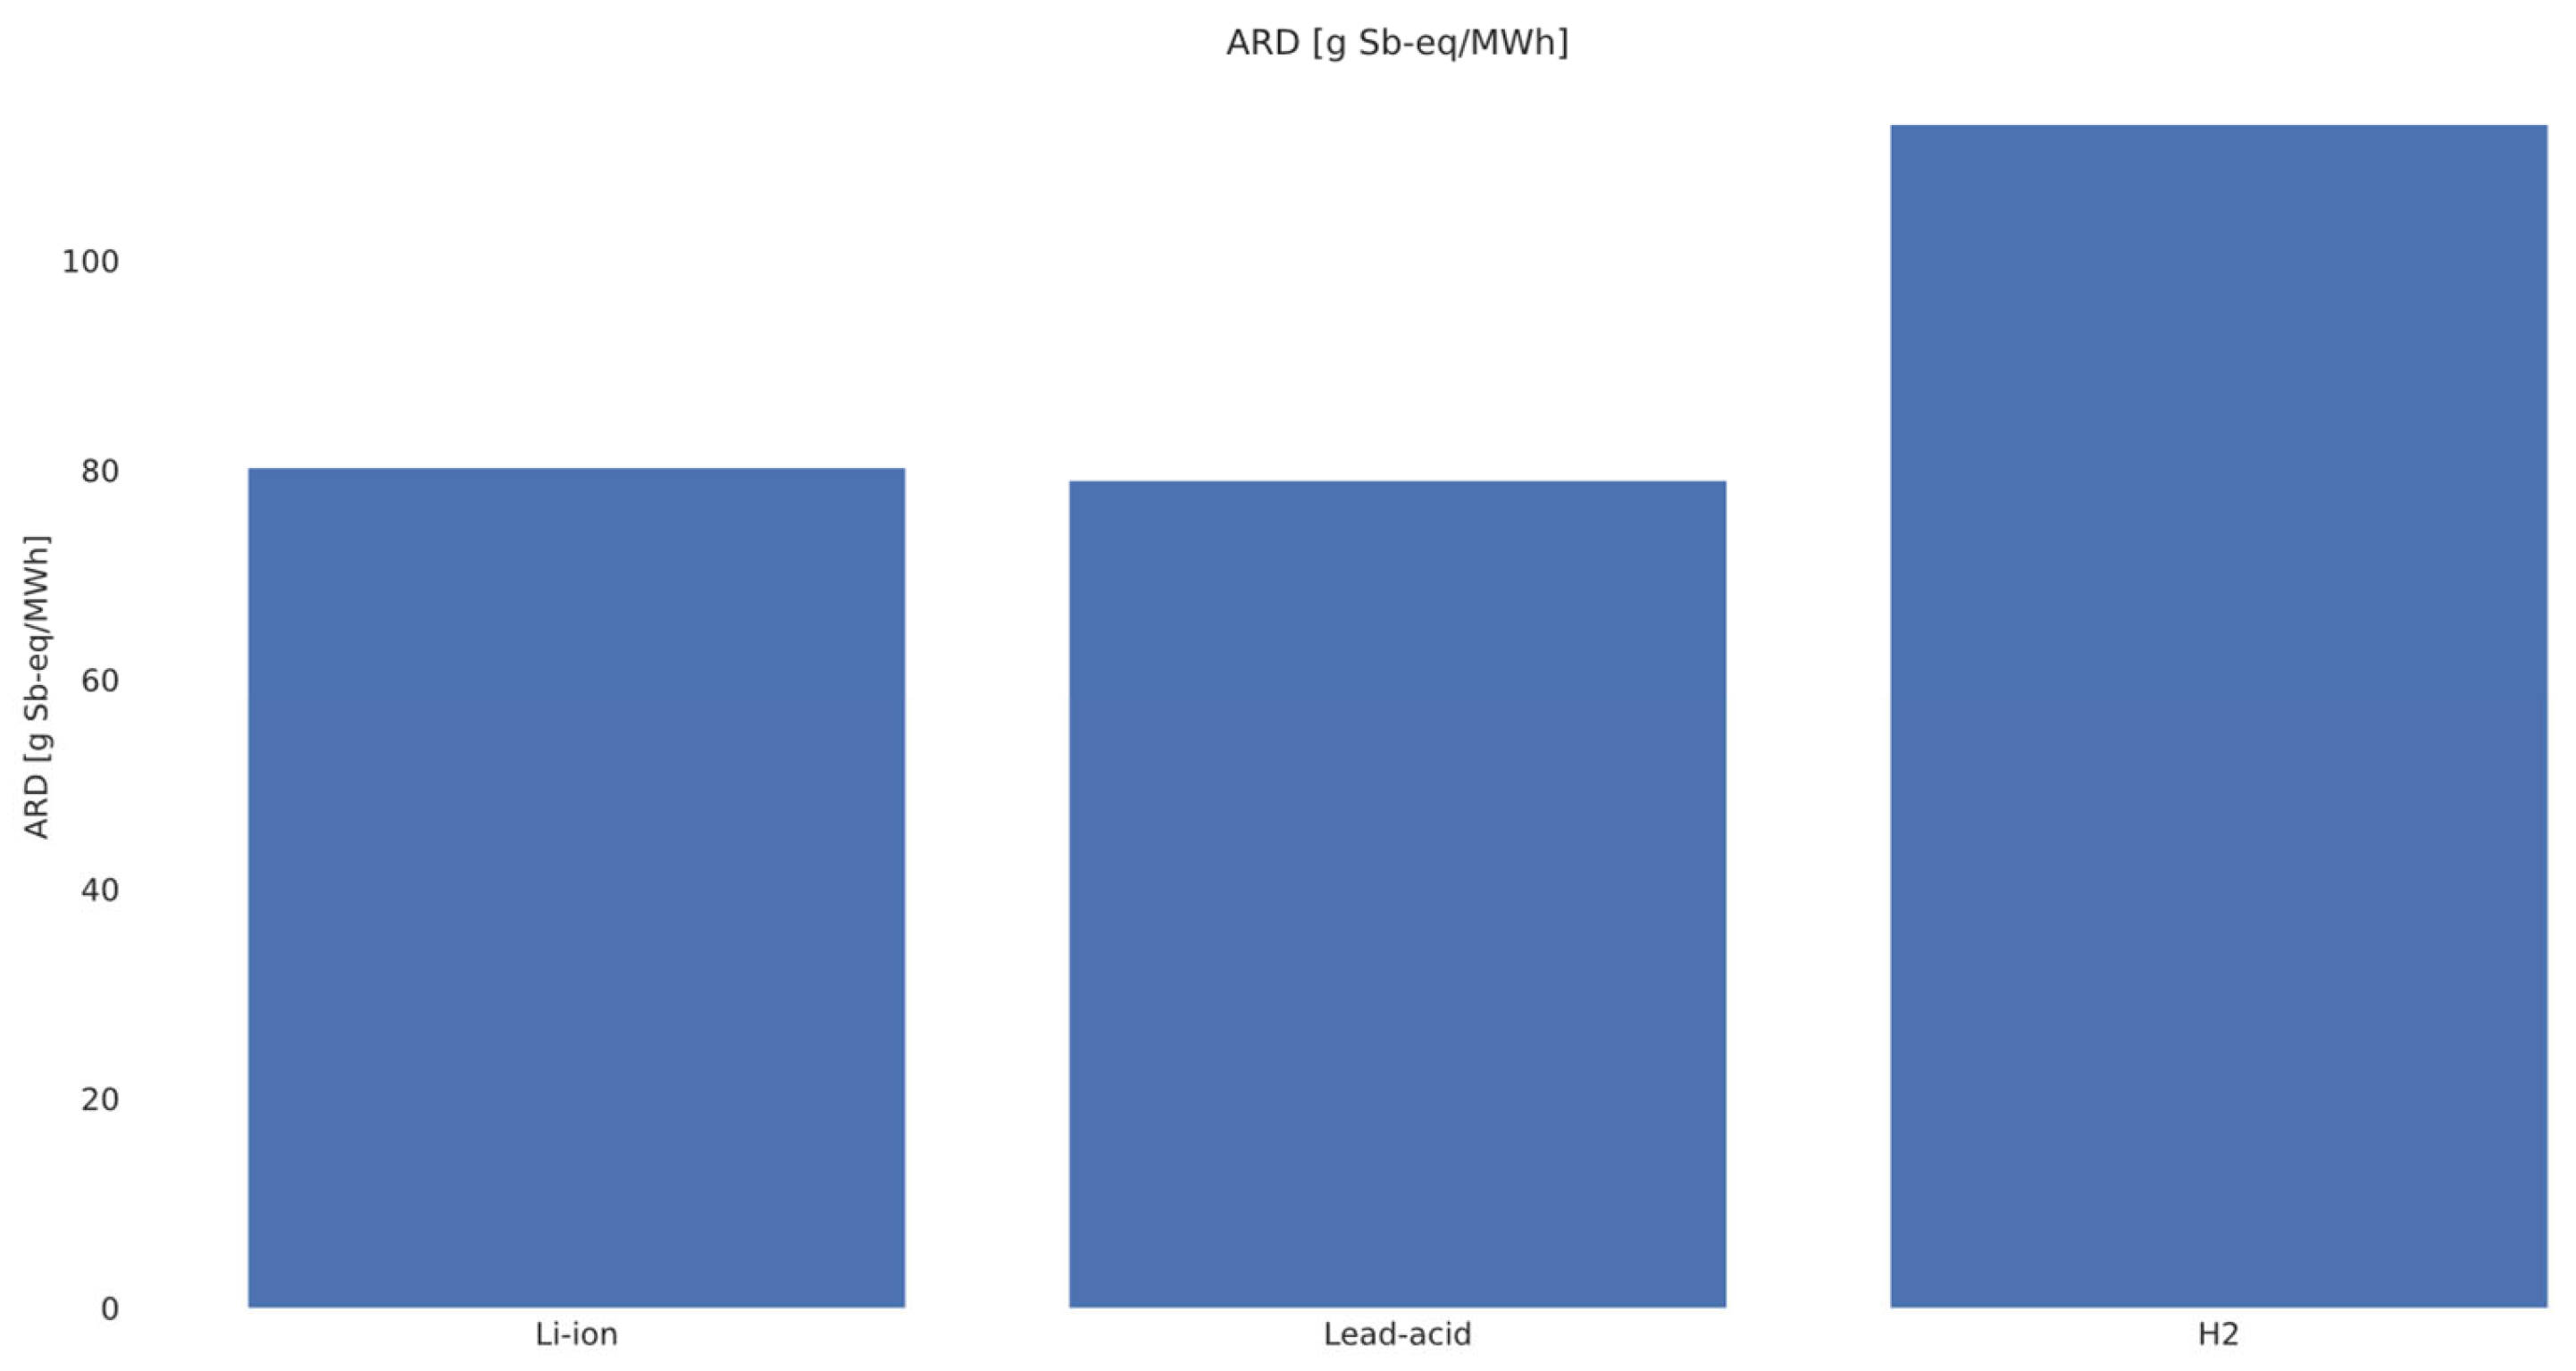
Figure 7 compares the ARD for the three technologies, estimated as the sum of the operating electricity contributions converted to g Sb-eq/MWh and fixed production offsets related to the material composition of the systems. The results are for Li-ion ≈ 80 g Sb-eq/MWh ≈ Pb-acid ≈ 79 g Sb-eq/MWh < H
2 ≈ 113 g Sb-eq/MWh, where lower = lower material load.
Li-ion and Pb-acid have similar ARD levels; despite the metal-intensive components in Li-ion, the good RTE and limited operating needs balance the indicator. The H2 system shows the highest ARD due to the complex hardware (electrolyzer, tanks, FC) and the higher electricity consumption in the cycle, which increases indirect material flows.
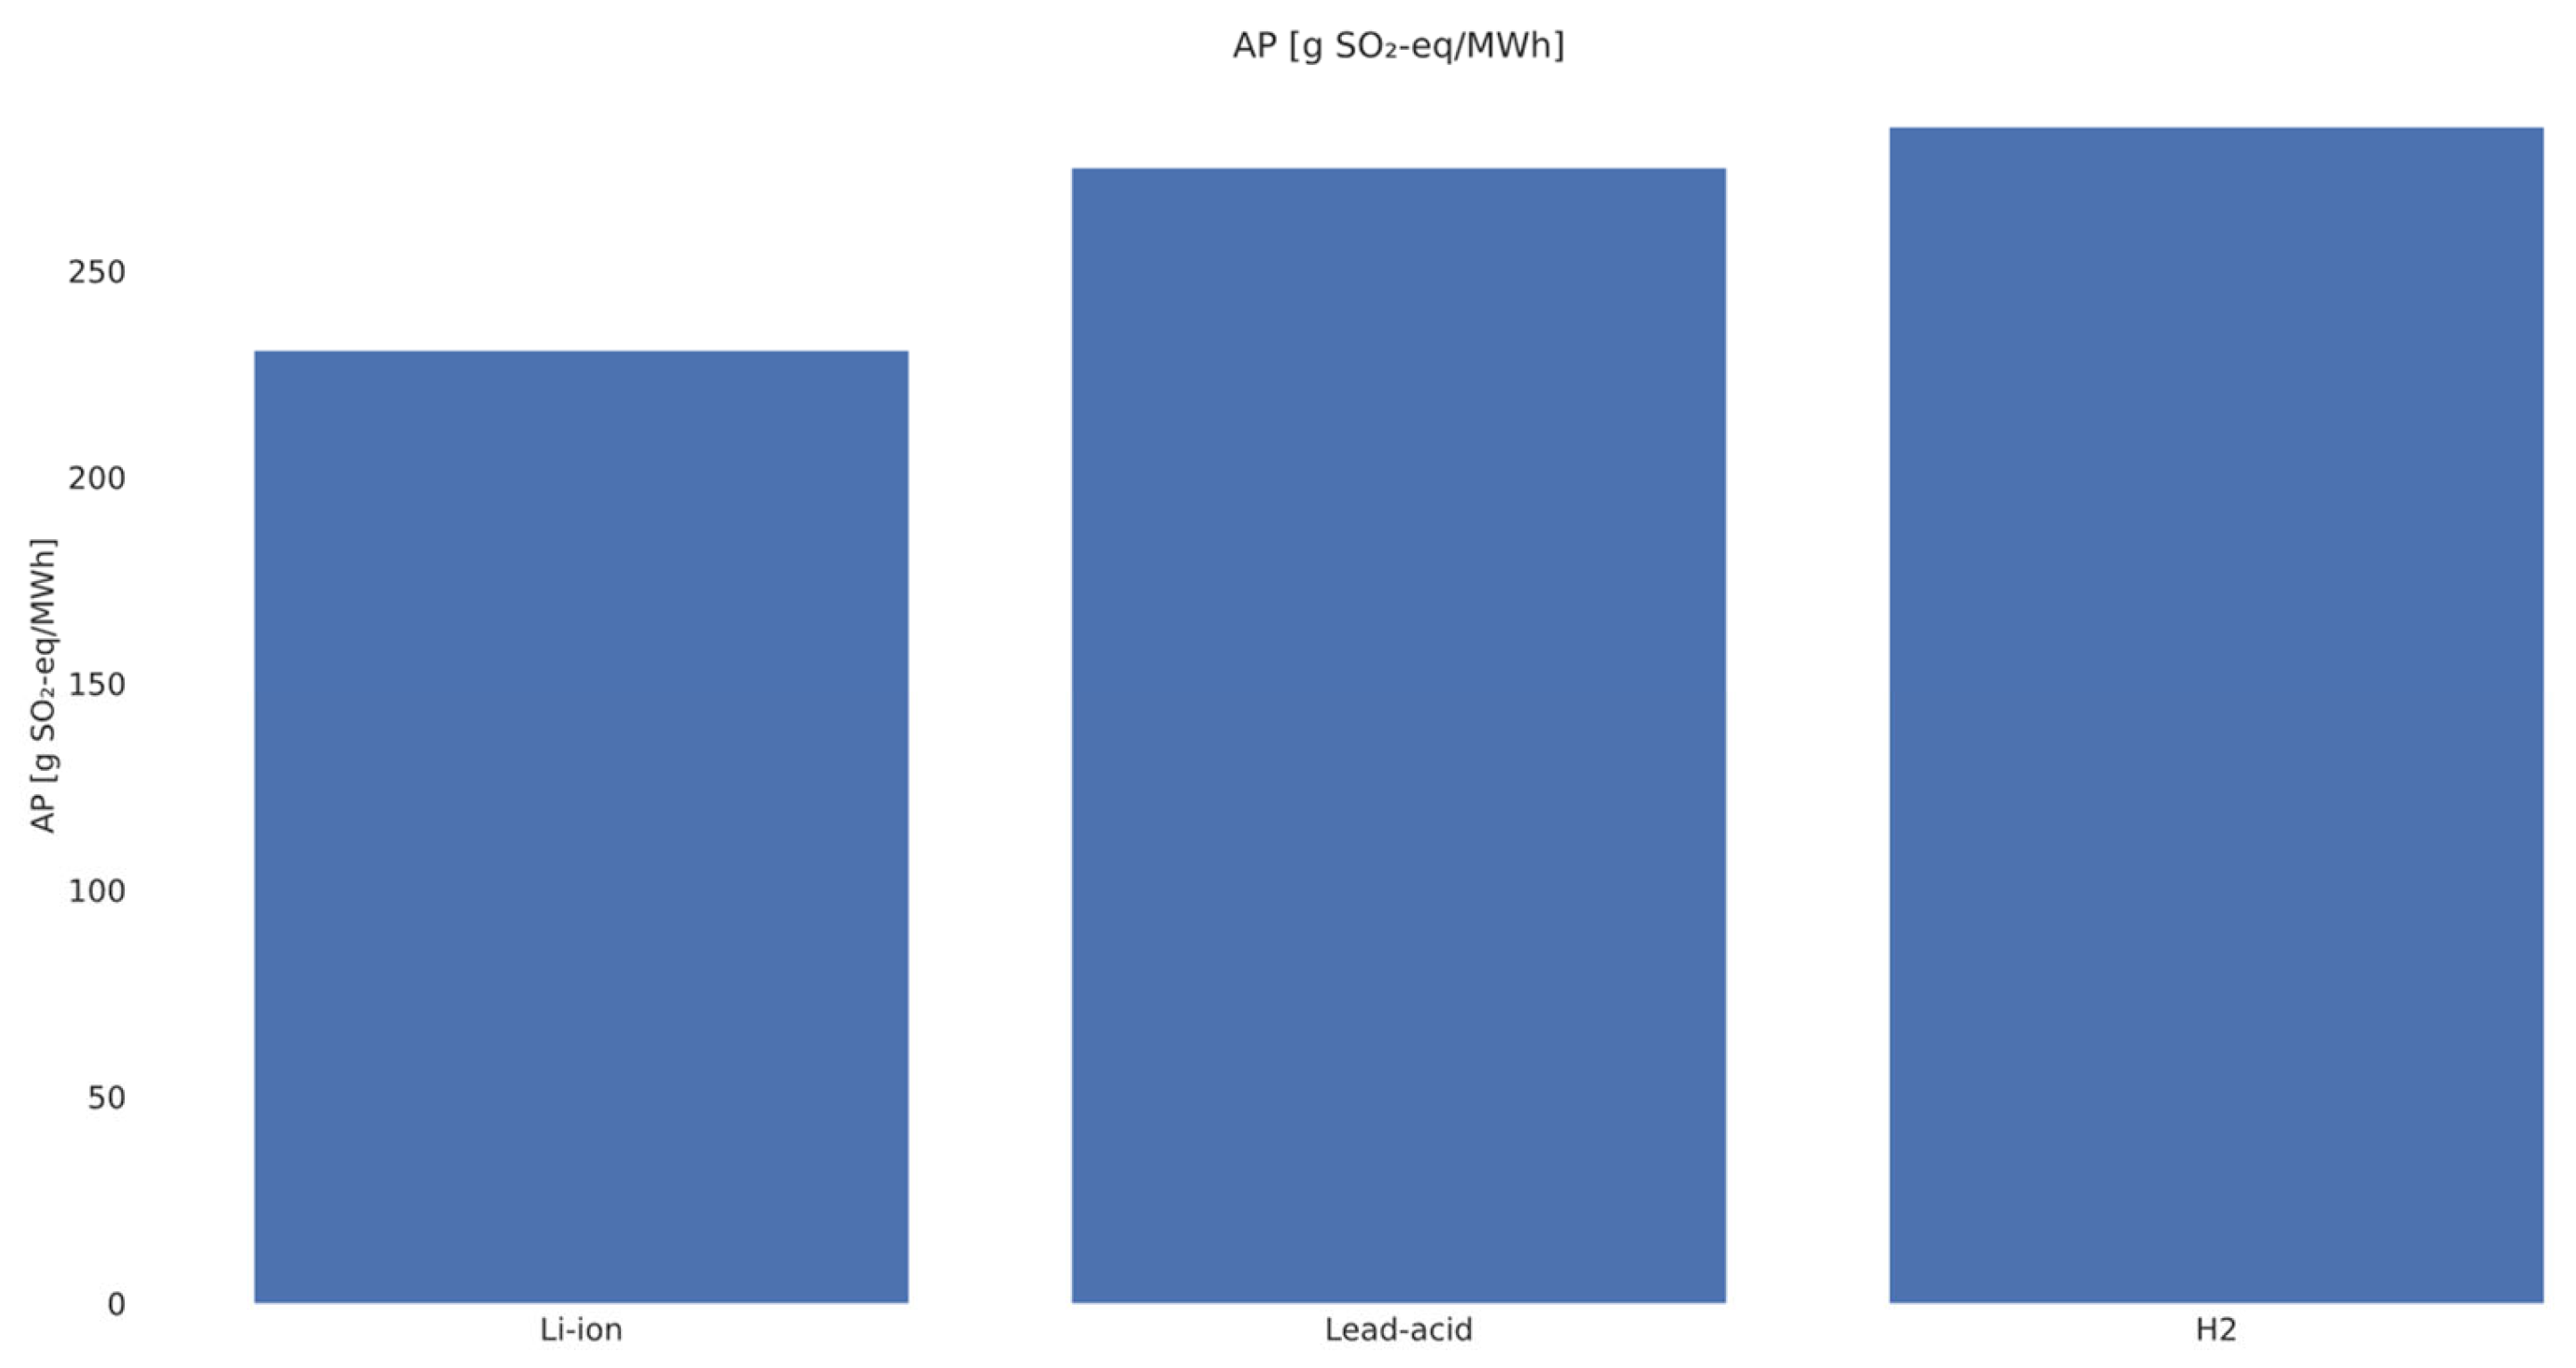
Figure 8 compares the AP for the three technologies, calculated as the sum of the contribution from the operating electricity and fixed production offsets. The values are approximately: Li-ion ≈ 231 g SO
2-eq/MWh < Pb-acid ≈ 275 g SO
2-eq/MWh < H
2 ≈ 285 g SO
2-eq/MWh, where lower = better. Li-ion has the lowest AP due to its higher RTE and fewer indirect emissions from the electricity in the cycle. Pb-acid shows higher values, influenced by material intensity and lower RTE. H
2 has the highest AP, as electrolysis, compression and the fuel cell increase the electricity consumption and associated emissions of acidification precursors.
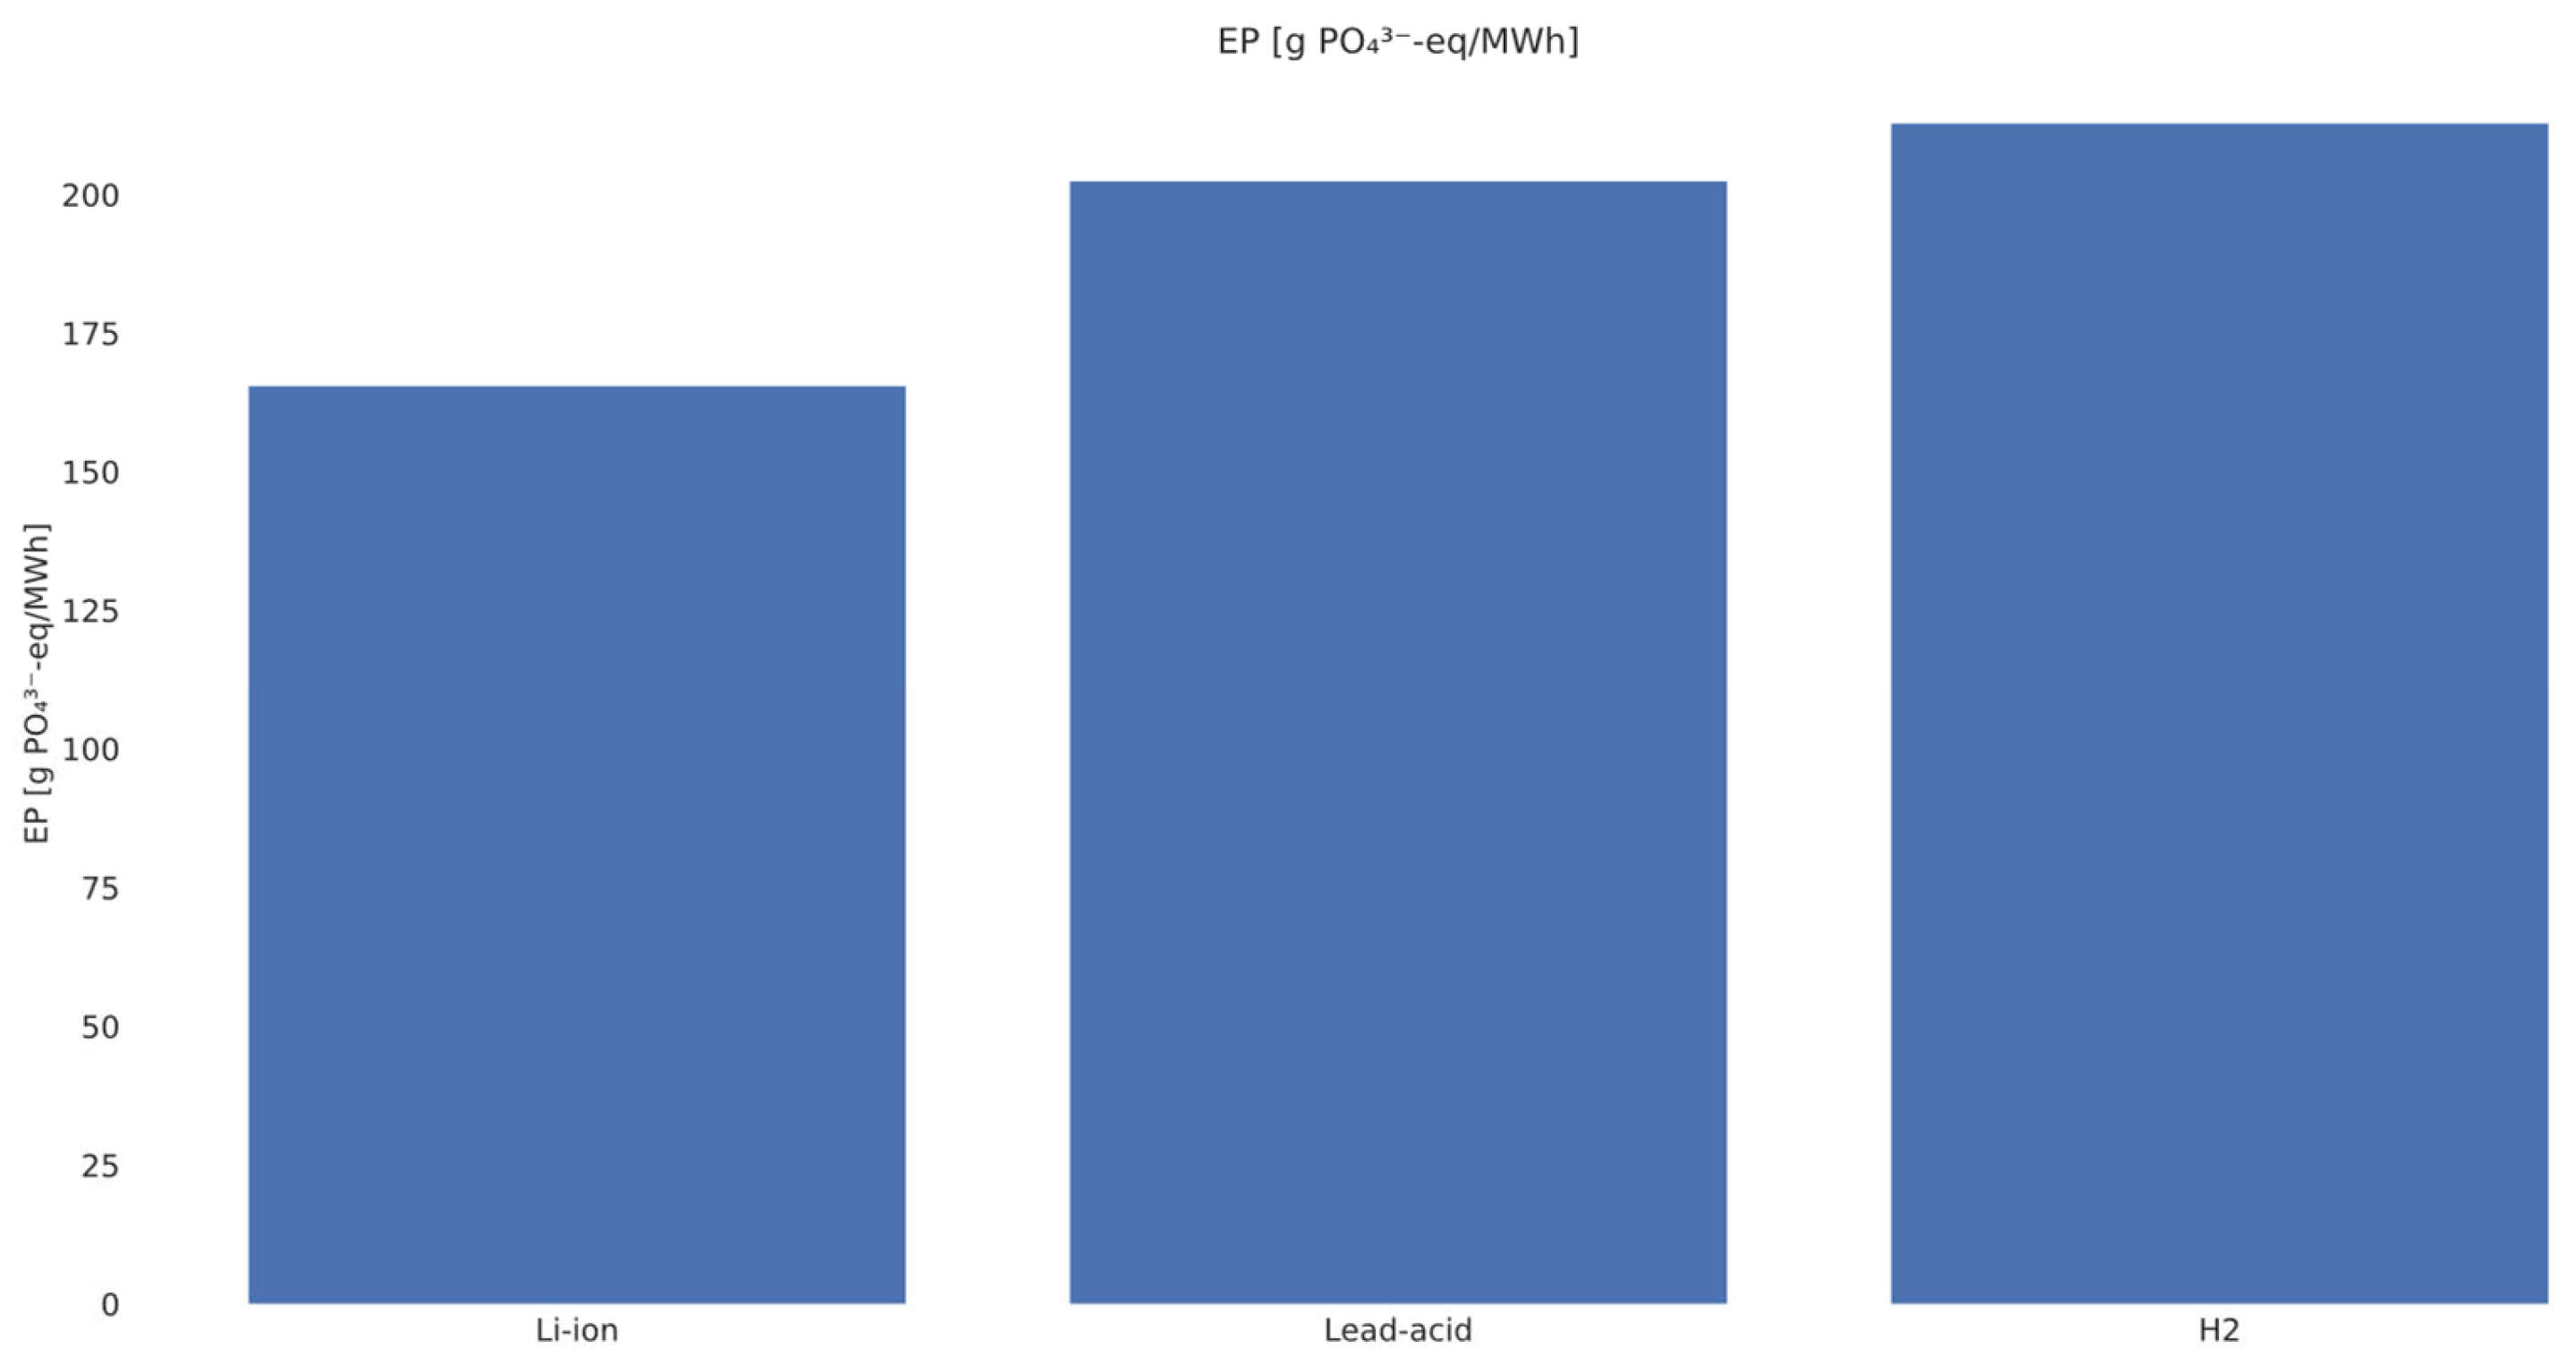
Figure 9 compares the EP for the three technologies. The estimated values are approximately: Li-ion ≈ 163 g PO
43−-eq/MWh < Pb-acid ≈ 202 g PO
43−-eq/MWh < H
2 ≈ 214 g PO
43−-eq/MWh (lower = better).
Li-ion achieves the lowest EP, mainly due to higher efficiency and lower share of grid electricity per MWh of delivered energy. Pb-acid has a higher EP, influenced by lead mining and processing and sulfuric acid production, upstream emissions of nutrient precursors. H2 has the highest EP due to the electro-intensive steps (electrolysis, compression/storage, fuel cell operation) that increase indirect water emissions along the electricity chain.
The absolute values are sensitive to the grid profile and assumptions for production offsets; the relative ranking remains stable across the sensitivities performed.
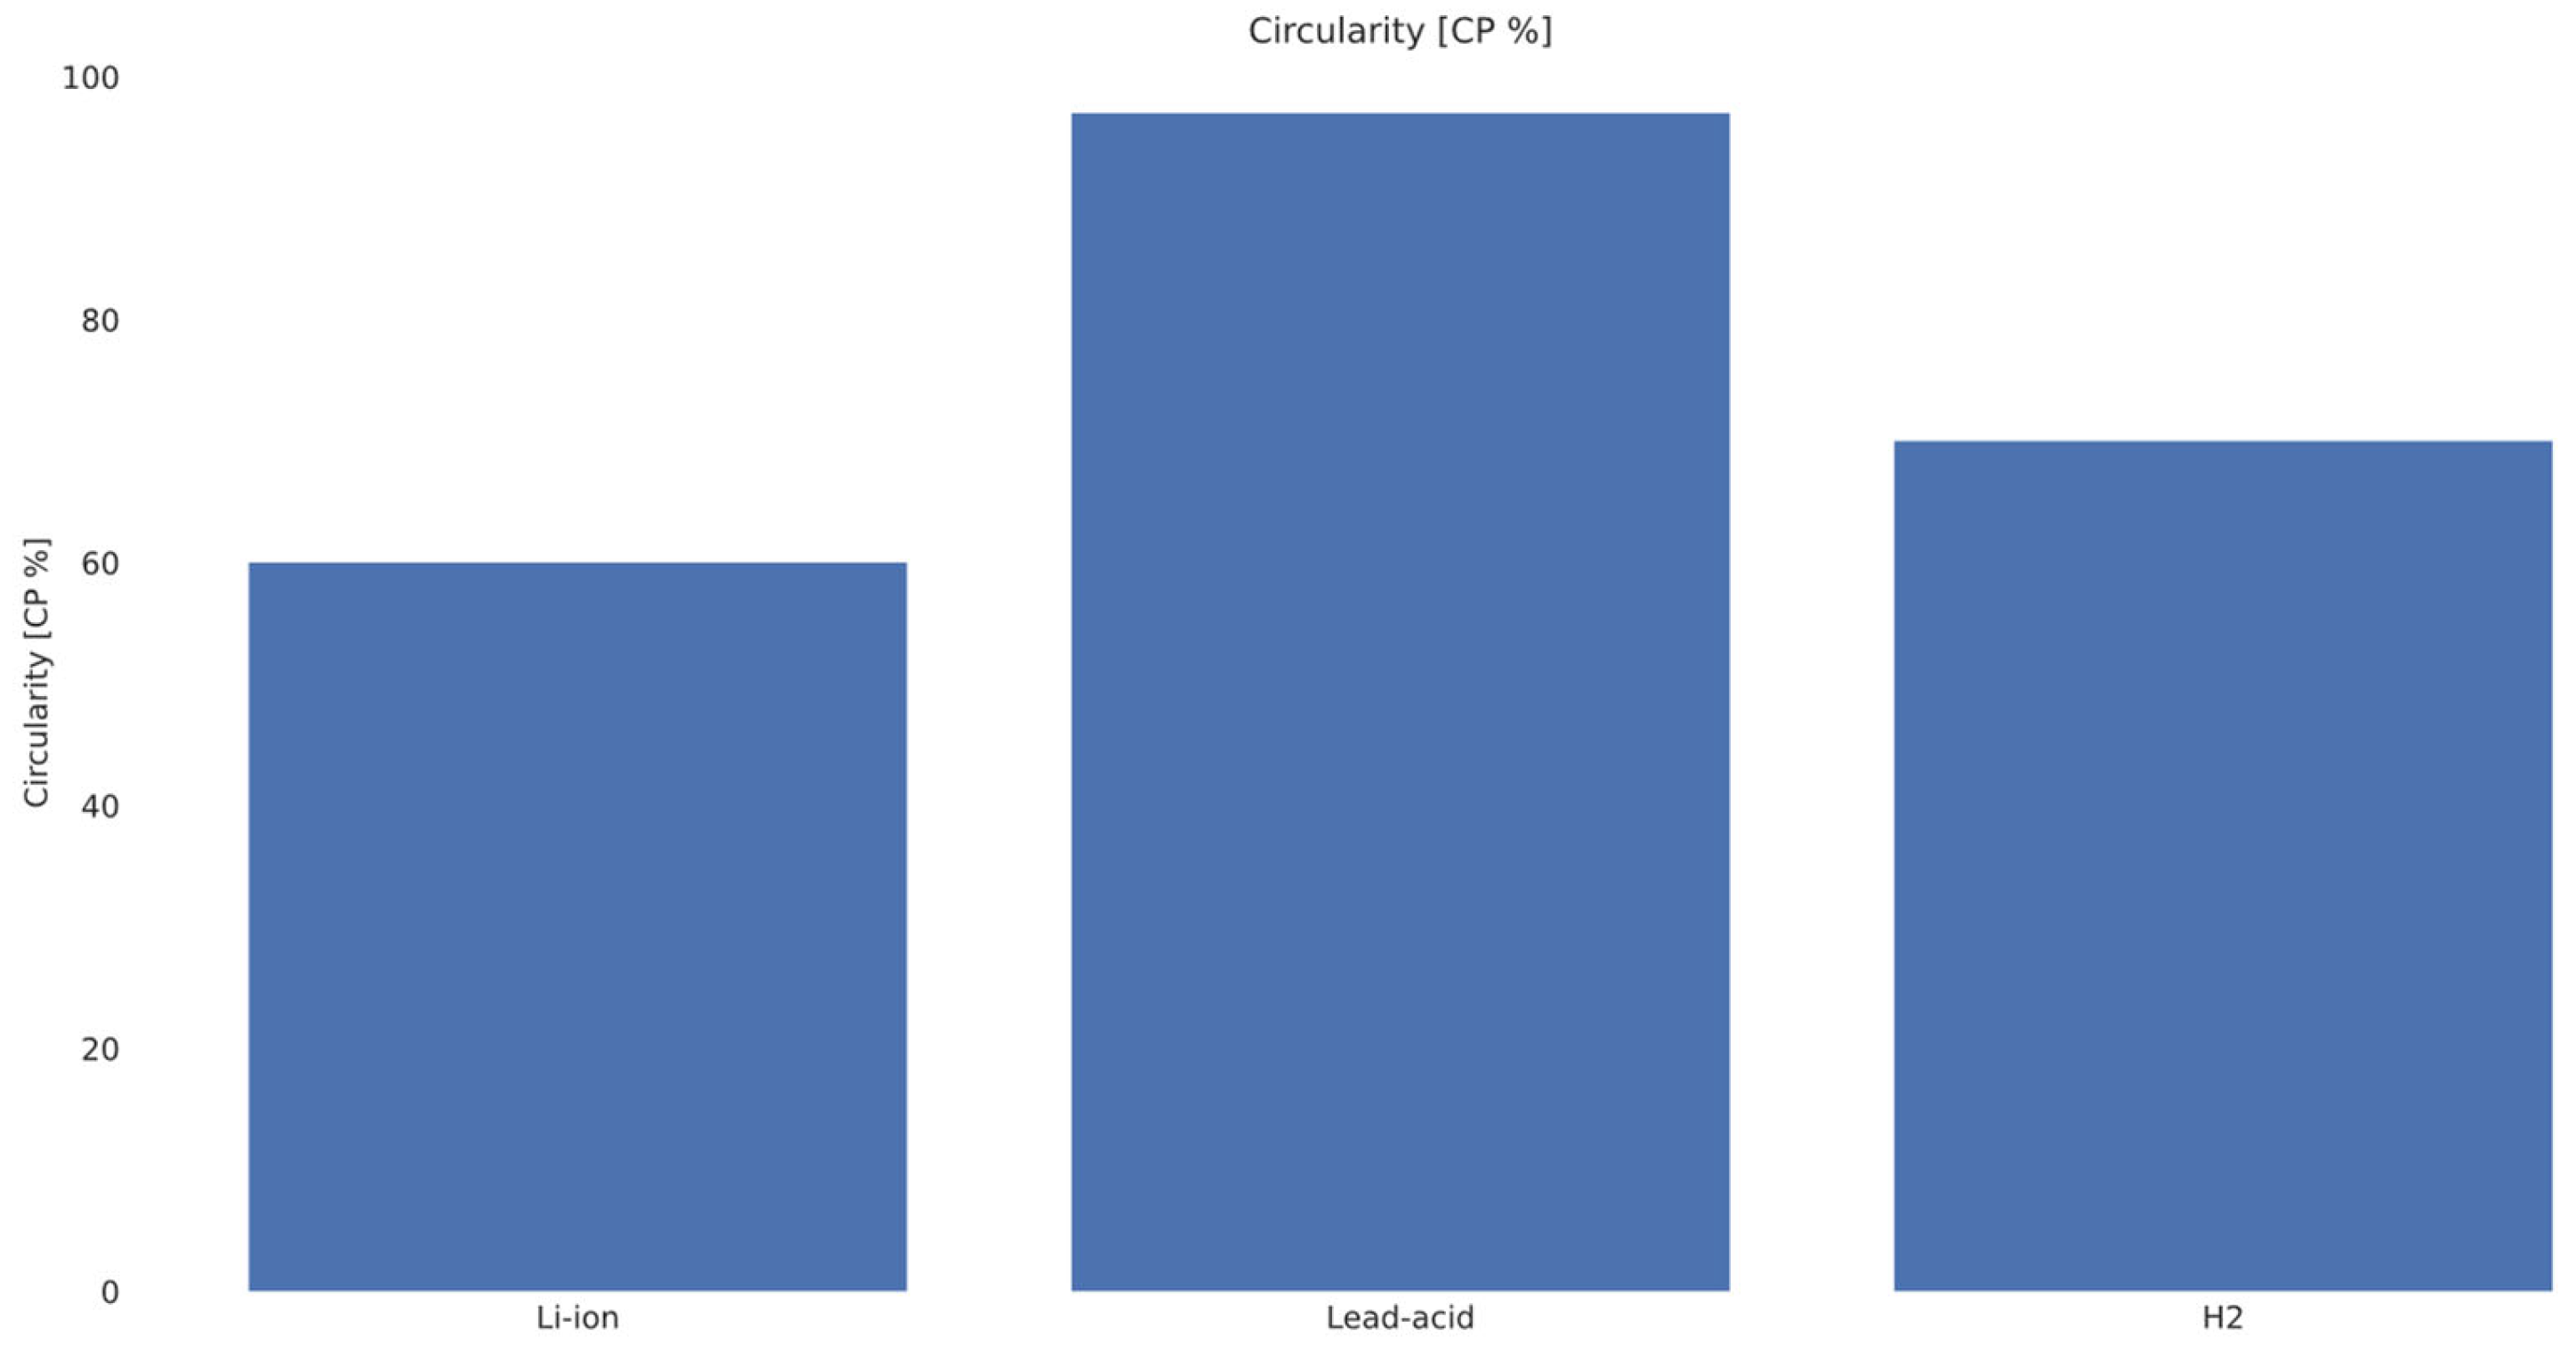
Figure 10 compares the estimated share of materials/value that can be returned to the cycle at the end of the system’s life. The indicative values are: Pb-acid ≈ 97% > H
2 ≈ 70% > Li-ion ≈ 60%, where higher = a more circular system. Pb-acid achieves the highest circularity thanks to established buyback chains and >95% recovery of lead and polypropylene housings, indicating an almost closed loop. The H
2 system has an average circularity: steel tanks and platinum catalysts are recyclable, but the heterogeneity of components (electrolyzer/GC, composites, membranes) and dismantling losses lower the index. Li-ion has the lowest CP in the baseline scenario, as the infrastructure for recycling cathode materials (Ni, Co, Li, Mn, P) does not yet achieve high recoveries for all chemistries, and electrolytes and separators are only partially recovered. However, second-life use can delay EoL and increase effective circularity at the system level.
The CP indicator is constructed from assumptions about real recovery rates and logistics, the absolute values may vary between regions, but the relative order is maintained across the sensitivities tested.
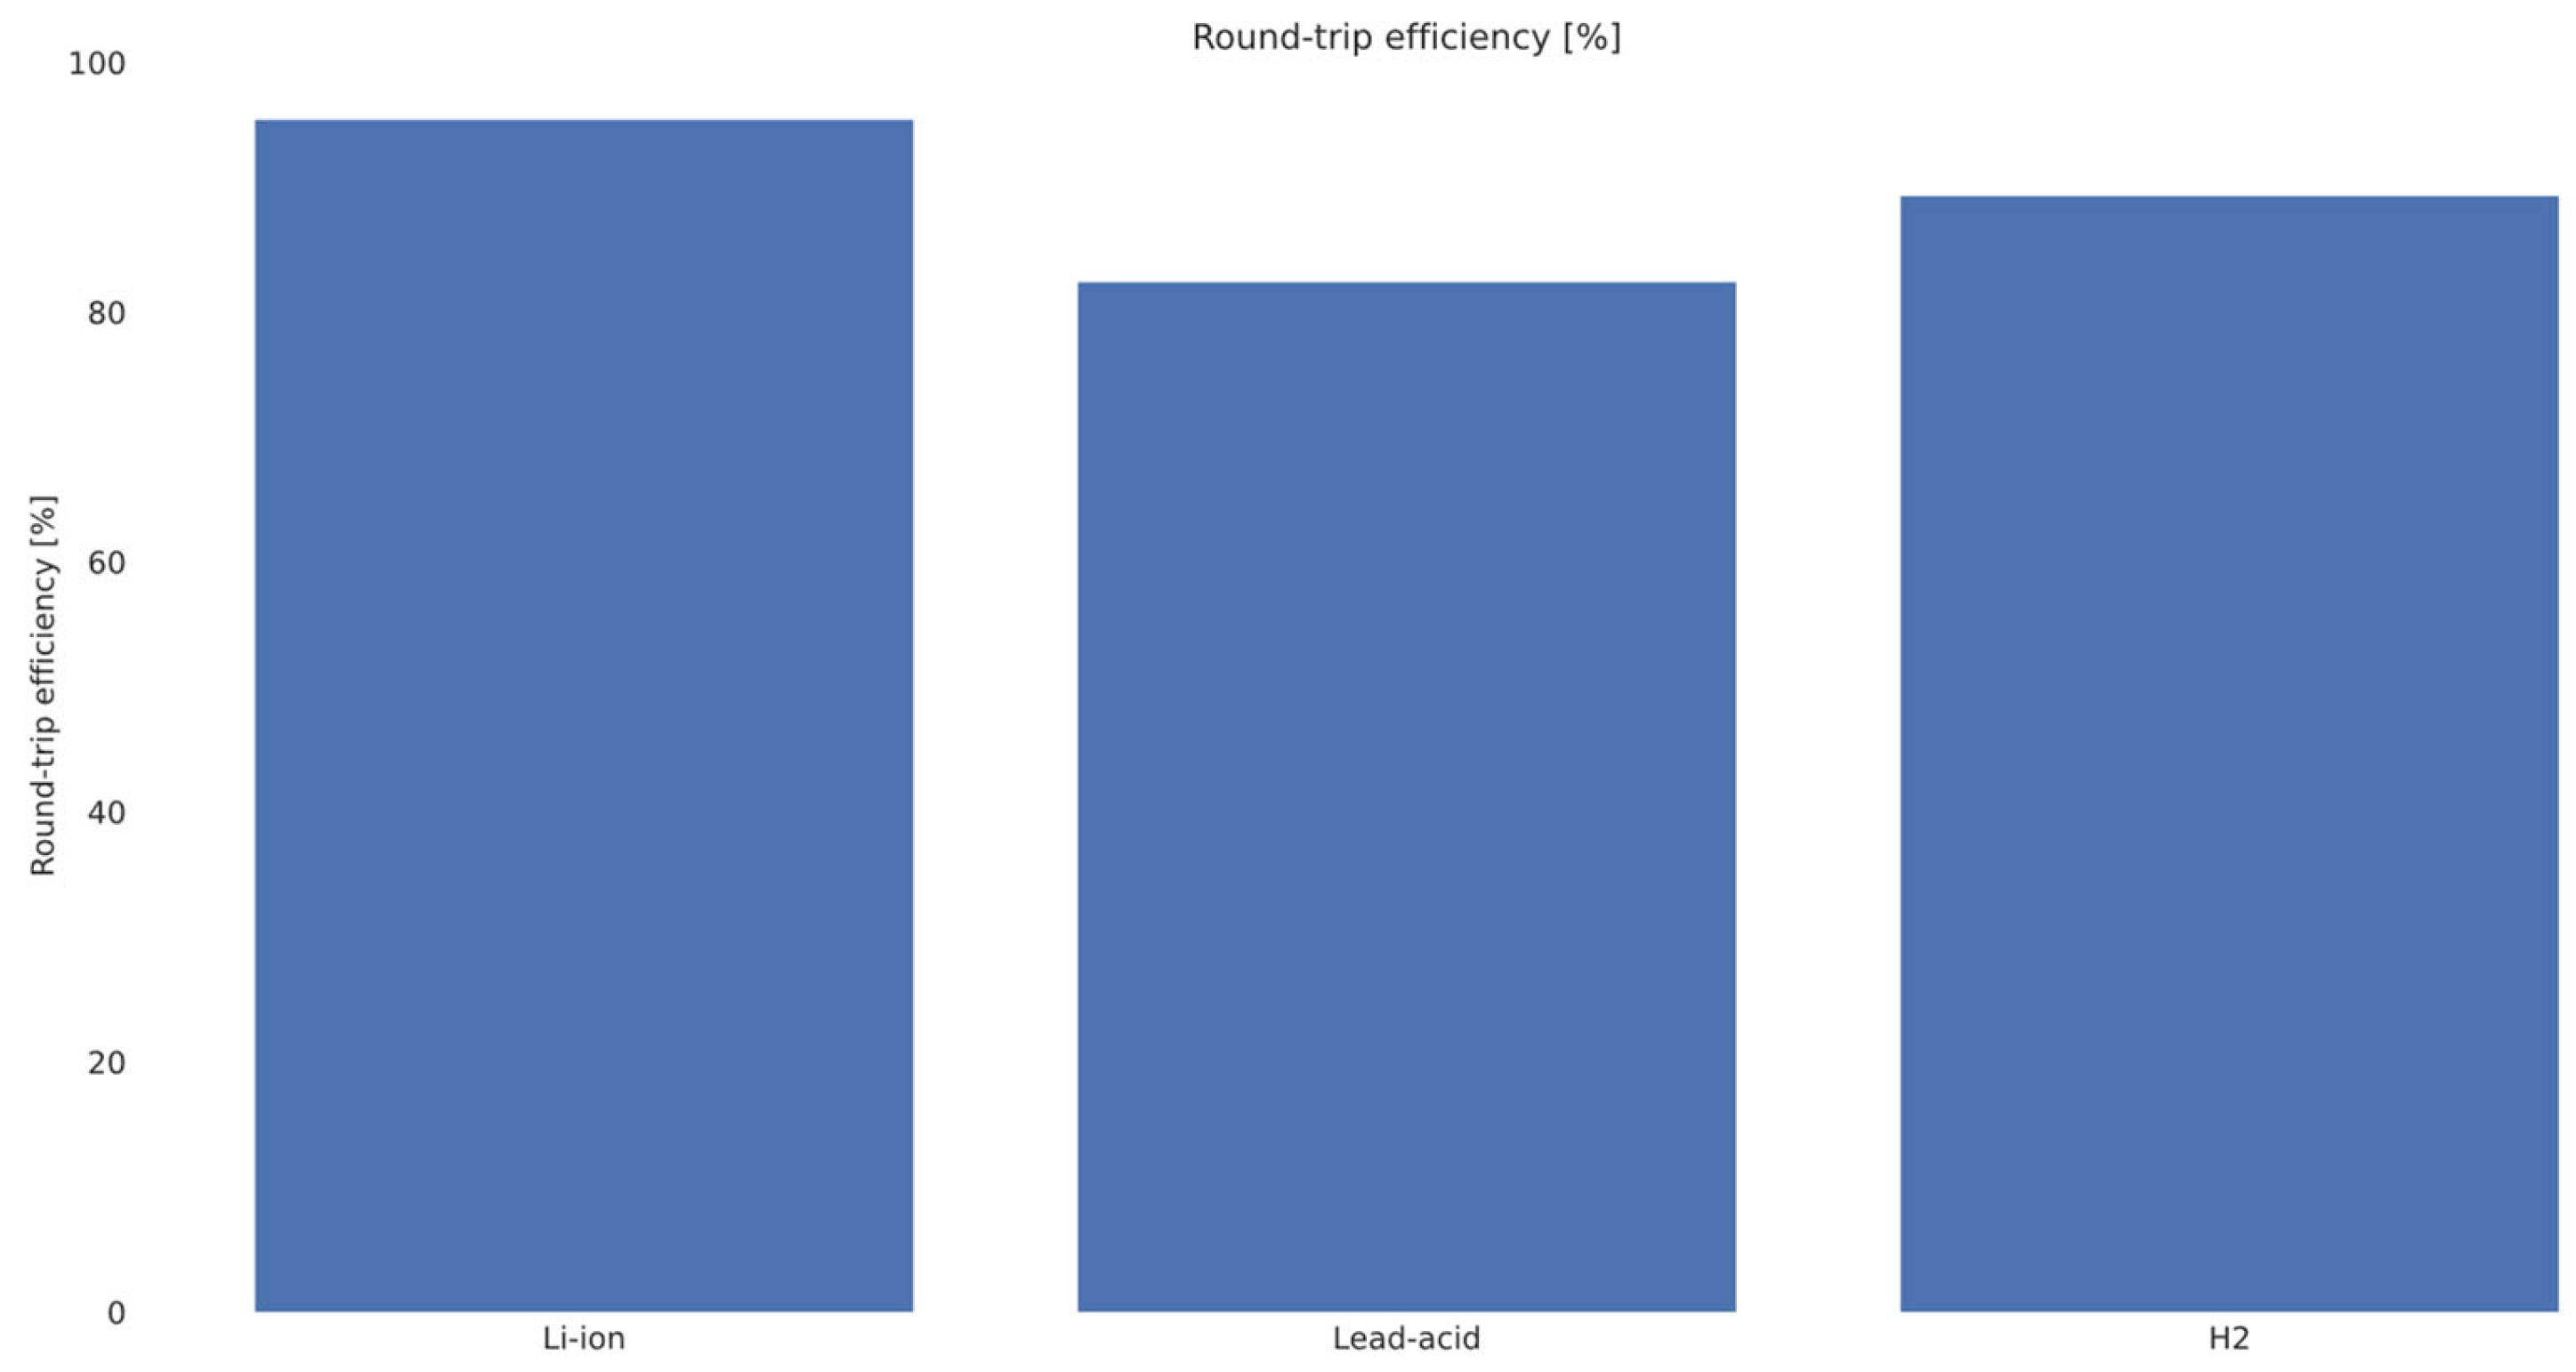
Figure 11 compares the calculated cycle efficiency for the base simulation period: Li-ion ≈ 95% > H
2 ≈ 89% > Pb-acid ≈ 82%, where higher = lower conversion losses.
Li-ion achieves the highest RTE due to low charge/discharge losses and limited auxiliary power. This results in a lower need for grid import for the same output and contributes to a lower GWP/LCOS. H2 is less efficient than batteries due to electrolysis/compression/fuel cell, but with the tested parameters (η_EL ≈ 60%, η_FC ≈ 50%) the aggregated RTE ~89% is due to operational optimization with limited standby and PV peak absorption. Pb-acid shows the lowest RTE, typical for the technology (internal losses and more limited allowed operating modes), which increases the required grid import and worsens some of the environmental indicators.
Differences in RTE are a key driver of the final metrics; all else being equal, systems with higher RTE require less primary electricity to deliver 1 MWh to the load, which reduces both operational emissions and the cost base.
To contextualize the point estimates, we further examined the sensitivity of the leading results to tariff and financial parameters, such as the export remuneration coefficient and discount rate, in line with the robustness checks. In the ranges studied, the ranking of technologies is primarily determined by the amount of residual electricity from the grid per MWh delivered and the export remuneration rule, which directly affects the LCOS balance. When uncertainty ranges are reported, they should be interpreted as scenario-driven variability and not as stochastic measurement noise.
To improve reproducibility, the specific impact factors used in these calculations are explicitly reported in
Table 1.
While GWP provides a primary indicator of climate impact, it does not fully capture all environmental trade-offs. For this reason, additional indicators including cumulative energy demand (CED), abiotic resource depletion (ARD), acidification potential (AP), and eutrophication potential (EP) are also evaluated to provide a broader perspective on environmental performance.
6. Discussion
A limitation of the present study is the reliance on a single case-study dataset, which may introduce site-specific bias. Although the selected dataset is representative of typical SME applications, variations in load profiles, climate conditions, and market structures may affect the generalizability of the results.
To mitigate this limitation, the study incorporates scenario-based analysis and sensitivity testing, which explore a range of operating conditions and parameter variations.
The results can be directly interpreted within the conceptual framework. In particular, the observed techno-economic and environmental outcomes are consistent with the model structure linking input variables, optimization-based dispatching decisions, and the resulting energy flows.
For example, variations in electricity prices and system efficiency affect dispatching decisions, which in turn determine the energy flows between the grid and the storage system. These energy flows directly affect both the LCOS and LCA metrics, confirming the central role of the energy flow vector as a linking variable in the proposed framework.
Thus, the empirical findings support the theoretical assumption that system performance metrics are not independent quantities but are generated by operational decisions within the model under given input conditions.
The results outline a consistent hierarchy across most metrics: Li-ion demonstrates the lowest GWP and highest RTE, Pb-acid lags behind mainly due to lower RTE and higher grid operational demands, and H
2 has the highest GWP/CED and the most unfavorable acidification/eutrophication indicators due to accumulated conversion losses (electrolysis/compression/fuel cell) and auxiliary capacities. The energy flows presented in
Figure 1 show that with Li-ion a larger share of PV is directed directly, via a battery, to the load, which reduces grid imports and explains the lower specific emissions. The reported negative LCOS values in
Figure 4 are an artifact of tariff allowances and export revenues; in the tested pricing configuration, net cash flows are dominated by feed-in revenues, rather than energy and capital costs. This does not mean “free” storage, but that within the given regulatory-pricing environment the system realizes positive net revenue per functional unit. Therefore, LCOS comparisons are valid for internal ranking, but absolute values should be interpreted with caution and accompanied by price sensitivity. In scenarios with strong export remuneration, the LCOS metric transitions from a cost indicator to a net benefit indicator, highlighting the influence of market conditions on economic interpretation.
A key insight from the multi-indicator assessment is the presence of potential burden-shifting effects between technologies. While Li-ion batteries exhibit the lowest GWP due to high round-trip efficiency and second-life credits, they rely on critical raw materials such as lithium, cobalt, and nickel, which are associated with resource depletion and supply risk. In contrast, hydrogen systems exhibit higher GWP and CED due to conversion losses, but rely less on critical battery materials and instead shift impacts toward energy demand and infrastructure complexity. Pb-acid batteries demonstrate strong circularity due to high recycling rates, but involve toxic materials such as lead, which raises concerns related to human toxicity and environmental contamination.
These trade-offs highlight that no single technology is environmentally optimal across all impact categories, and that technology selection depends on the prioritization of climate impact, resource use, and environmental risk.
Although human toxicity and ecosystem quality indicators are not explicitly quantified in the present study, they are indirectly reflected through material composition and resource-related indicators. Future work should extend the LCA framework to include midpoint and endpoint indicators for toxicity and ecosystem damage using detailed life-cycle inventory databases.
Recycling and especially the second-life credits for Li-ion in
Figure 2 have a negative contribution (benefit) to the GWP of FU, but in the baseline configuration their magnitude is small compared to operational emissions. However, they are politically and systemically relevant; with a higher second-life duration, a higher degree of substitution and a higher SoH at the end of the first life, the credit can reduce GWP by additional percentages. The circularity index (CP,
Figure 9) is highest for Pb-acid due to mature and closed recycling chains; Li-ion is lower today, but second-life scenarios and increasing recycling capacities can narrow the gap.
The high RTE of Li-ion (~95%,
Figure 10) reduces the primary electricity required to deliver 1 MWh to the load and “pulls” down both GWP (
Figure 3) and CED (
Figure 5). Conversely, H
2 systems accumulate losses in more stages and create higher CED, AP and EP (
Figure 5,
Figure 6,
Figure 7 and
Figure 8). This suggests that improvements in
ηEL/
ηFC and reductions in standby/aux loads are the most effective levers for environmental progress with H
2.
While Li-ion leads in GWP and RTE, Pb-acid wins in CP due to high recyclability, and H2 in autonomy over a long duration (high C/P equivalents), which is valuable for services with multi-day buffer or limited cycles. The optimal choice depends on daily displacement and minimal carbon footprint: Li-ion for maximum material circularity and low specific requirements; Pb-acid for long seasonal buffer/OTS services; and H2 after technological improvements.
Negative LCOS values suggest that current feed-in mechanisms strongly influence profitability. Export restrictions (cap/quotas) or reduced feed-in factor would shift some of the ranking. Policies that reward self-consumption, and reduce peak loads and emission benefits, rather than just exports, are likely to strengthen the advantage of high-efficiency systems and second-life pathways. In this work, negative LCOS values indicate that the system generates a net economic benefit under the assumed market conditions. In this context, LCOS values can be interpreted as the net revenue per MWh delivered, reflecting the balance between export revenues and total system costs. They should not be interpreted as universal profitability outside the tested tariff context.
Macro-drivers for the ranking are export/import price differentiation and price dynamics, RTE and auxiliary capacities, second-life allowances, SoH, years, degree of substitution, and discount rate. Our preliminary set of scenarios shows that the ranking by GWP and RTE is stable, while LCOS is most sensitive to tariffs and discount rate. It is appropriate to include the full grid of “C/P × price multiplier” and “feed-in × discount rate” in additional traceability materials.
The model is a deterministic LP with perfect forecasting within the period and uses simplified conversion factors for CED/AP/EP. There is no time/cycle degradation in dispatch, only in the financial module, and standby/aux are treated aggregated. Realistic price profiles, export restrictions and updated ecoinvent/ELCD inventory data would reduce uncertainty.
The economic advantage of second-life Li-ion batteries is strongly dependent on the assumed CAPEX reduction factor. Lower values of αSL significantly improve competitiveness, while higher values may reduce or eliminate the economic advantage relative to other technologies.
Safety and reliability considerations represent an important dimension in the evaluation of second-life battery systems. While second-life Li-ion batteries offer environmental and economic advantages, they are subject to higher uncertainty due to cell heterogeneity and degradation history. This can lead to increased maintenance requirements, reduced lifetime, and potential safety risks, which may partially offset their advantages in LCOS and GWP.
In comparison, new Li-ion systems provide higher reliability and more predictable performance, while Pb-acid batteries benefit from mature safety characteristics and well-established recycling processes. These differences highlight the importance of considering reliability and safety alongside techno-economic and environmental metrics when selecting storage technologies.
A further source of uncertainty in second-life Li-ion assessment is the quality of battery screening before repurposing. Future extensions should integrate fast micro-health parameter identification methods to better capture cell-to-cell consistency, regrouping quality, and their downstream effect on lifetime, safety, LCOS, and environmental performance.
The explicit inclusion of all intermediate energy conversions and auxiliary loads in hydrogen systems ensures that the comparison with battery-based storage remains methodologically consistent. This is particularly important given that hydrogen storage involves multi-stage energy transformations, which significantly influence both environmental and economic performance.
An important source of uncertainty in second-life battery assessment arises from degradation variability, chemistry differences, and regrouping quality. While the present model captures these effects through aggregated parameters, more detailed electrochemical and data-driven degradation models could further improve the accuracy of lifetime prediction and economic/environmental assessment.
A key limitation in hydrogen system modeling is the simplified treatment of degradation in electrolyzers and fuel cells. In practice, performance decay can significantly affect efficiency, lifetime, and replacement frequency, thereby influencing both LCOS and environmental metrics. Future work should integrate physics-based or data-driven degradation models to better capture these effects.
An important limitation of the economic assessment is the focus on energy arbitrage as the primary value stream. In practice, energy storage systems can participate in multiple markets, including frequency regulation, capacity markets, and congestion management.
These additional revenue streams can significantly influence the economic competitiveness of different technologies. For example, Li-ion batteries are well suited for high-frequency, fast-response services such as frequency regulation, due to their high power density and fast response time. In contrast, hydrogen systems are more aligned with long-duration capacity services and seasonal balancing, where energy capacity rather than power response is the dominant requirement.
The inclusion of stacked revenue streams and multi-market participation strategies could therefore alter the LCOS-based ranking presented in this study, particularly in market environments where ancillary services are highly remunerated. Future work should extend the optimization framework to explicitly model these market interactions.
The relative competitiveness of storage technologies is highly sensitive to market design. For instance, markets with strong incentives for ancillary services favor high-efficiency, fast-response technologies such as Li-ion batteries, while markets emphasizing long-duration capacity or seasonal balancing may improve the relative position of hydrogen systems. Therefore, policy and market structure play a critical role in shaping optimal technology selection.
The results demonstrate that key control variables such as electricity prices and discount rate have a dominant influence on economic performance, while environmental indicators are more strongly driven by efficiency and energy flows. This selection reflects a balance between model completeness and computational tractability.
Future work should extend the analysis to multiple sites and longer time horizons to improve statistical representativeness.
The robustness analysis indicates that the main conclusions are not dependent on a single model configuration. Although parameter variations can influence absolute performance metrics, the comparative ranking between technologies remains stable across a wide range of assumptions. This suggests that the proposed framework provides reliable insights despite uncertainties in input parameters and modeling assumptions. This approach serves as a practical alternative to full multi-model comparison while maintaining computational tractability.
It is important to note that the relationships identified in this study are derived from a simulation-based optimization framework and should not be interpreted as direct causal effects in real-world systems. Instead, they represent model-based dependencies under specific assumptions regarding input data, system parameters, and market conditions. Therefore, the conclusions should be interpreted as conditional insights rather than universally generalizable causal relationships. This distinction is particularly important when translating model-based findings into policy or design recommendations.
In second-life battery systems, module-to-module heterogeneity arising from prior degradation histories introduces dispersion in capacity and internal resistance. This leads to a reduction in usable system capacity (limited by the weakest module), increased resistive losses, and accelerated aging of stressed units. In the present model, these effects are indirectly accounted for through conservative operational limits, adjusted efficiency parameters, and reduced lifetime assumptions. However, explicit modeling of recombination-induced heterogeneity remains outside the scope of this study.
These results highlight that policy variables, such as carbon pricing and recycling regulations, can significantly alter the relative ranking of storage technologies. In particular, higher carbon prices tend to disadvantage energy-intensive systems such as PtH2P, while stricter recycling requirements may enhance the competitiveness of technologies with mature circular value chains.
The differences in recycling efficiency between different battery chemistries highlight an important trade-off between environmental impact and the material cycle. While lead-acid systems benefit from a highly efficient recycling infrastructure, lithium-ion systems, especially LFP, face challenges related to economic viability and process efficiency, which can impact their long-term environmental performance [
61,
62,
63].
Future research should integrate more advanced degradation modeling approaches to improve the accuracy of techno-economic and environmental assessments. For example, the lifecycle prediction framework proposed by [
64], which accounts for reversible voltage loss recovery, enables more accurate estimation of fuel cell lifetime under cyclic operating conditions. Incorporating such models into system-level optimization frameworks could significantly enhance the reliability of LCOS and LCA results, particularly for hydrogen-based storage systems. This is particularly relevant for PtH
2P systems, where dynamic operation and load variability strongly influence degradation behavior.
Safety and maintenance considerations represent an important cost component, particularly for second-life battery systems and hydrogen technologies. While these costs are included in aggregated form in the present model, their detailed representation—such as condition-based maintenance, failure probability, and safety risk modeling—could further refine economic assessments. This highlights that safety is not only a technical constraint but also an economic driver in storage system design.
In reality, grid carbon intensity varies over time and is often negatively correlated with photovoltaic generation. This implies that charging and discharging strategies can influence the effective carbon footprint of storage systems. For example, charging during periods of low-carbon electricity (e.g., high renewable penetration) and discharging during high-carbon periods could reduce overall emissions.
The present model does not explicitly account for this dynamic behavior; however, incorporating time-resolved carbon intensity data into dispatch optimization represents a promising direction for improving environmental performance.
These differences highlight that storage technologies should be evaluated not only based on direct comparability, but also in relation to their intended application domain, particularly with respect to storage duration and system flexibility. This distinction is critical when interpreting LCOS results across fundamentally different storage technologies.
7. Conclusions
This study presents a unified framework for the integrated techno-economic (LCOS) and environmental (LCA) assessment of stationary energy storage systems in photovoltaic-based applications for small and medium-sized enterprises. By combining optimization-based dispatch with harmonized system boundaries and functional units, the proposed approach enables consistent comparison across Li-ion, Pb-acid, and hydrogen storage technologies.
The results indicate that, under the assumed model conditions, Li-ion batteries particularly with second-life pathways provide the best overall techno-economic and environmental performance for short- to medium-duration applications, driven by high round-trip efficiency and reduced CAPEX. Pb-acid batteries remain competitive in scenarios prioritizing material circularity and established recycling infrastructure, while hydrogen systems are more suitable for long-duration and seasonal storage despite higher environmental impacts in the base case due to conversion losses and auxiliary energy consumption.
The findings also demonstrate that environmental performance should not be evaluated using a single indicator such as GWP. Different technologies exhibit trade-offs across impact categories, including resource use, toxicity, and cumulative energy demand, highlighting the importance of multi-indicator LCA approaches. Furthermore, negative LCOS values observed in some scenarios reflect net economic benefit under specific tariff structures and should be interpreted as net revenue per unit of delivered energy rather than conventional cost metrics.
From a broader perspective, the results confirm the validity of the proposed conceptual framework, showing that techno-economic and environmental outcomes are causally linked to optimization-driven energy flows under given input conditions. This highlights the importance of integrated assessment methods in supporting robust and transparent decision-making.
Several limitations should be acknowledged. The analysis is based on a single case-study dataset, which may limit generalizability. The LCA approach relies on simplified impact factors, while degradation effects and hydrogen system component behavior are represented using aggregated parameters. In addition, the economic model considers energy-only market participation and does not include stacked revenue streams such as ancillary services or capacity markets.
Future work should extend the framework to multiple case studies and geographic contexts, integrate detailed degradation and health modeling for both batteries and hydrogen systems, and incorporate multi-market participation strategies. Further research should also include full multi-indicator LCA based on detailed databases (e.g., ecoinvent or ELCD) and probabilistic uncertainty analysis.
From a policy perspective, the results suggest several actionable directions. The development of standardized certification frameworks for second-life batteries is essential to ensure safety and performance consistency. Clear allocation of responsibility for recycling and end-of-life management should be established through mechanisms such as extended producer responsibility. In addition, policy incentives should support circular economy pathways and shift focus from export-based remuneration toward self-consumption, flexibility, and emission reduction. Finally, differentiated policy support is required, recognizing the distinct roles of Li-ion, Pb-acid, and hydrogen technologies in future energy systems.
Overall, the proposed framework provides a robust basis for comparing energy storage technologies and supports more informed, system-level decision-making in the transition toward sustainable and resilient energy systems. The findings should be interpreted within the context of the adopted modeling assumptions, as the results reflect scenario-dependent outcomes rather than empirically validated causal relationships.
The results further suggest that the competitiveness of storage technologies is highly sensitive to policy design, particularly with respect to carbon pricing and circular economy regulations. This emphasizes the need to evaluate storage technologies within a policy-aware framework.
Future work will focus on integrating physics-informed or semi-empirical electrochemical degradation models, as well as data-driven state-of-health estimation techniques, to explicitly capture degradation pathways and module-level heterogeneity in second-life battery systems.
Future research should integrate time-dependent grid carbon intensity data into the optimization framework, enabling carbon-aware dispatch strategies that jointly optimize economic and environmental objectives. This approach would enable the transition from static LCA to dynamic, time-resolved environmental assessment.