1. Introduction
Climate change has become a primary concern for governments and companies, as its impacts have only intensified in recent years [
1]. The implementation of renewable energies has been on the rise; however, the total substitution of non-renewable sources for renewables is progressing slower than required to effectively mitigate environmental problems. Governments and industries are therefore focusing on expanding renewable energy deployment and on exploring both the development of new technologies and the improvement of existing ones [
2]. One of the most relevant areas of research in this context is the energy storage system (ESS), as it is essential for enabling a larger penetration of renewables. The ESS allows for the capture of excess energy generated during periods of low demand and its release when needed, thus improving the efficiency, flexibility, and stability of renewable energy systems [
3,
4,
5].
An important part of current ESS research is directed towards hybrid energy storage systems (HESSs), which combine different types of storage devices to maximize the advantages and applications of each while minimizing their disadvantages [
6]. This configuration increases the efficiency of the system and can also extend the lifetime of the storage elements, such as lithium-ion (Li-ion) batteries, thereby reducing costs [
7]. A HESS is generally composed of a high-energy storage system—which can store and release energy over long durations, such as batteries, compressed air energy storage (CAES), pumped hydro energy storage (PHES), or fuel cells—and a high-power storage system, which can deliver large amounts of power over short durations, such as supercapacitors, superconducting magnetic energy storage (SMES), or specific high-power batteries. The most common combinations under investigation involve pairing a high-energy battery with either a supercapacitor or a high-power battery [
8].
In this scenario, Li-ion batteries have emerged as one of the most promising technologies for HESSs due to their unique combination of high energy density, long cycle life, and relatively high efficiency compared to other electrochemical storage devices [
9]. Their modularity and maturity make them highly adaptable to both stationary and mobile applications, while their declining costs have accelerated large-scale deployment. Within the family of Li-ion batteries, different chemistries can be tailored to specific roles in a HESS. High-energy Li-ion batteries, such as NMC (Nickel–Manganese–Cobalt), are particularly suitable for providing long-duration energy storage because of their high specific energy, enabling them to store and deliver large amounts of energy over extended periods [
10]. In contrast, high-power Li-ion batteries, such as LTO (Lithium Titanate Oxide), are optimized for fast charge/discharge capability, high power density, and excellent cycle life, making them ideal for handling transient peaks or rapid load variations [
11]. By combining these complementary chemistries in a HESS, it is possible to exploit the advantages of both; the high-energy cells ensure sustained operation, while the high-power cells manage fast dynamics and reduce stress on the high-energy battery, thereby improving system efficiency, extending lifetime, and reducing overall costs. Many studies have demonstrated the effectiveness of such configurations for smoothing renewable energy fluctuations, improving electric vehicle performance and extending battery lifetime [
12,
13].
The best way to exploit the potential of this kind of system is by combining it with an appropriate control strategy. Control strategies improve the performance of the system, but the choice of the most suitable strategy for the specific configuration is crucial [
14]. These strategies can be broadly divided into two categories. The first are classical control strategies, which are conventional and relatively simple, making them easier to implement in real-time applications. They are typically based on static rules, which cannot adapt well to dynamic conditions and may lead to non-optimal solutions. The most used among them are proportional–integral–derivative controller (PID) controllers and rule-based strategies [
15]. The second category includes optimization-based strategies, which minimize a cost function to obtain optimal or near-optimal solutions. While methods such as Dynamic Programming (DP) and Pontryagin’s Minimum Principle (PMP) can achieve optimal results, they are computationally expensive and not suitable for real-time use [
16,
17]. On the other hand, Model Predictive Control (MPC) and other meta-heuristic strategies provide close-to-optimal solutions while remaining feasible for real-time operation [
18]. As highlighted in previous studies, MPC has shown strong potential for hybrid storage systems, as it incorporates system constraints and considers system dynamics effectively [
19].
As seen in Ref. [
14], direct comparisons between control strategies can only be made with the same system and objectives for each control, which problematizes the possibilities of these comparisons. Also, the high variety of control strategies can make all of them the best option for different objectives or for requirements for different types of systems. However, in some studies, some of these methods could be compared strictly regarding power and SOC values, especially between rule-based and optimization methods, resulting, as expected, in the optimization-based method usually having the best solution. Based on this idea and considering how the MPC is an optimization-based control and how implementation complexity is not a problem for the system, it is a better control option than most rule-based strategies. Compared to control strategies such as PID, MPC appears as a better option regardless of the solution, as it provides an easier way to consider the different variables for the control.
Usually, in these studies, the model only considers the elements from the storage system (battery–battery or battery–ultracapacitor) as the model affected by the control strategy chosen, which leads the control having a solution that diverges from the real system. In this study, not only are power electronics considered as part of the system but also the efficiency associated with the converter is explicitly considered for the control, with the aim of this being to achieve the best optimal solution in relation to the real-world system.
A further crucial aspect of achieving optimal operation in HESSs is the modeling of system components. Accurate models are indispensable both for the design of the control strategy and for evaluating system performance under realistic operating conditions. In particular, battery modeling is a central element, as it provides the basis for estimating parameters such as the state of charge (SOC) and the state of health (SOH). Among different modeling approaches, the Equivalent Circuit Model (ECM) stands out as a practical and reliable method, offering a balance between accuracy and computational efficiency [
20]. ECM-based models can capture the internal resistance, capacitance, and voltage response of batteries, making them particularly suitable for real-time SOC estimation and control implementation [
21].
Additionally, converter modeling plays a fundamental role, since converters are the interface between different storage elements and the grid or load. Neglecting the behavior of converters can lead to inaccurate performance assessment of the entire system. In particular, multi-port converters, such as dual active bridge (DAB)-based topologies, are widely studied in hybrid storage systems because of their flexibility and bidirectional power flow capability [
22]. However, their losses—including conduction, switching, and magnetic losses—must be considered in the model to avoid overestimating system efficiency [
23].
The novelty of this study lies in the combination of a multi-battery HESS composed of one LTO and two NMC modules, the use of a triple dual-active multi-port converter with explicit loss modeling, and the development of a nonlinear MPC framework. The modeling approach includes ECM-based battery models for SOC estimation and converter models with losses, aiming to provide a realistic evaluation of the performance and applicability of such systems in real-life scenarios. This approach enables more realistic performance assessment and greater operational flexibility across diverse scenarios, setting it apart from earlier contributions in the field.
Recent advancements in HESSs have explored nonlinear MPC strategies to enhance energy management. For instance, Ref. [
24] proposed a fast SOC balancing method for Modular Multilevel Converter Battery Energy Storage Systems (MMC-BESSs) based on nonlinear MPC, focusing on rapid balancing and computational efficiency. Similarly, Ref. [
25] developed a nonlinear MPC energy management strategy for hybrid power ships, emphasizing working condition identification. However, these studies primarily concentrate on SOC balancing and working condition identification without integrating detailed converter loss modeling or considering battery stress in the control strategy. In contrast, our study introduces a comprehensive approach by incorporating detailed multi-port converter models, including conduction, switching, and magnetic losses, into the nonlinear MPC framework. This integration allows for a realistic representation of power flow constraints and enables the controller to balance trade-offs between energy efficiency and battery stress, which has not been addressed in previous studies. Furthermore, we employ ECMs for both NMC and LTO batteries, ensuring accurate SOC estimation and capturing realistic battery behavior in simulations. This approach provides a more detailed representation of battery dynamics compared to earlier works. By combining these elements, our research offers a novel and practical solution for HESS control, advancing beyond existing studies in the field.
The effectiveness of this approach is demonstrated through two representative real-world scenarios: a residential renewable energy system and an electric vehicle application. In both cases, the MPC strategy successfully distributes the power demand among batteries, prioritizes LTO cells during transient peaks to protect NMC health, and considers converter efficiency to optimize overall system performance. Quantitative comparisons with uncontrolled operation highlight the benefits of the proposed control strategy, including improved efficiency, an extended NMC lifetime, and reliable power delivery under dynamic conditions.
Finally, the modeling approach, which combines ECM-based battery models with a detailed converter description, allows for a more accurate evaluation of system performance and provides insights into the trade-offs between efficiency, battery stress, and operational constraints. This makes the proposed methodology broadly applicable to various HESS applications, from stationary renewable energy integration to electrified transportation.
The research methodology that was used starts with an investigation on the state of the art of similar systems and the EMS used, coming to the next step of defining the model to be used (both batteries and control strategy); next, all the equations for the MPC were established considering the model. After all were defined, the next step was to search and determine the cases to be studied, leading to the correct tune of the MPC in order to obtain the best results possible. If there were problems with this first batch of results, the model, MPC equations, and tuning of this strategy were revised and changed in order to improve them, considering the cases. After obtaining good results, the model was improved by considering the power electronics involved in the system, leading to new tuning of the MPC, considering the level of restriction put on the new variables, and obtaining new results. If these new results were not good, the model, MPC, and tuning of the MPC were revised and changed to obtain better results. After the results were labeled as good, they were discussed and analyzed. In
Graph 1, there is a flowchart that shows this procedure.
This paper is structured as follows:
Section 2 presents the battery modeling approach;
Section 3 describes the converter model including loss mechanisms;
Section 4 details the MPC strategy;
Section 5 provides numerical validation and case studies;
Section 6 presents the results;
Section 7 presents the discussion of the results and
Section 8 concludes the paper.
Graph 1.
Flowchart of the research methodology.
Graph 1.
Flowchart of the research methodology.
2. Battery Model
Hybrid storage systems can offer higher efficiency and, especially, higher flexibility, since the advantages of each technology can be maximized while their disadvantages are minimized. In this study, the two elements of the configuration are Li-ion batteries of different chemistries, as their use is well established in the market and they offer a wide range of characteristics suitable for hybridization. Among them, NMC is selected as the high-energy device, while LTO is chosen as the high-power device. As mentioned, NMC batteries are characterized by their high specific energy and relatively low cost, which makes them suitable for supplying energy over longer periods in a stable manner. Conversely, LTO batteries are distinguished by their excellent power capability, long lifespan, and superior safety, as they can withstand high charge/discharge rates with minimal degradation, making them ideal for handling power peaks and frequent cycling.
As presented before, the system under study consists of a combination of three batteries/modules: one LTO and two NMCs. This configuration allows NMC to act as the primary source for long-duration energy supply, while LTO operates as a buffer to absorb rapid fluctuations and protect the NMC from excessive stress, thereby extending the overall system lifetime.
To accurately capture the dynamic behavior of these cells, ECMs are employed. ECMs were selected for this study because they provide a balance between modeling accuracy and computational simplicity, which is essential for real-time control. More complex electrochemical models may offer higher fidelity, but they are computationally demanding and unsuitable for embedded implementation. Conversely, ECMs are widely validated in the literature for SOC estimation, power prediction, and integration into optimization-based control frameworks.
The ECMs used in this work are parameterized from empirical data obtained from commercial cells. The selected NMC cell is an LG NMC cell with a nominal voltage of 3.63 V and a capacity of 4.85 Ah, while the LTO cell is a Hakami LTO cell with a nominal voltage of 2.4 V and a capacity of 1.5 Ah. For the model, both NMC cells are assumed to be identical and share the same parameter set. The models were coded in C language within a MATLAB environment, allowing for seamless integration into the simulation framework and direct compatibility with the MPC controller developed in later sections.
The ECM adopted is a resistive Thevenin model, which includes an open-circuit voltage (OCV) source dependent on the SOC and a series resistance (R0) representing internal losses. This model structure is sufficiently accurate to replicate the terminal voltage under most operating conditions while maintaining a low computational burden.
The terminal voltage of the battery is calculated as
with
k being each iteration of the defined discrete time and
I being the current in Ampere units.
The model is composed as a state space considering the SOC, which is calculated with the following equation:
where
β = {NMC, LTO} indicates the battery chemistry, ∆t is the discrete time step,
is the current of the batteries,
is the nominal capacity of the battery, and
is the Coulombic efficiency.
It is worth noting that the simplified battery model adopted does not fully capture all short-term transients, particularly under highly dynamic conditions, as for example the WLTP cycle in electric vehicles. While the simplified resistive Thevenin model adopted provides computational efficiency, it does not fully capture all electrochemical dynamics. In particular, higher-order models with multiple RC branches can reproduce diffusion-related phenomena and voltage relaxation more accurately. This may introduce slight deviations in SOC estimation and terminal voltage prediction during rapid accelerations or braking.
Despite these limitations, the simplified ECM is widely validated in the literature and offers a good trade-off between accuracy and computational cost. Therefore, for the purposes of this work, where the MPC controller operates at the system level to manage power flows between NMC and LTO batteries, the model provides sufficient fidelity to ensure proper tracking of the power demand profile while remaining suitable for real-time implementation. In particular, the MPC strategy operates on a system-level horizon, ensuring correct energy distribution between the NMC and LTO batteries to meet the power demand profile. Thus, the potential modeling inaccuracies at very fast timescales do not compromise the overall performance of the proposed control approach.
Therefore, the presented formulation enables the model to capture SOC evolution, terminal voltage, and power exchange while maintaining low computational effort, which is crucial for real-time operation in the MPC framework. Moreover, the distinction between NMC and LTO is preserved in the model through their parameterization; NMC cells are modeled with higher capacity but lower current tolerance, while LTO cells are parameterized with a higher admissible current and lower energy density. In this way, the models reflect not only the electrochemical differences but also the functional roles of each chemistry within the hybrid storage system.
All these parameters and variables appear summarized in
Table A1 in
Appendix A, which lists their values, descriptions, and units for clarity. As can be noticed in
Table 1, which shows the numerical values for the different cases of study, NMC cells have a greater capacity than LTO chemistry.
3. Power Electronics
The configuration for power electronics requires consideration of the different chemistries of the batteries. One of the options used frequently in previous investigations is the multi-port converter due to its bidirectional controlled power flow capability, which facilitates the power exchange between batteries and reduces the number of conversion stages compared to using separate converters.
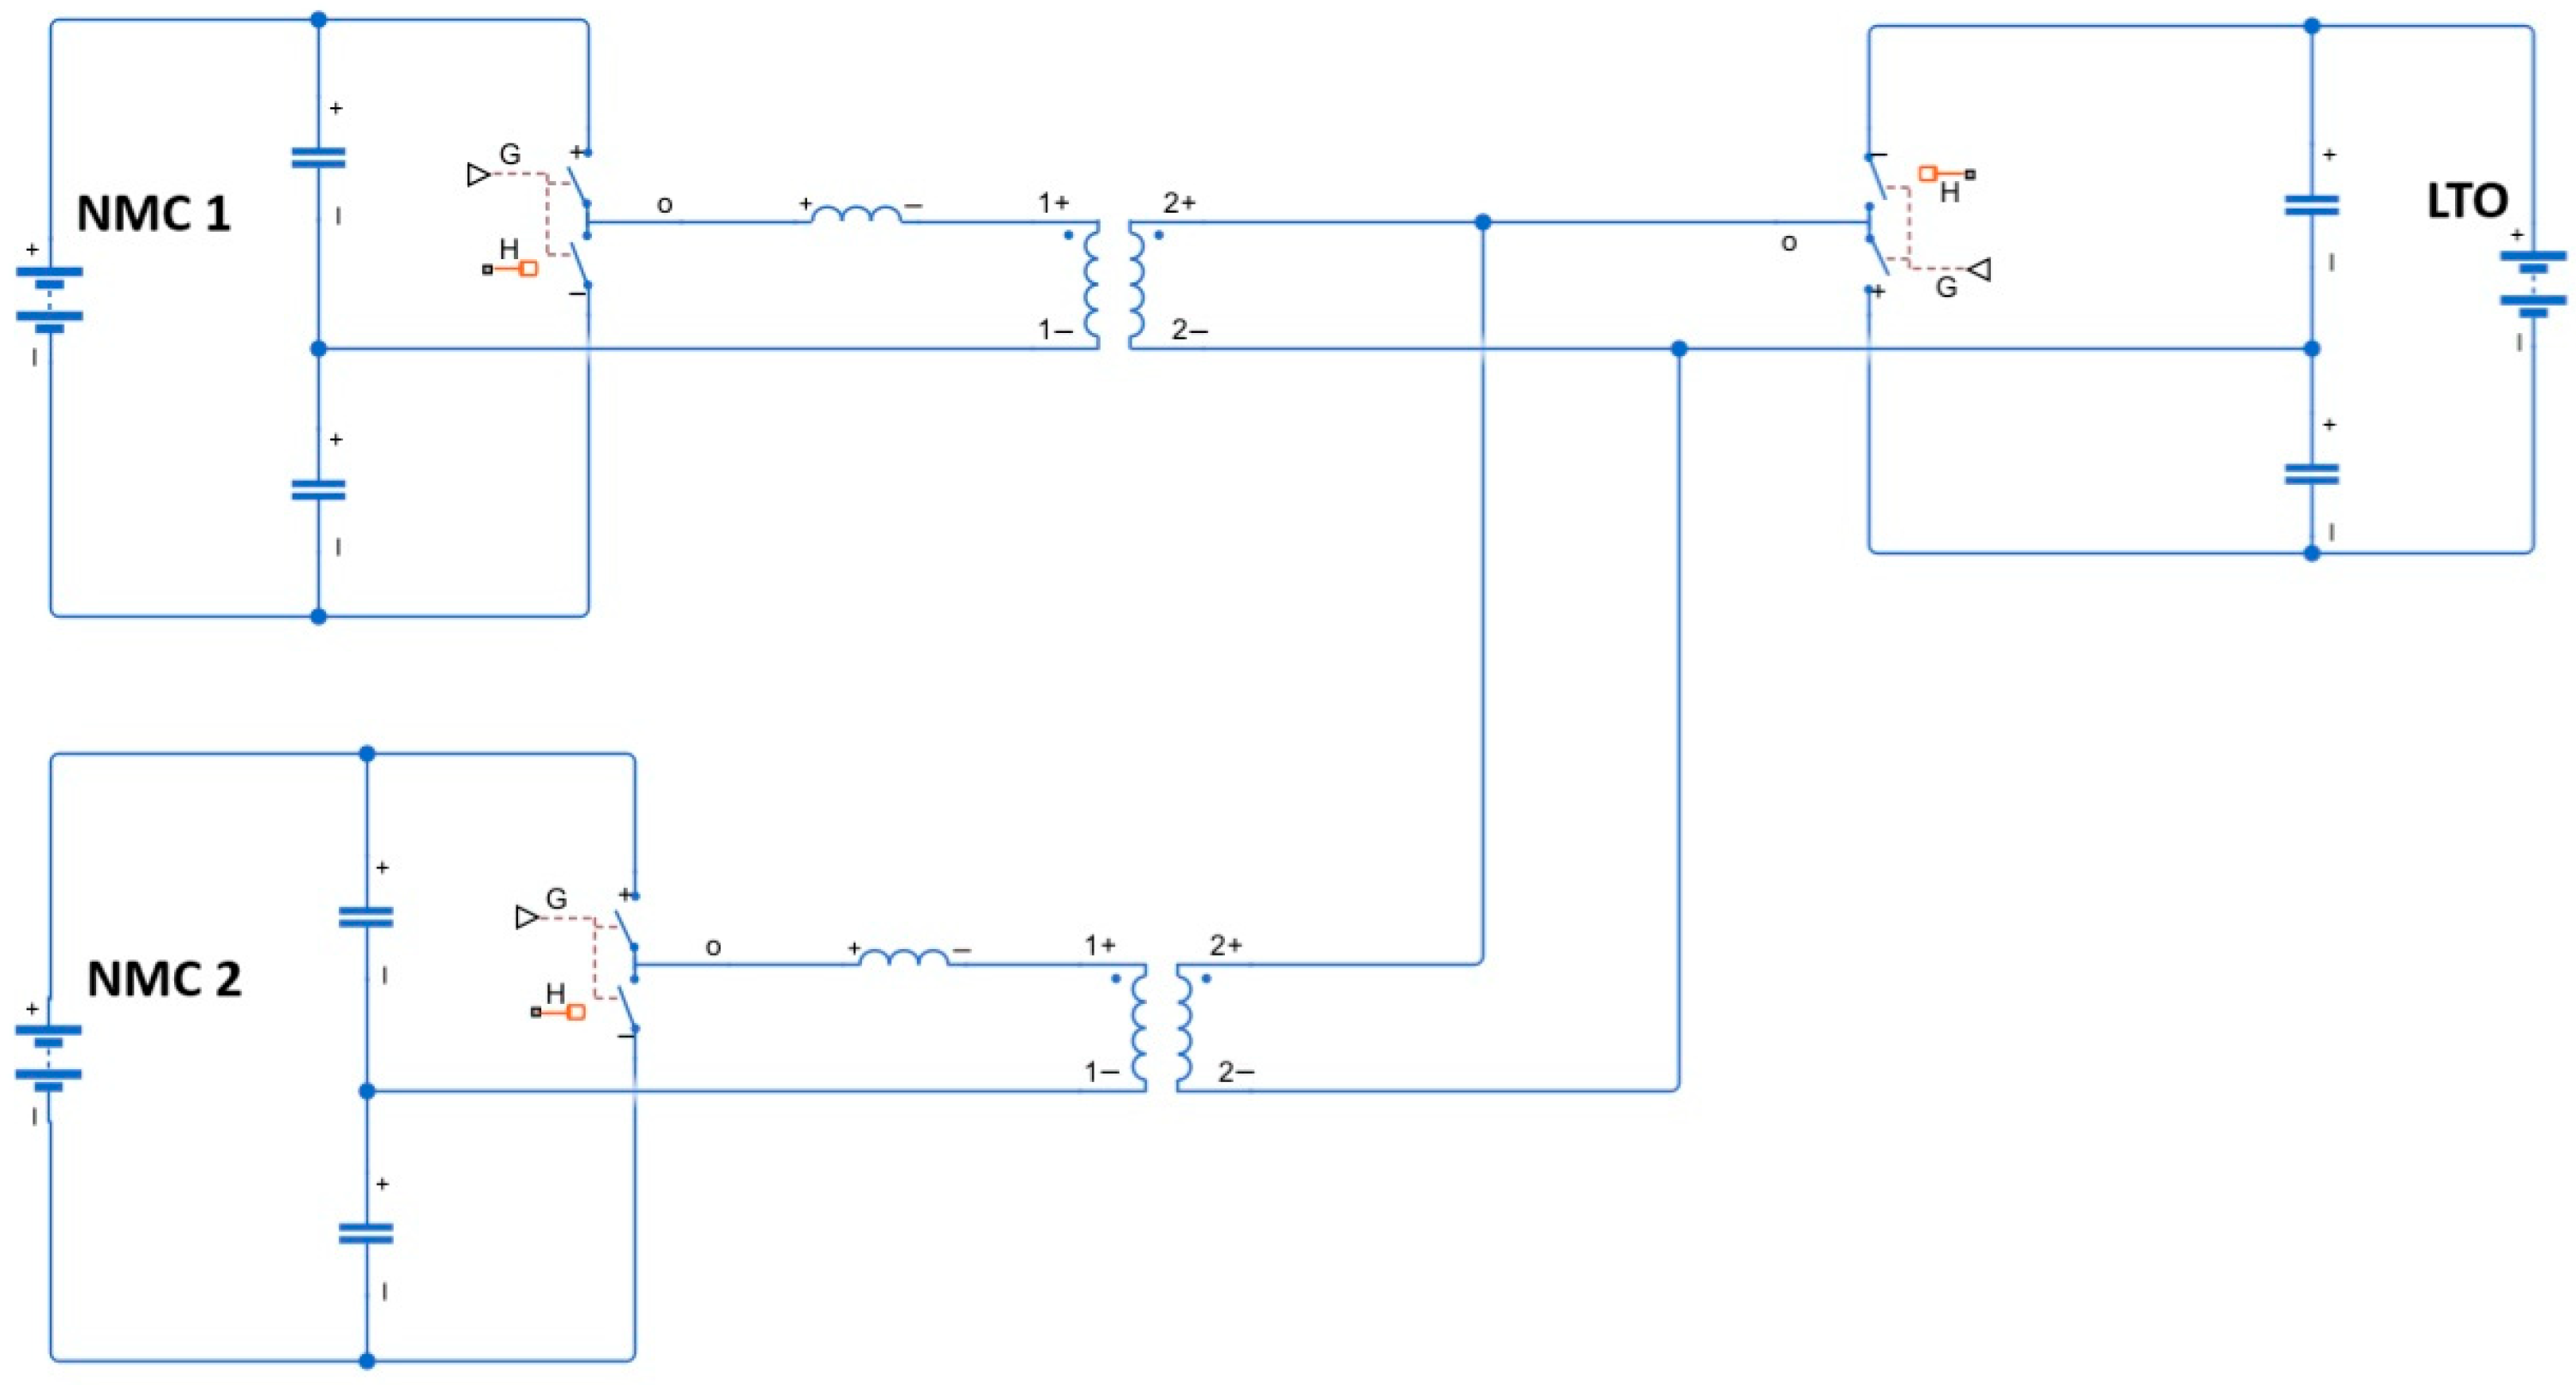
From this family of converters, the option selected for this system is a two-level triple-active bridge (TAB), composed of three half-bridges from switches and a high-frequency transformer, dividing each battery into different modules. In this configuration, the two NMC modules (NMC 1 and NMC 2) are connected to the external ports of the transformer, while the LTO is connected to the internal port. This structure makes it possible to efficiently transfer power among the three modules while maintaining galvanic isolation. The architecture of the converter implemented in Simulink is shown in
Figure 1.
The main advantage of this converter, as expressed before, is the easy transfer of power between the modules and batteries, with the additional benefit of compactness compared to using several DABs. The LTO, connected to the central port, can absorb or deliver fast power variations, while the NMC modules contribute stable energy over longer durations.
From the way the converter works and especially related to the control, it can be simplified to an equation associating the current from each battery with the required angle
φ, which is directly related to the power the converter transfers. This formula is expressed as
where
corresponds to the LTO voltage,
relates to the different inductors for each half-bridge of the converter, with all of them having a value of 330 nH, and
is the angular frequency.
With respect to the angular frequency, it can be calculated by means of the following equation:
where
is the switching frequency of the converter, which has a value of 50 kHz. It is also important to consider that the angle
φ is subject to a theoretical constraint that limits its value to the range −
to
, which ensures safe and stable operation. All converter parameters and variables are summarized in
Table A1.
In addition to the basic power transfer, the efficiency of the converter must be considered in the model. In real applications, losses arise from conduction in semiconductor devices, transformer windings, switching events, and magnetic components. To reflect this, an efficiency profile as a function of current and output power is included in the model, based on experimental or literature-derived curves. This enables the controller not only to determine the power split among the batteries but also to account for the impact of converter losses, improving the realism of the optimization process.
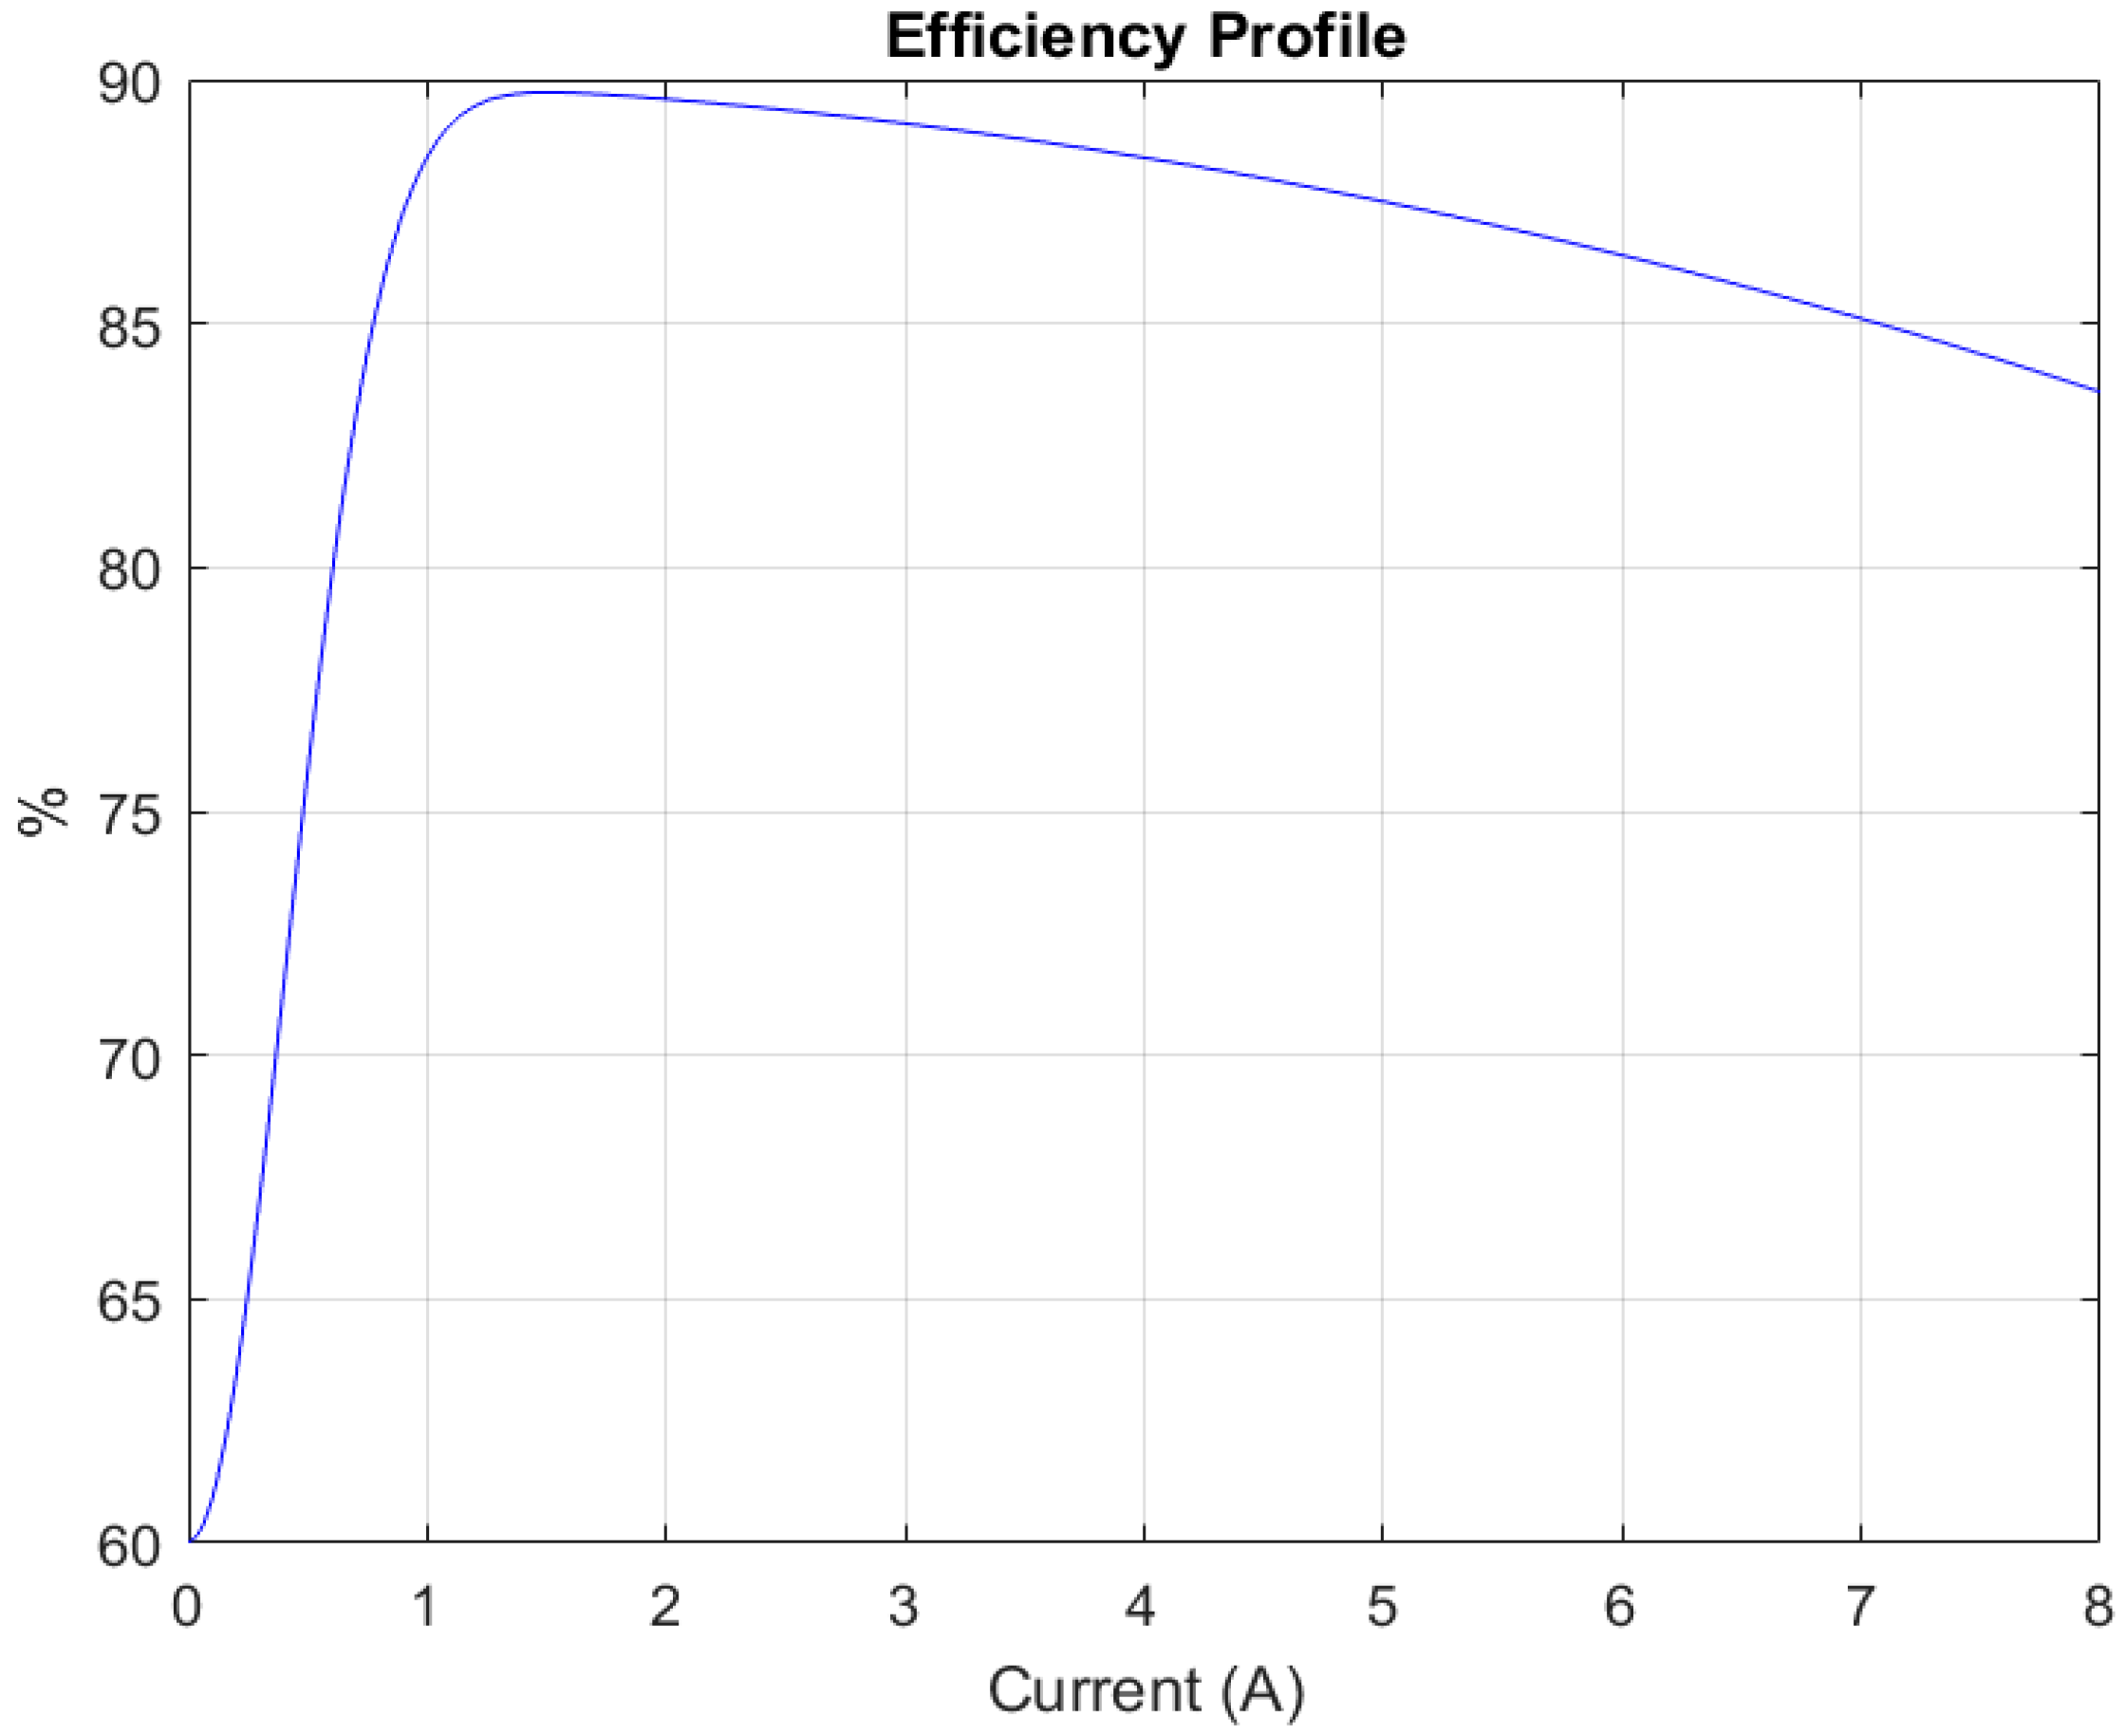
The converter efficiency profile used in this work is shown in
Figure 2 and was generated in version R2024b in MATLAB based on experimental results reported in the literature. In particular, the curve was reconstructed from [
26], which provides a detailed analysis of bidirectional DC-DC converter efficiency in hybrid energy storage applications. In that study, efficiency is expressed as a function of the output current, exhibiting a characteristic shape: lower efficiency at very low currents, a peak between 1 and 2 A, and a gradual decrease in efficiency as the current increases further. Accordingly, in this work, the efficiency profile reflects the same behavior, with values ranging from 60% to nearly 90%, and a maximum at approximately 1.5 A.
It is important to note that, although efficiency may vary with operating conditions such as temperature or switching frequency, a single representative profile has been adopted in this study to ensure tractability. This simplification enables the proposed optimization strategy to explicitly account for converter performance while maintaining the computational efficiency required for control-oriented applications.
By combining the simplified analytical equation with efficiency modeling, the TAB converter representation achieves a good balance between accuracy and computational simplicity, which is essential for embedding the converter dynamics into the MPC framework presented in
Section 4.
4. Model Predictive Control
The optimization of the hybrid battery system must be selected considering the main objectives of this study: improving system efficiency and ensuring a high degree of operational flexibility. As previous studies have shown, the application of any control strategy to hybrid storage systems already improves the behavior of the batteries. However, achieving the flexibility required is only possible with more advanced optimization-based strategies. After evaluating different approaches, MPC was selected as the most suitable optimization strategy.
MPC is an optimization/control method characterized by the use of an objective (cost) function that is minimized subject to a set of constraints [
27]. The method relies on a predictive horizon, over which the future behavior of the system is forecast using a state-space model. At each sampling step, the MPC solves a nonlinear optimization problem over a finite control horizon, where the manipulated variables are the battery currents. The objective is to minimize the total cost function while satisfying constraints on current limits, SOC bounds, and converter operation. Only the first control action is applied, and the optimization is repeated at the next time step in a receding-horizon fashion, allowing the controller to anticipate future power demands and disturbances. This approach allows the controller to anticipate future events and disturbances, which leads to near-optimal solutions at each iteration. Given the nonlinear nature of battery models, a nonlinear MPC formulation is employed in this work, providing a more accurate description of the system at the expense of increased computational complexity.
In contrast to linear MPC, which assumes that the system dynamics can be approximated by linear models, the nonlinear MPC employed in this study explicitly accounts for the nonlinear behavior of both the battery and converter models. This is particularly important for HESSs where cell voltage, internal resistance, and converter efficiency vary nonlinearly with current and SOC. By incorporating these nonlinearities directly into the optimization problem, NMPC provides a more accurate prediction of system behavior, leading to better control performance, reduced battery stress, and improved efficiency compared to linear approximation. Although NMPC requires higher computational effort, the use of existing optimization solvers facilitates the problem.
For the hybrid battery system considered here, which consists of three battery modules (two NMC and one LTO), the MPC optimization is formulated based on the equivalent circuit models introduced in
Section 2. The manipulated variables are the currents of the three batteries, and the cost function is designed to penalize deviations from the desired current sharing. Specifically, the quadratic cost function is defined as
where
are the battery currents (manipulated variables), and
are the weighting factors assigned to each battery
= {NMC1, NMC2, LTO}, which are typically tuned empirically.
It is important to note that, although there are no theoretical values for the weighting factors in a MPC problem, certain criteria can be established to properly select their numerical ranges and practical values. According to the literature, small values favor fast, aggressive responses to reach targets, while large values promote smoother control actions and protect actuators.
In the case of the hybrid battery system, the values of can be chosen according to the desired behavior of each battery. On the one hand, higher weights are assigned to penalize the use of NMC modules, thereby limiting rapid current variations. On the other hand, lower weights are assigned to the LTO module to encourage its role in absorbing peak demands.
Accordingly, for current weights, values of 5–20 are recommended for NMC modules, while 0.2–5 are suggested for LTO modules. This difference reflects the distinct electrochemical characteristics: NMC cells are sensitive to current stress, with high charging/discharging currents accelerating degradation, increasing thermal risk, and reducing cycle life. Conversely, LTO cells exhibit high power capability and excellent tolerance to high C-rates, which allows for lower penalties and more aggressive operation without compromising safety.
One of the main strengths of MPC is the ability to incorporate constraints directly into the optimization problem, which is crucial in battery applications. The first essential constraint is the power demand balance, ensuring that the sum of the power delivered by the three batteries equals the total system demand, as follows:
where
are the powers of the three batteries and
is the required power demand at time step
. Depending on the case study, this equation may also include other sources or sinks, such as capacitors or the electrical grid. The power of each battery is computed as the product of its voltage and current, calculated in simulation using the ECM-based models.
As mentioned, limiting the current is necessary to ensure the safe operation of the system, in order to avoid possible spikes that could damage the electronic components or even the batteries themselves. For this reason, it is common to define minimum and maximum current limits for each battery, which are usually specified in the cell manufacturers’ datasheets. Thus, the following second set of constraints has been introduced to limit the current within safe bounds:
where
Iβmin and
Iβmax are obtained from the manufacturer datasheets. These limits prevent current spikes that could damage power electronic components or accelerate battery degradation.
Finally, there is a constraint regulating the SOC of the batteries to prevent overcharging or deep discharging. This constraint has been formulated by imposing minimum and maximum SOC bounds, which in practice depend on the battery chemistry and are usually specified in the manufacturer’s datasheets. This third constraint has been defined as follows:
where
and
are the allowable SOC boundaries for each chemistry, and
are slack variables that allow for temporary, controlled violations of the SOC constraints. These slack variables are incorporated into the cost function as
where
are weights penalizing the violation of SOC bounds. This approach, commonly known as soft constraints, ensures that the optimization problem remains feasible even under dynamic and unexpected conditions, while discouraging operation outside the safe limits.
For this constraint, the weighting factors are substantially higher compared to the current ones, with recommended ranges of 10–100 for NMC and LTO. This reflects the critical nature of SOC limits. NMC modules have a narrow safe operating window (typically 10–90%), so violations are heavily penalized to prevent degradation and safety hazards. LTO modules have a wider safe operating window and can tolerate deeper cycling, allowing for lower penalties while still discouraging violations.
The final optimization problem solved at each time step
over the control horizon
is formulated as
This formulation balances two main objectives: (i) performance, by penalizing deviations in current distribution across the batteries, and (ii) safety, by ensuring that SOC and current constraints are satisfied as much as possible. By embedding both aspects, the MPC strategy ensures safe, efficient, and robust operation of the hybrid storage system while adapting to disturbances, uncertainties, and highly dynamic power demand conditions.
Therefore, the problem formulation is based on solving Equation (10) while ensuring that all previously defined constraints are satisfied. As mentioned, the manipulated variables are the battery currents, which, through the ECMs introduced in
Section 2, allow for the prediction of the evolution of the SOC and terminal voltage. These terminal voltages are then used to calculate the powers involved in the presented optimization problem. Thus, at each sampling step, an optimal current value is obtained for each battery in the HESS, minimizing the cost function while respecting all operational constraints.
Several assumptions are considered in this formulation. First, the battery and converter models accurately represent the system dynamics over the prediction horizon. Second, all operational limits, including current, SOC, and converter constraints, are known and deterministic. Third, the optimization problem assumes perfect measurement of the battery states at each step, allowing the controller to update predictions and compute the optimal currents in real time.
For numerical implementation in this work, the nonlinear MPC problem is solved in MATLAB/C using the fmincon solver, which handles the nonlinear constraints and provides the optimal battery current profiles. To improve convergence and computational efficiency, the solver quadprog is used to compute an initial approximation of the solution by solving a related quadratic problem. This combination ensures that the optimization is both accurate and computationally tractable for real-time simulation.
All MPC parameters and variables are explained and summarized in
Table A1. With respect to the values of parameters such as the weights or bounds, they have been defined depending on the case of study presented in the next section.
5. Cases of Study
For the evaluation of the performance of the system selected, and to analyze the chemistries of the batteries, architecture of the system, and chosen control strategy, this system needs to be evaluated in real-time scenarios. Considering the main applications of storage systems, the best way to prove the effectiveness of this system is by proving it regarding electric vehicles and renewable energy systems; thus, two different cases centered on these applications were chosen for this study.
The first case is about a renewable energy system composed of a photovoltaic system and a grid in addition to the storage system, while the second case is about an electric vehicle with its demand based on the Worldwide Light Vehicles Test Procedure (WLTP).
All the analyses were carried out in simulation, with the entire system implemented in code C. In the simulations, the batteries are represented by a single module—in the case of the LTO, composed of six cells in series, and in the case of the NMC, composed of four cells in series—in order to provide a higher energy storage capacity.
For the case studies presented, where real data from different sources have been considered, the power demand has been scaled to match the limited capacity of the modeled NMC and LTO cell modules. This approach was selected to facilitate the analysis and to illustrate the operation of the proposed HESS in the applications mentioned. It is worth noting, however, that in real implementation the correct dimensioning of the number of cells and modules is a crucial step to ensure that both power and energy demands are satisfied. In such cases, the constraints defined in the control strategy could be linearly scaled when moving to kW-range systems, while other parameters, such as the weights, may remain unchanged as they reflect relative priorities among system variables. Nonetheless, fine adjustment of these weights may be advisable in practical large-scale applications to guarantee the desired balance between performance, safety, and efficiency.
The strategy followed by the MPC control revolves around the characteristics of the chemistries of the batteries, as the LTO is encouraged to be the main supplier while it is preferred for the NMCs to be constant regarding their power supply. This way, the NMC is protected from the power and current peaks and is able to improve its lifespan.
The physical characteristics of the converter and battery modules are summarized in the following
Table 1. As can be noticed, the batteries are defined by a maximum current of 14.55 A for NMC and 12 A for LTO and a safe range of SOC values between 0.1 and 0.9. These values have been chosen considering the datasheets of the commercial cells LG NMC and Hakami LTO, whose ECMs have been obtained using experimental data.
Table 1.
Physical parameters of the converter and NMC and LTO modules.
Table 1.
Physical parameters of the converter and NMC and LTO modules.
| Variable | Value | Units |
|---|
| 1 | S |
| 4.453 | Ah |
| 1.5 | Ah |
| 0.95 | - |
| 0.9 | - |
| −14.55 | A |
| 14.55 | A |
| −12.99 | A |
| 12.99 | A |
| 0.1 | - |
| 0.9 | - |
| 0.1 | - |
| 0.9 | - |
| 330 | nH |
| 50 | kHz |
5.1. Case A: Renewable Energy System
As previously stated, the first case evaluates the performance of the HESS within a renewable energy system composed of the storage system and a photovoltaic (PV) system connected to the electric grid and with the objective of supplying the power demand expected from a household. The demand profile used for this case comes from the CREST Demand Model, a stochastic integrated thermal–electrical domestic demand simulation tool developed by Eoghan McKenna and Murray Thomson [
28]. This model simulates power demand based on the average electricity consumption of 15,000 households in the United Kingdom while also providing the corresponding PV generation profile from the same stochastic simulation tool.
For this study, the demand profile corresponds from a typical day in June near the city of Birmingham and represents the electrical consumption of a single household over one weekday and one week. For simplicity, all weekdays (Monday to Friday) are assumed to follow the same demand profile, while Saturday and Sunday are assigned different demand patterns.
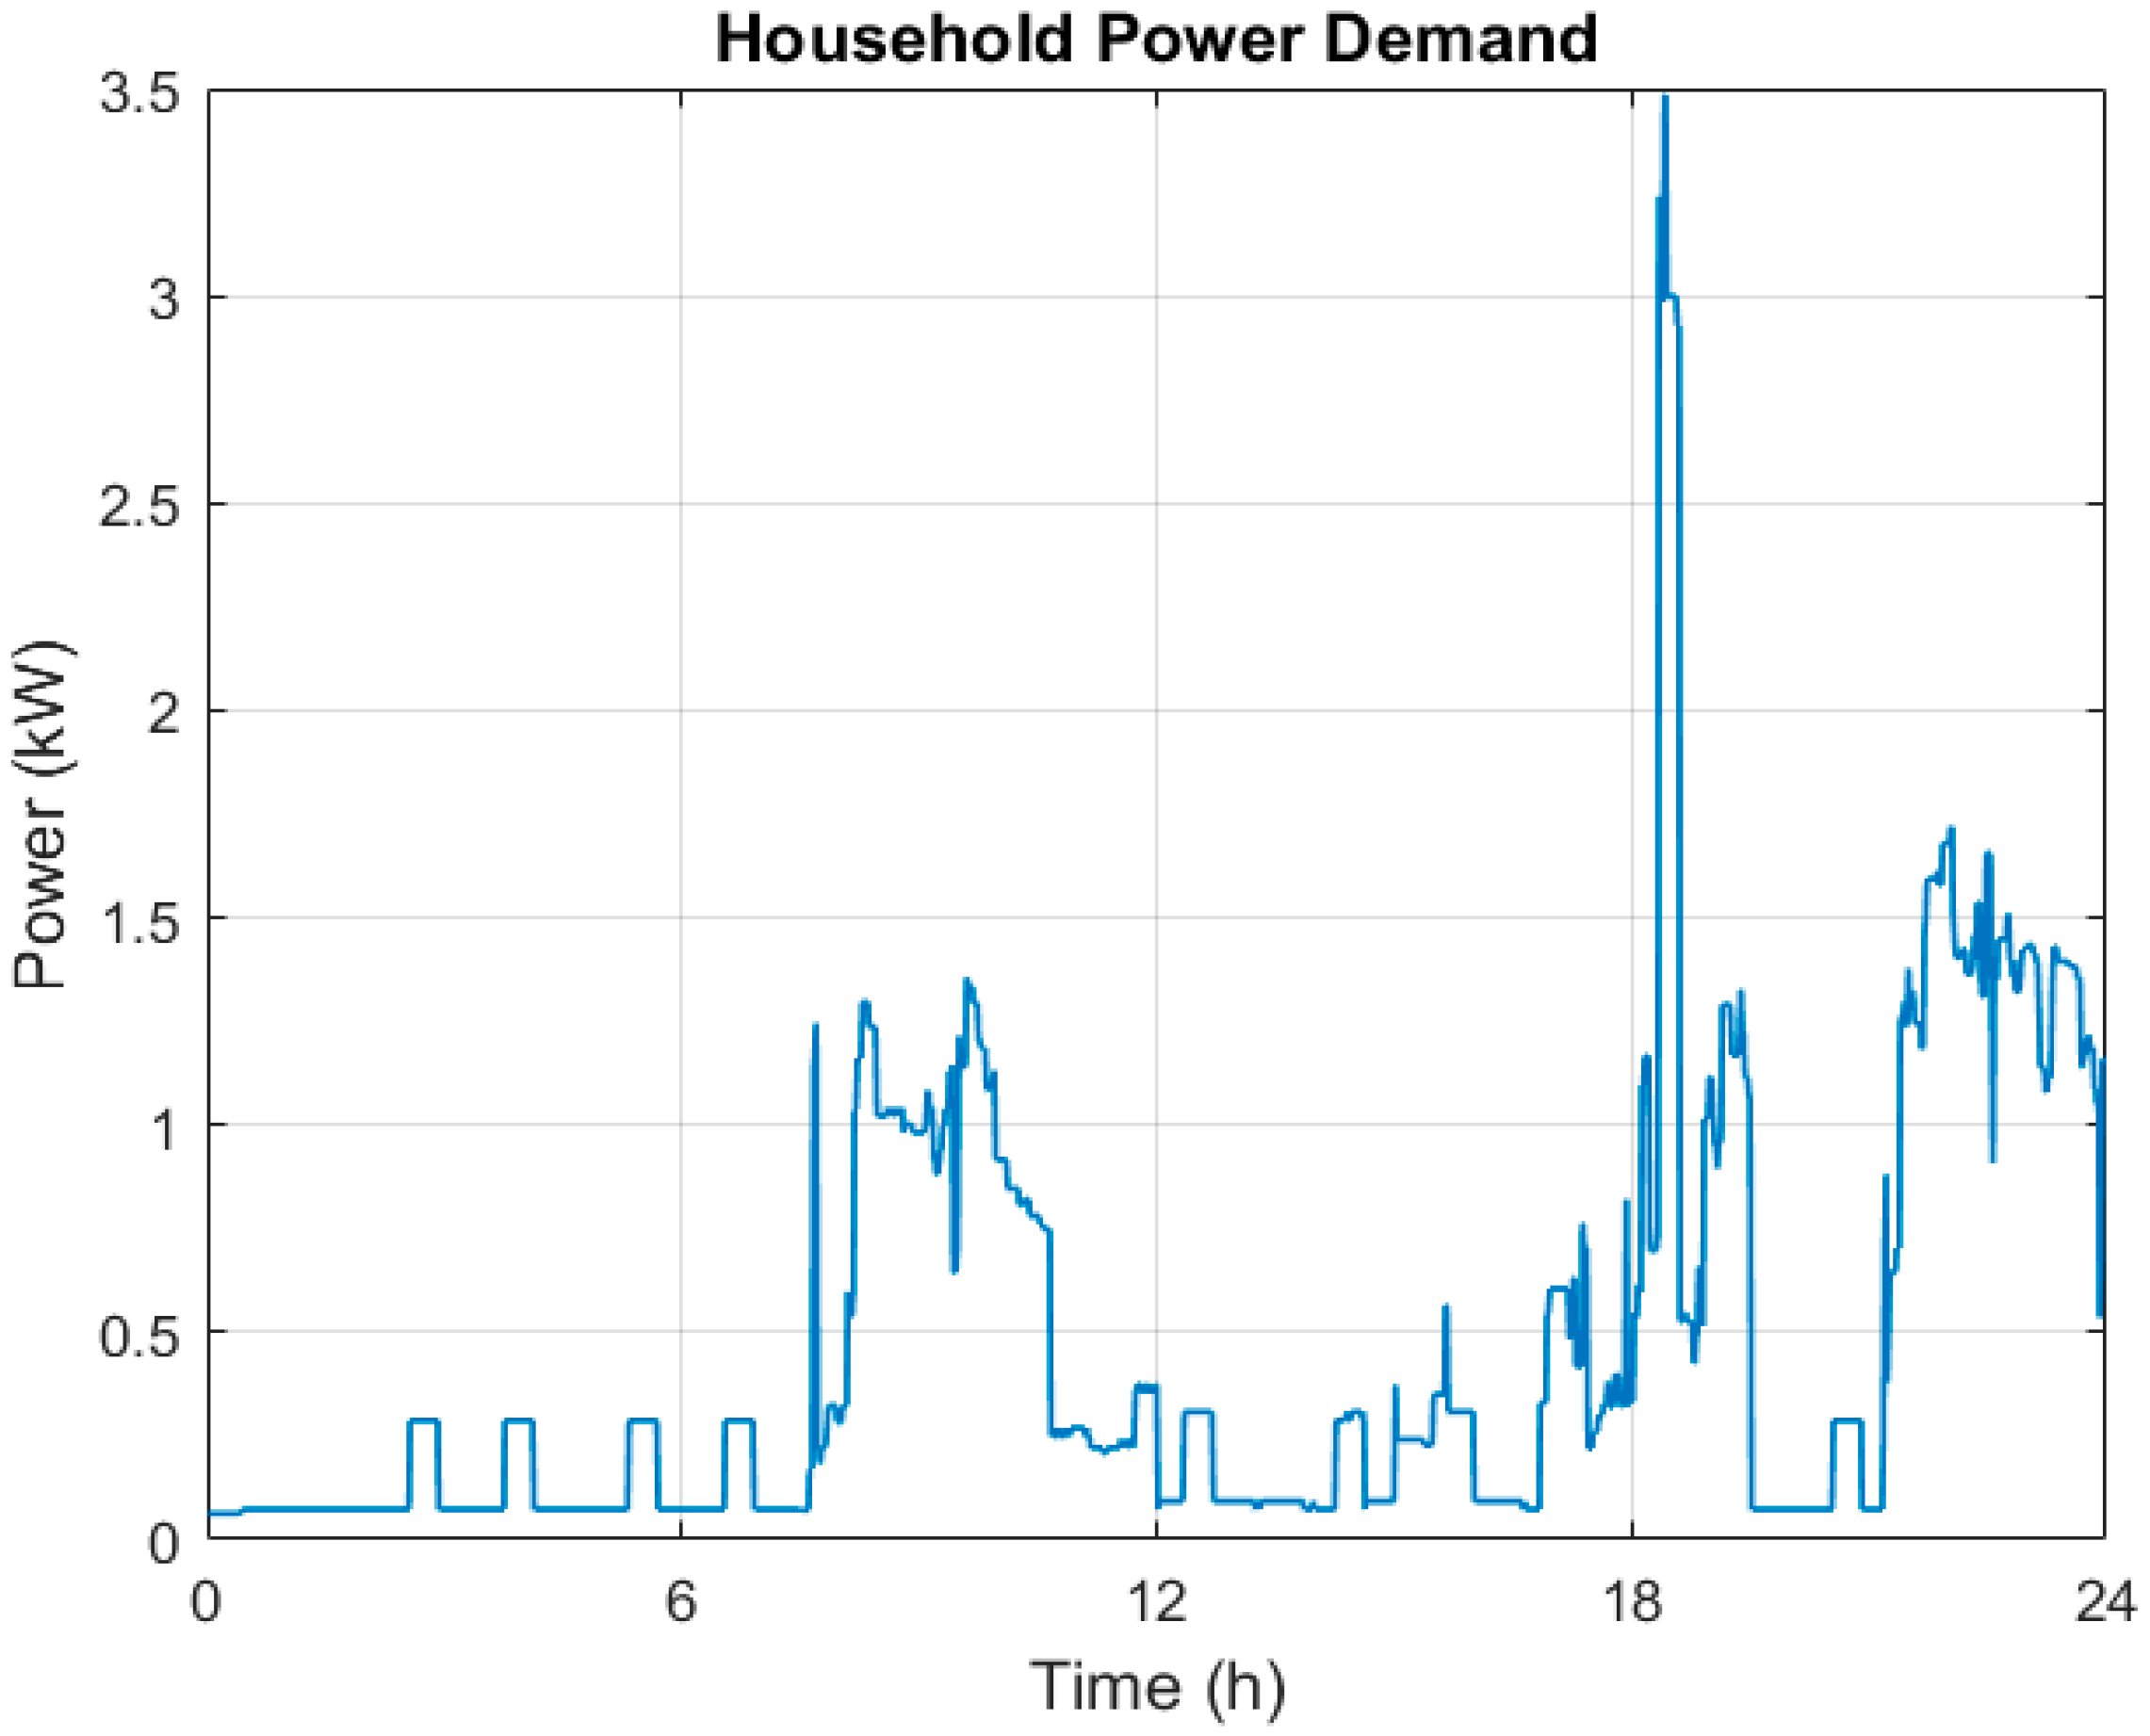
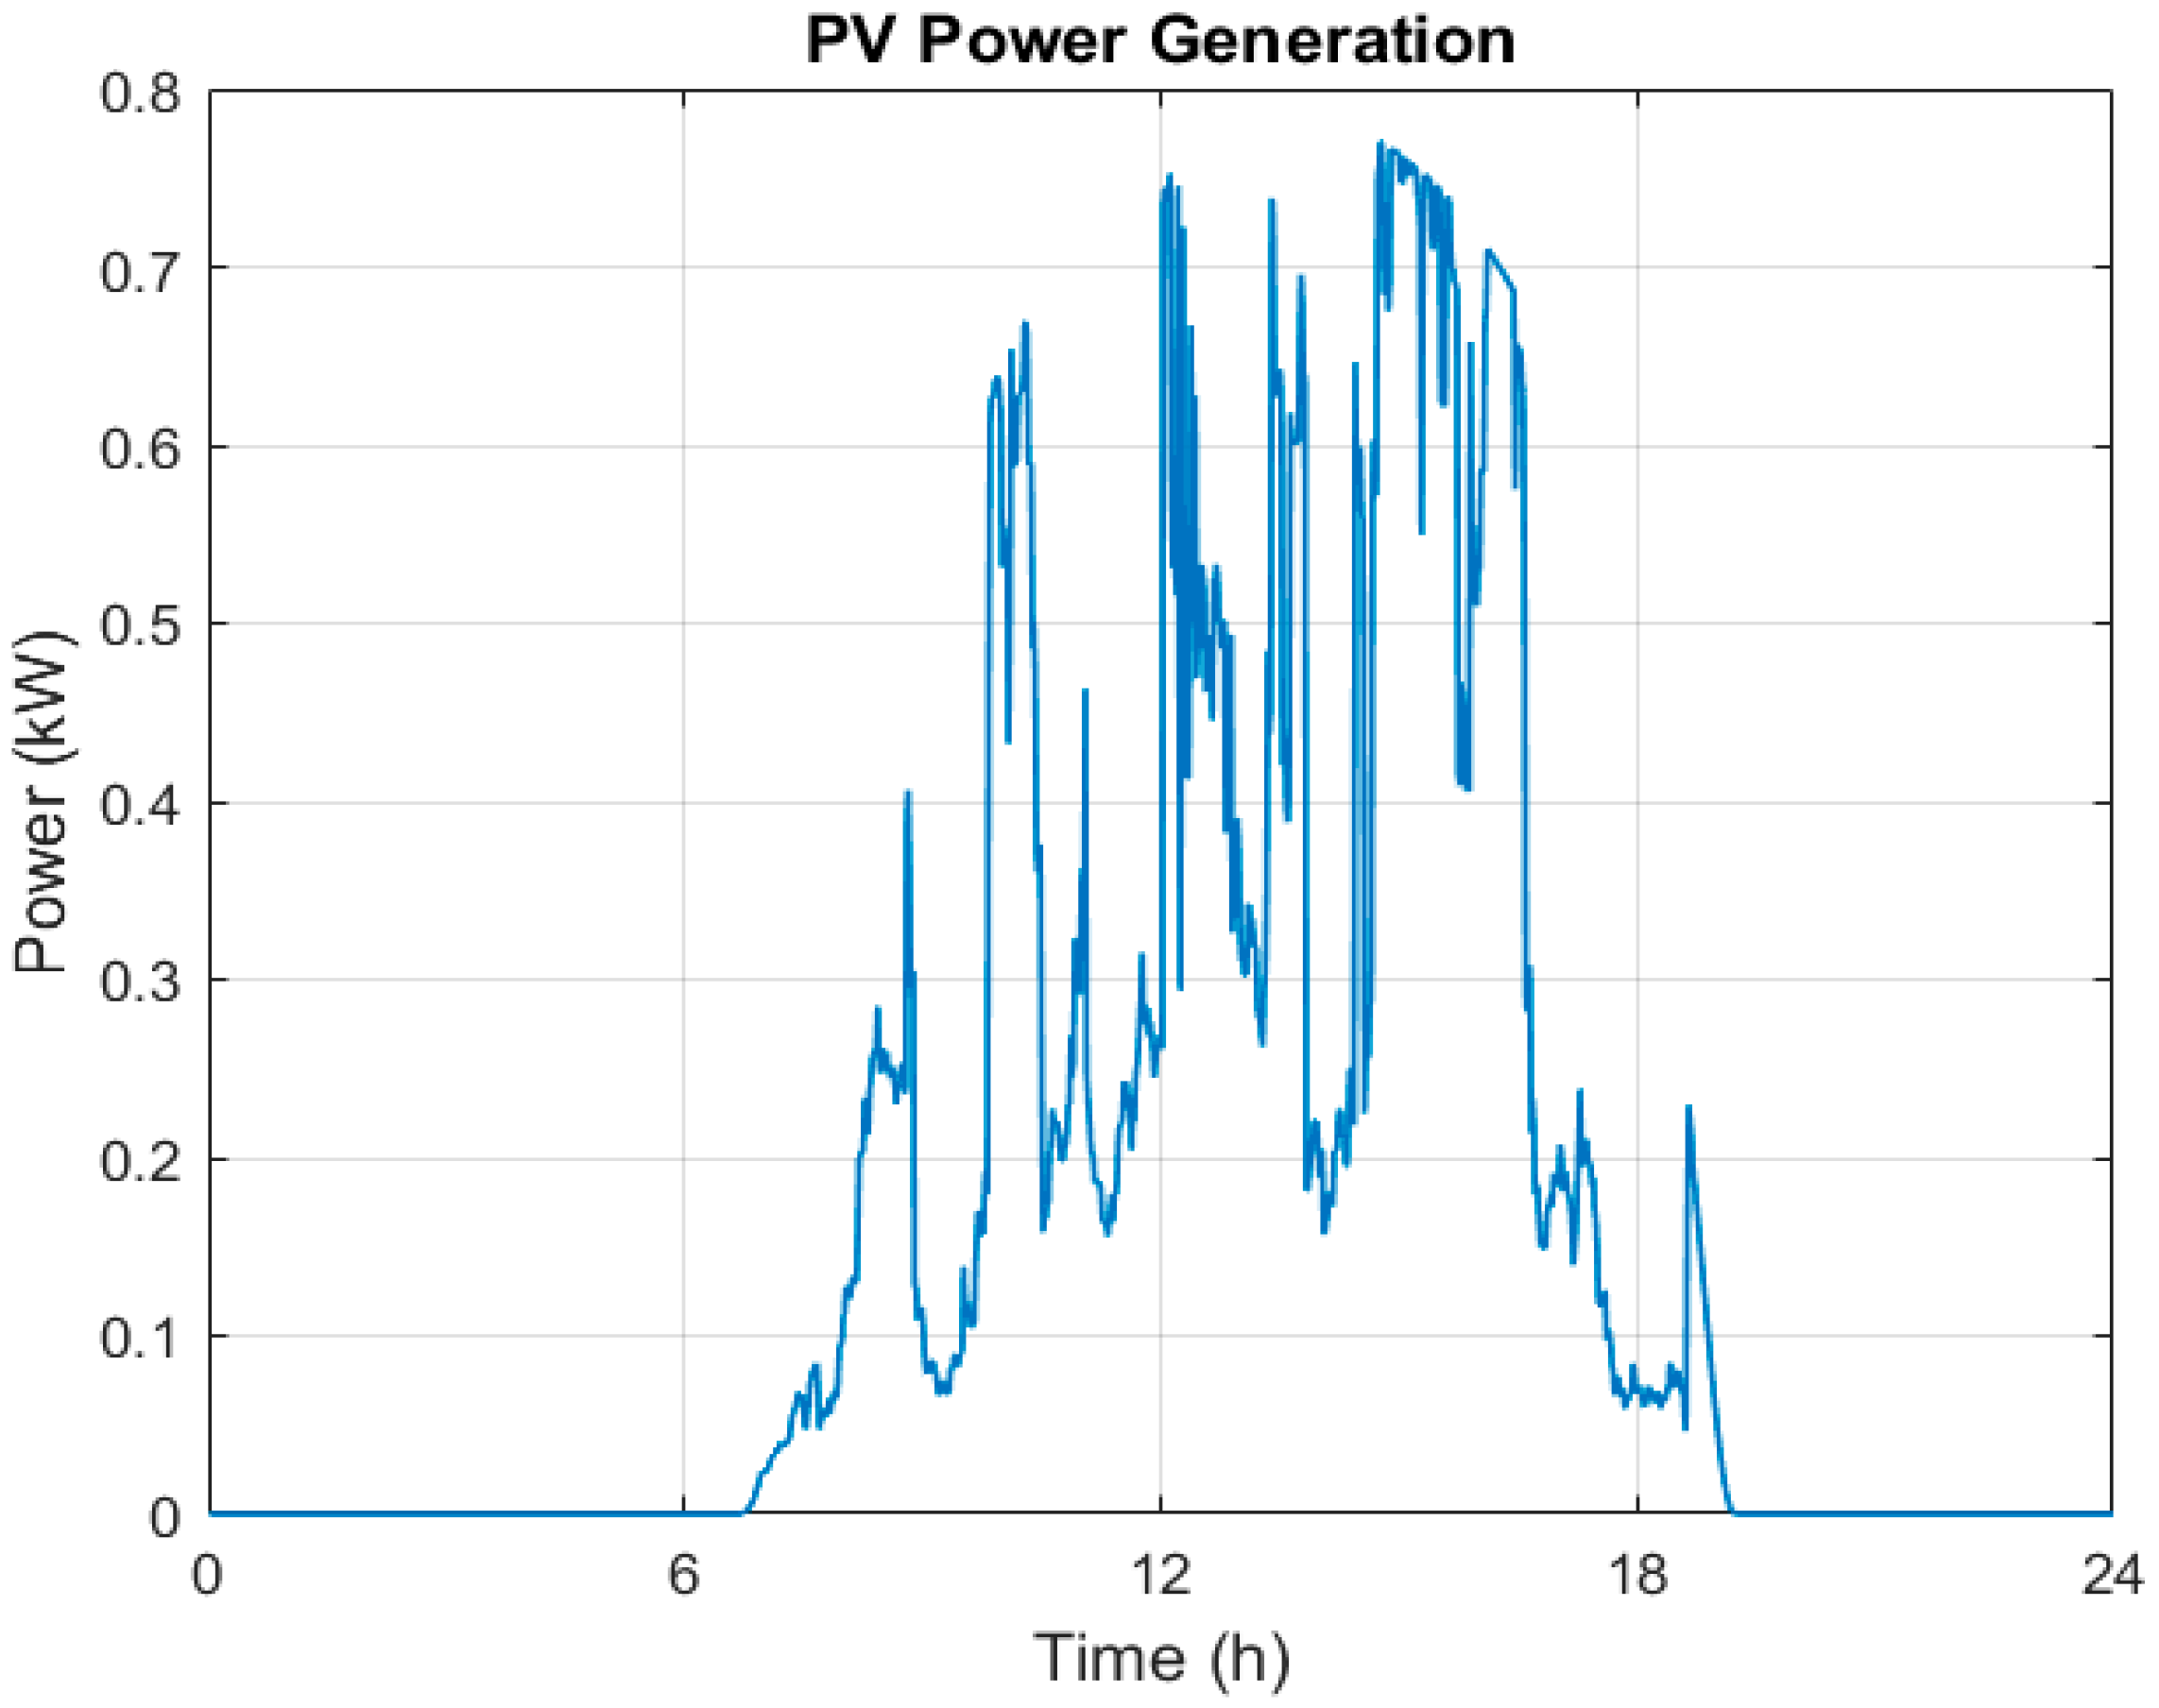
The household power demand and PV generation profiles for weekdays are shown in
Figure 3 and
Figure 4, respectively.
From
Figure 3, the profile of the power demand for all 24 h can be divided into five time periods which correspond to different levels of activity and occupation inside the house. This time periods correspond to the following:
- -
Early morning (00–06 h): The power demand is at its lowest, close to the baseline consumption from the stand-by appliances.
- -
Morning (06–10 h): The consumption increases around 1–1.5 kW, as there is also an increase in the use of the appliances and lightning from their morning routines.
- -
Midday (10–16 h): There is a decrease in consumption as there is a decrease in the activity and occupation in the household. The consumption happens to be a little over the one registered in the early morning
- -
Afternoon–Evening (16–21 h): In this period, the household is considered to be in peak activity and occupation, characterized by the biggest peaks (3.5 kW) in electricity.
- -
Night (21–24 h): The power demand is still very high (between 0.5 and 1.5 kW) and decreases in time as people go to bed.
These periods can be divided as two of them being low demand and three being high demand, alternating during the day and corresponding to the usual activity in a household, being at its highest between the afternoon and the night.
Figure 4 presents the PV power generation profile for a weekday for the same 24 h as the power demand. The generation starts shortly after sunrise (between 6 and 7 h), increasing until it reaches its peak at midday and early afternoon (between 0.6 and 0.8 kW for all these hours) and starts to fall at 17 h until 18:30 when it reaches 0 kW.
Combining both profiles, there is a clear mismatch between both of them; the highest power demand revolves around the hours when there is lower or no photovoltaic generation. The main objective of the storage system is to balance this supply and demand.
For this particular case, the power demand has been scaled to a maximum of 100 W to ensure that the different modules can supply most of the required energy. In addition, the grid has been considered as a supporting element.
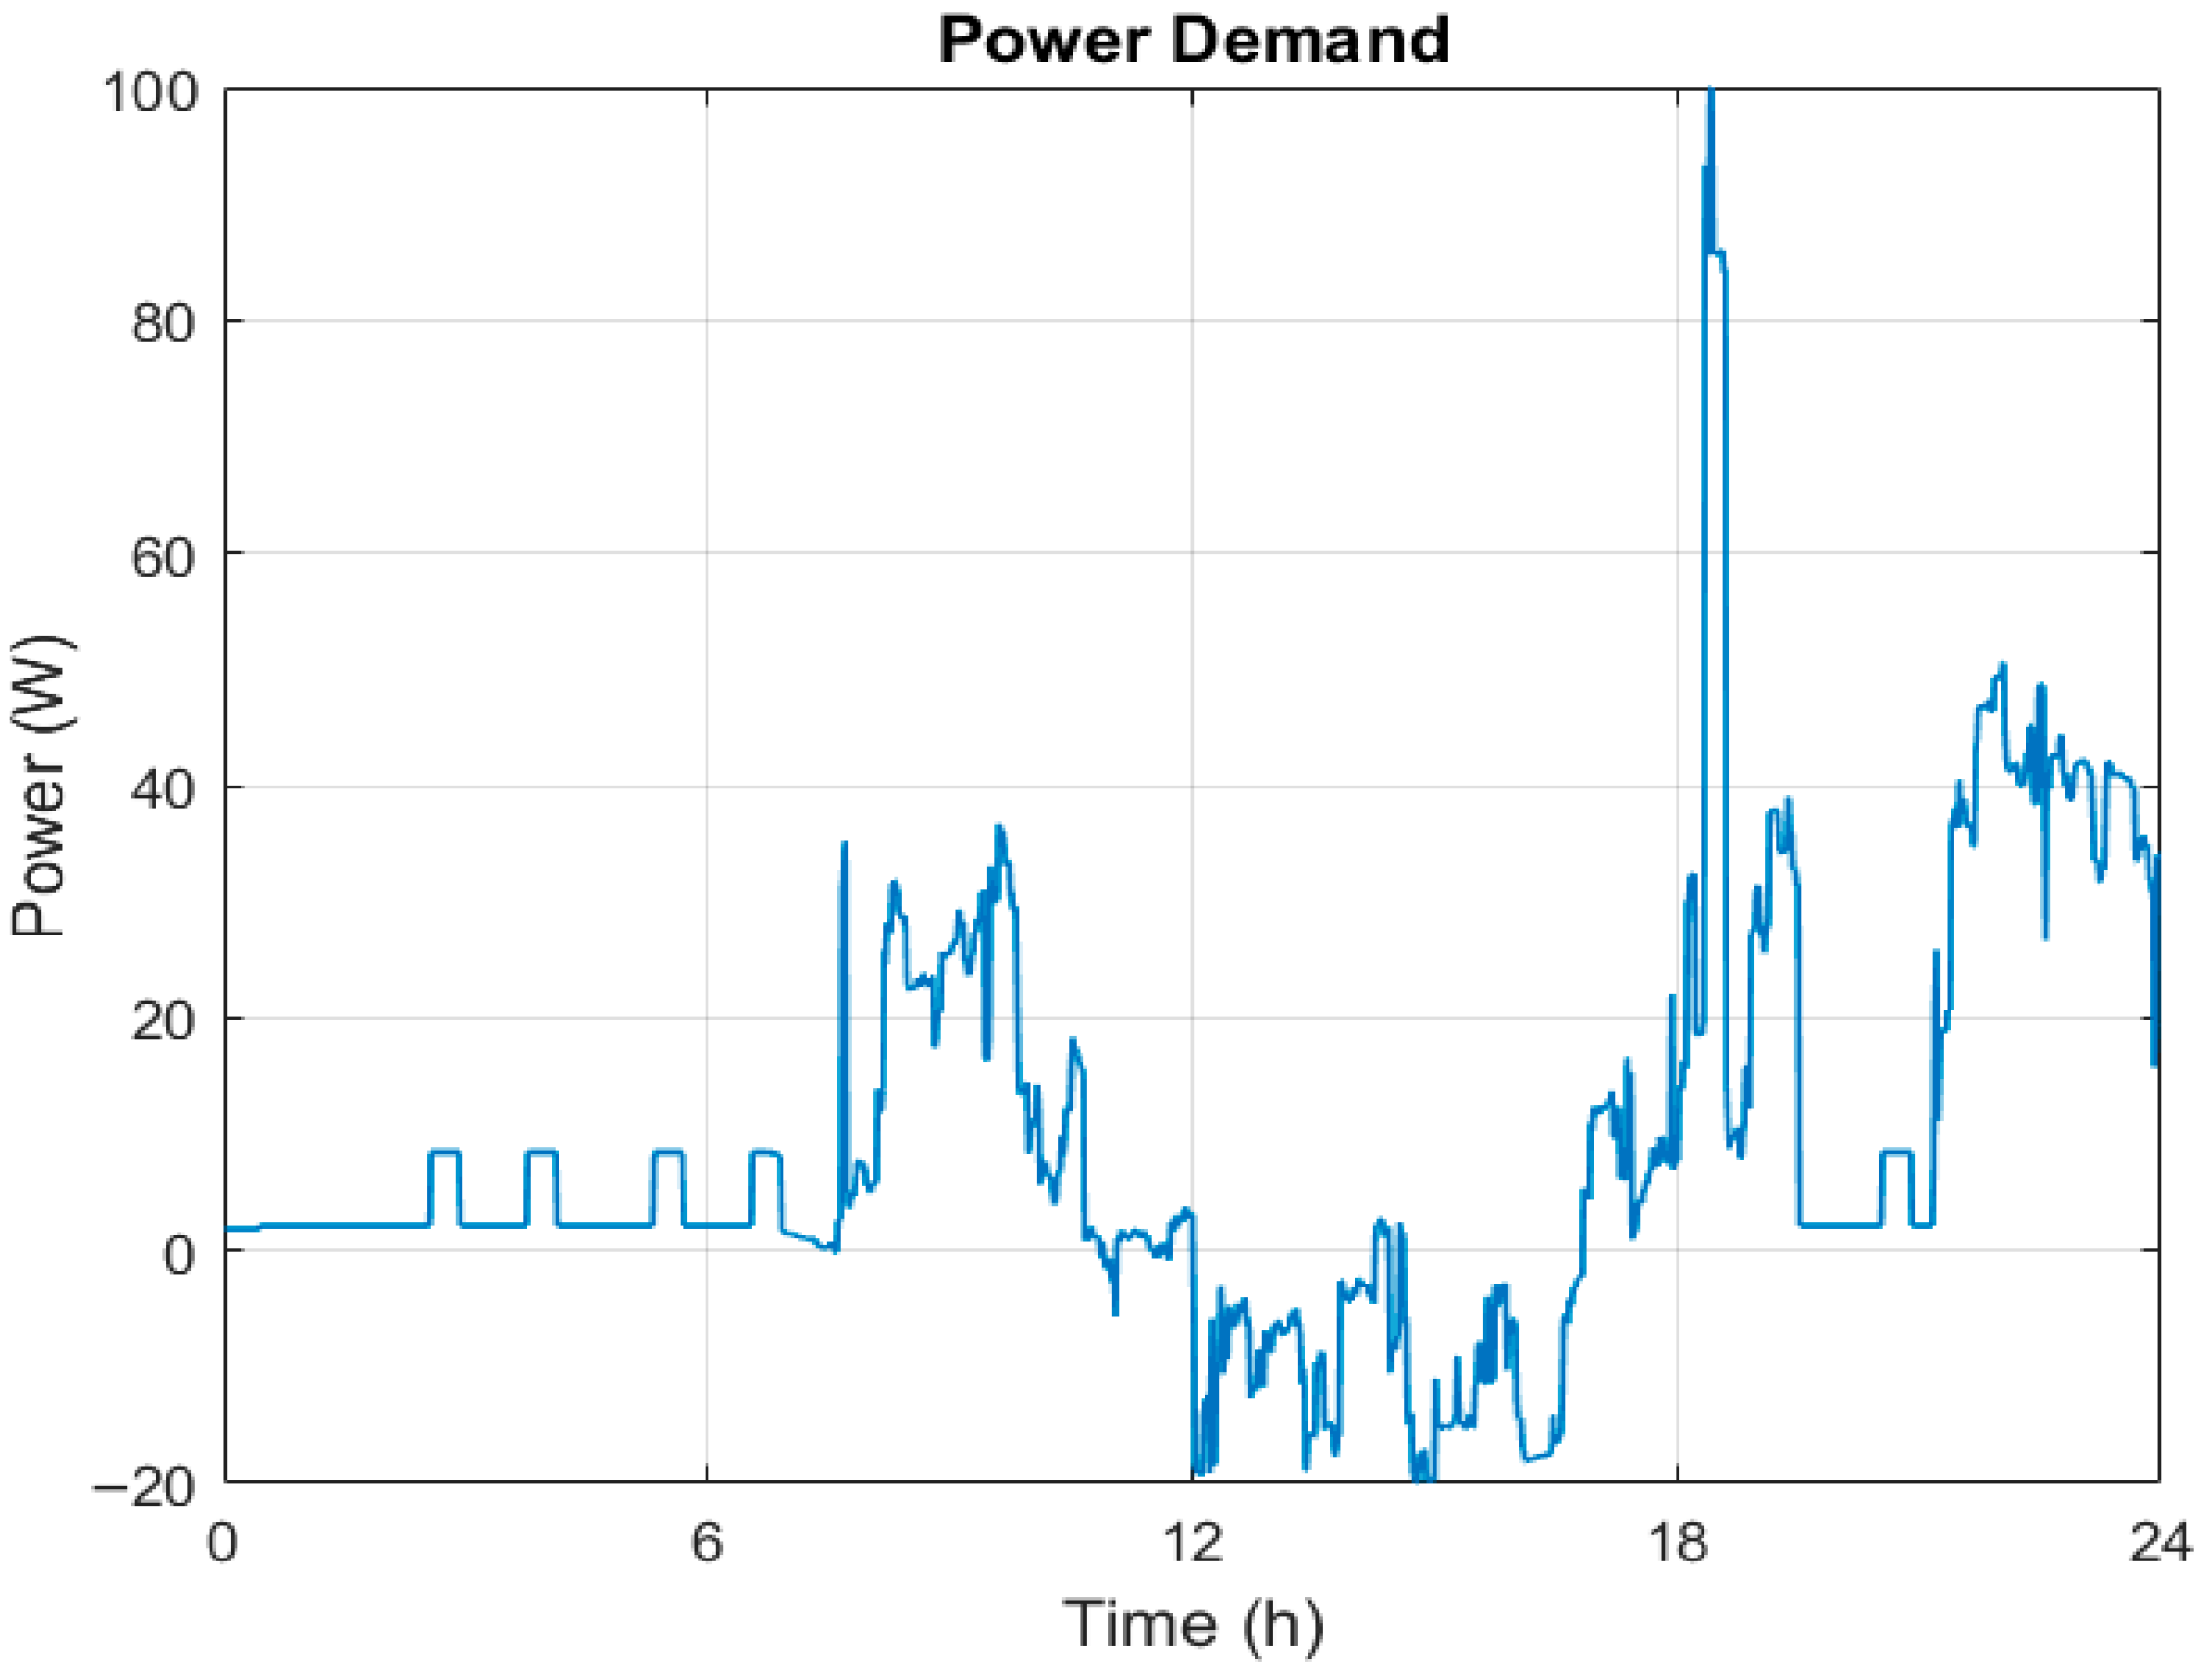
Figure 5 presents the scaled power demand profile, calculated as the difference between the household electricity demand and PV power generation. As can be observed, the profile shows a negative demand between 12:00 h and 18:00 h, resulting from low household consumption during these hours combined with maximum PV generation.
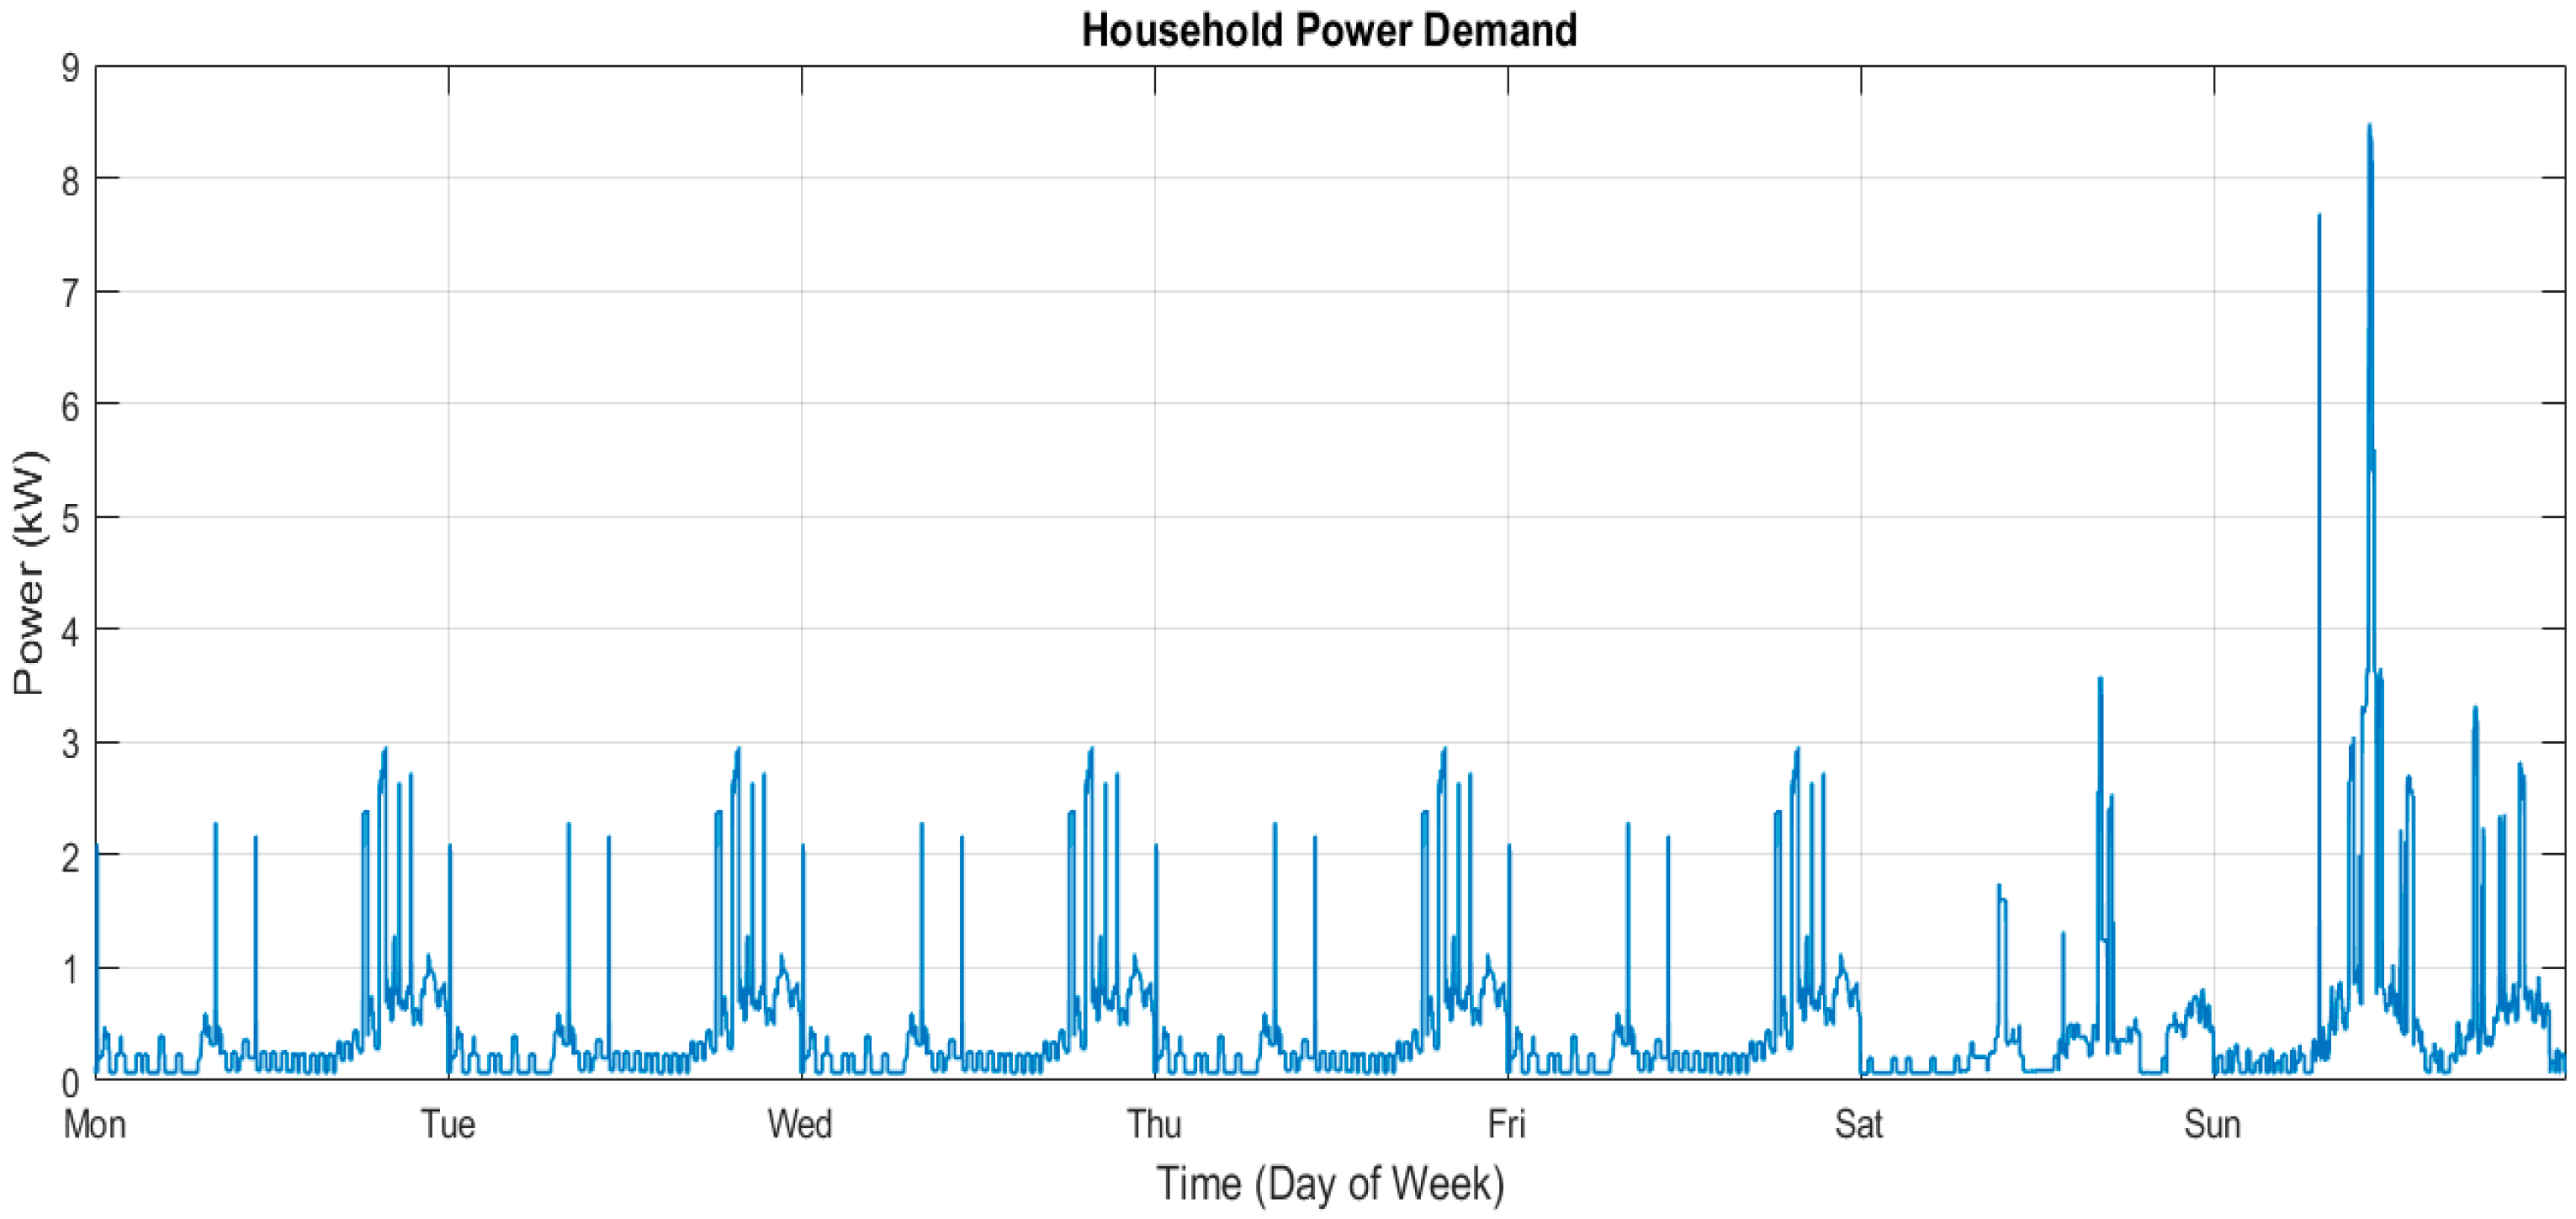
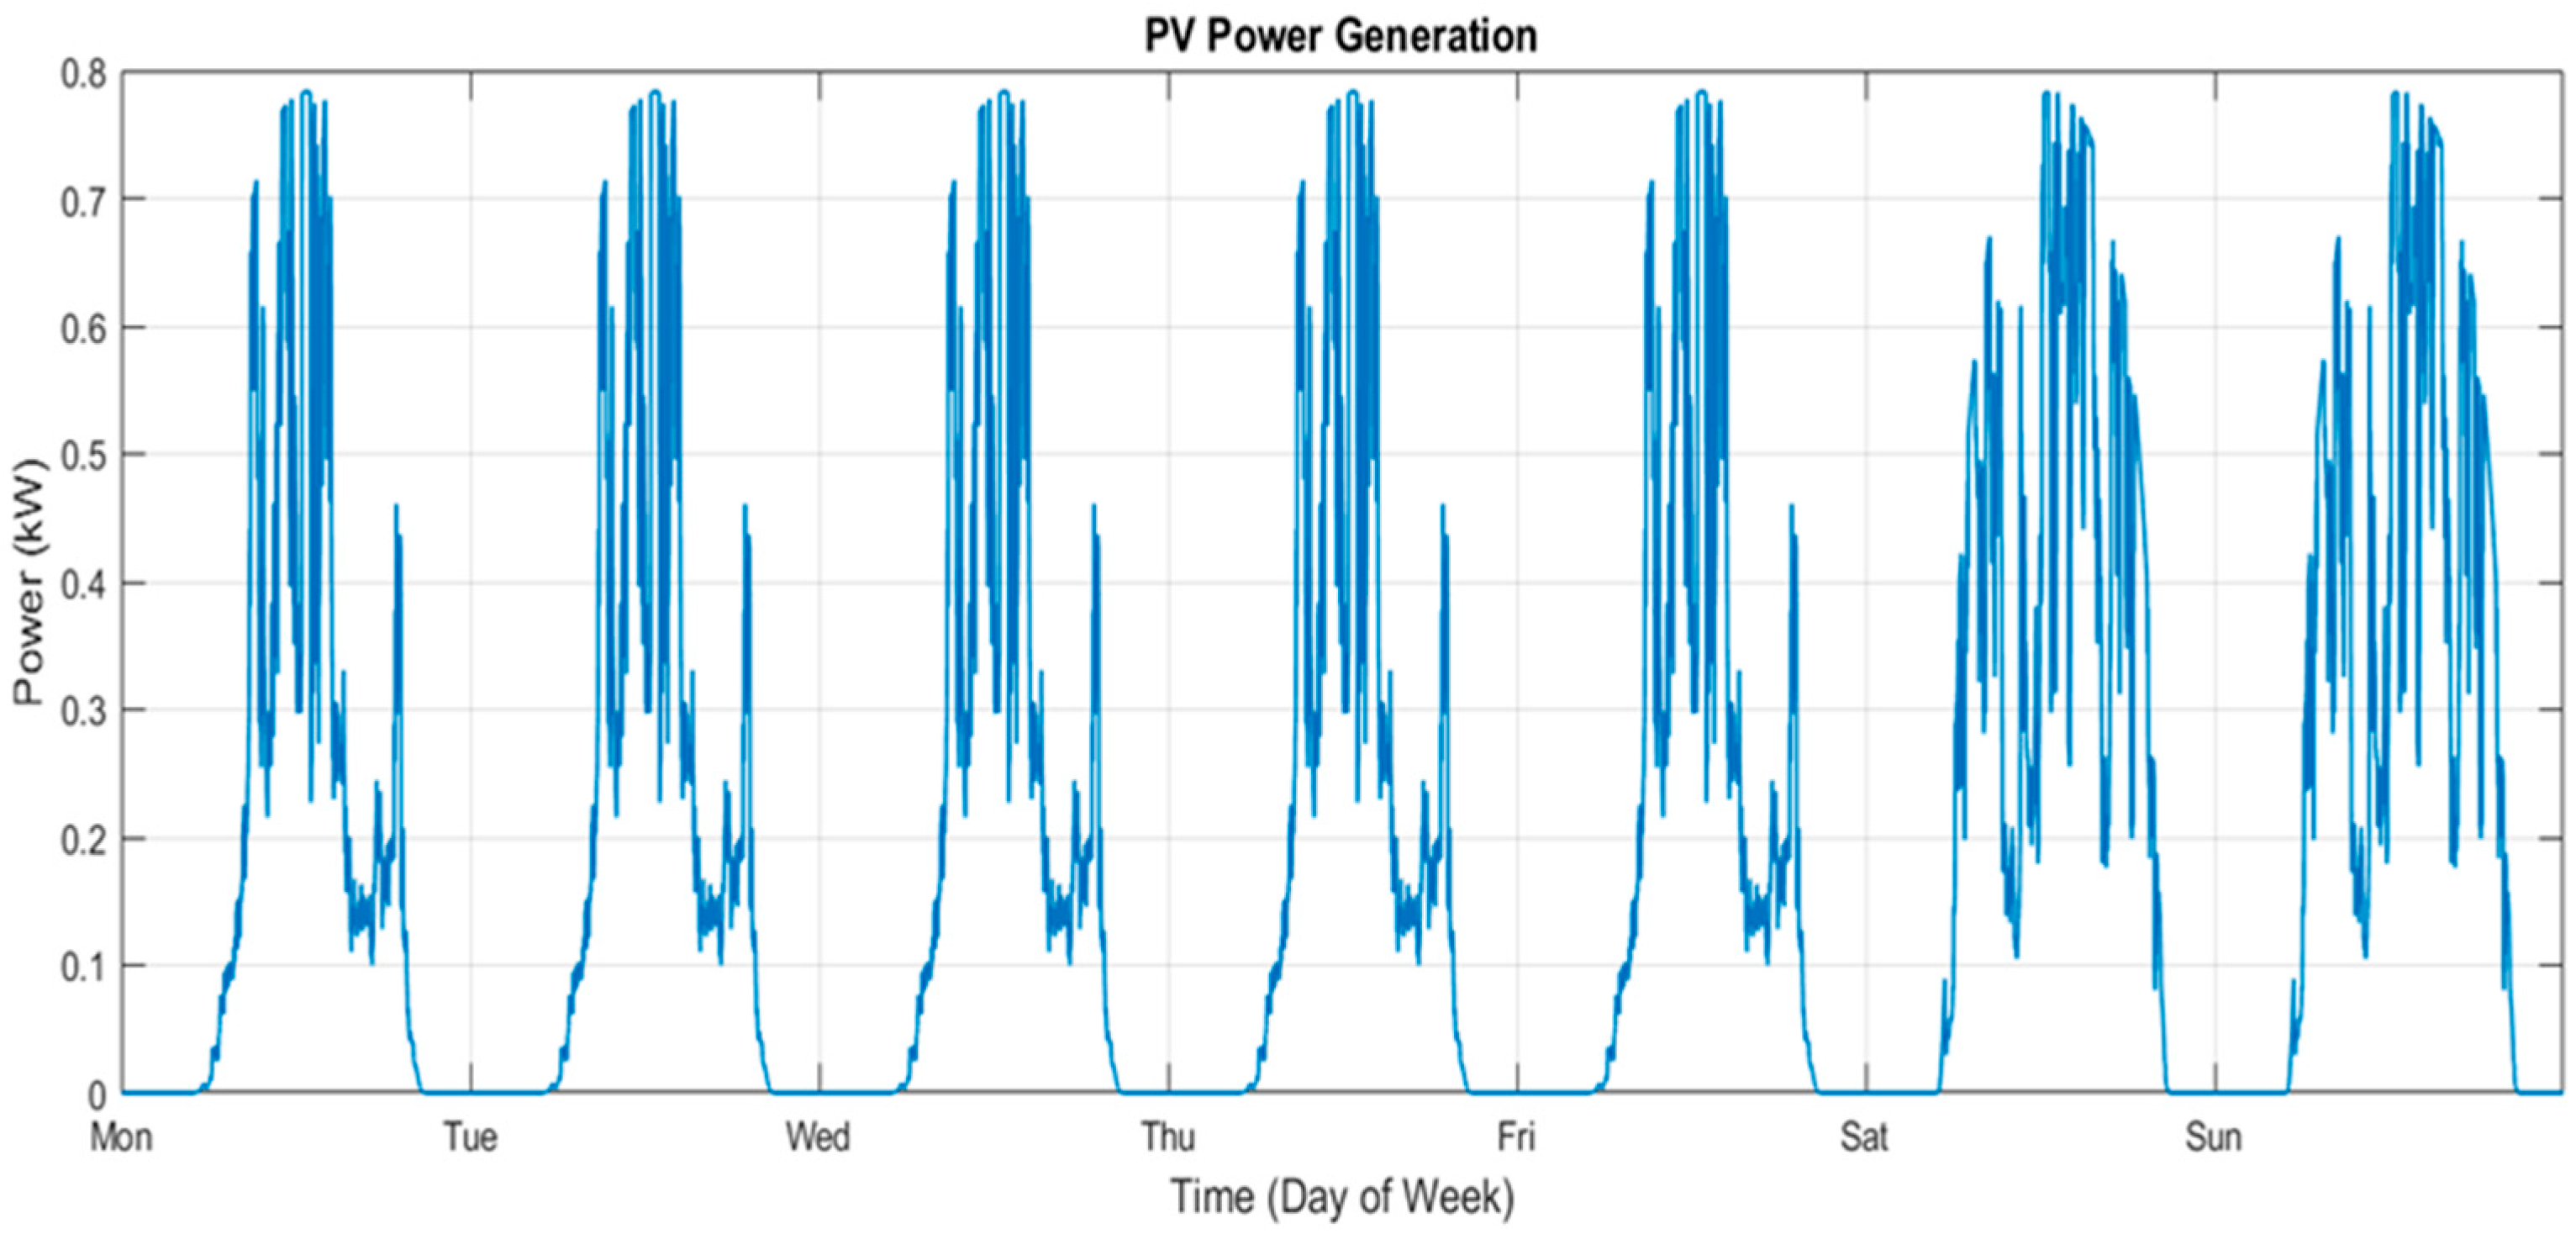
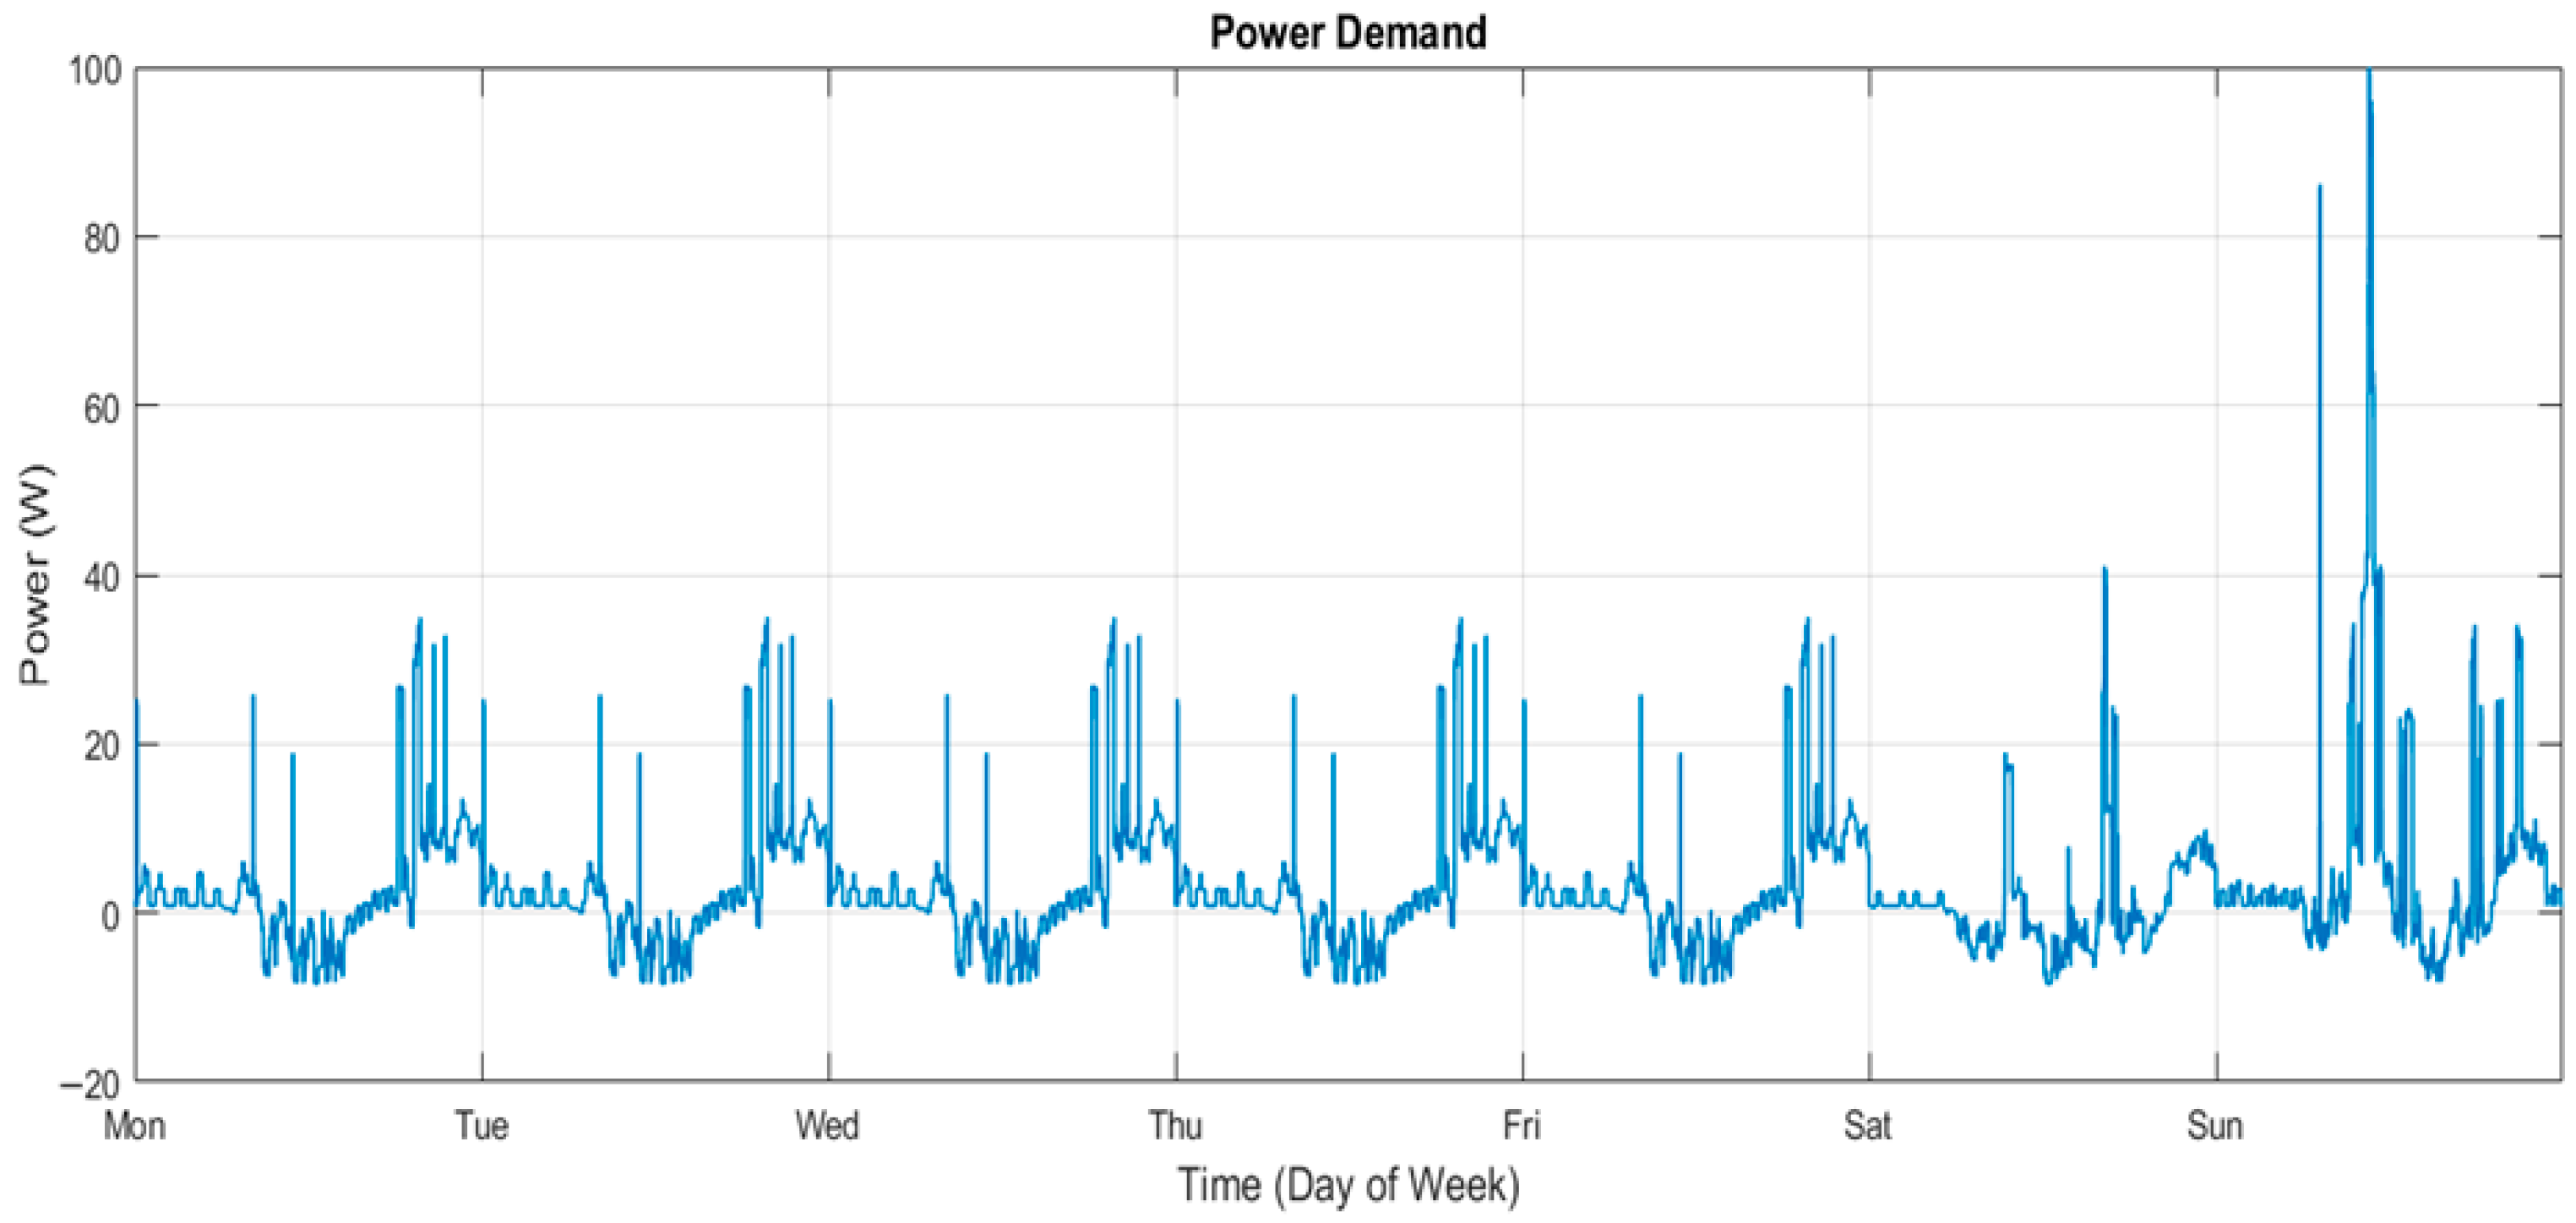
In this case, there is also the validation of the system from the power demand of the entire week, which spans from a Monday at 0 h to a Sunday at 23:59 h. To simplify the analysis, the weekdays are considered to have the same power demand and PV generation, while the two days of the weekend present different ones higher than those of the weekdays, as the activity inside the house is usually higher than during the weekdays. This power demand and PV generation can be seen in
Figure 6 and
Figure 7.
Similar to the weekday, the power demand has also been scaled to ensure that the problem can be addressed using the characteristics of the battery modules—still the same as previously, six cells for the LTO and four cells for the NMC. Specifically, the maximum power demand over any given time interval has been normalized to 100 W, whereas the actual peak demand was 2956 kW for a weekday and 8483 kW during Sunday.
Figure 8 presents the scaled power demand profile, calculated as the difference between the household electricity demand and PV power generation.
As stated previously, the strategy is to preserve the NMC’s health, using the LTO as the main provider of power. This strategy is followed by the weights of the MPC, especially the current weight values for every battery, as its values are
= 10,
= 15 and
= 1; the lower the value of the weight is, the less restrictive on its use it is. The SOC also is restricted by the different weights that appear in
Table 2, still enforcing the restriction on the NMC cells. The other parameters are summarized in the same table.
5.2. Case B: Electric Vehicle
This second case evaluates the system as the energy storage system of an electric vehicle, studying its operation under the Worldwide Harmonized Light Vehicles Test Procedure (WLTP). The WLTP Class 3 cycle is selected, as the power-to-mass ratio related to this cycle (greater than 34 W/kg) is the standard for the majority of passenger cars currently in the market.
This driving cycle is divided into four phases, each defined by a different speed range:
- -
Phase 1 (low): 0–56 km/h;
- -
Phase 2 (medium): 0–76 km/h;
- -
Phase 3 (high): 0–97 km/h;
- -
Phase 4 (extra high): 0–137 km/h.
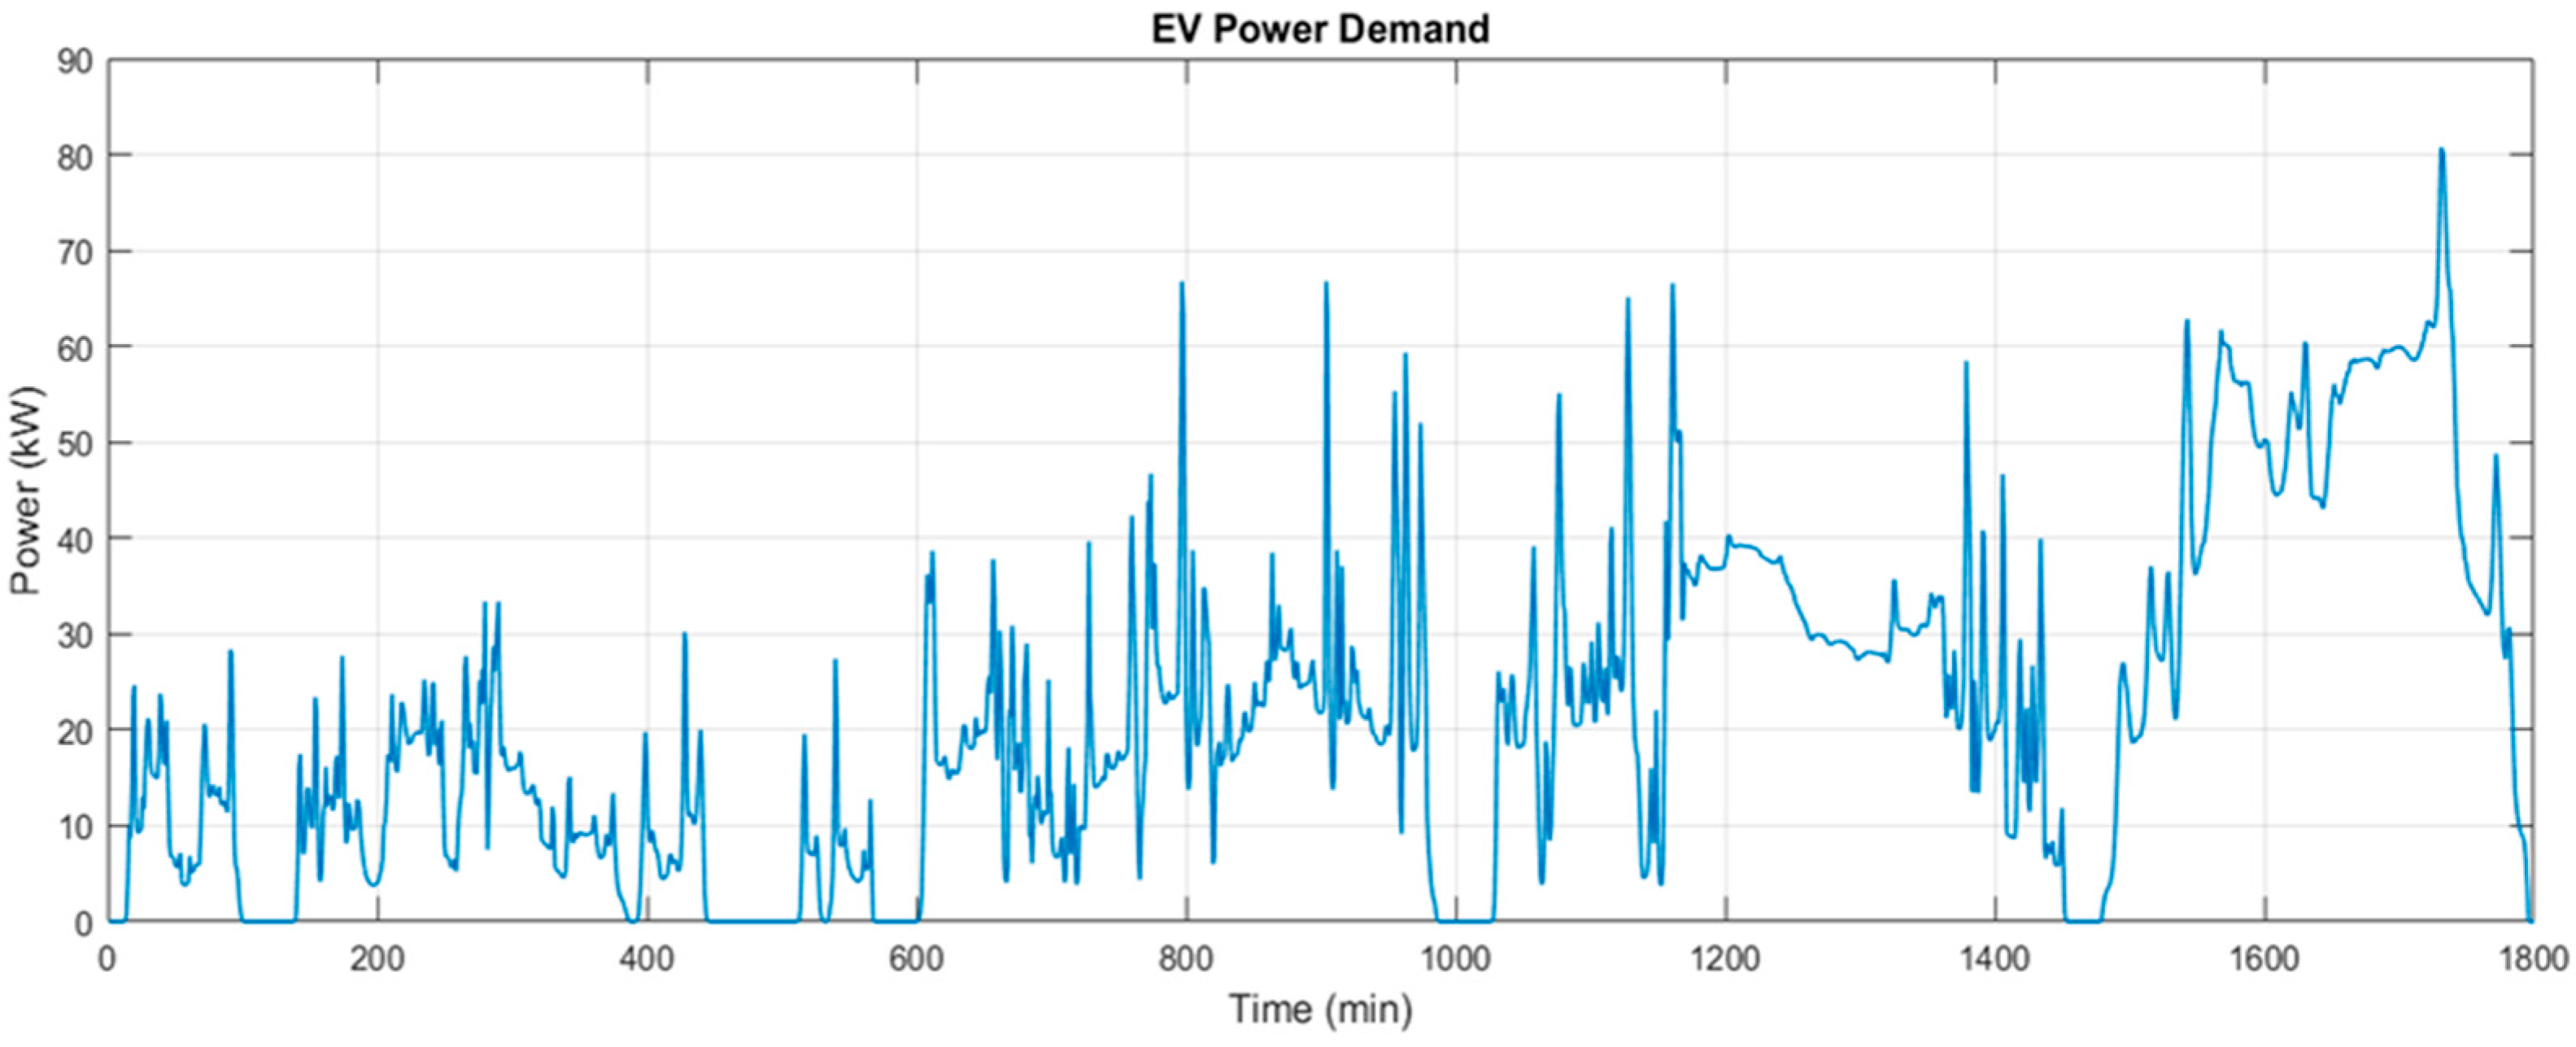
The power demand required by the electric vehicle is derived from its speed profile and the combination of forces acting on the vehicle, including rolling resistance, aerodynamic drag, grade resistance, and acceleration resistance, and these can be seen in
Figure 9. This kind of cycle allows for the system to be evaluated in both low- and high-power demands, analyzing its performance across a wide range of conditions.
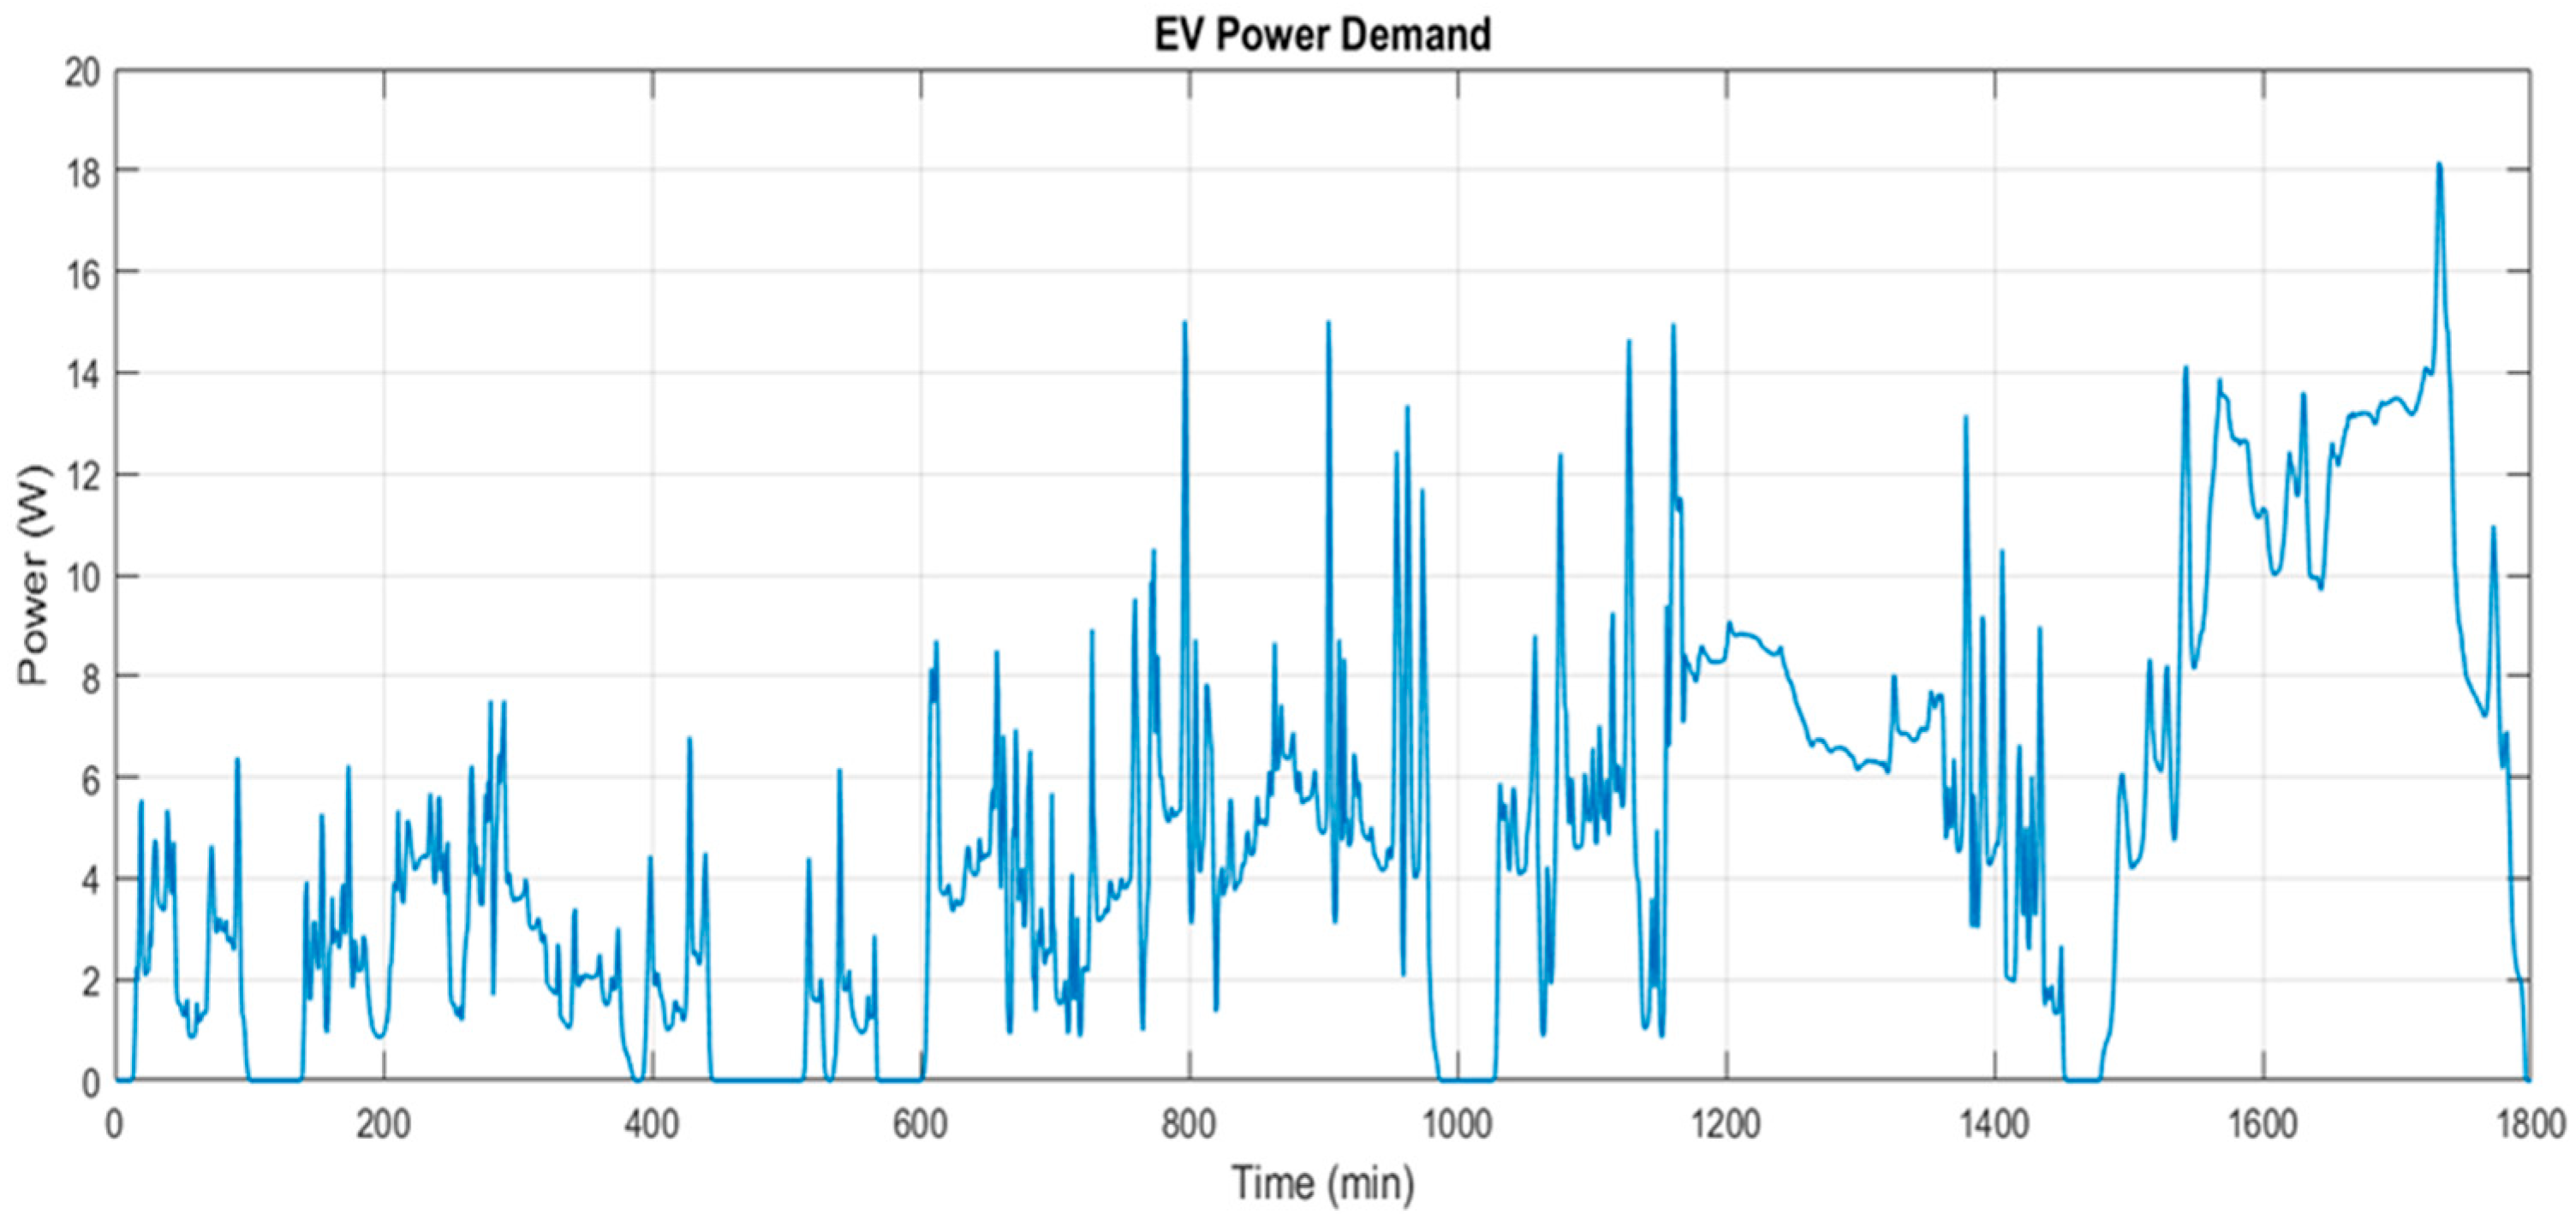
As seen in the previous case, the power demand is also scaled as seen in
Figure 10; in this case, the maximum considered is 20 W while maintaining real-life behavior. Consequently, the results obtained from this scaled case remain representative of real driving conditions and allow for a realistic assessment of the MPC strategy under vehicle operation scenarios.
In this study case, similar current weights for the NMC batteries have been selected,
= 10,
= 7. With respect to the LTO, the weight chosen is
= 5, prioritizing its higher contribution and penalizing the use of NMC more strongly. The SOC also is restricted with the same weights as the previous case, Case A. Other parameters such as initial SOC are summarized in
Table 3.
6. Numerical Results
The results shown in the following subsections for the different study cases have been obtained from simulations in C code made in MATLAB. An exploration of different weights for efficiency was undertaken, and a comparison between the systems with and without control was made.
6.1. Case A: Renewable Energy System
For the first results, the efficiency weight is 0.075, which is a very low value as the first approach of the system. The power delivered by each battery considering all the weights is shown in
Figure 11.
As can be noticed in
Figure 11, the power dynamics correspond very clearly to the strategy approach set on the MPC, as the LTO is the main supplier and the most variable, while the NMC has a more constant approach. The grid is only used as a support until nearly the end when the batteries are at their lowest level of energy and become the main provider.
This can be seen in
Figure 12, depicting the evolution of the SOC, starting with all batteries being discharged on different levels, with the NMC2 reaching its minimum (0.1). The first peaks of power demand occur in the morning; then, they are charged, matching the low demand and high photovoltaic generation during midday until they become discharged again as a result of the high demand that occurs during the afternoon and night. All of these arriving to the minimum of 0.1 and require the grid to supply the majority of the power. Visually, there is a clear difference between the LTO and NMCs batteries, as the latter have a smoother charge and discharge profile, coinciding with more constant behavior.
In
Figure 13, the current profile from all the batteries is similar to the power profile, as the LTO presents the most fluctuations while the NMCs are very similar. As said previously, efficiency is not considered a priority in these results, as
Figure 14 can show the efficiency of the three batteries. To better analyze this variable, the mean value was calculated, showing the following results: 66.65% for NMC1, 69.81% for NMC2, and 66.64% for LTO. All the efficiencies are lower than 70%.
To illustrate how the proposed optimization strategy accounts for the different weights and see the low results from the previous efficiency calculations, a new simulation was carried out by increasing the efficiency weight in order to assess the potential improvement while still meeting the power demand. In this case, a value of 0.5 instead of the previous 0.075 was chosen.
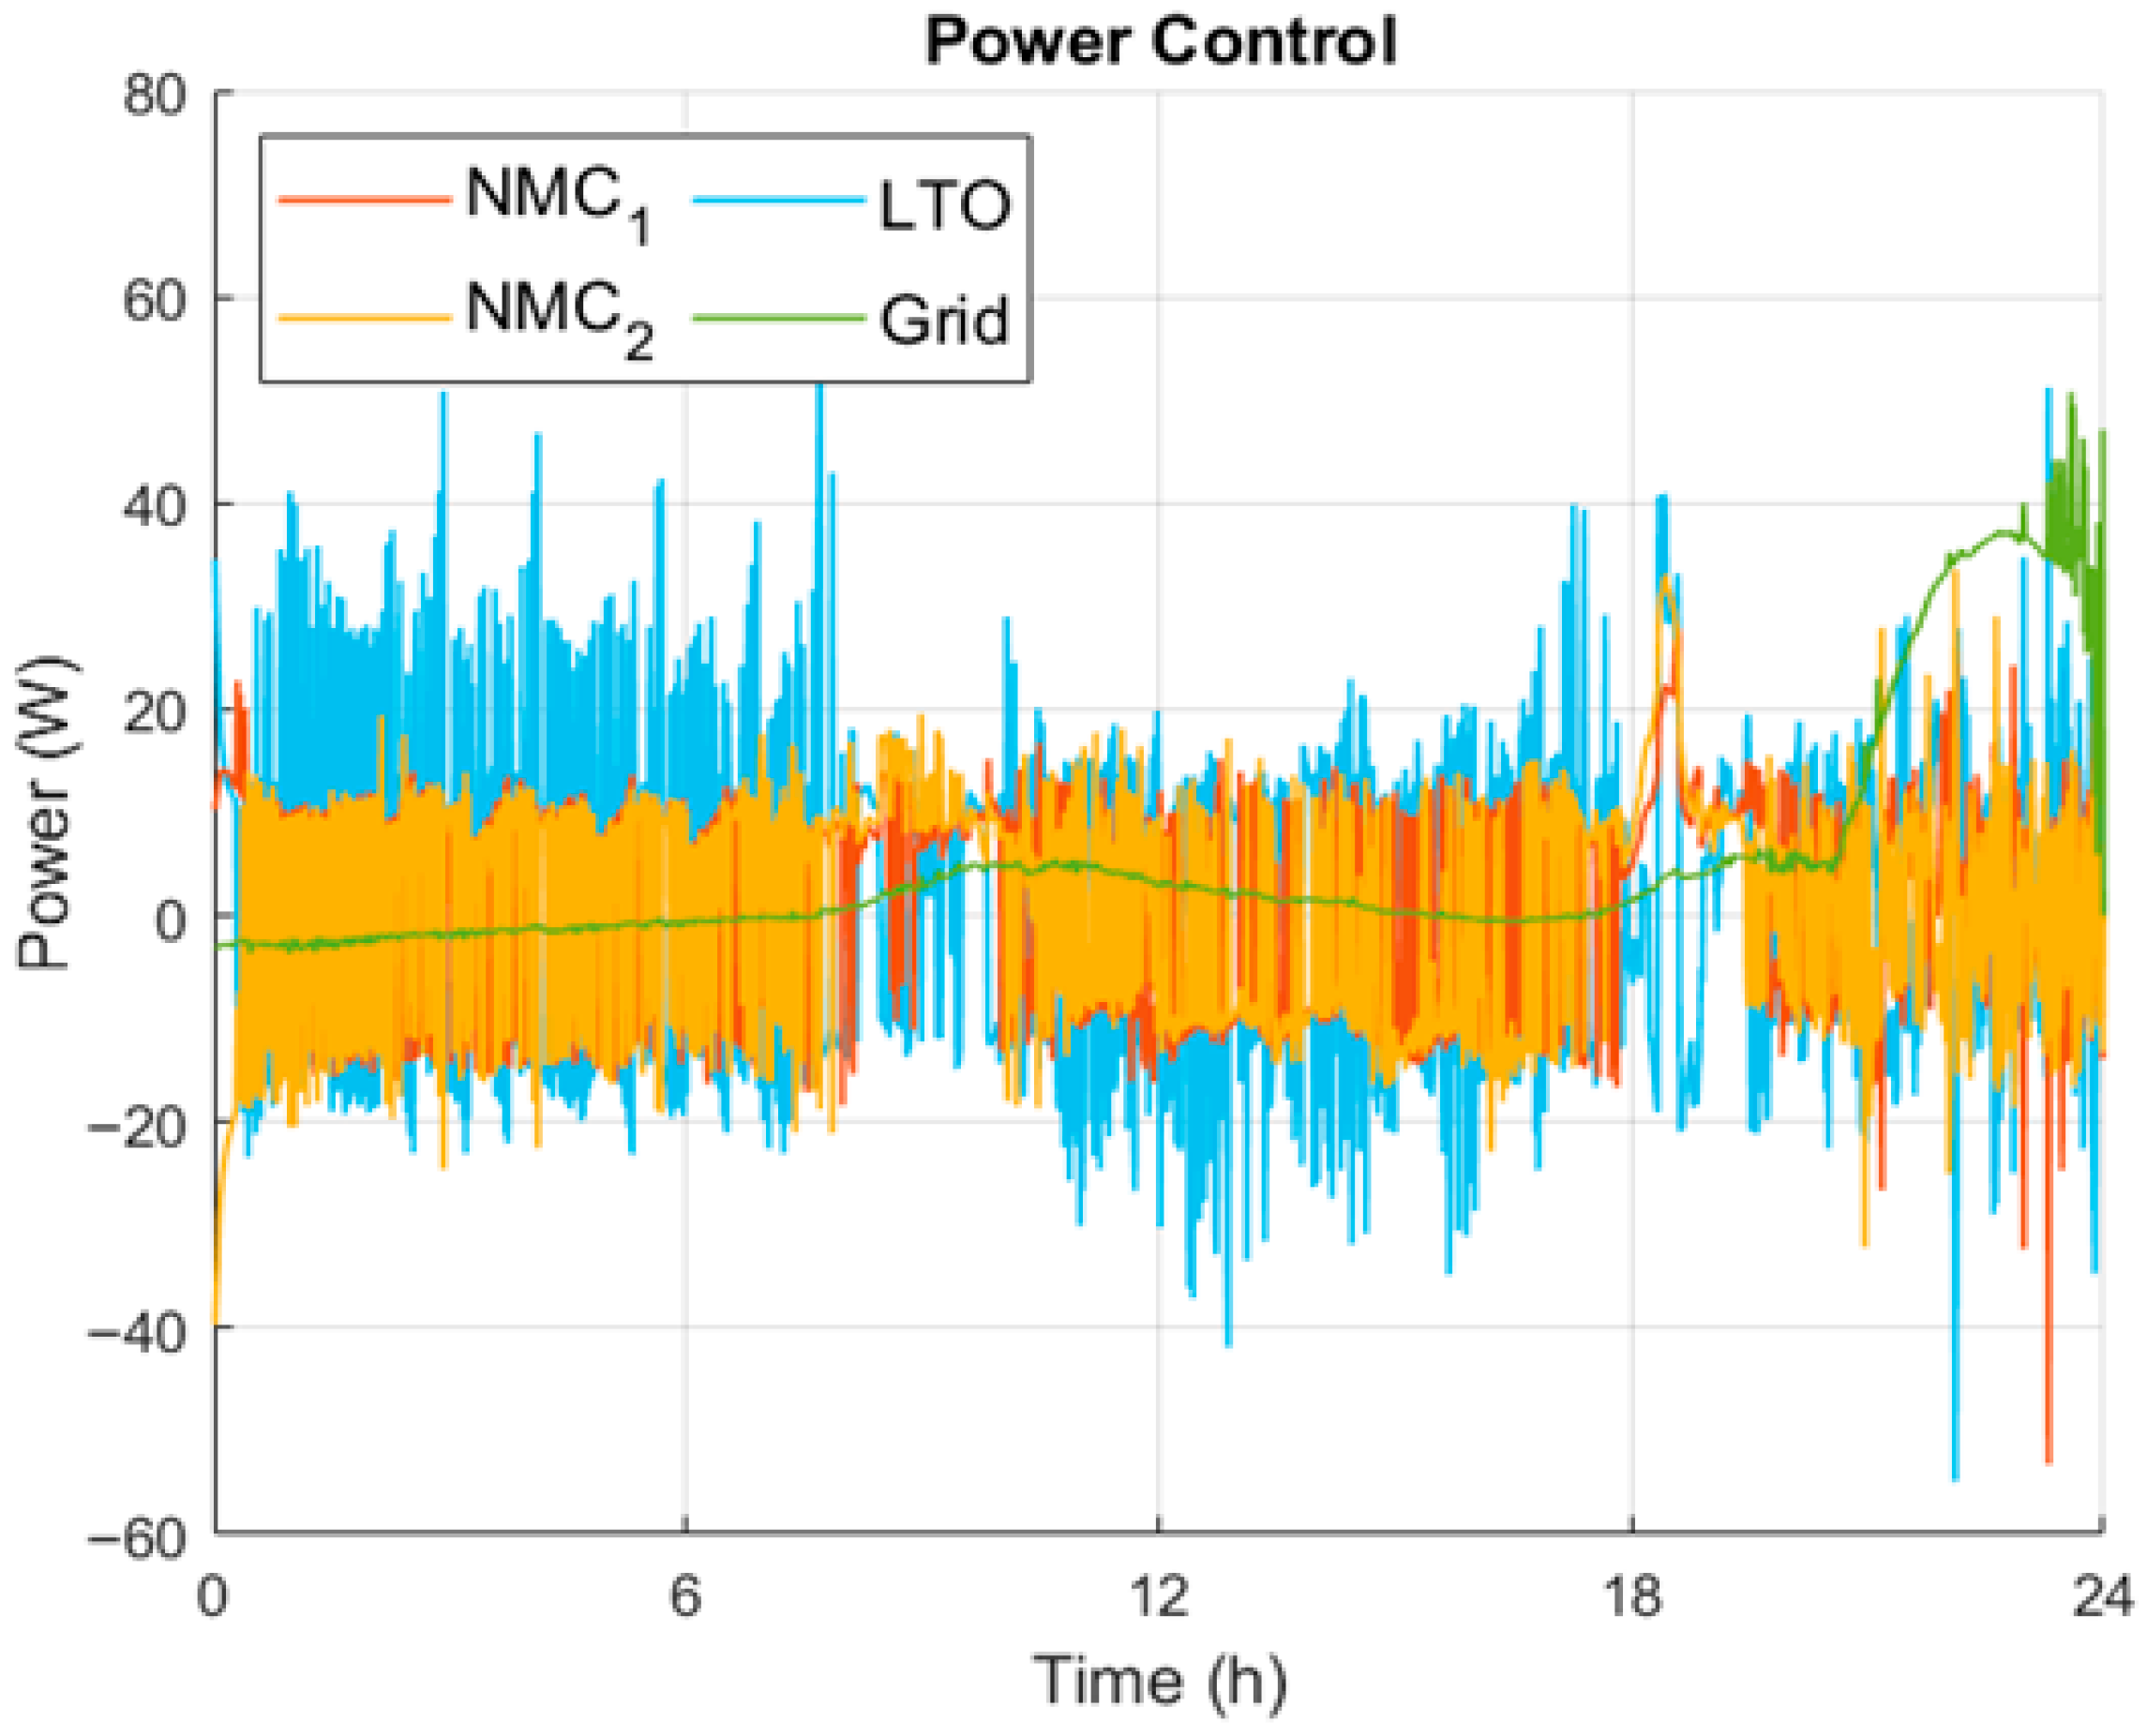
Figure 15 shows the new power profiles of the batteries and the grid, where it can be seen that the behavior is quite similar to the previous case, as expected. On the one hand, regarding the batteries, they exhibit many more fluctuations, with the main objective of maintaining a current close to 2 A, which is optimal for maximizing efficiency. Similar to the previous simulation, the grid becomes the main provider at the final hours.
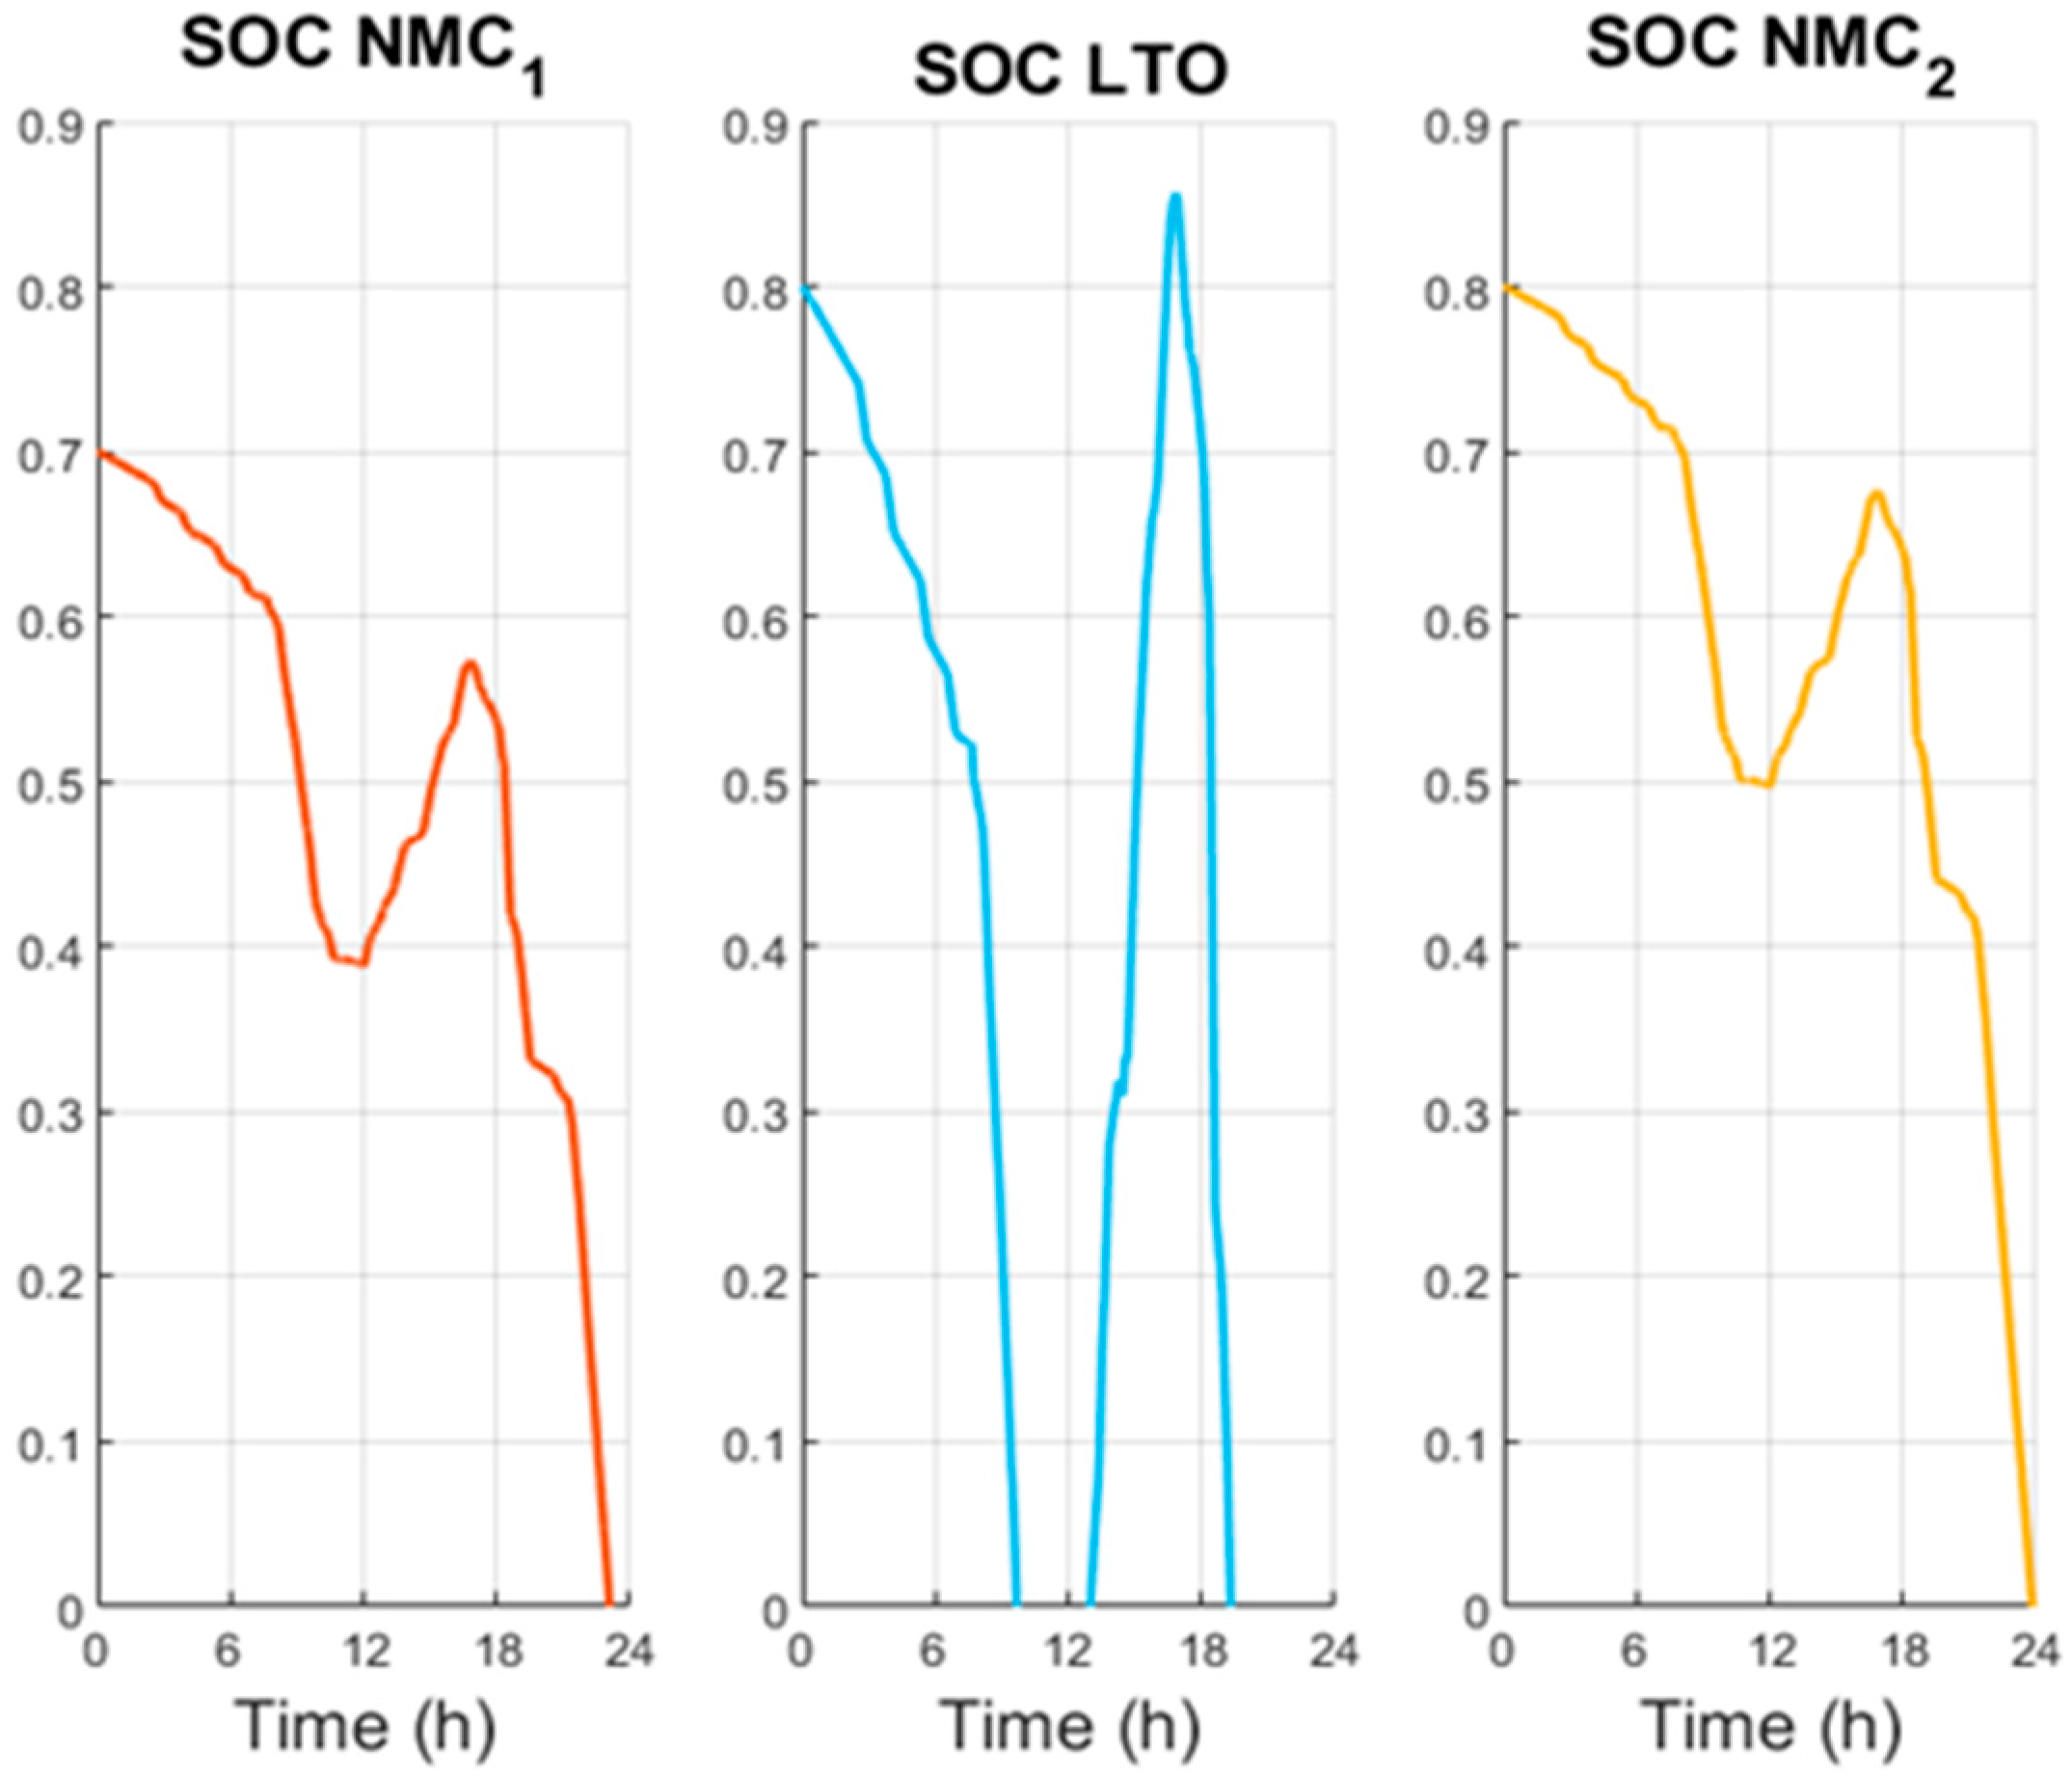
The behavior of the SOC, seen in
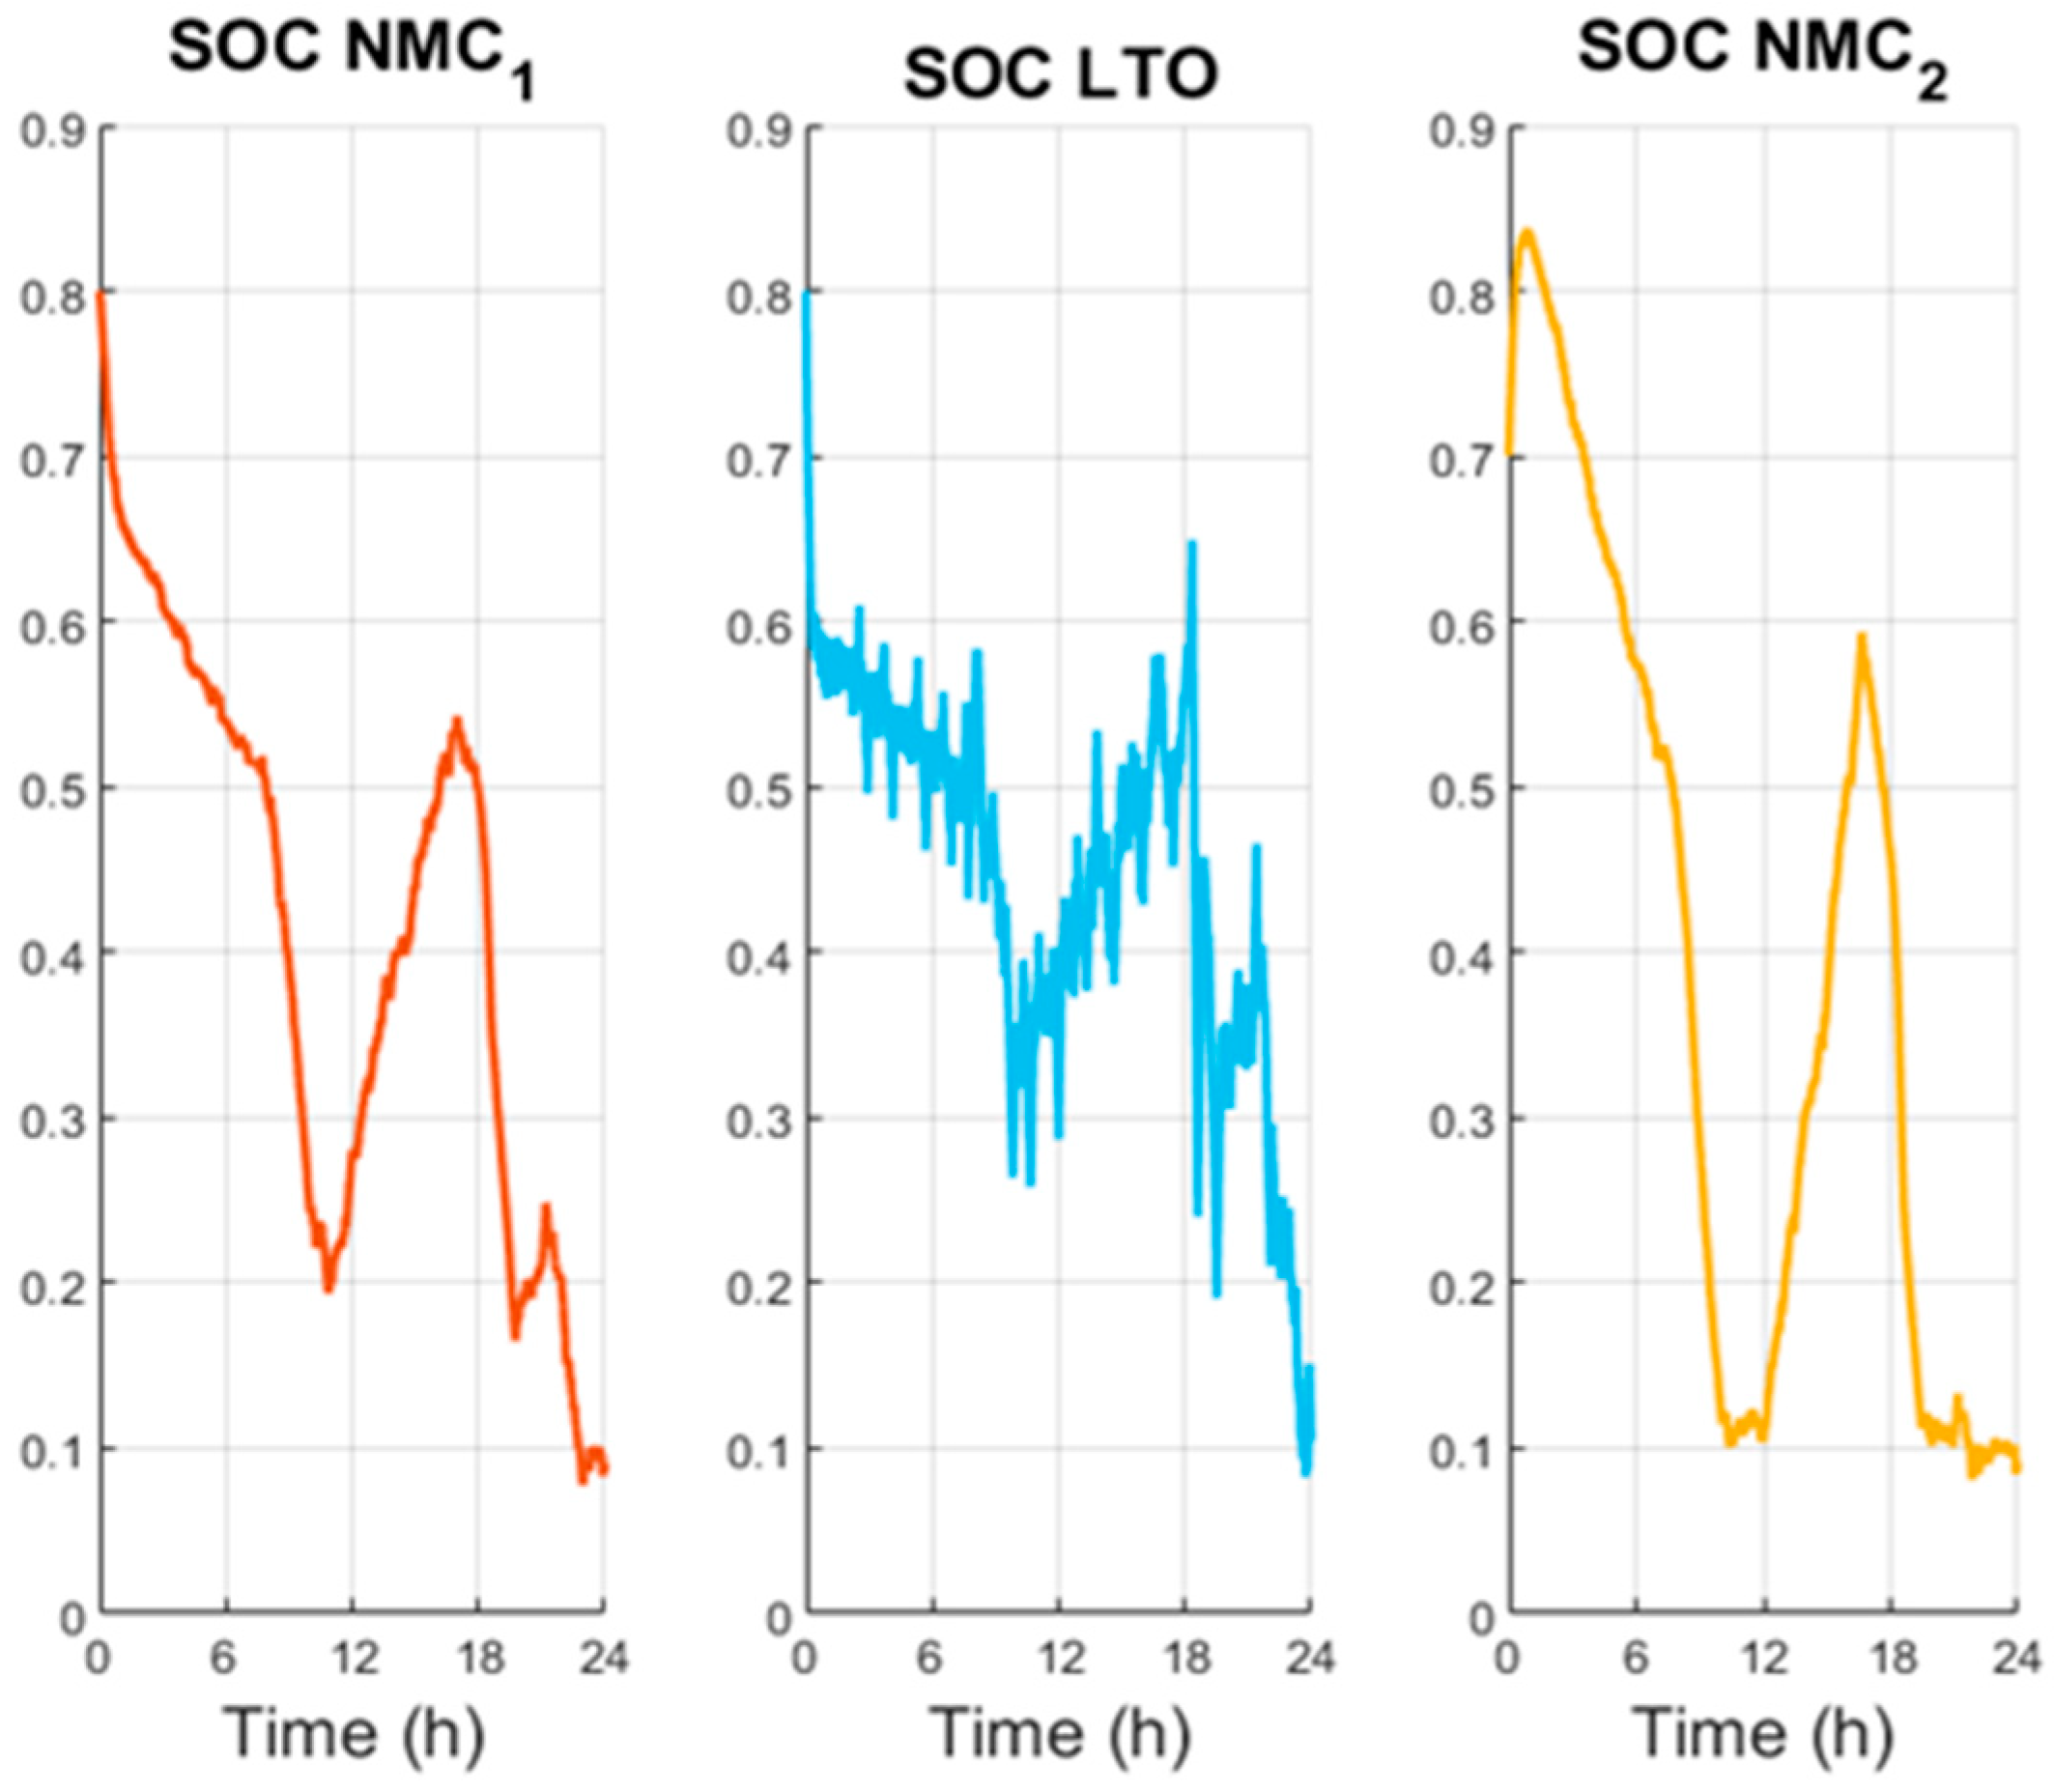
Figure 16, happens to be very similar to the previous simulation, with a first discharge in the morning, a charge in the afternoon, and a final discharge during the late afternoon and night. The only clear difference is that there are high fluctuations, especially concerning the SOC, as the current tries to reach the most efficient values (between 1 and 2 A or −1 A and −2 A).
Similarly to
Figure 15 and
Figure 16,
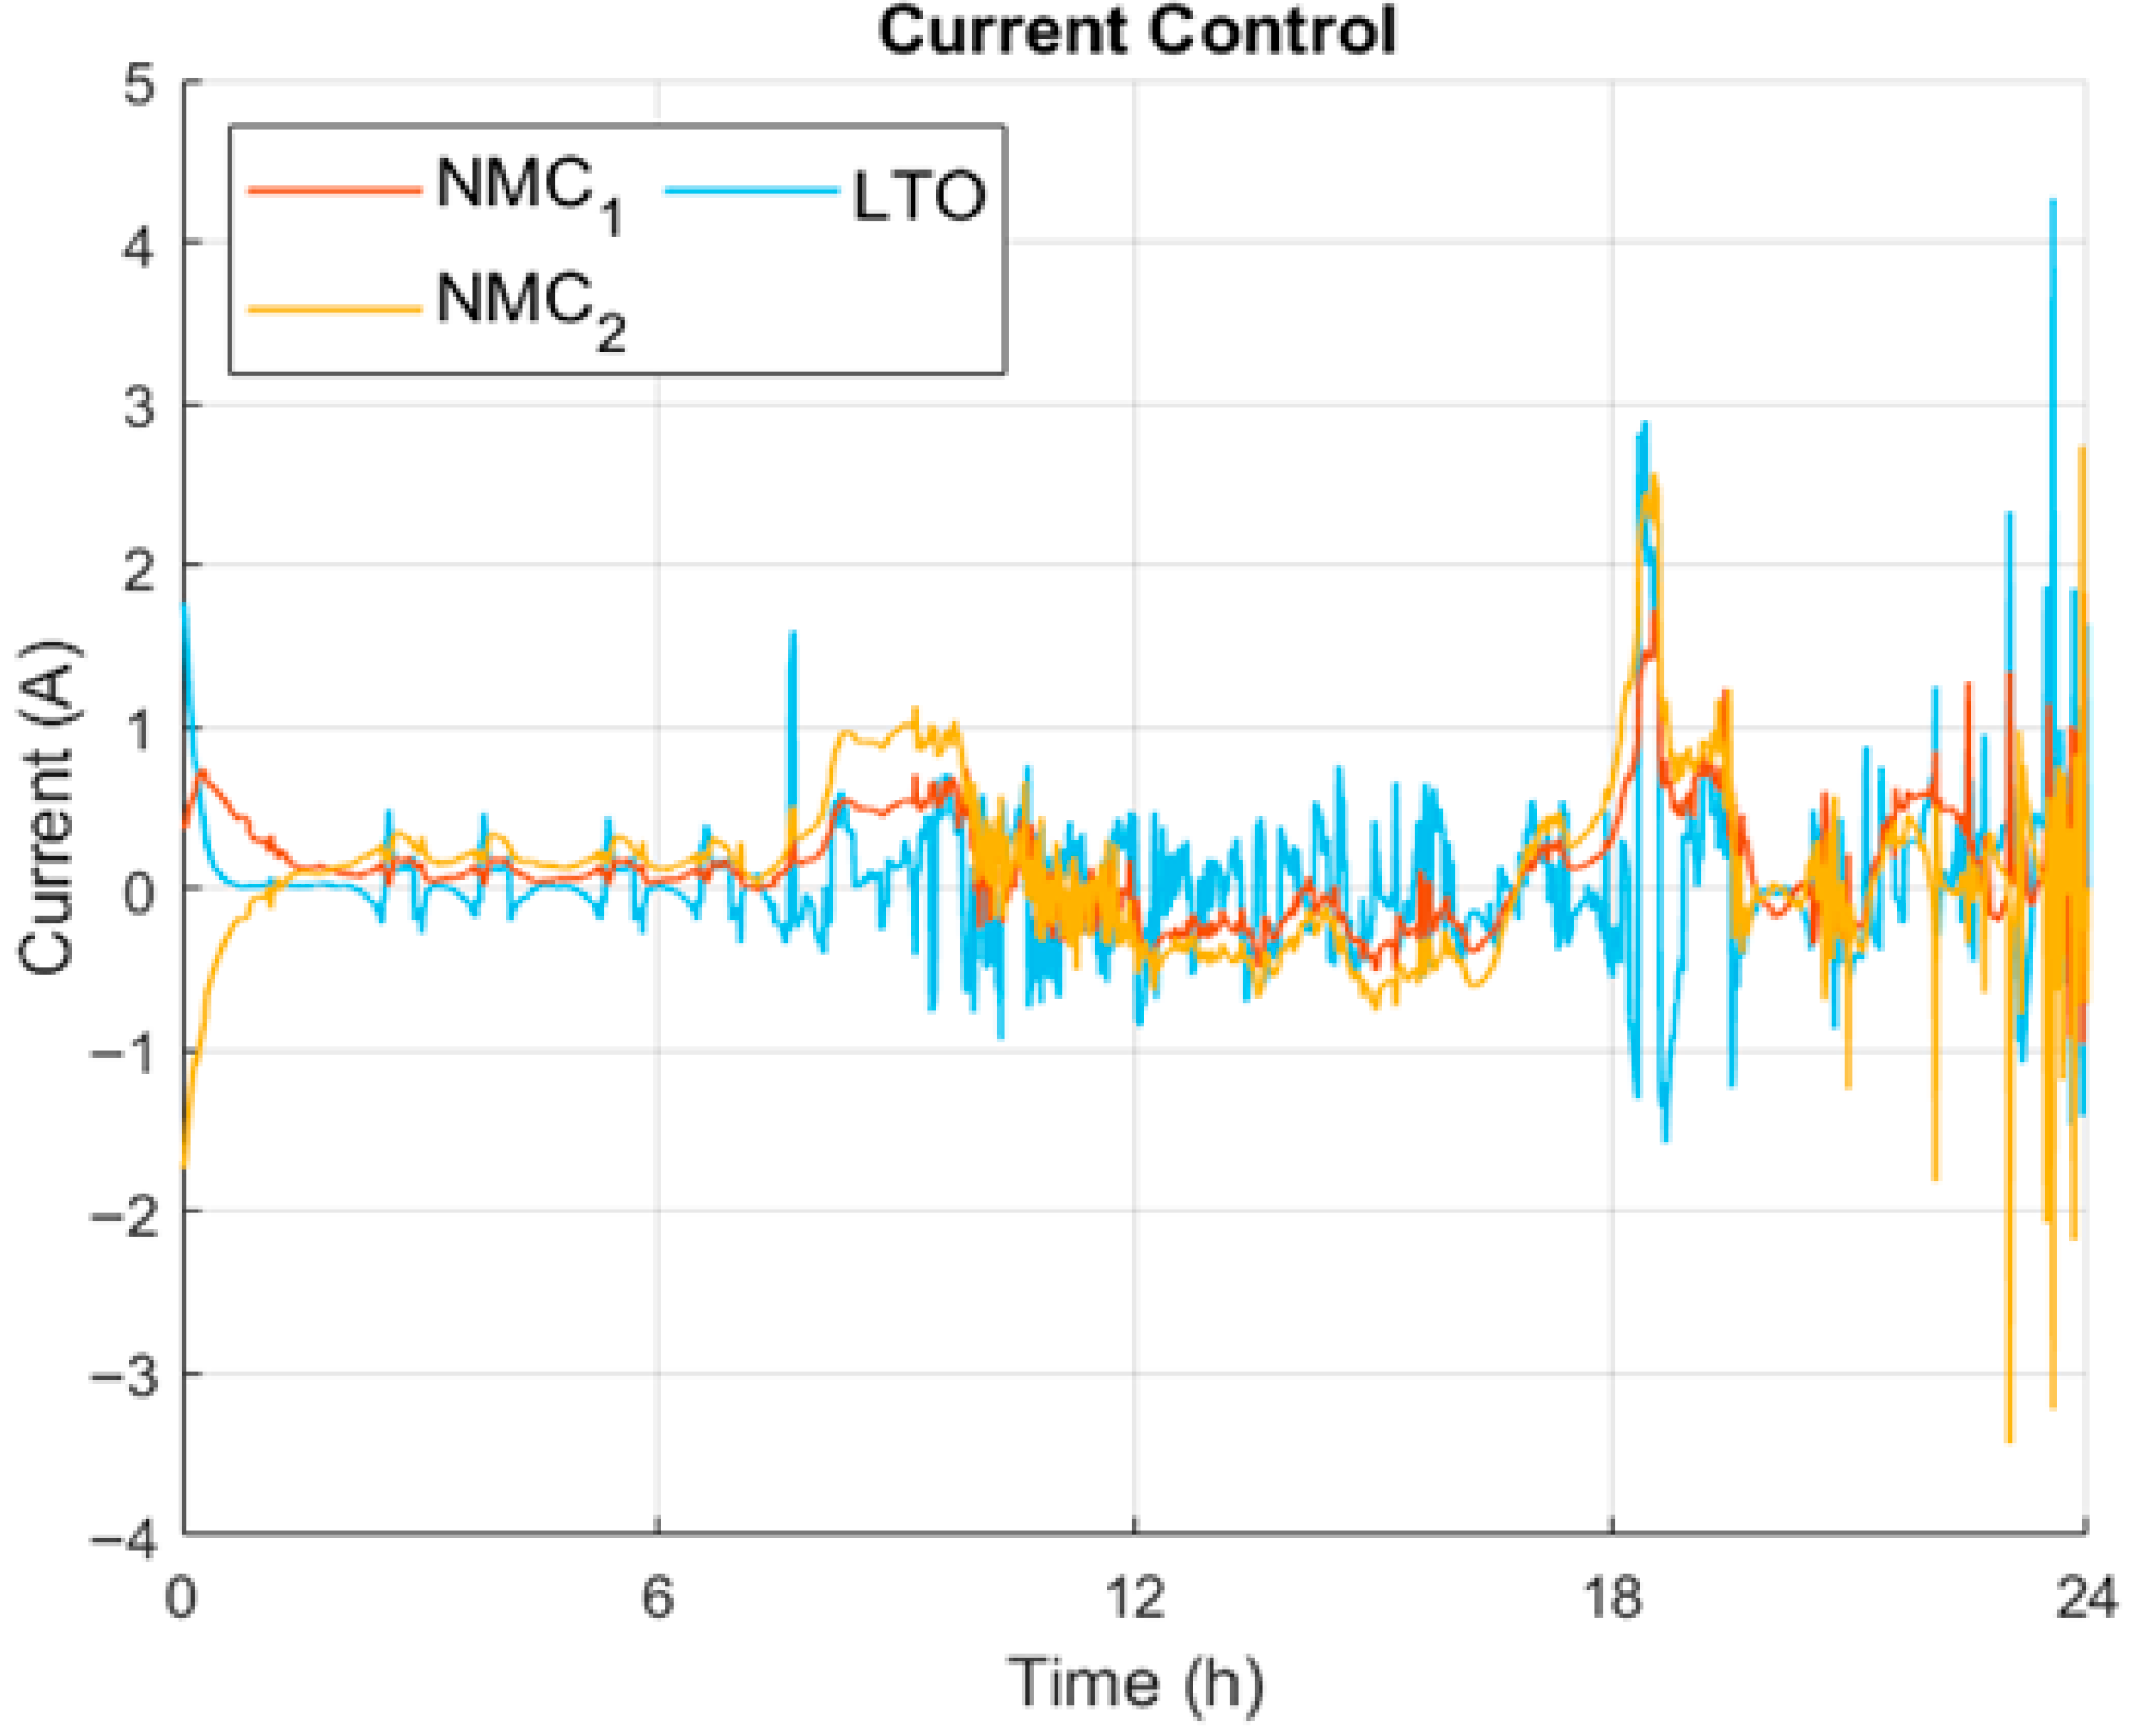
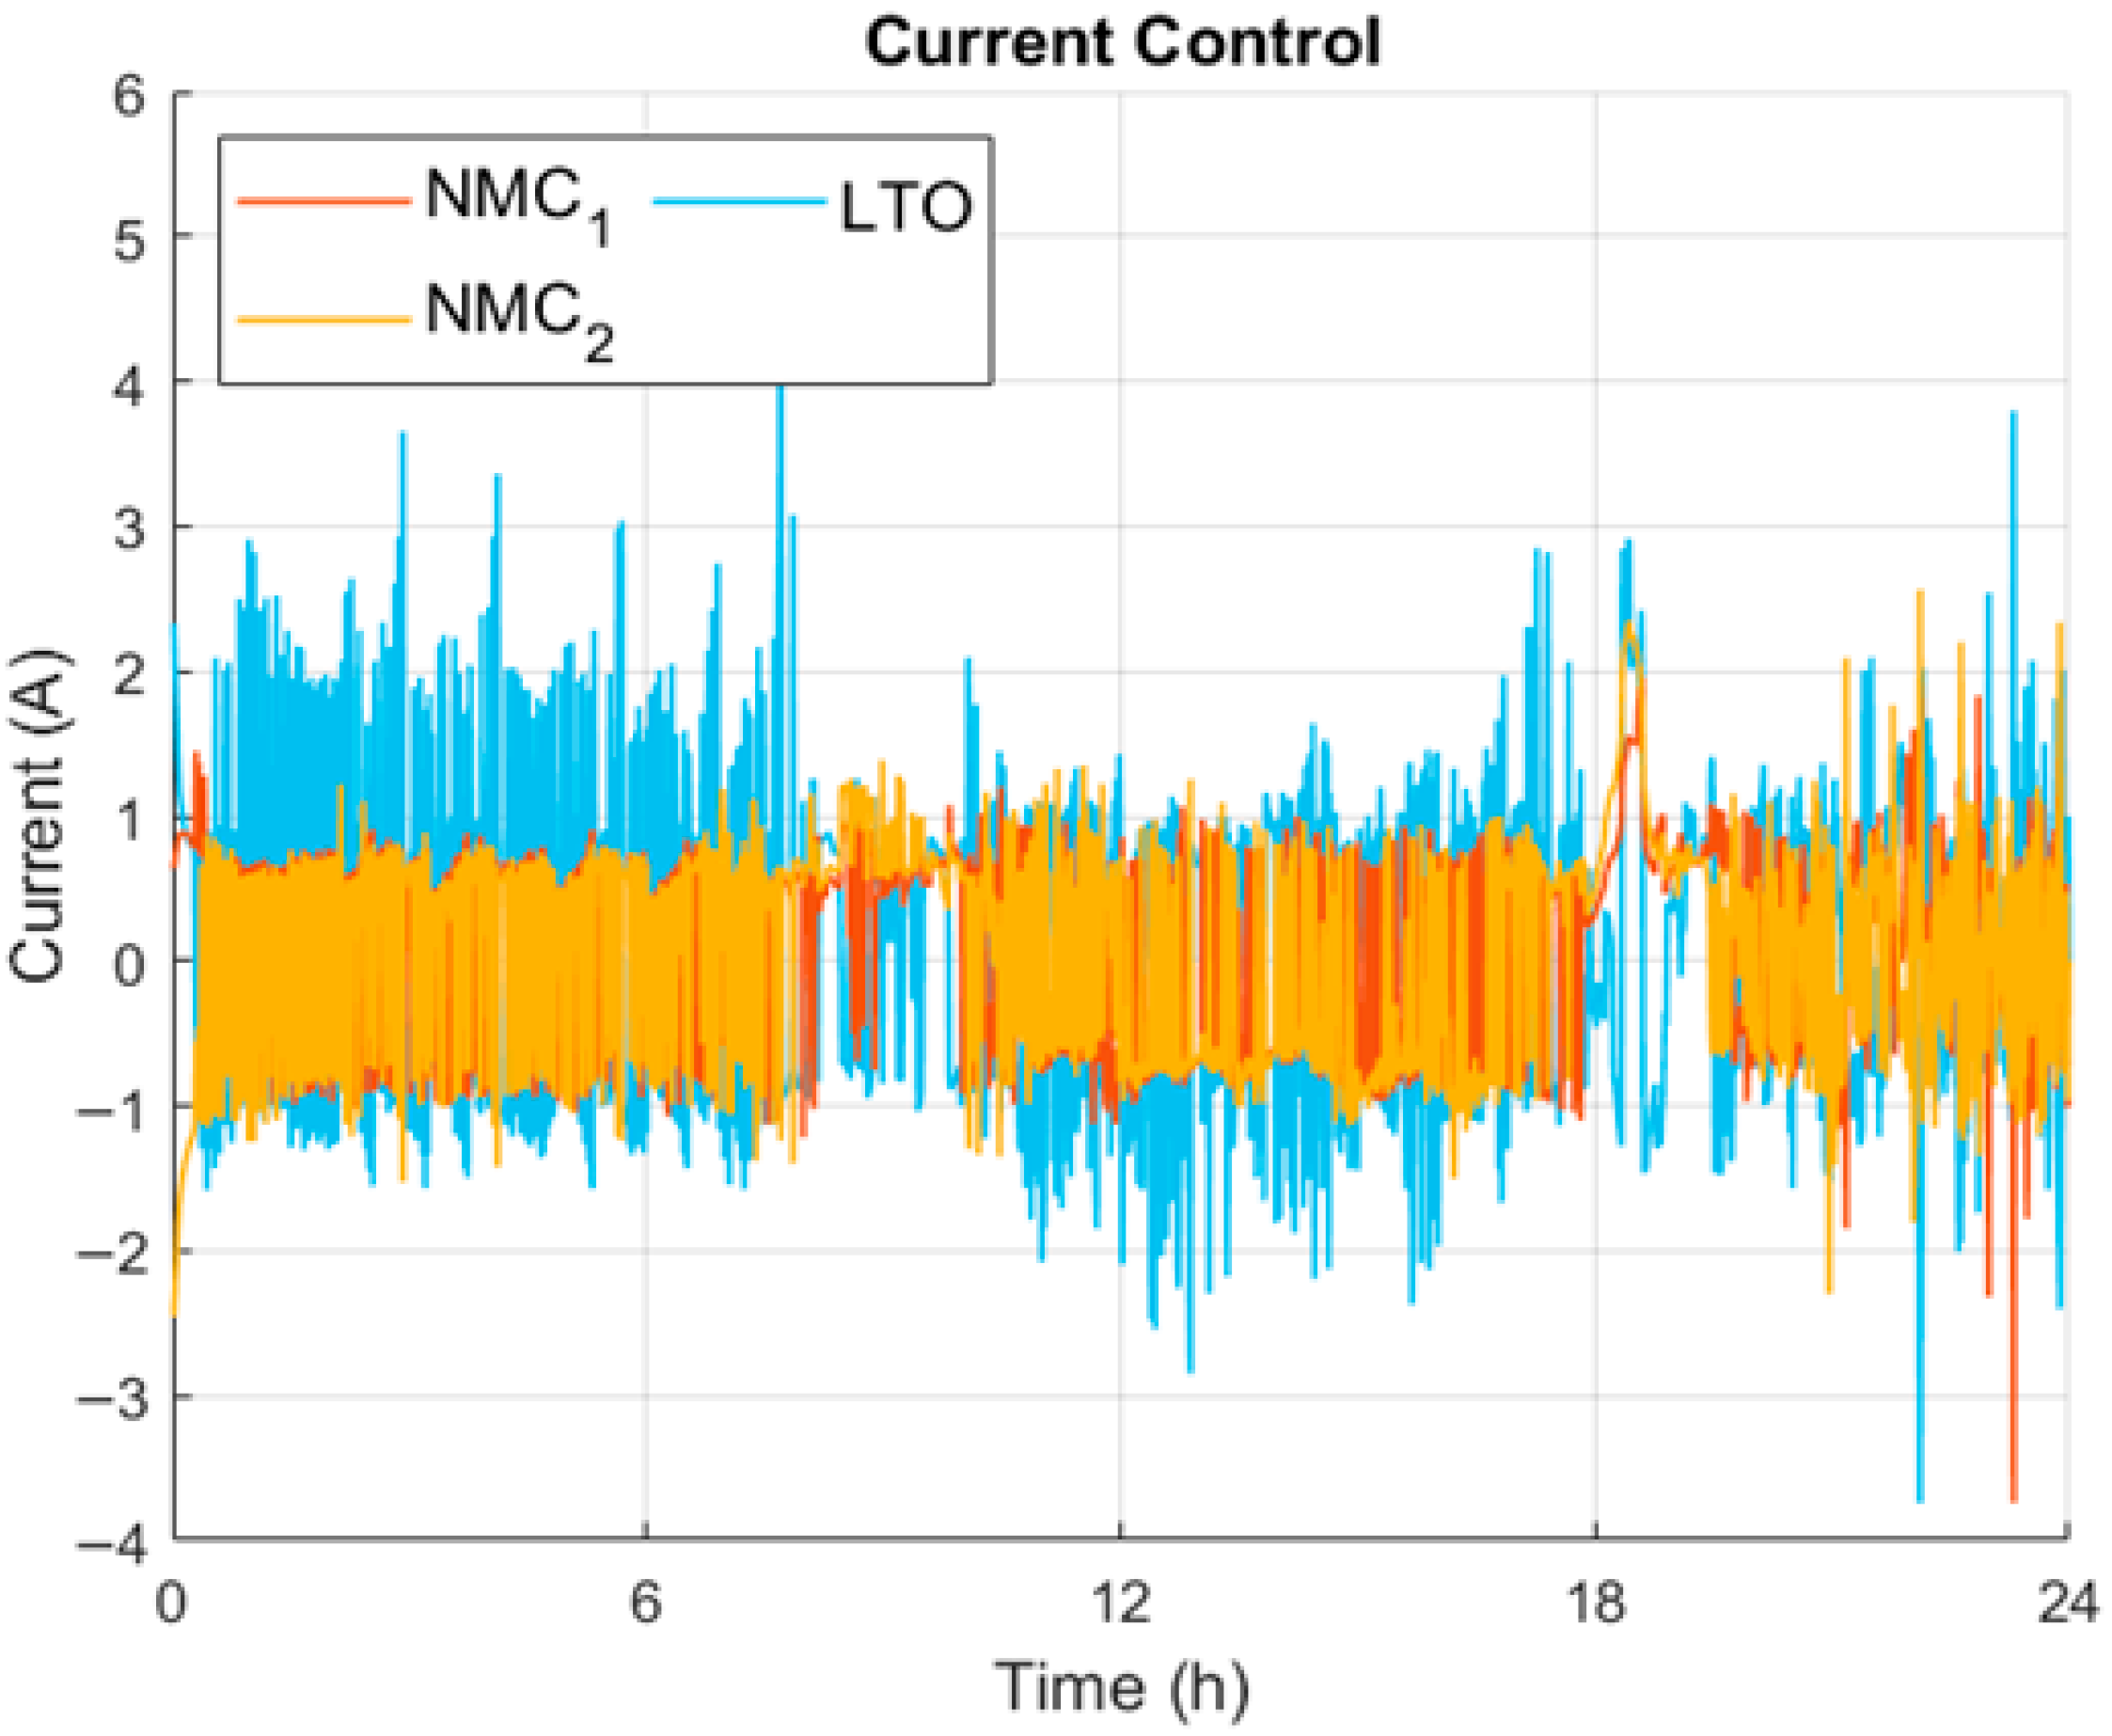
Figure 17 depicts a current profile demonstrating that the current fluctuates significantly, oscillating between approximately 1 and −1 A for the NMC and between −2 A and 2 A for the LTO. This behavior reflects the controller’s continuous effort to keep the operating point within the region that maximizes converter efficiency.
These oscillations, while necessary for the increase in efficiency, may introduce additional stress on the batteries, potentially affecting their aging and long-term reliability. Therefore, these results highlight an important trade-off: optimizing efficiency by maintaining the current near its most favorable operating range inevitably leads to higher short-term fluctuations in current profiles.
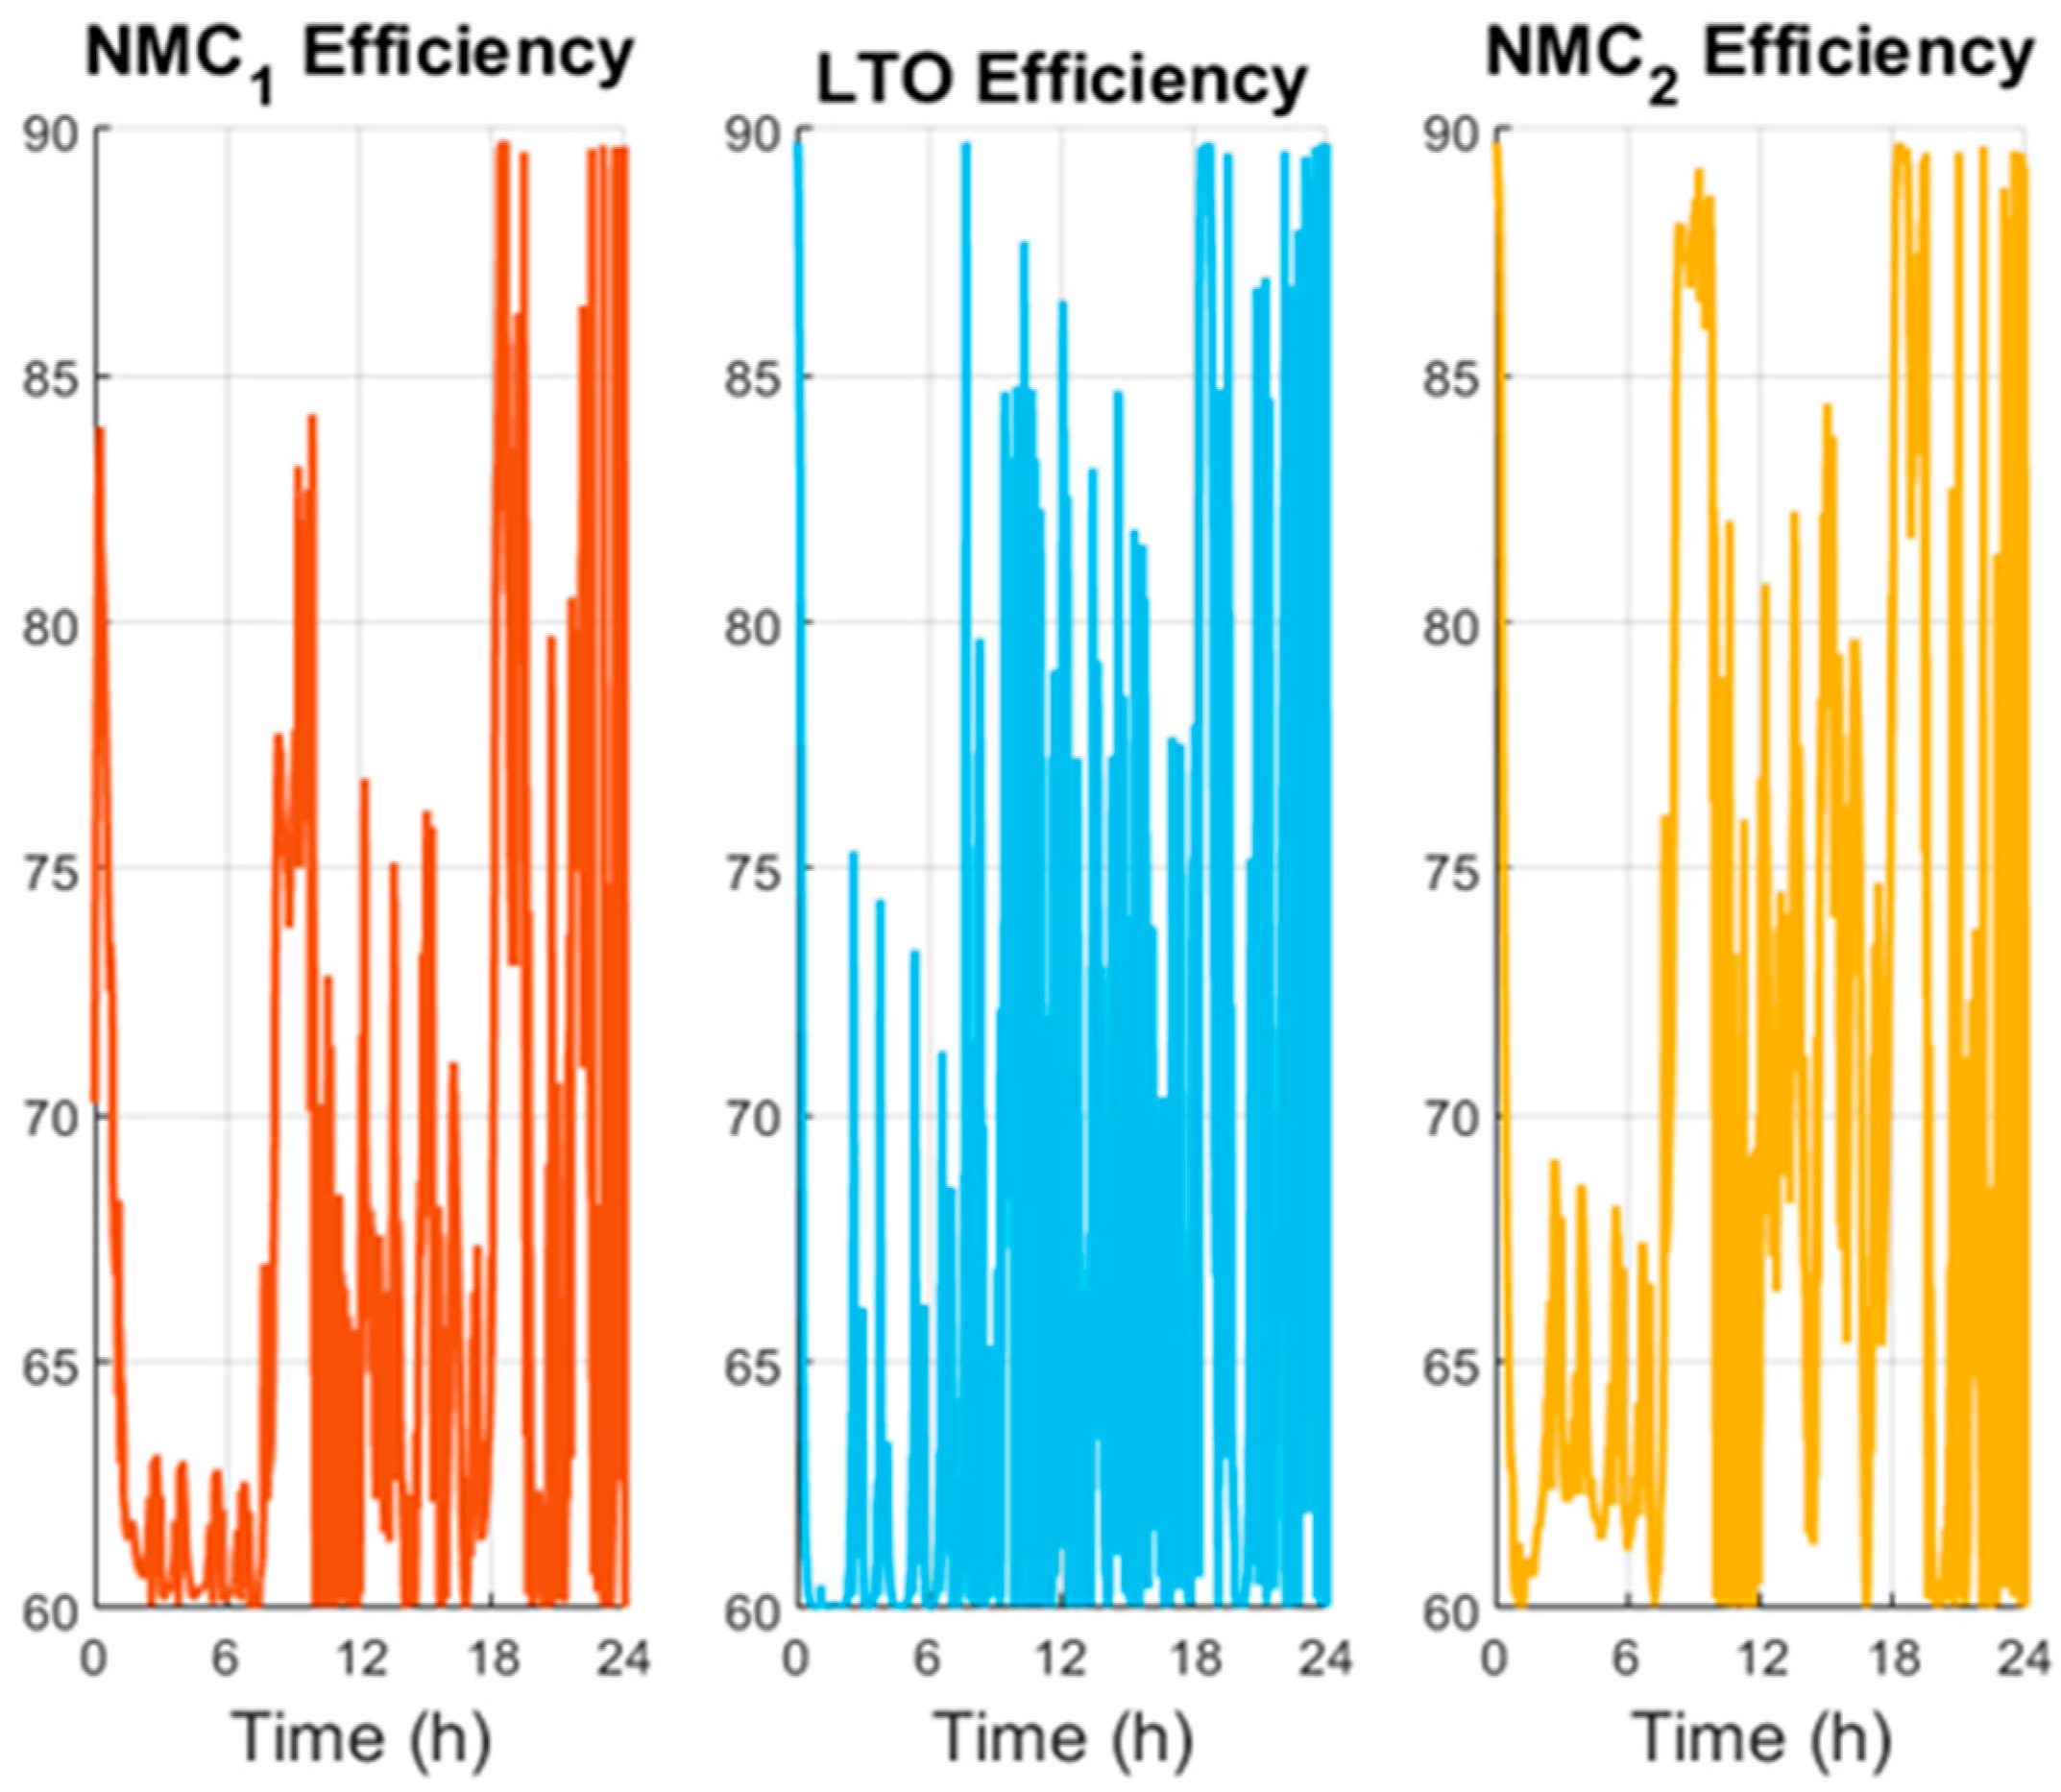
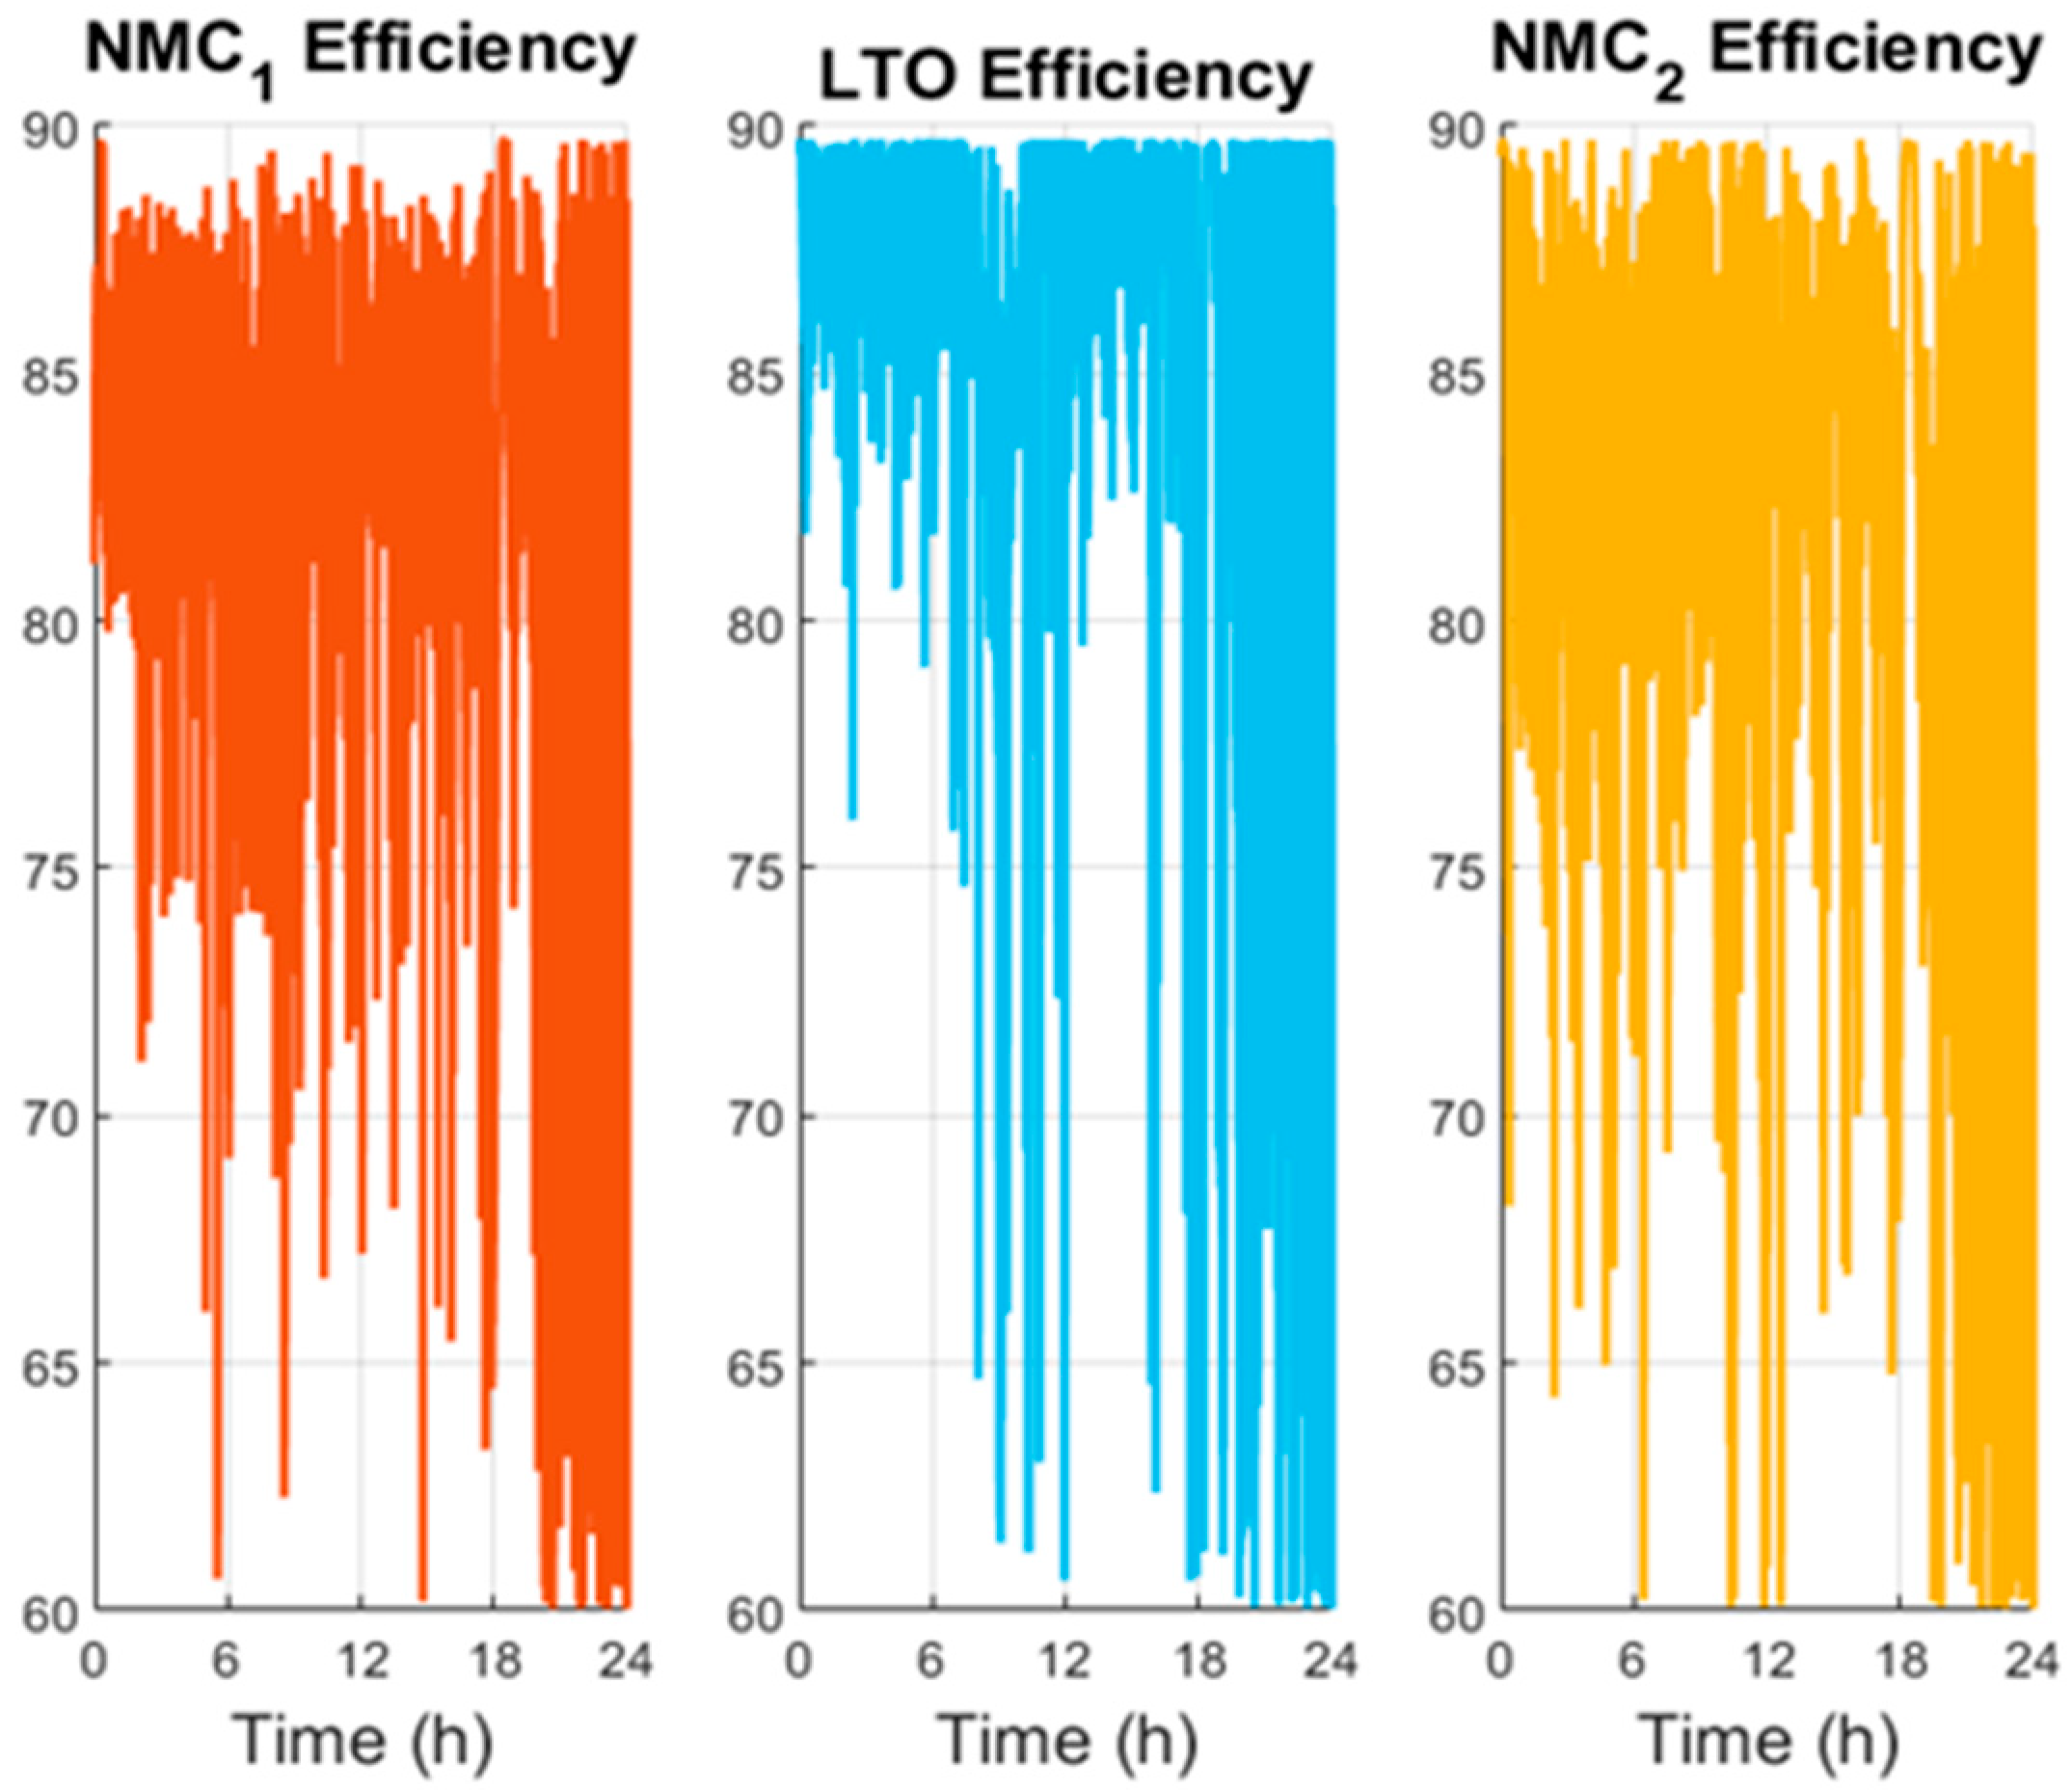
To better illustrate the connection between the theoretical formulation and the obtained results, it is important to quantify the effect of changing the efficiency weight in the cost function. When the efficiency weight was increased from 0.075 to 0.5, the average efficiency of the modules improved markedly: from 66.65% (NMC1), 69.81% (NMC2), and 66.64% (LTO) in the baseline case to 81.25%, 81.60%, and 85.37%, respectively. This represents an efficiency gain of more than 10% across all modules. However, this improvement was achieved at the expense of more pronounced current oscillations, particularly for the LTO module, where the current varied within ±2 A as the controller actively sought the operating points associated with higher converter efficiency. This result highlights the theoretical trade-off introduced in the cost function between maximizing efficiency and minimizing current stress to preserve battery lifetime. By adjusting the weighting factors, the MPC strategy allows for explicit navigation of this trade-off, demonstrating both the flexibility of the control design and its direct correspondence to the theoretical optimization problem.
Figure 18 shows the efficiency profile of the three batteries, with the mean values for each battery being 81.25% for NMC1, 81.60% for NMC2, and 85.37% for LTO, more than 10% higher than the previous simulation.
This improvement clearly demonstrates the impact of assigning a higher weight to the efficiency criterion within the optimization framework. By prioritizing efficiency, the system effectively shifts its operating point to regions where the converter performs optimally, even if this results in more fluctuating current profiles, as shown previously. Furthermore, the results highlight the flexibility of the proposed strategy; by adjusting the weighting factors, it is possible to emphasize different objectives, such as efficiency, battery lifetime, or grid support, depending on the requirements of the application.
To emphasize the necessity of a control strategy, a simulation was performed without any type of control. In this scenario, it is assumed that the total power demand is simply divided among the four supply elements (the two NMC batteries, the LTO battery, and the grid).
Figure 19 shows that the SOC of the batteries, specially the LTO, becomes discharged very quickly, even reaching values below 0, which means that this system could not be implemented in real life without a control. As seen, the implementation of the control strategy ensures safe, efficient, and reliable operation by maintaining the SOC within realistic bounds while simultaneously balancing power demand among the available resources.
The uncontrolled case further reinforces the necessity of explicitly including the SOC and current constraints in the MPC formulation. Without a control, the LTO module rapidly over-discharges, even reaching infeasible negative SOC values, which are physically unrealistic and would cause permanent battery damage in practice. In contrast, the MPC formulation ensures that such violations are avoided by enforcing the theoretical constraints at each step of the optimization. This comparison highlights how the theoretical framework directly translates into safe and feasible system operation in realistic scenarios.
After this first approach to the renewable energy system (RES), we performed a simulation regarding the power demand from the entire week. In this case, efficiency is not considered to be a priority, so the weight is 0.075.
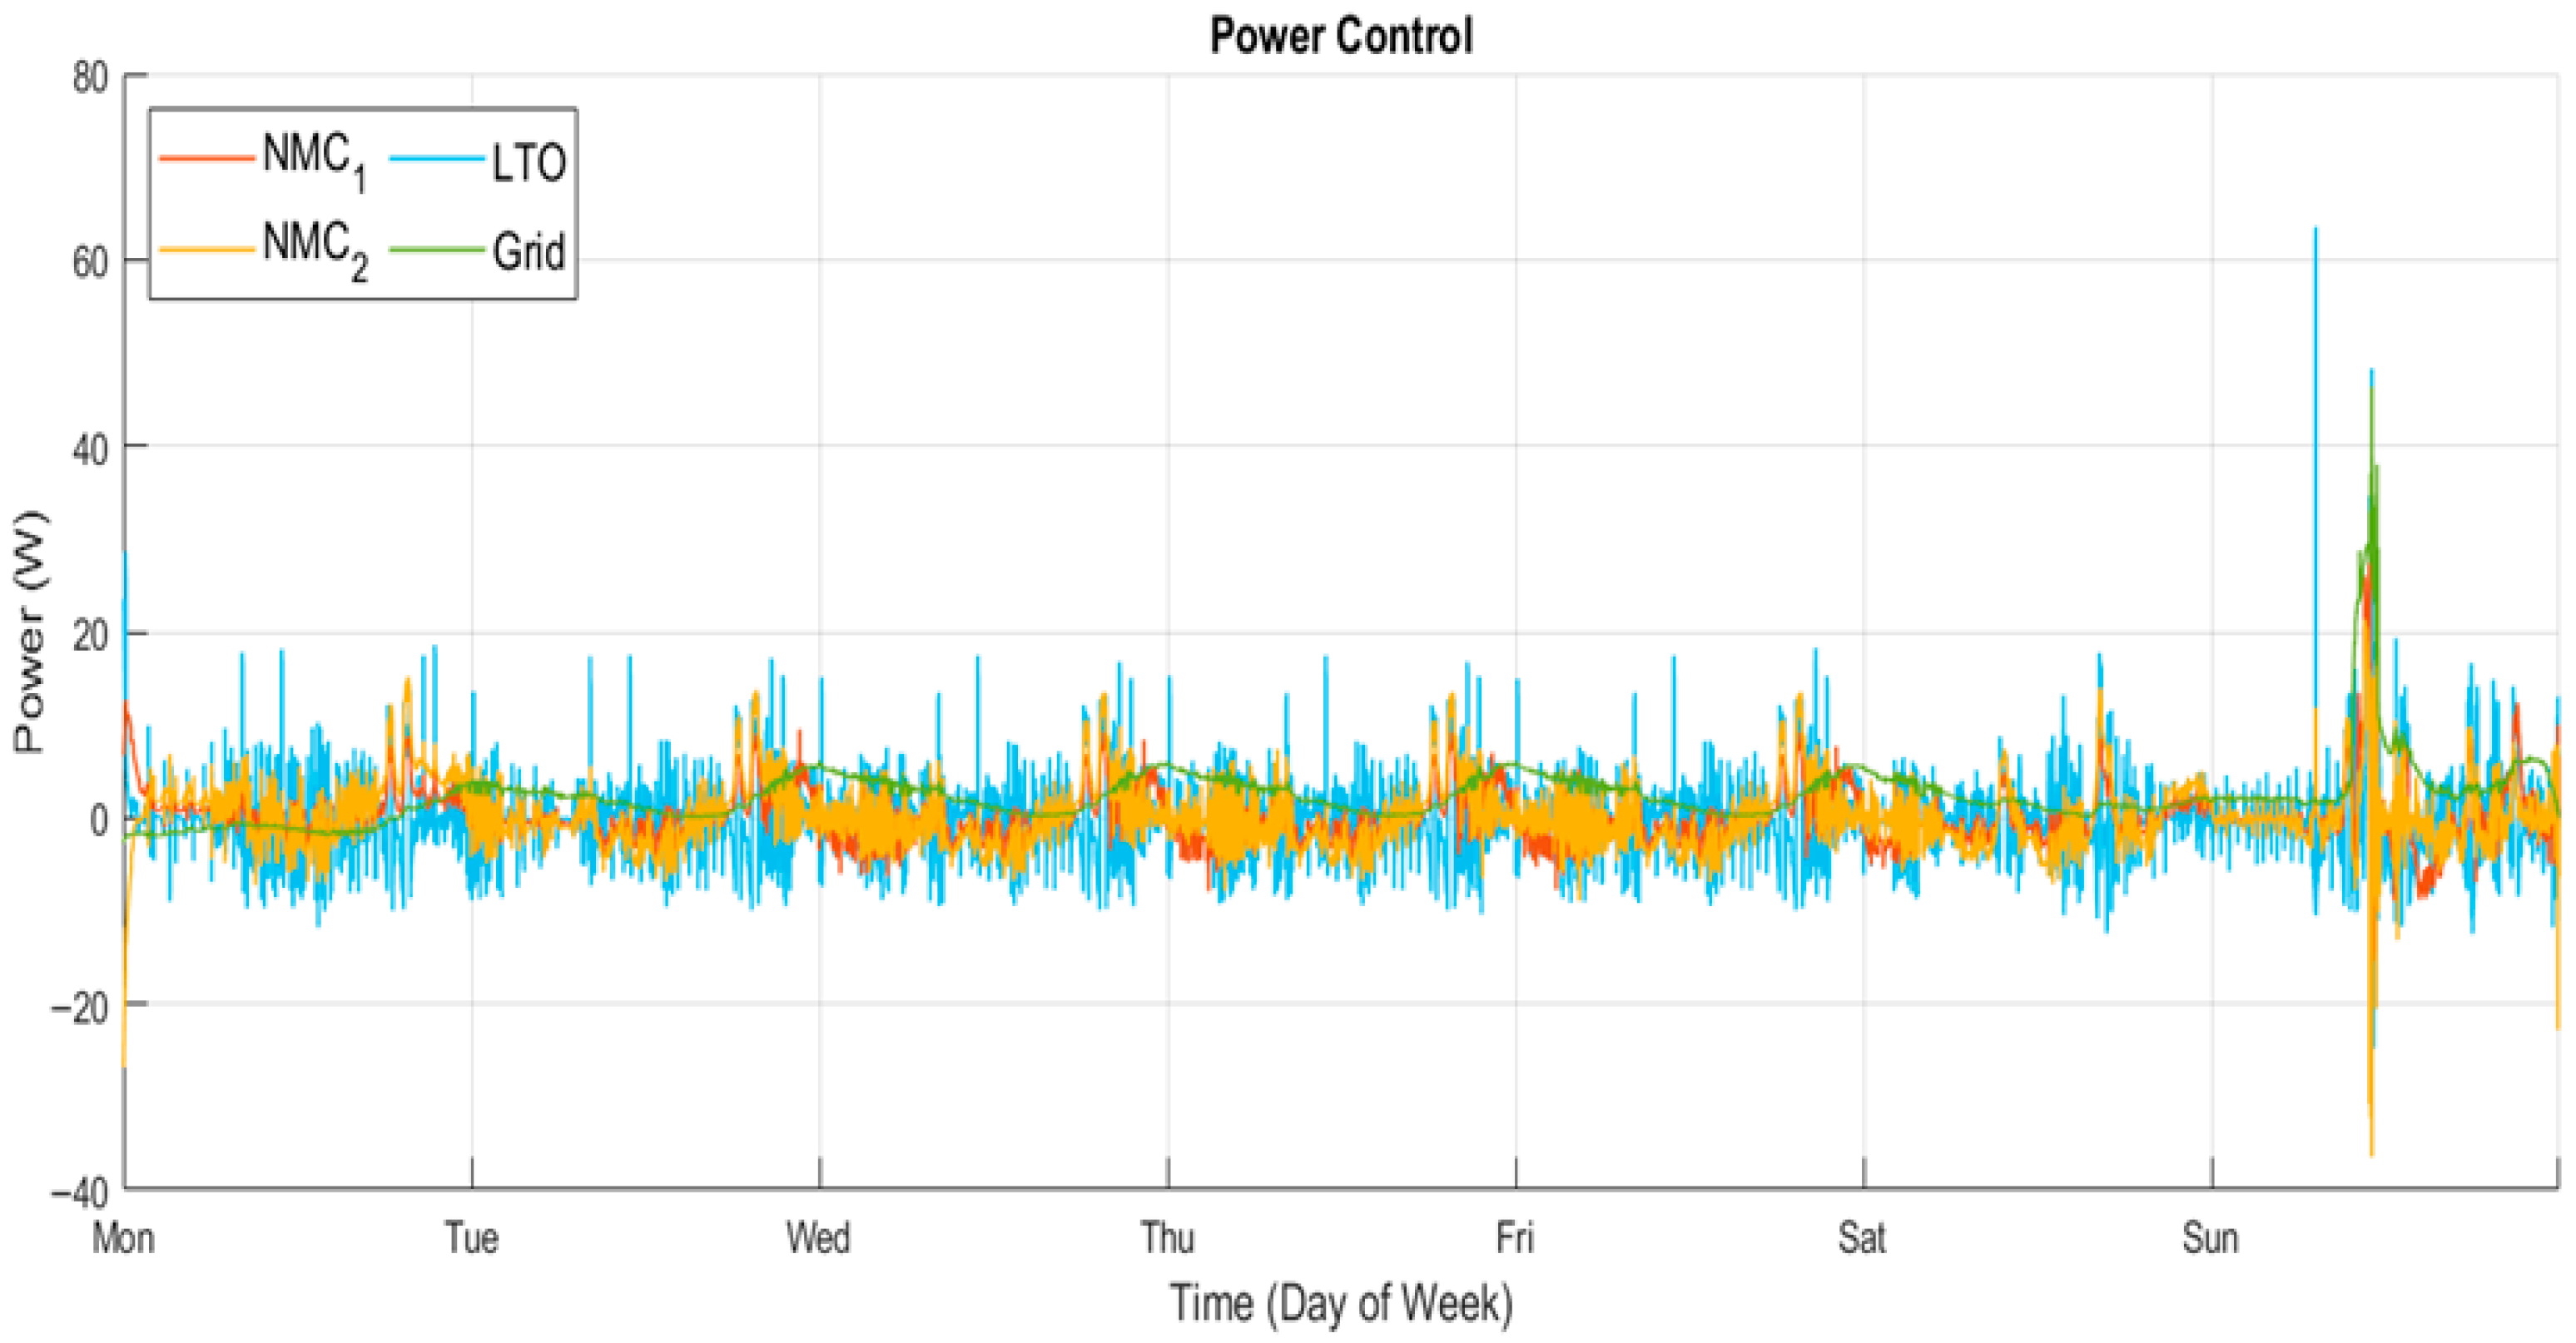
Figure 20 shows the power profiles of the batteries and the grid. Similar to the results obtained from the one-day simulations, the LTO is the main power source, especially for the peaks, while the NMCs are more constant regarding their power supply. The grid also becomes the main provider by the last day of the week.
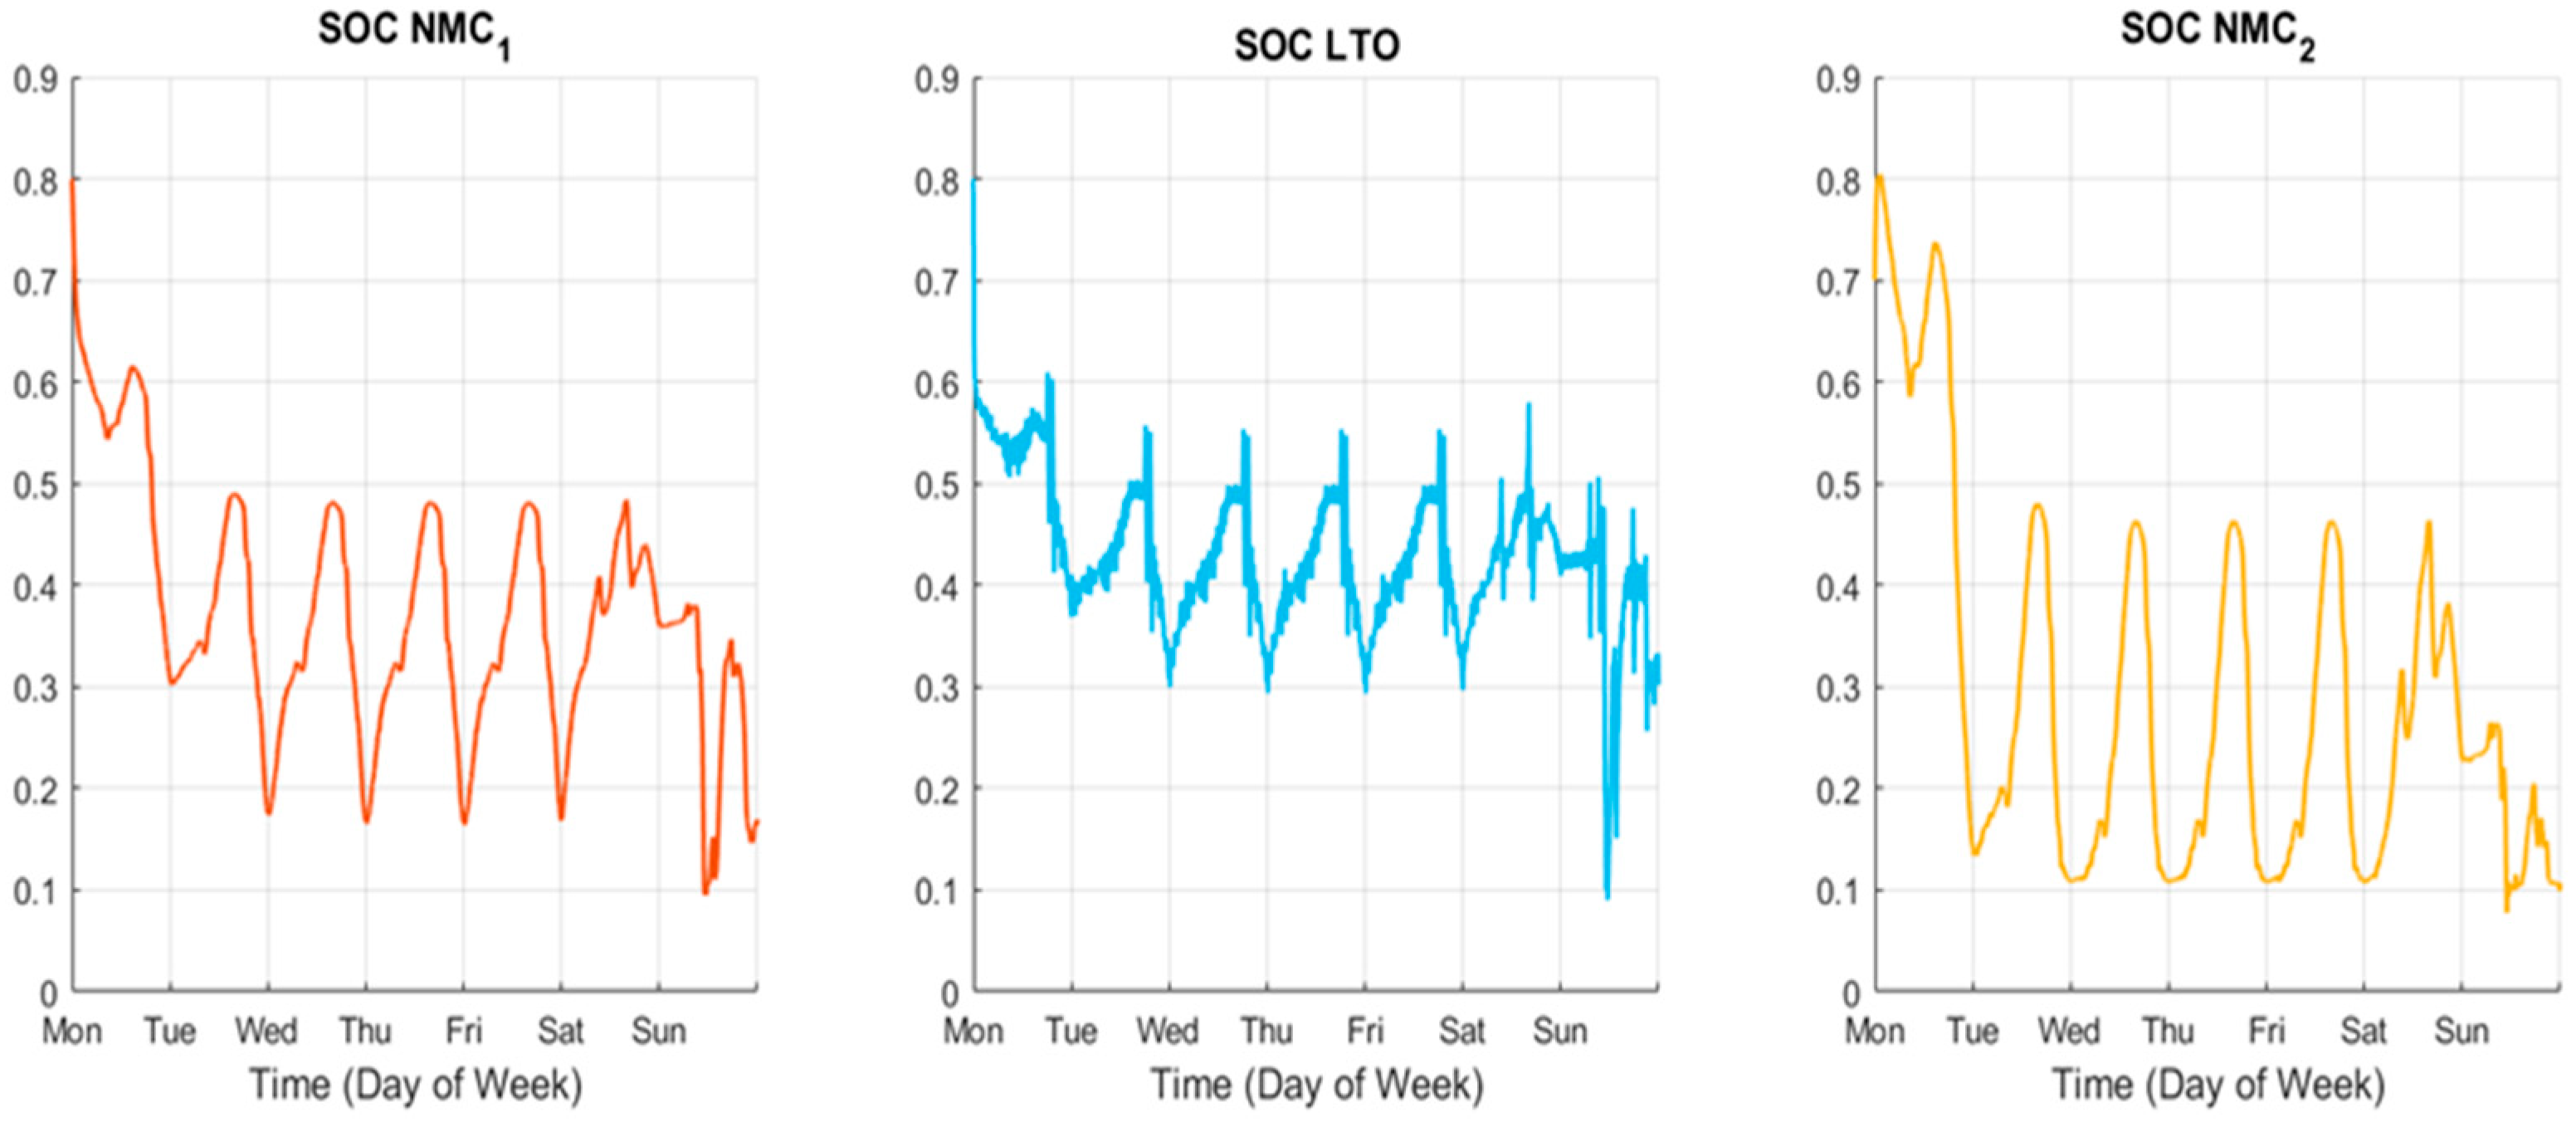
Figure 21 shows the SOC profiles of the batteries. During weekdays, the behavior is largely consistent and very similar to that of the previous simulations, with the batteries supplying energy during the late hours of the day when demand is highest and storing energy during the morning and afternoon. This is the main difference from the one-day approach, as the first discharge observed previously does not happen. All three batteries reach their lowest SOC values near the 0.1 limit defined in the optimization problem on Sunday, when the highest power demand peaks occur and the grids become the main provider.
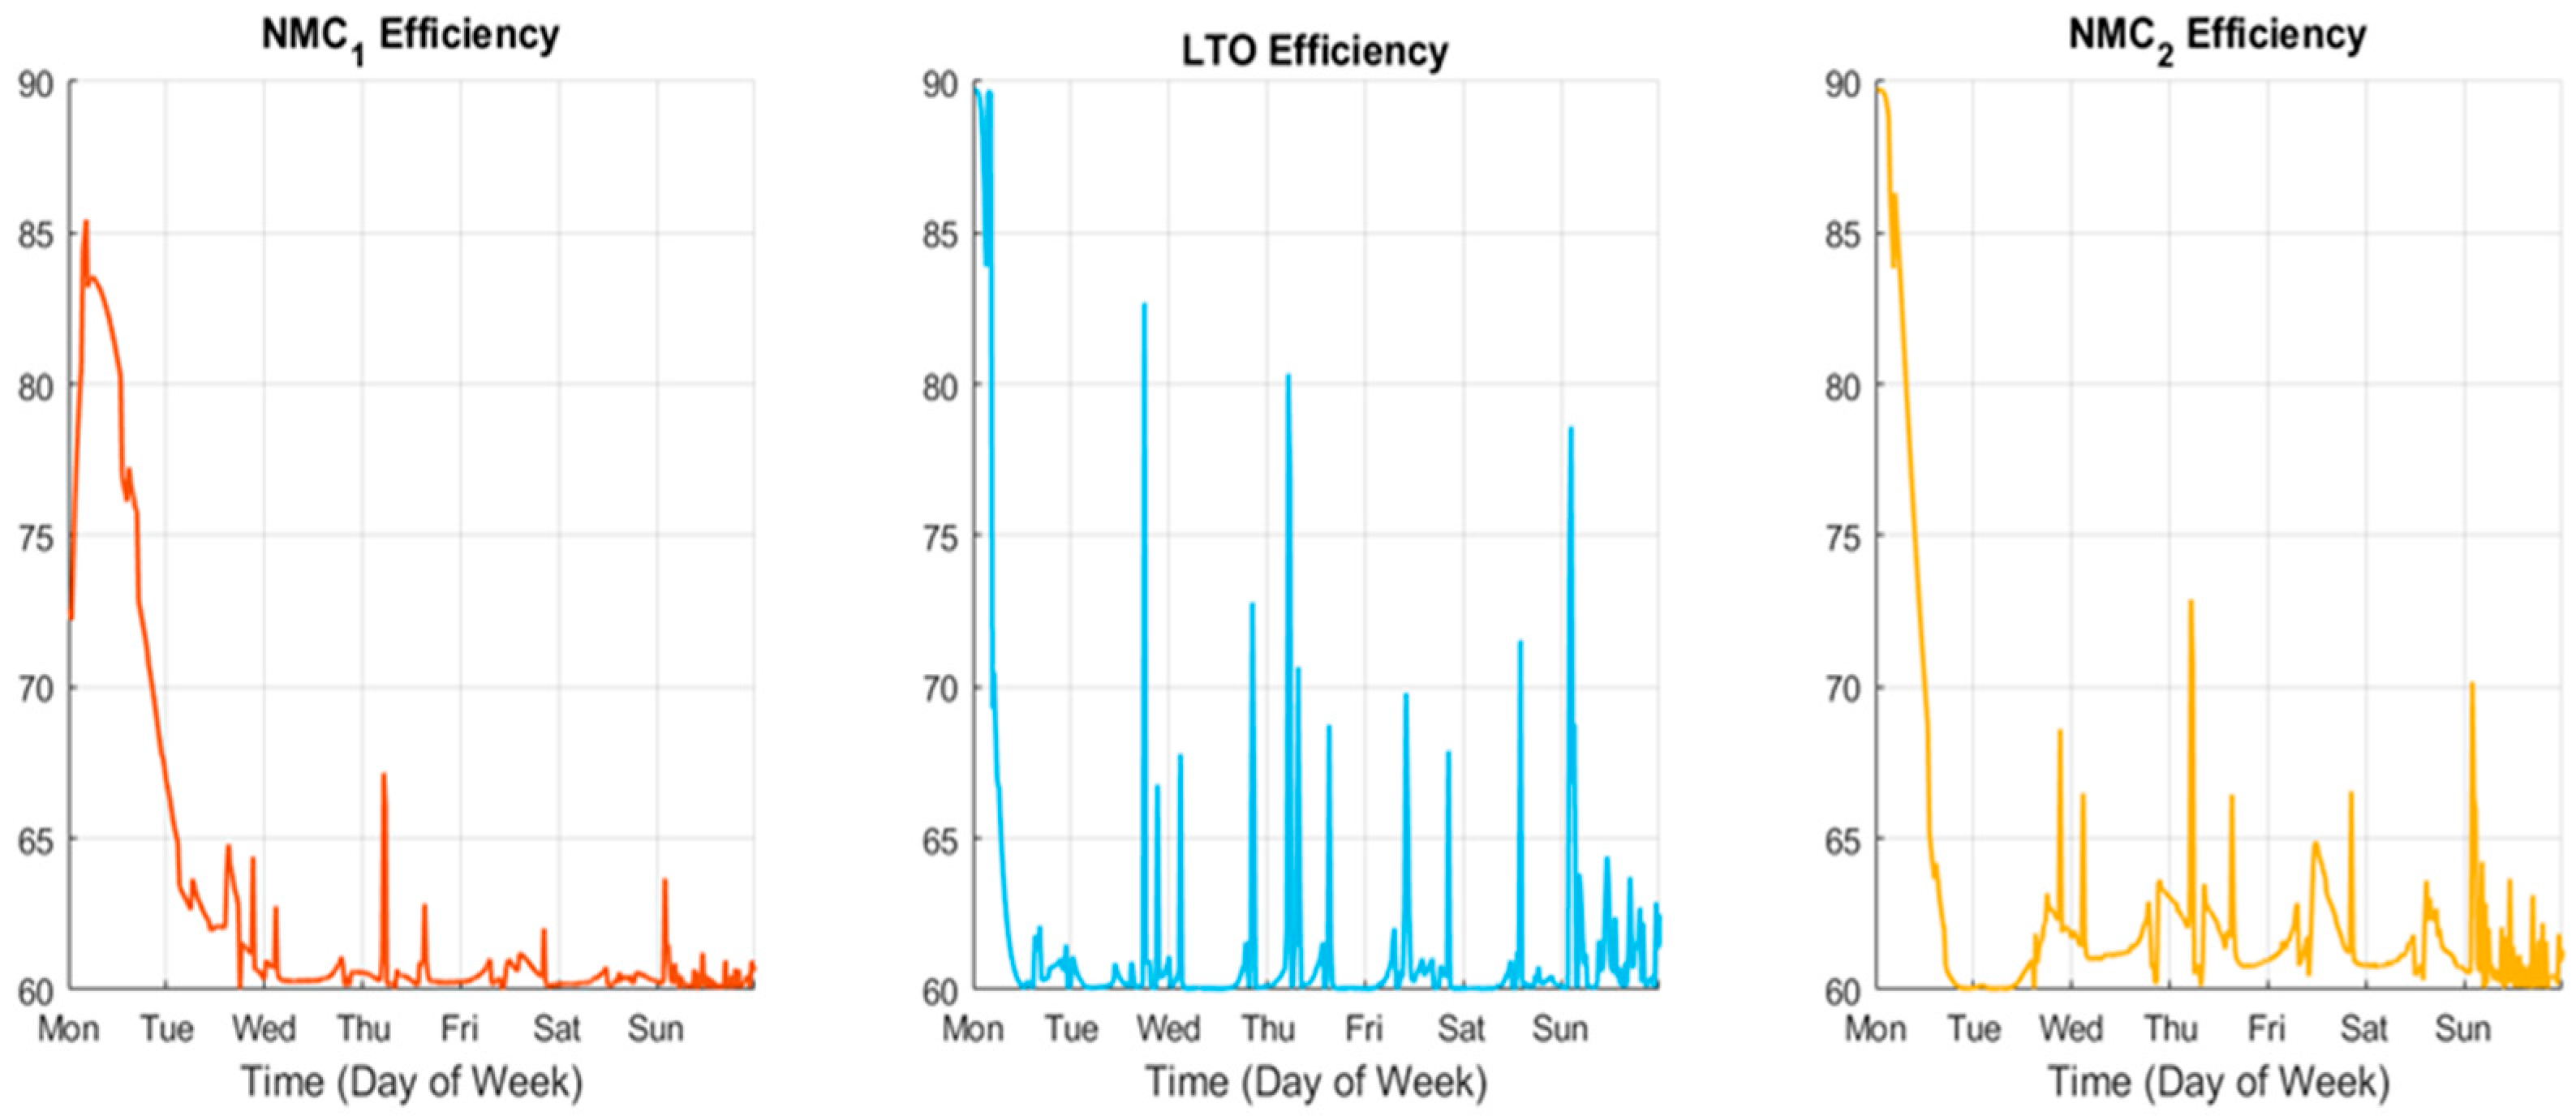
As said previously, efficiency is not considered a priority in these results, as
Figure 22 can show the efficiency of the three batteries. The results of the mean values are 62.66% for NMC1, 63.82% for NMC2, and 64.63% for LTO, with all the efficiencies being lower than 70% and between 2% and 6% lower than the one-day simulations’ efficiencies.
As expressed previously, the results are very similar to the ones in the first simulation. These results confirm that the control strategy effectively balances the load among the batteries and the grid, prioritizing LTO for peak handling while preserving NMC health. The approach ensures system reliability over extended periods, manages battery degradation, and maintains a predictable power delivery profile, demonstrating the robustness of the MPC strategy across both single-day and week-long demand scenarios.
6.2. Case B: Electric Vehicle
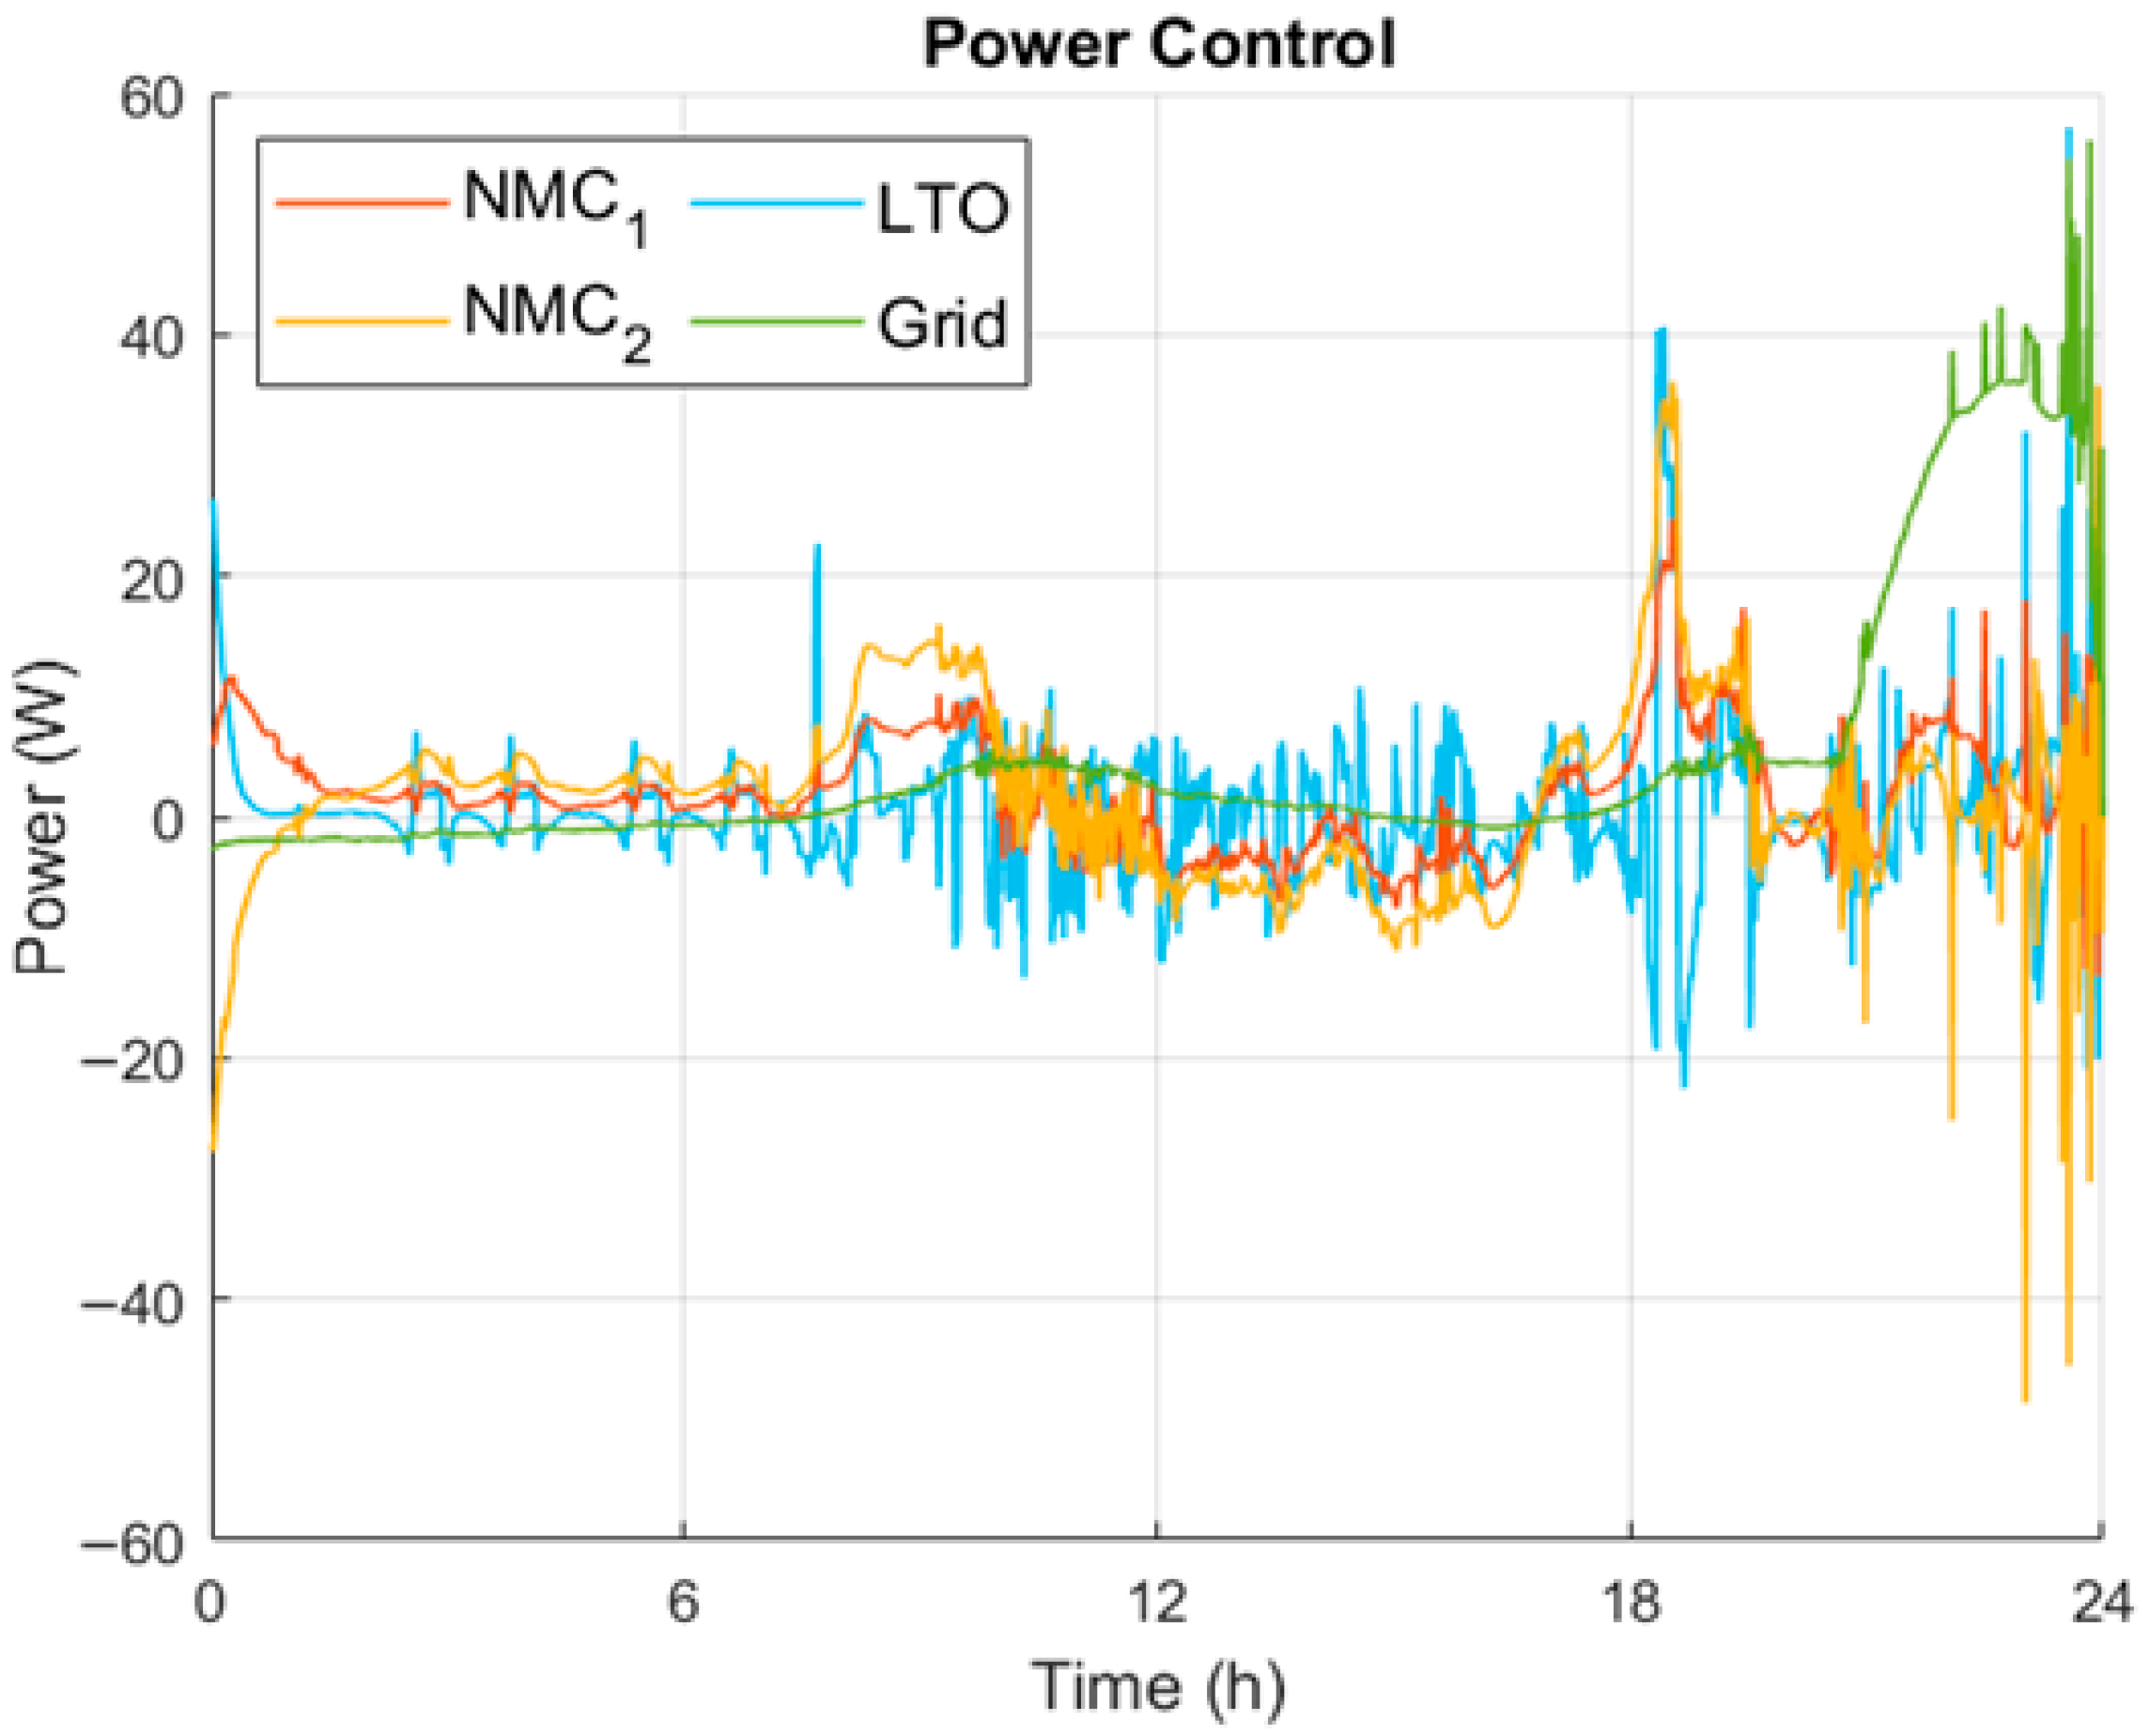
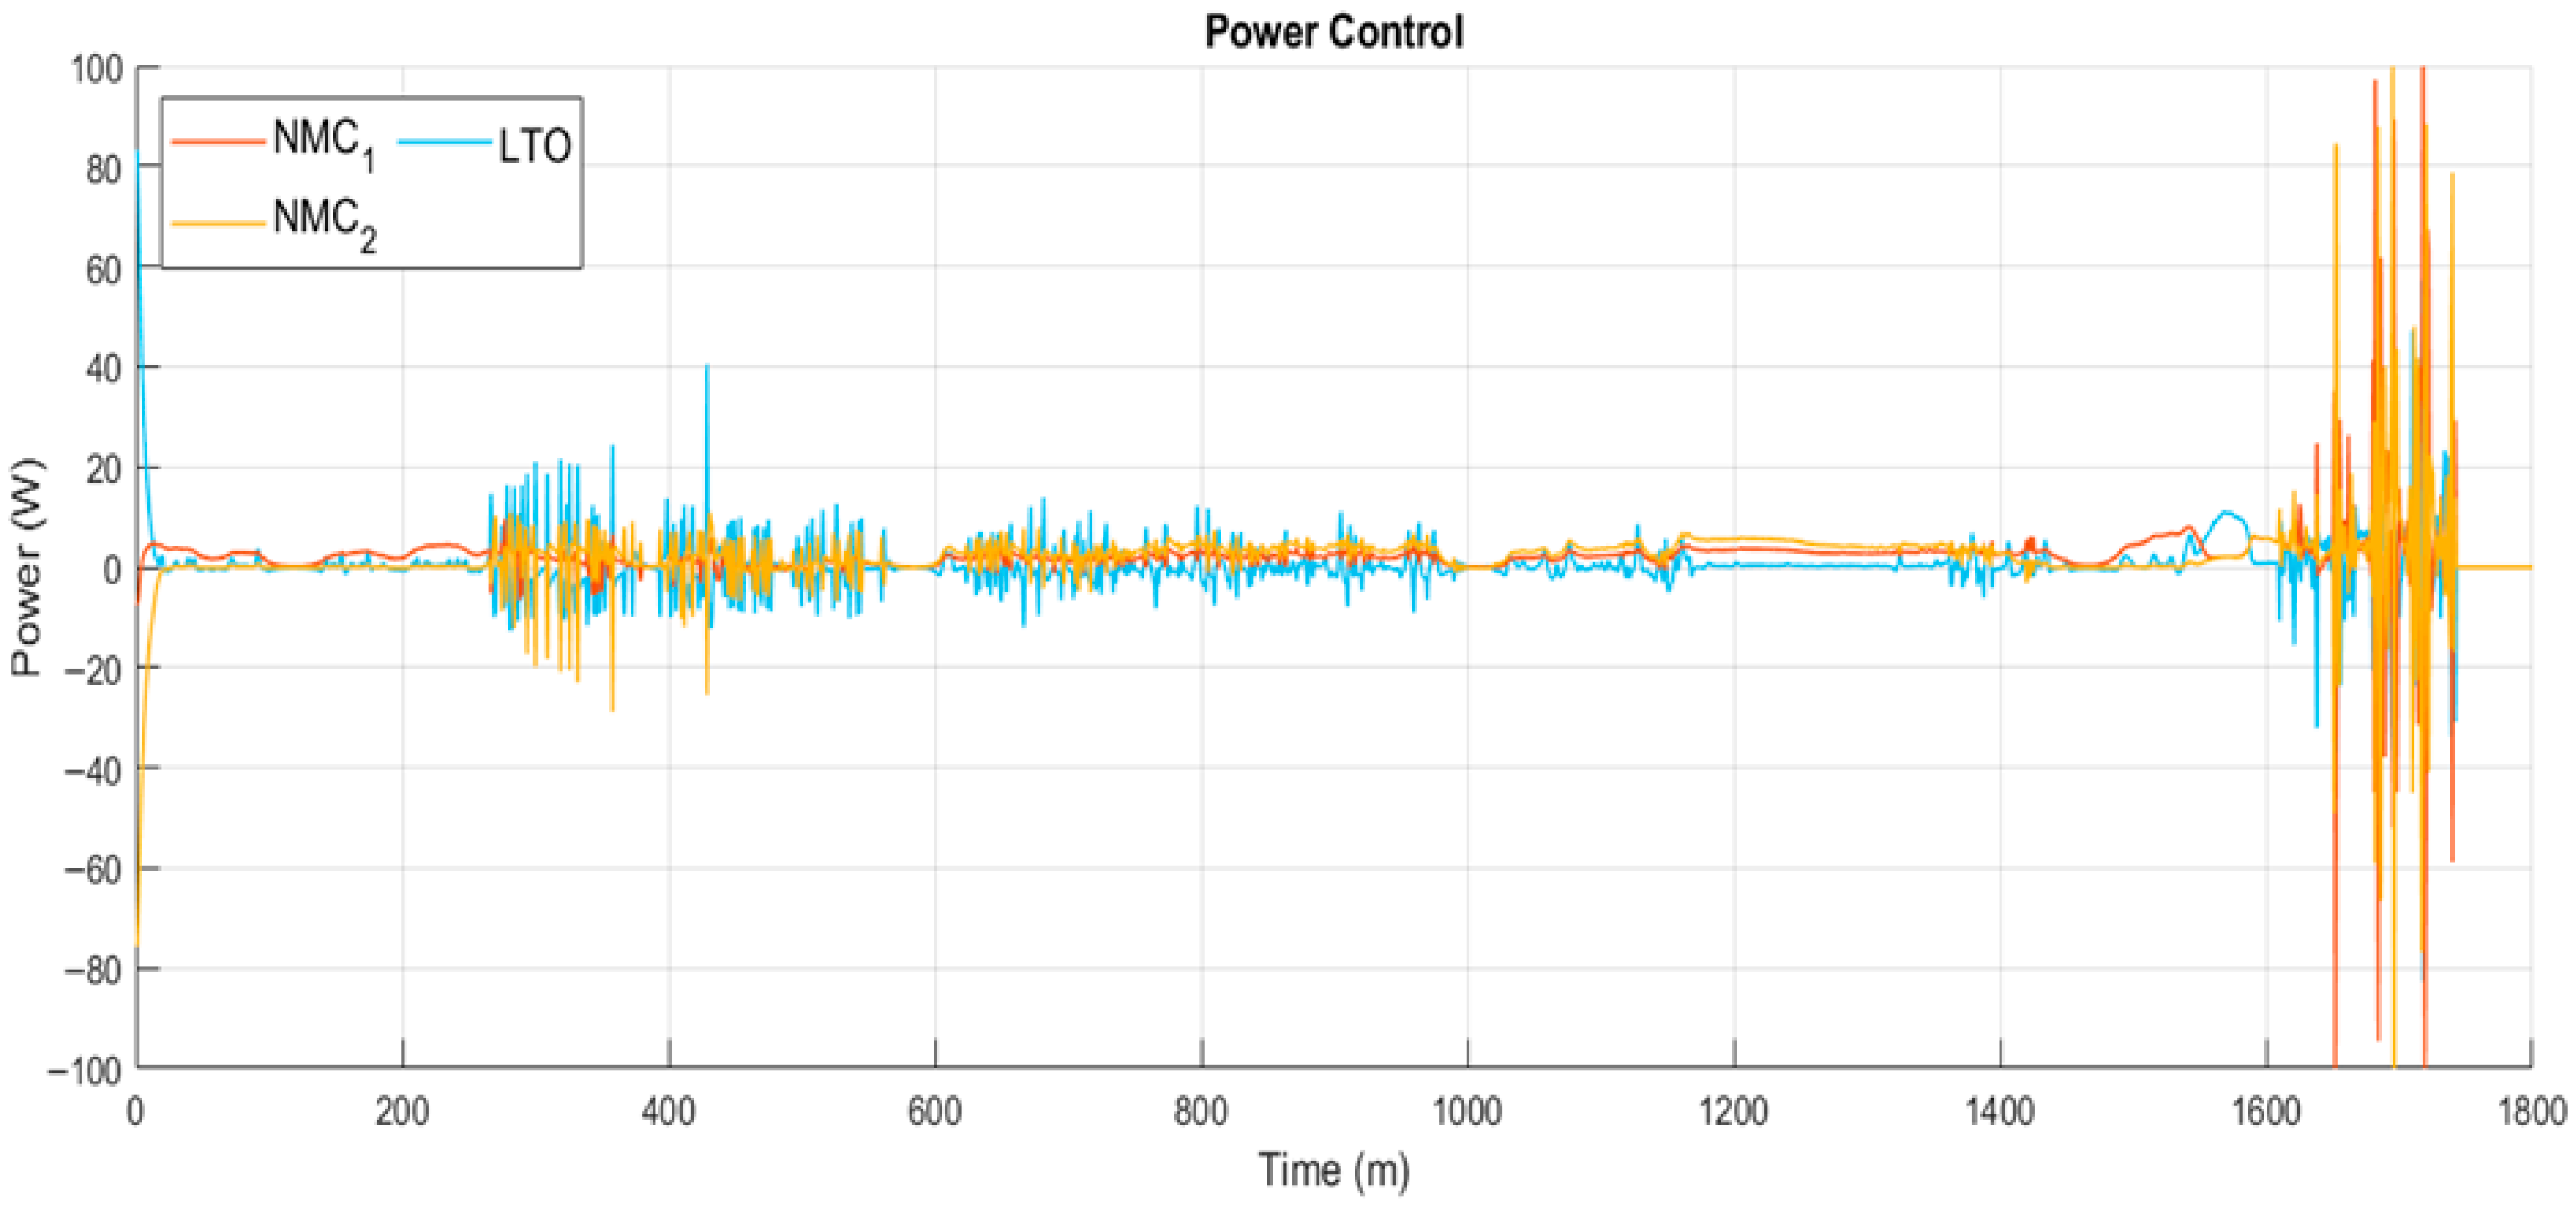
In this case, efficiency is also not considered a priority, with its weight being 0.075. The power delivered by each battery considering all the weights is shown in
Figure 23.
The results align with the MPC strategy, as the LTO seems to be the one delivering the peaks and the fluctuations in power from the demand while the NMCs have a more constant power profile until the final part of the simulation when all the batteries experience big fluctuations because of the high-power demand peaks. In general, the MPC correctly balances the batteries in order to not cause greater stress in one of them while still following the strategy from the weights.
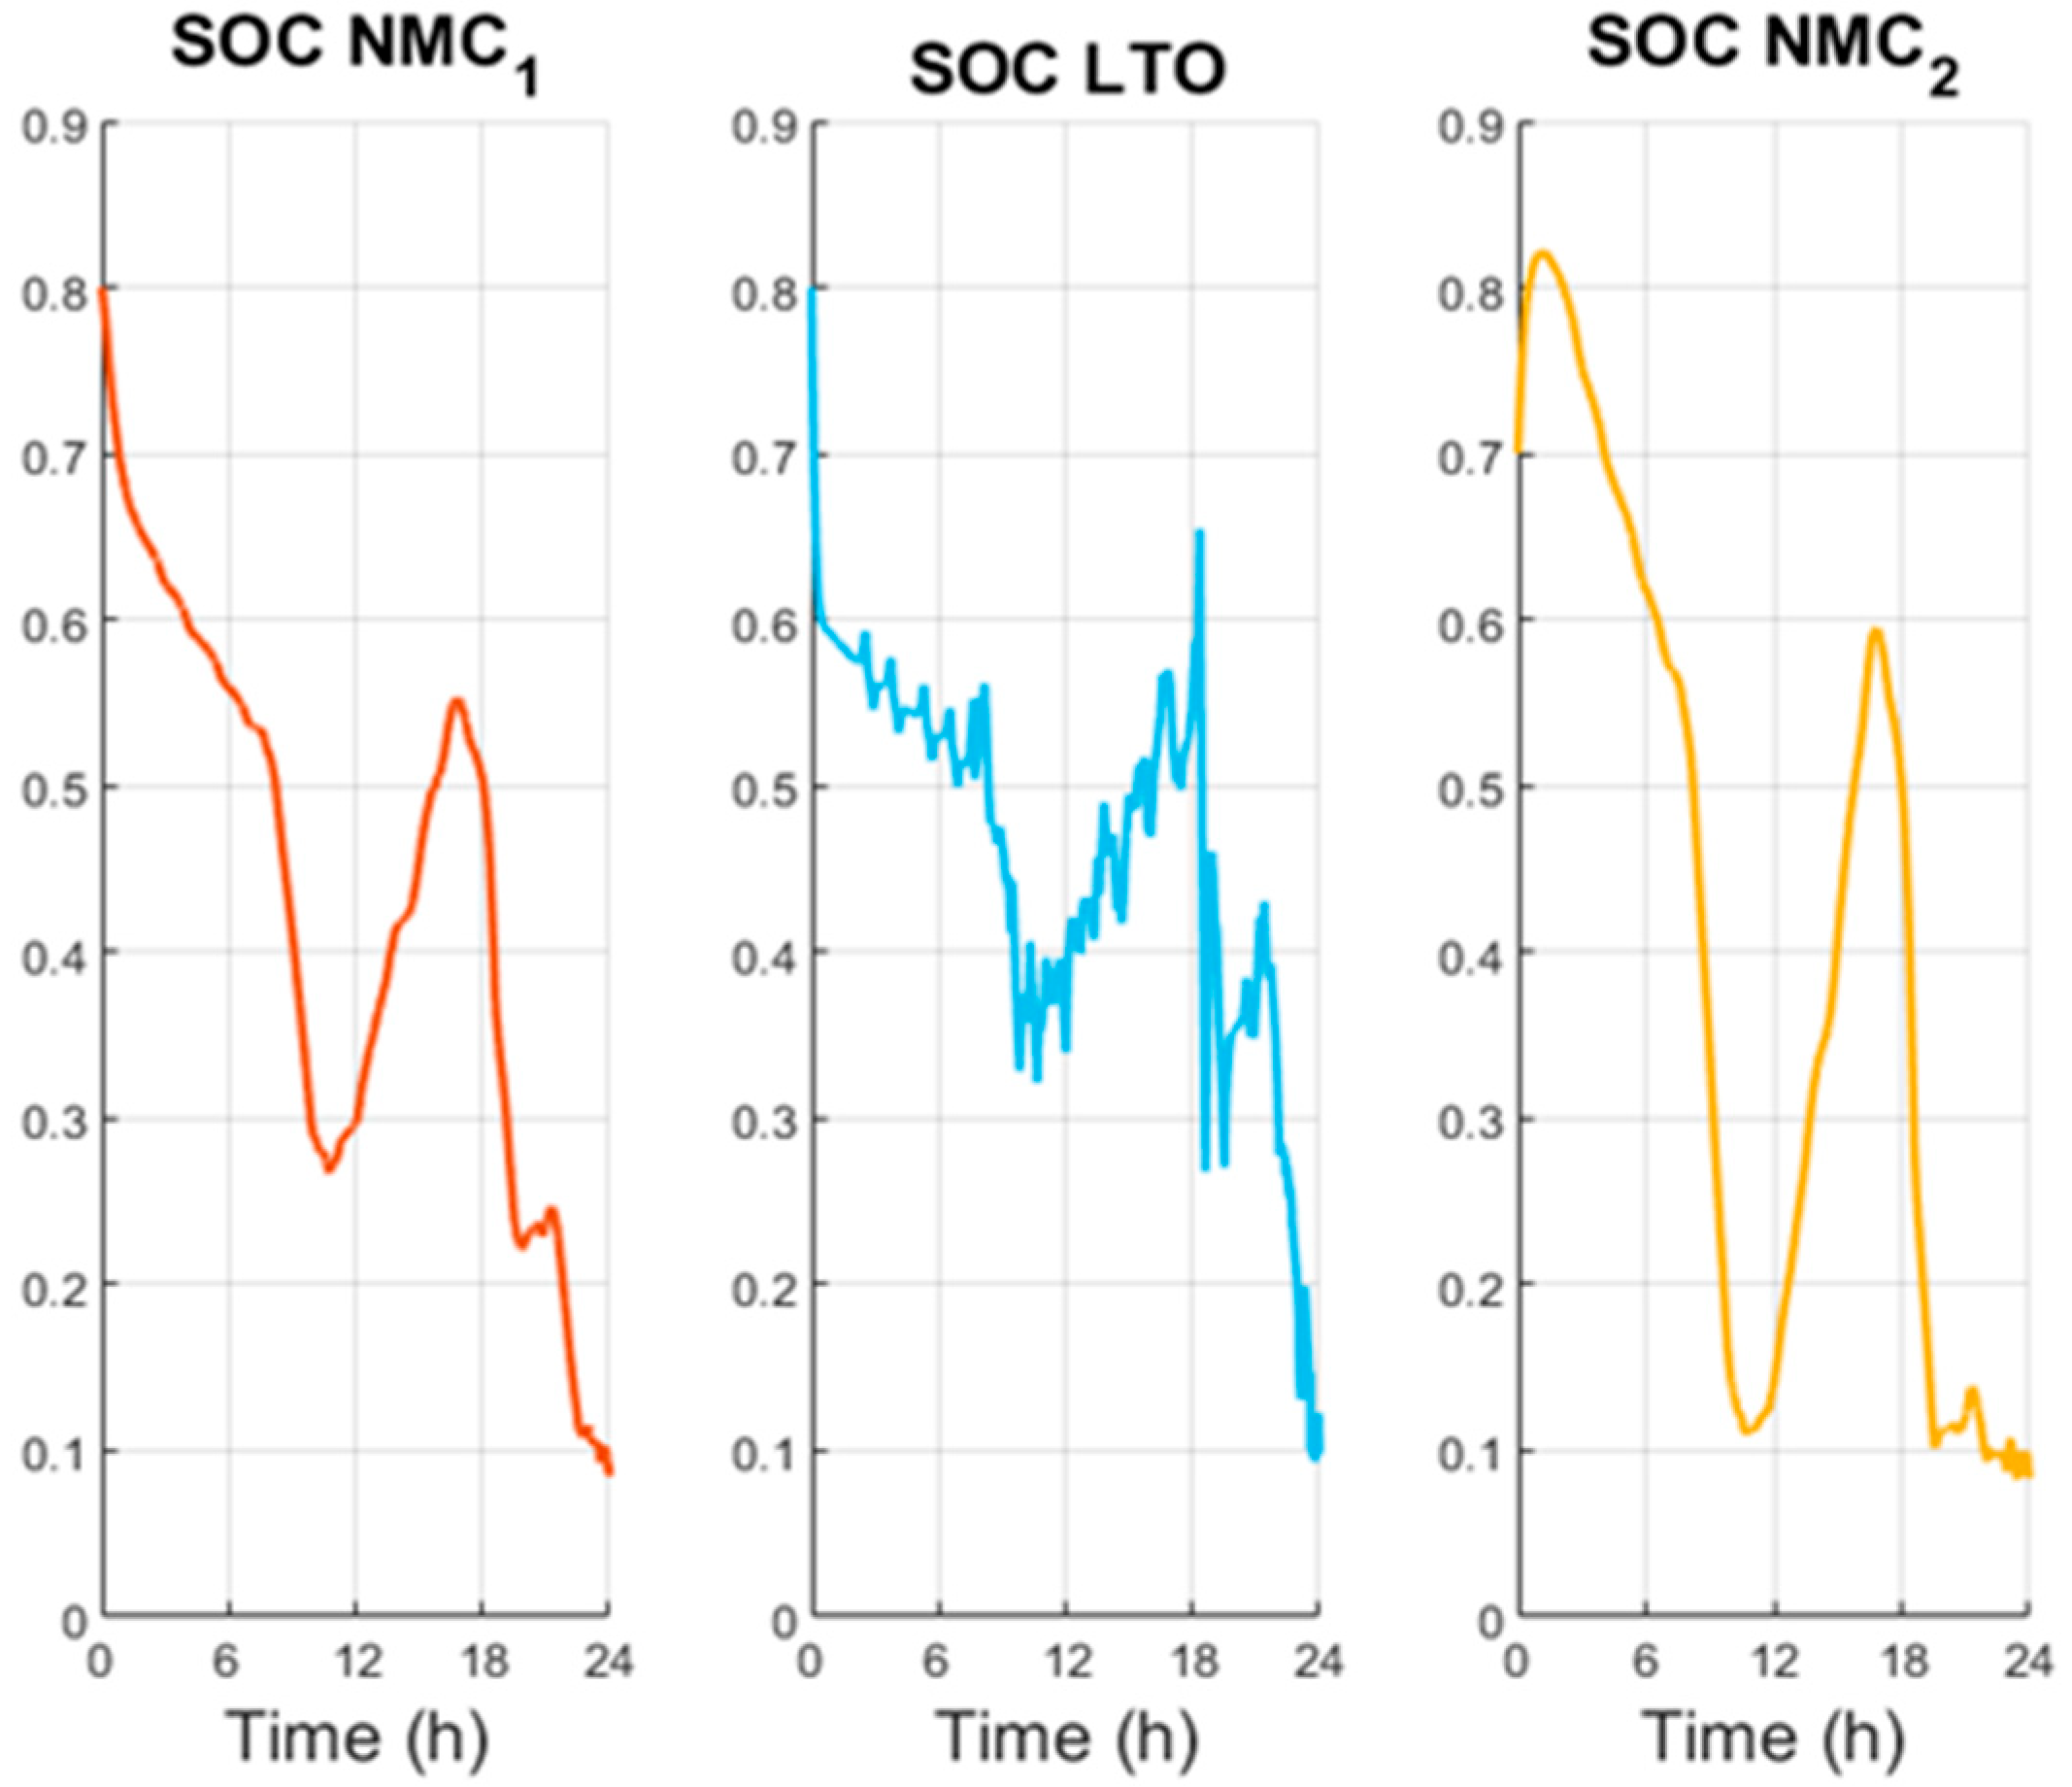
As can be observed at the end of the WLTP cycle in
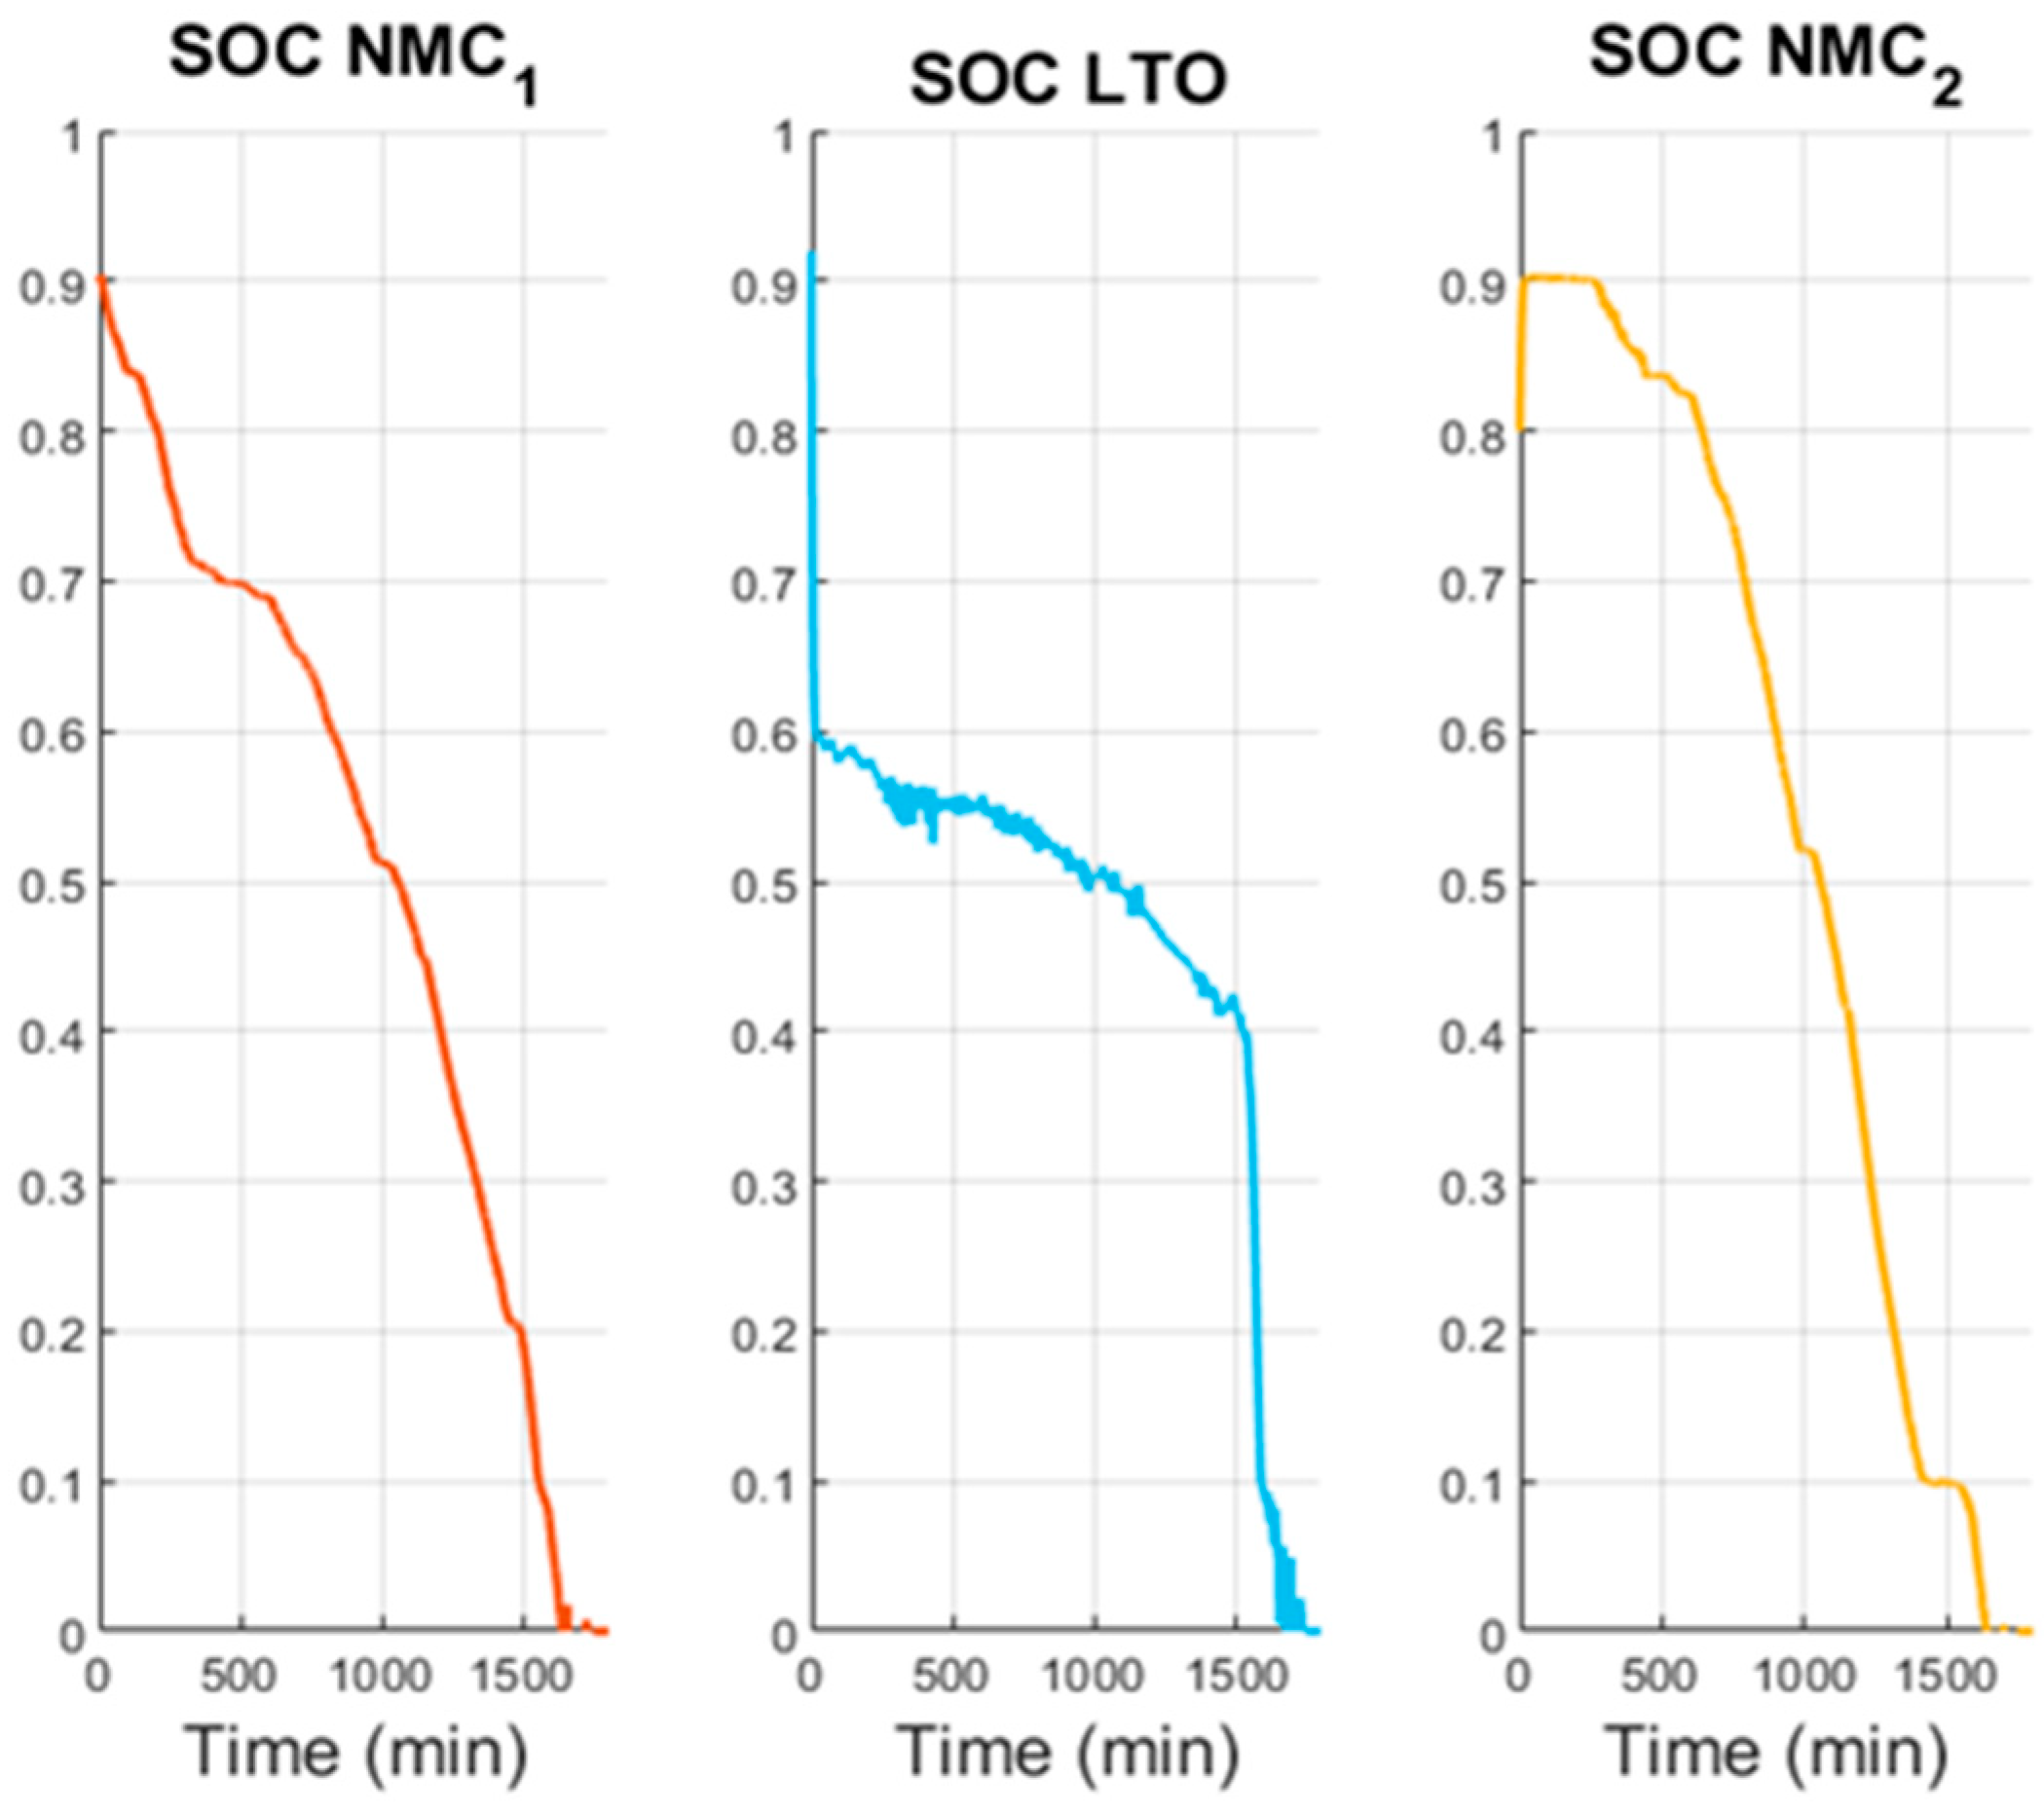
Figure 23, the batteries reach a deep discharge with significant power fluctuations. Regarding the SOC,
Figure 24 shows that all batteries reach values below the minimum SOC defined in the optimization problem. This occurs because, in this scenario, the system sizing is insufficient to fully meet the vehicle’s power demand under normal operating conditions.
Nevertheless, the demand profile has been maintained to illustrate the operation of the MPC, which prioritizes meeting the required power demand even when SOC constraints are temporarily exceeded. For longer WLTP profiles, it would be necessary to appropriately rescale the system to ensure that the power demand can be fully satisfied while keeping the SOC within safe operational limits.
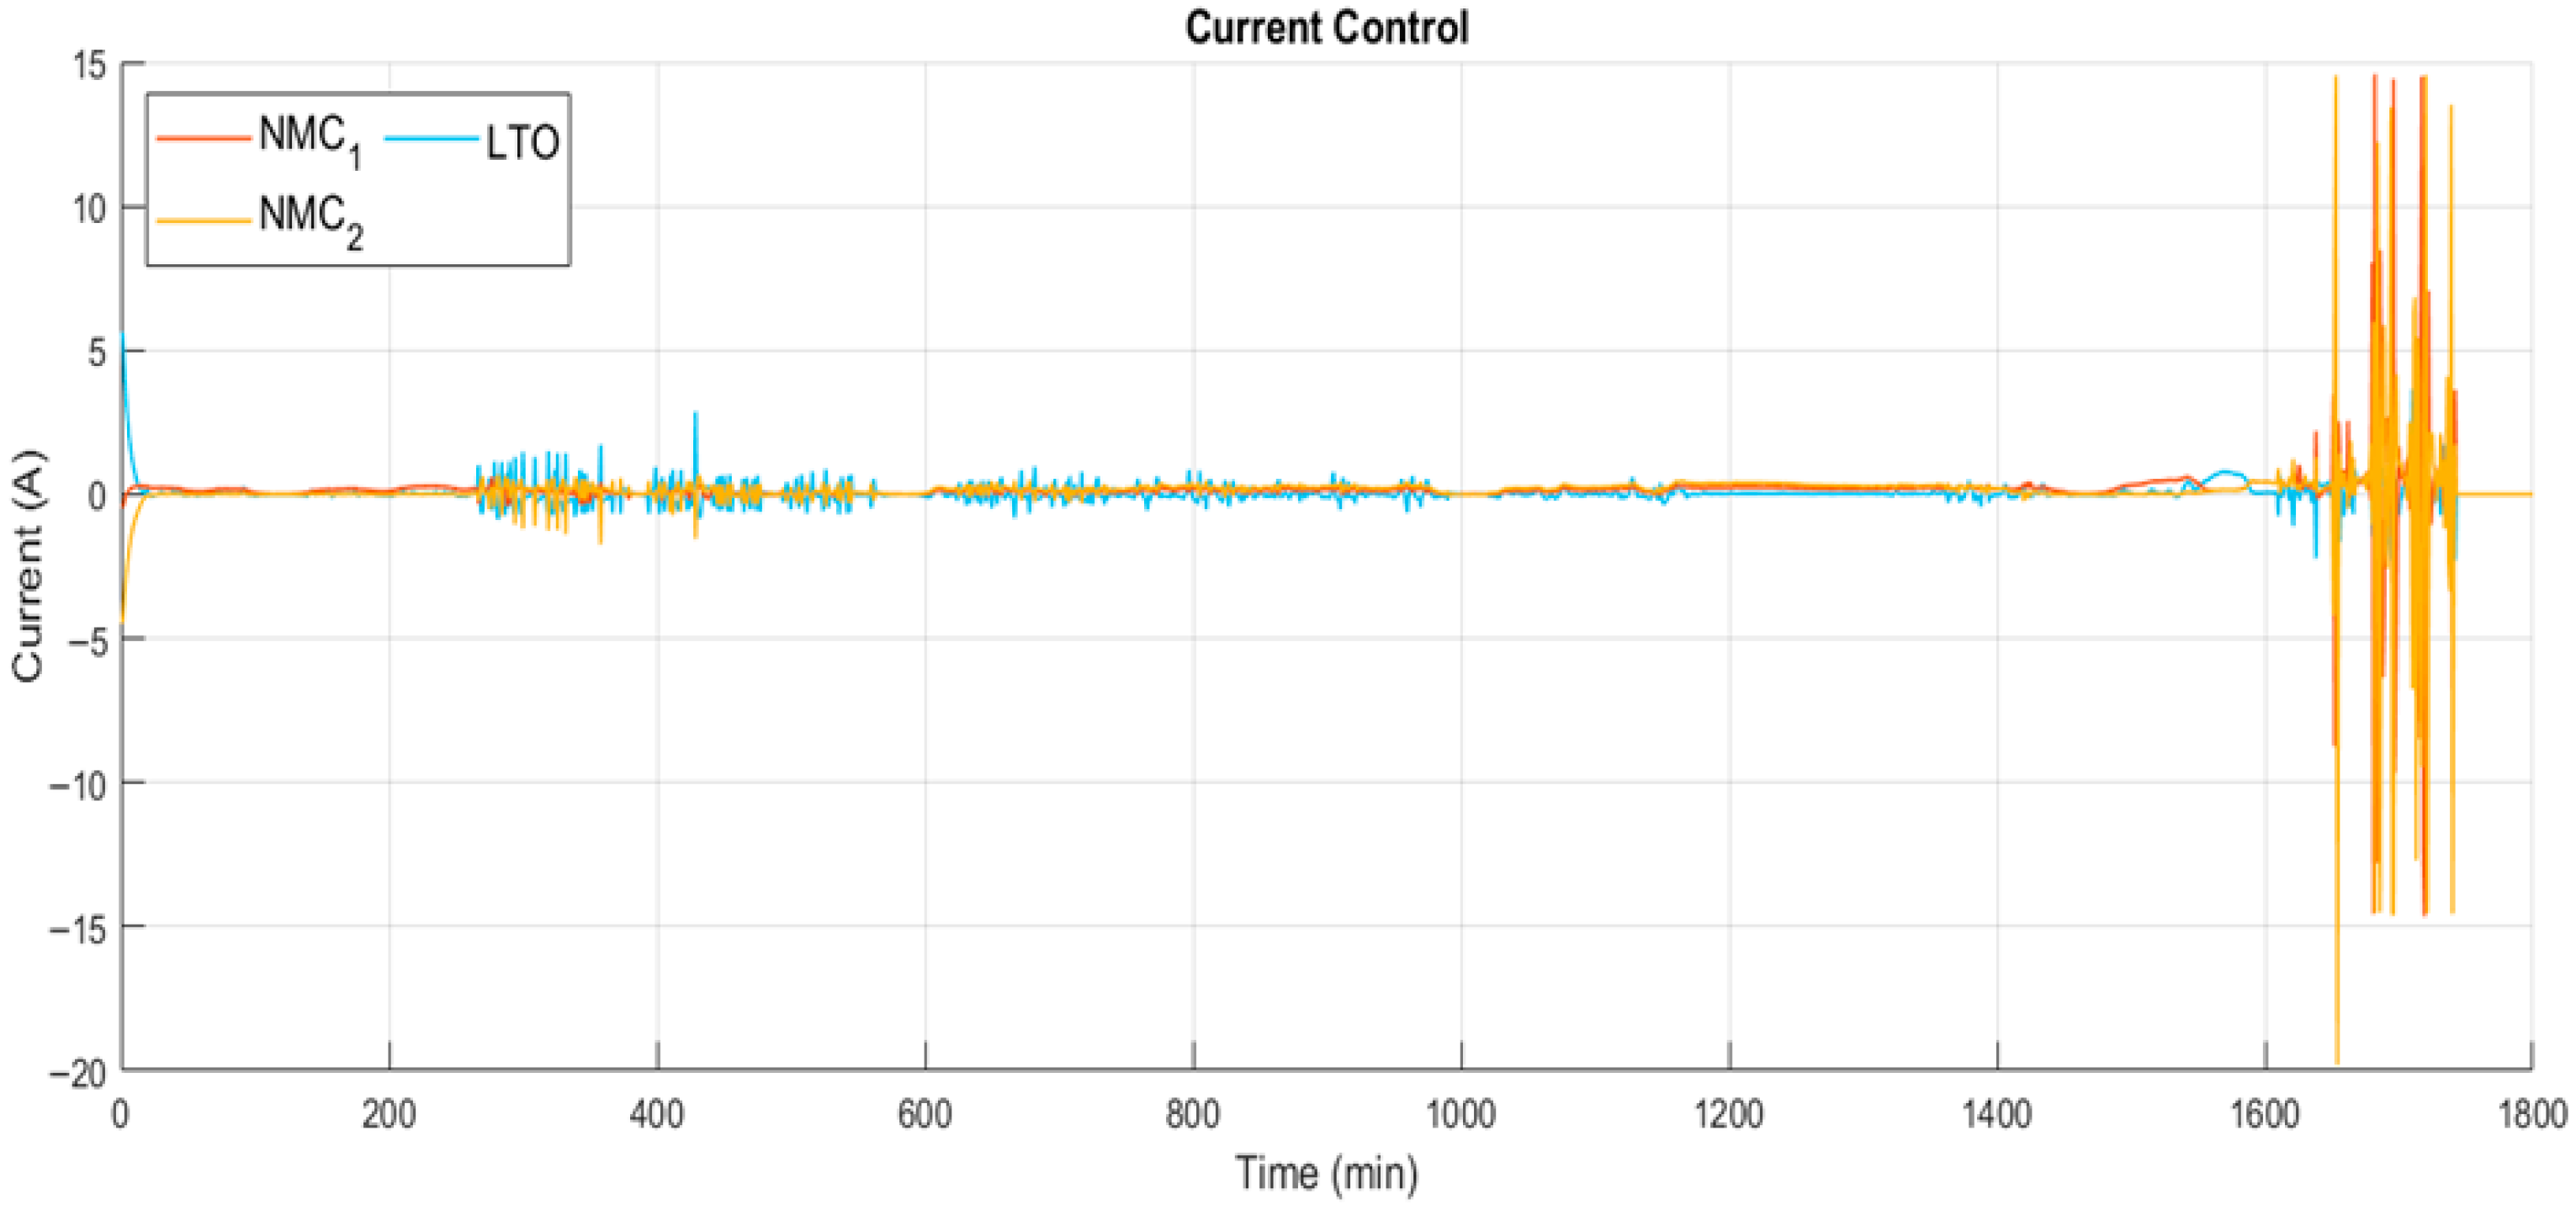
The current profile, shown in
Figure 25, has the same dynamics as the power profile shown in
Figure 23.
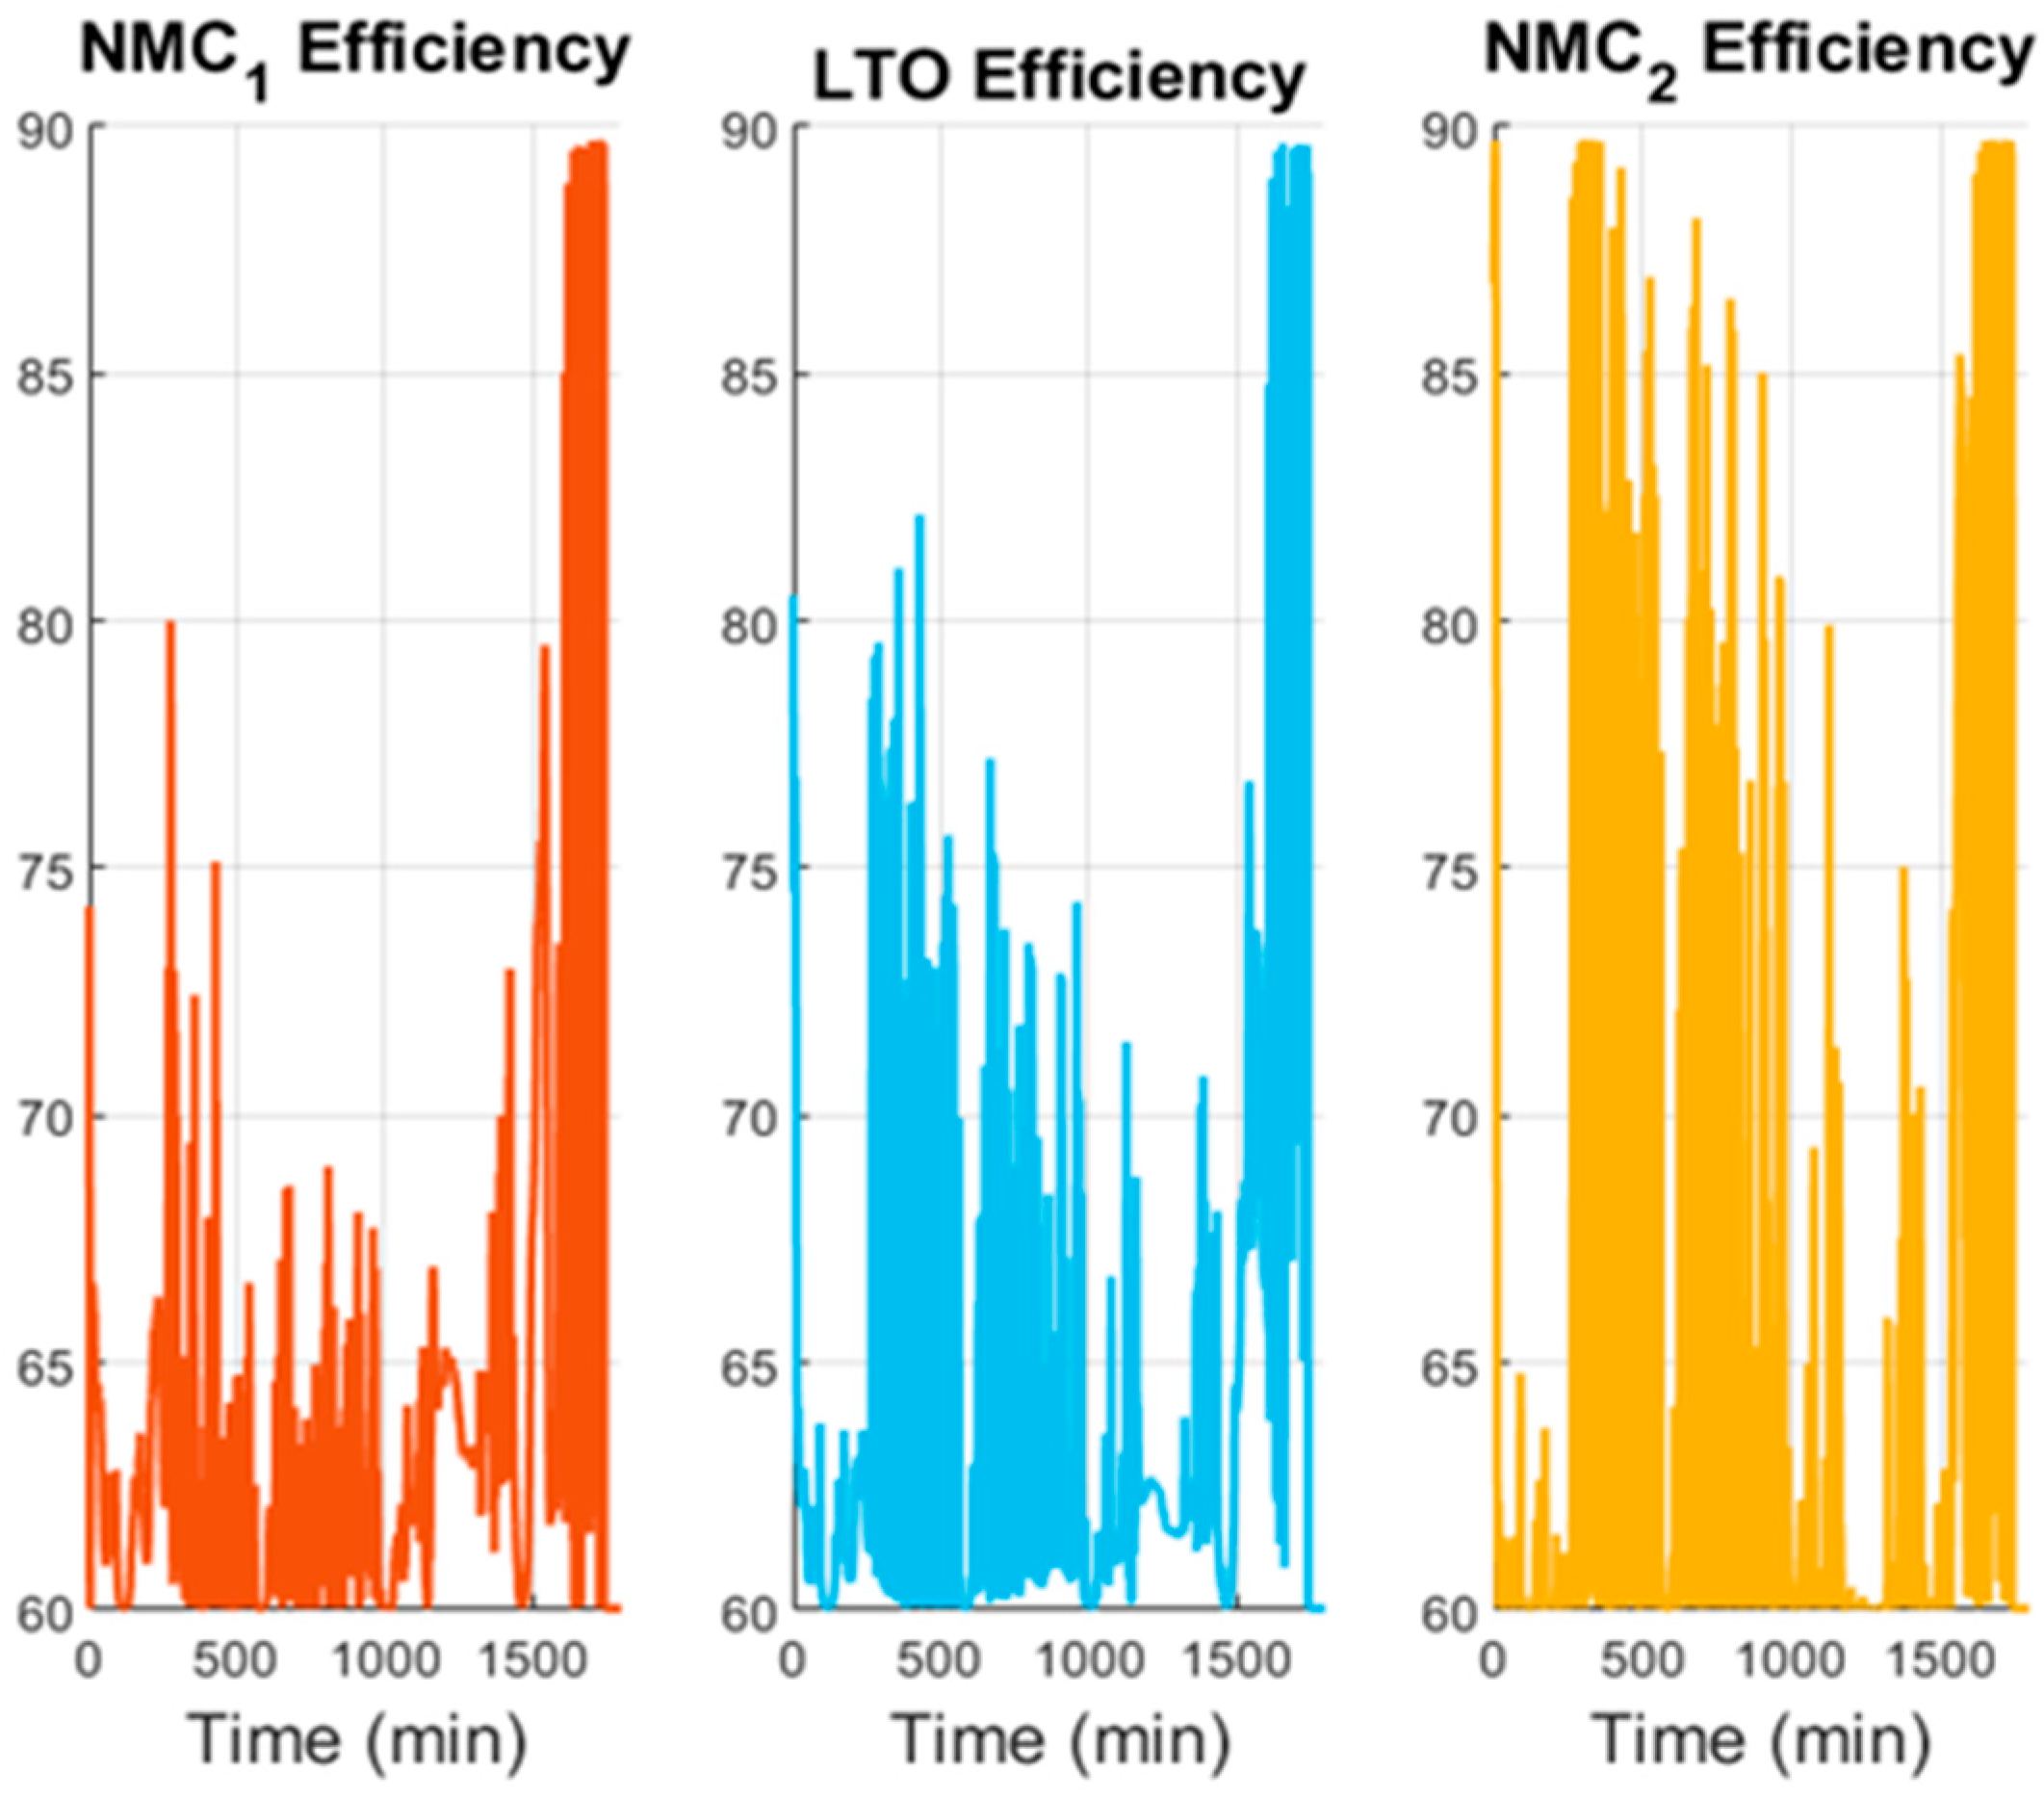
Finally, the efficiency of the batteries is shown in
Figure 26. As expected, the LTO module exhibits greater variability, consistent with its role as the main buffer for transient loads, while the NMC modules generally operate more smoothly. The NMC 2 seems to be the battery with the highest efficiency.
7. Discussion
The results confirm the hypothesis that combining two NMC batteries with one LTO battery under an MPC control framework can significantly enhance the efficiency, flexibility, and reliability of HESSs. In both case studies, the control strategy ensured that the power demand was satisfied while respecting the operational limits of the SOC and current. This demonstrates that the system design can be adapted to distinct applications, from renewable energy integration to electric mobility.
In the renewable energy case, the results showed that the LTO acted as the main provider of variable power, compensating for peaks in household demand, while the NMC modules supplied energy more smoothly. This division of roles aligns with the working hypothesis: LTO is well suited for transient loads due to its fast charge/discharge capability, while NMC performs better under steady conditions, thereby reducing its degradation rate. Importantly, the strategy prevented unsafe SOC levels, in contrast to the uncontrolled scenario where the LTO module was discharged beyond acceptable limits. These results are consistent with previous findings that hybrid storage enhances stability and lifetime compared to single-chemistry approaches.
The efficiency results highlight a critical trade-off. When efficiency was not prioritized, the average efficiency of all modules remained below 70%. Increasing the efficiency weight in the optimization improved mean values to above 80% but introduced higher current fluctuations. This suggests that system operators can tailor the MPC to prioritize either battery lifetime or converter efficiency depending on the application. Such flexibility reinforces the value of MPC in hybrid systems, as also suggested in recent studies. However, the observed current oscillations also indicate potential implications for battery aging, which must be considered in future work.
In the electric vehicle case, the system successfully handled the WLTP demand cycle, with the LTO absorbing transient peaks and the NMCs maintaining smoother power delivery. This confirms that the same control framework can be extended to highly dynamic scenarios. Nevertheless, by the end of the cycle, the batteries approached deep discharge, showing the importance of initial SOC levels and system sizing. These results underline that, while the control strategy ensures safe operation, long-range driving applications may still require scaling the system or introducing additional storage components.
Overall, the findings place this work in line with previous research while extending it in several ways: (i) the explicit consideration of converter efficiency in the control formulation, (ii) the use of a multi-battery architecture instead of the more common battery–supercapacitor pairing, and (iii) validation across two very different but realistic scenarios. The flexibility of the strategy demonstrates that MPC can adapt priorities between efficiency, safety, and performance, depending on the needs of the application.
Future research should extend the present work in several directions, such as incorporating aging and thermal models into the optimization to better predict lifetime effects; validating the approach in real-time embedded platforms; and scaling the system to higher power levels, including different combinations of chemistries. Such studies would consolidate the practical feasibility of hybrid Li-ion storage managed by converter-aware MPC.
8. Conclusions
This study analyzed the behavior of a hybrid storage system composed of different Li-ion battery chemistries, two NMC batteries and one LTO, interconnected through a multi-port converter configured as a triple-active bridge and managed by a Model Predictive Control strategy. The Equivalent Circuit Models developed for the batteries provided a realistic representation of their behavior and ensured accurate simulation of their operational characteristics.
The scenarios selected for analysis were designed to reflect real-life applications, thereby validating the system under conditions representative of typical storage system use. The results demonstrate that the proposed system successfully achieved its main objectives, delivering higher flexibility and improved efficiency compared to uncontrolled operation. In particular, the MPC strategy enabled the system to satisfy power demand while respecting SOC and efficiency constraints across all simulations. By coordinating the complementary strengths of each battery chemistry, the controller also contributed to reducing stress on the NMC batteries during dynamic operating conditions, thereby extending their lifetime. The comparison with the uncontrolled case highlighted the essential role of MPC; it enabled the same demand to be met with fewer cells while making better use of the complementary advantages of each chemistry. As expected, the strategy also contributed to extending the lifetime of the NMC batteries by reducing stress during dynamic operating conditions.
Beyond demonstrating improved performance, this work introduces several key contributions that distinguish it from prior studies. First, the MPC strategy was verified in diverse application contexts, including residential renewable energy systems and electric vehicles, highlighting its practical applicability. Second, the study explicitly incorporates the power converter into the system model, a critical component often neglected in battery-focused control studies. Finally, the efficiency of the converter was considered directly in the cost function, allowing the controller to optimize overall system performance by balancing energy losses with battery stress and operational constraints.
Future research should focus on extending these results to other types of systems with different power demand profiles, implementing the control strategy in real time on experimental platforms and exploring hybrid systems incorporating three or more different battery chemistries. These steps will further validate the scalability and robustness of the proposed approach for practical energy storage systems.
The main contributions of this work can be summarized as follows:
A nonlinear Model Predictive Control (MPC) strategy was developed for hybrid energy storage systems (HESSs), explicitly incorporating nonlinearities of the system dynamics.
Unlike most existing studies, the converter model was included in the control formulation, allowing for a realistic representation of power flow constraints and losses.
Converter efficiency was considered as an explicit optimization objective, enabling the controller to balance trade-offs between energy efficiency and battery stress.
Equivalent Circuit Models (ECMs) were used for both chemistries, ensuring accurate SOC estimation and realistic battery behavior in the simulations.
The proposed control strategy was validated in two representative real-world scenarios, a residential renewable energy system and an electric vehicle application, demonstrating flexibility and robustness across diverse conditions.
A quantitative comparison with the uncontrolled case highlighted the benefits of the MPC strategy, including extended lifetime of NMC cells, improved efficiency, and reliable power delivery.

