1. Introduction
Driven by the “dual carbon” strategy, new energy vehicles, including electric vehicles and fuel cell vehicles, have developed rapidly [
1,
2,
3]. Consequently, the number of electric vehicle charging piles has grown rapidly, and their metering accuracy directly affects user charging fee calculation and grid load forecasting. Since 2023, China has included charging piles in the mandatory verification scope. However, due to cost and technical limitations, in practice, high-precision metering standards are usually only configured on some charging piles, making it difficult to accurately estimate the metering errors of a large number of non-standard piles, which has become a key bottleneck restricting the improvement of charging-pile metering supervision efficiency.
Regarding the problem of charging-pile metering error analysis, existing research mainly proceeds from two directions: hardware modification and data-driven approaches. Remote verification methods based on hardware modification directly obtain high-precision measurement data by installing high-precision metering standards in charging piles, providing reliable true value reference for error analysis [
4,
5,
6,
7,
8]. Although these methods have high precision, they are difficult to promote on a large scale due to equipment cost and deployment difficulties. Data-driven verification methods establish error models for error estimation by analyzing historical data reported by charging piles, avoiding the cost of hardware modification [
9,
10,
11]. Among them, machine learning and deep learning methods can mine complex nonlinear error patterns from historical data, providing new ideas for error analysis [
12,
13]. However, these methods typically require per-pile labeled data (i.e., true error values obtained from standard devices for each charging pile) in large quantities for model training [
14], which in practice demands deploying standard devices on most or all piles—an equally costly proposition. At the same time, the interpretability of “black box” models is insufficient, making it difficult to reveal the physical causes and transmission mechanisms of errors. The method proposed in this paper does not eliminate the dependence on such high-quality labels; standard device data remain essential as reference values. The key contribution is that, by exploiting inter-pile data association through vehicle cross-charging records, the required number of standard-equipped (i.e., labeled) piles is reduced from full coverage to approximately 10%, converting a large-volume labeling requirement into a small-volume one while preserving estimation accuracy.
However, existing methods still have some shortcomings in complex application environments. First, in scenarios with limited standard device configuration, non-standard piles lack high-precision reference data, and the true values of their metering errors are difficult to obtain directly [
15]. Second, existing methods mostly adopt single-pile independent analysis strategies [
11,
16], using only the historical data of a single charging pile for error estimation, ignoring the potential correlation between piles. In practical applications, the same vehicle often charges at multiple charging piles, and its cross-pile charging records can establish inter-pile data correlation, but existing methods fail to effectively utilize this information for error cross-validation. In addition, with single-pile analysis, it is difficult to identify systematic errors, and it cannot achieve multi-pile collaborative error estimation and correction. Finally, charging-pile metering errors are affected by multiple factors such as hardware aging, environmental interference, and improper operation [
17,
18,
19]. In practice, the dominant component is a systematic bias caused by hardware drift and manufacturing defects, while operating condition-dependent variations (e.g., due to charging power and ambient temperature) are generally smaller in magnitude and behave as stochastic perturbations. Existing methods mostly use fixed thresholds to determine anomalies but cannot distinguish between systematic deviations and random noise, which is prone to misjudgment or missed detection.
To address the above shortcomings, this paper proposes a dynamic estimation method for charging-pile metering errors based on limited standard metering terminals. For the true value anchoring problem, this method uses a small amount of standard device data as “anchor points” to spread high-precision true value information to non-standard piles through an error transmission network. For the collaborative estimation problem, it uses charging records of the same vehicle at different charging piles to establish inter-pile data correlation [
20], and uses the Alternating Least Squares (ALS) algorithm to simultaneously estimate error parameters of each charging pile and the actual charging energy of vehicles. For the anomaly identification problem, it constructs dynamic threshold determination rules based on joint estimation results, effectively distinguishing systematic deviations from random noise in combination with the confidence interval of error estimation. This method provides technical support for achieving high-precision error estimation and accurate anomaly identification of wide-area charging piles under limited standard device configuration.
2. Method Overview and Error Source Analysis
2.1. Operating Condition-Dependent Variations
The generation of charging-pile metering errors is the result of the combined effect of multiple factors, mainly from the following three aspects:
Hardware Aging and Drift. During long-term operation of charging piles, key metering components such as energy meters and current transformers are susceptible to performance degradation and parameter drift due to environmental factors such as temperature, humidity, and electromagnetic interference, resulting in decreased metering accuracy [
21]. Especially for outdoor charging piles, their metering devices are exposed to harsh environments for a long time, and the aging speed is faster.
Operating Condition-Dependent Variations. The metering characteristics of charging piles differ under different charging powers, different SOC intervals, and different ambient temperatures. For example, during low-power charging, the energy meter may produce a large relative error due to an excessively low load rate; under extreme temperature conditions, the temperature coefficient effect of the metering device will cause measurement deviation. However, these condition-dependent variations are generally smaller in magnitude than the systematic bias caused by hardware aging, and tend to cancel out over multiple charging sessions. Therefore, in the proposed model (
Section 3.1), they are treated as stochastic perturbations absorbed into the noise term rather than as a separate error parameter.
Systematic Manufacturing Defects. Charging piles of the same batch and manufacturer may have common hardware design defects or software algorithm problems, causing this batch of charging piles to show systematic metering deviations. This type of error has spatial clustering characteristics and is difficult to identify through single-pile independent analysis.
The complexity and diversity of the above error sources make it difficult for traditional single-pile independent verification methods to comprehensively and accurately evaluate charging-pile metering performance. Therefore, it is necessary to construct a multi-pile collaborative error joint estimation method, using vehicle cross-pile charging data to establish an error transmission network to achieve comprehensive identification and correction of various errors.
2.2. Overall Framework of Joint Metering Error Estimation Method
The basic principle of this method is: utilizing the characteristic that the same vehicle charges sequentially at multiple charging piles, collecting multiple charging curve data, using a small number of standard metering terminals as “true value anchor points”, and using joint estimation algorithms to back-calculate the metering errors of each charging pile, thereby achieving networked collaborative verification of “using vehicles as media and using standards to calibrate piles”.
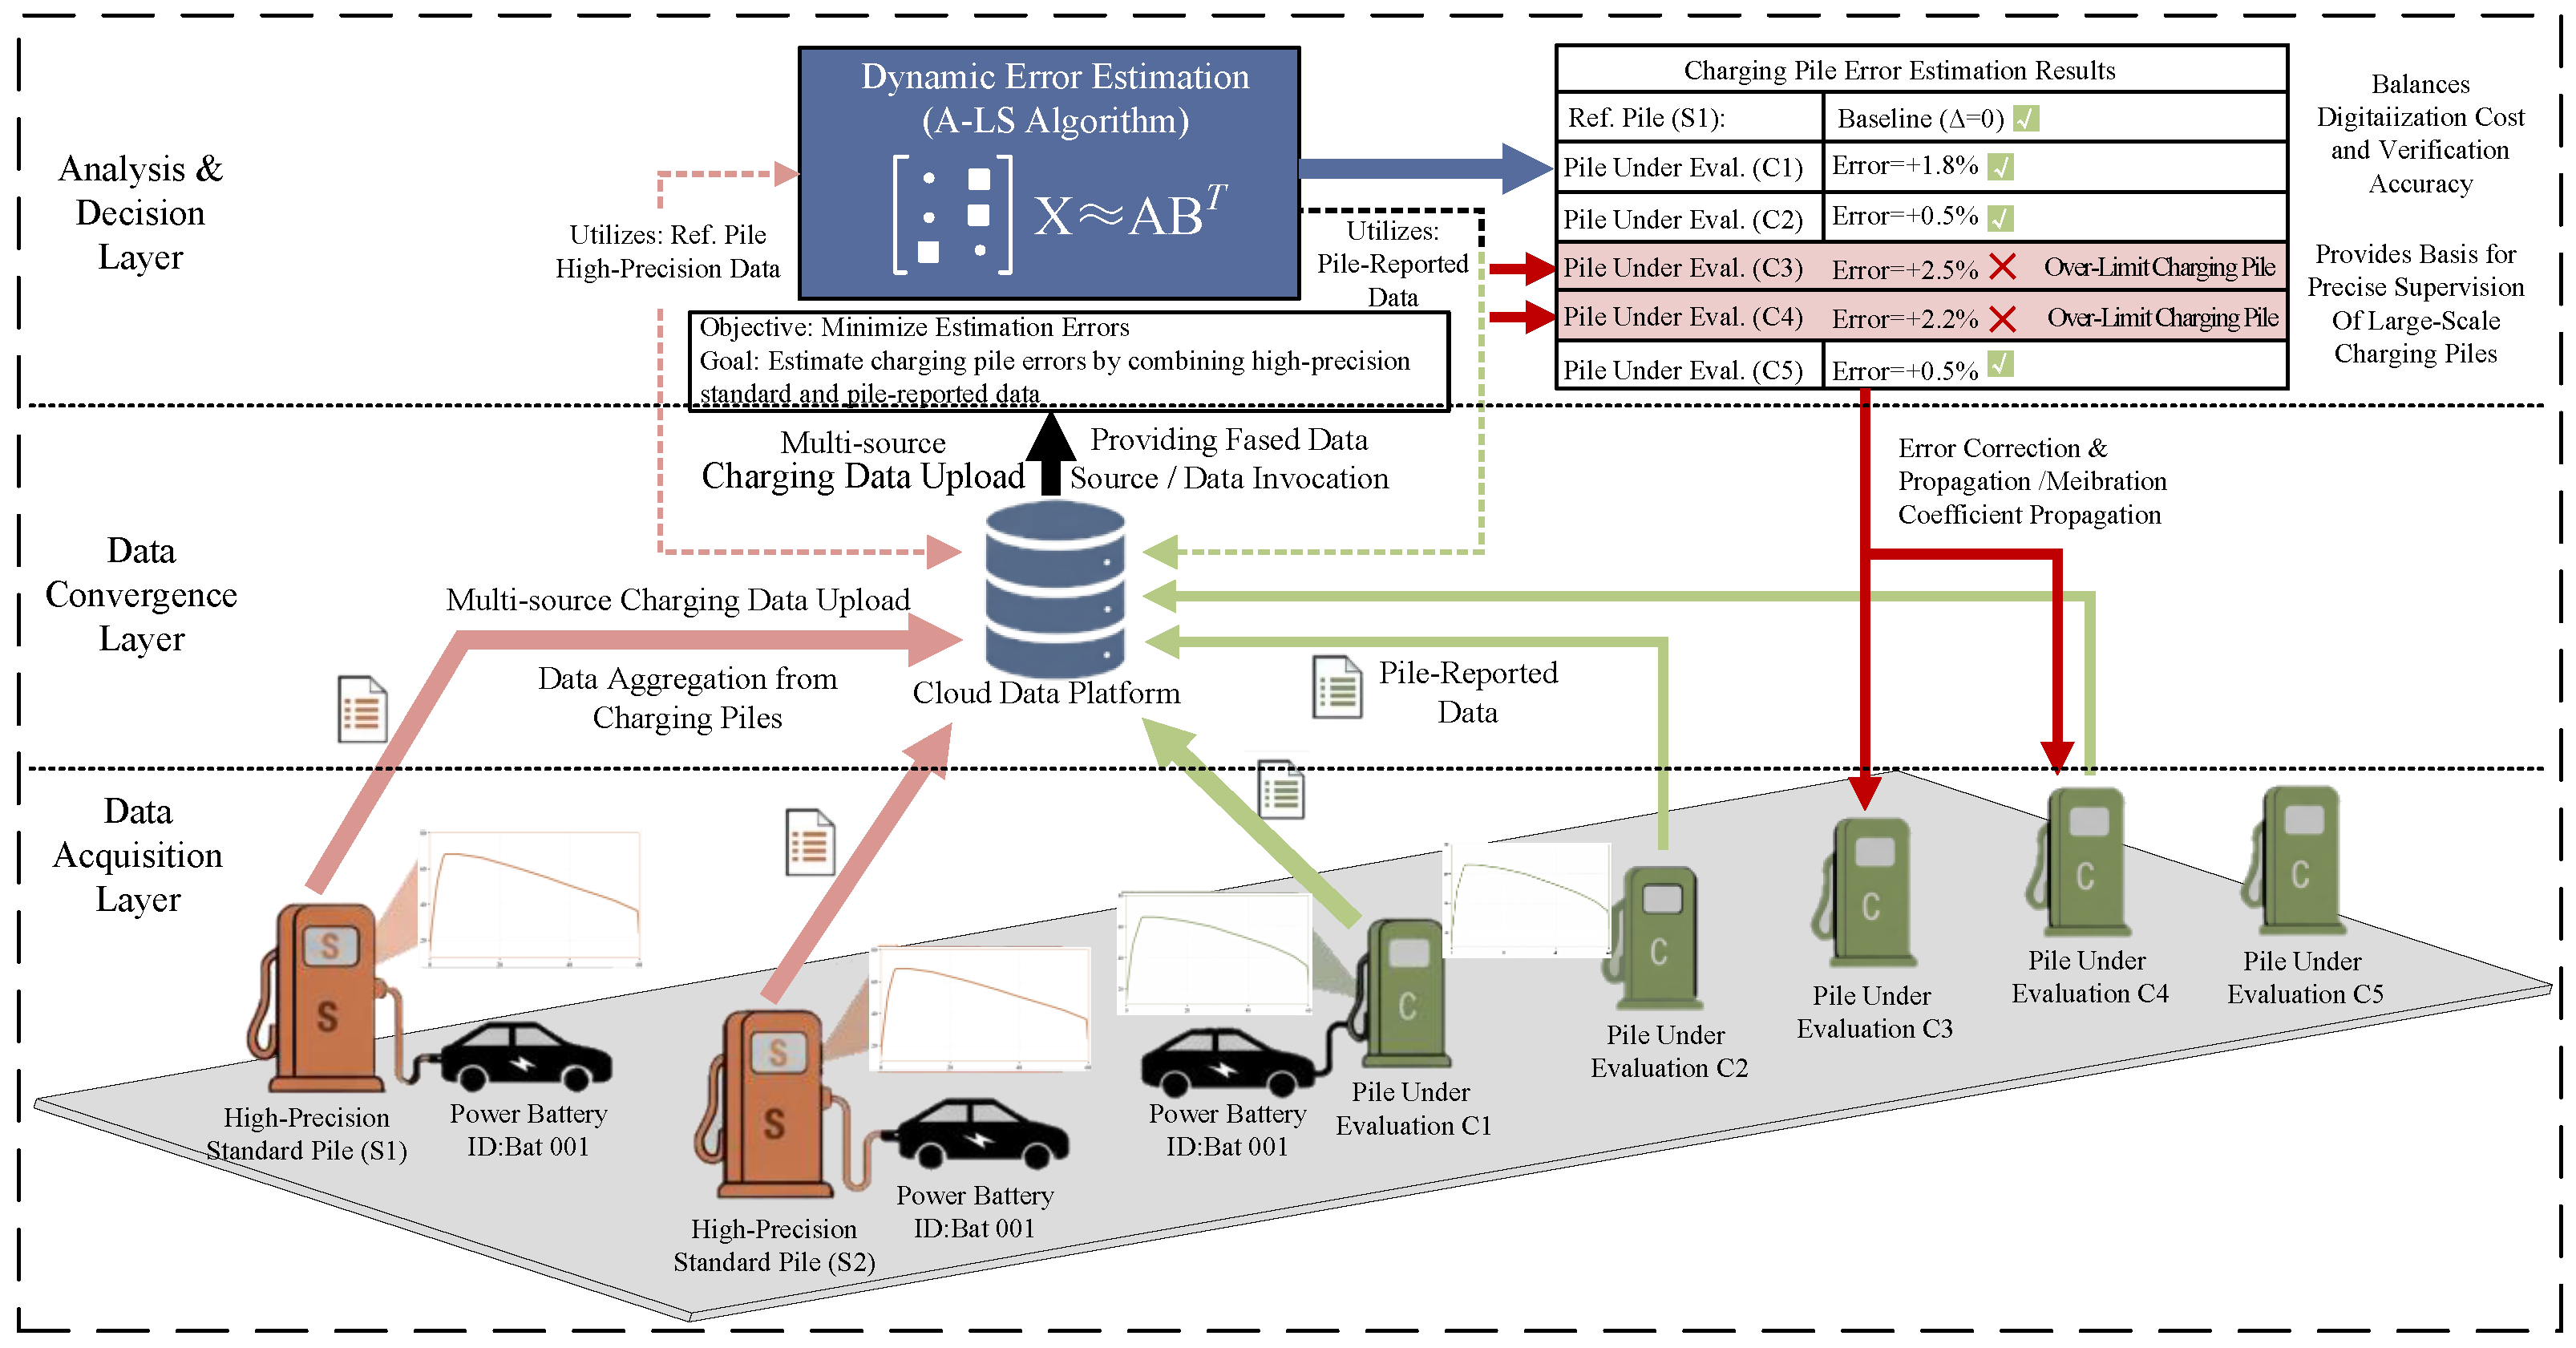
To achieve efficient and accurate verification of massive charging piles under limited verification resource conditions, this paper constructs an overall framework of joint metering error estimation method. As shown in
Figure 1, this framework mainly includes four core components:
Data Sources: The data required by this method includes three types—pile-side metering data (metering energy reported by each charging pile, charging time, pile number, vehicle identification, etc.), standard device metering data (high-precision metering energy collected by charging piles equipped with a small number of metering standards), and vehicle correlation data (charging records of the same vehicle at different charging piles, used to establish inter-pile error transmission relationships).
Joint Estimation and Error Analysis: Fusing high-precision data from standard devices with data reported by piles, using the Alternating Least Squares (ALS) algorithm to simultaneously estimate error parameters of each charging pile and the actual charging energy of vehicles.
Anomaly Identification and On-site Verification: Based on error estimation results, combined with industry standard thresholds to determine metering abnormal piles, output abnormal pile lists and guide precise on-site verification.
Output Results: Output charging-pile error parameters, standard device error parameters, actual energy, and abnormal pile identification results.
Figure 1.
Architecture and workflow of the proposed joint metering error estimation method.
Figure 1.
Architecture and workflow of the proposed joint metering error estimation method.
The core advantage of this method is: through the strategic deployment of a small number of standard devices, using vehicle cross-pile charging data to establish an error transmission network, shifting from “point-to-point detection” to “networked collaborative estimation”, providing technical support for efficient metering supervision of wide-area charging piles.
3. Joint Estimation Method for Charging-Pile Metering Errors Based on Standard Device Data
3.1. System Modeling and Basic Assumptions
To achieve multi-pile collaborative metering error estimation, a charging network model containing N charging piles and M electric vehicles is constructed, where K charging piles () are randomly configured with metering standards. The model is established based on the following basic assumptions:
The precision grade of the metering standard is at least one grade higher than the meter of the charging pile being calibrated, i.e., , and the absolute value of standard device error is usually less than 0.1%;
The metering error of each charging pile is modeled as a time-invariant systematic bias that captures the dominant error component caused by hardware aging and manufacturing defects. Operating condition-dependent error variations (e.g., due to charging power, SOC interval, and ambient temperature changes) are treated as stochastic perturbations absorbed into the noise term ;
The metering noise is modeled as Gaussian noise, with pile-side noise , standard device noise , and satisfying .
The above assumptions involve certain simplifications. The Gaussian noise assumption may not fully hold in complex outdoor electromagnetic environments where impulsive interference or heavy-tailed noise can occur, potentially leading to biased estimates under the least-squares framework. In practice, the L2 regularization and multi-vehicle data redundancy provide moderate robustness against such deviations, though pre-filtering of outlier charging records is recommended under severely non-Gaussian conditions. Additionally, if the standard device undergoes intrinsic drift due to aging or calibration degradation, biased reference values may propagate through the error transmission network. Periodic re-calibration of standard devices and monitoring of the estimated values can mitigate this risk. The time-invariant assumption for means that the method captures the average systematic error over the observation period; for charging piles with rapid error drift, a sliding-window approach with shortened statistical windows is advisable.
To improve estimation accuracy, define the key vehicle set : containing all vehicles that have charging records at the k-th standard device charging pile. In subsequent calculations, only the cross-pile charging data of vehicles in is used to establish the “standard device-non-standard” error transmission link to solve the problem of non-standard piles lacking true value reference.
3.2. Measurement Equations and Objective Function
3.2.1. Measurement Equations
The core of the model establishes data correlation through two types of measurement equations, achieving the mapping relationship of “standard device high-precision data - pile-side reported data - actual energy”:
(1) Pile-side Measurement Equation
Describes the metering relationship when any vehicle charges at a charging pile not equipped with a standard device:
where
is the metering energy (kWh) of the
i-th charging pile not equipped with a standard device for the
j-th vehicle;
is the actual charging energy (kWh) of the
j-th vehicle, which is to be estimated;
is the relative error (%) of the
i-th charging pile not equipped with a standard device; and
is the pile-side metering noise.
(2) Standard Device Measurement Equation
Only applicable to charging piles equipped with standard devices, we utilize their high-precision characteristics to provide “anchoring data” for actual energy:
where
is the metering energy (kWh) of the
k-th charging pile equipped with a standard device;
is the relative error (%) of the
k-th standard device, which is to be estimated; and
is the standard device metering noise, satisfying
.
3.2.2. Objective Function Design
The objective function takes “minimizing the deviation between measured values and estimated values” as its core, while preventing overfitting through regularization constraints. The objective function consists of a data fitting term and regularization terms:
(1) Data Fitting Term
Combines the measurement data from pile-side and standard devices:
where
is the index set of charging piles equipped with standard devices;
is the set of vehicles charging at the
i-th non-standard pile; and
,
are the weights for pile-side and standard device measurement data respectively.
The pile-side weight is set uniformly as for all non-standard piles. Since standard devices have higher precision, the standard device weight is set as , where the ratio reflects the inverse variance weighting between the two data sources.
(2) Regularization Terms
Charging-pile error regularization:
Standard device error regularization:
Note: For small metering errors (), . Since the constant and linear terms do not affect the optimization, these regularization terms are effectively equivalent to penalizing and respectively.
Actual energy regularization:
where
is the theoretical charging energy of the
j-th vehicle, computed from BMS-reported SOC and battery capacity as:
is the nominal battery capacity (kWh) of the j-th vehicle, and , are the BMS-reported states of charge at the start and end of the charging session.
Although is not a ground-truth value due to BMS SOC estimation errors (typically 3–5%) and battery capacity degradation over the vehicle’s lifetime, the regularization term is retained primarily for identifiability reasons. Without any prior on , the joint estimation problem is underdetermined, as scaling up while scaling down yields identical residuals. The term breaks this scale ambiguity by anchoring to an approximate physical reference. The weight is set small relative to the data fitting coefficients (approximately 1.0 per observation) so that with a typical vehicle having 5–10 charging records, contributes less than 1% to the final estimate when sufficient data is available. Since appears only in and not in the measurement equations, even a 20% capacity degradation shifts by at most 20%, translating to less than 0.2% influence on the final estimate.
3.3. ALS Joint Estimation Algorithm
Since the objective function contains three types of variables
,
,
T, the Alternating Least Squares (ALS) strategy [
22] is adopted to update parameters in alternating steps. When any two sets of variables are fixed, the sub-problem with respect to the remaining variable is a regularized weighted least squares problem, whose objective function is quadratic with a positive semi-definite Hessian matrix, and therefore strictly convex. Specifically: (i) fixing
and
, the sub-problem for each
is a scalar quadratic minimization; (ii) fixing
T and
, the sub-problem for each
is likewise a scalar quadratic minimization; (iii) fixing
T and
, the sub-problem for each
is analogous. Each sub-problem thus admits a unique closed-form solution as derived in
Section 3.3.1,
Section 3.3.2 and
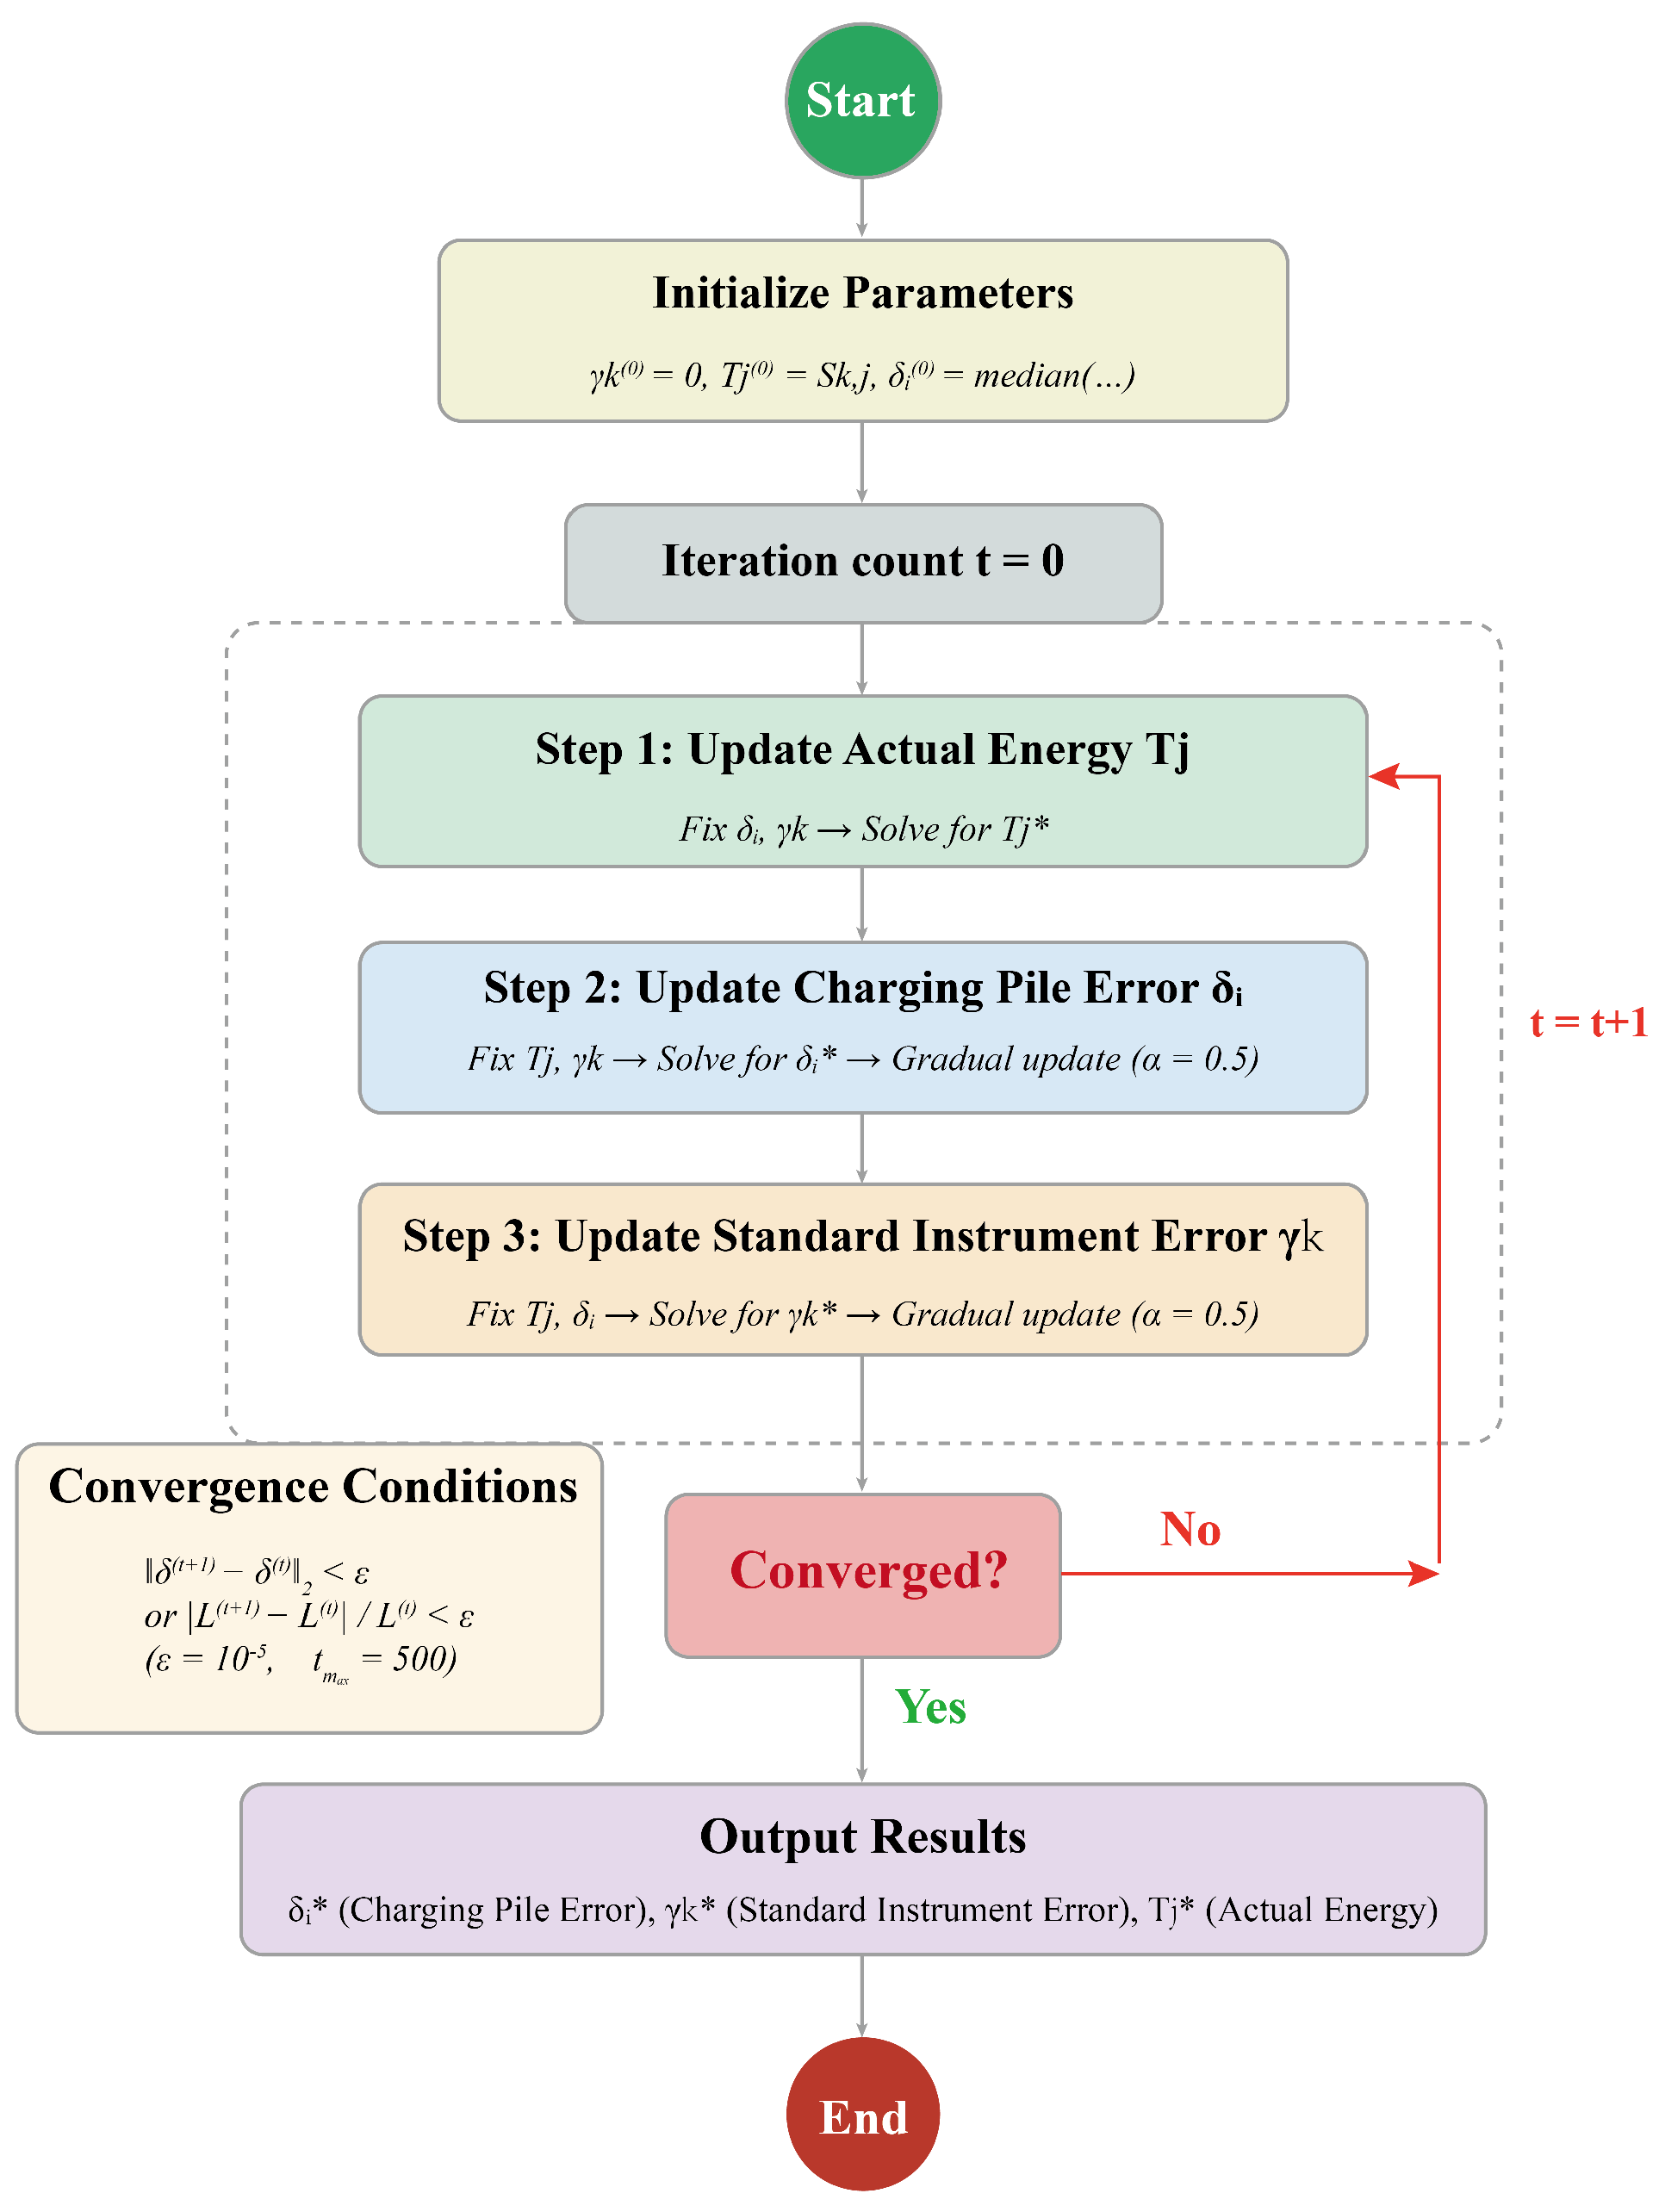
Section 3.3.3. The overall algorithm flow is shown in
Figure 2.
3.3.1. Actual Energy Update
For fixed
and
, the objective function terms involving
are
Taking the derivative with respect to
and setting it to zero gives the normal equation, which yields the closed-form solution below:
Note that all weights
,
are dimensionless (see
Section 3.3.2), and all error parameters
,
are dimensionless relative errors, so every term in both the numerator (units: kWh) and the denominator (dimensionless) is dimensionally consistent.
3.3.2. Charging Pile Error Update
Fixing
and
,the sub-problem for
involves minimizing the following terms from the objective function:
where the regularization penalizes the magnitude of the multiplicative factor
, which is equivalent to penalizing
for small
. Taking the derivative with respect to
and setting it to zero,
Solving for
and subtracting 1 yields the closed-form update:
To avoid oscillation, a learning rate
is introduced for damped updating:
The choice of affects the convergence behavior: when , the update reduces to the standard undamped ALS step, which may cause oscillation between coupled variables and T; when , convergence becomes overly conservative. In practice, provides a suitable trade-off between convergence speed and stability, and is adopted in this study based on empirical tuning. Since the overall objective function is non-convex due to the bilinear coupling between (or ) and , the damped ALS algorithm converges to a stationary point rather than necessarily a global optimum. The L2 regularization terms smooth the objective landscape, and the standard device anchor data constrains the solution space, making the algorithm robust to initialization in practice.
3.3.3. Standard Device Error Update
Fixing
and
, the update formula for
is
3.3.4. Convergence Determination
A dual determination method is adopted:
Maximum relative parameter change: , where denotes the Euclidean norm and ; Objective function value: ; Maximum iterations: .
3.4. Abnormal Pile Identification and Evaluation Indicators
3.4.1. Abnormal Pile Identification Rules
Based on the error estimation result , combined with the industry Class 2 m standard (error absolute value ), construct abnormal pile identification rules:
Core determination criterion: If , determine that the charging pile is a “metering abnormal pile”;
Auxiliary determination criterion: If , but the relative error of a single charging event , and the proportion of such abnormal records exceeds 10% of all charging records at that pile, it is also determined as a “metering abnormal pile”. The relative-error-based formulation makes this criterion applicable across different vehicle types regardless of battery capacity.
3.4.2. Evaluation Indicators
(1) Error Estimation Accuracy Evaluation
The Root Mean Square Error (
) is used as the evaluation criterion:
(2) Anomaly Identification
Evaluation
where
is the number of piles that are truly abnormal and correctly identified,
is the number of piles that are truly normal and correctly identified,
is the number of piles misjudged as abnormal, and
is the number of piles missed as normal.
(3) Missed Detection Rate (
)
(4) False Detection Rate (
)
(5)
,
, and
-score
(6)
The Area Under the Receiver Operating Characteristic curve () is computed by varying the error threshold from 0% to 5% and plotting the True Positive Rate () against the False Positive Rate () at each threshold.
(7) Workload Reduction Ratio (
)
4. Case Setup and Parameter Configuration
4.1. Simulation Data Description
To verify the effectiveness of the proposed method, a charging event data generation model based on trip chains is used to generate charging event data. This model simulates vehicle trip chains, route selection, SOC changes, and charging decisions through Monte Carlo methods, generating charging demand distributions that conform to actual characteristics. The main parameter characteristics of the simulation data are as follows:
User SOC preferences follow a normal distribution, with a minimum SOC mean of 20% and a standard deviation of 5%;
Charging station selection is based on the Huff model, comprehensively considering distance, price, and scale factors;
Vehicle charging energy is calculated from the SOC change interval and battery capacity, serving as the actual energy reference value.
The simulation area is set as a typical urban area, including three types of functional areas: residential, work, and commercial areas. The proportions and parameters of various vehicle types are shown in
Table 1.
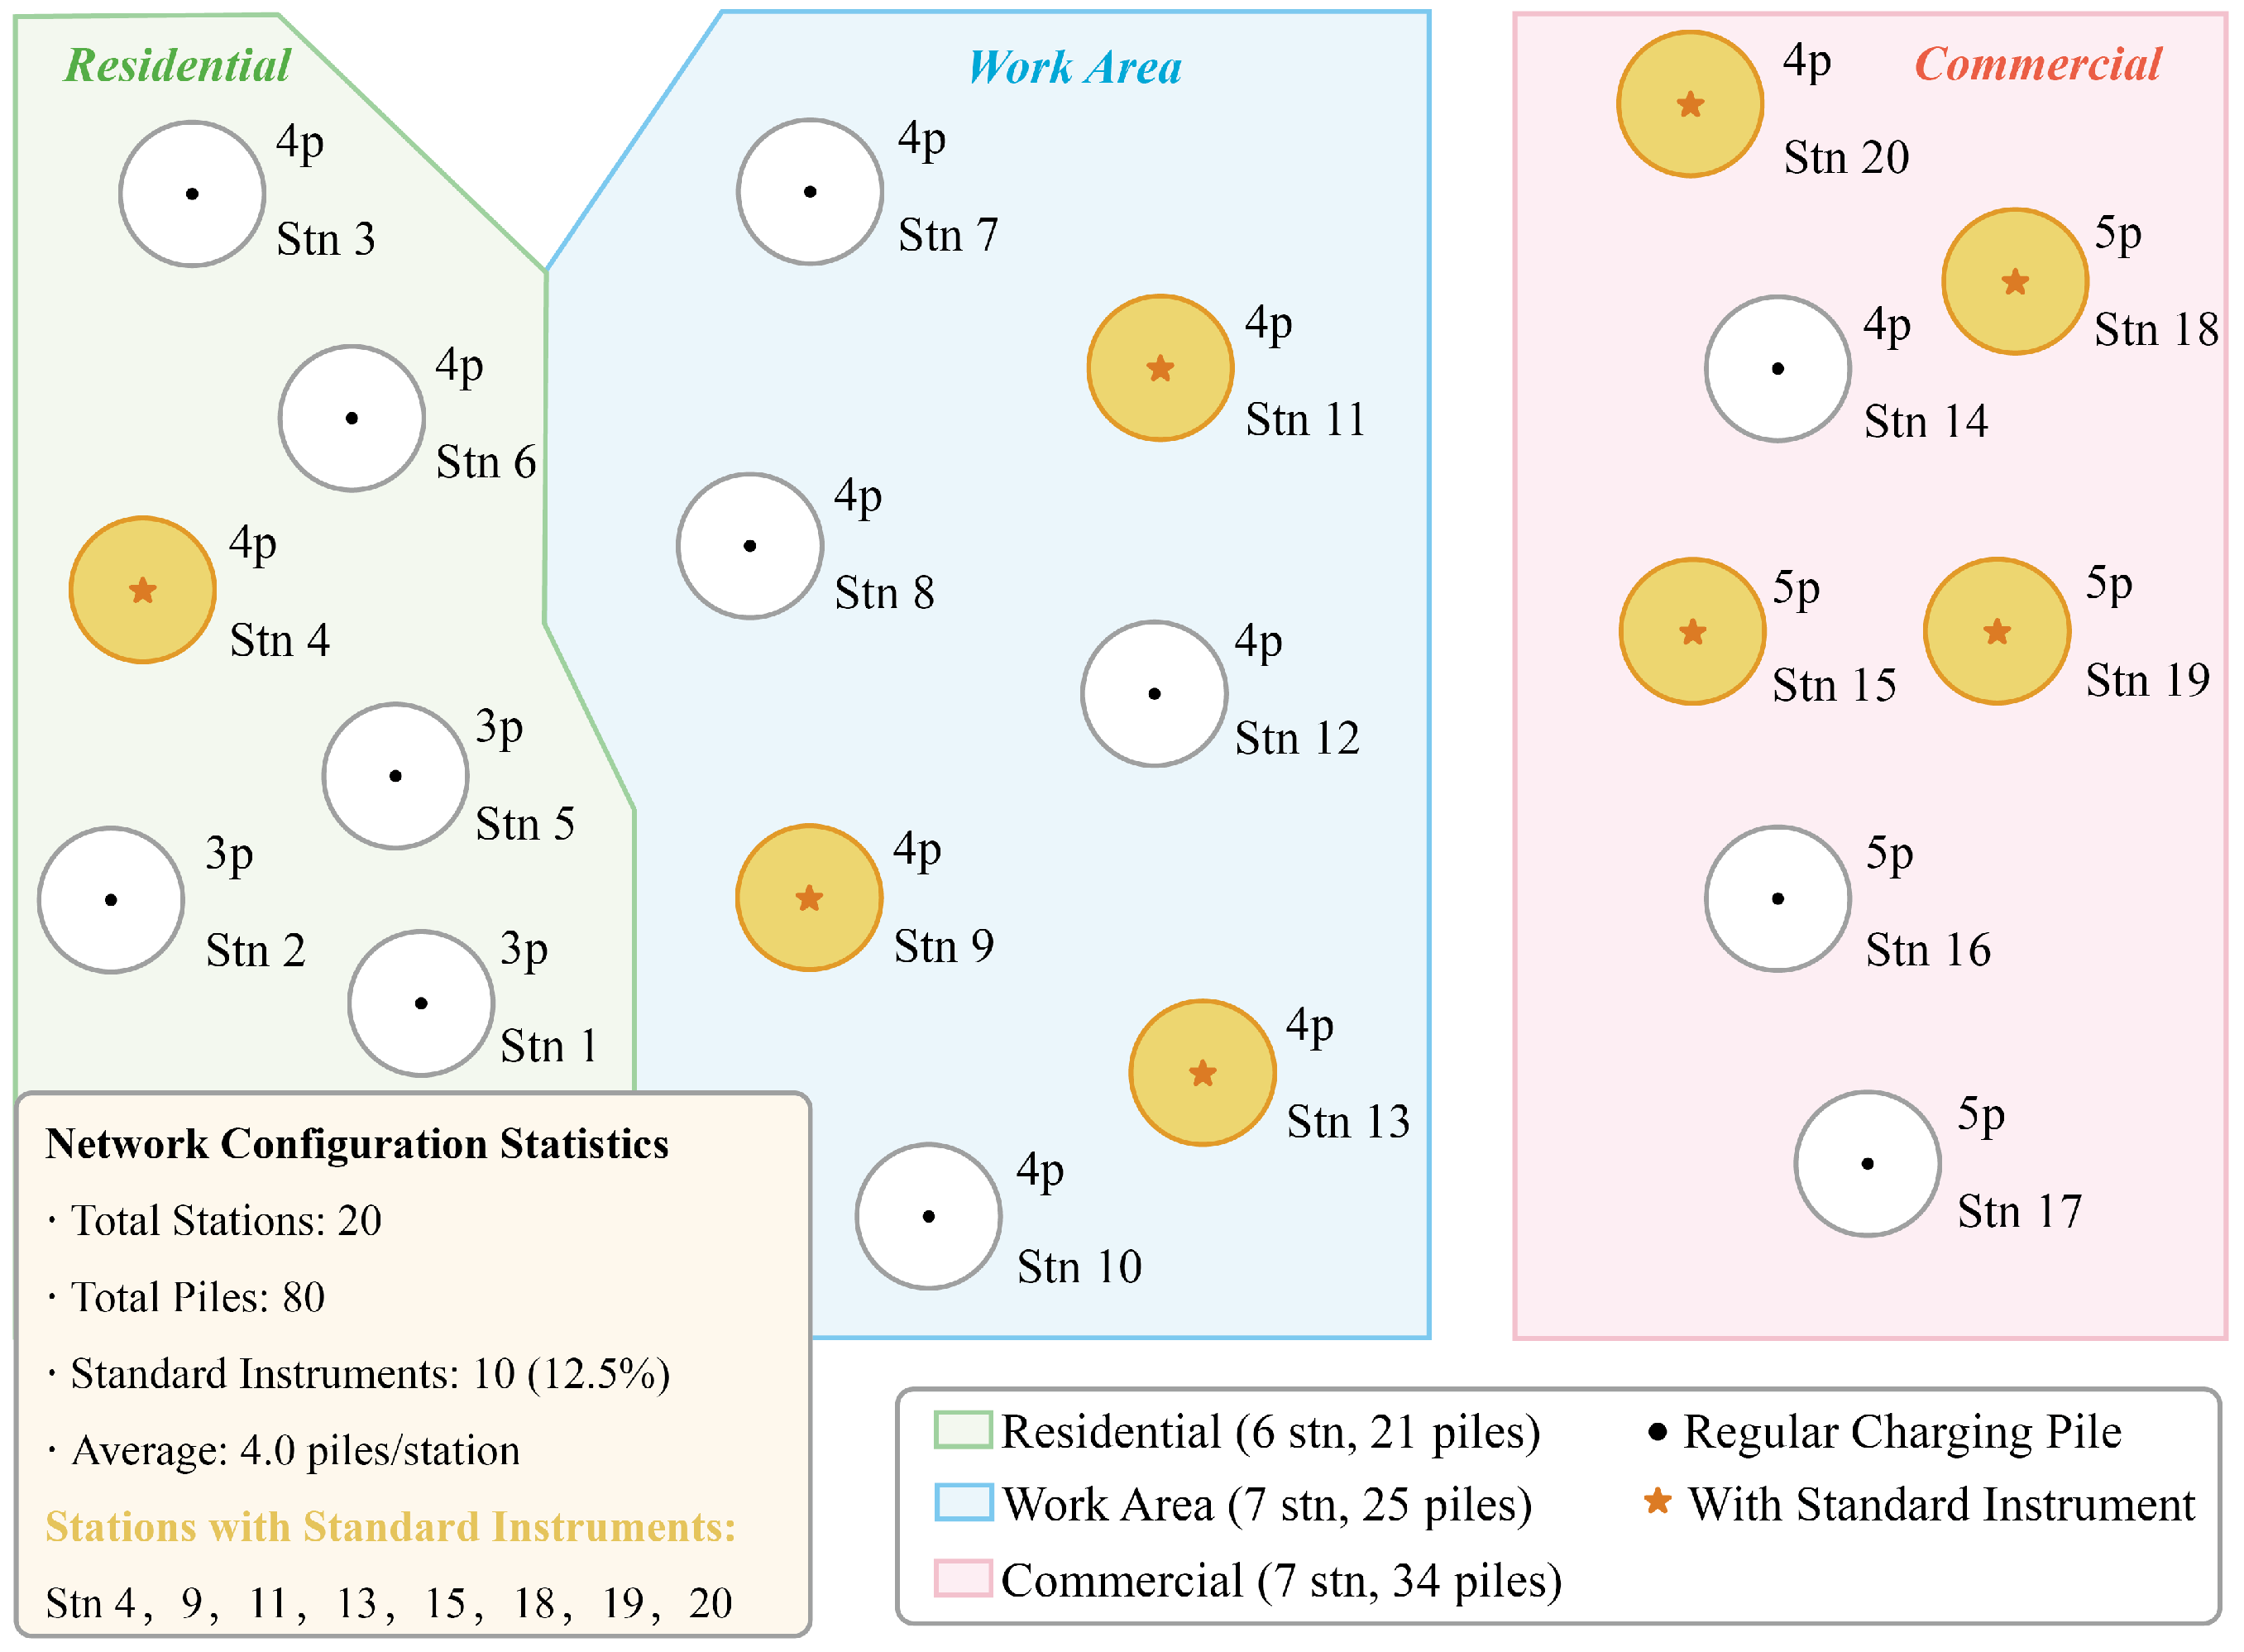
A total of 20 charging stations are set up in the simulation area, distributed in different functional areas, with each charging station equipped with 3–5 charging piles, totaling 80 charging piles. The spatial distribution of charging stations is shown in
Figure 3.
4.2. Distribution of True Metering Error Values
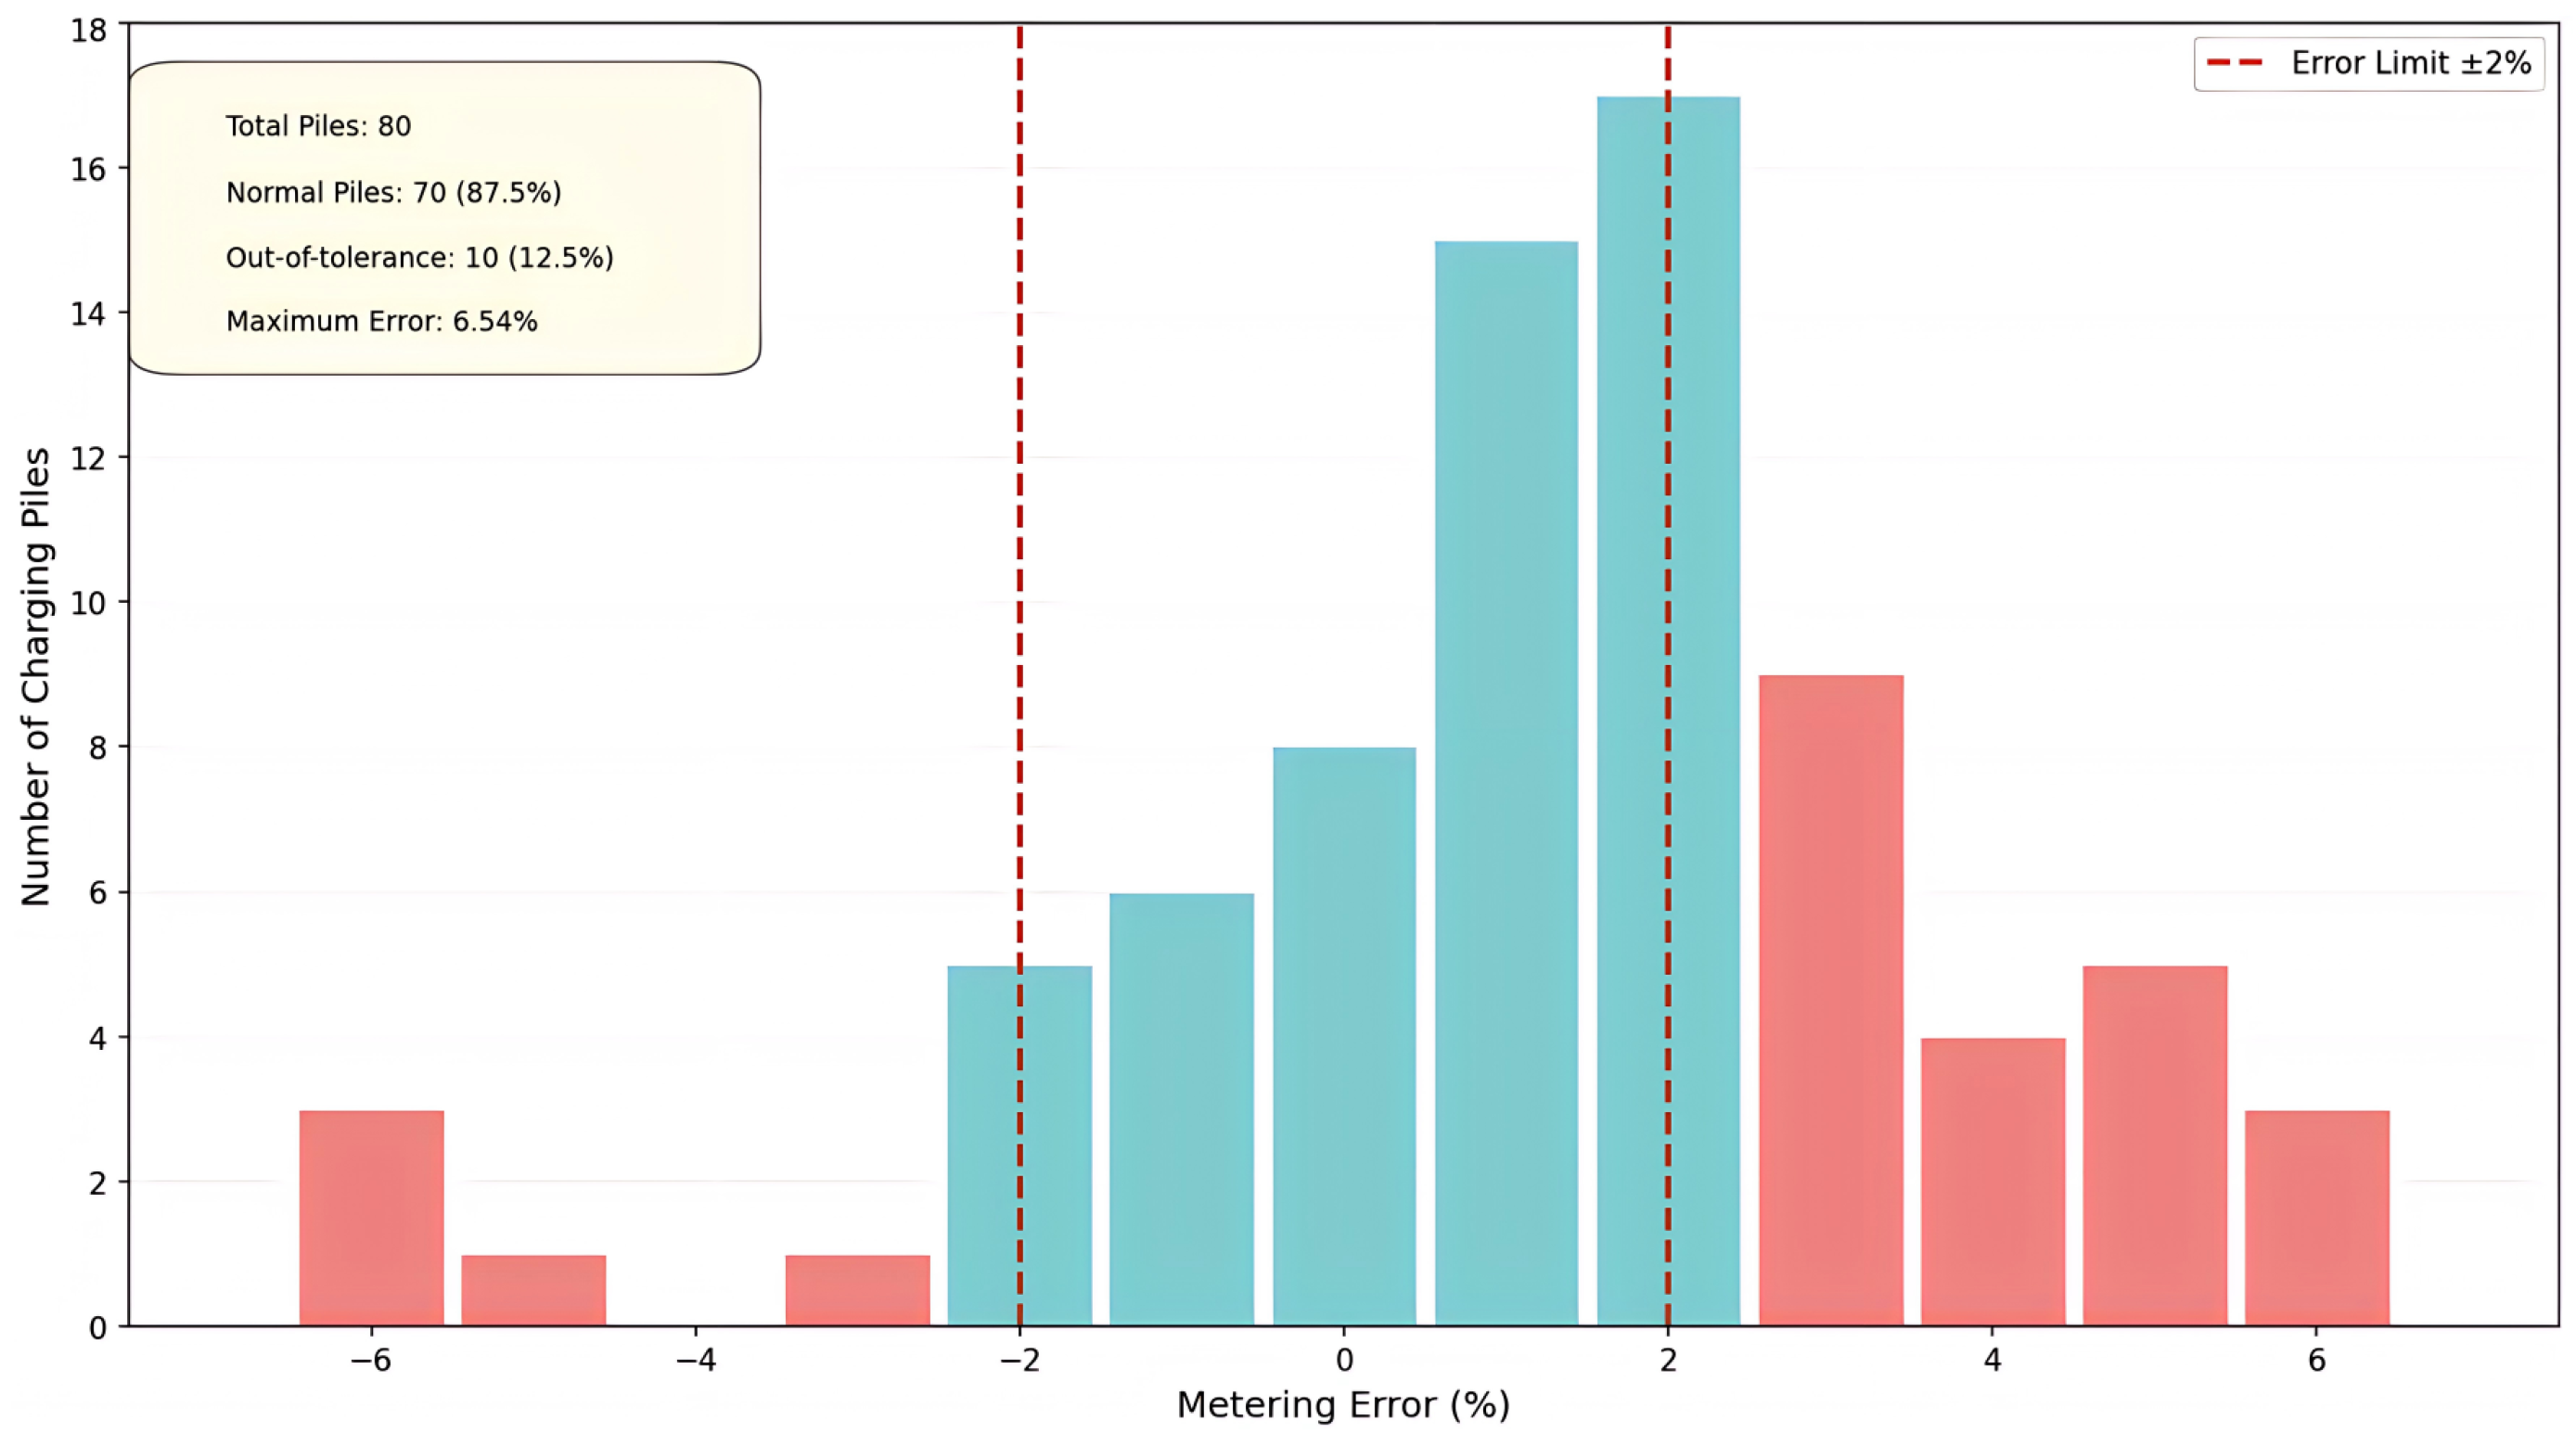
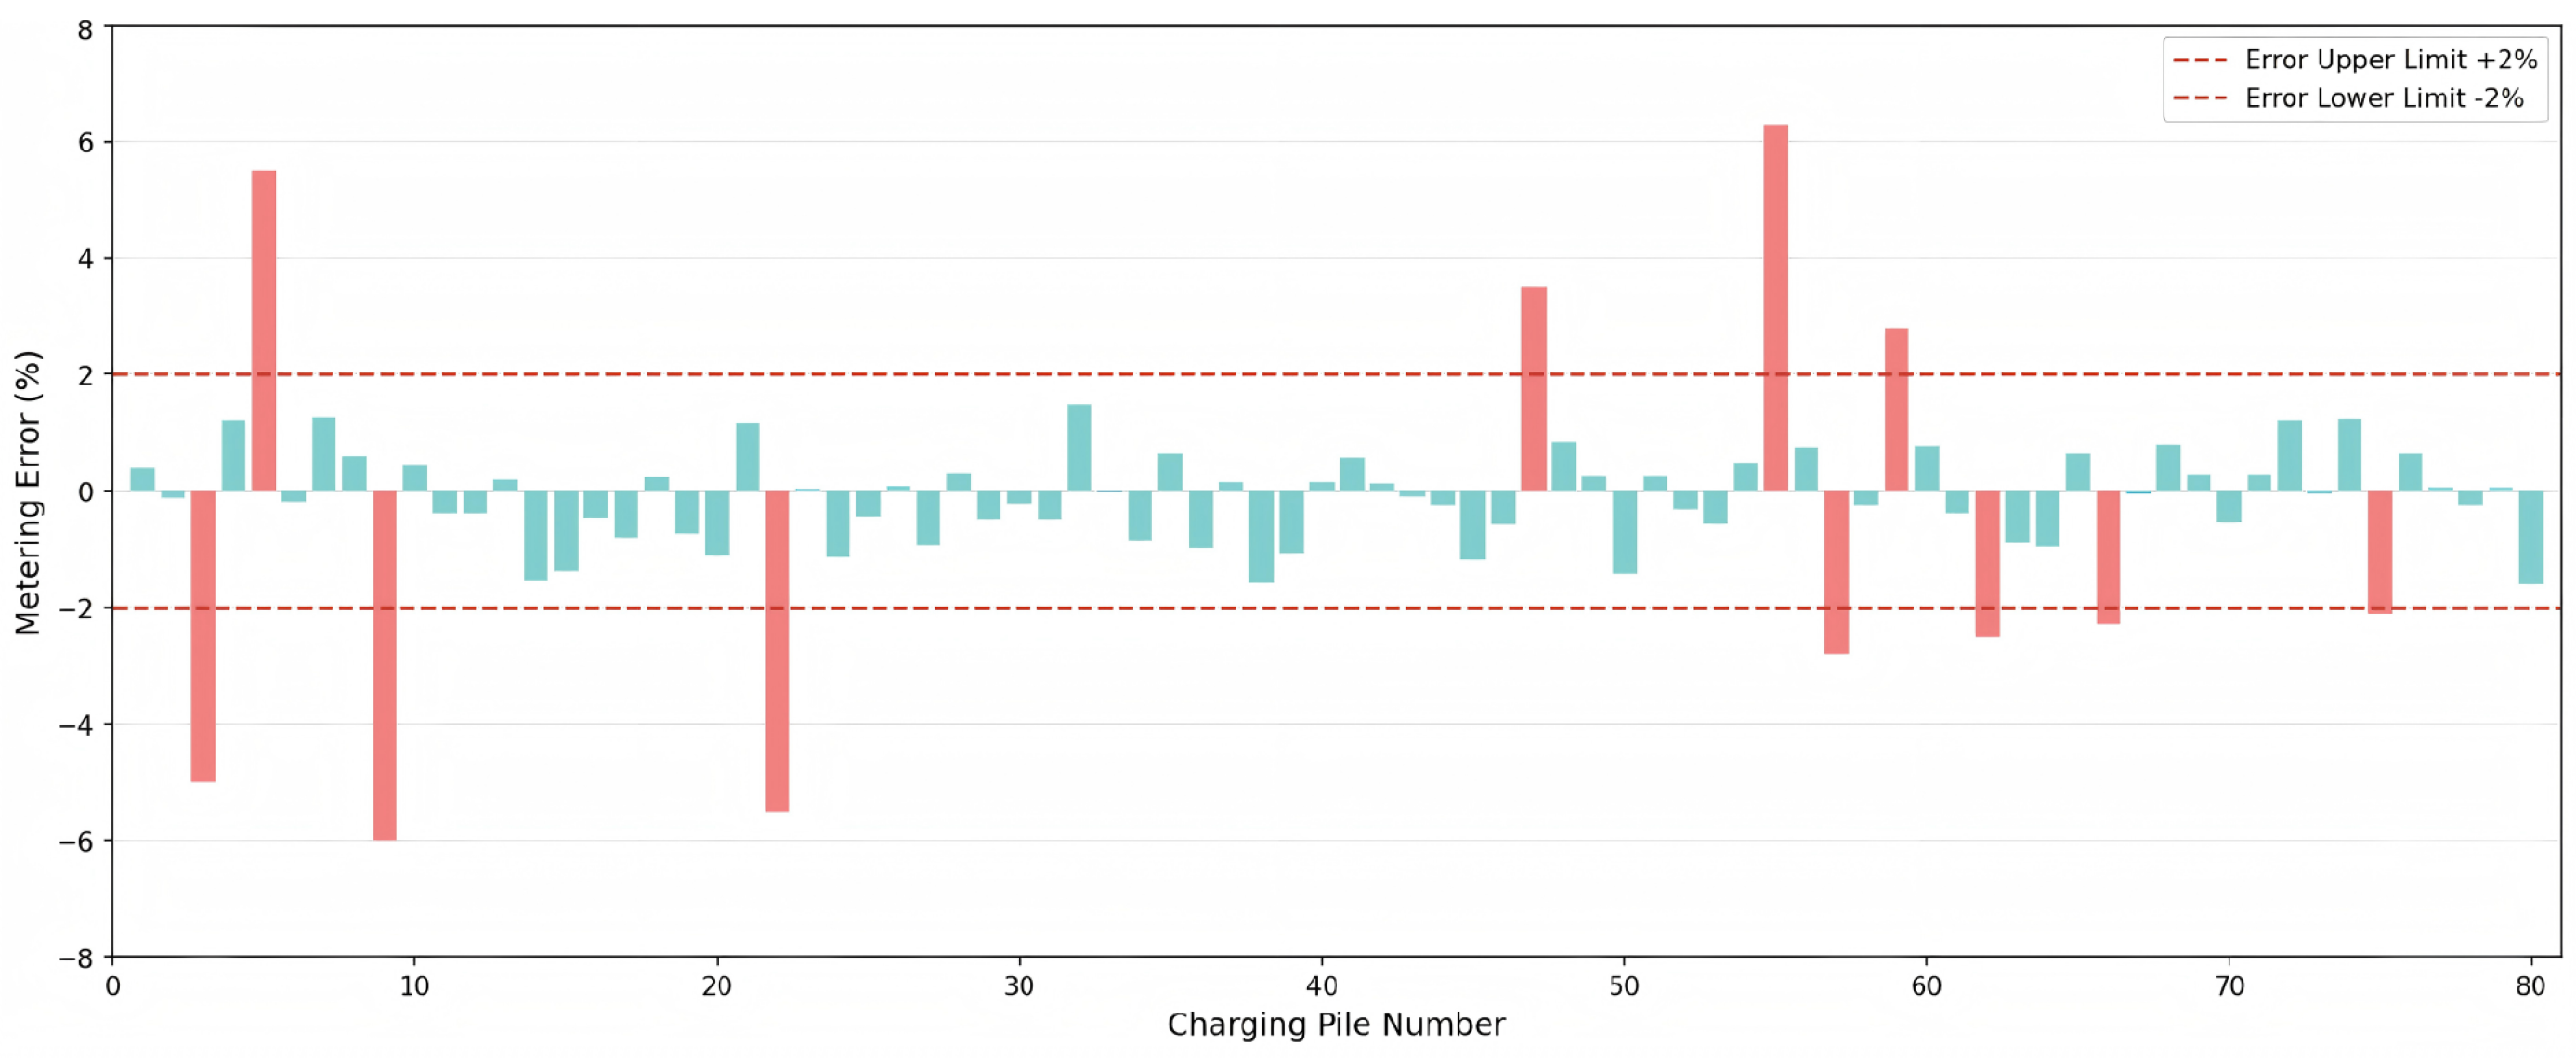
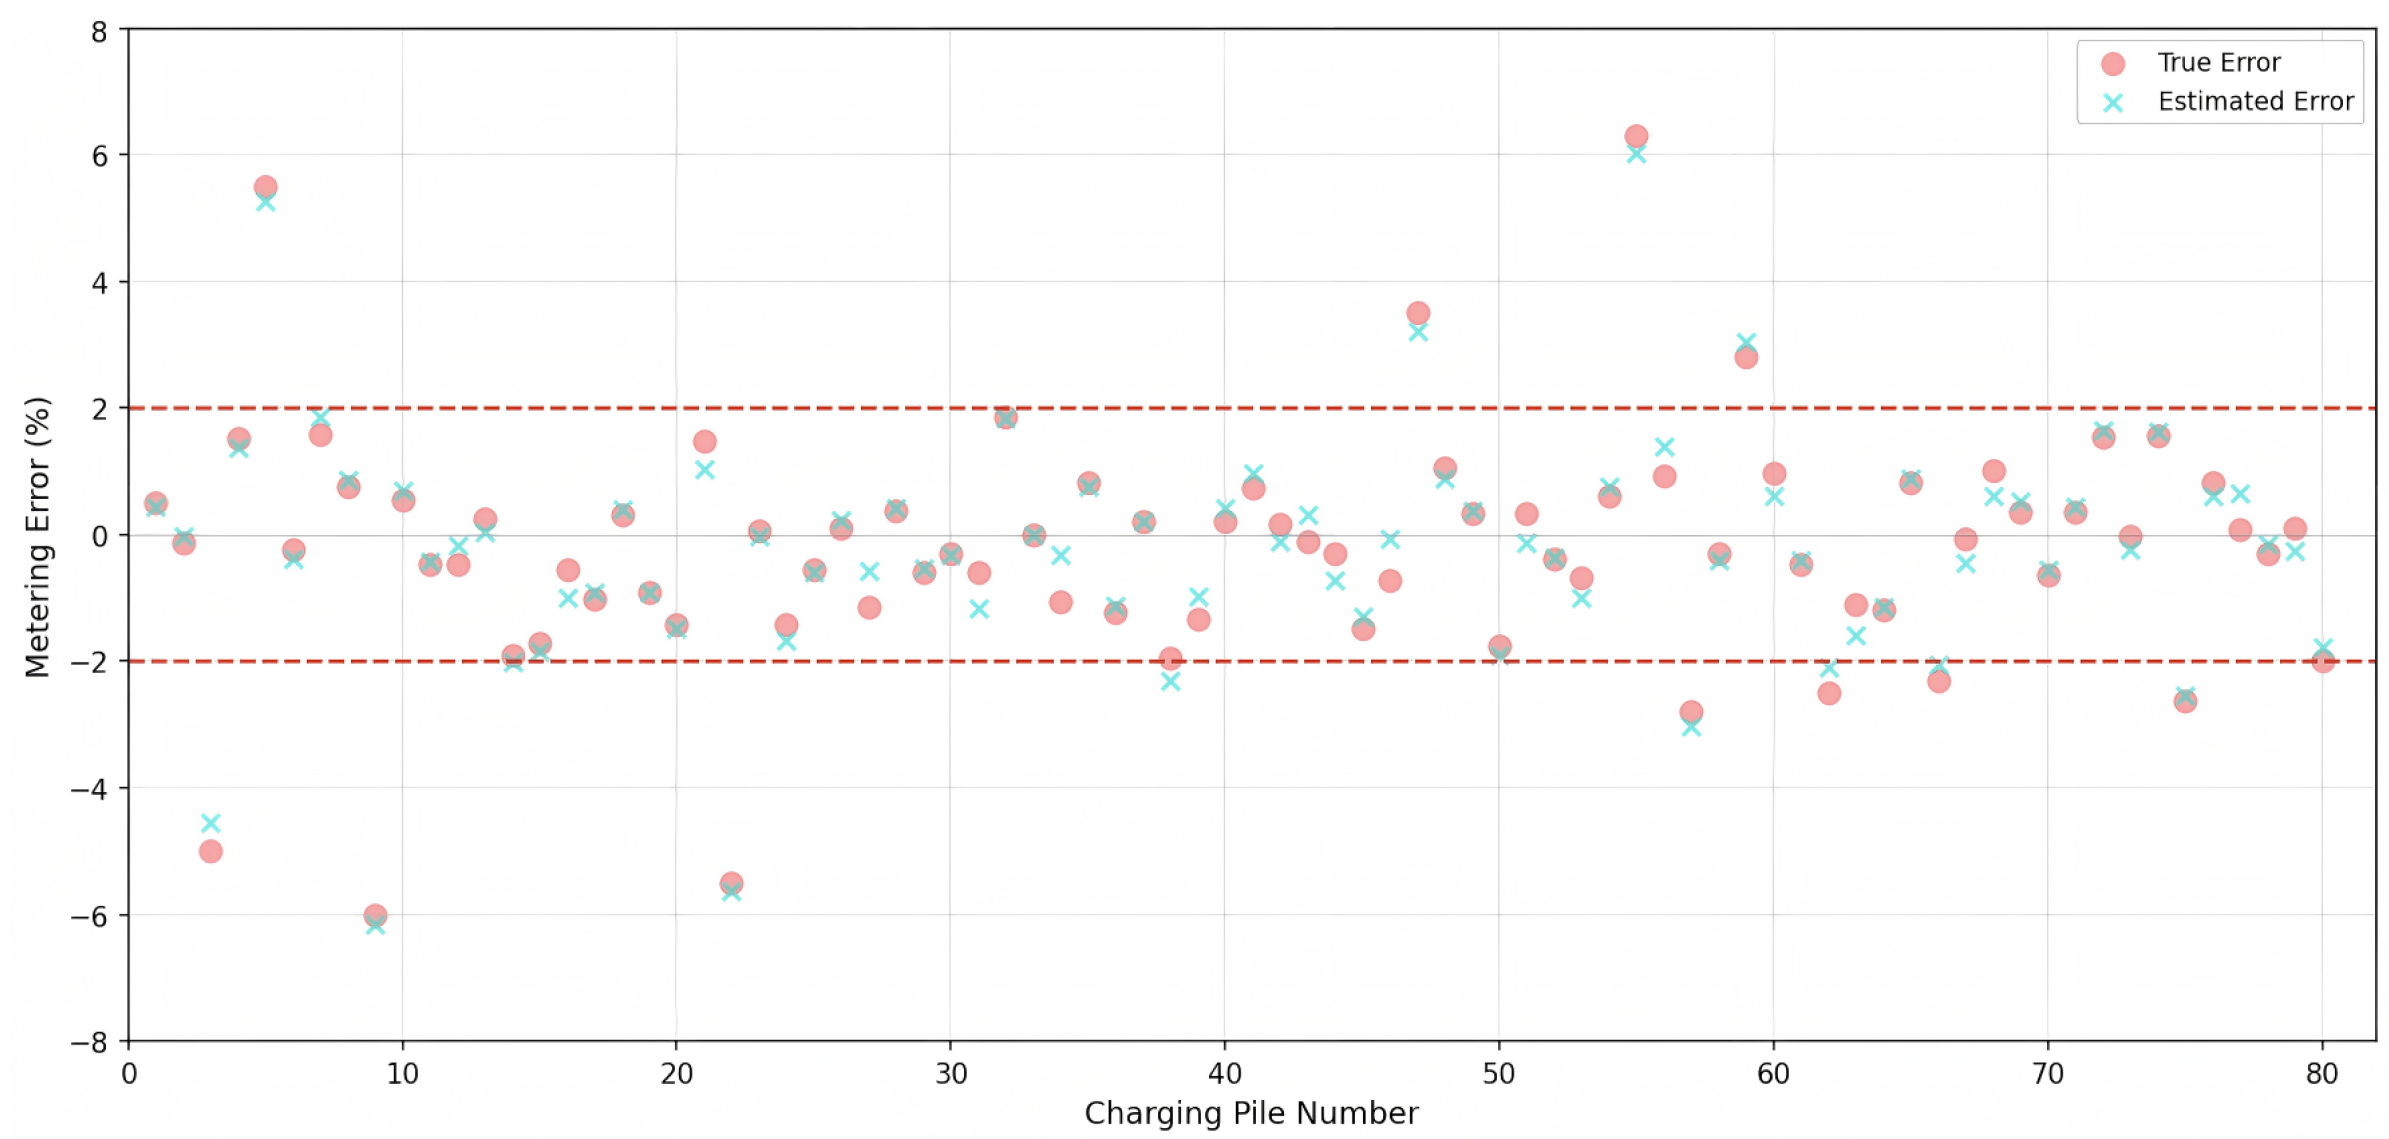
Using vehicle SOC interval energy as the true value of vehicle demand energy, a charging pile and metering standard measurement dataset is constructed by artificially injecting errors. The metering errors of each charging pile are set as shown in
Figure 4. Most charging-pile metering errors are within the ±2% error limit, with a total of 10 out-of-tolerance piles.
The charging-pile error distribution pattern is shown in
Figure 5. The metering errors of each charging pile basically satisfy a normal distribution, and the proportion of out-of-tolerance piles is relatively small, which is consistent with the actual conditions.
4.3. Scenario Setup
To comprehensively evaluate the robustness and accuracy of the algorithm, multiple scenarios are constructed according to different variables such as number of vehicles, number of metering standards, statistical duration, data distribution characteristics, and system scale. The scenario setup mainly proceeds from the following four dimensions:
Data Volume Dimension: Compare the algorithm performance under large sample size (200 vehicles) and small sample size (50 vehicles, 100 vehicles);
Data Distribution Dimension: Construct scenarios with extremely uneven traffic flow/data distribution;
System Scale Dimension: Expand the experiment from 80 charging piles to medium-scale (200 piles) and large-scale (500 piles) systems;
Standard Device Quantity Dimension: Compare the impact of different standard device configuration quantities (5%, 10%, 15%, and 20%).
4.4. Parameter Settings
The model parameters are shown in
Table 2.
5. Result Analysis
5.1. Charging Behavior Verification
To verify the effectiveness of the simulation data, this section presents the simulation results of electric vehicle travel and charging events.
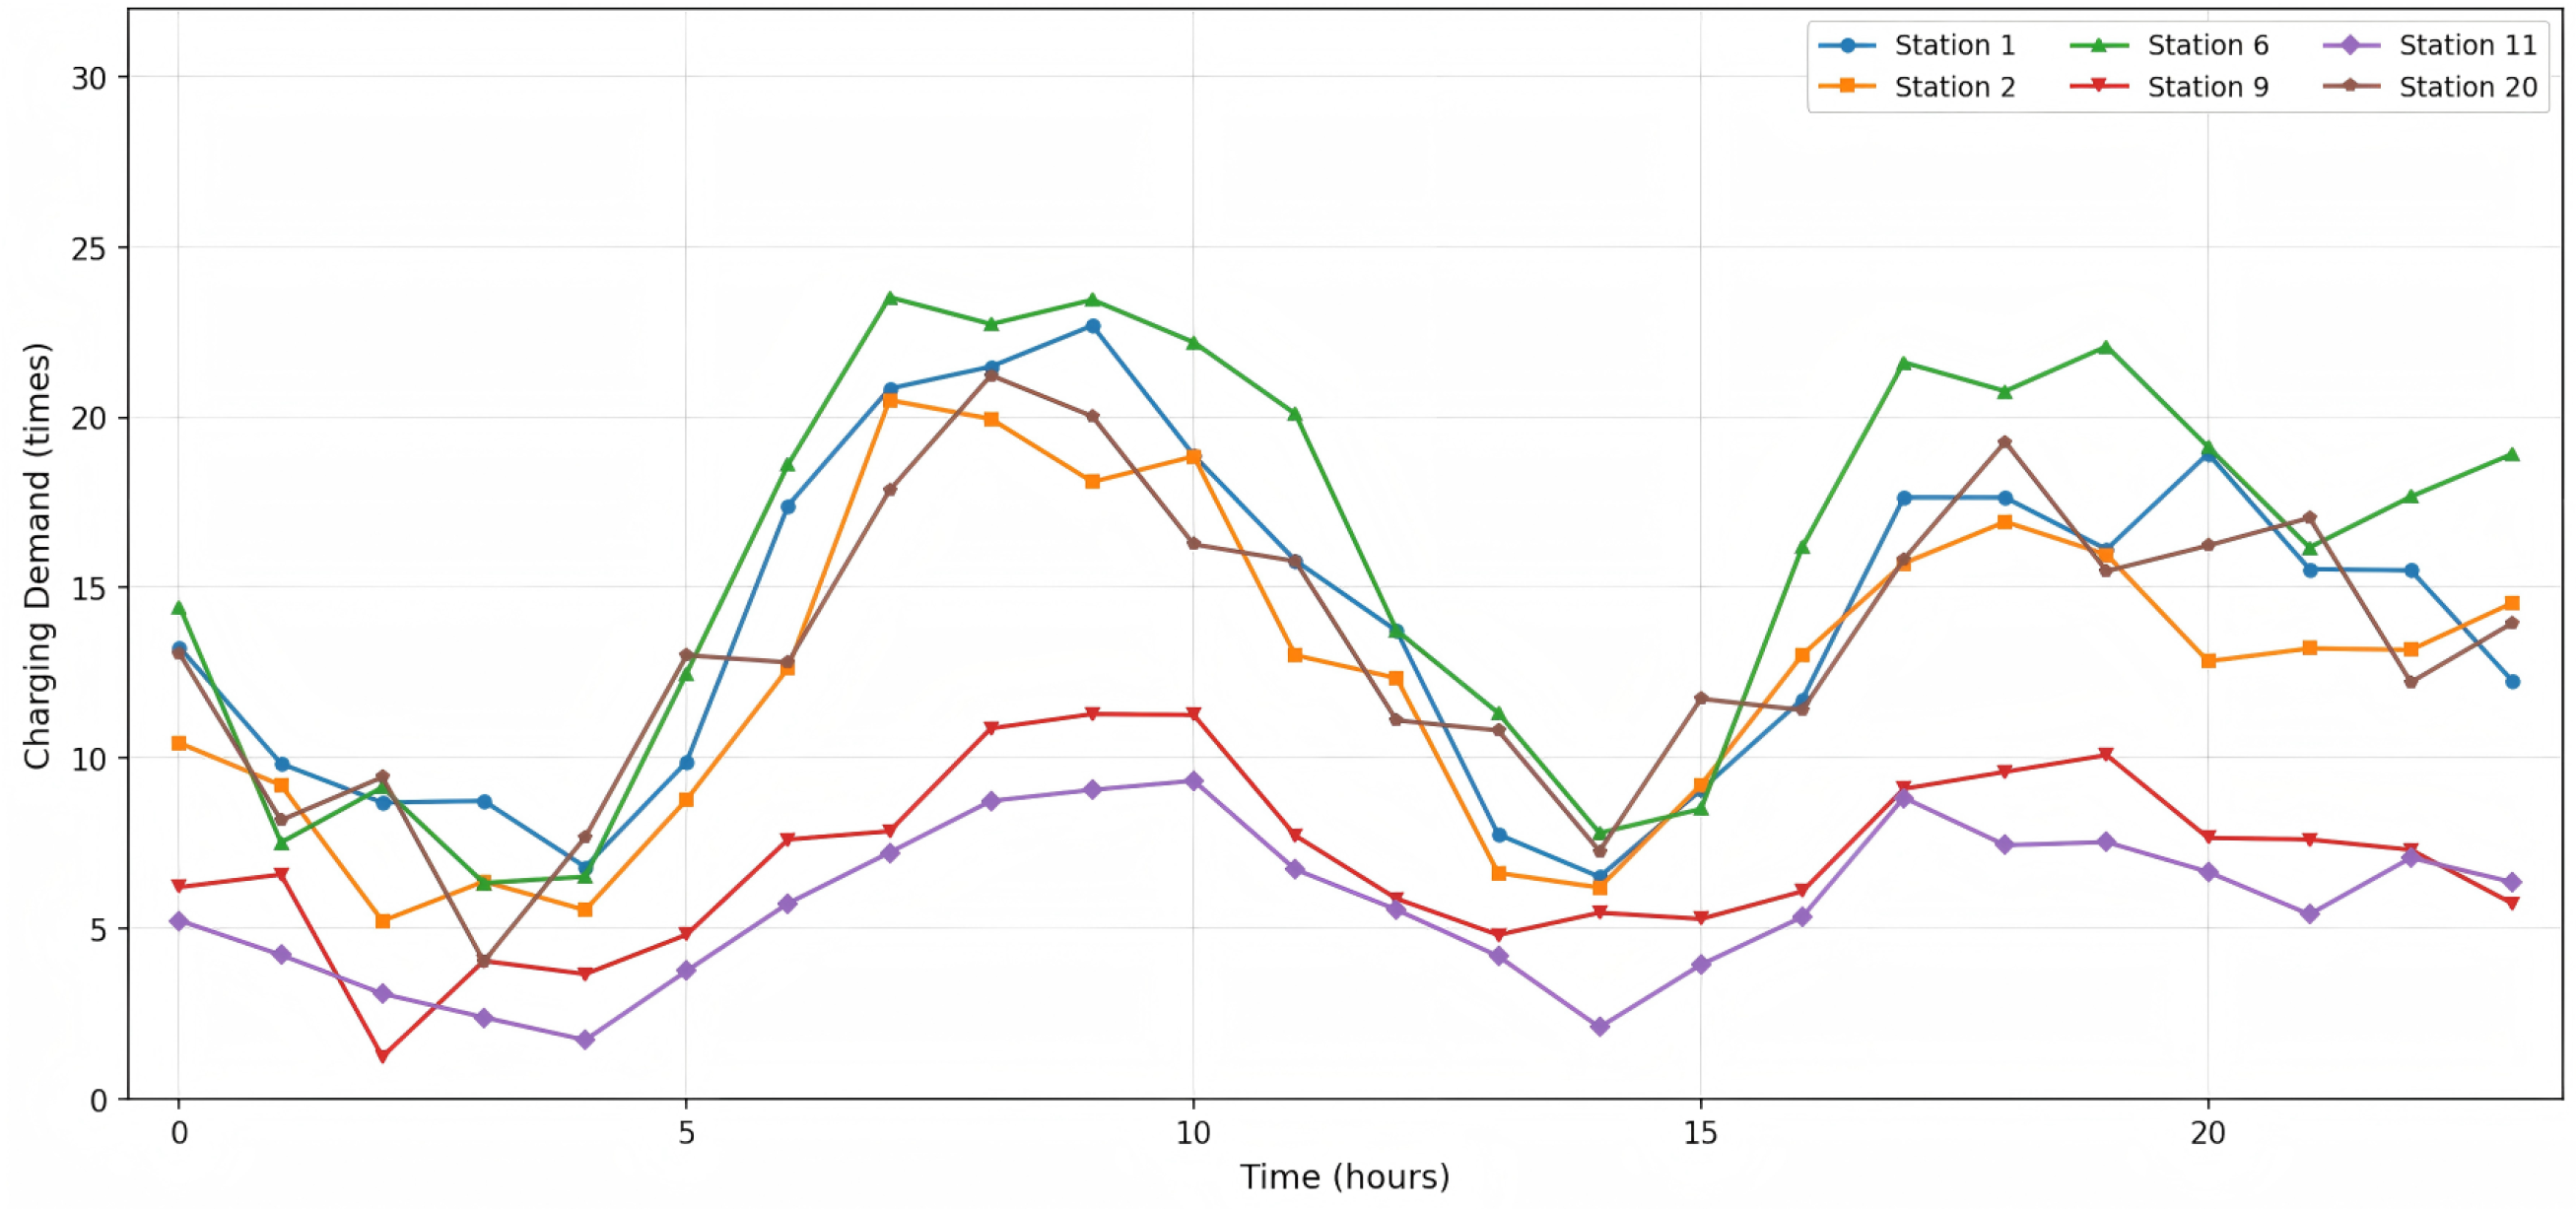
Figure 6 shows the demand situation of private cars for each charging station. The private car charging demand shows obvious spatial–temporal characteristics. In the time dimension, demand generally has similar morning and evening double peak characteristics, which is highly correlated with people’s daily travel habits. In the spatial dimension, demand shows significant differences due to different charging station locations.
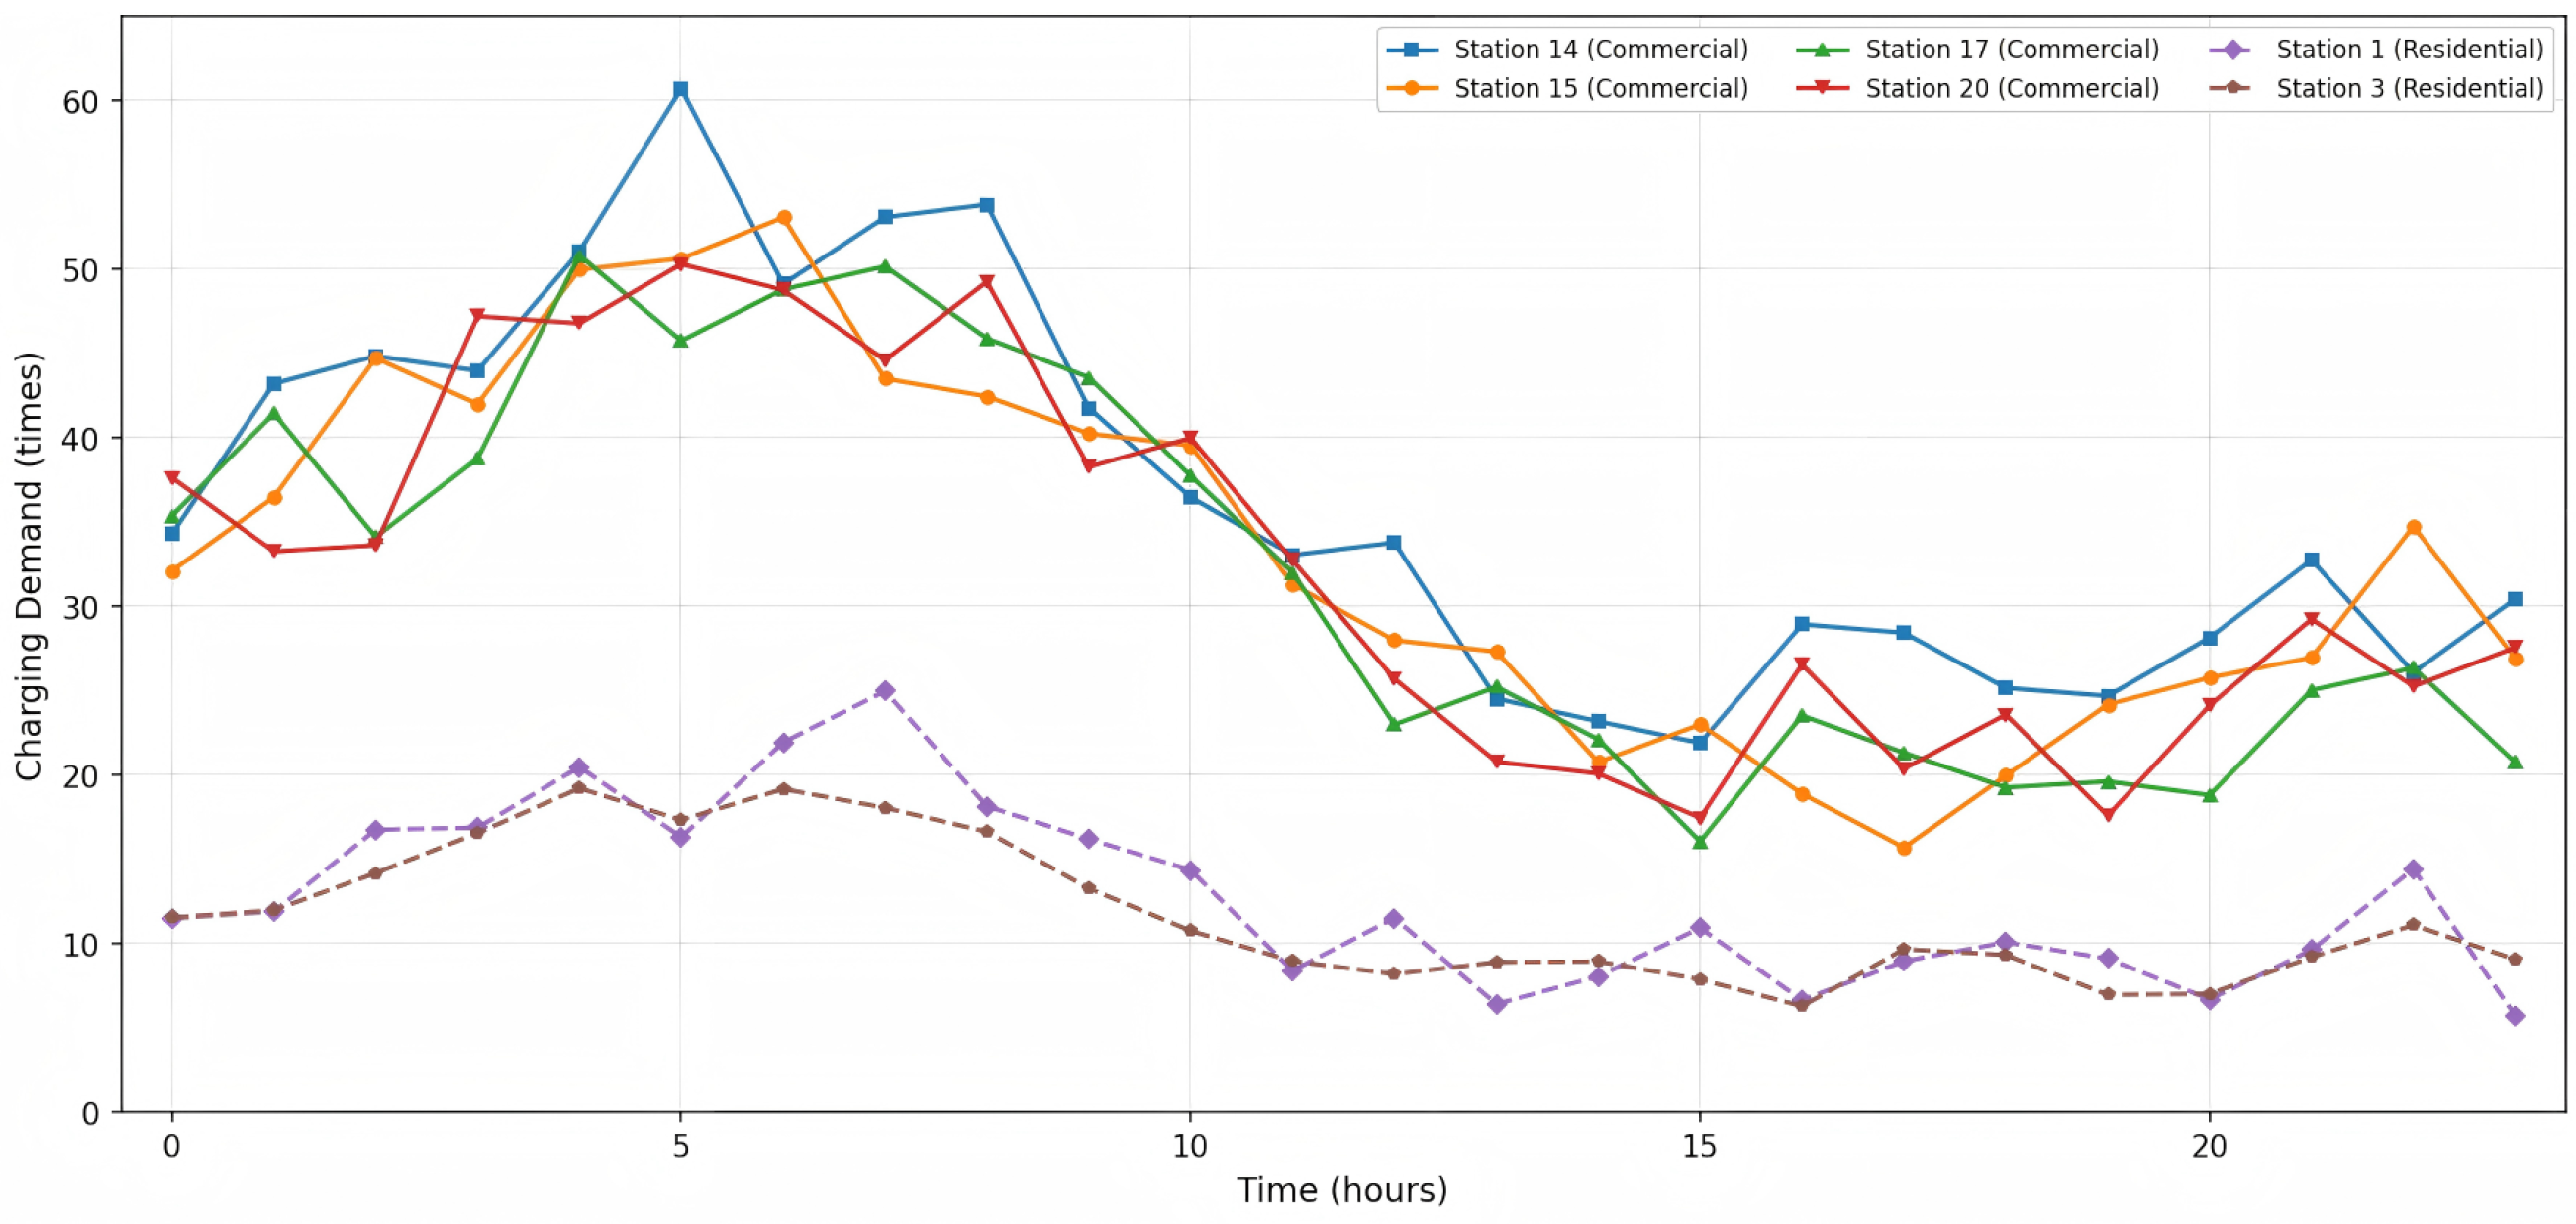
In contrast, the spatial distribution characteristics of taxi charging demand are more prominent. As shown in
Figure 7, taxi charging demand shows great imbalance in space, with commercial area charging demand significantly higher than residential and work areas.
5.2. Benchmark Scenario Analysis
To verify the convergence, stability, and effectiveness of the proposed charging-pile metering error joint estimation method, this section applies this method to analyze related indicators. First, the convergence of the loss function is shown in
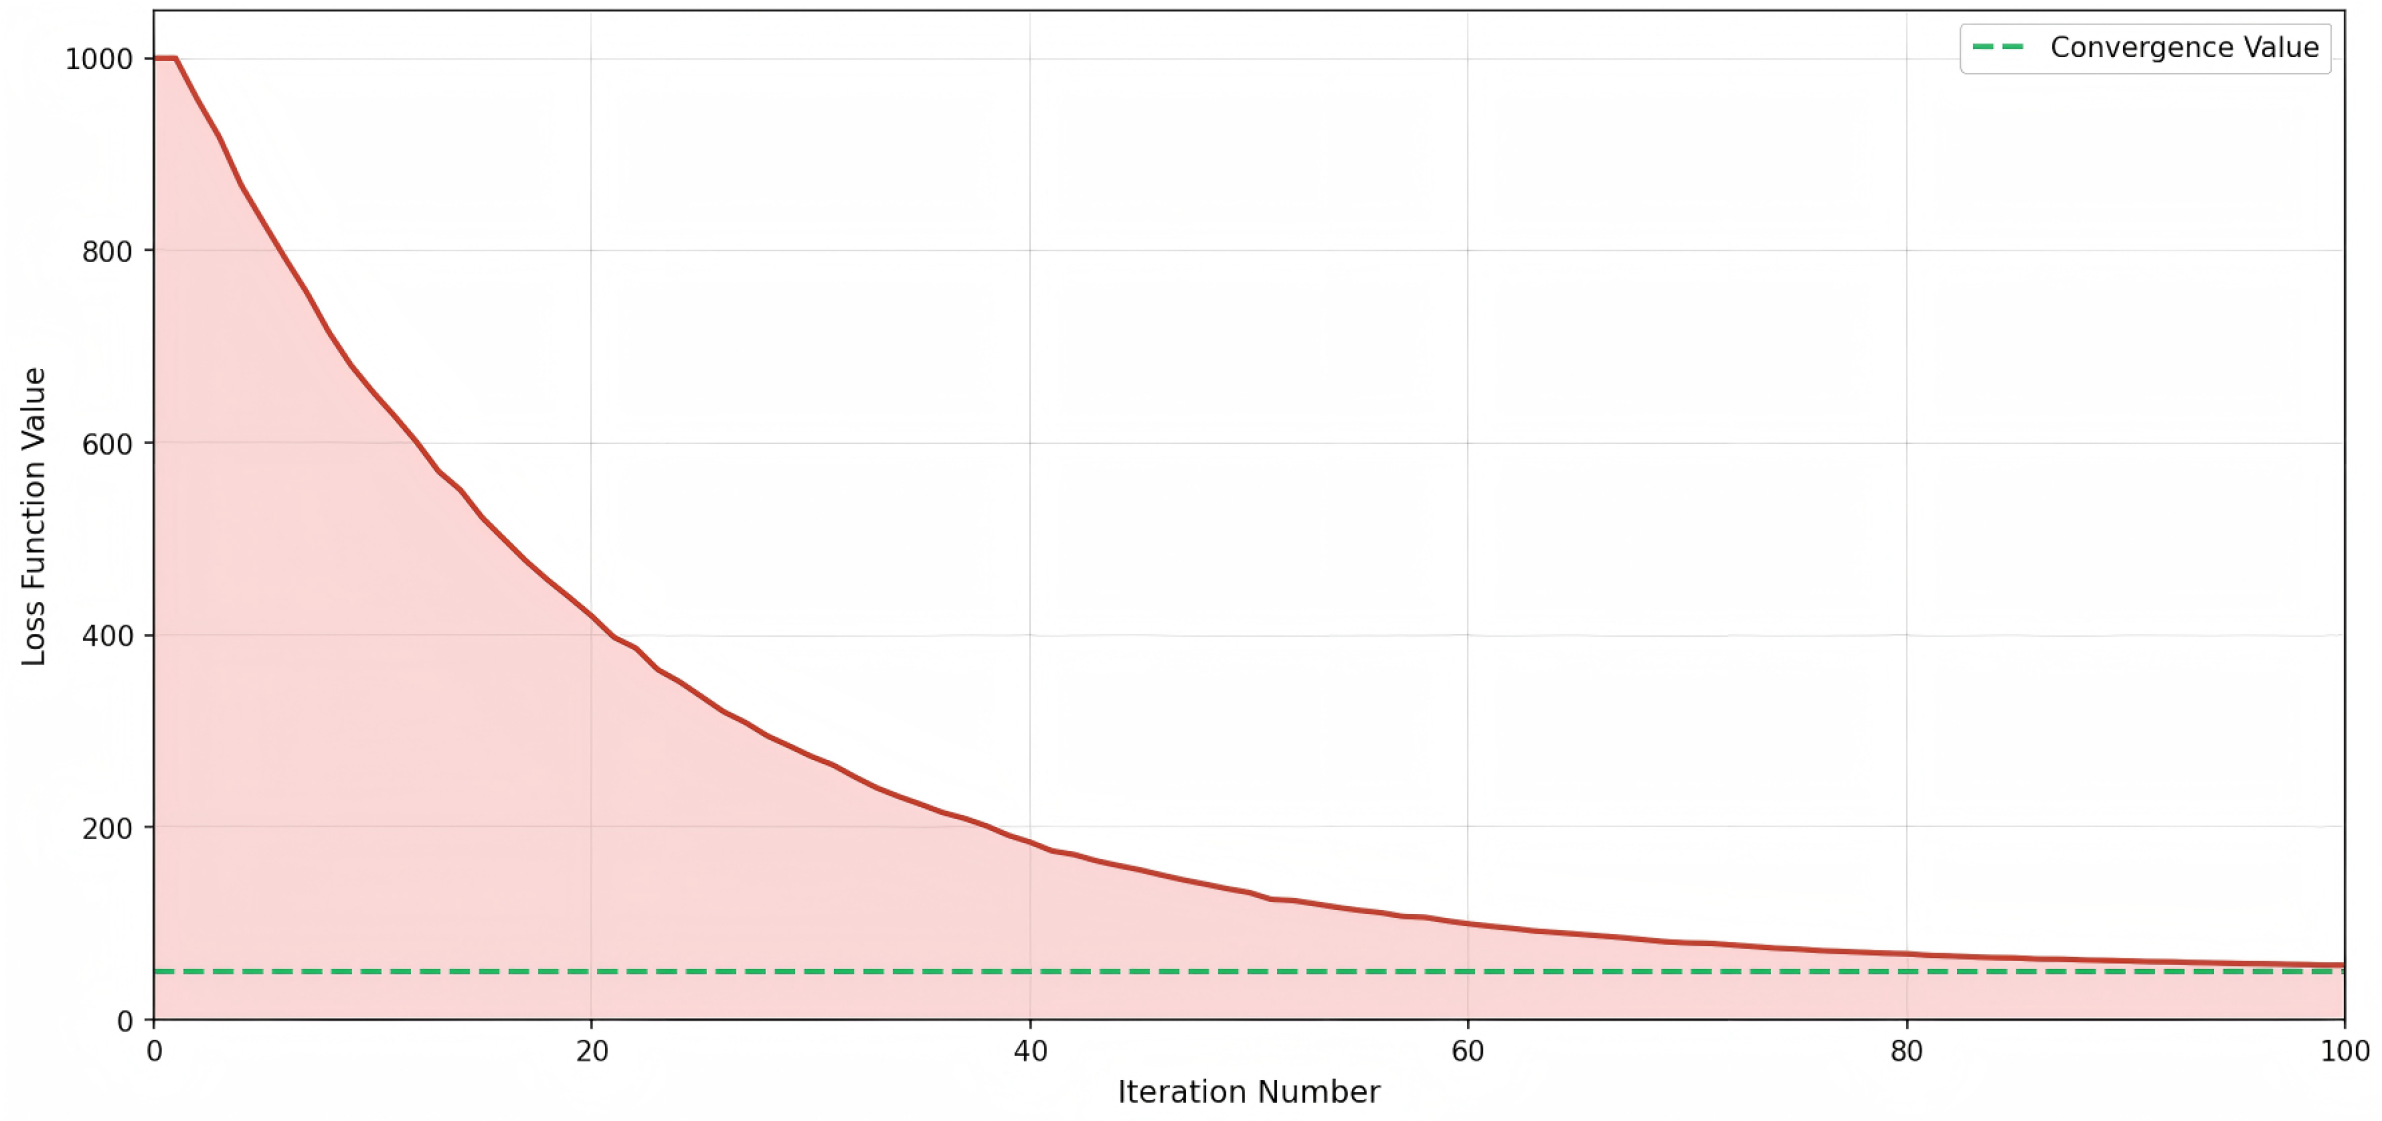
Figure 8. The algorithm rapidly decreases the loss function value from the initial value within the first 20 iterations and tends to stabilize in subsequent iterations.
Second, the effectiveness of error estimation is evaluated through the RMSE indicator.
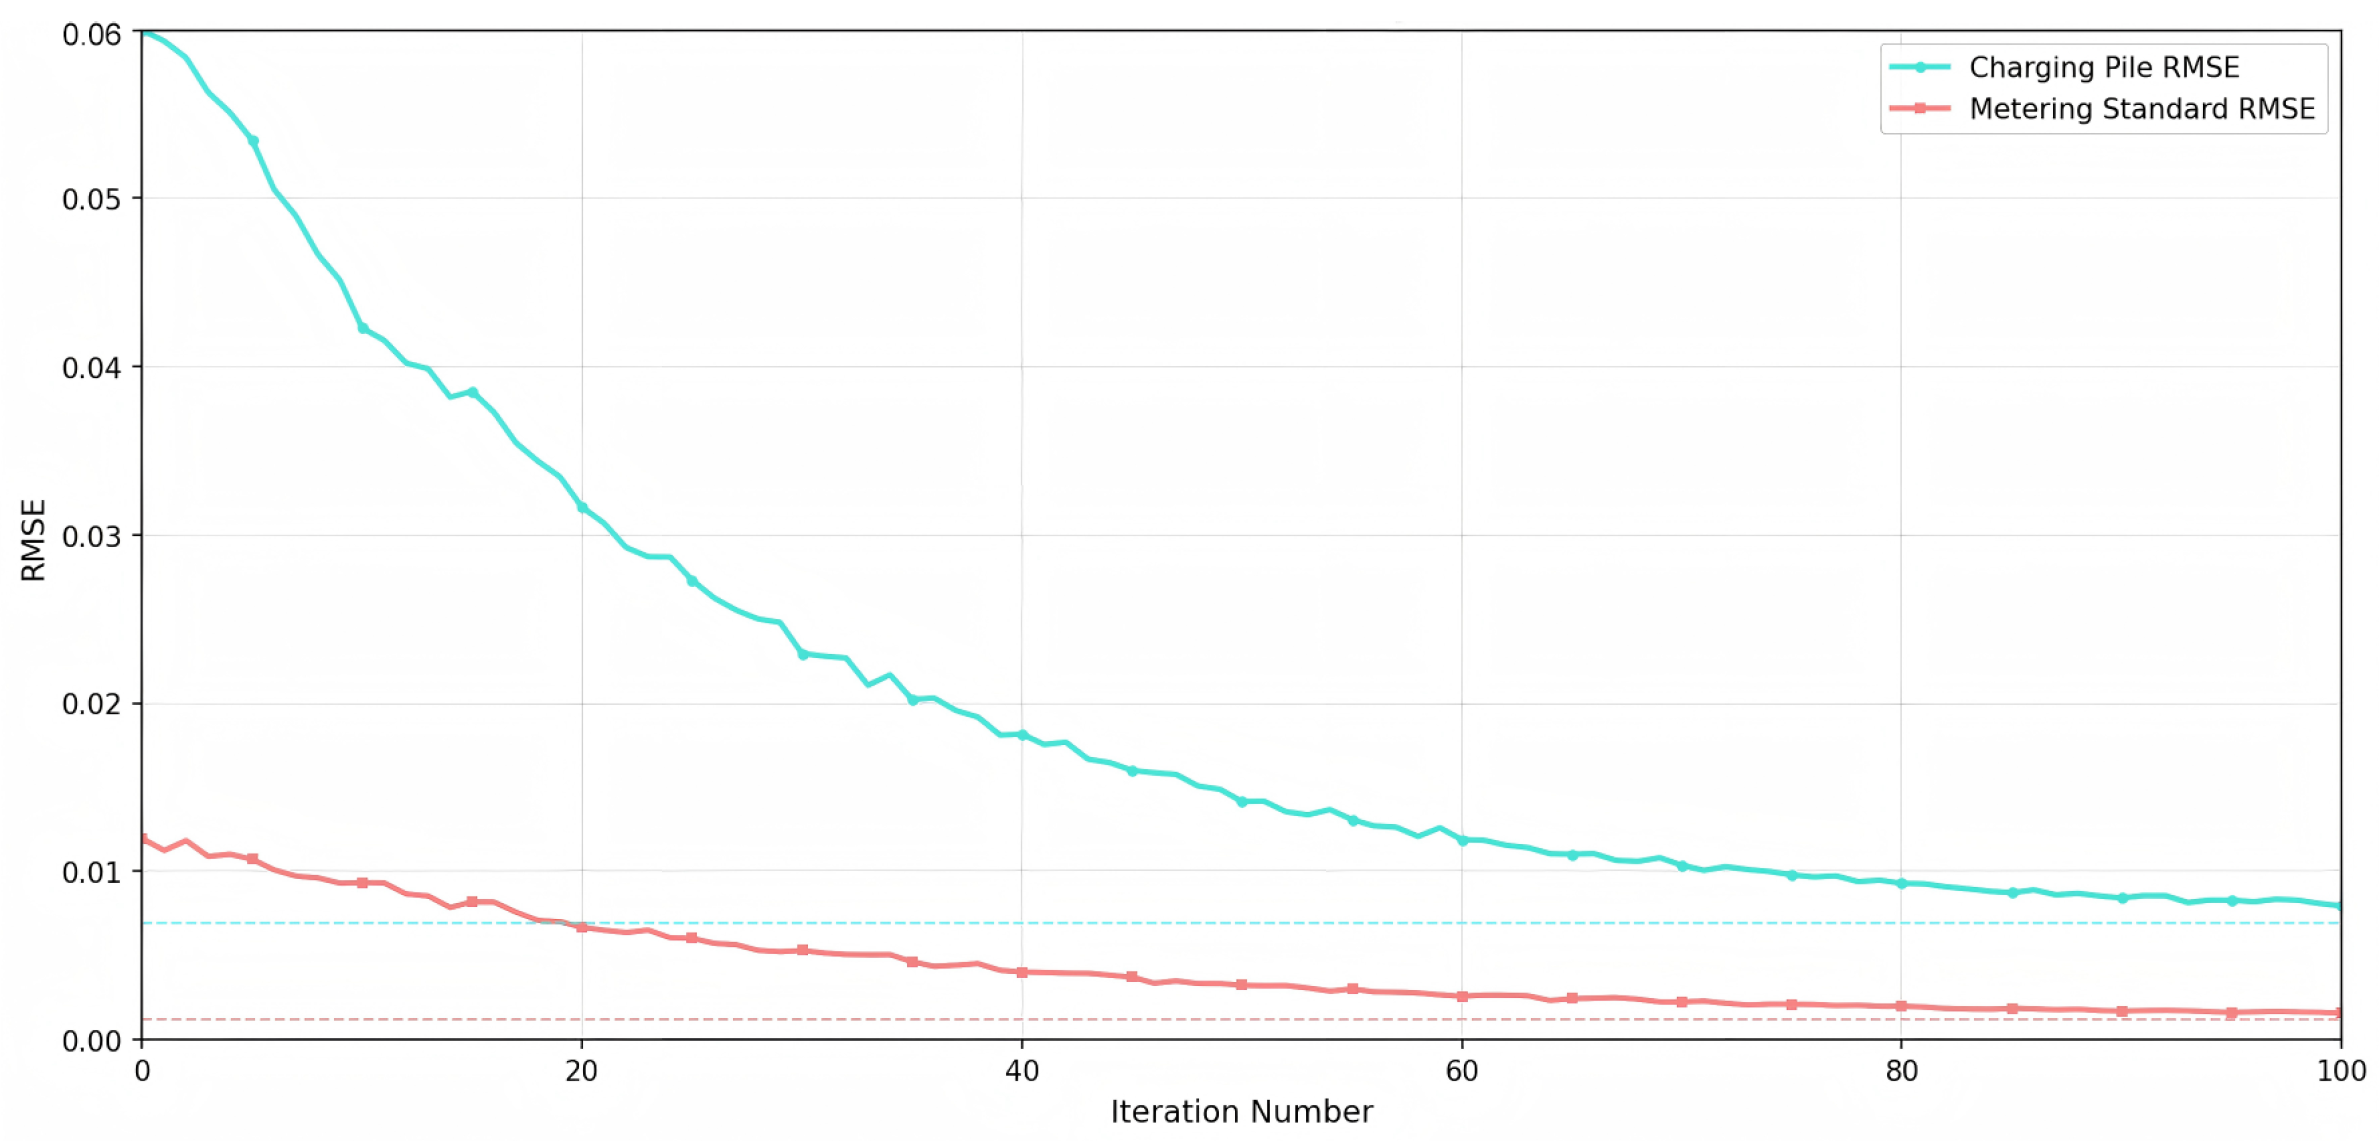
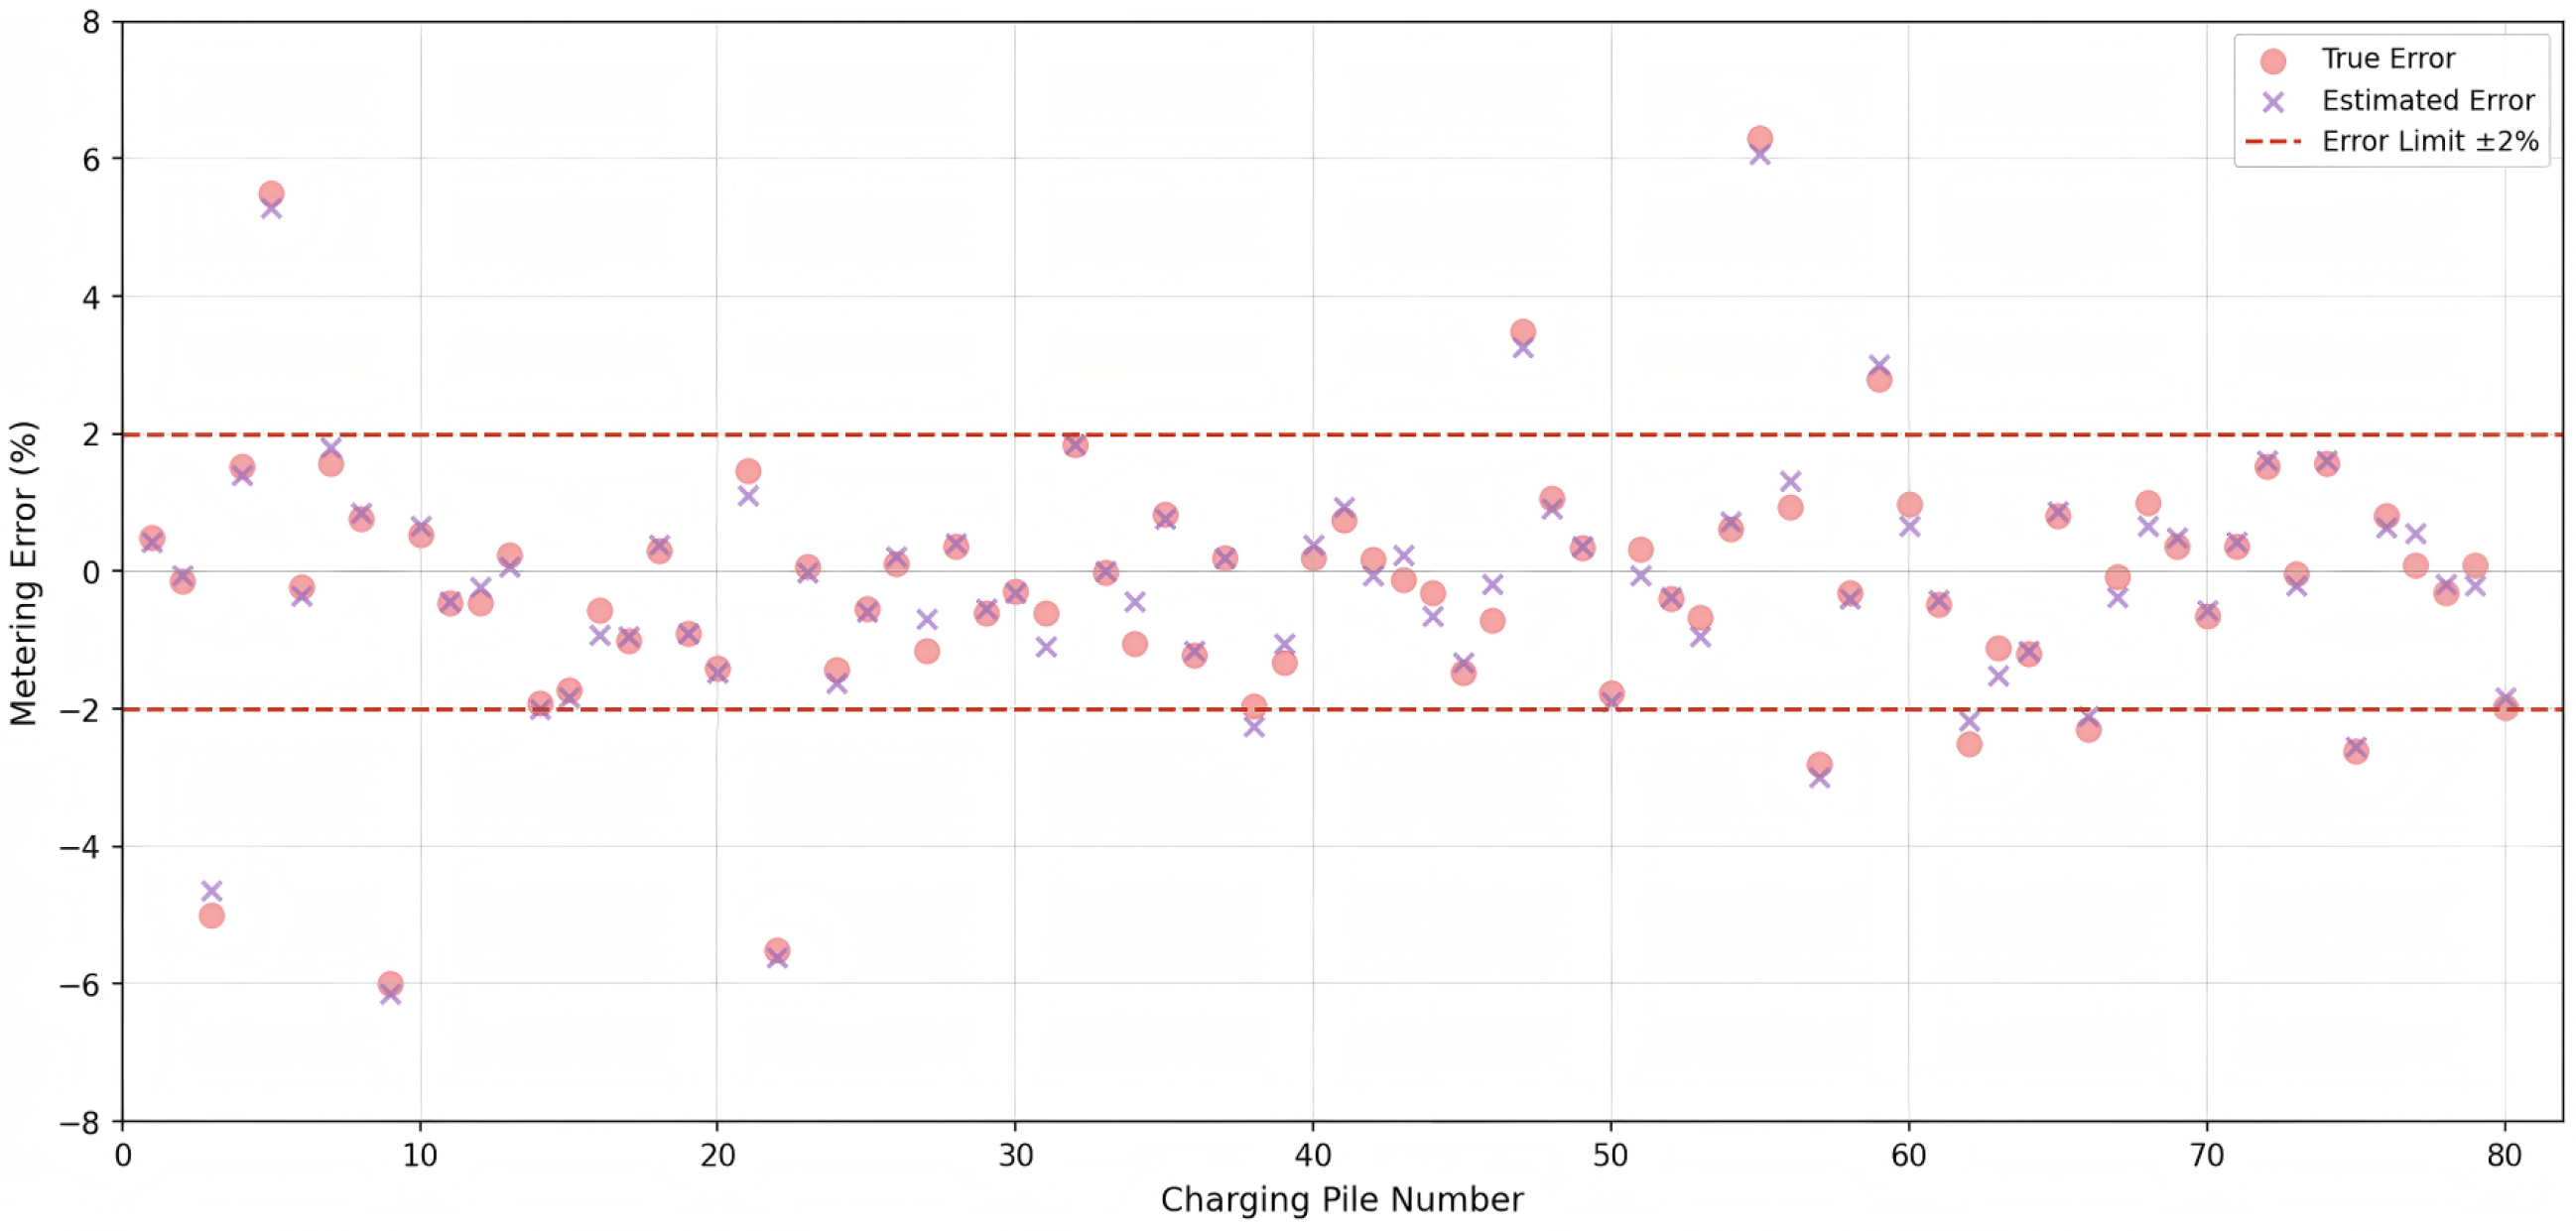
Figure 9 shows that the RMSE of charging piles rapidly decreases in the initial iterations and stabilizes at about 0.0069 after about the 40th iteration. At the same time, the RMSE of metering standards shows a similar trend, stabilizing at about 0.0012 after about the 40th iteration.
As shown in
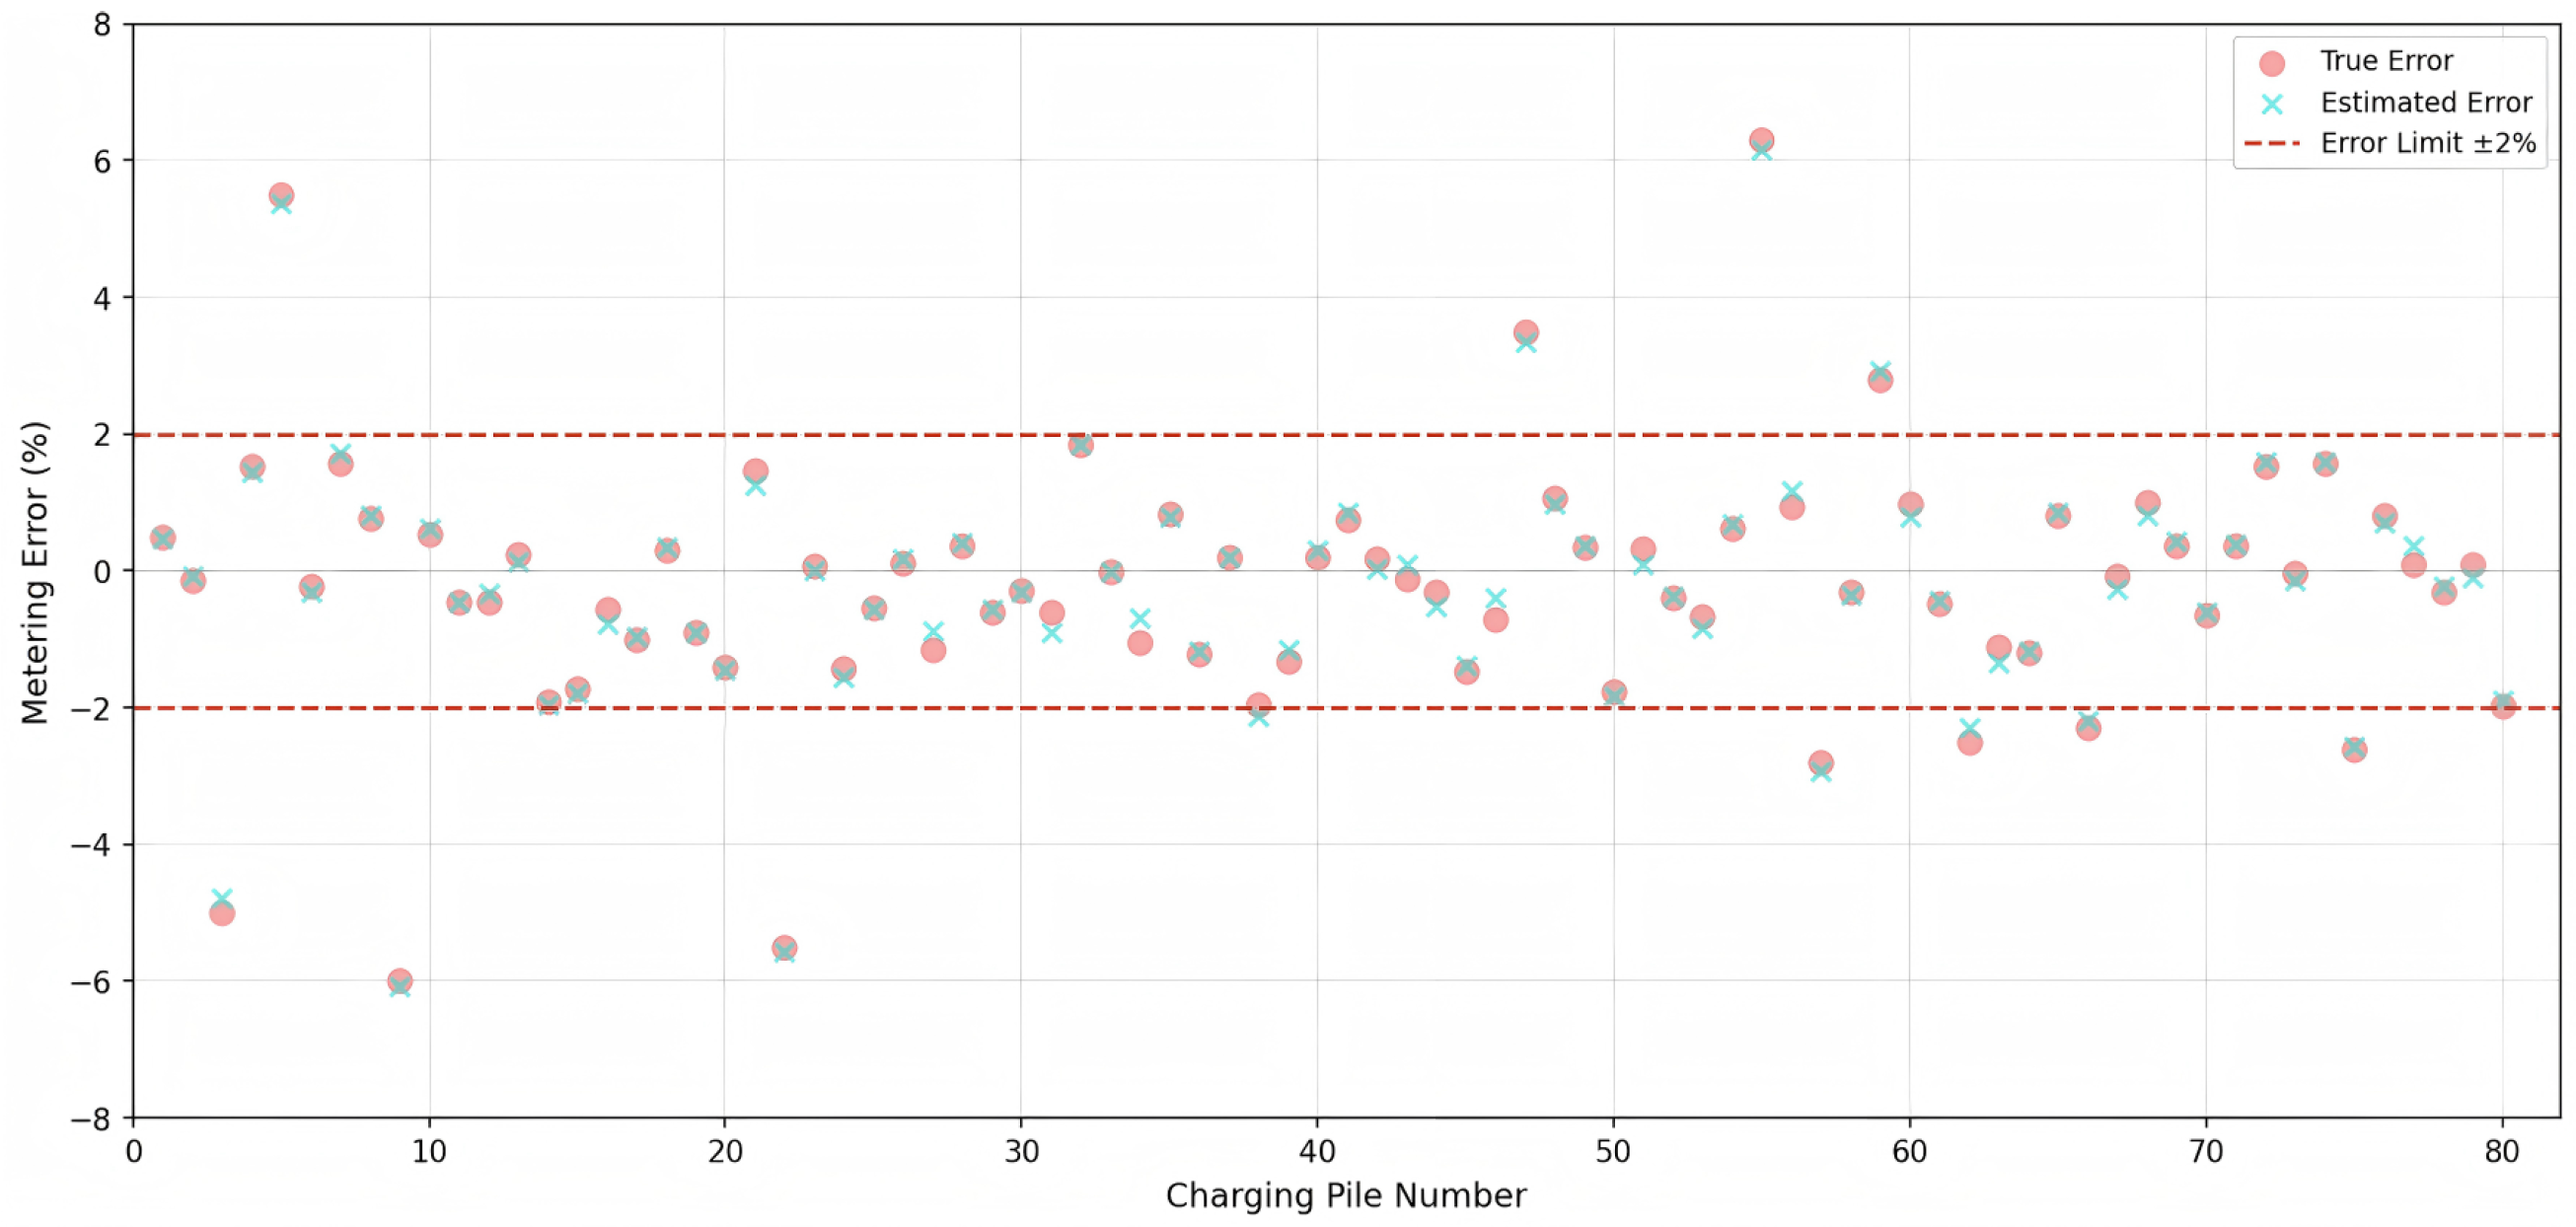
Figure 10, the impact analysis of configuring metering standards shows that charging piles equipped with metering standards have significantly higher error estimation accuracy than those not equipped.
Finally, to comprehensively verify the stability and accuracy of the method, a confusion matrix of charging-pile error estimation under the benchmark scenario is constructed. According to the data in
Table 3, the overall identification accuracy of the method reaches 91.25%.
Based on the confusion matrix, the comprehensive evaluation indicators are shown in
Table 4. The precision is 60.00% and the recall is 90.00%, yielding an F1-score of 72.00%. The AUC-ROC, computed by varying the error threshold from 0% to 5%, is 0.943, indicating strong discriminative capability. The missed detection rate (FNR) is 10.00%, meaning that among the 10 actually out-of-tolerance piles, only 1 was missed. The false detection rate (FPR) is 8.57%. The workload reduction ratio is 81.25%.
5.3. Analysis of Results for Each Scenario
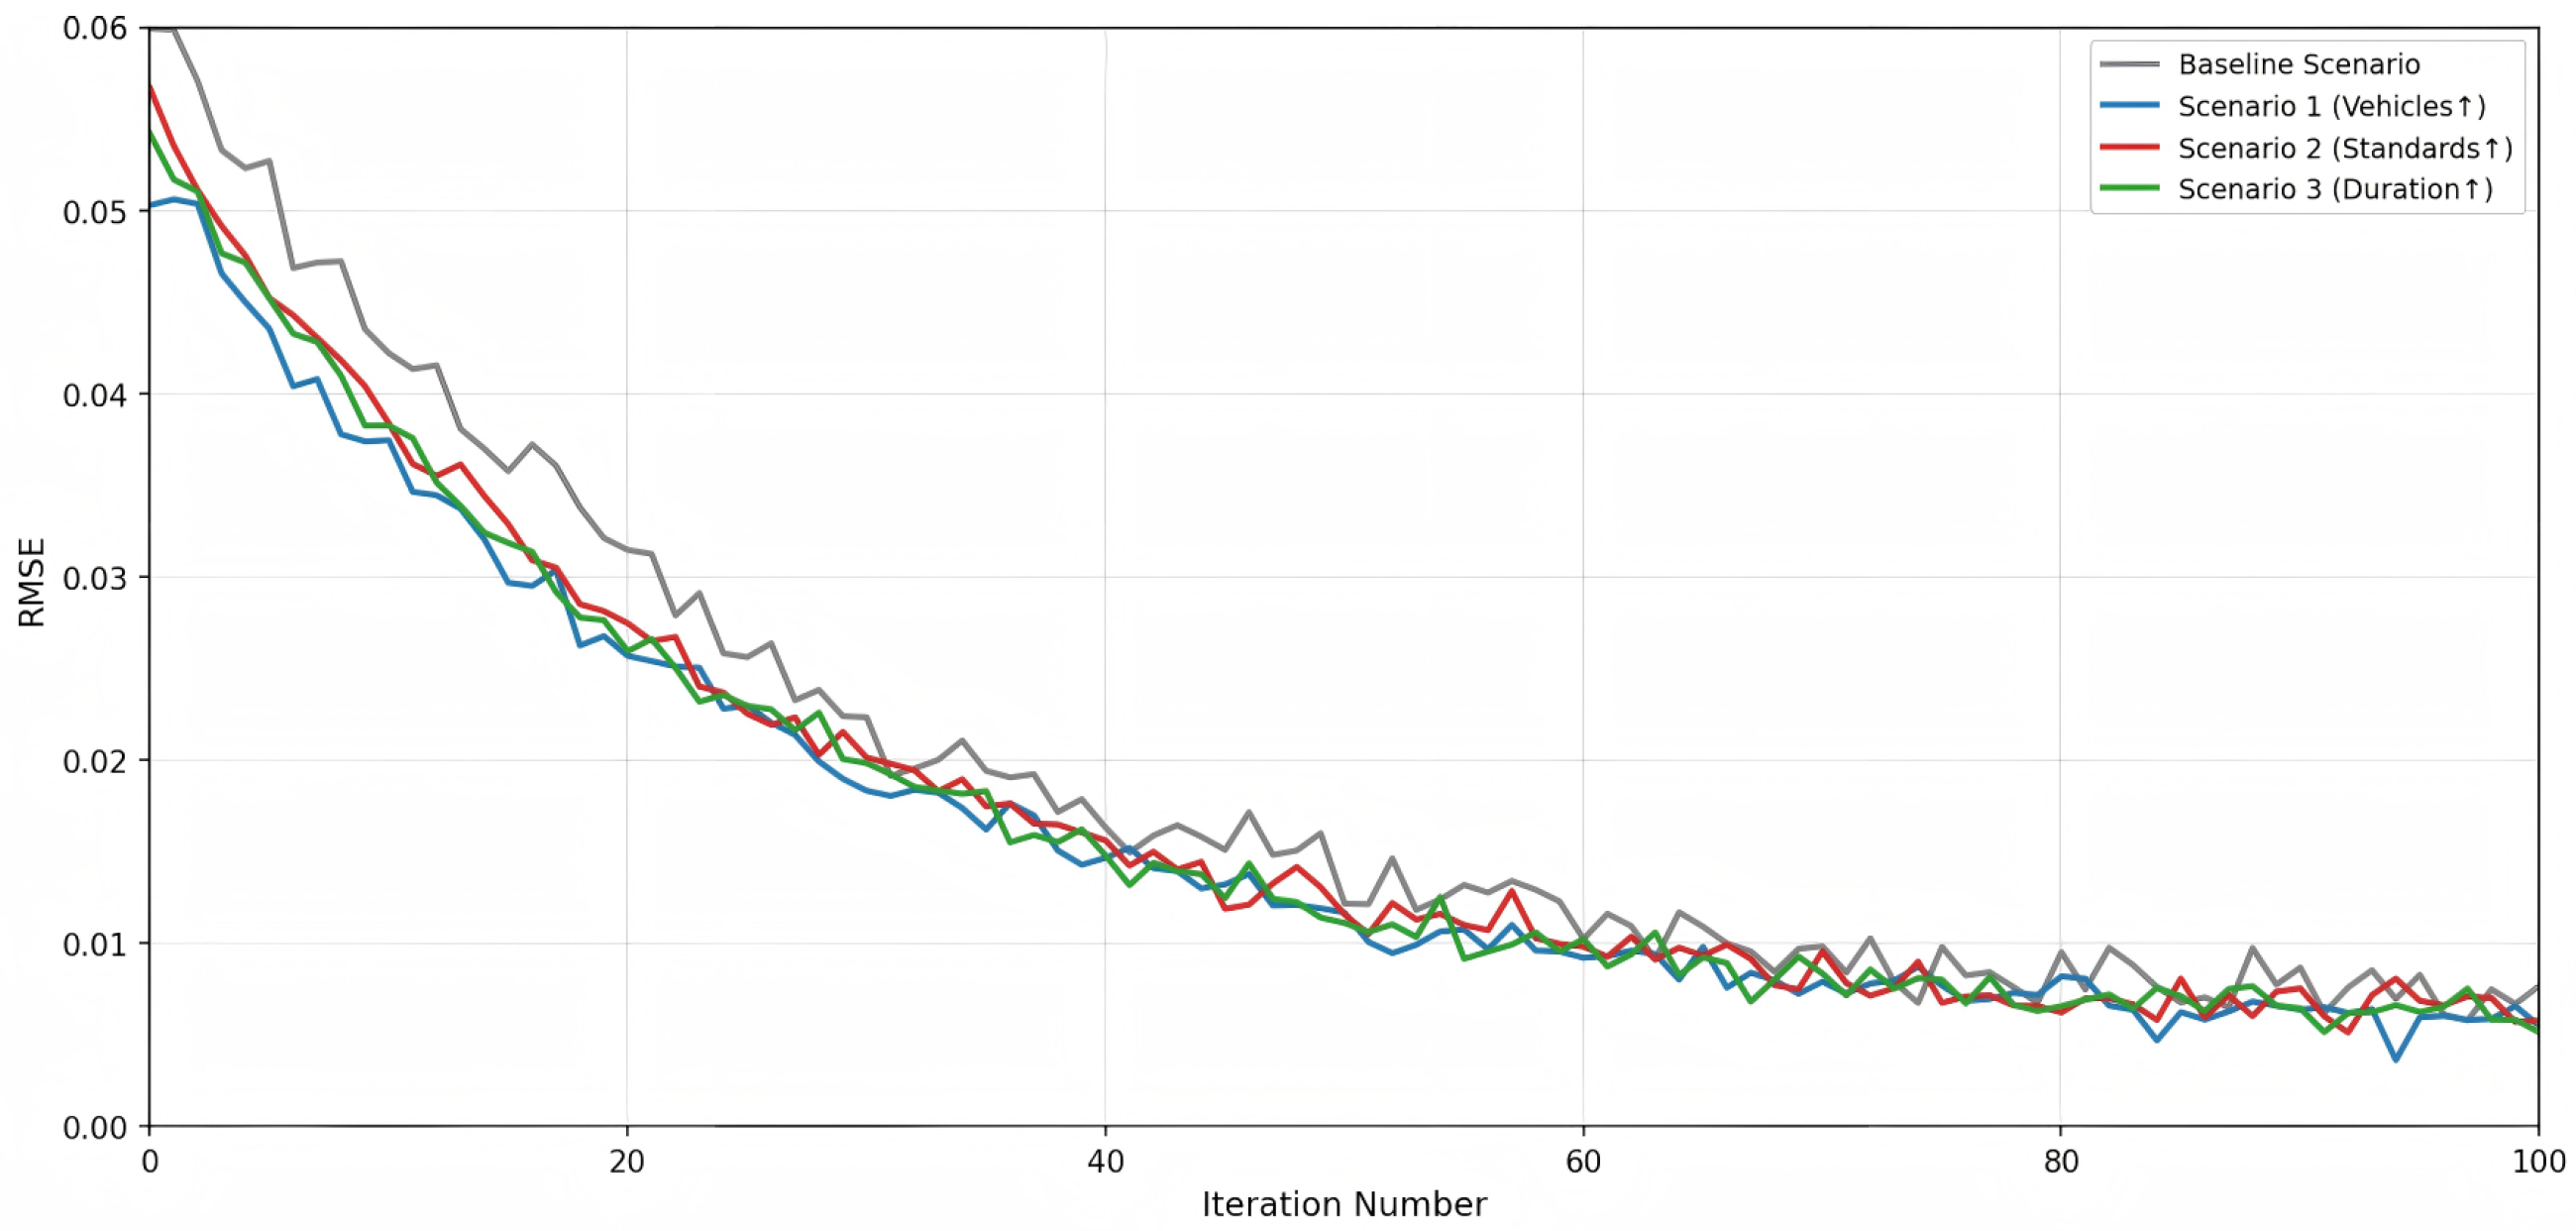
As shown in
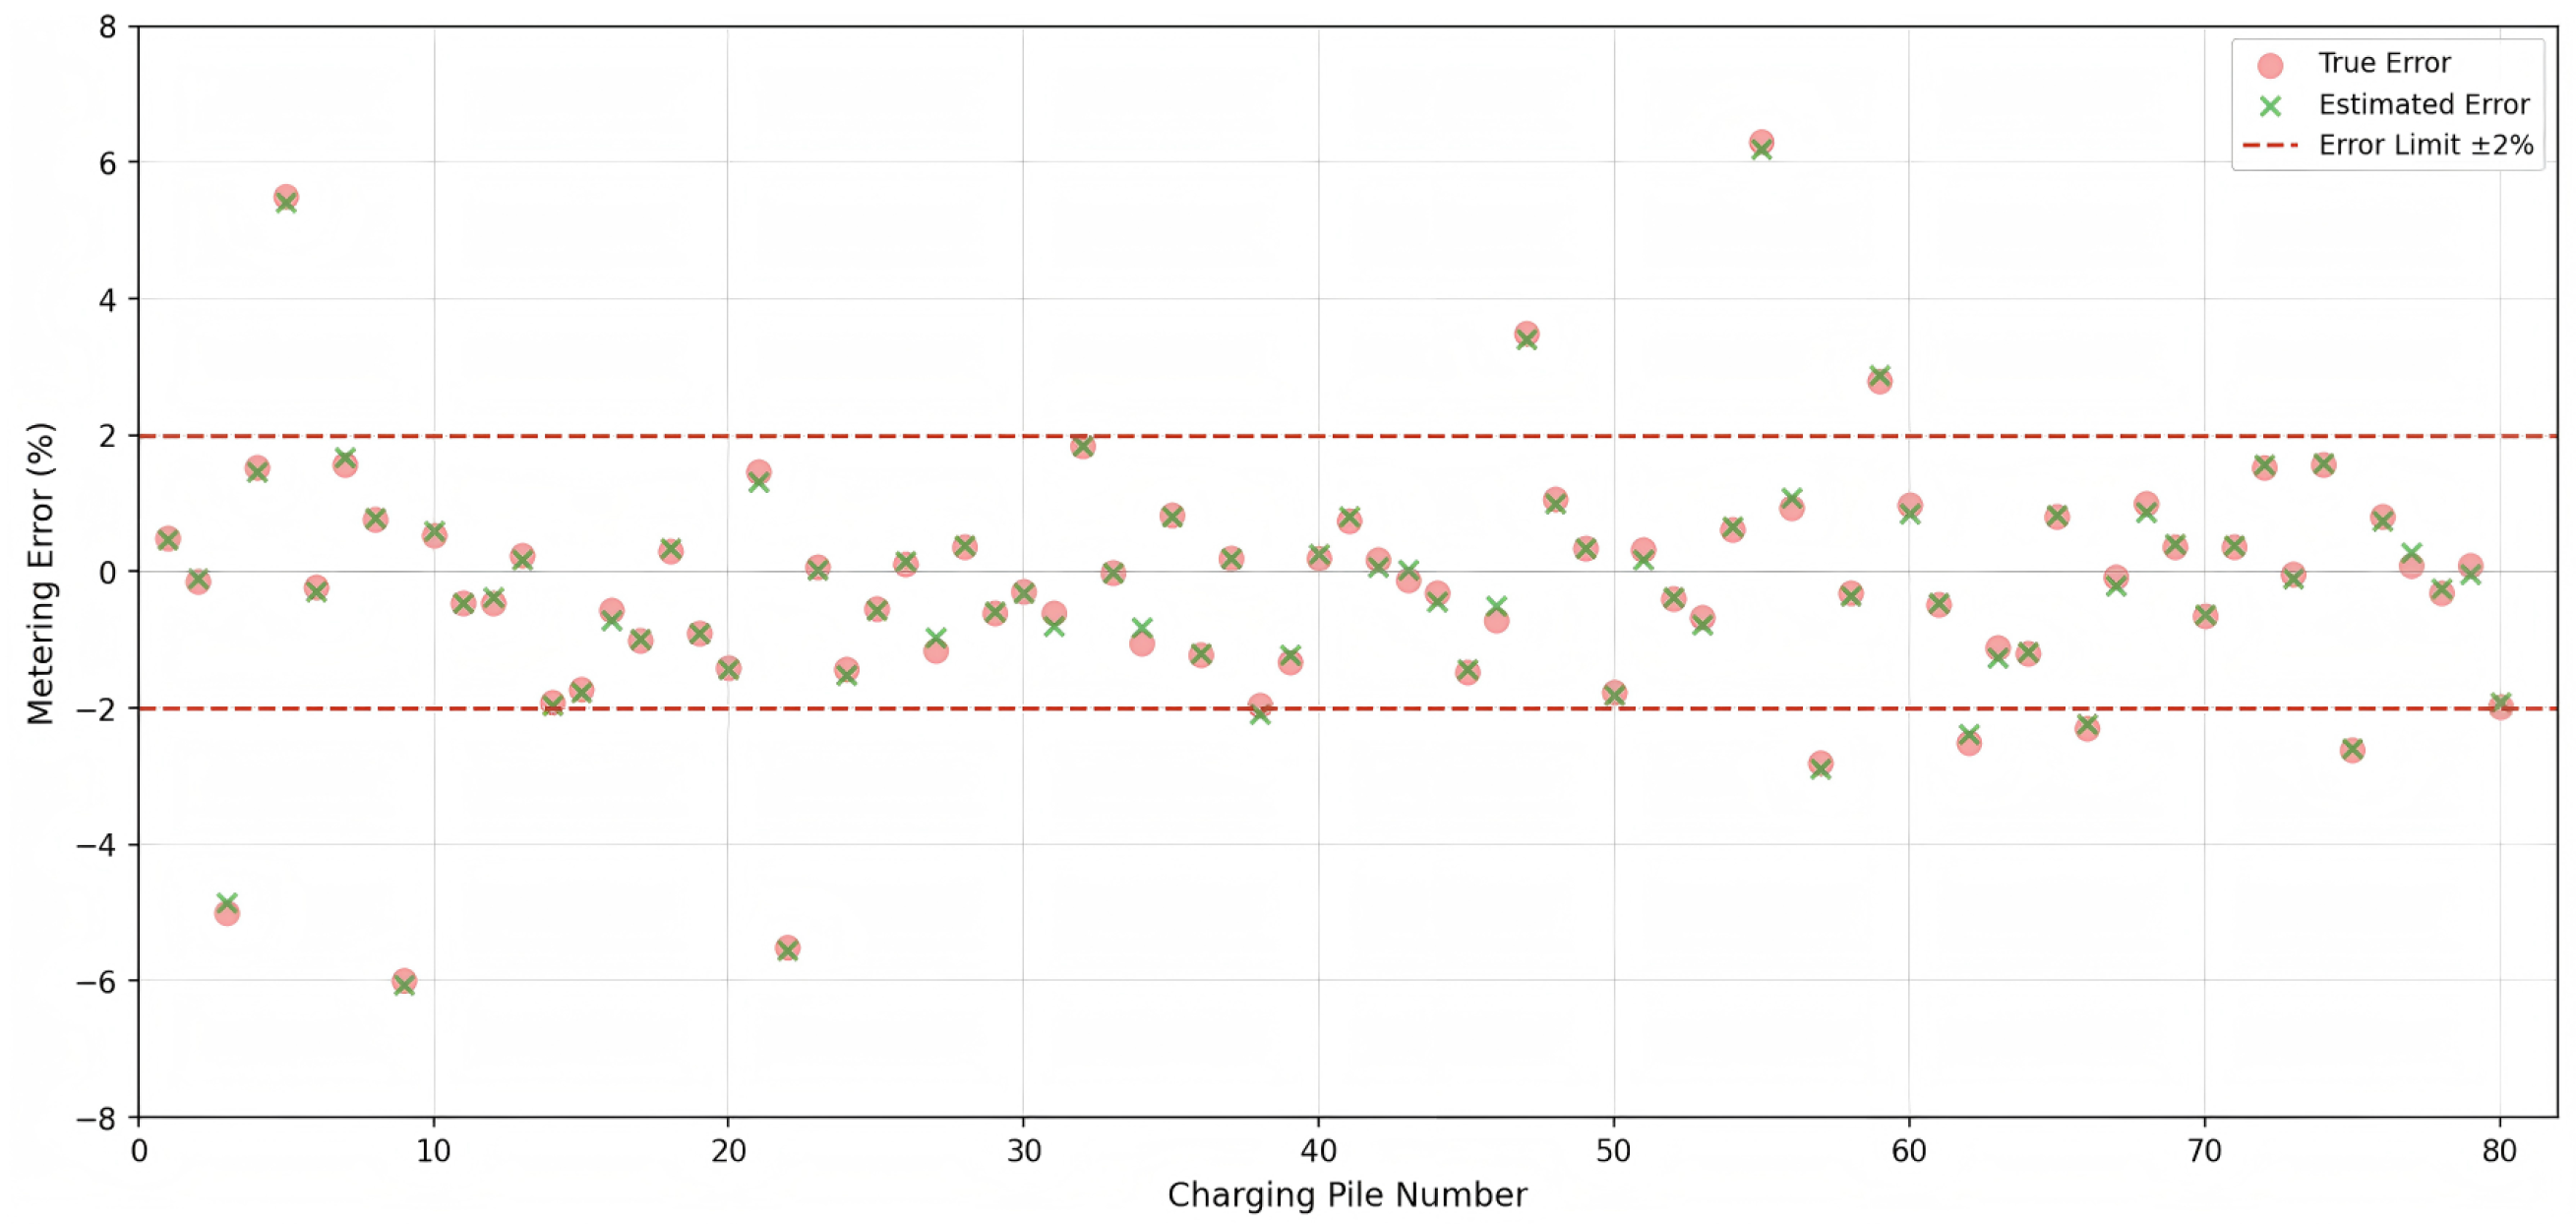
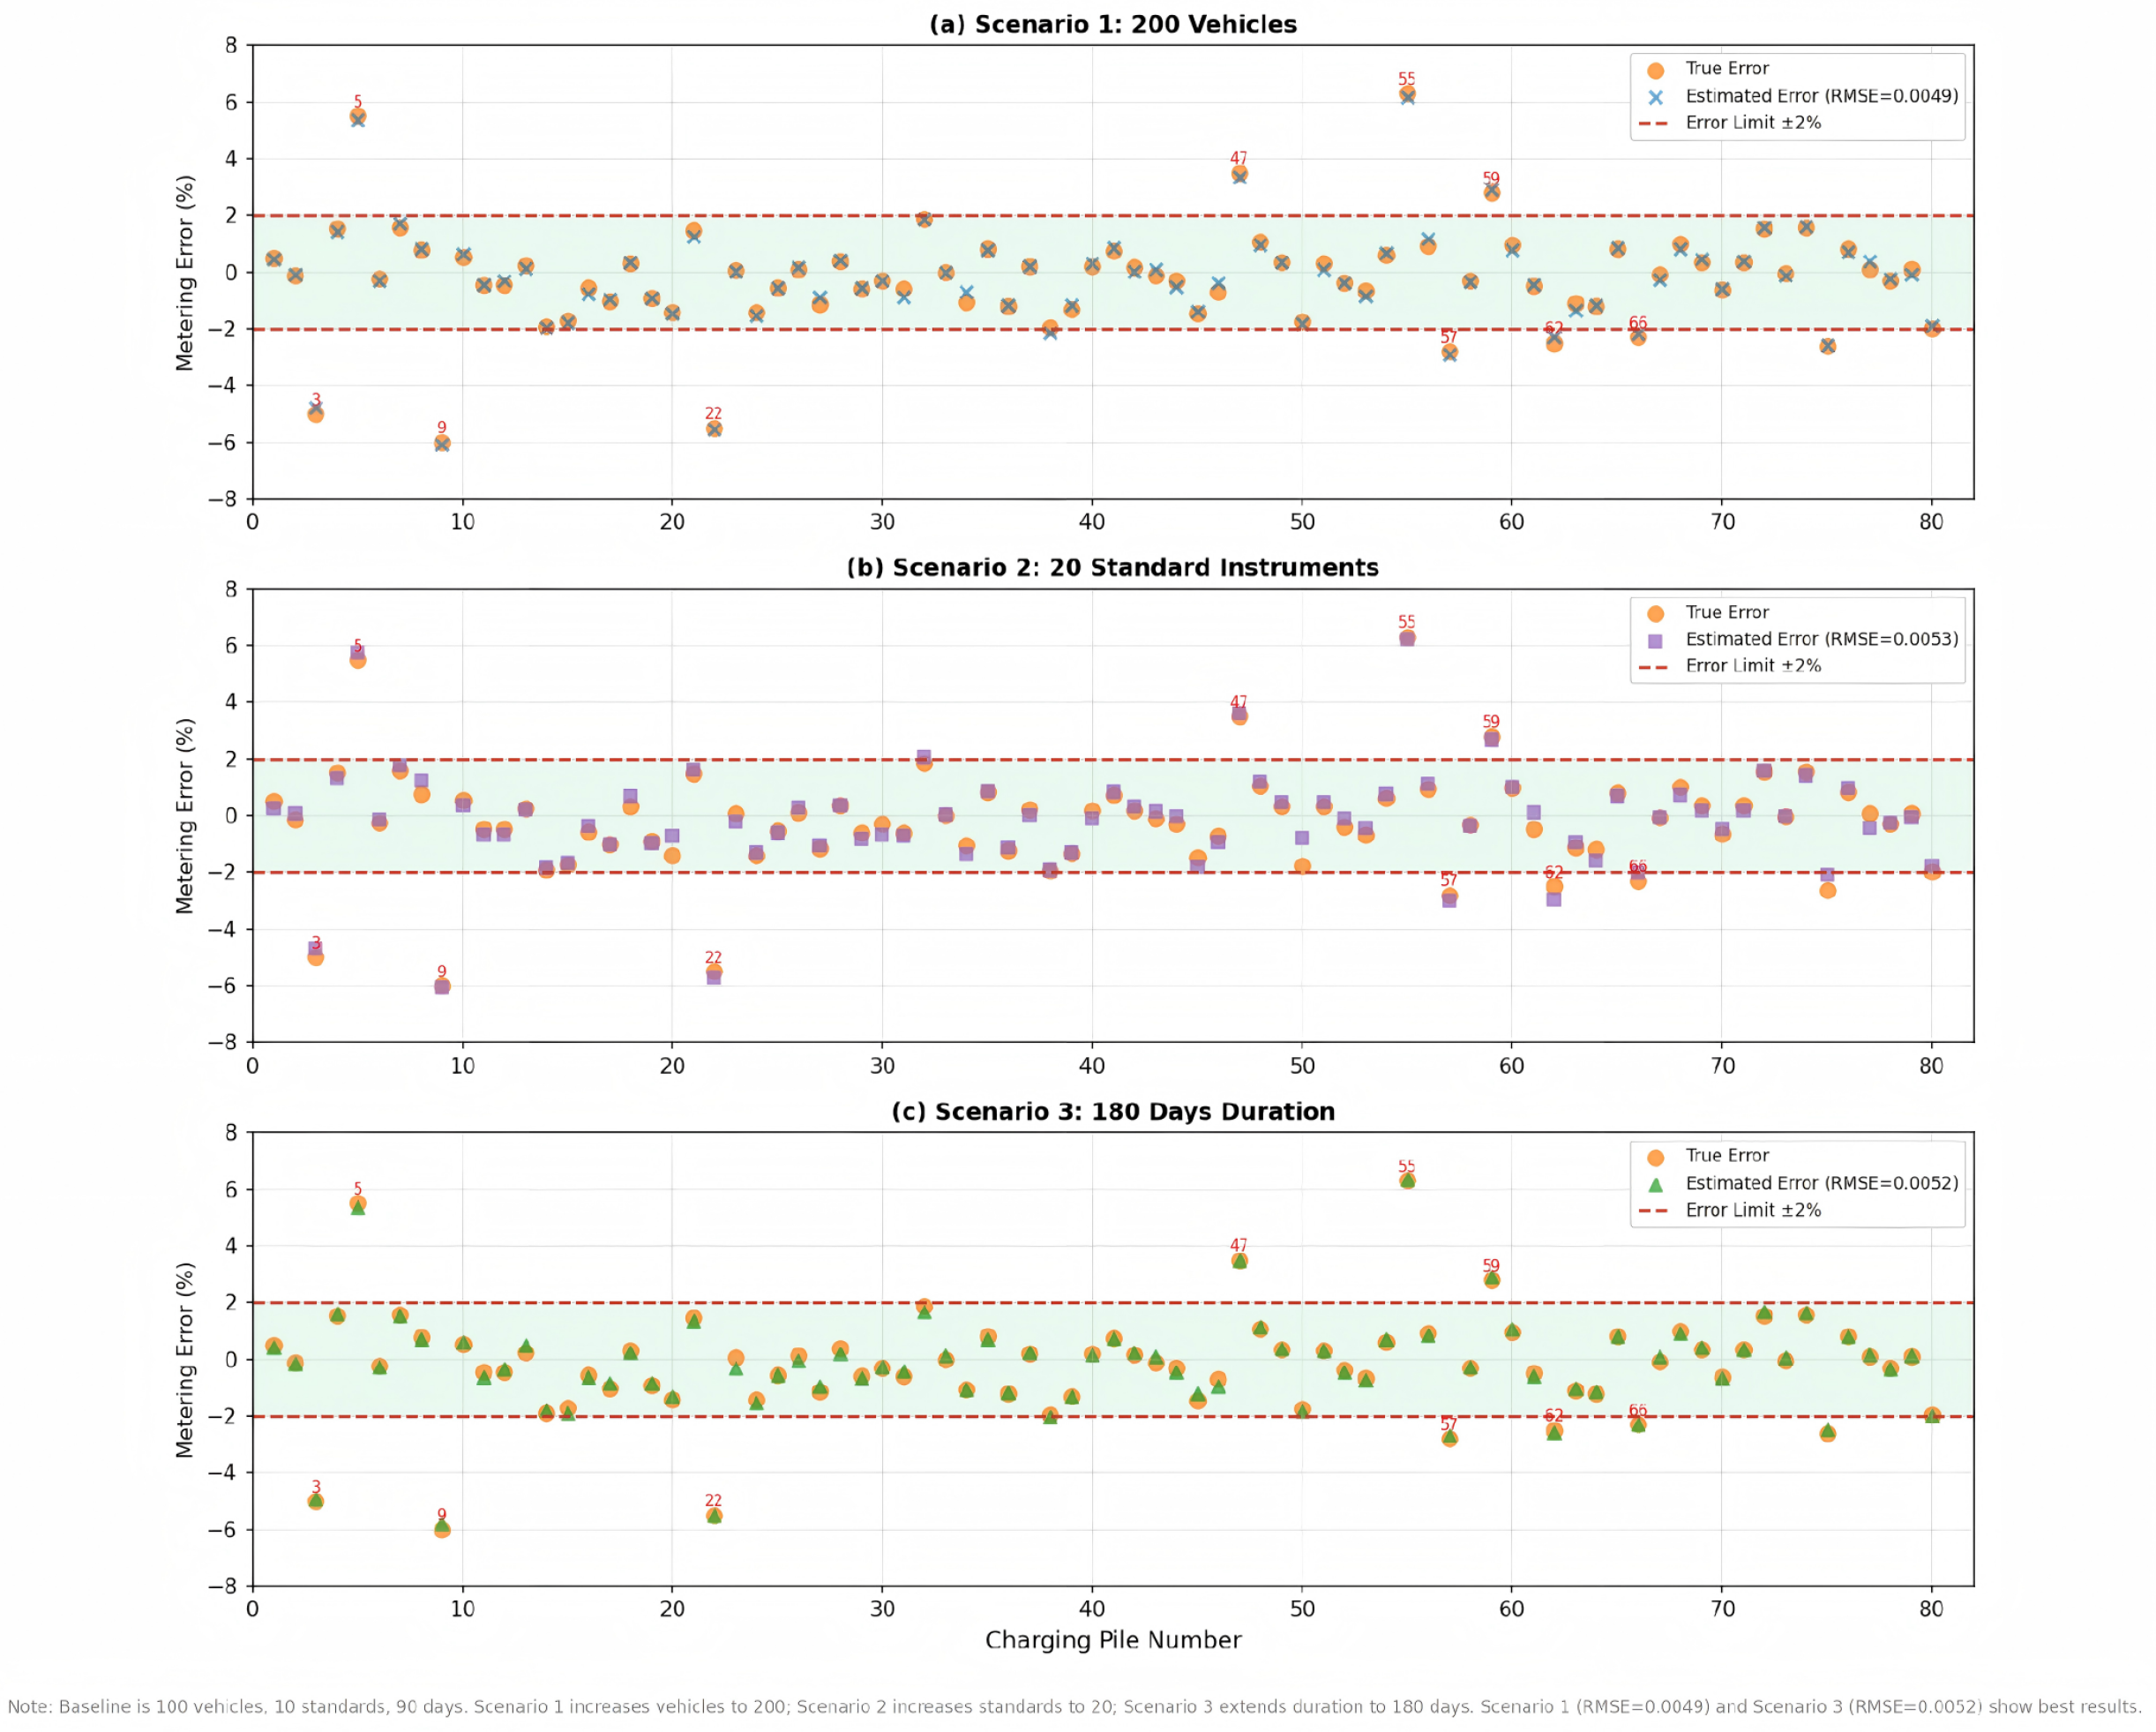
Figure 11, the RMSE variation curves of charging piles under different scenarios all show similar convergence characteristics. Among them, Scenario 1 performs best, with its final RMSE stabilizing at about 0.0049.
First, analyze Scenario 1 (
Figure 12). The results show that increasing the total number of electric vehicles can significantly improve the accuracy of charging-pile metering error estimation.
Next, examine Scenario 2 (
Figure 13). The results show that while maintaining the total number of electric vehicles at 100, increasing the number of metering standard configurations can also significantly improve charging-pile error estimation accuracy.
Finally, discuss Scenario 3 (
Figure 14). This scenario extends the statistical duration from 90 days to 180 days. The results show that charging-pile error estimation accuracy significantly improves.
The identification accuracy statistics are shown in
Table 5.
It is noted that the out-of-tolerance pile identification accuracy remains at 90.00% (
) across the Benchmark, Scenario 1, and Scenario 2 conditions. Investigation reveals that this is caused by one specific charging pile whose true metering error (approximately 2.1%) lies very close to the 2% identification threshold. Due to the borderline nature of this error, the algorithm consistently estimates its error slightly below the threshold regardless of data volume or standard device quantity. Only in Scenario 3, where the statistical duration is extended from 90 to 180 days, does the accumulated data sufficiently reduce the estimation uncertainty to correctly identify this borderline pile, raising the out-of-tolerance accuracy to 100%. The corresponding
values and out-of-tolerance accuracy under different scenarios are summarized in
Table 6.
5.4. Analysis of the Impact of Data Volume on Algorithm Performance
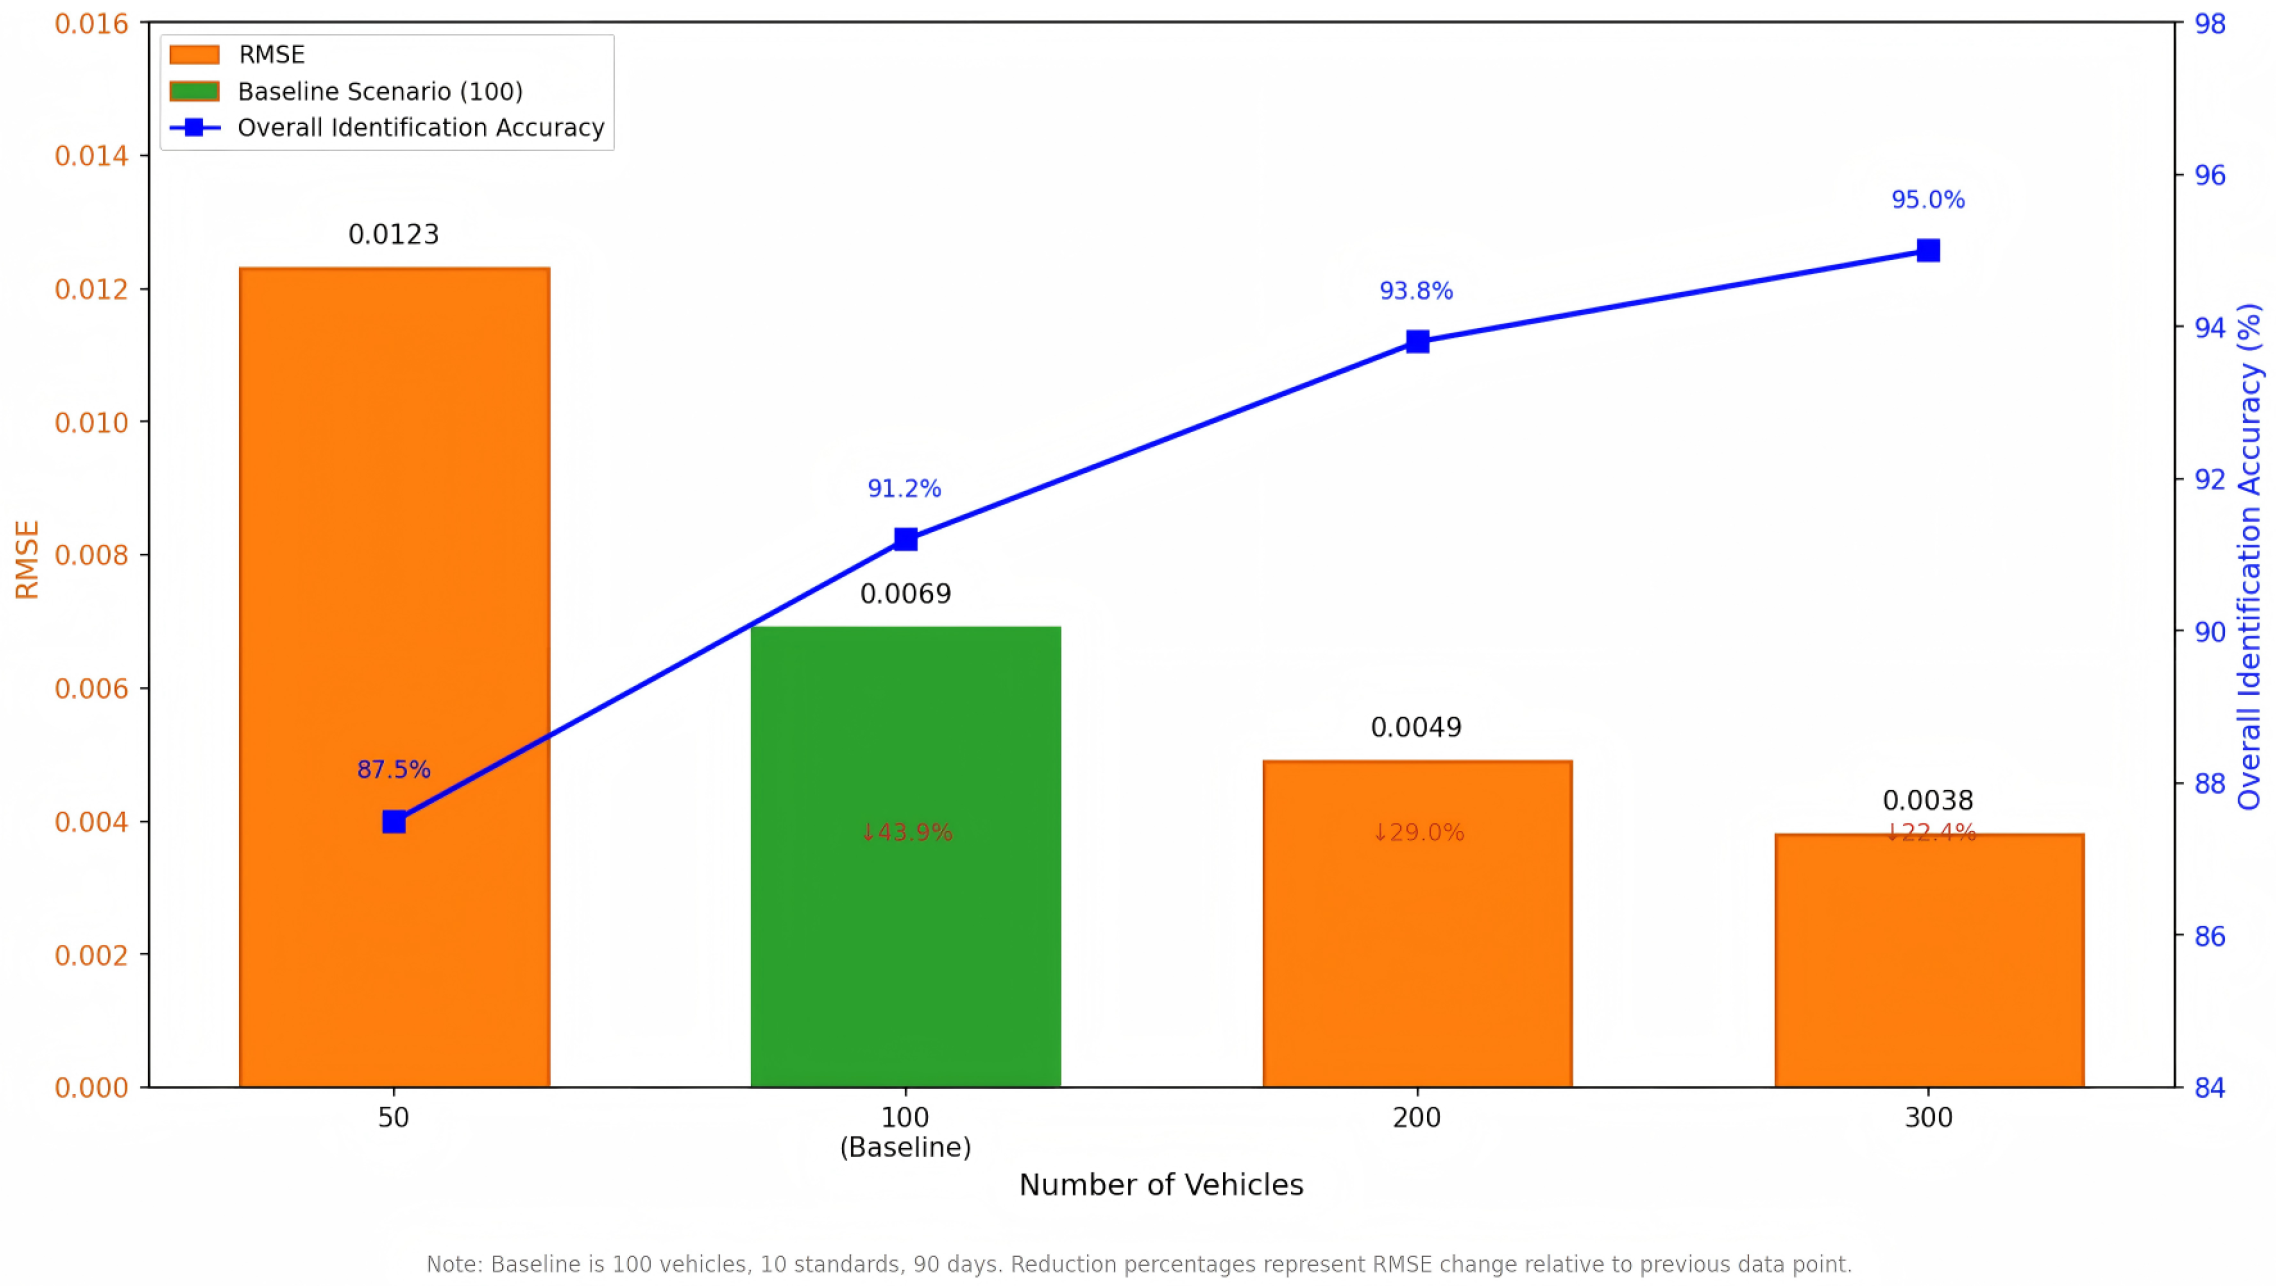
To verify the algorithm performance under different data richness, comparative analysis was conducted. As shown in
Figure 15, as the number of vehicles increases, the RMSE of charging-pile error estimation shows a clear downward trend.
To further quantify the influence of data volume on identification performance, the recognition accuracy metrics and
under different data volumes are summarized in
Table 7.
5.5. Analysis of the Impact of Data Distribution Unevenness on Algorithm Performance
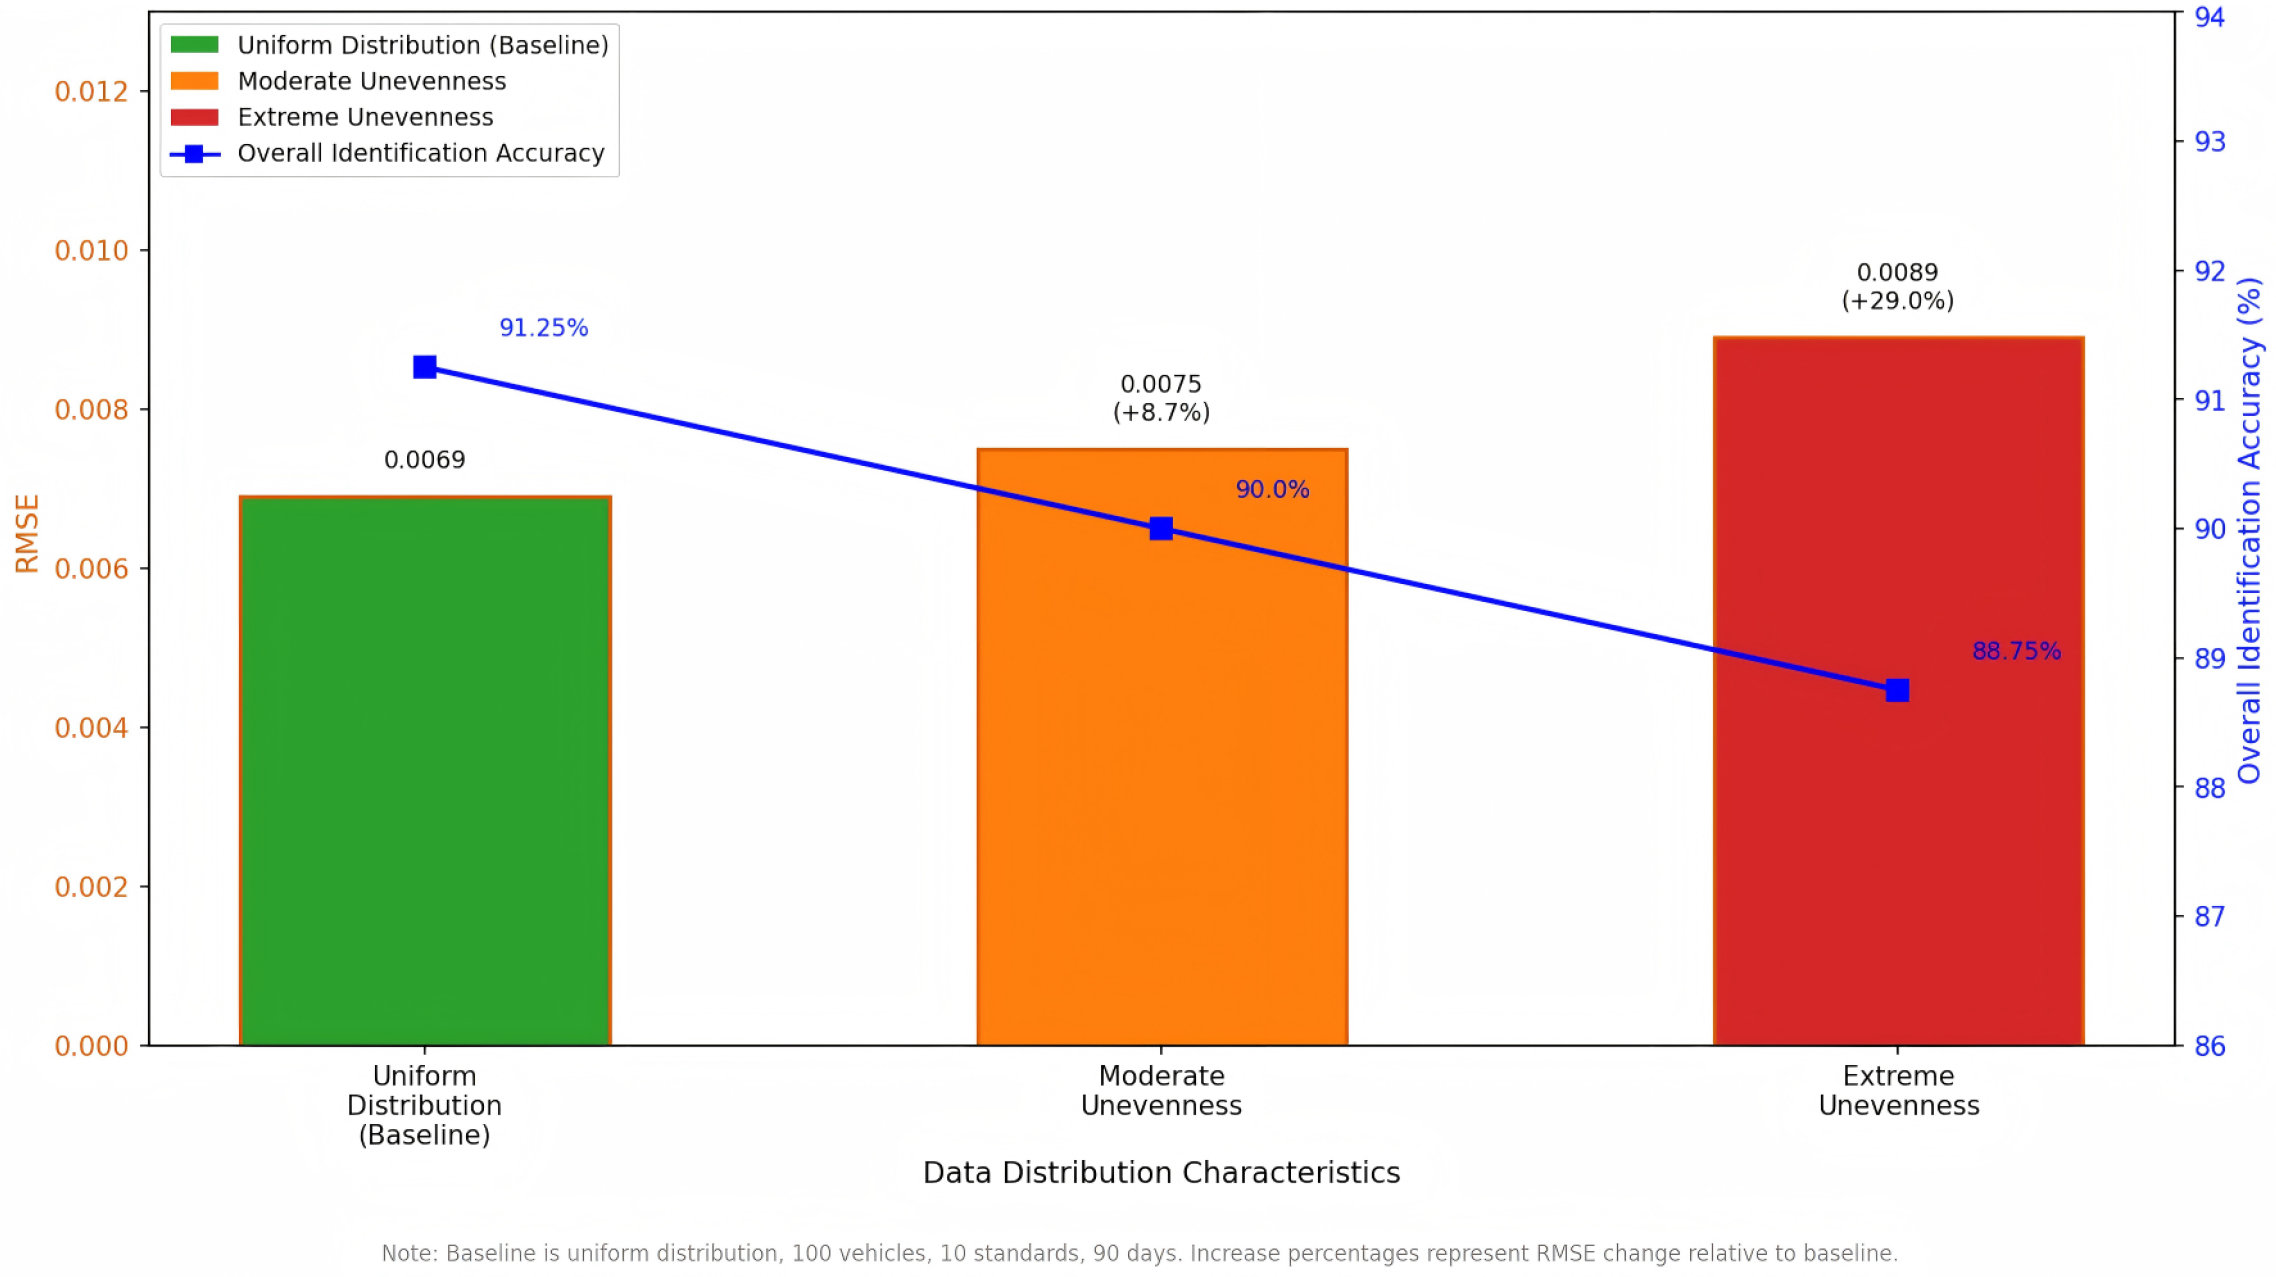
To verify the robustness of the algorithm under extremely uneven data distribution scenarios, comparative analysis was conducted. As shown in
Figure 16, under uneven data distribution, the algorithm’s RMSE increases slightly but can still maintain good estimation accuracy.
The corresponding recognition accuracy metrics and
under different data distribution characteristics are summarized in
Table 8.
5.6. System Scale Scalability Verification
To verify the scalability of the algorithm, comparative analysis was conducted on different system scales. As shown in
Figure 17, as the system scale expands, the algorithm’s RMSE basically remains stable without obvious performance degradation.
Furthermore,
Table 9 now reports actual convergence iterations rather than a capped value, confirming that all experiments achieved strict convergence well before the 500-iteration limit.
To further verify the consistency of key parameter settings across the algorithm description and the result tables,
Table 10 summarizes the corresponding values of
and
reported in
Section 3.3.4,
Table 2, and
Table 9.
5.7. Analysis of the Impact of Standard Device Quantity on Algorithm Performance
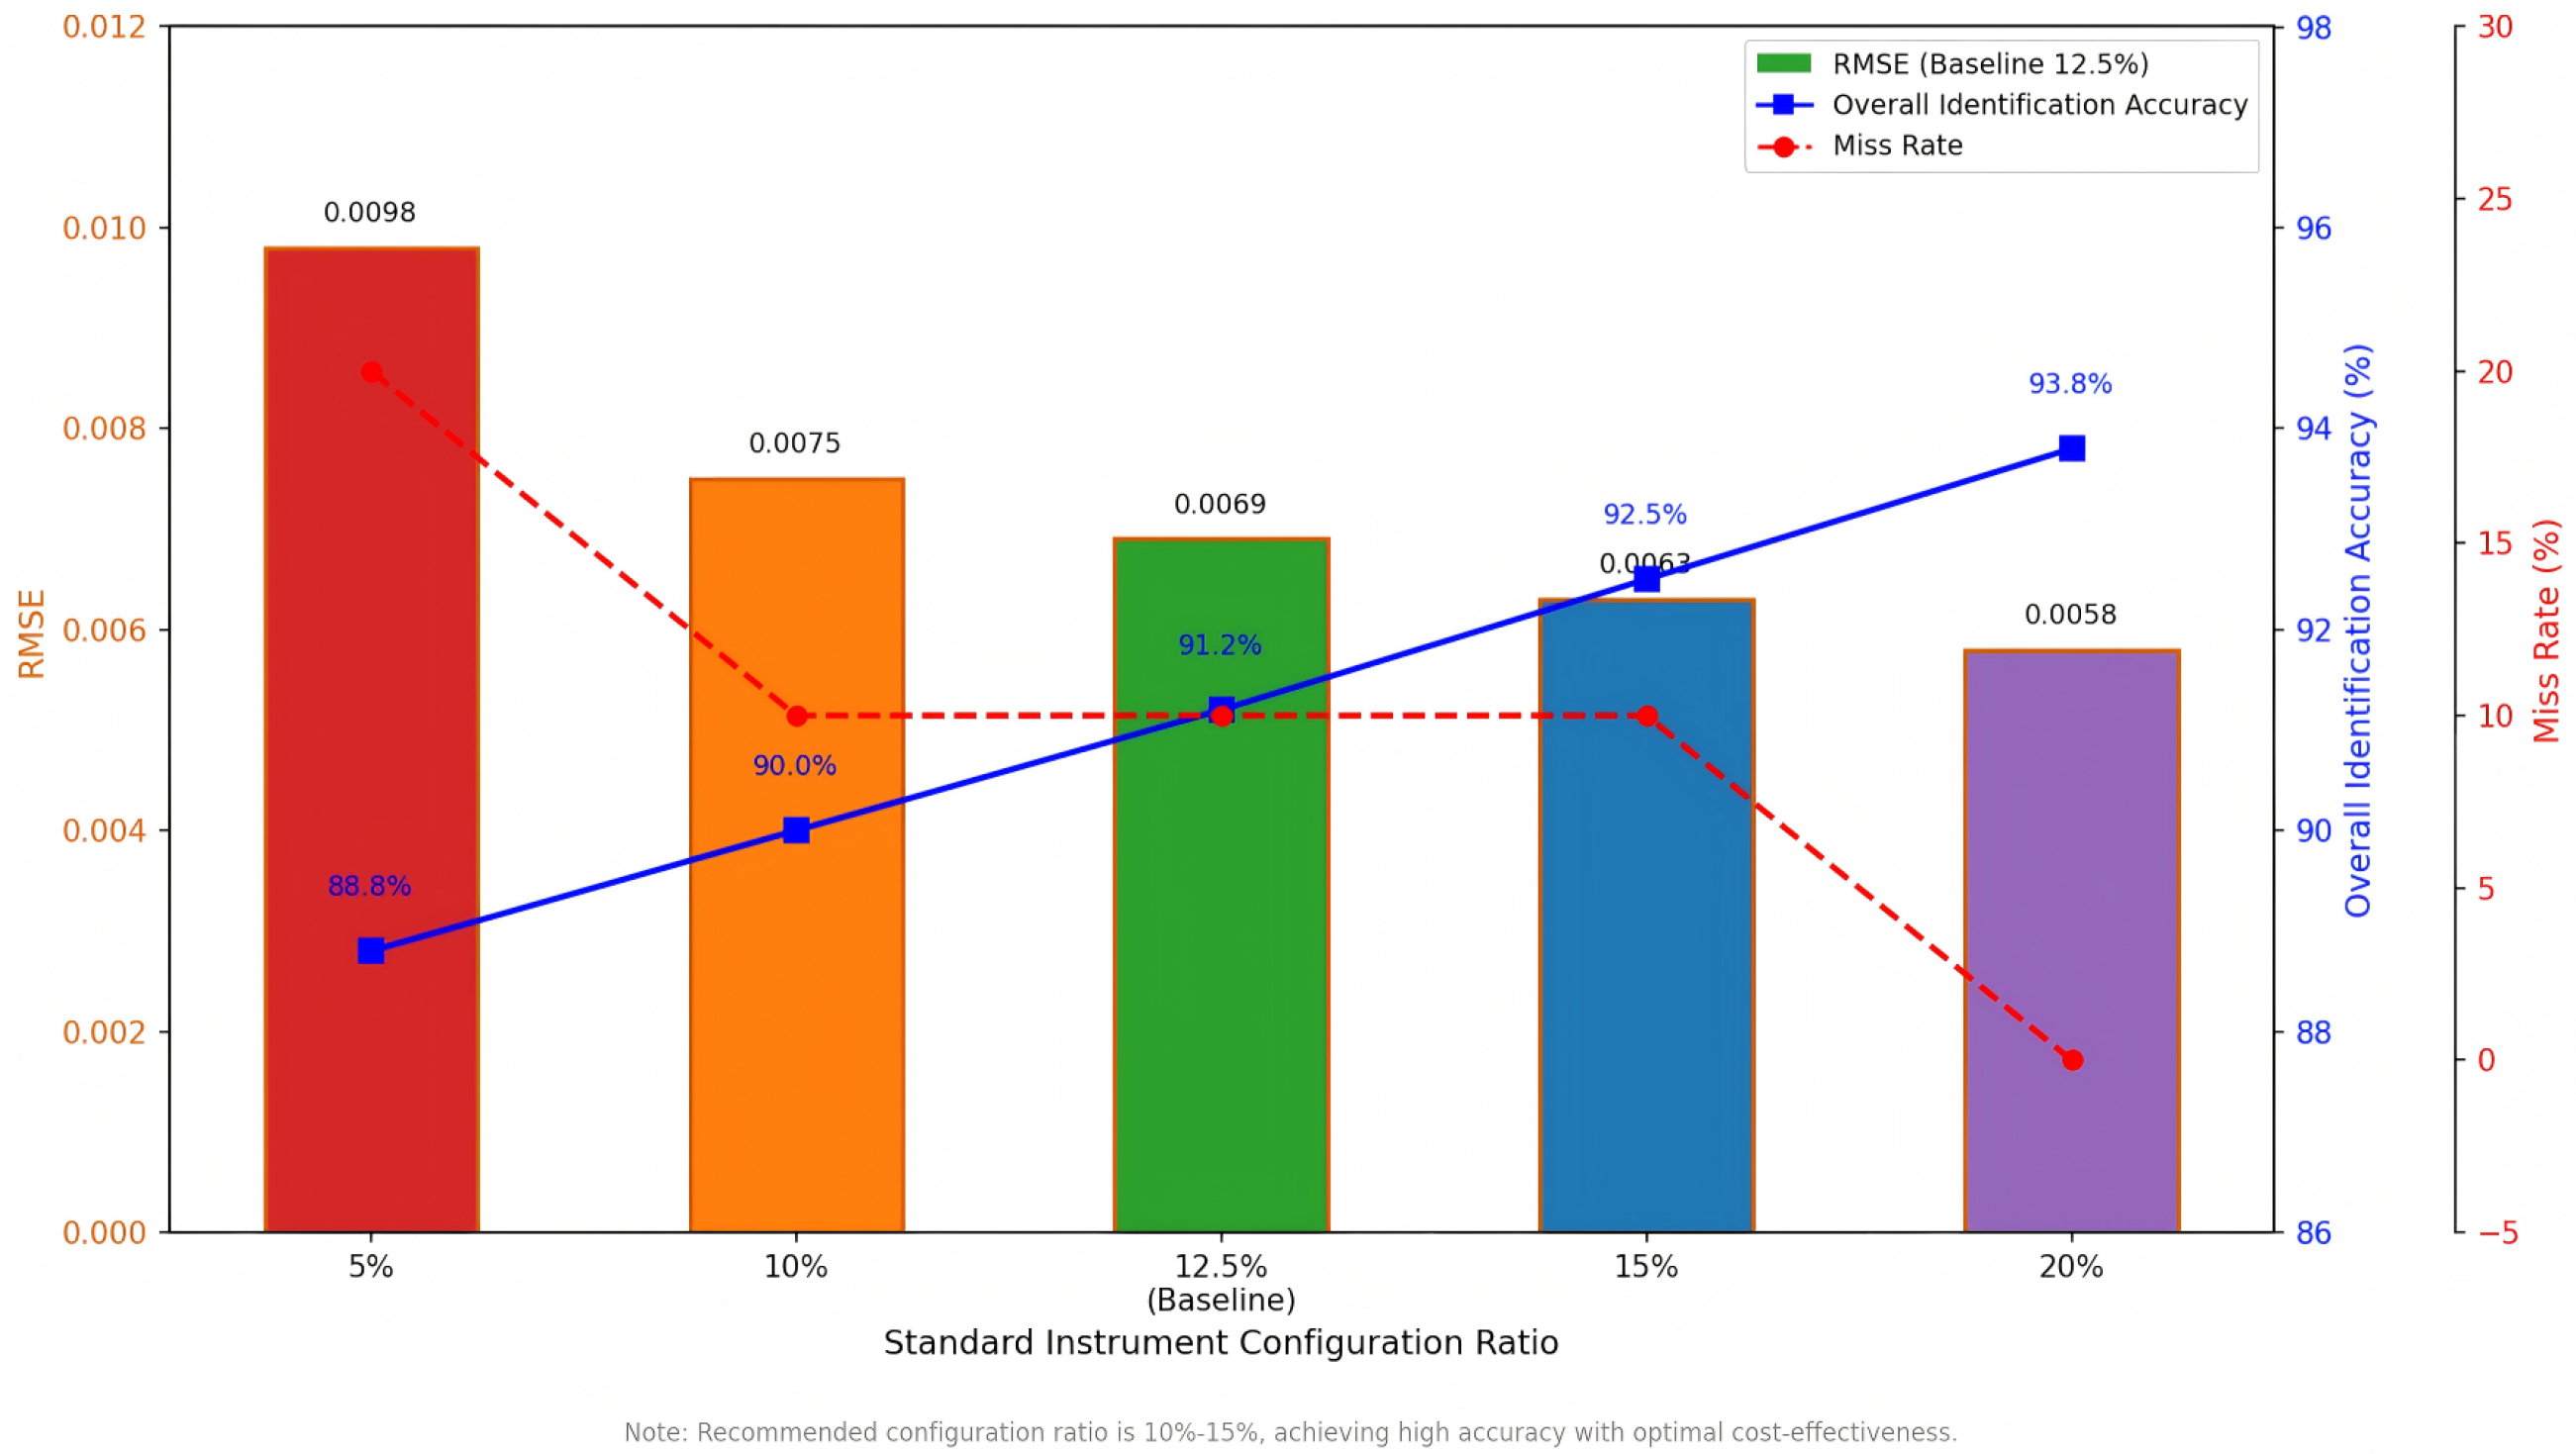
As shown in
Figure 18, as the standard device configuration quantity increases,
shows a downward trend, while the improvement in overall identification accuracy gradually tapers off. The corresponding performance indicators under different standard device configuration ratios are summarized in
Table 11.
6. Conclusions
Remote verification methods based on hardware modification are often limited by equipment cost and deployment difficulties, while data-driven verification methods that do not rely on hardware modification also have error estimation bias problems. To address the above problems, this paper utilizes the characteristic parameter data generated by electric vehicle charging behavior to design a multi-pile collaborative charging-pile metering error joint estimation method. Through multi-dimensional and multi-scenario simulation verification, this study draws the following conclusions:
The algorithm has good stability and robustness. Even under scenarios with small data volume (50 vehicles) or extremely uneven data distribution, the algorithm can still maintain an identification accuracy of over 87.50%, demonstrating good data sparsity robustness.
The influence patterns of key factors on algorithm performance are clear. Increasing the number of electric vehicles, increasing the number of standard metering devices, and extending the data statistical duration can all improve the estimation accuracy of the algorithm. When the number of vehicles increases from 50 to 300, RMSE decreases from 0.0123 to 0.0038, a decrease of 69.1%; when the statistical duration is extended from 90 days to 180 days, the identification accuracy increases to 92.50%.
The algorithm has good scalability. Through verification experiments expanding the system scale from 80 charging piles to 500 charging piles, results show that the algorithm can maintain identification accuracy above 90% under different scales, with an RMSE increase of only 4.3%, computational complexity approximately .
Data distribution unevenness has limited impact on algorithm performance. Under scenarios with extremely uneven data distribution (20% of charging stations bearing 80% of charging demand), the algorithm can still maintain an identification accuracy of 88.75%, only 2.5 percentage points lower than the uniform distribution scenario, indicating that the algorithm has a certain tolerance for uneven data distribution.
The algorithm shows good adaptability under different standard device quantities. Even when the number of standard devices is small (5%), the algorithm can still maintain an identification accuracy of 88.75%; when the number of standard devices reaches 10%, the algorithm has already achieved high estimation accuracy (RMSE < 0.007, identification accuracy >91%).
The method has broad practicality and adaptability. This method has strong scalability and practicality, and can achieve efficient error estimation and remote verification of charging piles when the number of charging piles is large and widely distributed.
Author Contributions
Conceptualization, X.H.; methodology, B.C.; software, Z.W.; validation, Z.G.; formal analysis, X.H. and Z.T.; investigation, Z.W.; resources, Z.G.; data curation, Z.G. and T.L.; writing—original draft preparation, Z.W.; writing—review and editing, X.H.; visualization, Z.T.; supervision, B.C.; project administration, B.C. All authors have read and agreed to the published version of the manuscript.
Funding
This research was funded by the Science and Technology Plan Project of the Guangxi Zhuang Autonomous Region Market Supervision Administration (Grant No. GXSJKJ2024-4) and the Guangxi Key Research and Development Program (“Empowerment” Action Plan) (Grant No. FN2600640444).
Institutional Review Board Statement
Not applicable.
Informed Consent Statement
Not applicable.
Data Availability Statement
The data presented in this study are available on request from the corresponding author.
Acknowledgments
The authors acknowledge the support received during the preparation of this manuscript.
Conflicts of Interest
Authors Ziqiang Tan and Tie Li were employed by the company Guangxi Power Grid Co., Ltd., China Southern Power Grid. The remaining authors declare that the research was conducted in the absence of any commercial or financial relationships that could be construed as a potential conflict of interest.
Abbreviations
The following abbreviations are used in this manuscript:
| ALS | Alternating Least Squares |
| EV | Electric Vehicle |
| FNR | False Negative Rate |
| FPR | False Positive Rate |
| RMSE | Root Mean Square Error |
| SOC | State of Charge |
| WRR | Workload Reduction Ratio |
| AUC-ROC | Area Under the Receiver Operating Characteristic Curve |
References
- Jiao, Z.; Li, K.; Meng, H.; Guo, Y.; Zhou, J.; Zhang, C.; Huang, Z. A methodology for lithium-ion battery state of health estimation using random constraints of state of charge. J. Energy Storage 2026, 154, 121349. [Google Scholar] [CrossRef]
- Jia, C.; Liu, W.; Chau, K.T.; He, H.; Zhou, J.; Niu, S. Passenger-aware reinforcement learning for efficient and robust energy management of fuel cell buses. eTransportation 2026, 27, 100537. [Google Scholar] [CrossRef]
- Lu, D.; Yi, F.; Hu, D.; Li, J.; Yang, Q.; Wang, J. Online optimization of energy management strategy for FCV control parameters considering dual power source lifespan decay synergy. Appl. Energy 2023, 348, 121516. [Google Scholar] [CrossRef]
- Xu, Z.L.; Li, Q.; Hu, H.L.; Li, H.; Li, D.Y.; Xiong, Q.Z. Development of DC energy meter verification device for electric vehicle charging piles. Electr. Meas. Instrum. 2011, 48, 65–69. [Google Scholar] [CrossRef]
- Chen, Z.; Li, F.; Xu, X.; Dong, X.; Wang, P.; Dai, Y. Research on Remote Calibration System of DC Metering Device for Electric Vehicle Charging Piles Based on Embedded. In Proceedings of the 2019 IEEE 3rd Information Technology, Networking, Electronic and Automation Control Conference (ITNEC), Chengdu, China, 15–17 March 2019. [Google Scholar] [CrossRef]
- Ji, H.G.; Zhou, L. Research on remote verification method for DC metering device of electric vehicle charging pile. Metrol. Test. Technol. 2017, 44, 69–71. [Google Scholar] [CrossRef]
- Wang, X.Y.; Li, H.L.; Song, Y.J.; Wu, L.R. Research on metering characteristics of DC charging pile remote detection system. Electr. Meas. Instrum. 2023, 60, 142–147. [Google Scholar] [CrossRef]
- Zhang, L.; He, H.Y. Analysis and experimental research on energy metering characteristics of charging pile verifier based on high-precision dynamic testing. Lab. Test. 2025, 41, 21–23. [Google Scholar]
- Miao, P.; Shao, H.M.; Cai, J.H.; Huang, H.T.; Xiao, Z.S. Electric vehicle charging pile verification system based on cloud platform. J. China Univ. Metrol. 2025, 36, 186–195. [Google Scholar]
- Chen, S.; Zhou, D.; Ye, J.; Zheng, W.; Fu, P. A New Calibration Approach for Charging Facilities for Electric Vehicles via Machine Learning. In Proceedings of the 2020 IEEE 5th International Conference on Advanced Information and Communication Technology (ICAICA), Dalian, China, 27–29 June 2020. [Google Scholar] [CrossRef]
- Chen, X.; Liu, X.L.; Chen, H.M.; Cheng, L.; Li, X.L.; Liu, J.G. Remote metering performance verification method for DC charging pile based on deep neural network. J. Hohai Univ. Natural Sci. 2023, 51, 119–125. [Google Scholar] [CrossRef]
- Jia, C.; He, H.; Zhou, J.; Li, K.; Li, J.; Wei, Z. A performance degradation prediction model for PEMFC based on bi-directional long short-term memory and multi-head self-attention mechanism. Int. J. Hydrogen Energy 2024, 60, 133–146. [Google Scholar] [CrossRef]
- Zhou, J.; Shu, X.; Zhang, J.; Yi, F.; Jia, C.; Zhang, C.; Kong, X.; Zhang, J.; Wu, G. A deep learning method based on CNN-BiGRU and attention mechanism for proton exchange membrane fuel cell performance degradation prediction. Int. J. Hydrogen Energy 2024, 94, 394–405. [Google Scholar] [CrossRef]
- Yi, F.; Shu, X.; Zhou, J.; Zhang, J.; Feng, C.; Gong, H.; Zhang, C.; Yu, W. Remaining useful life prediction of PEMFC based on matrix long short-term memory. Int. J. Hydrogen Energy 2025, 111, 228–237. [Google Scholar] [CrossRef]
- Yang, T.; Dang, Z.; Zhou, F.; Gao, B.; Lu, H. Remote Detection Method for Metering Inaccuracy of EV Charging Stations Based on Ridge Regression. IEEE Trans. Instrum. Meas. 2025, 74, 1010511. [Google Scholar] [CrossRef]
- Han, Z.T.; Zheng, H.Z.; Yuan, R.M. Research on Remote Verification Methods for Charging Piles by Virtual Standard Device. In Proceedings of the 2024 International Conference on Sensing, Measurement & Data Analytics in the Era of Artificial Intelligence (ICSMD), Huangshan, China, 31 October–3 November 2024. [Google Scholar] [CrossRef]
- Li, L.; Jiang, W.L.; Liang, J.C. Analysis of common problems in AC charging pile metering verification. Brand Stand. 2025, 4, 247–249. [Google Scholar]
- Shi, Y.X.; Wang, G.C. Innovative charging pile metering supervision model to help Hainan’s new energy vehicle strategy development. China Metrol. 2025, 3, 55–58, 78. [Google Scholar]
- Liu, R. Multi-dimensional analysis and practical coping strategies for electric vehicle charging pile verification errors. Metrol. Test. Technol. 2025, 51, 82–85. [Google Scholar]
- Yang, T.; Yu, J.; Pen, H.; Zhou, F.; Gao, B.; Lu, H. Remote Metrological Verification Method for Electric Vehicle Off-Board Chargers Based on the SIS Infectious Disease Model in a Vehicle-Pile Interaction Network. IEEE Trans. Instrum. Meas. 2025, 74, 1500711. [Google Scholar] [CrossRef]
- Sunderman, W.G.; Dugan, R.C.; Dorr, D.S. The neutral-to-earth voltage (NEV) test case and distribution system analysis. In Proceedings of the IEEE Power Engineering Society General Meeting; IEEE: New York, NY, USA, 2008; pp. 1–6. [Google Scholar]
- Zachariah, D.; Sundin, M.; Jansson, M.; Chatterjee, S. Alternating Least-Squares for Low-Rank Matrix Reconstruction. IEEE Signal Process. Lett. 2012, 19, 231–234. [Google Scholar] [CrossRef]
Figure 2.
Flowchart of the ALS joint estimation algorithm, where the superscript * denotes the updated estimate of the corresponding variable at each iteration.
Figure 2.
Flowchart of the ALS joint estimation algorithm, where the superscript * denotes the updated estimate of the corresponding variable at each iteration.
Figure 3.
Spatial distribution of charging stations and charging pile configuration.
Figure 3.
Spatial distribution of charging stations and charging pile configuration.
Figure 4.
Distribution of charging-pile metering errors.
Figure 4.
Distribution of charging-pile metering errors.
Figure 5.
Histogram of charging-pile error distribution (error limit: ±2%).
Figure 5.
Histogram of charging-pile error distribution (error limit: ±2%).
Figure 6.
Charging demand of private cars.
Figure 6.
Charging demand of private cars.
Figure 7.
Taxi charging demand.
Figure 7.
Taxi charging demand.
Figure 8.
Loss function descent curve.
Figure 8.
Loss function descent curve.
Figure 9.
RMSE variation of charging piles.
Figure 9.
RMSE variation of charging piles.
Figure 10.
Charging pile metering error estimation results.
Figure 10.
Charging pile metering error estimation results.
Figure 11.
RMSE variation curves of charging piles in each scenario.
Figure 11.
RMSE variation curves of charging piles in each scenario.
Figure 12.
Scenario 1: charging-pile metering error estimation results (increased vehicle number).
Figure 12.
Scenario 1: charging-pile metering error estimation results (increased vehicle number).
Figure 13.
Scenario 2: charging-pile metering error estimation results (20 standard instruments).
Figure 13.
Scenario 2: charging-pile metering error estimation results (20 standard instruments).
Figure 14.
Scenario 3: charging-pile metering error estimation results (180 days duration).
Figure 14.
Scenario 3: charging-pile metering error estimation results (180 days duration).
Figure 15.
RMSE comparison under different vehicle numbers.
Figure 15.
RMSE comparison under different vehicle numbers.
Figure 16.
RMSE comparison under different data distributions.
Figure 16.
RMSE comparison under different data distributions.
Figure 17.
RMSE comparison under different system scales.
Figure 17.
RMSE comparison under different system scales.
Figure 18.
RMSE comparison under different standard device configuration quantities.
Figure 18.
RMSE comparison under different standard device configuration quantities.
Table 1.
Proportions and parameters of each type of vehicle.
Table 1.
Proportions and parameters of each type of vehicle.
| Category | Vehicle Type | Battery Capacity (kWh) | Proportion |
|---|
| Private Car | Type 1 | 78.4 | 30% |
| Private Car | Type 2 | 62.5 | 30% |
| Taxi | Type 3 | 57.6 | 40% |
Table 2.
Model parameter settings.
Table 2.
Model parameter settings.
| Parameter Name | Value | Parameter Name | Value |
|---|
| 0.01 | | 500 |
| 0.1 | | 0.002 |
| 0.05 | | 0.5 |
| | | 1.0 |
Table 3.
Confusion matrix of charging-pile error estimation in the benchmark scenario.
Table 3.
Confusion matrix of charging-pile error estimation in the benchmark scenario.
| True Value | Estimated Value |
|---|
| Normal | Out-of-Tolerance |
|---|
| Normal | 64 (TN) | 6 (FP) |
| Out-of-tolerance | 1 (FN) | 9 (TP) |
Table 4.
Comprehensive evaluation indicators of anomaly identification in the benchmark scenario.
Table 4.
Comprehensive evaluation indicators of anomaly identification in the benchmark scenario.
| Evaluation Indicator | Value | Description |
|---|
| Overall Identification Accuracy | 91.25% | (64 + 9)/(64 + 6 + 1 + 9) |
| Precision | 60.00% | 9/(9 + 6) = 9/15 |
| Recall | 90.00% | 9/(9 + 1) = 9/10 |
| F1-score | 72.00% | 2 × 0.60 × 0.90/(0.60 + 0.90) |
| AUC-ROC | 0.943 | Computed by varying threshold from 0% to 5% |
| Missed Detection Rate (FNR) | 10.00% | 1/(9 + 1) = 1/10 |
| False Detection Rate (FPR) | 8.57% | 6/(64 + 6) = 6/70 |
| Workload Reduction Ratio (WRR) | 81.25% | ()/80 |
Table 5.
Statistics of identification accuracy for each scenario.
Table 5.
Statistics of identification accuracy for each scenario.
| Scenario | Normal Pile Identification Accuracy | Out-of-Tolerance Pile Identification Accuracy | Overall Identification Accuracy | Precision | Recall | F1-Score |
|---|
| Benchmark | 91.43% | 90.00% | 91.25% | 60.00% | 90.00% | 72.00% |
| Scenario 1 | 94.29% | 90.00% | 93.75% | 69.23% | 90.00% | 78.26% |
| Scenario 2 | 92.86% | 90.00% | 92.50% | 64.29% | 90.00% | 75.00% |
| Scenario 3 | 91.43% | 100.00% | 92.50% | 62.50% | 100.00% | 76.92% |
Table 6.
Summary of FN and out-of-tolerance accuracy under different scenarios.
Table 6.
Summary of FN and out-of-tolerance accuracy under different scenarios.
| Scenario | FN | Out-of-Tolerance Accuracy | Key Variable Changed |
|---|
| Benchmark | 1 | 90.00% | — |
| Scenario 1 (200 vehicles) | 1 | 90.00% | Data volume |
| Scenario 2 (more standards) | 1 | 90.00% | Standard devices |
| Scenario 3 (180 days) | 0 | 100.00% | Observation duration |
Table 7.
Recognition accuracy and under different data volumes.
Table 7.
Recognition accuracy and under different data volumes.
| Number of Vehicles | Normal Pile Identification Accuracy | Out-of-Tolerance Pile Identification Accuracy | Overall Identification Accuracy | Precision | Recall | F1-Score | |
|---|
| 50 | 85.71% | 90.00% | 87.50% | 47.37% | 90.00% | 62.07% | 0.0123 |
| 100 | 91.43% | 90.00% | 91.25% | 60.00% | 90.00% | 72.00% | 0.0069 |
| 200 | 94.29% | 90.00% | 93.75% | 69.23% | 90.00% | 78.26% | 0.0049 |
| 300 | 95.71% | 90.00% | 95.00% | 75.00% | 90.00% | 81.82% | 0.0038 |
Table 8.
Recognition accuracy and under different data distributions.
Table 8.
Recognition accuracy and under different data distributions.
| Data Distribution Characteristic | Normal Pile Identification Accuracy | Out-of-Tolerance Pile Identification Accuracy | Overall Identification Accuracy | Precision | Recall | F1-Score | |
|---|
| Uniform Distribution | 91.43% | 90.00% | 91.25% | 60.00% | 90.00% | 72.00% | 0.0069 |
| Moderately Uneven | 90.00% | 90.00% | 90.00% | 56.25% | 90.00% | 69.23% | 0.0075 |
| Extremely Uneven | 88.57% | 90.00% | 88.75% | 52.94% | 90.00% | 66.67% | 0.0089 |
Table 9.
Performance indicators under different system scales.
Table 9.
Performance indicators under different system scales.
| Piles | | Accuracy | Iter. Time (s) | Total Time (s) | Convergence Iter. |
|---|
| 80 | 0.0069 | 91.25% | 0.15 | 38 | 253 |
| 200 | 0.0071 | 91.00% | 0.32 | 85 | 267 |
| 500 | 0.0072 | 90.40% | 0.68 | 192 | 283 |
Table 10.
Unified parameter settings in the algorithm description and tables.
Table 10.
Unified parameter settings in the algorithm description and tables.
Table 11.
Performance indicators under different standard device configuration ratios.
Table 11.
Performance indicators under different standard device configuration ratios.
| Configuration Ratio | | Overall Identification Accuracy | Number of Standard Devices |
|---|
| 5% | 0.0098 | 88.75% | 4 |
| 10% | 0.0069 | 91.25% | 8 |
| 15% | 0.0058 | 92.50% | 12 |
| 20% | 0.0052 | 93.75% | 16 |
| Disclaimer/Publisher’s Note: The statements, opinions and data contained in all publications are solely those of the individual author(s) and contributor(s) and not of MDPI and/or the editor(s). MDPI and/or the editor(s) disclaim responsibility for any injury to people or property resulting from any ideas, methods, instructions or products referred to in the content. |