


Abstract
The European Union aims to achieve climate neutrality by 2050, with biogas and biomethane expected to play an increasingly important role in the decarbonisation of the energy system. This study investigates the economic and social determinants shaping the development of biogas production in European countries and identifies an optimal investment strategy for new biogas plants under varying environmental conditions. An expert–mathematical method was applied to assess and hierarchise twenty economic and social factors influencing biogas production, based on evaluations provided by 71 experts from eleven European countries. Subsequently, individual choice criteria derived from game theory were used to determine the optimal strategy for biogas plant construction under conditions of uncertainty. The results indicate that six determinants—EU-level production support mechanisms, investment costs, national support instruments, process efficiency improvements, community involvement, and agricultural raw material prices—account for 52.9% of the total impact on biogas development potential. Among the analysed investment options, large-scale biogas plants with an installed capacity of 3 MW were identified as the optimal strategy, offering the lowest unit production costs and the lowest risk of cost overruns across diverse economic and social environments. These findings provide policy-relevant insights for supporting efficient and socially acceptable biogas deployment in Europe.
1. Introduction
The European Union has set a target of reducing net greenhouse gas emissions by 90% by 2040 compared to 1990 levels, which is an intermediate step towards achieving climate neutrality by 2050. The development of renewable energy sources, which enables a significant reduction in greenhouse gas emissions into the atmosphere, plays a key role in achieving this goal. Among the technologies based on renewable energy sources, particular importance is attached to the production of biogas and its purified form, i.e., biomethane.
Biogas is produced through anaerobic fermentation, in which microorganisms break down organic waste, such as agricultural residues or food waste, in conditions of limited oxygen access. The product of this process is a mixture of gases, consisting mainly of methane (CH4) and carbon dioxide (CO2), which can be used as a renewable energy source. The biogas produced can be purified in specialised equipment to obtain biomethane. In this form, it can be fed into existing gas networks. Biogas that has not undergone purification is used directly to produce electricity in biogas plants, using electric generators. The accelerating effects of climate change and the growing volatility of fossil fuel markets have intensified the need for a rapid transition towards renewable energy sources in Europe [1]. In response, the European Union has adopted ambitious climate and energy targets, including a reduction of net greenhouse gas emissions by 90% by 2040 relative to 1990 levels, as an intermediate milestone on the pathway to climate neutrality by 2050. Within this framework, biogas and its upgraded form, biomethane, are increasingly recognised as strategic components of the European energy transition, particularly due to their capacity to combine renewable energy production with waste management and rural development. The bioenergy production efficiency of biogas plants is around 50% for biogas and up to 83% for biomethane, which translates into a significant reduction in greenhouse gas emissions compared to fossil fuel-based technologies. For example, electricity production in biogas plants can reduce emissions by 603–940 g of CO2 equivalent per 1 kWh of energy produced, which is significantly lower than in conventional energy systems [2,3]. In addition, CO2 and other pollutant emissions generated by biogas plants are significantly lower than those from power plants using fossil fuels, in particular coal, which has a much greater impact on the environment [4]. An important aspect of biogas plant operation is also the effective management of organic waste, leading to a reduction in landfill and waste management emissions [5].
Despite its technical maturity and environmental benefits, the development of biogas production in Europe remains highly uneven across regions and countries. While some Member States have achieved significant installed capacities, others continue to exploit only a small fraction of their technical and economic potential. This heterogeneity suggests that biogas deployment is shaped not only by technological factors but also by a complex interaction of economic policies, social conditions, and regional characteristics.
In light of the above, the research question can be formulated as: (1) determination of the key factors affecting the possibilities of the biogas production sector, and (2) development of an optimal strategy for this sector in European countries.
This aspect can play a significant role in increasing the share of renewable energy in the energy mix, whilst contributing to a reduction in the use of fossil fuels and a significant improvement in the state of the natural environment in Europe.
Economic and social conditions have a key influence on the development prospects of the biogas sector. Consequently, the primary objective of this study is to conduct an in-depth analysis of these factors and to rank them in terms of their importance for the potential development of biogas production in Europe.
Previous studies have focused only on selected factors influencing the development of biogas production in Europe, such as feed-in tariffs, investment subsidies and substrate availability. However, there is still a lack of a comprehensive analytical framework that would take into account multiple economic and social factors and translate them into real investment strategies in conditions of uncertainty. Filling this gap is particularly important in the context of dynamic political changes and volatile market conditions [6,7]. Understanding the impact of economic and social factors on the potential for biogas market development in Europe and the hierarchy of their impact on the process under study will allow future investors to make more informed and economically viable investments in new biogas plants.
The development of biogas production has been widely analysed in the literature from technological, economic, environmental, and social perspectives. Previous studies emphasise that biogas occupies a unique position among renewable energy sources due to its ability to simultaneously address energy generation, waste management, and greenhouse gas mitigation objectives.
A substantial body of research focuses on policy and economic instruments supporting biogas deployment. Feed-in tariffs, investment subsidies, and guaranteed purchase schemes have been identified as key drivers of biogas market expansion, particularly in countries such as Germany, Italy, and Denmark. Empirical evidence indicates that stable and predictable support mechanisms significantly reduce investment risk and improve the financial viability of biogas projects. At the same time, several authors note that frequent regulatory changes may undermine investor confidence and slow down long-term sector development [1,8].
Economic efficiency remains a central theme in biogas-related research. Studies analysing levelised costs of energy (LCOE) demonstrate that economies of scale play a decisive role in reducing unit production costs. Larger installations generally benefit from lower specific investment and operating costs, whereas small-scale plants are more sensitive to fluctuations in substrate prices and policy support. Research also highlights the importance of integrating biogas plants with agricultural systems, which allows for improved substrate logistics and cost optimisation [3].
Public acceptance is increasingly recognised as a key factor determining the success of projects involving the construction of new biogas plants. Numerous studies show that opposition from the local community can significantly delay or even prevent the implementation of a project, regardless of the favourable economic conditions for biogas production [4,9]. Factors such as perceived environmental risks, odour emissions and traffic intensity influence public attitudes towards biogas plants [5]. On the other hand, community involvement, transparency of decision-making processes and local economic benefits—such as job creation or increased community income—are associated with higher levels of public acceptance [10].
Technological advances, including the use of enzyme supplements and multi-stage fermentation systems, have contributed to increased efficiency and profitability in biogas production. These innovations not only improve the energy efficiency of the plant, but also support the sustainability of the process by optimising the use of raw materials and reducing waste [11,12]. The development of biogas technology is closely linked to agricultural production, as the availability of a variety of substrates, such as agricultural waste and manure, is a prerequisite for the operation of biogas plants. Regions with a developed agricultural sector therefore have greater potential for the development of this type of investment [13].
Despite the extensive literature on individual determinants of biogas development, relatively few studies adopt an integrated approach that simultaneously considers economic, social, and policy-related factors within a unified analytical framework. Moreover, existing research rarely translates determinant-based analyses into concrete investment strategies under conditions of uncertainty. This study addresses these gaps by combining an expert–mathematical assessment of key determinants with individual choice criteria derived from game theory, thereby linking determinant analysis directly to strategic decision-making in biogas investment planning. Therefore, the objective of this study is: firstly, it aims to assess and hierarchise the economic and social determinants influencing the development of biogas production in Europe using an expert–mathematical approach, and secondly, based on the most influential determinants identified, the study seeks to determine the optimal strategy for the construction of new biogas plants by applying individual choice criteria derived from game theory. By combining expert knowledge with formal decision-making tools, this research contributes to a more comprehensive understanding of how biogas investments can be aligned with both economic efficiency and social feasibility in the European context.
2. Materials and Methods
2.1. Calculated Unit Cost of Biogas Production
The economic efficiency of biogas production is determined by the level of unit production costs (LCOE) as well as by the variability of the environmental conditions in which a biogas plant operates. The value of the unit cost of biogas production (LCOE) can be estimated based on the relationship presented in Equation (1)
where
- It—investment expenditure [EUR/year];
- O&Mt—maintenance and repair costs [EU/year];
- Ft—raw material costs [EUR/year];
- Ct—costs related to the decommissioning of the biogas plant EUR/year;
- At—electricity generated from untreated biogas in a biogas plant [kWh/year];
- d—discount rate [%];
- n—biogas plant operating period [years];
- t—year in which the calculations are made.
In order to determine unit costs, the analysis should take into account all components of the cumulative costs of biogas production, referred to as the LCOE [14]. This includes all capital expenditure and operating costs, which should be presented in comparable values, for example using a discount account. These criteria are satisfied by the levelized cost of energy (LCOE), which incorporates both the total capital and operational expenditures incurred over the entire lifetime of a biogas plant, as well as the costs associated with its decommissioning at the end of its operational life [15].
When estimating the total unit costs of biogas production under conditions of a dynamic economic and social environment, and for a given installed capacity of the biogas plant, it is necessary to incorporate additional influencing factors into the analysis. These include, among others, the benefits of co-financing from the European Union or national funds, the economic effects of CO2 emission reductions, and preferential energy purchase tariffs offered by distributors, in accordance with Equation (2).
where
KJC = KLCOE + DEUiK/Pp + WCO2 − Dc
- KLCOE—calculated cost of biogas production [EUR/kWh];
- DUEiK—European Union and national subsidies for the construction of biogas plants [EUR/kWh];
- PP—Production potential of the biogas plant throughout the entire production period [kWh];
- WCO2—CO2 indexation [EUR/kWh];
- Dc—subsidy to the energy purchase price [EUR/kWh].
2.2. The Expert–Mathematical Method Used to Assess the Hierarchical Structure of Economic and Social Factors Influencing the Costs of Energy Generation from Biogas
The expert–mathematical method constitutes a well-established research approach applied in the analysis and resolution of complex decision-making problems. Its distinguishing features include a formalised procedure for determining the minimum number of experts and their qualitative selection, a clearly defined sequence of stages for conducting the expert assessment, and the application of mathematical tools both in the organisation of the research process and in the development and interpretation of results obtained at each stage of the analysis.
To determine the unit costs of biogas production, with respect to the adopted strategy for the installed capacity of the biogas plant and the prevailing economic and social conditions, it is necessary to estimate the probability of occurrence of specific environmental conditions. In addition, the potential benefits and losses resulting from their occurrence should be taken into account, in particular the possibility of obtaining funds under the EU or national co-financing, the benefits associated with CO2 emission reductions, as well as EU and national subsidies relating to the costs of purchasing biogas or electricity generated from this fuel by its distributors.
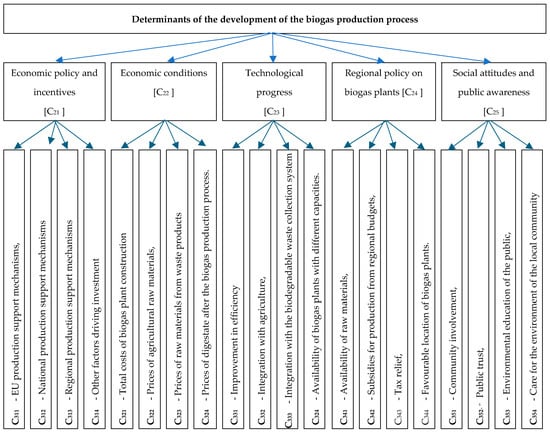
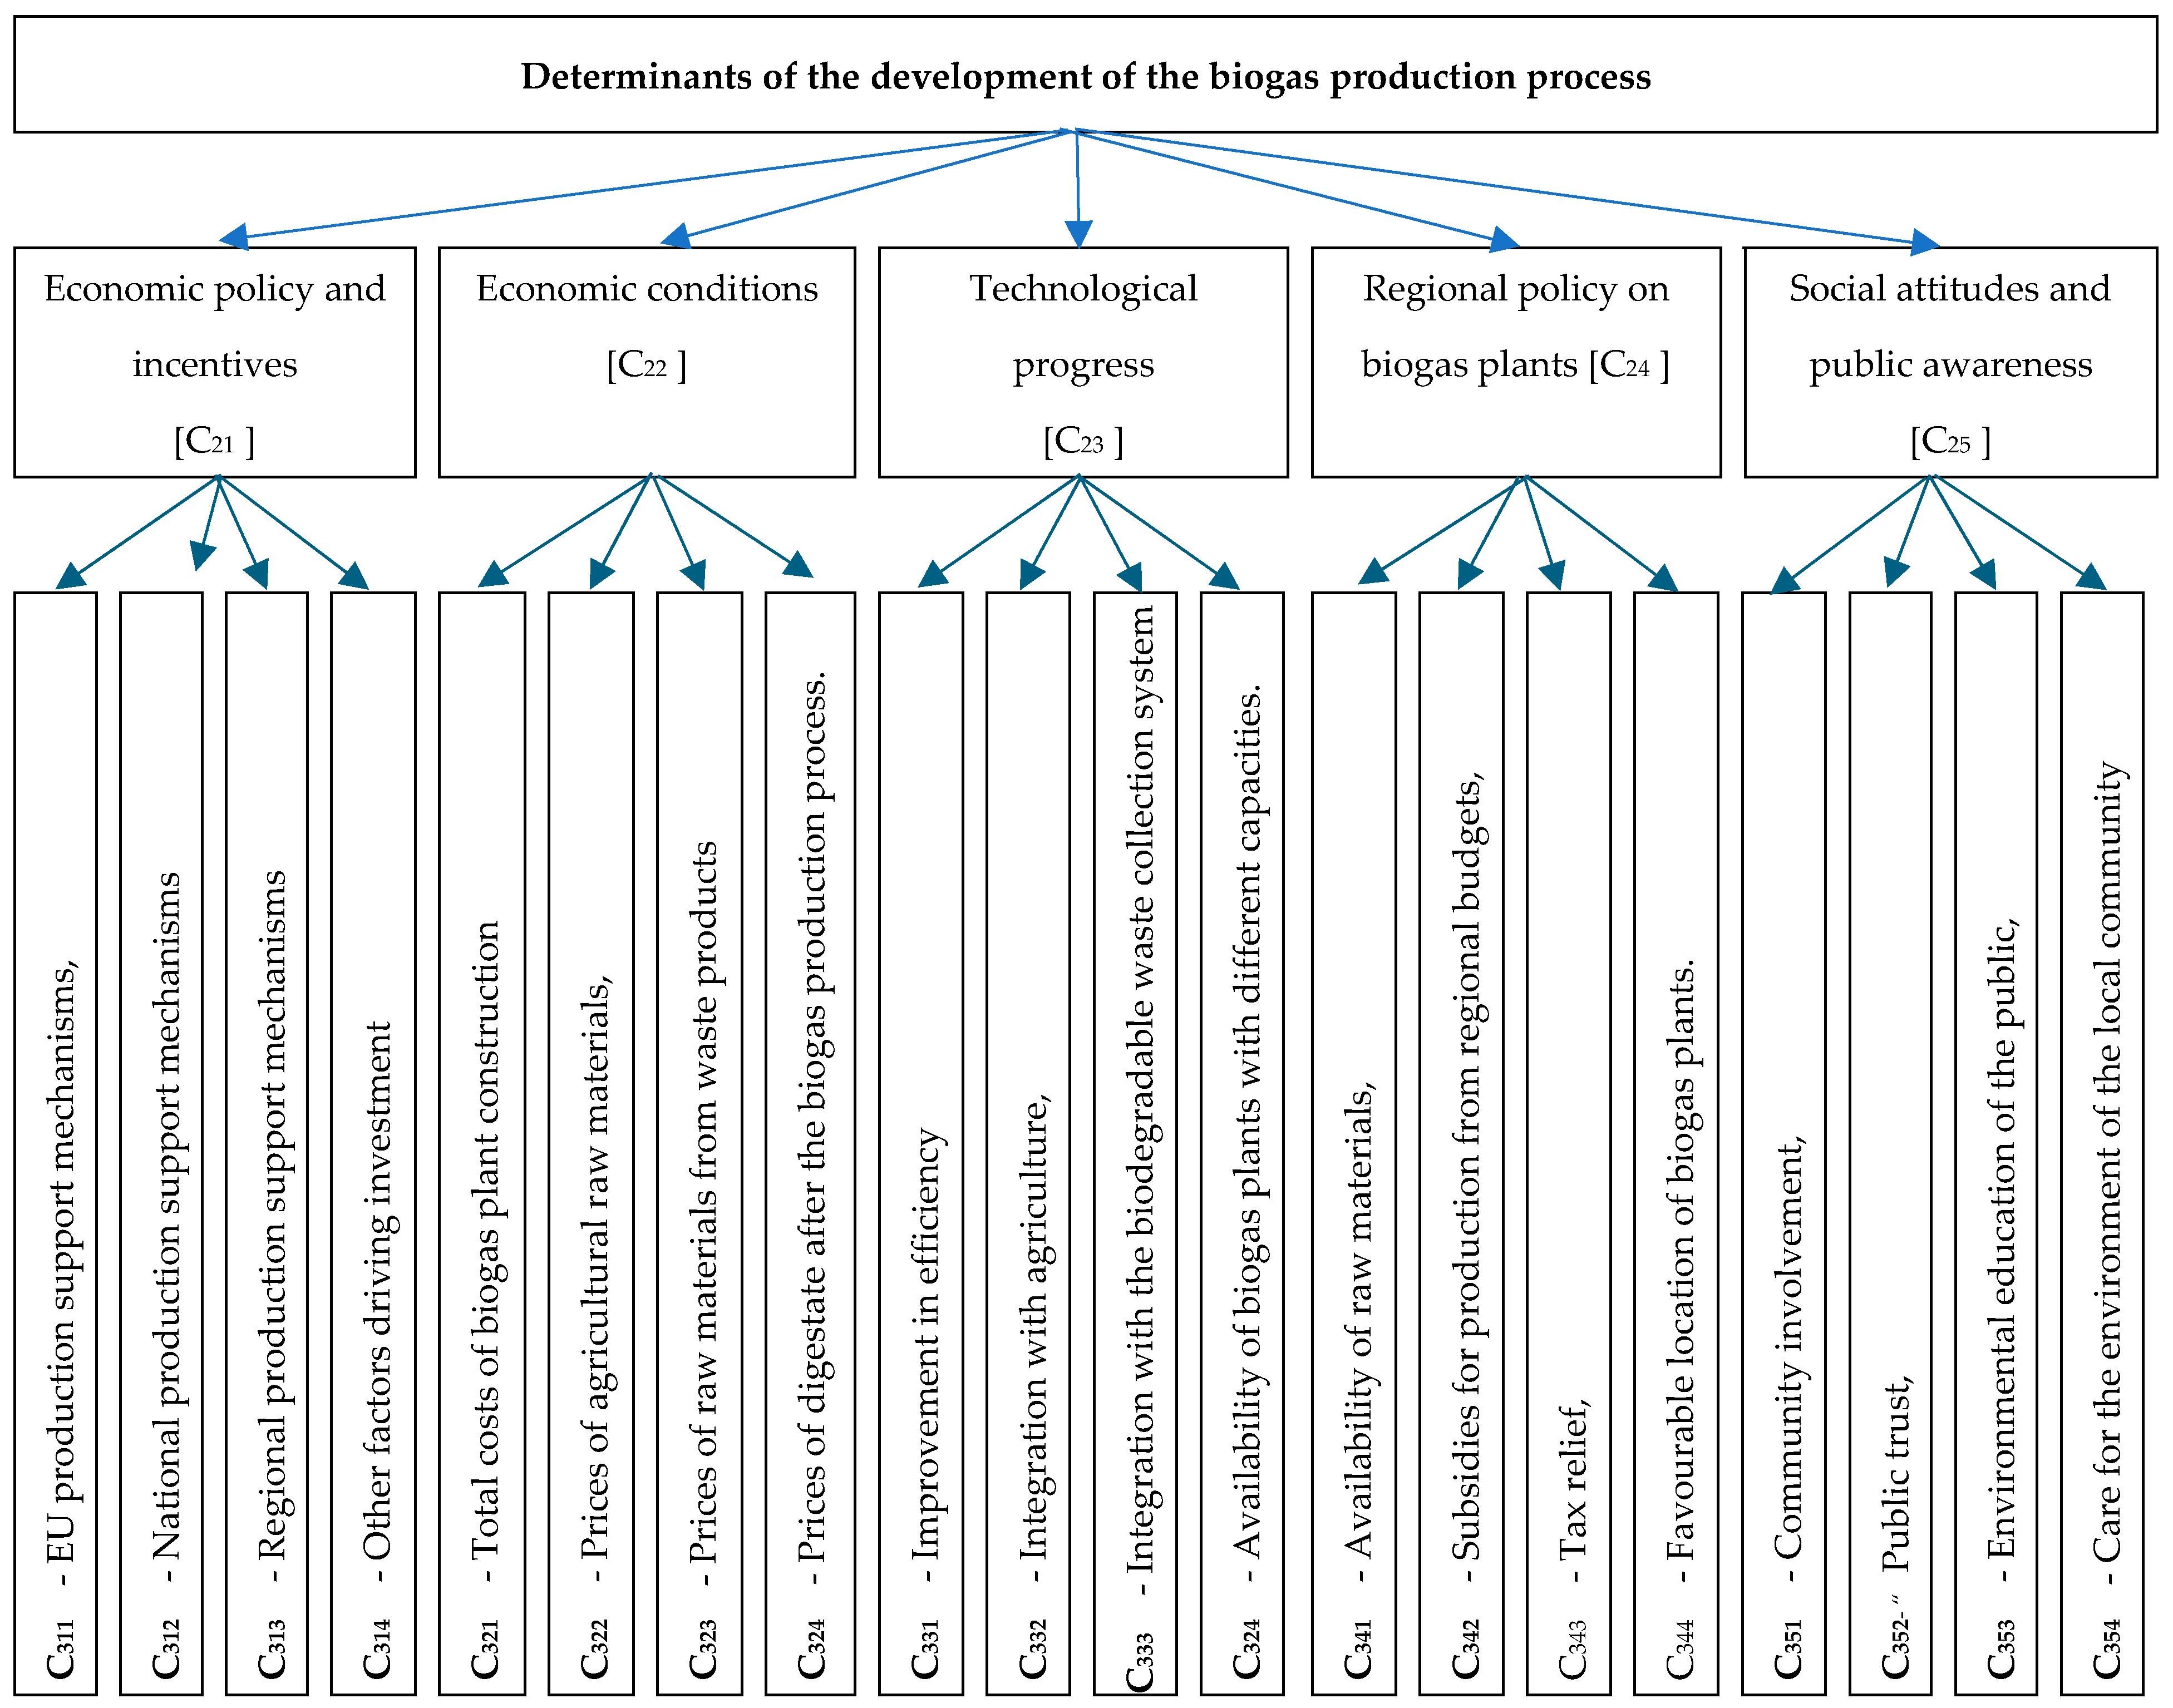
In order to assess the significance of the impact of the analysed determinants and to establish their hierarchy of influence on the examined process, in accordance with the presented diagram (Figure 1), five second-level determinants (Y21–Y25) and twenty third-level determinants (Y311–Y354) were used. The analysis of the hierarchy of influence of individual factors was carried out using an expert-mathematical method. The expert research, carried out in accordance with the assumptions of this method, involved 71 experts representing various European countries.
Figure 1.
Event tree for the construction of new biogas plants. Source: Own work.
One of the most effective approaches for determining the relative importance of objectives (Y factors) is the objective interdependence graph method, also referred to as the consequence tree [16]. This method involves identifying the overarching objective and then gradually decomposing it into lower-level objectives, which leads to the creation of a consequence tree structure (Figure 1). The fundamental principle underlying the construction of such a tree is an assumption that each lower-level objective is directly associated with a single higher-level objective, simultaneously being connected to a set of more detailed, subordinate objectives.
In accordance with the principles of the expert–mathematical method, three levels of analysis of the studied process have been distinguished (Figure 1). The first level, marked with the symbol S1, corresponds to the overarching goal and includes the unit costs of obtaining biogas [EUR/kWh]. At the second level (S21–S25), the specific conditions of the economic and social environment are identified, whereas the third level (S311–S354) represents the percentage contributions of individual components to the structure of unit costs of biogas production in selected variants of the economic and social environment.
The presented structure of the consequence tree differentiates between local and systemic priorities of objectives. Local priorities translate to the relative significance of individual objectives constituting a given higher-level objective, which in the analysed case is the primary objective S1 (determinants of the development of the biogas production process). These local priorities are defined such that the sum of points assigned by experts to subordinate objectives within a particular higher-level objective equal 100 (e.g., C311 + C312 + C313 + C314 + C315 = 100). At the same time, the normalisation condition is met, according to which the sum of local priorities at each level of the hierarchy (level II or III) is 100.
For a given objective, the systemic priority indicates its contribution to the attainment of the overarching objective and is calculated as the product of the priority of the lower-level objective and that of the higher-level objective. This method enables a quantitative evaluation of the relative contribution of each subordinate objective in the primary objective determination (e.g., C311 × C21).
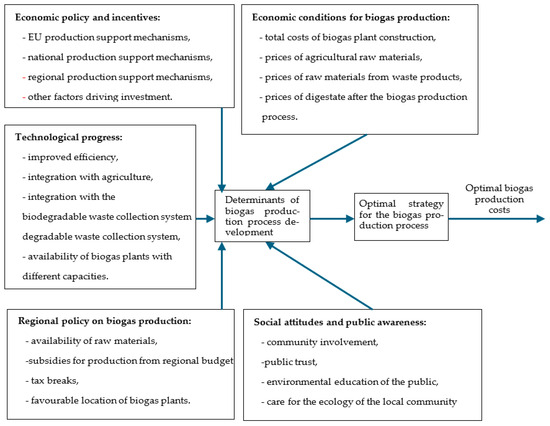
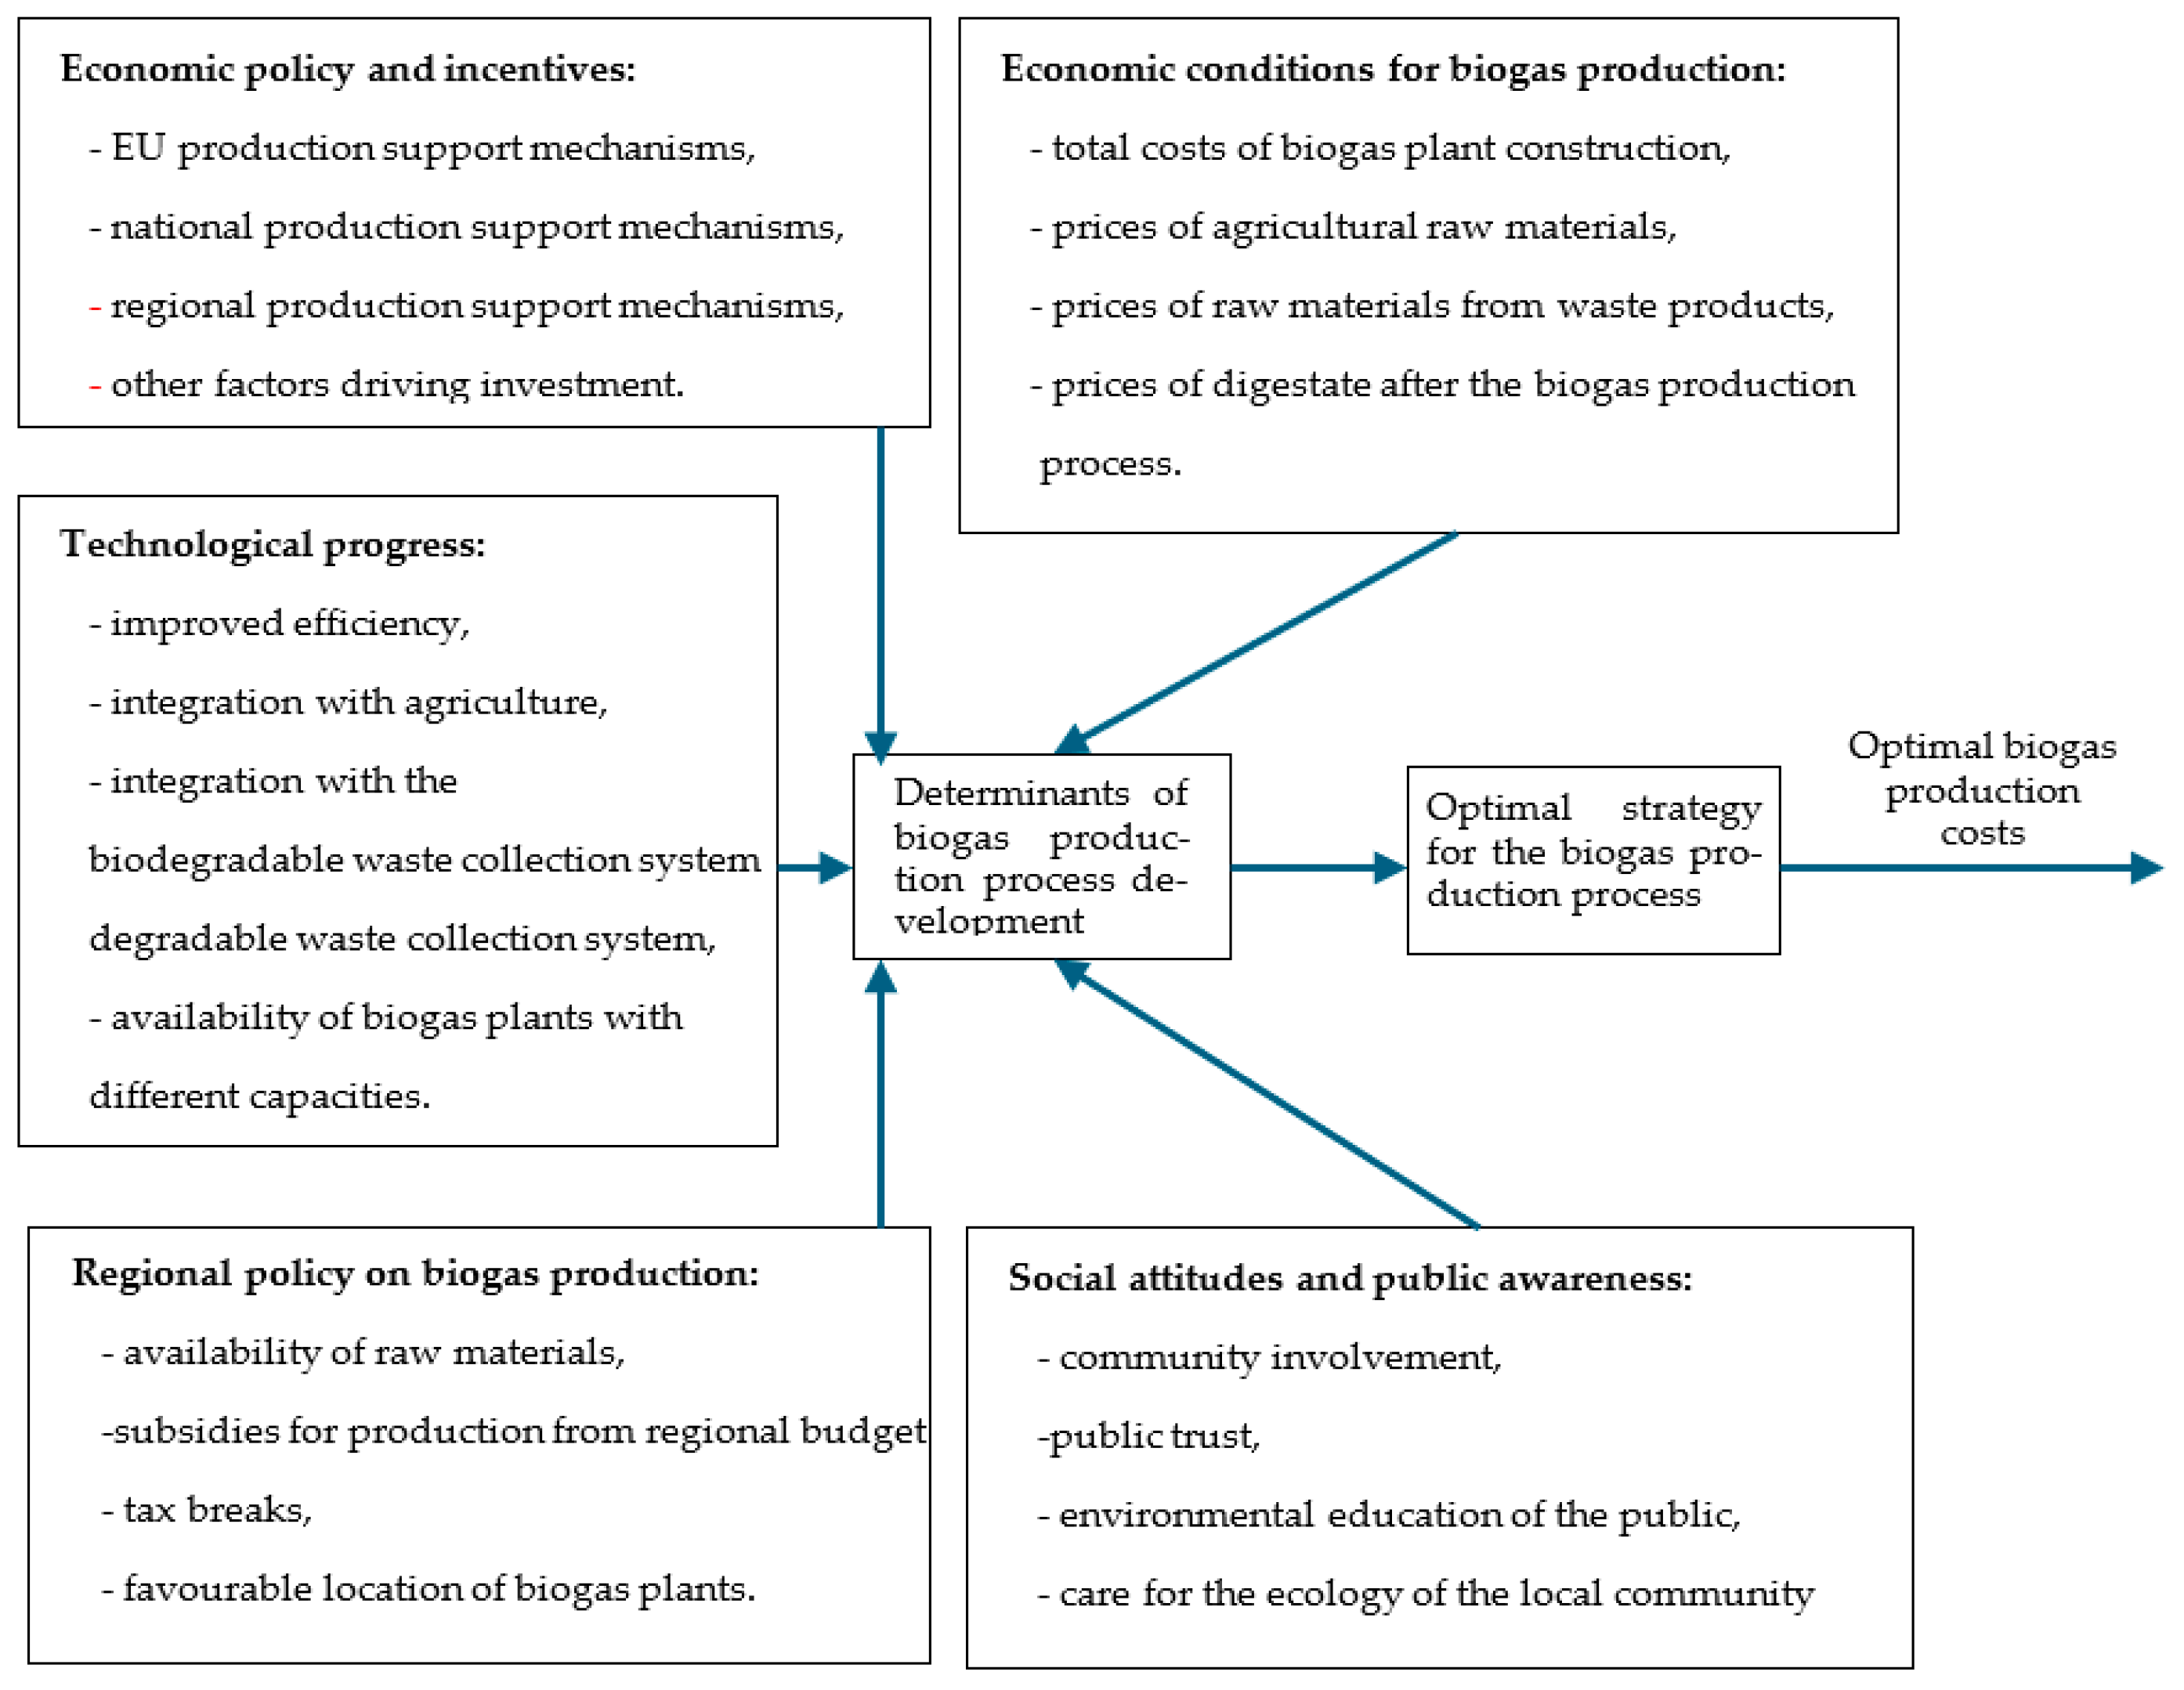
As shown in Figure 2, the unit cost of biogas production is influenced by many factors of varying strength. For this reason, achieving high economic efficiency in the biogas production process is a complex, multi-criteria and multi-level decision-making problem.
Figure 2.
A model for determining optimal strategies for the construction of new biogas plants in Europe based on specific selection criteria.
Data obtained through expert research require further processing using mathematical methods. In response to this need, an expert-mathematical method has been developed, constituting a comprehensive approach [14] with rational integration of the intuitive–logical process with both quantitative and qualitative methods of mathematical data analysis. The resulting evaluations, derived from the aggregation of individual expert opinions, enable the formulation of a consistent and comparable assessment of the relative significance of each determinant.
In this context, the consistency of individual, subjective assessments formulated by many experts leads to an objective assessment of the analysed problem. The use of mathematical tools in the process of developing expert assessments makes it possible to obtain reliable and stable final results, which translates into high effectiveness in solving the decision-making problem under consideration [16].
The minimum number of experts required is determined using the following equation:
where
- fβ(b − 1)—quantile of the distribution χ2 corresponding to the confidence level β and the number of degrees of freedom b − 1;
- b—number of factors assessed;
- γ—assumed accuracy in the concordance assessment;
- Θ0—critical value of the concordance coefficient.
The result of aggregating the as sessments formulated by experts is the determination of a measure of central tendency, such as the arithmetic mean or median. The range of variation in the set of assessments is characterised by statistical measures describing their dispersion, including standard deviation, even rank correlation coefficient and other relevant statistical indicators.
The analysed quantity can be presented in the form of ordered series (at appropriate hierarchical levels) or in the form of scaled ratings. In the latter case, the rating scale is determined at the final stage of the analysis and then converted into relative values, expressed in parts of a unit, most often as a percentage.
In situations where a ranking procedure is used, consisting in ordering factors according to their decreasing degree of importance, the dispersion concordance coefficient is used to assess the consistency of expert opinions. In the absence of equal ranks, this coefficient is determined according to the relevant mathematical relationship:
where
- S—sum of squares of deviations of actual values of series:
- —sum of series assigned by experts to the j-th factor and —arithmetic mean of the sum of series:
- —series assigned by the i-th expert to the j-th factor.
For similar series, the concordance coefficient is calculated as follows:
where
- Ti—indicator of similar series:
- p—number of groups of identical series in the assessment of the j-th expert;
- ti—number of repetitions of an identical series in the p-th group.
The concordance coefficient is a quantitative measure of the degree of agreement between the assessments made by experts and takes values from the range ⟨0, 1⟩. A value of Θ = 0 indicates a complete lack of agreement among experts, while Θ = 1 indicates complete unanimity in the assessments. Adopting a critical value of the Θ0 coefficient close to zero requires the involvement of a larger number of experts, but at the same time leads to an increase in the reliability of the results obtained.
The value of the concordance coefficient, calculated using Equation (4) or (7), represents an estimate of the parameter true value and, as such, should be considered a random variable. In order to verify that the observed variation in the ranks assigned to the analysed factors is not random, it is necessary to assess the statistical significance of the concordance coefficient.
This assessment is carried out using the consistency criterion, in accordance with the relevant mathematical relationship:
The quantile values of the distribution χ2 corresponding to the confidence level β and the number of degrees of freedom b − 1 [fβ(b − 1)] are presented in Table 1.
Table 1.
Quantile of the distribution χ2 corresponding to the confidence level β and the number of degrees of freedom b − 1.
If the calculated value of the χ2 statistic exceeds the critical value from Table 1, and the concordance coefficient is significantly different from zero, it can be concluded that the agreement among expert evaluations is not due to chance.
Determining local priorities through a scaled assessment method—expressed in points or percentages—is more complex than ranking factors by their importance. Nevertheless, this approach offers a significant advantage: it provides direct numerical values for priorities and quantifies their contribution to the overall structure of the analyzed factors. Within this framework, the consistency of expert assessments is evaluated using the coefficient of variation.
The local priority m(j) of the j-th factor is derived from the data provided by the experts:
where
- mij—normalized importance coefficient of the j-th factor as evaluated by the i-th expert.
The mean square deviation of the importance coefficient for the j-th factor can be calculated as follows:
Based on these indicators, the coefficient of variation is calculated for each factor:
It is assumed that if the value of the coefficient of variation Vj ≤ 0.25, the level of consistency of individual assessments of significance made by experts can be considered sufficient. On the other hand, values of Vj exceeding 0.25 indicate insufficient consistency of assessments. In addition, the following classification of the level of consistency can be applied depending on the value of the coefficient of variation: Vj ≤ 0.10—high consistency; 0.10 < Vj ≤ 0.15—above-average consistency; 0.16 < Vj ≤ 0.25—average consistency; 0.26 < Vj ≤ 0.35—below-average consistency; and Vj > 0.35—low compliance.
2.3. Individual Choice Criteria—Determining the Optimal Strategy for Building New Biogas Plants in Europe
Individual choice theory is a fundamental economic concept that explains how individuals make decisions to maximise their utility based on their preferences and constraints [17]. This theory is crucial for understanding consumer behaviour in economic models, particularly in the context of utility maximisation [18]. This theory provides a framework for understanding consumer behaviour through utility maximisation, whilst acknowledging the significant influence of psychological factors and social contexts [18,19]. As the theory evolves, it faces challenges that require a more precise understanding of decision-making processes, in both economic and social terms [20].
To select the optimal strategy for biogas production, it is important to provide the individual decision criteria by the use of game theory. These criteria facilitate a rational evaluation of alternative options under conditions of uncertainty and variable environmental factors. Strategy can be conducted using two categories of individual decision criteria. The first category, which necessitates knowledge of the probabilities of specific economic and social scenarios, involves an analysis focused on determining the total unit production of biogas.
When applying the criterion of maximising the average gain (equivalently, minimising the average cost), the optimal strategy is considered to be the one for which the value of the function M(Si, Yj), corresponding to the sum of the total unit costs of electricity generation (Table 4, column 7), takes the minimum value (relation (14)).
where
- d—the term refers to the number of possible states in the economic and social environment, denoted as Yj;
- Pj—probability of occurrence referring to a specific condition or scenario within economic and social factors.
Wald’s criterion is a fundamental decision rule under uncertainty, focusing on the worst-case scenario to ensure the best of the worst outcomes. Although it is widely used and has important applications, it is also criticised for its extreme pessimism. Alternatives, such as the maximum pessimism criterion, offer a more balanced approach to decision-making under uncertainty [20].
Wald’s maximum pessimism criterion is based on the assumption that the most unfavourable decision variant will occur, while ensuring a guaranteed minimum “win” value (Table 4, column 8). Therefore, the determination of the optimal strategy according to this criterion is conducted in two sequential stages. As first, for each strategy the minimum value of the function M(Si, Rsj) should be identified. Secondly, the optimal strategy can be selected by identification of the maximum value among minimum values identified (15):
The strategy corresponding to the value determined in this way is accepted as the optimal solution, as it ensures a minimum guaranteed level of profit while eliminating the possibility of obtaining a less favourable result.
The Hurwicz criterion is a valuable tool for decision-making under uncertainty, providing a balance between optimism and pessimism. Its applicability across various fields makes it a widely used method, although it has certain limitations that can be overcome by extending it and combining it with other decision-making criteria [16].
According to Hurwicz’s pessimism-optimism criterion (Table 4, column 9), which is a compromise between an extreme pessimistic approach and excessive decision-making optimism, the choice of the optimal strategy is made on the basis of an appropriate mathematical relationship (16).
where
- κ—coefficient determining the degree of pessimism and optimism.
The application of this criterion allows us to conclude that, in conditions of unknown probability of occurrence of particular decision states, the selection of the appropriate solution should be based on the decision-maker’s experience, expert knowledge and rational assessment of the situation. In this approach, the optimal strategy is identified according to the following decision rule: when the parameter κ = 1, the pessimism–optimism criterion simplifies to the maximum pessimism criterion. Conversely, for κ = 0 the decision is made without incorporating caution, corresponding to the criterion of extreme optimism. Under this condition, the optimal strategy is defined as the one for which the maximum value occurs in a given row of the decision matrix, in accordance with the following relationship: (17):
The value of the coefficient κ can be determined analytically or using a comprehensive expert-mathematical method. It should be noted that as the level of risk of the analysed situation increases, the acceptable level of risk should be reduced, which corresponds to values of the coefficient κ close to unity. In this study, the parameter κ was determined using an expert-mathematical approach and was found to be 0.60. This indicates that the adopted decision-making strategy incorporates a pessimistic perspective in 60% of cases, while the remaining 40% reflects an optimistic approach.
The second group of decision criteria, used in conditions where the probabilities of individual states occurring are unknown, includes the minimum average risk criterion and the minimum risk criterion. When these criteria are applied, the previously determined matrix of total unit costs of biogas production is transformed into a risk matrix. This transformation can be performed by calculating the difference between the minimum value Mmin(Si, Yj) in the j-th column and the other values in that column, for the adopted strategy Si and an unchanged economic and social environment, i.e., assuming Yj = const. (18).
where
R(Si, Yj) = M(Si, Yj) − Mmin(Si, Yj)
- R(Si, Yj)—risk-loss from a potentially incorrect strategy, R(Si, Yj) ≥ 0.
After determining the risk value in accordance with the described procedure, the strategy corresponding to the selected optimisation criterion, ensuring risk minimisation in the most unfavourable decision-making conditions, is adopted as the decision solution.
The minimum average risk criterion is often used in various fields, such as decision making, risk assessment and portfolio optimisation. This criterion aims to minimise the average risk associated with a decision or investment, ensuring the optimisation of expected results while keeping the risk at a minimum [21]. When applying the minimum average risk criterion, the optimal strategy is considered to be the one for which the sum of the risk values in the individual rows of the decision matrix reaches the minimum value (19):
When selecting a strategy without considering the probabilities of individual environmental states, the Laplace principle of insufficient reason is applied. This principle assumes that all possible states of the environment are equally likely, so that the probability of each state occurring is identical and can be expressed by the relationship:
Because the adopted multiplier is identical for all environmental states and does not influence the determination of the minimum values from Equations (21) and (22), the optimum strategies can be simplified to the following forms:
and
The Savage minimum risk criterion is a decision-making approach used in conditions of uncertainty. It aims to minimise the maximum possible regret, i.e., the difference between the actual payoff and the best possible payoff that could have been achieved in hindsight [22]. Determining the optimal strategy according to Savage’s minimum risk criterion is based not on an analysis of the value of the payoff, but on an assessment of the level of risk (decision regret). According to the assumptions of this criterion, the procedure for selecting the optimal strategy is carried out in two stages. In the first stage, for each strategy Si, the maximum risk value R(Si, Ysj) is determined within a given row of the decision matrix. Then, from among the maximum values obtained, the one with the lowest value is selected, which leads to the identification of the optimal strategy, in accordance with Equation (23):
3. Results
3.1. Hierarchy of Economic and Social Determinants
The type and availability of raw materials used for biogas production vary considerably across Europe, which directly affects the potential for development of this sector. For example, in Croatia, manure and agricultural by-products are the dominant substrates, but much of the potential remains untapped due to inefficient management of available resources [12]. Regions with well-developed agricultural practices can effectively manage organic waste for biogas production, thereby strengthening local economies. The integration of biogas plants into local economic systems promotes job creation and reduces waste management costs. Simultaneously, variations in agricultural practices and waste management systems may restrict the availability of feedstock, thereby adversely impacting the economic feasibility of biogas production projects [13].
The development of biogas production in Europe is the result of favourable political and economic frameworks, public acceptance, techno-logical progress and regional agricultural conditions. Effective engagement of local communities and the implementation of innovative technological solutions are key to overcoming development barriers and fully exploiting the potential of biogas as a sustainable energy source. The combination of these factors not only promotes investment in the biogas sector, but also contributes to the achievement of broader objectives in terms of energy security and sustainable environmental development in Europe.
The rapid expansion of energy demand, driven by intensive economic development, along with the finite and progressively diminishing availability of conventional energy resources and escalating environmental pressures—evidenced by rising atmospheric concentrations of particulate matter and gases—serves as a primary catalyst for the advancement of renewable energy sources [14]. Biogas production is recognized as one of the most promising solutions within this context. Consequently, by developing a model that enables the prioritization of economic and social factors, based on these key determinants, the identification of an optimal strategy for the construction of new biogas plants can offer substantial guidance for future investment initiatives (Figure 2).
In accordance with the presented methodology, expert research was conducted in eleven European countries. For this purpose, a research questionnaire was developed and sent to a selected group of experts. Completed questionnaires were received from 71 European experts, which were then subjected to mathematical analysis in accordance with the adopted research procedure. The research results obtained, together with an example of their mathematical analysis, are presented in Table 1. Based on the expert survey and subsequent mathematical aggregation, local priorities were determined for the five second-level determinant groups influencing the development of biogas production in Europe. The results indicate that economic policy and incentive mechanisms represent the most influential group, accounting for 32.1% of the total impact. This group is followed by economic conditions (25.9%), technological progress (19.2%), social attitudes and public awareness (16.8%), and regional policy (6.0%). The coefficient of concordance obtained for second-level factors confirms a satisfactory level of agreement among expert assessments.
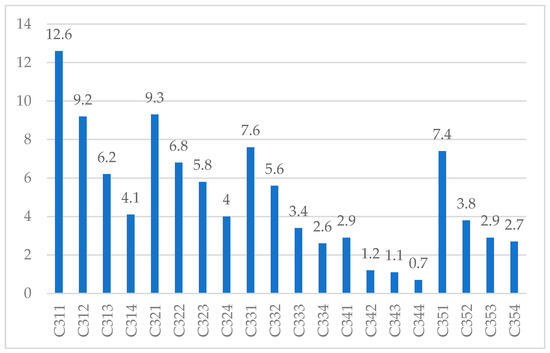
Systemic priorities calculated for the third-level determinants reveal a strong concentration of influence among a limited number of factors. EU-level production support mechanisms emerged as the single most important determinant, with a systemic priority of 12.6%. Other highly influential factors include total biogas plant construction costs, national production support mechanisms, improvements in process efficiency, community involvement, and prices of agricultural raw materials. Together, these six determinants account for 52.9% of the total impact on biogas development potential.
The remaining fourteen determinants exhibit relatively low systemic priorities, each contributing less than 5% to the overall outcome. Sensitivity analysis indicates that even substantial improvements in these lower-ranked factors would not significantly alter the overall development potential of biogas production in Europe.
The data compiled in Table 2 show that the key determinant influencing the development of biogas production in Europe is economic policy and the support instruments and economic incentives used [C21], whose share was estimated at 32.1%. On the other hand, regional policy relating to the location and implementation of investments in the construction of biogas plants has the least impact on the development of the analysed production. The scaled values of the third-level systemic determinants are presented in Figure 3.
Table 2.
Priorities of local factors of the second level.
Figure 3.
Value of systemic priorities of third-level factors [%].
3.2. Classification of Determinants by Importance
To facilitate interpretation, third-level systemic priorities were grouped into four importance classes based on their relative magnitude. System priorities were determined by multiplying the value of the second-level local priority by the corresponding third-level local priority (e.g., C21 × C311). As a result, a total of 20 third-level system priorities were obtained, summing up to 100% (Table 3).
Table 3.
Ranges of importance of systemic priorities of level III factors.
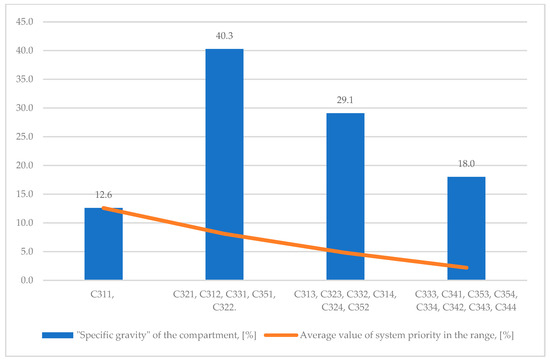
The first class includes determinants with very high importance, exceeding 9.6% of total impact. The second class comprises determinants with above-average importance, ranging from 6.6% to 9.5%. Determinants with average importance fall within the 3.7–6.5% range, while the fourth class includes factors with below-average importance, contributing less than 3.6%. This classification confirms that policy- and cost-related factors dominate the determinant structure, while purely regional and perception-related variables tend to play a secondary role when assessed from a system-wide European perspective.
As shown in Figure 3, the highest value is characterised by determinant C311, whose share in the achievement of the main objective, i.e., biogas production costs, is 12.6%. The lowest share was recorded for determinant C344, which accounts for 0.7% of the total impact.
The analysis presented in Figure 4 shows that only one determinant was classified in the first group of significance, i.e., C311—production support mechanisms in the European Union, whose share in the achievement of the main objective, understood as the possibility of developing the biogas production process in Europe, is 12.6%. Five determinants were classified in the second group of importance: C231—total costs of biogas plant construction, C312—national production support mechanisms, C331—efficiency improvement, C351—community involvement and C322—prices of agricultural raw materials. Their total share in the achievement of the main objective is 40.3%, with the average value of a single determinant in this group being 8.1%. The remaining 14 determinants, with small shares of 4.8% and 2.2%, respectively, were omitted from further analysis because even a significant improvement in their value would not have a significant impact on increasing the potential for biogas production in Europe.
Figure 4.
Validity ranges of systemic priorities of level III factors.
3.3. Unit Costs of Biogas Production Under Different Conditions
Each new investment related to the construction of a biogas plant, with an operating life of approximately 20 years, should be subject to a detailed analysis of the economic efficiency of the production process. It should be taken into account that during its operation, there may be changes in economic and social conditions affecting biogas production. These conditions can range from extremely unfavourable conditions, to current conditions (determined at the design and implementation stage of the investment), to extremely favourable conditions.
Therefore, based on the factors included in the first and second groups of importance (Table 3) whose values may vary widely, five possible economic and social conditions, marked as Y1–Y5, were identified for further analysis. The implementation of a biogas plant investment may include facilities with varying production capacities, from micro-biogas plants with a capacity of 10–15 kW to large installations with a capacity of 3 MW. Therefore, four alternative investment strategies were adopted for further consideration: S1—a micro-biogas plant with a capacity of 10–50 kW, S2—a biogas plant with a capacity of 75–150 kW, S3—a biogas plant with a capacity of 250–500 kW, and S4—a biogas plant with a capacity of 3 MW.
By applying the expert-mathematical method with Equation (2), the unit costs of biogas production were estimated, along with the probabilities of occurrence for specific economic and social conditions affecting its production (Table 4).
Table 4.
Matrix of biogas production costs and criteria for optimising the implementation of strategies for the construction of new biogas plants in Europe [EUR/kWh] [11].
Based on the six most significant determinants, five alternative scenarios for the economic and social environment were established, from highly unfavorable to highly favorable characterisation. For each environmental state, unit production costs were calculated for four alternative investment strategies corresponding to different biogas plant capacities. The results demonstrate a clear inverse relationship between installation scale and unit production costs. Large-scale biogas plants with an installed capacity of 3 MW consistently achieve the lowest unit costs across all environmental conditions. Under very favourable conditions, unit costs for this strategy reach approximately EUR 0.05/kWh, increasing to EUR 0.18/kWh under current conditions and to EUR 0.27/kWh in a very unfavourable environment. In contrast, micro-scale biogas plants exhibit significantly higher unit production costs, ranging from EUR 0.11/kWh under very favourable conditions to EUR 0.63/kWh in a very unfavourable environment. Small- and medium-scale plants show intermediate cost levels but remain consistently less cost-efficient than large installations.
3.4. Optimisation of Investment Strategies
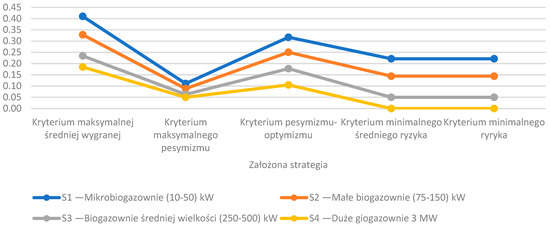
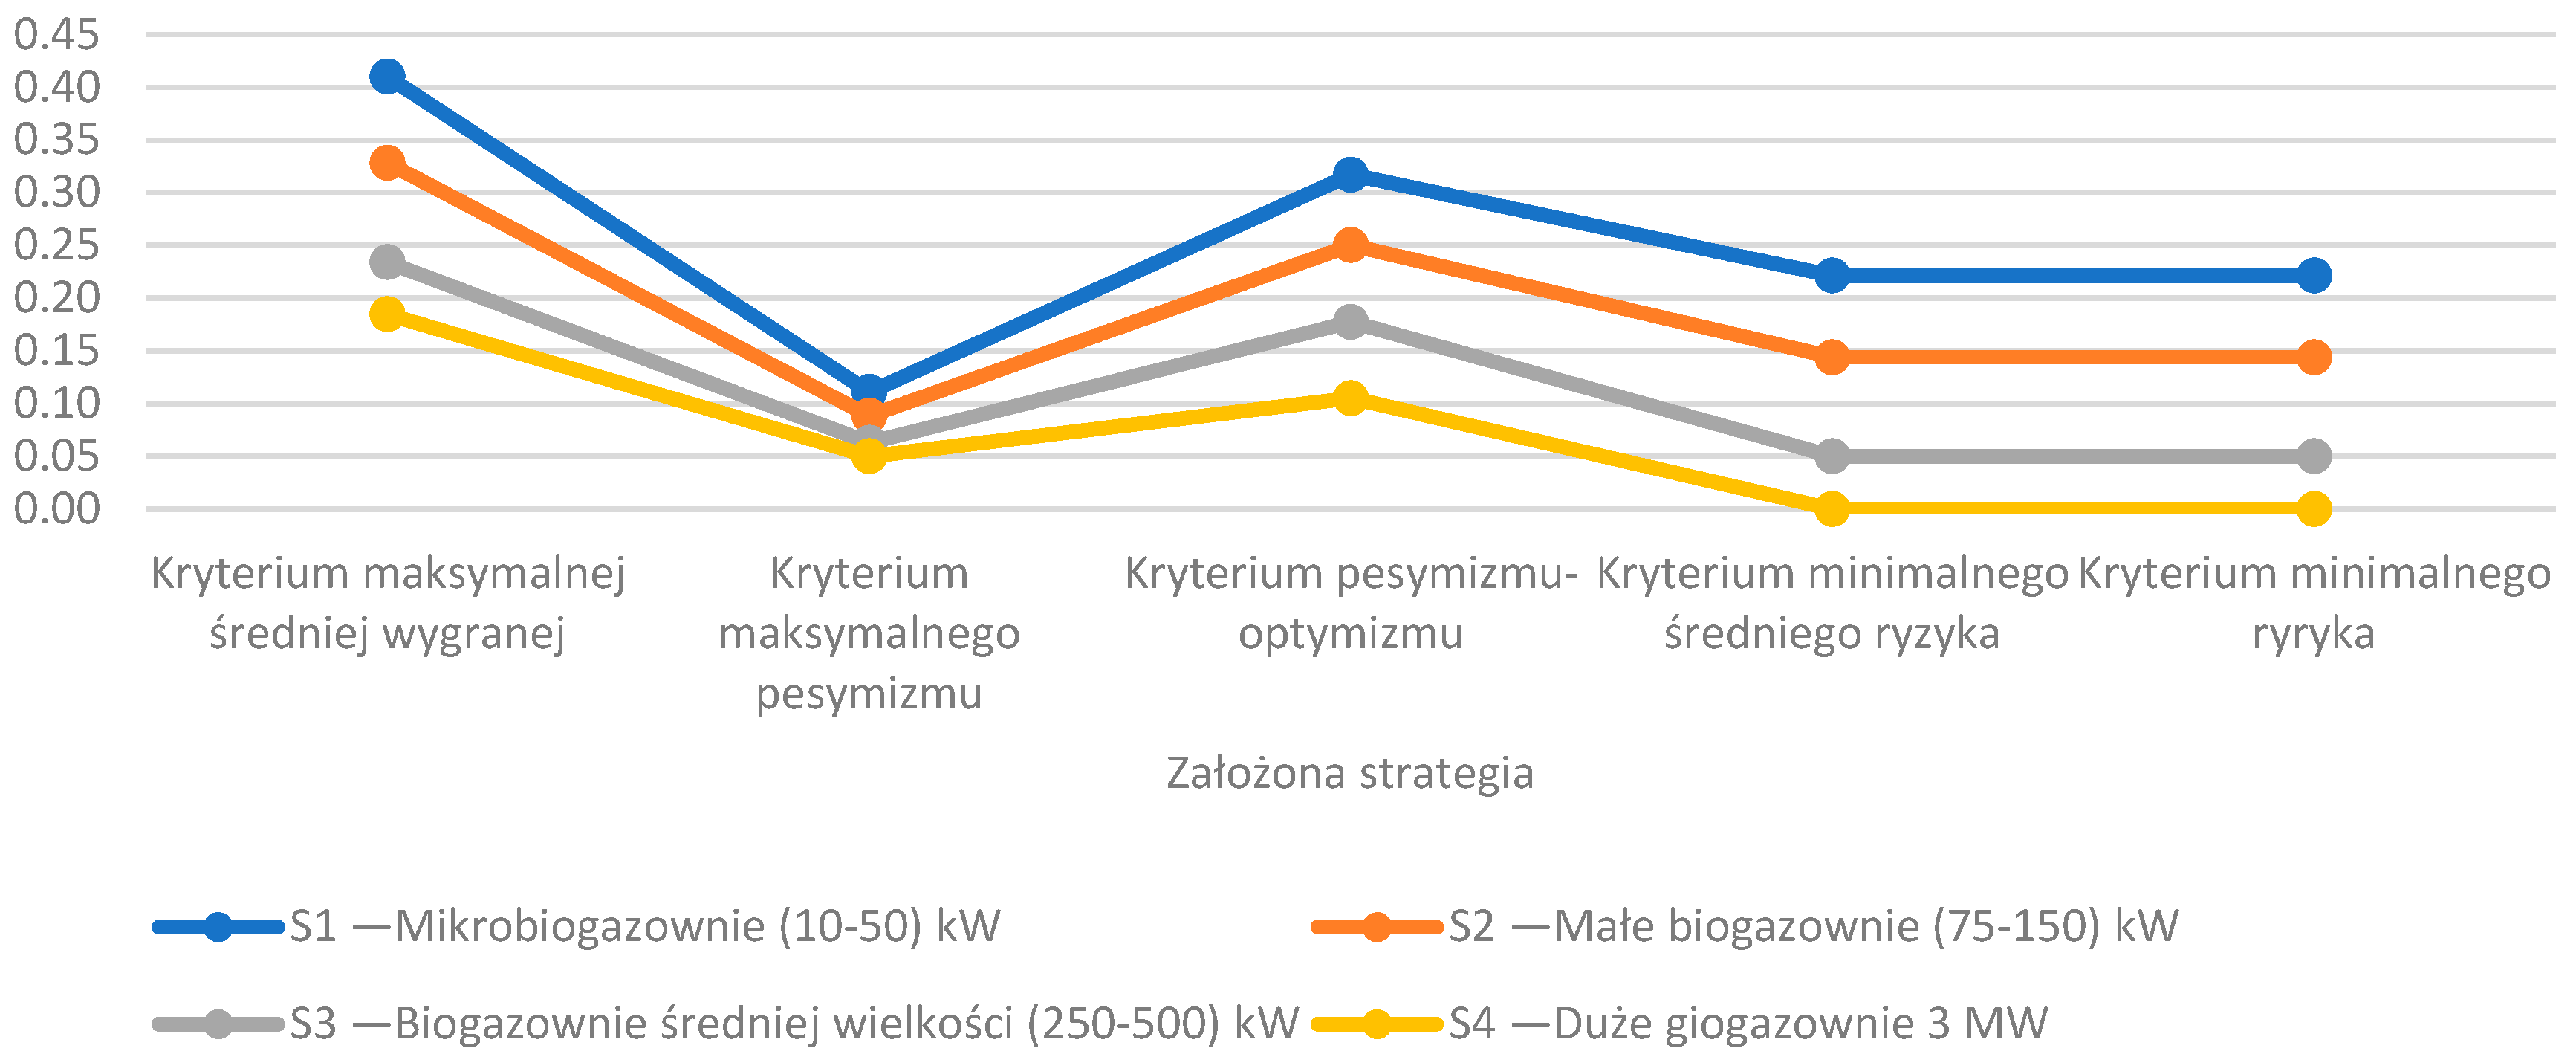
Application of individual choice criteria to the decision matrix yields consistent results across different optimisation approaches. When probabilities of environmental states are considered, the maximum average gain criterion identifies the large-scale biogas plant strategy as the optimal solution, minimising expected unit production costs.
Risk-based criteria applied under conditions of uncertainty further reinforce this conclusion. Both the minimum average risk criterion and the Savage minimum risk criterion indicate that large-scale installations offer the lowest exposure to cost overruns relative to the minimum achievable costs. Across all applied decision criteria, the 3 MW installation strategy receives the highest number of favourable evaluations, confirming its robustness under diverse economic and social conditions (Table 5).
Table 5.
Risk matrix and criteria for optimising the implementation of the assumed strategies for the construction of new biogas plants in Europe.
After determining the unit costs of biogas production and estimating the risk of unit costs exceeding the minimum costs, in accordance with the adopted individual selection criteria, such as the maximum average gain criterion, the maximum pessimism criterion, the pessimism–optimism criterion, minimum average risk criterion and minimum risk criterion (Table 4 and Table 5), the optimal investment strategy for the construction of biogas plants was selected, as illustrated in Figure 5.
Figure 5.
Optimal strategy for the construction of new biogas plants in Europe depending on the individual selection criterion.
4. Discussion
The results of this study offer empirical evidence supporting the working hypothesis that the expansion of biogas production in Europe is predominantly influenced by a restricted set of economic and social factors, with policy stability and cost-related parameters exerting a decisive impact. The dominance of EU-level and national support mechanisms identified in the results is consistent with previous studies, which emphasise that biogas investments are highly sensitive to regulatory frameworks due to their capital-intensive nature and long payback periods. Earlier analyses conducted for Germany, Italy, and Scandinavian countries demonstrate that predictable support schemes significantly reduce investment risk and accelerate market diffusion, whereas regulatory volatility tends to suppress new capacity additions [21,22,23]. The strong influence of total construction costs and economies of scale corroborates the hypothesis that scale effects are a fundamental characteristic of biogas production systems. In line with prior research on levelised costs of energy, the results confirm that larger installations benefit from lower unit investment and operating costs, more efficient use of equipment, and improved bargaining power in substrate procurement. Previous studies have shown that small-scale plants are disproportionately affected by feedstock price volatility and changes in support schemes, which helps explain why micro- and small-scale strategies are consistently outperformed by larger installations across all analysed environmental states [24,25]. Technological progress, particularly improvements in process efficiency, is confirmed as an important but complementary determinant. Earlier studies often highlight technological innovation as a key driver of renewable energy expansion; however, the results of this analysis suggest that its impact on biogas development is conditional on favourable economic and policy environments. This finding refines existing literature by demonstrating that technological advancements alone are insufficient to ensure large-scale deployment if not accompanied by adequate financial incentives and cost competitiveness. Thus, technological and economic determinants should be interpreted as mutually reinforcing rather than independent drivers [26,27]. Social determinants, especially community involvement, also play a meaningful role in shaping biogas development outcomes. Consistent with previous research on social acceptance of renewable energy infrastructure, the results indicate that while social factors contribute less to overall development potential than economic variables, they can represent binding constraints at the project level. Studies on local opposition to biogas and waste-to-energy facilities show that inadequate stakeholder engagement may lead to delays, increased transaction costs, or project cancellation. In this context, the present findings support the hypothesis that participatory approaches and local benefit-sharing mechanisms can indirectly enhance the economic feasibility of biogas projects by reducing non-technical barriers [8,24,25]. From a strategic standpoint, the optimisation analysis suggests that large-scale biogas facilities, with an installed capacity of around 3 MW, constitute the most resilient investment alternative in the context of environmental and economic uncertainty. This outcome is consistent with previous optimisation and scenario-based studies, which identify large installations as more resilient to adverse market conditions. Importantly, the convergence of results across multiple decision-making criteria strengthens the validity of this conclusion and suggests that it reflects structural properties of the biogas production process rather than methodological artefacts [28,29,30]. In the broader context of European energy and climate policy, these findings have several important implications. They [8,24,25] suggest that policy effectiveness depends not only on the level of financial support but also on its long-term stability and coherence with agricultural, waste management, and regional development policies. Furthermore, the results indicate that supporting economically efficient, medium- to large-scale installations may yield greater system-wide benefits, provided that accompanying measures address social acceptance and regional integration. Such an integrated policy approach is particularly relevant in light of the European Union’s decarbonisation targets and the increasing role of biomethane in sector coupling [31,32,33]. Despite the robustness of the proposed framework, several limitations should be acknowledged. The reliance on expert judgement introduces an element of subjectivity, although consistency checks indicate an acceptable level of agreement among experts. In addition, the analysis is conducted at the European level and does not capture country-specific regulatory or market heterogeneity in detail [34,35]. Future research could extend this study by incorporating dynamic policy scenarios, empirical cost data from operational biogas plants, and comparative analyses at the national or regional level. Further work could also explore the interaction between biogas development and emerging energy system trends, such as hydrogen production, carbon capture, and integrated bioenergy systems.
5. Conclusions
This study assesses the economic and social determinants of biogas production in European countries, using an expert-mathematical method and individual choice theory. The expert studies conducted, followed by their mathematical analysis, demonstrated a high degree of consistency in the assessments obtained, which—in accordance with the methodology adopted—allows them to be considered objective with 95% probability.
In the subsequent stage, individual choice theory, as an element of game theory, was applied to identify the optimal investment strategy for the establishment of new biogas plants in European countries. The analysis considered diverse production capacities, spanning from 10 kW to 3 MW, as well as the variability of the economic and social environment, encompassing scenarios from extremely unfavourable, through prevailing conditions, to highly favourable.
The analysis showed that, of the twenty factors considered, the greatest influence on the development of biogas production in Europe will be exerted primarily by support mechanisms for this production within the European Union (12.6% share). Other significant determinants include: biogas plant construction costs (9.3%), national production support mechanisms (9.2%), process efficiency improvements (7.6%), local community involvement (7.4%) and prices of agricultural feedstocks (6.8%). The remaining fourteen factors have a relatively smaller impact on the development of biogas production in Europe. For this reason, when analysing the potential for constructing new biogas plants, the six most significant determinants listed above should be considered first.
The lowest unit costs of biogas production among the four analysed investment strategies for the construction of new biogas plants, differing in production capacity, were obtained for strategy S4 (3 MW). The unit costs of biogas production vary according to the economic and social environment, ranging from 0.05 EUR/kWh under highly favourable conditions to 0.18 EUR/kWh under current conditions, and reach 0.27 EUR/kWh in extremely unfavourable scenarios. The highest unit costs of biogas production, however, are generated by strategy S1 (construction of small biogas plants with a capacity of 10–15 kW), ranging from 0.11 EUR/kWh, through 0.43 EUR/kWh, to 0.63 EUR/kWh.
The analysis conducted using individual choice theory indicates that the optimal investment strategy is strategy S4, which involves the construction of large biogas plants with a capacity of 3 MW. Plants of this capacity are characterised by the lowest unit costs of biogas production and the lowest risk of unit costs exceeding minimum values in a volatile economic and social environment.
Author Contributions
W.I.: Conceptualisation, Fundraising, Methodology, Formal analysis, Writing—original draft. K.K.: Resources, Writing—original draft, Writing—review and editing. K.M.: Fundraising, Supervision, Resources, Writing—original draft, G.P.: Supervision, Resources, Writing—original draft, T.A.G.: Fundraising, Supervision, Resources, Writing—original draft. All authors have read and agreed to the published version of the manuscript.
Funding
This research received no external funding.
Data Availability Statement
The original contributions presented in this study are included in the article. Further inquiries can be directed to the corresponding author.
Conflicts of Interest
Author Karol Mirowski was employed by the company Decofresh Holland B.V. The remaining authors declare that the research was conducted in the absence of any commercial or financial relationships that could be construed as a potential conflict of interest.
Abbreviations
| KJC | Total unit costs of biogas production |
| KLCOE | Calculated cost of biogas production |
| DUEiK | European Union and national subsidies for the construction of biogas plants |
| PP | Production potential of the biogas plant throughout the entire production period |
| WCO2 | CO2 indexation |
| kWh | kilowatt-hour |
| MW | megawatt |
| Dc | Subsidy to the energy purchase price [EUR/kWh] |
| fβ(b − 1) | Quantile of the distribution χ2 corresponding to the confidence level β and the number of degrees of freedom b − 1 |
| b | Number of factors assessed |
| γ | Assumed accuracy in the concordance assessment |
| Θ0 | Critical value of the concordance coefficient |
| S | Sum of squares of deviations of actual values of series |
| Sum of series assigned by experts to the j-th factor, —arithmetic mean of the sum of series | |
| Series assigned by the i-th expert to the j-th factor, | |
| Ti | Indicator of similar series |
| p | Number of groups of identical series in the assessment of the j-th expert |
| ti | Number of repetitions of an identical series in the p-th group |
| X2 | Quantile of distribution |
| mj | Local priority |
| mij | Normalised importance coefficient of the j-th factor determined by the i-th expert |
| gj | Mean square deviation of the weighting coefficient of the j-th factor |
| Vj | Coefficient of variation |
| Siopt | Criterion of maximising the average win |
| SioptW | Criterion of maximum pessimism |
| Siopth | Criterion of pessimism–optimism |
| κ | A coefficient determining the degree of pessimism and optimism |
| Si | Maximum win |
| R(Si, Yj) | Risk-loss from a potentially incorrect strategy, R(Si, Yj) ≥ 0 |
| Sioptmsr | Minimum average risk criterion |
| P | Probabilities of occurrence of particular environmental conditions |
| Sioptmr | Probabilities of occurrence of particular environmental conditions |
References
- Pilarski, K.; Pilarska, A.A.; Pietrzak, M.B. Biogas Production in Agriculture: Technological, Environmental, and Socio-Economic Aspects. Energies 2025, 18, 5844. [Google Scholar] [CrossRef] [Scilit]
- Biró, K.; Woon, K.S.; Ounsaneha, W.; Rattanapan, C. A Global Perspective on Sustainable Pathways for Biogas Adoption. Glob. J. Environ. Sci. Manag. 2025, 11, 825–856. [Google Scholar] [CrossRef]
- Hamman, P.; Dziebowski, A. Building an Agricultural Biogas Supply Chain in Europe: Organizational Models and Social Challenges. Sustainability 2025, 17, 5806. [Google Scholar] [CrossRef] [Scilit]
- Mirzoieva, T.; Tkach, N.; Nitsenko, V.; Gerasymchuk, N.; Tomashevska, O.; Nechyporenko, O. Development of the Correlation Model Between Biogas Yield and Types of Organic Mass and Analysis of Its Key Factors. C 2022, 8, 73. [Google Scholar] [CrossRef] [Scilit]
- Kucher, O.; Zelenskyi, A.; Hofmann, M.; Yermakov, S.; Plotnichenko, S. Biogas Market Research in EU Countries. In Proceedings of the Environment Technology Resources—Proceedings of the 16th International Scientific and Practical Conference, Rezekne, Latvia, 19–20 June 2025; Volume 1, pp. 313–317. [Google Scholar]
- Liu, H.; Liang, X.; Yang, L.; Chen, J. Challenges and Innovations in Green Process Intensification. Sci. China Chem. 2010, 53, 1470–1475. [Google Scholar] [CrossRef] [Scilit]
- Pilarski, K.; Pilarska, A.A.; Dach, J. Biogas as Renewable Energy Source: A Brief Overview. J. Ecol. Eng. 2025, 26, 408–416. [Google Scholar] [CrossRef] [Scilit]
- Majerus, S.; Lauinger, D.; Van Herle, J. Taking Advantage of the Vastly Underused European Biogas Potential: Break-Even Conditions for a Fuel Cell and an Engine as Biogas Converters. J. Electrochem. Energy Convers. Storage 2018, 15, 031006. [Google Scholar] [CrossRef] [Scilit]
- Petravić-Tominac, V.; Nastav, N.; Buljubašić, M.; Šantek, B. Current State of Biogas Production in Croatia. Energy. Sustain. Soc. 2020, 10, 8. [Google Scholar] [CrossRef] [Scilit]
- Kulla, M.; Novotny, L.; Pregi, L. The Role and Perception of Biogas in the Energy Transformation in Slovakia. Geogr. Cassoviensis 2022, 16, 52–75. [Google Scholar] [CrossRef] [Scilit]
- Roopnarain, A.; Ndaba, B.; Bello-Akinosho, M.; Bamuza-Pemu, E.; Mukhuba, M.; Nkuna, R.; Adeleke, R. Biogas Technology in Africa: An Assessment of Feedstock, Barriers, Socio-Economic Impact and the Way Forward. In Biogas Production; Springer: Berlin/Heidelberg, Germany, 2021. [Google Scholar]
- Camps-Aragó, P.; Michopoulou, S.; Stamos, A.; Zendron, G.; Tiaka, E. Socio-Demographic and Psychological Factors Behind Citizen Acceptance of Biogas in Livestock Farming. In Proceedings of the European Biomass Conference and Exhibition Proceedings, Marseille, France, 24–27 June 2024; pp. 241–245. [Google Scholar]
- Lubańska, A.; Kazak, J.K. The Role of Biogas Production in Circular Economy Approach from the Perspective of Locality. Energies 2023, 16, 3801. [Google Scholar] [CrossRef] [Scilit]
- Izdebski, W.; Kosiorek, K.; Izdebski, M.; Mirowski, K.; Charmas, R. The Optimal Strategy for Supplying Single-Family Homes with Electricity Using Photovoltaic Installations. Energies 2025, 18, 4909. [Google Scholar] [CrossRef] [Scilit]
- Fakhriddin, N.; Abdurasul, J.; Ibragim, K.; Nurmukhammed, K. Economic Calculation of a Photoelectric Station for Degradation Processes. AIP Conf. Proc. 2023, 2552, 50035. [Google Scholar] [CrossRef] [Scilit]
- Izdebski, W.; Kosiorek, K. Analysis and Evaluation of the Possibility of Electricity Production from Small Photovoltaic Installations in Poland. Energies 2023, 16, 944. [Google Scholar] [CrossRef] [Scilit]
- Nebel, J.M.; Weymark, J.A. Social Choice Theory. In The Routledge Companion to Social and Political Philosophy; Routledge: Oxfordshire, UK, 2024. [Google Scholar]
- Mathis, K.; Steffen, A.D. From Rational Choice to Behavioural Economics: Theoretical Foundations, Empirical Findings and Legal Implications. In European Perspectives on Behavioural Law and Economics; Springer International Publishing: Cham, Switzerland, 2015. [Google Scholar]
- Tappari, S.; Arshiya; Nirmala, A.; Sowmya, S.; Suchithra, K. Machine Learning Models for Salary Prediction: A Comprehensive Literature Survey. In Proceedings of the International Conference on Communications and Cyber Physical Engineering 2018; Springer: Berlin/Heidelberg, Germany, 2024; pp. 1664–1668. [Google Scholar]
- Salas-Molina, F.; Pla-Santamaria, D.; Vercher-Ferrandiz, M.L.; Garcia-Bernabeu, A. New Decision Rules Under Strict Uncertainty and a General Distance-Based Approach. AIMS Math. 2023, 8, 13257–13275. [Google Scholar] [CrossRef] [Scilit]
- Zhang, Y.; Li, Y. Risk-Based Life-Cycle Loss Assessment Using Statistical Moments. In Life-Cycle of Structures and Infrastructure Systems; CRC Press: Boca Raton, FL, USA, 2023; pp. 1961–1966. ISBN 978-1-003-32302-2. [Google Scholar]
- Korotkov, V.; Emelichev, V.; Nikulin, Y. Multicriteria Investment Problem with Savage’s Risk Criteria: Theoretical Aspects of Stability and Case Study. J. Ind. Manag. Optim. 2020, 16, 1297–1310. [Google Scholar] [CrossRef] [Scilit]
- Kamio, T.; Baechle, G.; Kreinovich, V. Decision Making Under Uncertainty: Cases When We Only Know an Upper Bound or a Lower Bound. In Decision Making Under Uncertainty and Constraints: A Why-Book; Springer: Berlin/Heidelberg, Germany, 2023; pp. 189–192. [Google Scholar]
- Baena-Moreno, F.M.; Malico, I.; Rodríguez-Galán, M.; Serrano, A.; Fermoso, F.G.; Navarrete, B. The Importance of Governmental Incentives for Small Biomethane Plants in South Spain. Energy 2020, 206, 118158. [Google Scholar] [CrossRef] [Scilit]
- Venus, T.E.; Strauss, F.; Venus, T.J.; Sauer, J. Understanding Stakeholder Preferences for Future Biogas Development in Germany. Land Use Policy 2021, 109, 105704. [Google Scholar] [CrossRef] [Scilit]
- Benato, A.; Macor, A. Italian Biogas Plants: Trend, Subsidies, Cost, Biogas Composition and Engine Emissions. Energies 2019, 12, 979. [Google Scholar] [CrossRef] [Scilit]
- Ferrari, G.; Shi, Z.; Marinello, F.; Pezzuolo, A. From Biogas to Biomethane: Comparison of Sustainable Scenarios for Upgrading Plant Location Based on Greenhouse Gas Emissions and Cost Assessments. J. Clean. Prod. 2024, 478, 143936. [Google Scholar] [CrossRef] [Scilit]
- Banzato, D.; Canesi, R.; D’Alpaos, C. Biogas and Biomethane Technologies: An AHP Model to Support the Policy Maker in Incentive Design in Italy. In Proceedings of the International Conference on Smart and Sustainable Planning for Cities and Regions; Springer: Berlin/Heidelberg, Germany, 2017; pp. 319–331. [Google Scholar]
- Skovsgaard, L.; Jacobsen, H.K. Economies of Scale in Biogas Production and the Significance of Flexible Regulation. Energy Policy 2017, 101, 77–89. [Google Scholar] [CrossRef] [Scilit]
- DelaVega-Quintero, J.C.; Nuñez-Pérez, J.; Lara-Fiallos, M.; Barba, P.; Burbano-García, J.L.; Espín-Valladares, R. Advances and Challenges in Anaerobic Digestion for Biogas Production: Policy, Technological, and Microbial Perspectives. Processes 2025, 13, 3648. [Google Scholar] [CrossRef] [Scilit]
- Bharadwaj, B.; Kambo, A.; Arratia-Solar, A.; Ashworth, P. Awareness of Biogas Increases Its Social Acceptance. J. Clean. Prod. 2023, 421, 138432. [Google Scholar] [CrossRef] [Scilit]
- Sari, A.I.; Purnomo, S.H. Community Participation in Utilizing Livestock Waste Biogas to Support Sustainable Energy Development. Int. J. Sustain. Dev. Plan. 2022, 17, 841–848. [Google Scholar] [CrossRef] [Scilit]
- Brahmi, M.; Bruno, B.; Dhayal, K.S.; Esposito, L.; Parziale, A. From Manure to Megawatts: Navigating the Sustainable Innovation Solution Through Biogas Production from Livestock Waste for Harnessing Green Energy for Green Economy. Heliyon 2024, 10, e34504. [Google Scholar] [CrossRef] [Scilit] [PubMed]
- di Perta, E.S.; Cervelli, E.; di Campagna, M.P.; Pindozzi, S. From Biogas to Biomethane: Techno-Economic Analysis of an Anaerobic Digestion Power Plant in a Cattle/Buffalo Farm in Central Italy. J. Agric. Eng. 2019, 50, 127–133. [Google Scholar] [CrossRef] [Scilit]
- Meena, P.K.; Awale, S.D. Comparative Analysis of Biogas Upgrading Technologies: Efficiency, Economics, and Sustainability. Int. J. Green Energy 2025, 22, 1850–1862. [Google Scholar] [CrossRef] [Scilit]

Disclaimer/Publisher’s Note: The statements, opinions and data contained in all publications are solely those of the individual author(s) and contributor(s) and not of MDPI and/or the editor(s). MDPI and/or the editor(s) disclaim responsibility for any injury to people or property resulting from any ideas, methods, instructions or products referred to in the content. |
© 2026 by the authors. Licensee MDPI, Basel, Switzerland. This article is an open access article distributed under the terms and conditions of the Creative Commons Attribution (CC BY) license.