Infrared thermography applications in the building sector can be broadly categorized into two main groups based on their objective: qualitative and quantitative [
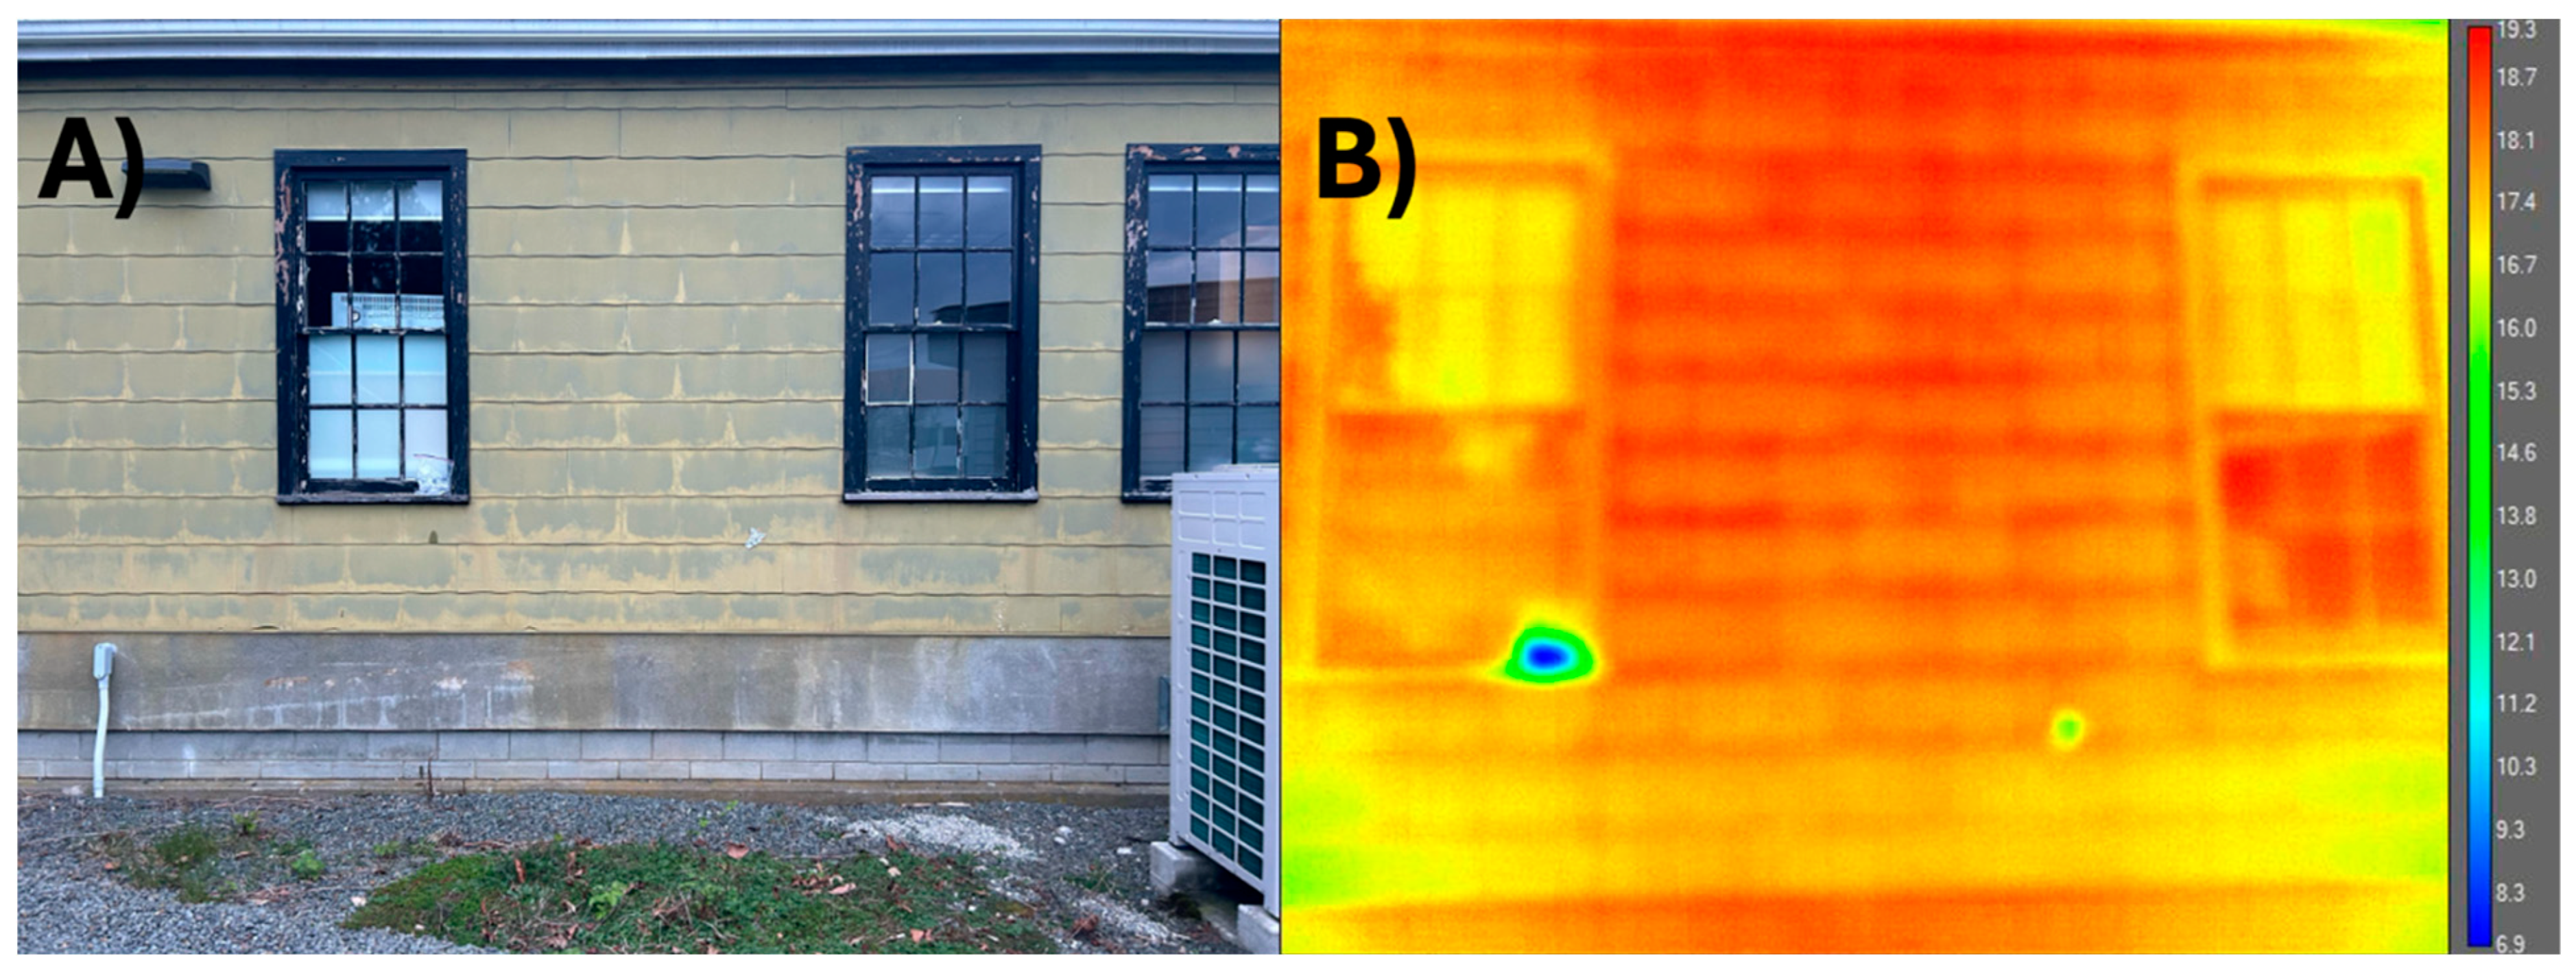
33]. Qualitative IRT is primarily used to visualize temperature distribution patterns in order to detect potential deficiencies in the building envelope. This method identifies irregularities in thermal images, such as color gradients and intensity differences, to reveal thermal anomalies [
34]. Common applications include the detection of moisture damage [
35], air leakage [
36,
37], missing insulation [
38] and thermal bridges. For instance, during external IRT inspections conducted in winter, areas with missing insulation, cracks, or air leaks typically appear as hot spots [
39]. This occurs because a defect-free envelope exhibits uniform thermal behavior, while disruptions such as voids or material inconsistencies cause localized increases in heat flows and appear as hot spot in thermal image [
40]. Air leakages, in particular, show as warmer areas resulting from indoor air escaping through the building envelope. These are intensified by increase in pressure differentials and air flow [
41], and appear as linear thermal streaks in thermal image [
37]. It is important to note that air leakage patterns are directional and plume-like, unlike insulation defects or thermal bridges which are broader or structural. Visibility of these patterns strongly depends on the pressure difference across the building envelope; during winter inspections, buildings are often pressurized or depressurized using a blower-door test so that warm indoor air is forced outward and appears clearly in thermal images. Without this artificial pressurization, leakage patterns can be weak or masked by environmental factors such as wind and solar radiation. Thermal bridge is a part of the building envelope where heat flows more easily due to differences in material, geometry, or construction, leading to localized heat loss [
42]. These typically appear as regularly spaced hot spots caused by structural elements or hot spots in geometrically distinct areas like joints and corners [
43]. Additionally, moisture accumulation within the envelope can be identified through non-uniform surface temperature patterns. Such areas often appear as cold spots, primarily due to the cooling effect of evaporation [
39].
4.1. Qualitative Studies
Recent studies have increasingly explored dynamic UAV-based infrared thermography for qualitative assessment of building envelope conditions. These applications primarily focus on detecting thermal anomalies associated with insulation defects, moisture intrusion, and air leakage in building envelopes
Early work demonstrated the effectiveness of UAV thermography for building inspections. Ortiz-Sanz et al. [
46] investigated the detection of thermal anomalies in traditional semi-buried wine cellars located in northwest Spain. The study compared UAV-based inspections with inspections conducted using a pole-mounted thermal camera. The results showed that both methods were effective in identifying the loss of thermal insulation in roof tiles over time and the presence of moisture in the walls. The authors noted that UAV-based inspections were more efficient and timesaving for exterior surveys. In contrast, for indoor environments or areas inaccessible to drones, pole-mounted cameras offered a practical alternative for inspecting hard-to-reach locations.
Building on this, researchers explored how 3D thermal modeling could enhance spatial interpretation of thermographic data. Gil-Docampo et al. [
47], who combined UAV-based and pole-mounted thermal imaging to generate a 3D thermal model of a wine cellar for detecting thermal anomalies. They utilized Structure from Motion and Multiview Stereo photogrammetry software, Agisoft Metashape™, to construct three-dimensional models. Since thermal cameras produce large pixel sizes and often lead to poor image alignment during 3D reconstruction, the researchers applied a preprocessing workflow in MATLAB to enhance image quality. This included converting color thermal images to greyscale to retain temperature data, adjusting histograms for better contrast, and using Gaussian filters to reduce noise and sharpen the images. As a result, the number of successfully aligned thermal images increased from 153 to 199. Despite the lower resolution compared to RGB images, the final 3D thermal model successfully identified areas of heat loss and moisture on the building’s roof and walls. Additional work has further expanded this concept. Additional work has further expanded this concept.
Roof inspection has emerged as one of the most active application areas for UAV-IRT, given the difficulty of traditional access methods. Moore et al. [
48] utilized dynamic IRT for remote roof inspections to identify damage related to water, heat, and HVAC system issues. Using a dual-camera setup, they identified cracks in slate shingles caused by mineral inclusions, missing shingles, roof damage from long-term water accumula-tion, drainage issues indicated by small standing water pools, and rusting HVAC pipes due to steam condensation. The study concluded that this method offers a time-efficient approach for assessing rooftop conditions and conducting spot inspections of facilities. A persistent technical challenge in UAV-IRT roof inspections is the autogain control problem, where identical temperatures are scaled differently across images during orthomosaic generation. Zhang et al. [
49] conducted a study at York University focusing on the thermal infrared inspection of roof insulation using UAVs. The study aimed to address the autogain control problem of thermal cameras and improve the accuracy of thermal anomaly detection. The autogain control issue arises during orthomosaic image generation, where points with the same apparent temperature are scaled differently in different photos. To mitigate this problem, the researchers developed a relative thermographic radiometric calibration algorithm. This algorithm uses histogram matching technic which use one image as a reference image and then compute histogram of each image and then use their discrete cumulative distribution function to calibrate image. For anomaly detection, the researchers proposed a superpixel Markov Random Field model, which treats aggregated pixels with similar grayscales and spatial patterns as basic units, rather than analyzing individual pixels. They state that this approach improved detection accuracy compared to traditional pixel-based methods.
A key limitation of most conventional thermal surveys is their reliance on single, steady-state snapshots, which miss transient anomalies that only appear under specific diurnal or seasonal conditions. Rakha et al. [
50] addressed this by introducing a time-lapse, drone-based thermography workflow that captures sequential IR imagery and constructs four-dimensional models (3D geometry over time). These thermal datasets are directly integrated into a BEM to better reflect the dynamic behavior of building envelopes. In their field study, they capture thermographic data every two hours from 09:00 to 17:00. After temperature normalization the temperature range of each photo, the thermal images were processed in Agisoft Metashape to generate point clouds and orthomosaics for each timestep. These were then imported into Rhino/Grasshopper for defect mapping and subsequently linked to EnergyPlus using Honeybee. Parametric simulations, which involved gradually lowering the R-values of identified defective areas, revealed that these anomalies accounted for an estimated increase of 6.45 MWh/year in heat loss and a 2 kWh/m
2/year rise in the building’s Energy Use Intensity. Notably, certain defects, such as roof moisture and slab-edge thermal bridges, were detectable only during midday or late afternoon.
As datasets from UAV-IRT campaigns have grown, researchers have turned to machine learning to automate defect classification. Dabetwar et al. [
51] conducted a sensitivity analysis to evaluate the performance of different neural network models in classifying heat loss locations in buildings, focusing on the impact of dataset size and number of training epochs on model accuracy. They developed a dataset comprising three classes of heat loss: (1) leakage through doors and the adjacent wall, (2) leakage due to insulation damage in walls, and (3) leakage through window seals. Using dynamic IRT, they collected 98, 91, and 73 samples for each class, respectively. Four classification models were tested: a general five-layer convolutional neural network (CNN), VGG16, transfer learning with VGG16, and transfer learning with InceptionV3. The general CNN outperformed the others, achieving the highest classification accuracy even with a relatively small dataset. InceptionV3 with transfer learning showed the second-best performance, while VGG16 was the least accurate. Their results indicated that smaller datasets require more epochs to achieve high accuracy, while larger datasets reduce the needed epochs but increase training time. The optimal configuration was found to be the general CNN trained with 128 images over 5 epochs, which achieved perfect classification accuracy on the validation dataset. Mirzabeigi & Razkenari [
52] conducted a study using dynamic IRT to automate the identification of thermal anomalies. Computer vision algorithms were then implemented to analyze the data and identify thermal anomalies in the building envelope. The algorithm successfully identified thermal bridges, material degradation, and air leakage on their test data. Alongside classification-based approaches, computer vision methods have been applied to directly automate anomaly identification in thermal imagery.
Accurate integration of thermal findings into spatial building models has become an important goal, motivating research into acquisition parameter optimization. Dabetwar et al. [
53] a systematic sensitivity analysis was performed to establish flight-planning benchmarks for reconstructing centimetre-accurate 3-D point clouds from infrared-only UAV imagery and, in turn, to enable quantitative heat-loss mapping of buildings. The authors varied three key acquisition variables, surface-to-air temperature differential (∆T), image side-overlap, and camera oblique angle, through a two-part campaign that combined controlled laboratory heating of a defect-laden mock-up with field flights around a three-storey campus building. Laboratory trials showed that the workflow could still resolve insulation voids and moisture traps with ≥95% dimensional fidelity at a ∆T of just 1.3 °C. The second tier of the study moved outdoors where drone was flown while three side-overlap levels (90%, 80%, 70%) and four single oblique angles (15°, 20°, 25°, 30°) were tested. A 90% pattern kept the mean cloud-to-cloud error near 0.02 m, whereas reducing overlap to 80% and 70% inflated the error to 1.62 m and 2.34 m, respectively. Among the single-angle oblique flights, tilting the thermal camera 25° from nadir delivered the tightest cloud-to-cloud match. Taken together, the experiments establish practical lower bounds for infrared surveys: a ∆T of roughly 1.5 °C, a minimum 90% side overlap, and a nadir-plus-25° camera configuration are sufficient to generate BIM-ready thermal meshes in a single short flight.
With reliable acquisition parameters established, several studies developed frameworks for registering thermal data directly into BIM environments. Zhang et al. [
54] aimed to develop a framework for generating thermal-textured BIM using UAV-based thermal and RGB images. The research addressed significant challenges in the automated registration of UAV thermal images with BIM, such as the low texture in thermal images and thermal inconsistencies. Key objectives included creating a cost-effective calibration target for thermal cameras, developing a method for fusing thermal and RGB images to improve image registration, and enhancing thermal images to correct inconsistencies and improve the quality of the thermal-textured BIM. They developed a 3D-printed calibration target designed to align and calibrate the thermal and RGB cameras. Homography transformation was employed to register and fuse the captured images, aligning them with the BIM. A histogram-based approach was used to correct thermal inconsistencies between adjacent thermal images to enhance the contrast and detail in the thermal orthophotos. In a case study, the framework demonstrated its ability to accurately register and map thermal images onto BIM, resulting in a mean error of approximately 5.713 pixels. This improved accuracy and detail in the thermal-textured BIM allowed for the clear identification of thermal damages. Despite these advancements, some challenges remain. The histogram-based correction method assumes consistent temperatures in overlapping areas of adjacent images, which may not be true over extended periods. Moreover, the method is currently suitable only for flat building façades, necessitating further development for curved surfaces and more generalized applications. Chen et al. [
55] proposed a computational workflow for automatically registering and fusing thermal anomalies detected in aerial infrared images to a 3D building model. The study aimed to improve the localization and assessment of thermal anomalies. The primary objectives included developing a method to align IR images with corresponding visual RGB images and map them into façade reference images, and subsequently register these images to the 3D building coordinate system through a predefined transformation process. The methodology involved using UAVs equipped with dual RGB and IR cameras to capture multi-spectral images for close-up inspections of building façades. The captured RGB images were used to detect visible defects, while IR images identified thermal anomalies. The workflow included preprocessing steps such as undistorting the RGB images, aligning them with IR images using key point matches, and registering the IR images to the 3D building model using coordinate transformation techniques. Findings from a pilot case study demonstrated that the proposed method effectively registered and fused UAV-captured images and thermal anomaly information into a 3D building model. The study highlighted the improved precision in locating and measuring thermal anomalies, which is crucial for diagnosing and addressing building energy performance issues. The challenges identified in the study included the complexity of accurately aligning and registering multi-spectral images, the need for precise camera calibration parameters, and the potential distortions in close-up images captured by UAVs. Additionally, the study noted that environmental factors, such as direct radiation during IR image capture, could affect the accuracy of thermal anomaly detection.
Other researchers have combined UAV thermography with complementary spatial sensing technologies to further enrich 3D diagnostics. Huang et al. [
56] developed a methodology combining 3D modeling from point clouds and IRT to identify facade defects in buildings. Their objective was to extend the life cycle of buildings by accurately identifying defects using non-destructive testing methods. They employed UAVs and Terrestrial Laser Scanning (TLS) to collect spatial data and generate a 3D model of the building. The methodology involved using image segmentation to cluster pixels with similar temperatures, making it easier to detect and locate defects based on thermal variations. The spatial data from UAV and TLS were integrated using ground control points to align their coordinate systems, and the segmented thermal images were mapped onto a 2D image of the 3D model. The study demonstrated that this approach could effectively identify and locate facade defects, providing both thermal and spatial information in a comprehensive 3D model. Daffara et al. [
57] utilized the FLIR Duo R camera to capture dual visible-thermal image datasets. The system was calibrated using a passive target to align the visible and thermal sensors accurately. Reconstruction software was then employed to process the captured images and generate 3D thermal models of the buildings. The findings revealed that the system could accurately reconstruct 3D thermal models, allowing for the identification of thermal anomalies and potential areas of energy loss in buildings. The study highlighted the cost-effectiveness of the system, which relies on affordable, commercially available devices and user-friendly software, making it accessible for widespread use in building inspections.
Beyond envelope diagnostics, UAV-IRT has also been applied to structural damage assessment in post-disaster contexts. Zhang et al. [
58] developed an automated system for detecting structural damage in buildings post-earthquake by integrating UAV-based oblique photography with infrared thermal imaging. The objective was to provide accurate and timely information crucial for emergency rescue and loss assessment. The methodology consisted of four main components: 3D live-action modeling and structural analysis using ultramicro oblique UAV images to create detailed 3D models of buildings, damage information extraction from these models, crack detection in walls using infrared thermal imaging to identify cracks based on temperature distribution, and the integration of these detection systems into a cohesive framework. Findings indicated that the integrated system effectively identified structural damage and wall cracks with an accuracy of 78%. The authors state that combination of 3D modeling and thermal imaging offered a more comprehensive assessment of building conditions compared to traditional methods, which often missed critical damage details.
This section provided an overview of qualitative UAV-IRT studies focusing on detecting thermal anomalies in various building types. While the reviewed studies collectively demonstrate the technical feasibility and operational efficiency of UAV-based thermography for outdoor inspections, particularly for identifying insulation defects, moisture intrusion, and HVAC-related problems, a critical appraisal of the underlying evidence base reveals important concerns about its overall robustness, internal consistency, and readiness for broader adoption beyond controlled research settings.
A fundamental limitation running through the majority of reviewed studies is their reliance on single-building or single-campaign case studies, with little to no replication across different climatic zones, construction typologies, building ages, or envelope materials. Several studies were validated on a limited number of facilities without systematic variation in building type, age, or material composition. This pattern of narrow validation is pervasive across the reviewed literature. Reported performance metrics should therefore be treated as indicative rather than definitive, as some studies achieved high accuracy figures under controlled laboratory conditions, and it remains unclear whether such levels of accuracy are reproducible in uncontrolled field environments where surface temperatures, emissivity, and atmospheric conditions fluctuate unpredictably. Similarly, damage detection accuracy figures reported in post-disaster inspection studies were not consistently benchmarked against alternative non-destructive testing methods or validated across multiple structures, making it difficult to assess their true operational reliability. Registration and alignment errors reported in BIM integration studies are likewise difficult to contextualize without standardized reference data or independent replication across different building geometries and environmental conditions.
The application of machine learning to automate thermal anomaly detection represents one of the most promising directions in the field, yet some studies in this area reveal several important constraints that temper optimism about near-term deployment. The dataset sizes employed in some studies are strikingly small relative to the complexity of the classification task, with certain models trained on fewer than 100 samples per defect class and covering only a narrow range of heat loss categories. While high classification accuracies were reported in optimal configurations, these results must be interpreted with considerable caution given the limited sample sizes and the narrow range of building types, materials, and environmental conditions represented. Perfect or near-perfect accuracy on small, homogeneous datasets is a well-recognized indicator of overfitting, wherein a model learns the specific characteristics of its training data rather than the underlying patterns that would generalize to unseen buildings or different inspection scenarios. Furthermore, some studies found that model performance was highly sensitive to dataset size and the number of training epochs, which underscores how fragile these configurations may be when training data does not adequately capture real-world variability. Computer vision approaches for thermal anomaly identification similarly demonstrated effectiveness within narrow experimental contexts. Until training datasets are substantially expanded to encompass diverse building stock, varied climatic conditions, multiple defect severities, and data collected across different seasons and times of day, the generalizability of these models to real-world inspection practice remains an open and important question.
The variability of real-world boundary conditions presents a persistent and partially intractable challenge. Wind speed, solar irradiance, ambient temperature, relative humidity, and surface emissivity all influence the apparent temperature recorded by thermal cameras, and these variables interact in complex, nonlinear ways that are difficult to model or correct systematically. Some studies have shown that certain envelope defects, including roof moisture anomalies and slab-edge thermal bridges, are only detectable during specific windows of the day, when solar loading and surface temperature gradients create sufficient contrast for identification. This finding has significant implications for the generalizability of UAV-IRT campaigns conducted under narrow temporal windows, as surveys performed at suboptimal times may systematically underreport the true extent of envelope deficiencies. The autogain control problem encountered in orthomosaic generation represents another unresolved methodological obstacle, where identical apparent temperatures are scaled differently across images. While partial solutions have been proposed, these depend on the availability of reliable reference images and may not perform robustly under conditions of rapid temperature change or heterogeneous scene content. Preprocessing workflows developed to improve thermal image alignment in 3D reconstruction, including greyscale conversion, histogram adjustment, and Gaussian filtering, similarly represent workarounds for fundamental limitations in thermal camera resolution and image quality, rather than solutions that eliminate the underlying constraints. These limitations become particularly significant when UAV-IRT data is intended for integration into BIM environments. Such frameworks rely on precise camera calibration, stable environmental conditions during data capture, and extensive manual post-processing including key point matching, homography transformation, and coordinate system registration. The multi-step nature of these workflows introduces multiple potential sources of error that compound across processing stages, and thermal consistency correction methods that assume stable temperatures in overlapping image regions may not hold over extended flight campaigns or under variable solar loading.
Overall assessment. Taken together, the qualitative UAV-IRT literature reviewed in this section represents a technically diverse and rapidly evolving body of work that has convincingly established the feasibility of drone-based thermography for building envelope diagnostics across a range of applications and building types. However, the evidence base as a whole remains in an early stage of maturity. The predominance of small-scale, single-site case studies, the absence of standardized datasets and evaluation benchmarks, the sensitivity of machine learning models to dataset size and composition, the unresolved challenges of radiometric consistency and multi-sensor data registration, and the influence of regulatory and institutional barriers collectively indicate that current knowledge, while promising, is not yet sufficiently robust or validated to support confident generalization to diverse real-world inspection practice. Addressing these gaps will require not only methodological innovation within individual research groups, but coordinated efforts to develop shared datasets, common evaluation frameworks, and cross-jurisdictional dialogue between researchers, regulators, and professional bodies.
Table 1 synthesizes the reviewed studies by summarizing their objectives, data acquisition approaches, processing techniques, and key findings, thereby highlighting both current capabilities and the remaining research gaps that future work must address.
4.2. Quantitative Studies
In recent years, dynamic IRT has gained prominence as a quantitative tool for building envelope assessment due to its ability to provide rapid, non-contact, and large-scale thermal measurements. The growing demand for accurate in situ U-value estimation, urban-scale energy screening, and energy model calibration has further driven research in this field. Numerous studies have demonstrated the potential of dynamic IRT for quantitative thermal analysis under diverse operational and environmental conditions.
A foundational concern in quantitative UAV-IRT is how flight parameters affect measurement accuracy. Zhang et al. [
59] focused on using dynamic IRT to determine wall thermal transmittance. The study examined how different UAV flight distances, 15 m, 30 m, and 45 m, and speeds, 0.5 m/s and 1.5 m/s, affected measurement accuracy. Findings showed that as the distance between the camera and the wall increased, the recorded surface temperatures decreased when compared to readings from a heat flux meter. Temperature errors grew from 3.3% to 11.7%, and heat flux errors rose from 23.7% to 40%, primarily due to infrared radiation being partially absorbed by atmospheric elements like water vapor and CO
2, reducing atmospheric transmission. Additionally, faster flight speeds caused the drone to tilt more, slightly compromising image quality. However, the impact on measurement accuracy was limited, with total error rising only about 2%. The authors concluded that dynamic IRT remains a practical approach for evaluating thermal transmittance in buildings. Environmental timing plays an equally critical role in measurement reliability. Rodriguez et al. [
60] investigated the use of dynamic IRT to estimate the thermal transmittance of building envelopes, comparing the results with those obtained through the thermometric method. Acknowledging the influence of environmental conditions on measurement accuracy, they proposed conducting tests across different seasons and times of day. To evaluate this, they performed every hour measurements for 24-h during both summer and winter. Their findings showed that greater indoor-outdoor temperature differences significantly improved measurement reliability. Winter nights, characterized by higher temperature differentials, produced the most stable and accurate U-values, while summer nights, with minimal temperature differences, led to inconsistent and distorted results. Dynamic IRT demonstrated a strong correlation with thermometric measurements, with correlation coefficients of 0.978 in winter and 0.902 in summer. Despite this, the RMSE indicated a 25–29.1% discrepancy between the two methods, with most errors occurring during the day. These inaccuracies were primarily attributed to insufficient thermal contrast. Based on their findings, the authors recommended avoiding measurements when the temperature difference between indoor and outdoor conditions is low.
Beyond individual building assessments, dynamic IRT has been scaled to urban-level analysis. Zheng et al. [
61] introduced a dynamic IRT approach to create 3D thermal models of multiple buildings for the purpose of identifying those with high energy consumption. Thermal images captured during UAV flights were processed using Structure-from-Motion techniques and converted into a color-coded 3D model. To assess the accuracy of their method, the thermal data were compared against actual heating energy consumption records. The results demonstrated a strong alignment, confirming that this technique can effectively pinpoint buildings with poor energy performance. The study highlights the potential of dynamic IRT for large-scale urban energy efficiency evaluations.
Dynamic IRT has also proven effective as a tool for energy model calibration potential of dynamic IRT for large-scale urban energy efficiency evaluations. Bayomi et al. [
62] employed dynamic IRT as a method to calibrate energy models by assessing thermal transmittance. They compared three simulations based on design specifications, U-value calculated from dynamic IRT, and actual measured energy use of the building. This approach reduces the normalized mean bias error from 21% to less than 1% compared to the design specification simulation. Similarly, the coefficient of variation decreased from 25% to 9%. Additionally, they conducted a sensitivity analysis on four key input parameters for dynamic IRT: emissivity, reflected temperature, indoor temperature, and convective heat coefficient. By varying each parameter by 15%, they assessed the impact on thermal transmittance values. Their results showed that emissivity and reflected temperature had minimal influence on the final U-value calculation, whereas indoor temperature and convective heat coefficient played a more significant role. Overall, their study demonstrated that dynamic IRT effectively reduces simulation errors and enhances the accuracy of energy model calibration. Similarly, Ficapal and Mutis [
63] employed dynamic IRT to create a framework to identify and diagnose thermal bridges in building envelopes. In their case study, they utilized a FLIR Vue Pro-R camera to inspect a curtain wall and compared the results obtained through dynamic IRT with measurements from a thermometer and a simulation tool (THERM). Their findings demonstrated that the temperature values recorded using IRT exhibited a minimal discrepancy of less than 3% when compared to thermometer probe data and simulation outputs for exterior temperatures. Additionally, state that this variation fell within the 5% uncertainty range specified by the IR-sensing device manufacturer [
63].
Camera stability and measurement drift represent persistent technical challenges. Zheng et al. [
64] employed dynamic IRT to develop a 3D point cloud model with temperature data for evaluating the thermal behavior of building envelopes. Using Pix4Dmapper software, they constructed the 3D thermal model and compared the IR temperature readings to those from thermocouples. The study identified a maximum temperature deviation of 5 °C between the two methods, with larger discrepancies occurring when the camera was used immediately after startup. As the camera stabilized with environment, typically after 10 to 20 min, the measurement error decreased. They reported that 81.25% of the IR camera readings fell within a 3 °C range of the thermocouple data. Based on these findings, the authors recommended a 20-min stabilization period for the camera prior to initiating thermal surveys to improve accuracy. Mahmoodzadeh et al. [
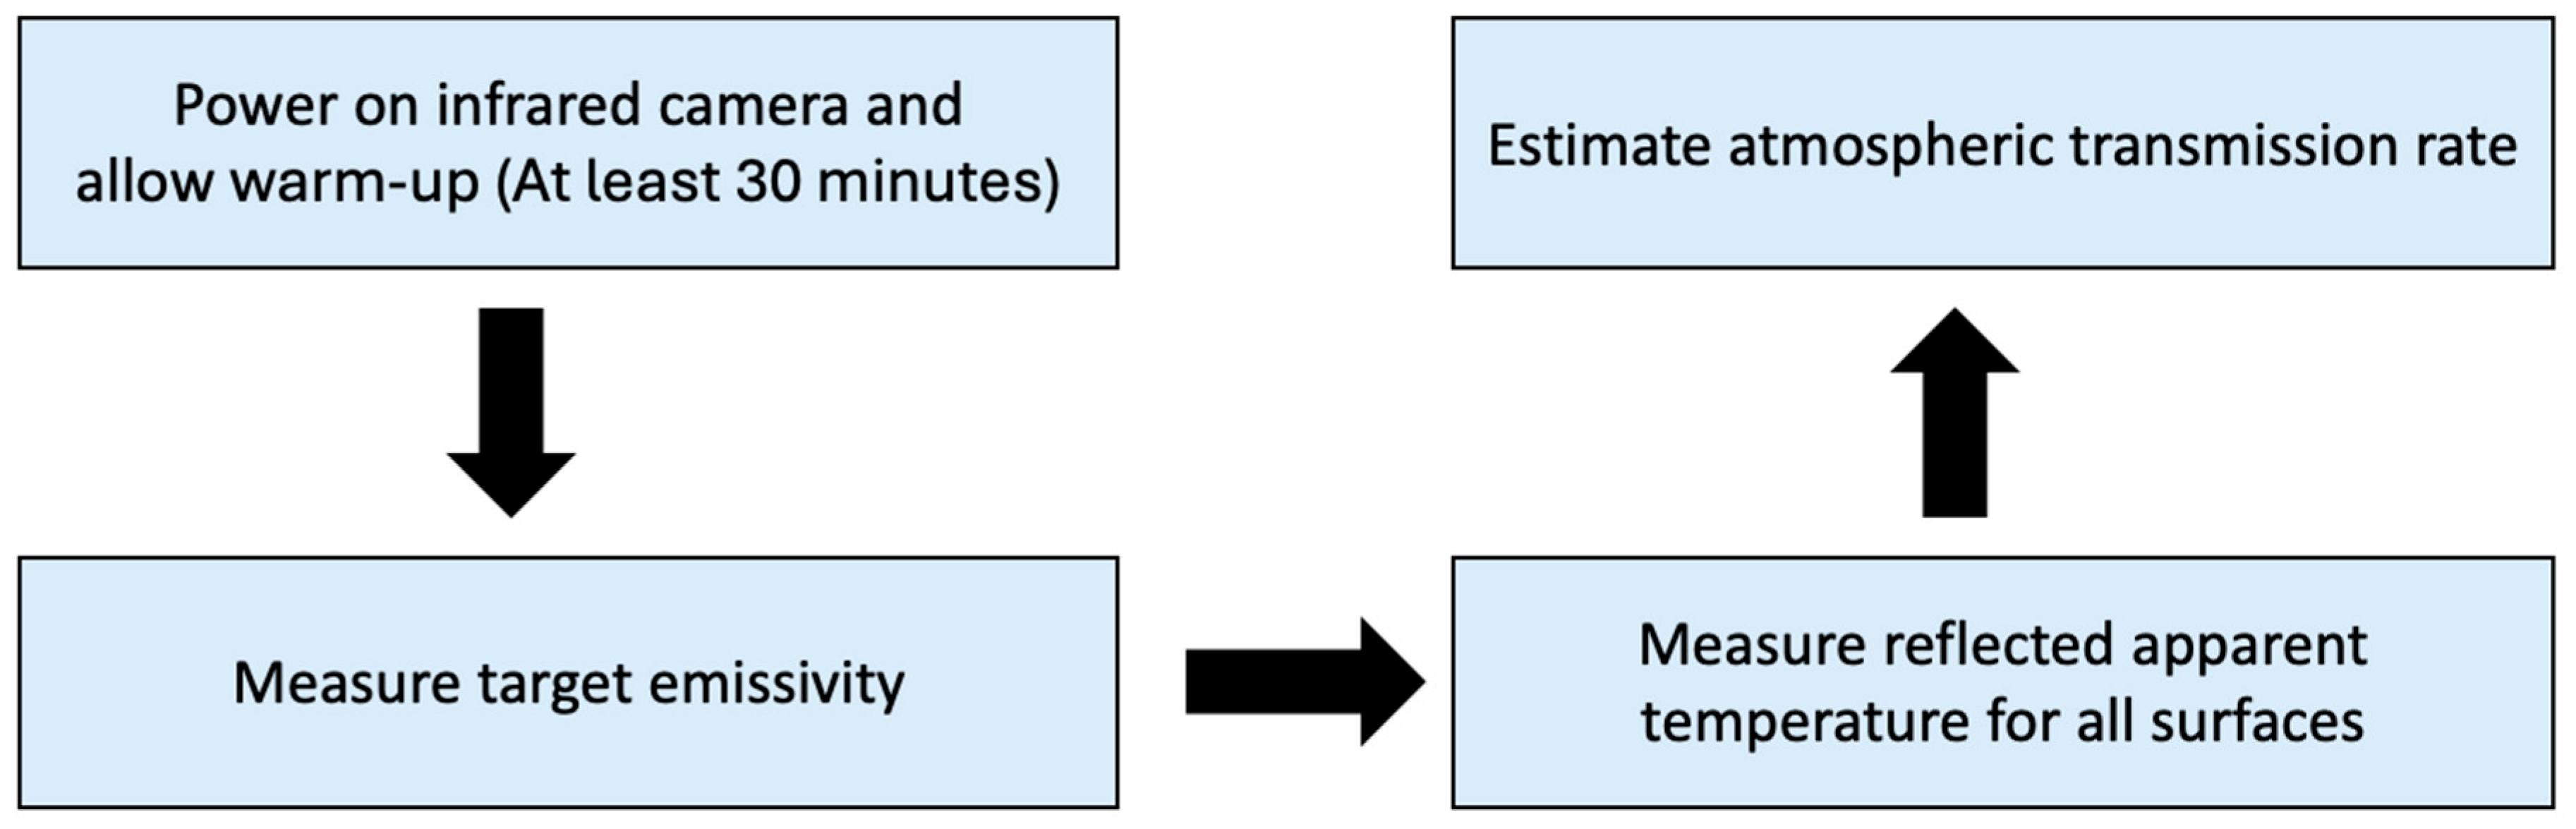
10] examined how effectively infrared cameras measure wall surface temperatures during aerial building inspections. In their initial test using the Zenmuse XT2, they observed temperature errors reaching up to 32 °C within the first 10 min of flight. A second test using a different device, the FLIR A65, showed improved stability, with a 7 °C error after 3 min in the air. These inaccuracies were attributed to airflow caused by the UAV’s propellers, which disrupted the thermal readings. To address this, they developed a shield to protect the camera. With the shield in place, temperature errors were significantly reduced to 4.5 °C after just 3 min and dropped to below 1 °C after 10 min. The researchers recommended a 30-min warm-up period for the camera before flight and advised more frequent application of NUC when conducting dynamic IRT to enhance measurement reliability. Yang et al. [
65] applied a similar approach and used shield to reduce wind-induced errors during dynamic IRT. Their comparison of laboratory and dynamic test results revealed average temperature deviations of approximately +8 °C and −5 °C under dynamic conditions. After implementing the shield, the fluctuation between maximum and minimum recorded temperatures dropped to below 2.5 °C. While the shield effectively enhanced camera performance, the researchers pointed out a key limitation: it restricted the camera’s field of view to 90 degrees, making it less compatible with automated UAV operations due to possible interference. Yang et al. [
65] applied a similar approach and used shield to reduce wind-induced errors during dynamic IRT. Their comparison of laboratory and dynamic test results revealed average temperature deviations of approximately +8 °C and −5 °C under dynamic conditions. After implementing the shield, the fluctuation between maximum and minimum recorded temperatures dropped to below 2.5 °C. While the shield effectively enhanced camera performance, the researchers pointed out a key limitation: it restricted the camera’s field of view to 90 degrees, making it less compatible with automated UAV operations due to possible interference.
The integration of machine learning has opened new directions for automating quantitative assessments. Sadhukhan et al. [
66] combined dynamic IRT with machine learning to automate the assessment of heat loss in building envelopes. They employed the Mask R-CNN model to detect and classify building components, such as walls and windows, using bounding boxes and semantic segmentation. For U-value estimation, the model produced values ranging from 2.64 to 0.31 BTU/hr·ft
2 for walls across different days, compared to the ASHRAE reference value of 0.085 BTU/hr·ft
2. For window analysis, the estimated U-values ranged from 0.14 to 0.5 BTU/hr·ft
2 for single-glazed windows, relative to the ASHRAE benchmark of 0.35 BTU/hr·ft
2, while double-glazed windows showed values between 0.23 and 1.02 BTU/hr·ft
2, compared to the standard of 0.95 BTU/hr·ft
2. During thermal data collection, a significant discrepancy was noted between infrared readings and actual surface temperatures measured by thermocouples; for instance, the camera recorded 25 °C while the true temperature was only 7.9 °C. However, the study did not explore the reasons behind this deviation. Overall, they sate that the measurements followed the ASHRAE standard, and this method is reliable.
The studies summarized in
Table 2 demonstrate that dynamic IRT is a promising quantitative tool for building envelope assessment, energy model calibration, and urban-scale energy analysis. The collective findings confirm its strong potential for non-invasive thermal characterization; however, they also reveal persistent challenges related to atmospheric effects, camera thermal drift, airflow disturbance, emissivity uncertainty, and environmental dependency. Future research should therefore focus on improving radiometric calibration under dynamic conditions, developing robust correction models for airflow and atmospheric attenuation, standardizing measurement protocols, and further integrating data-driven techniques to enhance reliability and automation. Addressing these challenges is essential for the large-scale and routine deployment of dynamic IRT in building energy diagnostics and retrofit decision-making.
Also,
Table 3 provides a generalized comparison of the main UAV-based infrared thermography applications in the building sector, highlighting their typical experimental setups, validation approaches, and key limitations. As shown in the table, qualitative applications such as thermal anomaly detection and structural damage assessment commonly rely on visual inspection, ground thermography, or other complementary diagnostic methods for validation. In contrast, quantitative-oriented applications require more rigorous validation through comparison with reference measurements such as heat flux meters or temperature sensors.
The table also illustrates that despite the diversity of applications; several limitations consistently appear across the literature. Measurement accuracy is often influenced by environmental factors such as temperature differential, wind speed, and solar radiation, as well as uncertainties related to emissivity and atmospheric attenuation. In addition, technical challenges associated with thermal image resolution, data fusion between thermal and RGB imagery, and the need for precise camera calibration remain significant barriers for advanced applications such as 3D modeling and BIM integration. Overall, the comparison highlights that while UAV-based IRT provides a powerful tool for building diagnostics, improvements in data processing, calibration procedures, and standardized validation methods are still required to enhance the reliability and broader adoption of these techniques.