1. Introduction
The increasing electrification of heating and the rapid growth of photovoltaic generation have intensified global interest in thermal energy storage (TES) as a means of converting surplus electrical energy into usable heat [
1]. Over recent decades, TES technologies have become effective solutions for mitigating the temporal mismatch between electricity production and thermal demand, thereby improving system flexibility and overall energy efficiency [
2,
3]. Among the available approaches, sensible heat storage remains one of the most practical options because of its simple operating principle, scalability, and relatively low implementation cost. In this context, compact storage units capable of directly transforming electrical input into stored thermal energy are especially attractive for small-scale renewable applications. The present study addresses this need by investigating a vapor-assisted sensible heat storage unit that converts electrical input into stored thermal energy within a vertical cylindrical geometry. The work combines (i) controlled laboratory measurements, (ii) validated CFD simulations of the transient charging/discharging process, and (iii) a direct comparison of insulated versus non-insulated configurations to quantify external thermal losses. The overarching objective is to provide experimentally validated insight into electrical-to-thermal energy storage processes and to support the integration of compact TES units in renewable-energy systems.
Thermal energy can be stored through three primary mechanisms—sensible heat storage, latent heat storage, and thermochemical storage—each suited to different operating ranges and application requirements [
4,
5,
6,
7]. Sensible heat storage relies on reversible temperature changes in a liquid or solid medium and continues to be widely investigated due to its robustness and simplicity [
8]. Typical storage media can be broadly categorized as liquids (e.g., water or thermal oils) and solids (e.g., concrete, granite, rocks, bricks, or marble) [
9,
10]. Water is frequently selected because it is readily available, has a high specific heat, and is well-suited to applications operating below 100 °C [
11]. Consequently, water-based sensible storage is commonly incorporated into heating and cooling systems, most often as tank-based solutions or as aquifer-based storage systems [
12]. Recent studies have also shown that horizontally partitioned water tanks can significantly improve thermal stratification and storage efficiency [
13]. Because heat losses can strongly affect usable storage duration and overall performance, insulation materials have become an important research focus. Conventional solutions such as mineral wool, extruded or expanded polystyrene, polyethylene foam, and polyurethane-based products remain dominant [
14], while more advanced options—including vacuum insulation panels and aerogel-enhanced products—offer substantially lower thermal conductivity and higher insulation effectiveness [
15]. Investigations on insulated hot-water tanks used in residential applications indicate that vacuum insulation can meaningfully limit heat losses and maintain elevated temperatures for longer periods, although cost can represent a barrier to adoption [
16]. Complementary numerical studies examining hybrid insulation configurations applied to concrete-based tanks further suggest that optimized material combinations can reduce temperature drop to as little as 6.29 °C over 24 h [
17].
In parallel, increasing attention has been directed toward integrating TES with renewable-energy technologies, particularly in systems aiming to enhance flexibility, reduce operating costs, and increase self-consumption of locally generated electricity [
18,
19]. For instance, industrial TES units coupled with heat pumps have been shown to deliver economic benefits by shifting energy consumption to periods with advantageous electricity pricing, even when total energy use increases [
20]. Other studies investigating photovoltaic-thermal (PVT) or heat-pump–TES hybrid systems report seasonal energy-savings improvements exceeding 40% and substantial reductions in annual energy expenditures [
21]. Field research in bioclimatic buildings similarly indicates that diverting excess photovoltaic production into hot-water storage units can substantially improve overall system efficiency, with self-consumption increases above 50% and more favorable economic indicators than conventional solar-thermal installations, including reduced energy costs and shorter payback period [
22]. Complementary demonstration projects integrating PV generation, air-to-water heat pumps, thermal storage tanks, and model-predictive control have further shown that coordinated operation can reduce heating expenses by approximately 14.5% and yield cumulative savings close to 56% [
23].
More recently, the emphasis has shifted from TES-only concepts toward cost-optimal combinations of thermal and electrical storage in buildings, particularly in contexts where on-site PV generation, electrified heating, and dynamic electricity prices interact. Using measured operation data from a net-zero office laboratory building in Trondheim (Norway) and solving a monthly convex optimization problem over December 2021–August 2024, Galteland et al. found that a hybrid configuration of battery energy storage (BESS) and (latent) thermal energy storage (TES) can be more cost-efficient than single-technology sizing, with pronounced seasonal dependence in the preferred thermal capacity [
24]. Consistent with this trend, Szymiczek et al. showed that thermal buffer storage can materially increase PV self-consumption in heat-pump-driven residential heating, while reducing grid electricity consumption as storage size increases, highlighting the value of short-term TES for PV utilization [
25].
At the broader system level, recent review work consolidates the expansion of building-scale PV coupled with on-site energy storage and surveys PV–storage configurations, PV-yield modeling, and operational optimization strategies aimed at improved economic performance and flexibility in buildings [
26]. Related reviews emphasize power-to-heat (P2H) as a key pathway for coupling variable renewable electricity with the heating sector, particularly when combined with thermal energy storage to absorb surplus generation and reduce curtailment; in this context, minimizing thermal losses is repeatedly identified as a practical determinant of achievable performance for both sensible and latent storage options [
27]. Technology assessments similarly point to the emergence of PV hot-water (PV2Heat) concepts, highlighting hot-water tanks as distributed thermal storage that can absorb PV surplus and improve self-consumption through appropriate control strategies and equipment integration [
28]. These recent studies strengthen the case for TES integration, but they also underline that practical deployment depends on predictable retention performance and controllable thermal losses.
Extensive review studies emphasize that coupling thermal storage with renewable-energy technologies provides multiple environmental benefits, including lower greenhouse-gas emissions and reduced dependence on fossil fuels [
18]. However, much of the recent literature prioritizes system-level performance indicators (e.g., self-consumption, cost, and control) over a mechanistic description of transient heat-transfer regimes inside compact sensible TES devices. In particular, there remains relatively limited experimentally validated evidence on how external insulation alters (i) the transition from conduction-dominated heating to vapor/phase-change-enhanced convection during charging and (ii) the subsequent heat-retention dynamics during discharge in compact, electrically charged storage units. Addressing this gap is important for translating promising PV–TES integration concepts into predictable, high-retention hardware.
To address this gap, the present work examines a compact sensible heat storage unit designed for integration with photovoltaic systems. The unit converts electrical energy into stored thermal energy through a controlled vaporization–condensation cycle occurring within a vertical steel cylinder. By combining detailed temperature measurements under insulated and non-insulated conditions with CFD simulations, the study offers insight into the system’s thermal behavior at each operational stage. The findings contribute to a deeper understanding of heat-transfer mechanisms in sensible TES configurations and support their improved integration in renewable-energy applications.
In the sections that follow, the paper outlines the design of the thermal storage unit and the parameters used for its experimental evaluation. The subsequent analysis presents the measured results and concludes with a discussion of the key findings and their implications.
2. Materials and Methods
2.1. Equipment Design
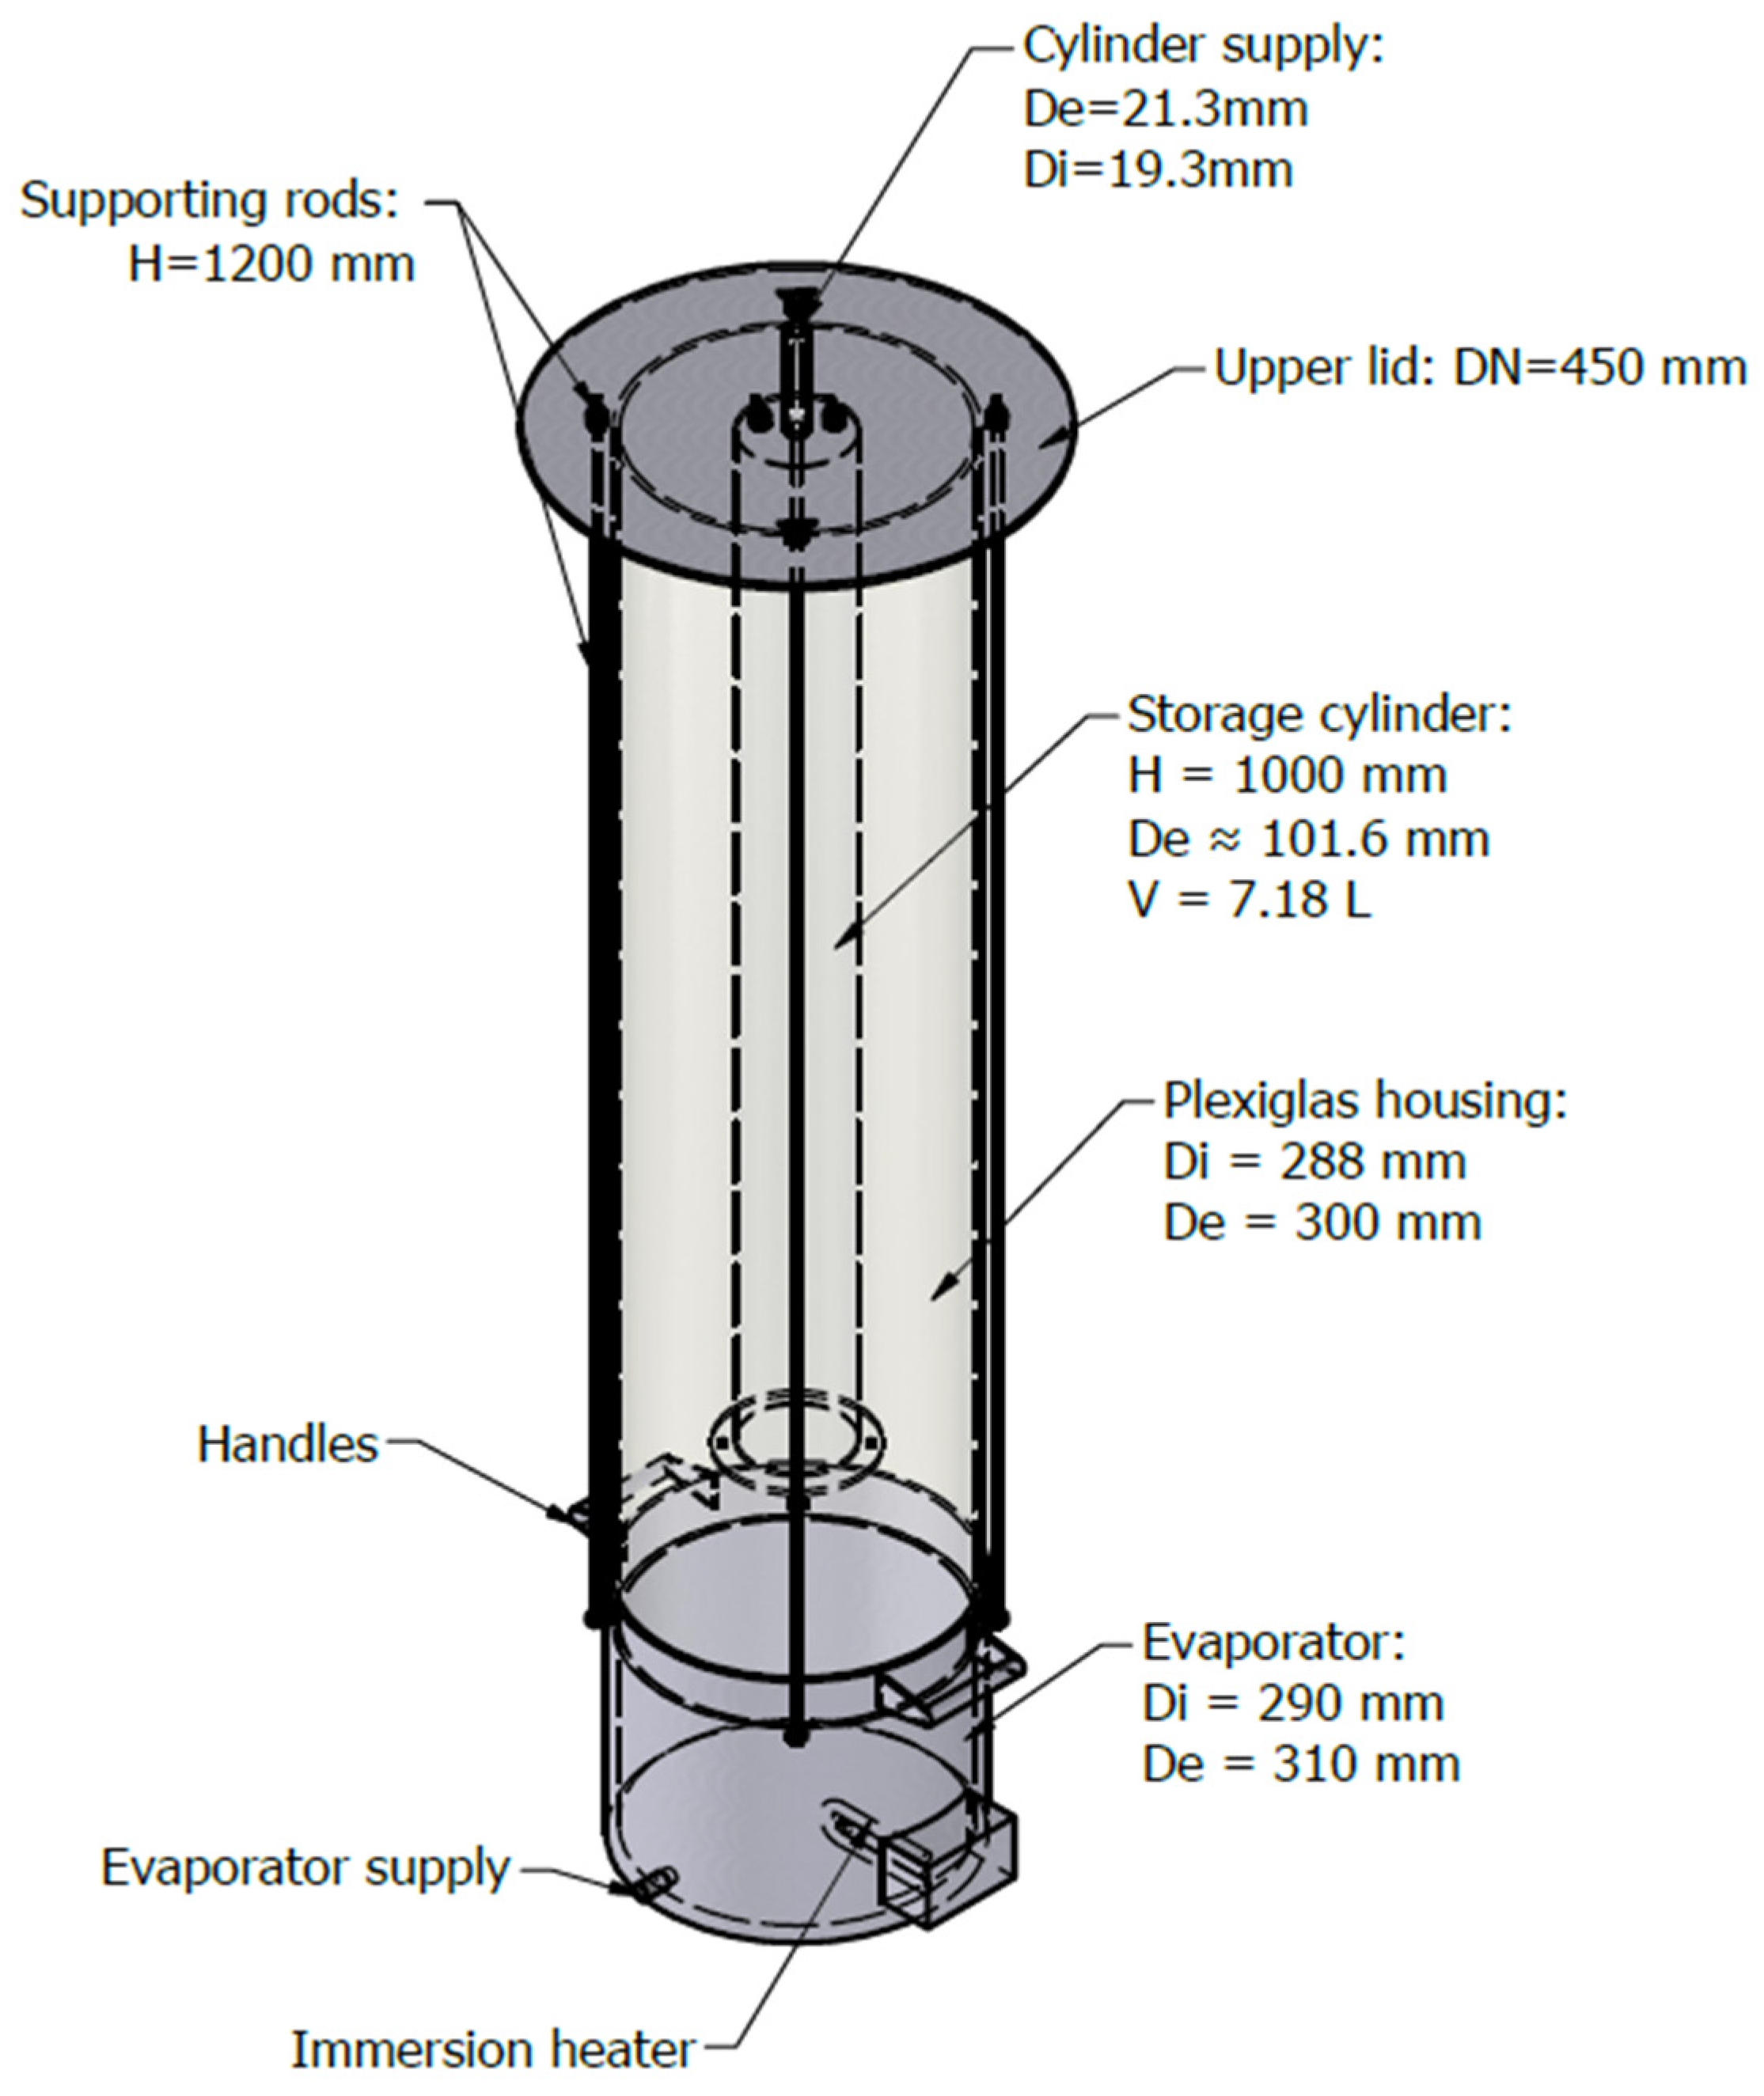
A custom sensible heat storage unit was developed for the experimental program, designed to store thermal energy released through the condensation of water vapor. The conceptual configuration was first modeled in Autodesk Inventor Professional 2023, and the resulting assembly is illustrated in
Figure 1. The main components of the system, along with their functions, materials, and dimensions, are described below.
To further clarify the equipment’s operation, the following section provides an in-depth look at each component:
The thermal storage medium is contained within a vertical steel cylinder that serves as the primary heat-absorption surface during condensation.
Function: Stores thermal energy as vapor condenses on the internal walls.
Material: Steel pipe Ø101.6 × 3 mm for the body; steel pipe Ø21.3 × 2 mm for the inlet section.
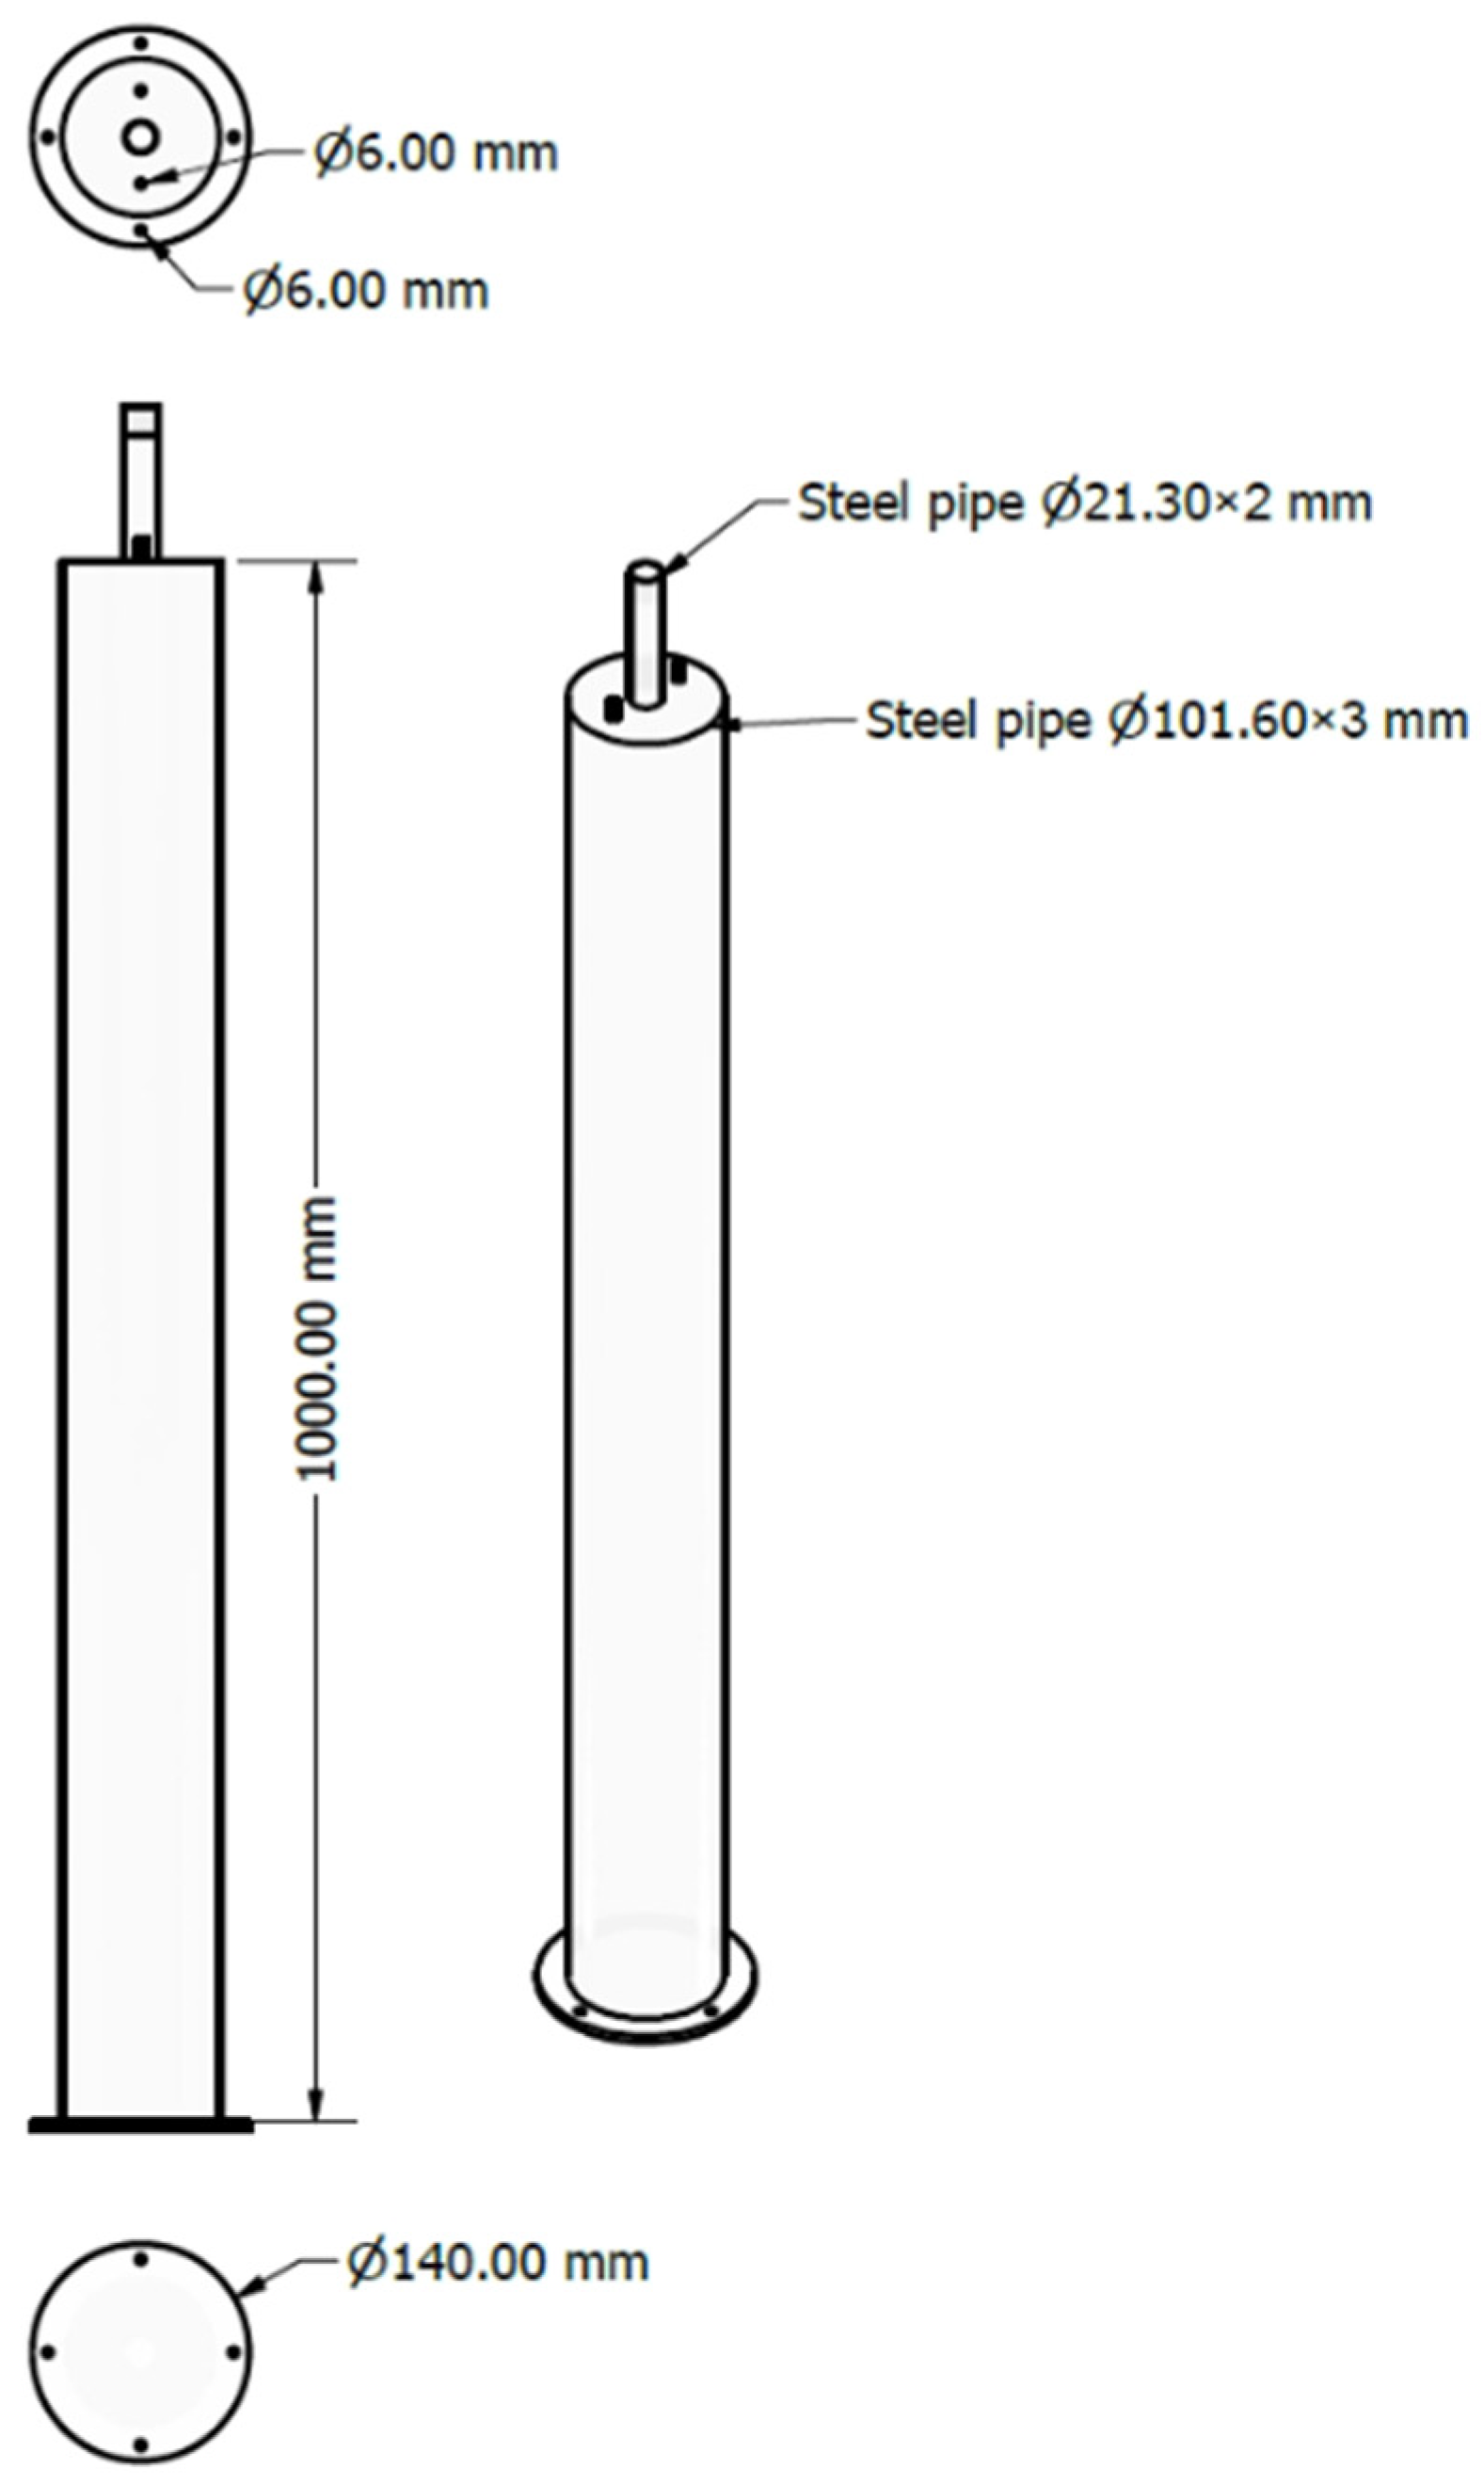
Dimensions: Total height of 1000 mm and external diameter of approximately Ø101 mm, resulting in a storage volume of 7.18 L. Two threaded steel rods (Ø6 mm) are welded at the top and used to fasten the upper cover. A flange is welded at the bottom to ensure complete sealing.
Additional construction details are provided in
Figure 2.
A transparent cylindrical housing surrounds the active region where vaporization and condensation occur, enabling direct visual observation of the internal processes.
Function: Provides a sealed and visible enclosure for the evaporation–condensation environment.
Material: Plexiglas (Röhm GmbH, Sontheim, Germany).
Dimensions: Length of 1200 mm, with an outer diameter of Ø300 mm and an inner diameter of Ø288 mm.
Function: Holds the water to be vaporized and supports the immersion heater. Two lateral handles facilitate handling.
Material: Steel.
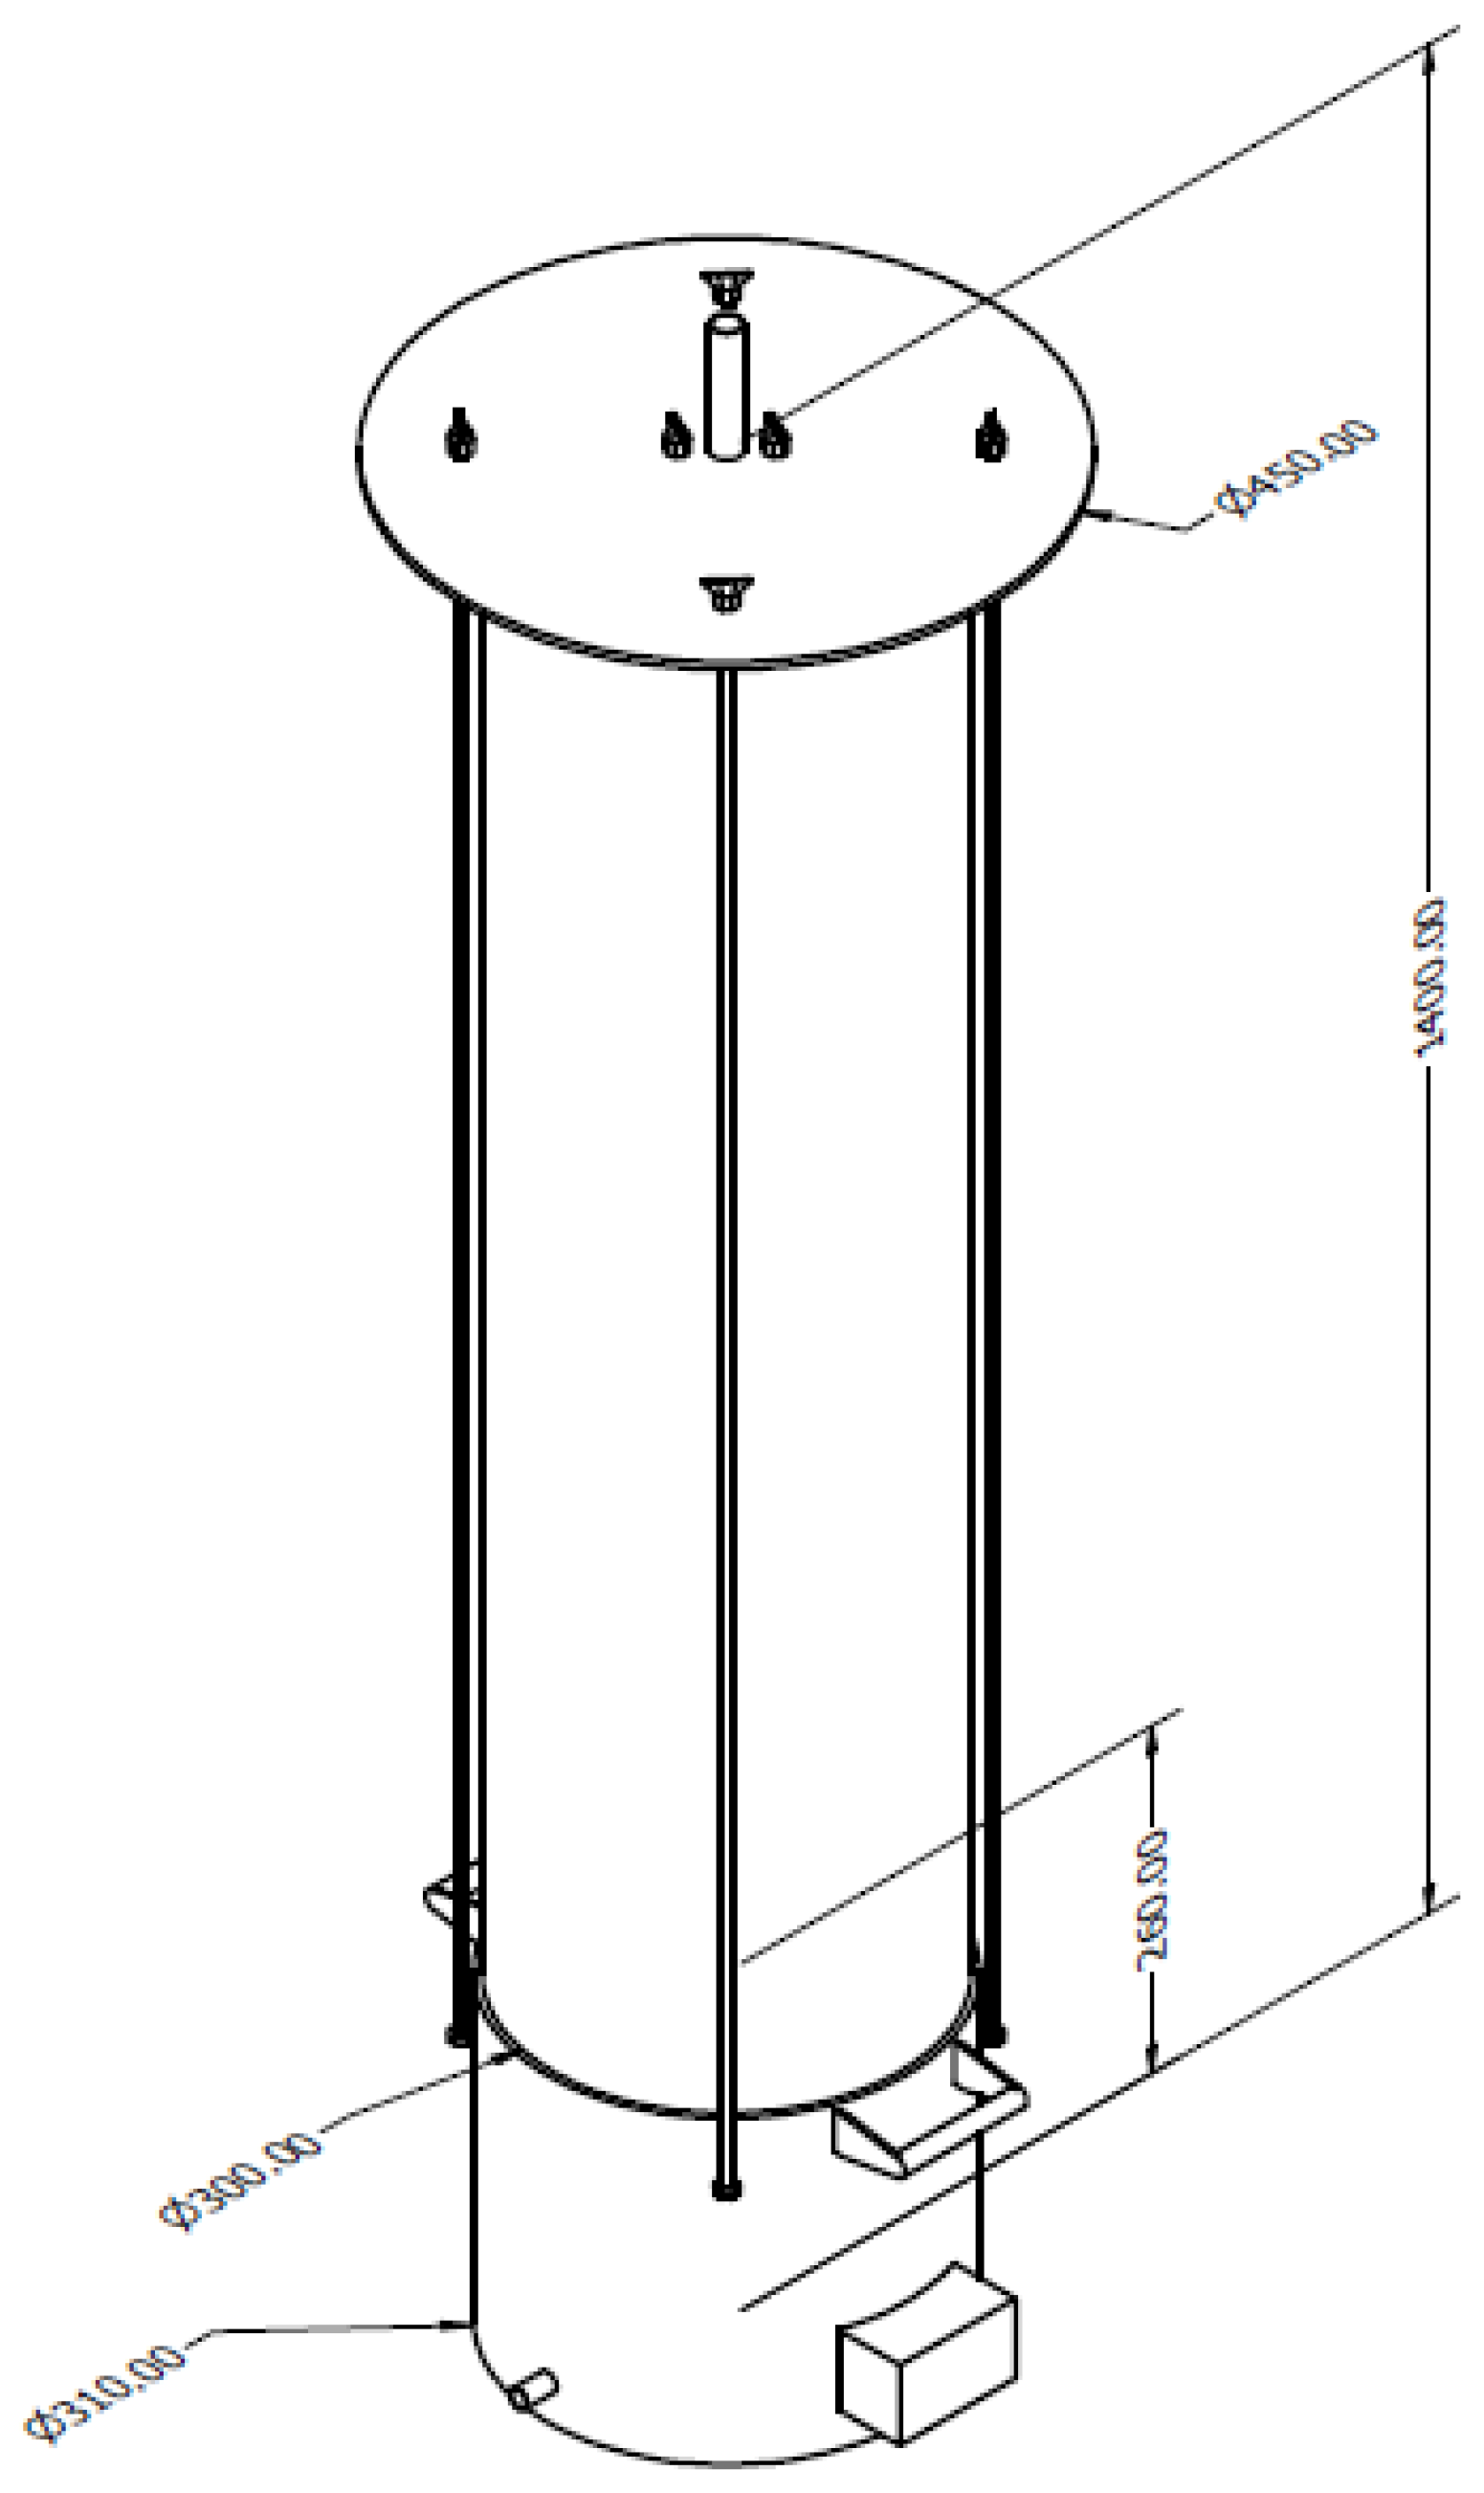
Dimensions: External diameter Ø310 mm, internal diameter Ø290 mm, and a capacity of 17.17 L. The upper edge includes a 60 mm–high interior rim (Ø300 mm), designed to support the Plexiglas tube.
Figure 3 presents the assembly and detailed dimensions.
The heating element is responsible for vapor generation.
Function: Raises the water temperature to the boiling point and sustains evaporation.
Specifications: The immersion heater was rated at 800 W according to the manufacturer’s specifications, and this nominal value was used as the electrical input in the energy balance. No separate in situ measurements of voltage, current, or power factor were performed during the tests; however, the good agreement between the estimated stored heat and the measured temperature evolution supports the consistency of the assumed input power value.
Function: Provides hermetic closure to retain the produced vapor within the system.
Material and Dimensions: Manufactured from steel, with an outer diameter of Ø450 mm.
Function: Ensure vertical alignment and mechanical stability of the equipment while securing the upper cover via a nut-based fastening system.
Material and Dimensions: Four steel rods, each 6 mm in diameter and 1200 mm in height.
Function: Minimizes heat transfer to the surroundings, thereby improving the overall energy retention of the storage system.
Material and Dimensions: Rockwool insulation (ROCKWOOL Group, Hedehusene, Denmark), 10 mm thickness.
2.2. Experimental Setup
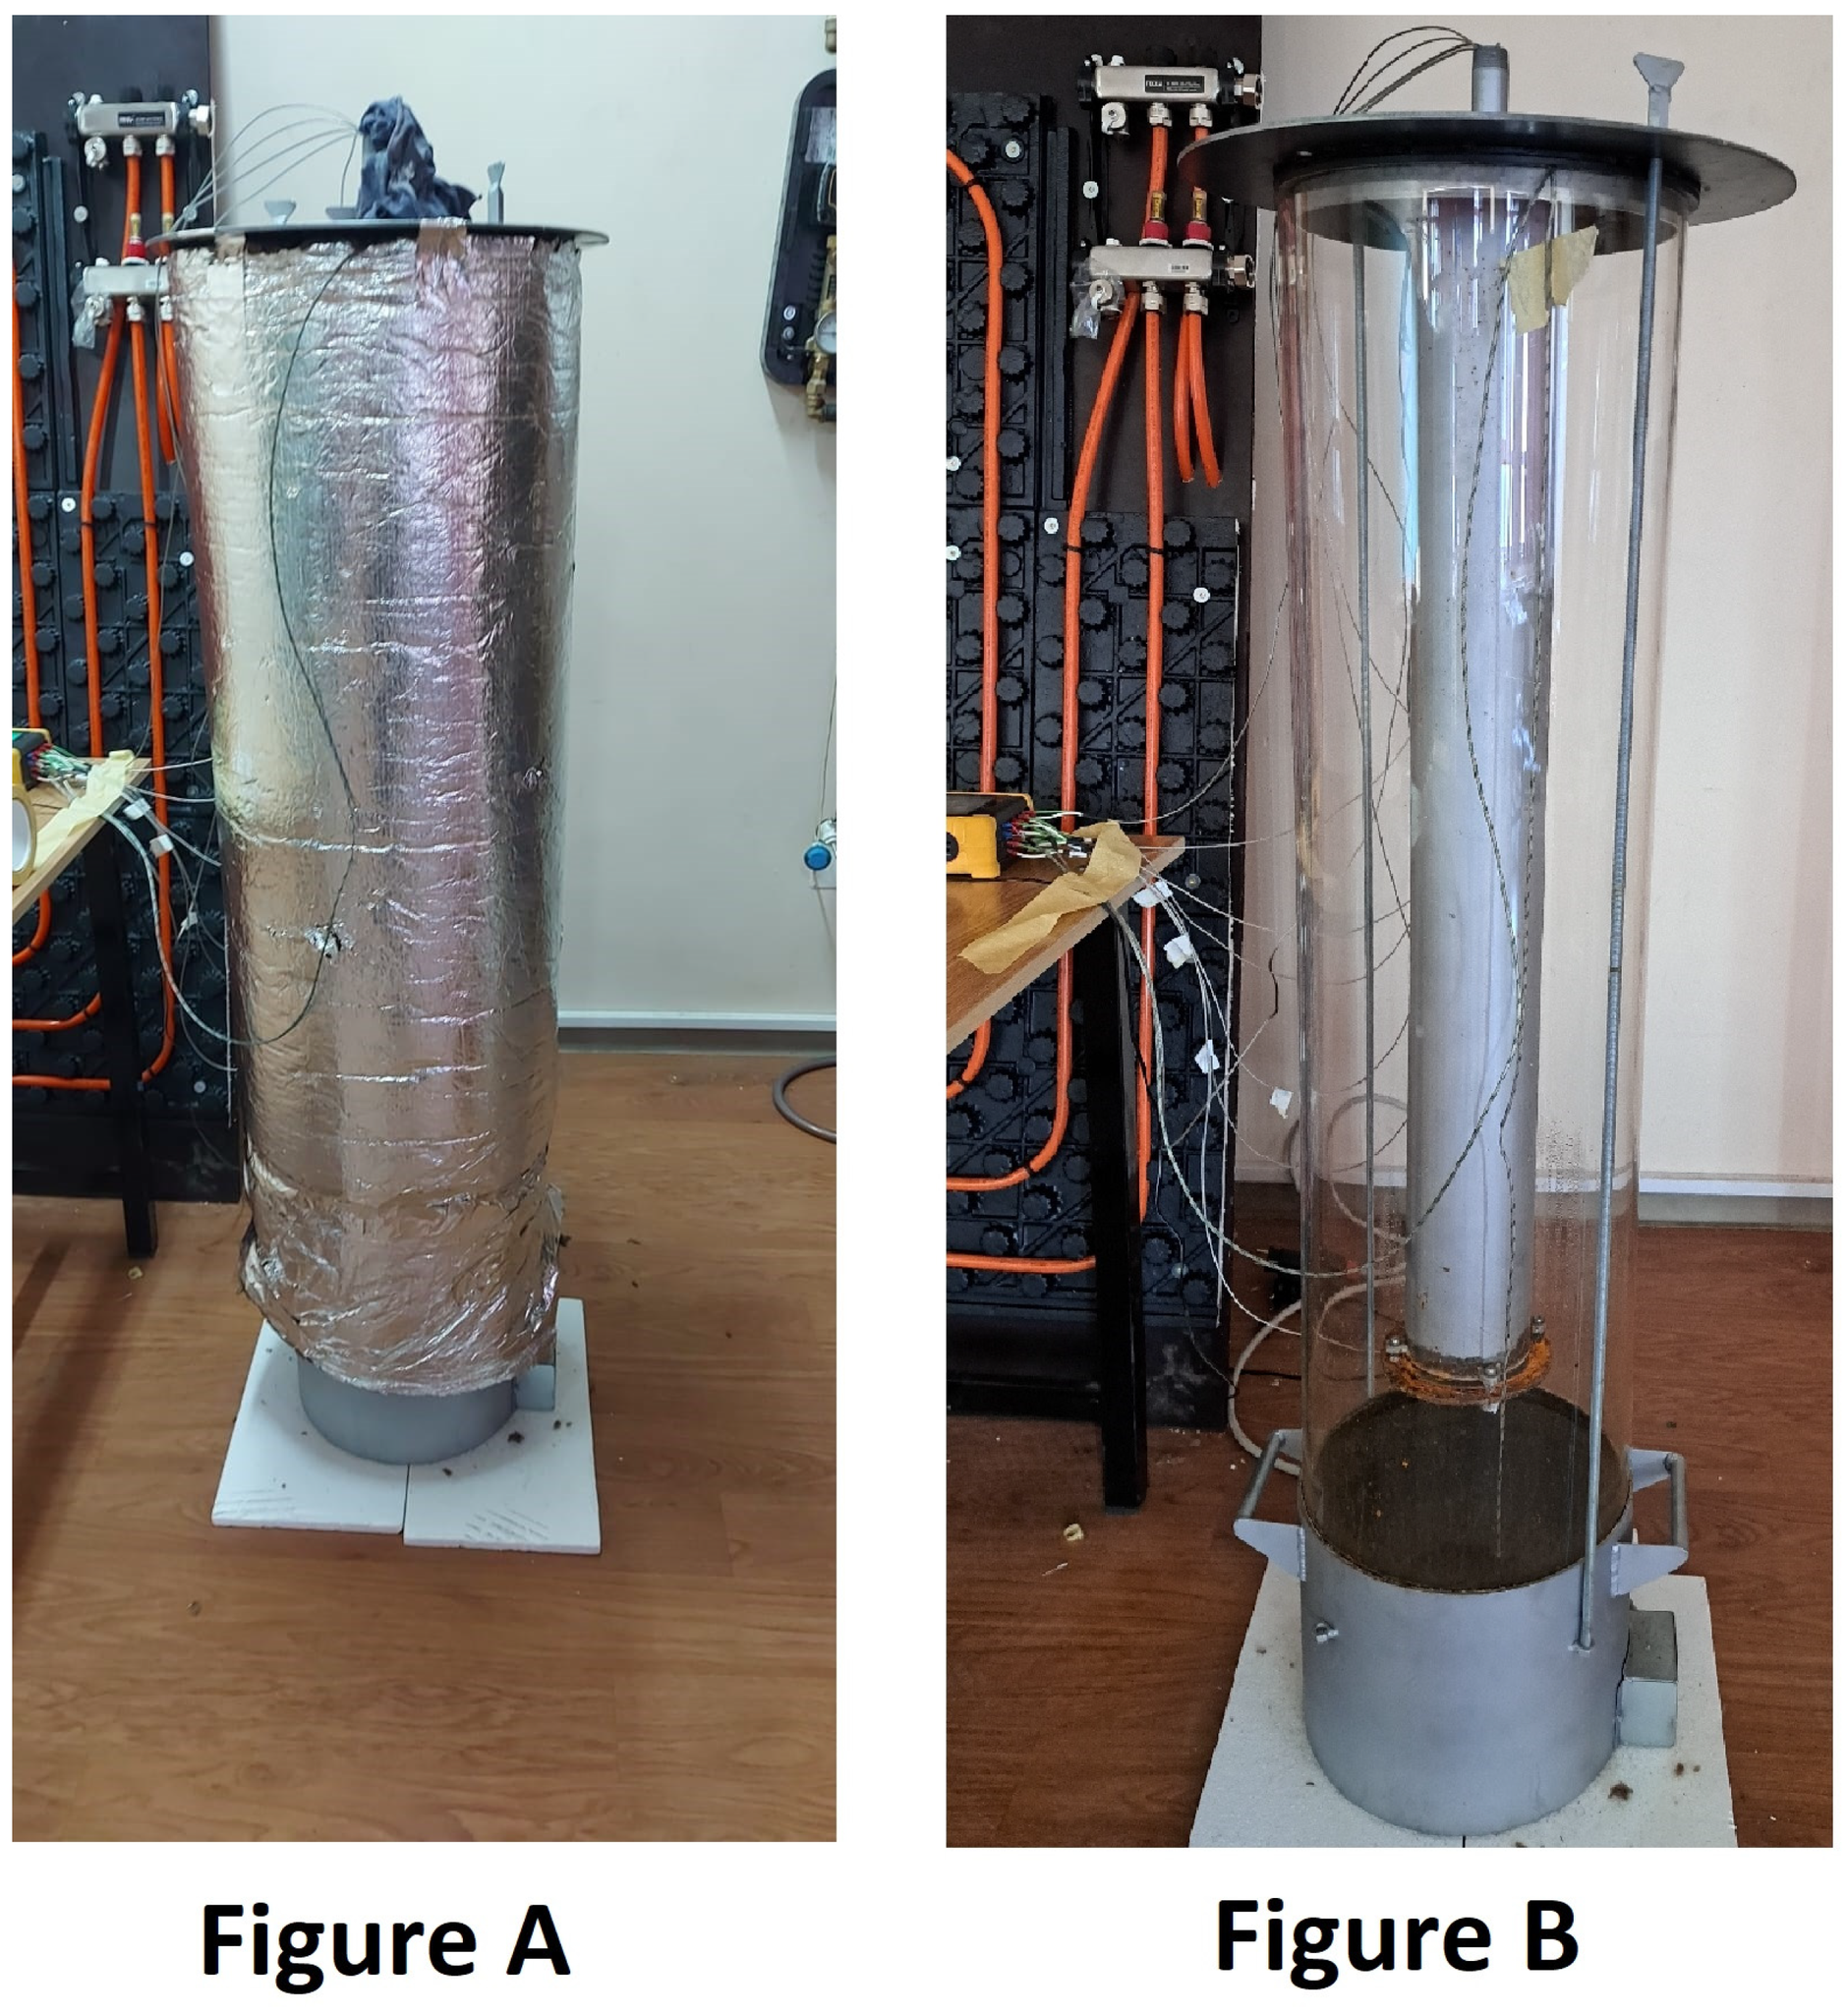
A dedicated laboratory stand was assembled to evaluate the thermal behavior of the storage unit under insulated and non-insulated conditions.
Figure 4 shows the complete setup in both configurations.
The evaporator vessel was supplied with a constant heat input using an 800 W immersion heater, ensuring continuous vapor generation during the charging period. The temperature of the evaporator water was monitored by a dedicated probe placed directly inside the vessel. To characterize the thermal field within the Plexiglas enclosure, air temperature was measured at three vertical locations situated 300 mm, 600 mm, and 900 mm above the evaporator water surface. Inside the steel storage cylinder, five sensors were positioned along its height, at the bottom and at 25 cm, 50 cm, 75 cm, and near the upper section, to capture the internal thermal stratification during heating and cooling.
All measurement points were connected to an LT BTM-4208SD multichannel digital thermometer (Lutron Electronic Enterprise Co., Ltd., Taipei, Taiwan), which provides a stated accuracy of ±0.4%.
2.3. Experimental Investigations
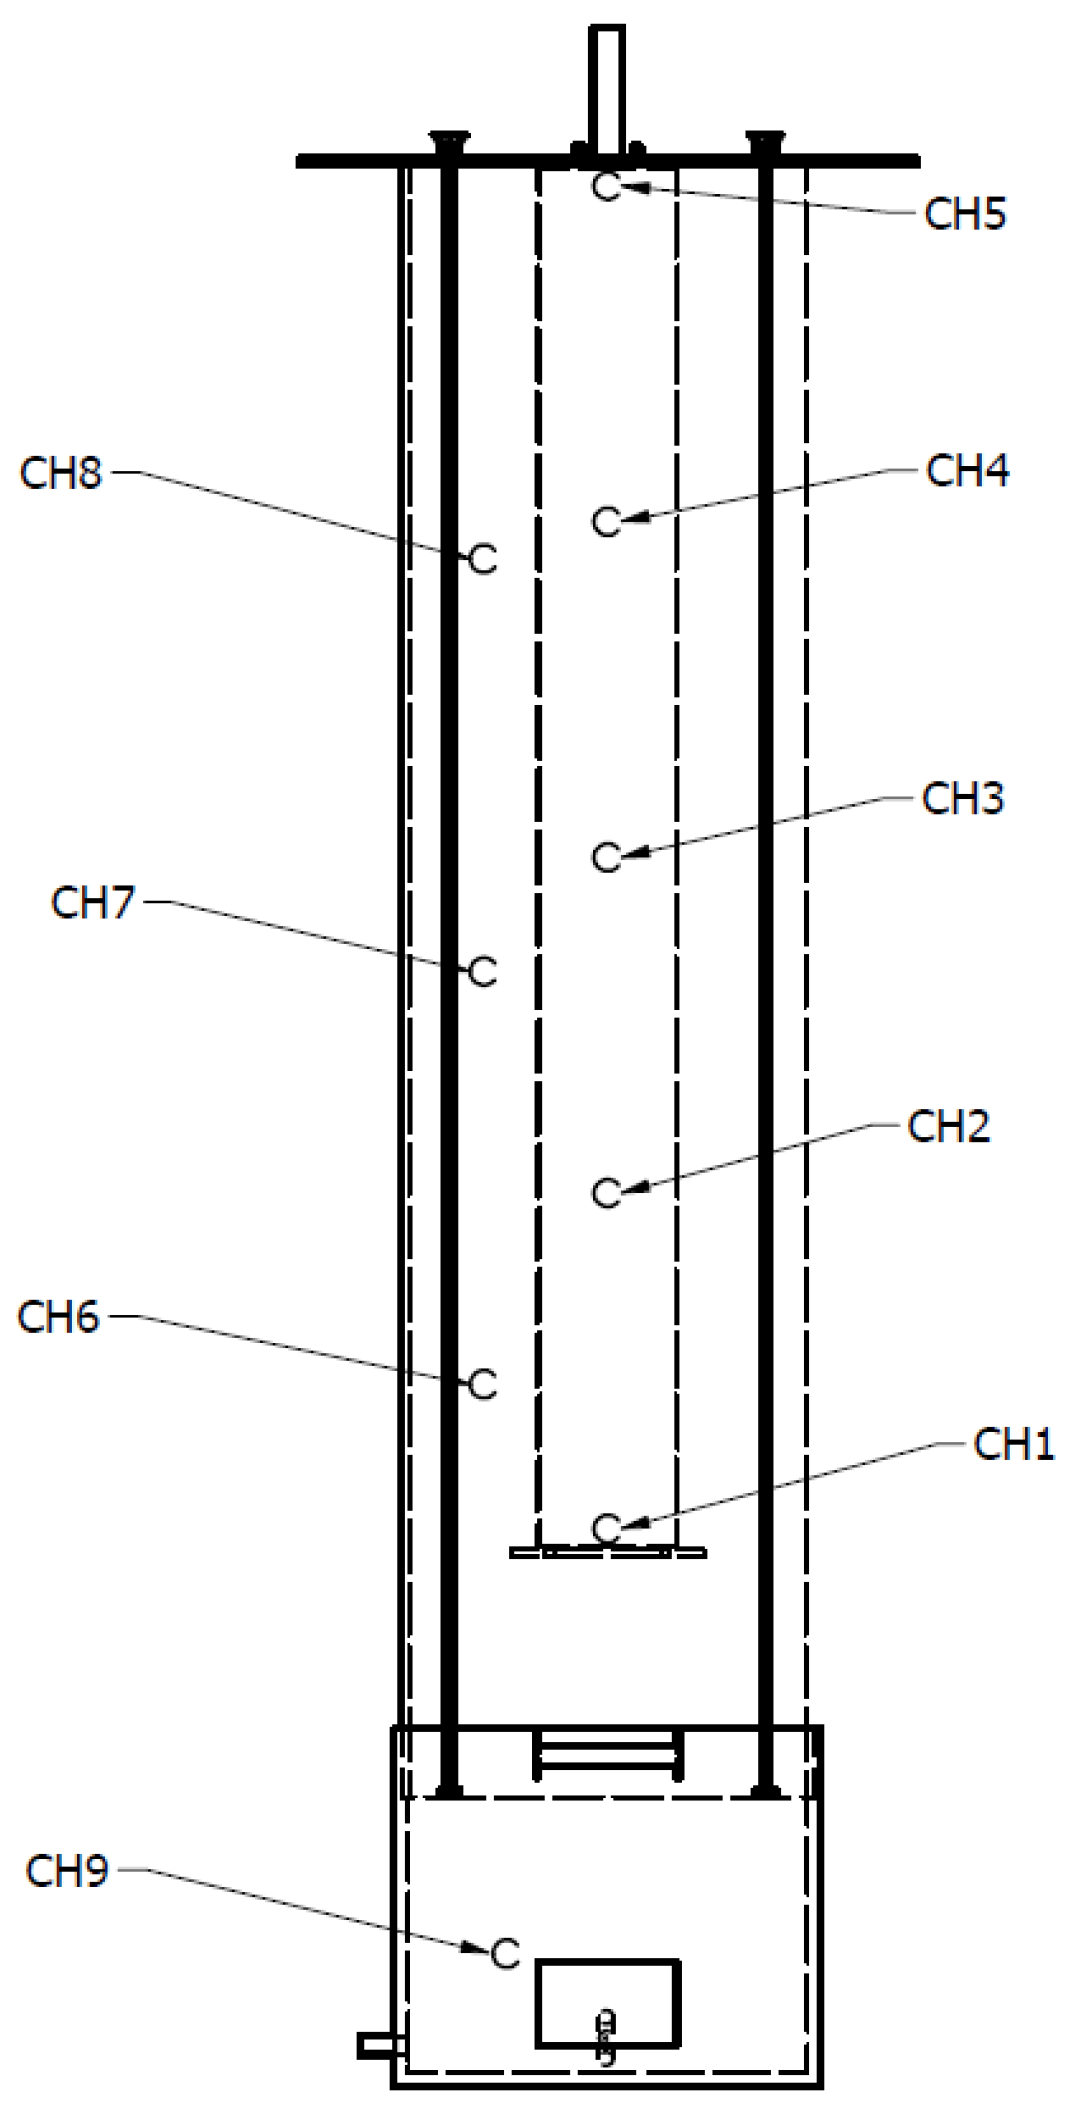
The experimental program was carried out separately for the insulated and non-insulated configurations in order to assess how the presence of the insulating layer influences the thermal response of the system. In each test, the evaporator was filled to its nominal volume of 17.17 L, and the temperature evolution of the entire assembly was monitored continuously for a 24 h interval. The nine temperature sensors shown in
Figure 5 were employed to track the thermal behavior of the evaporator, the surrounding air, and the stored water. Inside the steel storage cylinder, five sensors (CH1–CH5) were immersed directly in the water and positioned along its height at the bottom, 250 mm, 500 mm, 750 mm, and near the upper section of the cylinder, approximately along the central vertical axis rather than on the inner wall, allowing the internal temperature distribution and degree of stratification within the stored water to be examined throughout both heating and cooling. The air/vapor temperature inside the Plexiglas enclosure was recorded by three suspended thermocouples (CH6, CH7, and CH8) located 300 mm, 600 mm, and 900 mm above the evaporator water surface, while sensor CH9 measured the temperature within the evaporator basin.
All temperature measurements were performed using K-type thermocouples connected to an LT BTM-4208SD multichannel digital thermometer, which provides a stated accuracy of ±0.4 °C over the operating range relevant to this study. The thermocouples were operated without additional laboratory calibration; therefore, the overall uncertainty of individual temperature readings was estimated by combining in quadrature the thermometer accuracy with a typical K-type thermocouple tolerance of ±1.5 °C, resulting in an approximate expanded uncertainty of ±1.6 °C (k = 2). The immersed sensors (CH1–CH5 and CH9) exhibit a relatively fast thermal response and reduced placement uncertainty due to direct contact with the liquid, whereas the suspended probes in the air/vapor region (CH6–CH8) are more sensitive to local convective currents and thus display larger short-term fluctuations, particularly during the cooling phase. Since the stored sensible heat was calculated from averaged water temperatures together with the known mass and specific heat of the storage medium, the associated relative uncertainty in the derived energy content and storage efficiency remains on the order of a few percent, which is acceptable for the comparative assessment between the insulated and non-insulated configurations.
During each experiment, the LT BTM-4208SD unit acquired data at 60 s intervals for the entire duration of the tests. Each test consisted of two distinct phases. During the charging phase, the 800 W immersion heater was switched on and maintained active until the temperatures in the evaporator, in the enclosure air, and along the height of the storage cylinder approached a quasi-steady regime. When this condition was reached, the heater was turned off, and the system transitioned into the discharging phase, during which the assembly cooled naturally. Temperature measurements continued until the water in both the evaporator and the storage cylinder, as well as the air inside the enclosure, returned to values close to their initial pre-heating levels. Repeating this procedure for the insulated and non-insulated variants enabled a direct comparison of heat-retention capability, internal temperature gradients, and overall thermal performance.
2.4. Numerical Simulations
To obtain a detailed understanding of the coupled vaporization–condensation phenomena occurring inside the experimental system during the charging phase, a numerical model was developed and solved using Ansys Fluent 2023 R2. The simulation was designed to reproduce the thermal and fluid–dynamic behavior of the water contained in the evaporator, the air trapped inside the Plexiglas enclosure, and the water stored in the steel cylinder, as well as the interactions between vapor and condensate as phase change takes place. The thermophysical properties of all materials included in the model, specifically density, thermal conductivity, and specific heat, were taken from literature and are summarized in
Table 1.
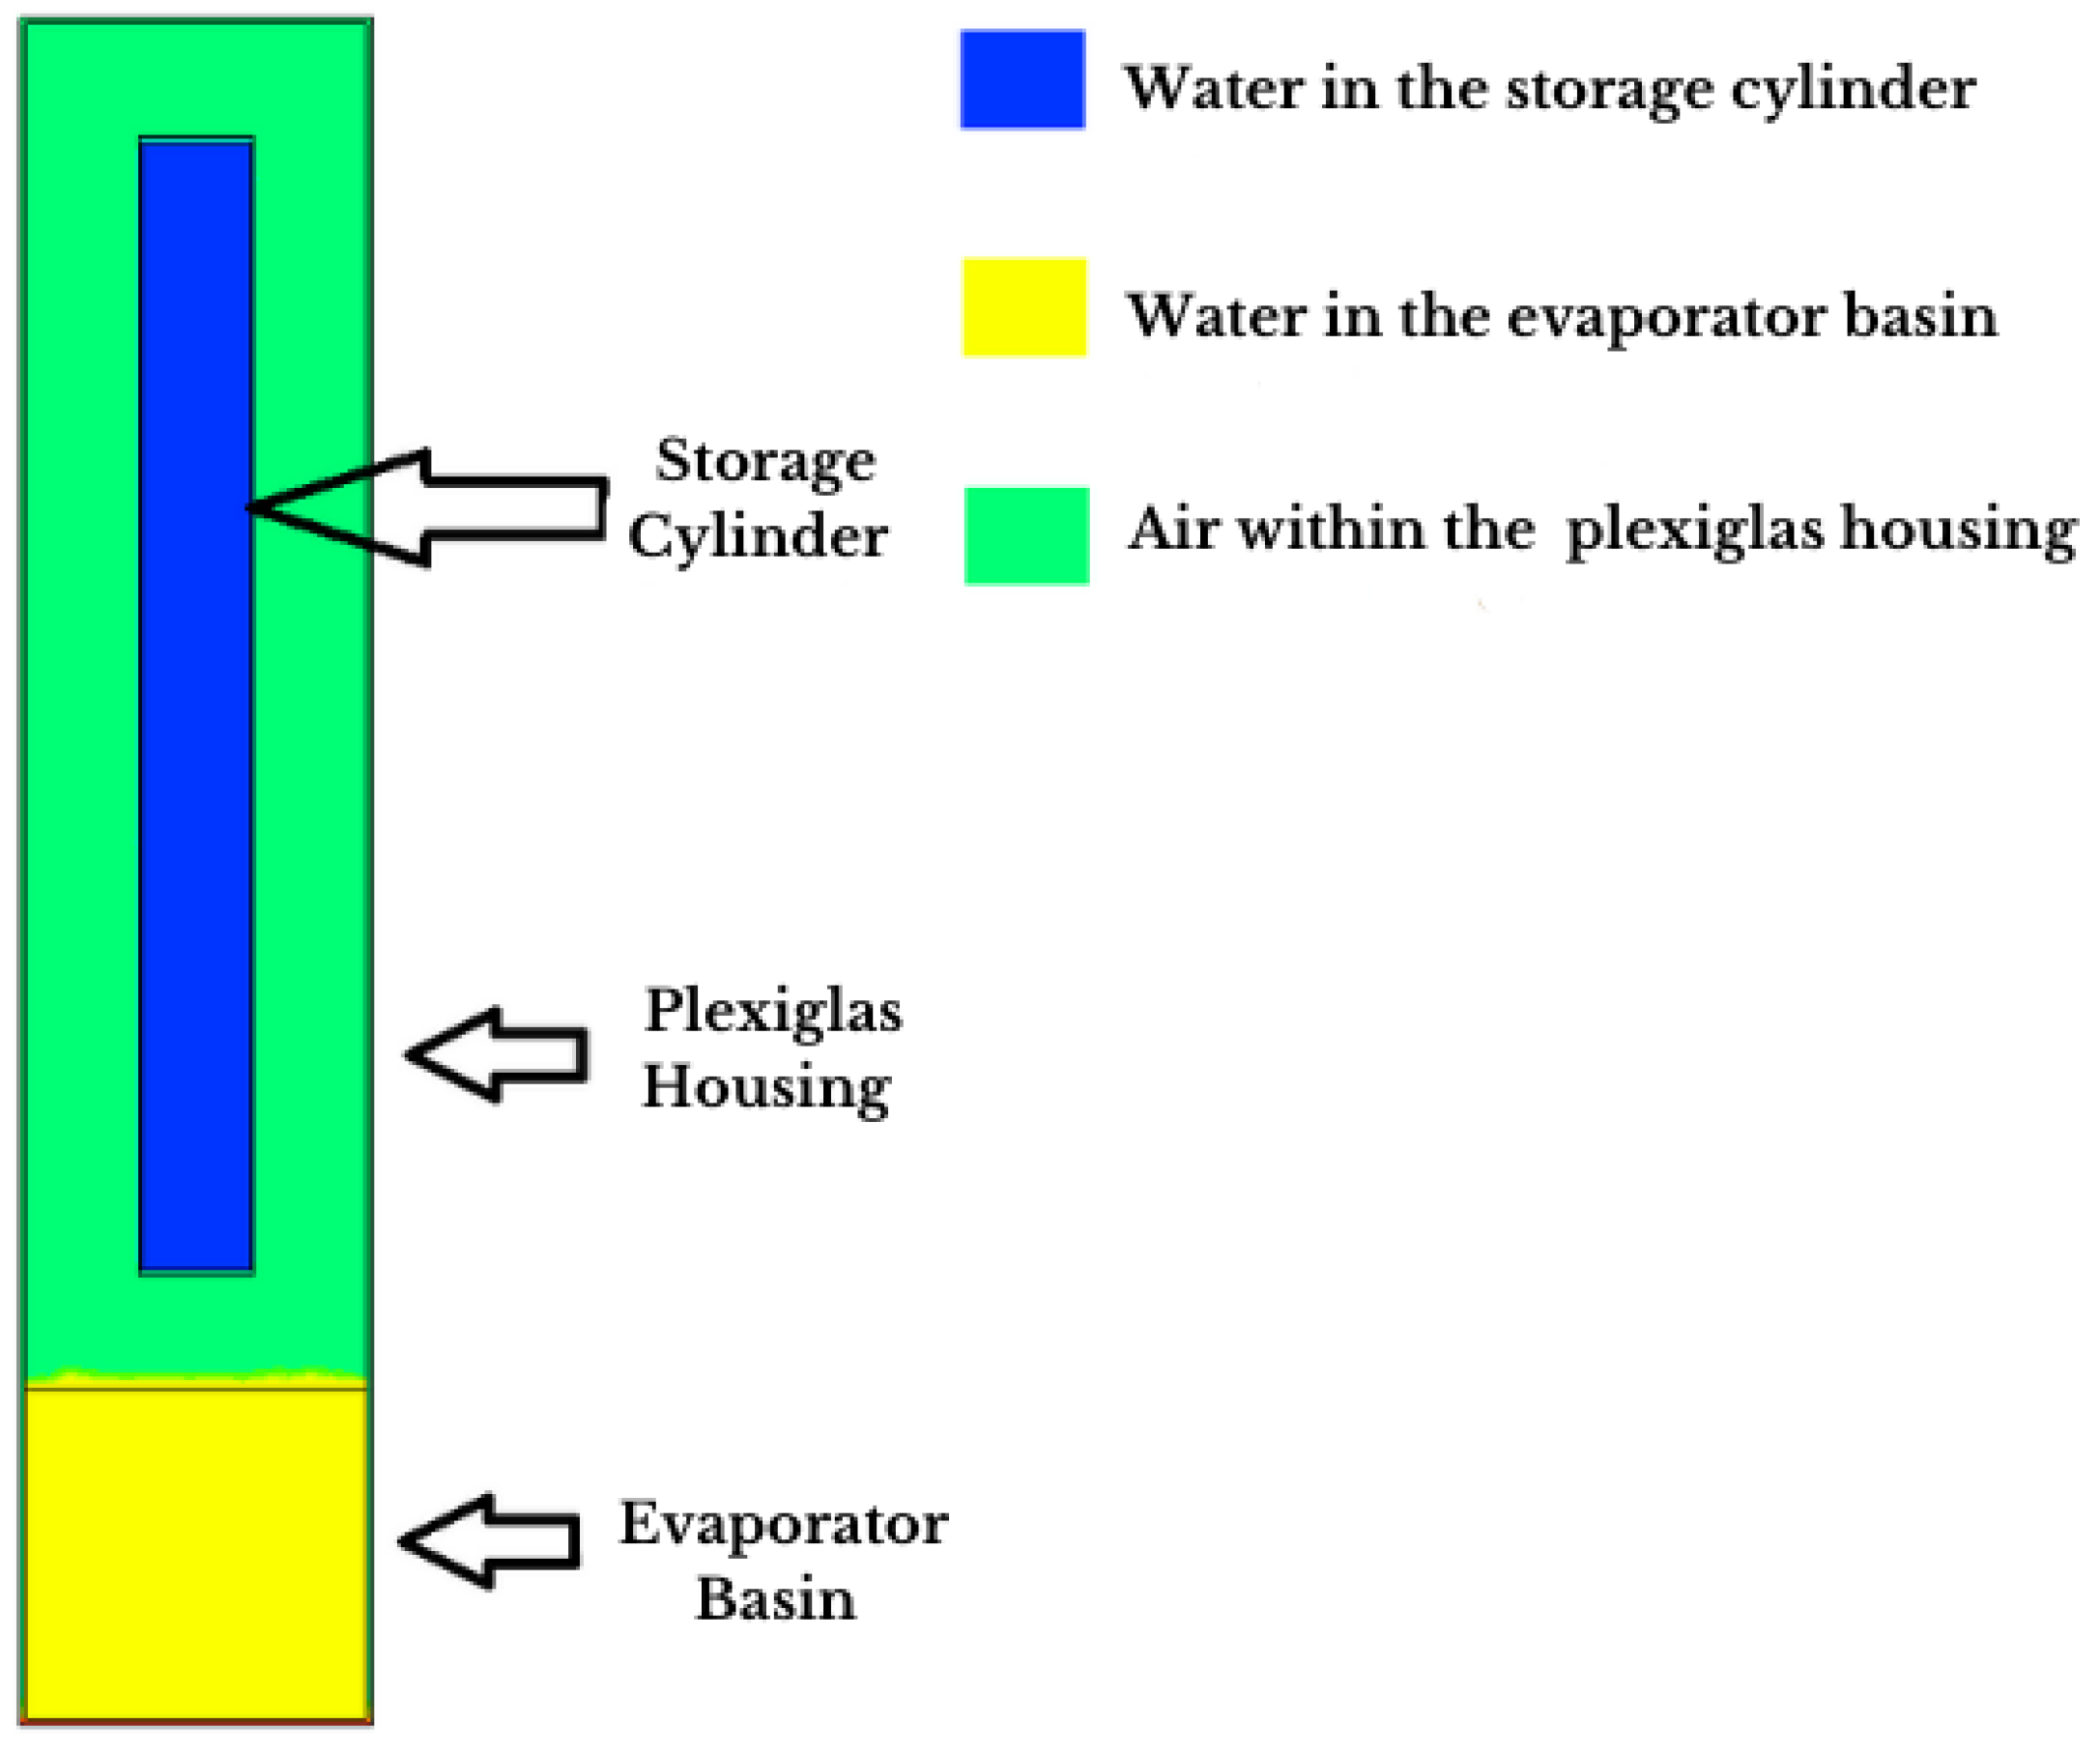
Because fully resolving the three-dimensional geometry at real scale would require substantial computational resources, the analysis was performed on a full-scale cross-sectional representation of the setup with a thickness of 10 mm. This approach preserved the essential physics of the process while maintaining a manageable computational cost. The main components of the simulated domain are illustrated in
Figure 6.
The multiphase nature of the process was represented using the Volume of Fluid (VOF) method, which allows tracking of the liquid–vapor interface and captures the progressive formation of vapor in the evaporator and its subsequent condensation on the walls of the storage cylinder. Stainless steel was assigned as the material for both the evaporator and the cylinder walls, water was defined as the initial fluid phase in the evaporator basin and inside the storage cylinder, while air filled the region corresponding to the Plexiglas enclosure.
The computational mesh was generated in Ansys Meshing using a structured grid with an average element size of 4 mm in the fluid regions, resulting in approximately 90,000 control volumes and 130,000 nodes for the two-dimensional cross-sectional domain. Grid refinement was applied in the vicinity of the storage-cylinder walls and the evaporator region to better resolve thermal and velocity gradients near the phase-change interface. Transient simulations were performed in Ansys Fluent 2023 R2 using a fixed time-step of 0.005 s and 200,000 time steps, with a maximum of seven iterations per time step; this choice kept local Courant numbers below unity in the regions of interest throughout the calculation. Convergence at each time step was monitored by requiring all normalized residuals to fall below 10−4 for continuity, momentum, and energy, while also checking the stability of volume-averaged temperatures in the evaporator, enclosure air, and storage water.
Turbulent flow was modeled with the realizable k-ε model combined with enhanced wall treatment, which provides adequate near-wall resolution for mixed natural-convection and phase-change conditions at the investigated scales. The three-phase VOF setup included water, air, and water vapor, together with surface-tension effects between all phase pairs. For interface reconstruction, the Geo-Reconstruct scheme was employed, while momentum, energy, and volume-fraction equations were discretized using second-order upwind or second-order schemes, as appropriate. Given the already high computational cost (several weeks of wall-clock time for the full transient run), further systematic mesh and time-step refinement studies were not performed; however, the good agreement between the simulated and measured temperature evolutions during charging supports the adequacy of the adopted numerical resolution for the present scope.
To accelerate numerical convergence and reduce computation time, the initial temperatures of the fluids were set to values slightly above the ambient experimental conditions, namely 40 °C for the water inside the storage cylinder and 70 °C for the air within the Plexiglas enclosure. These pre-heated initial states shorten the early conduction-dominated warm-up period but do not affect the subsequent boiling-driven convection regime that is the main focus of the analysis. A comparison between the simulated and measured temperature evolutions during the charging phase shows that, once vapor generation starts, the CFD predictions reproduce the experimental trends and peak temperatures with good agreement, indicating that the chosen initial conditions do not compromise the validity of the numerical results. A constant-temperature boundary condition of 110 °C was imposed on the outer surface of the evaporator vessel to raise the water to the boiling point and initiate vapor generation, and the model included the saturation temperature corresponding to atmospheric pressure, together with the latent-heat parameters for vaporization and condensation, enabling accurate prediction of the onset and progression of phase change.
The transient simulation was advanced in time using the above settings for energy and momentum, allowing the temperature fields in the evaporator, enclosure air, and storage cylinder to evolve consistently with the phase-change dynamics observed experimentally. The numerical results were subsequently compared with the measurements obtained during the charging phase, providing validation of the model and insight into the dominant mechanisms controlling heat transfer from the evaporator to the storage cylinder.
3. Results
3.1. Experimental Results
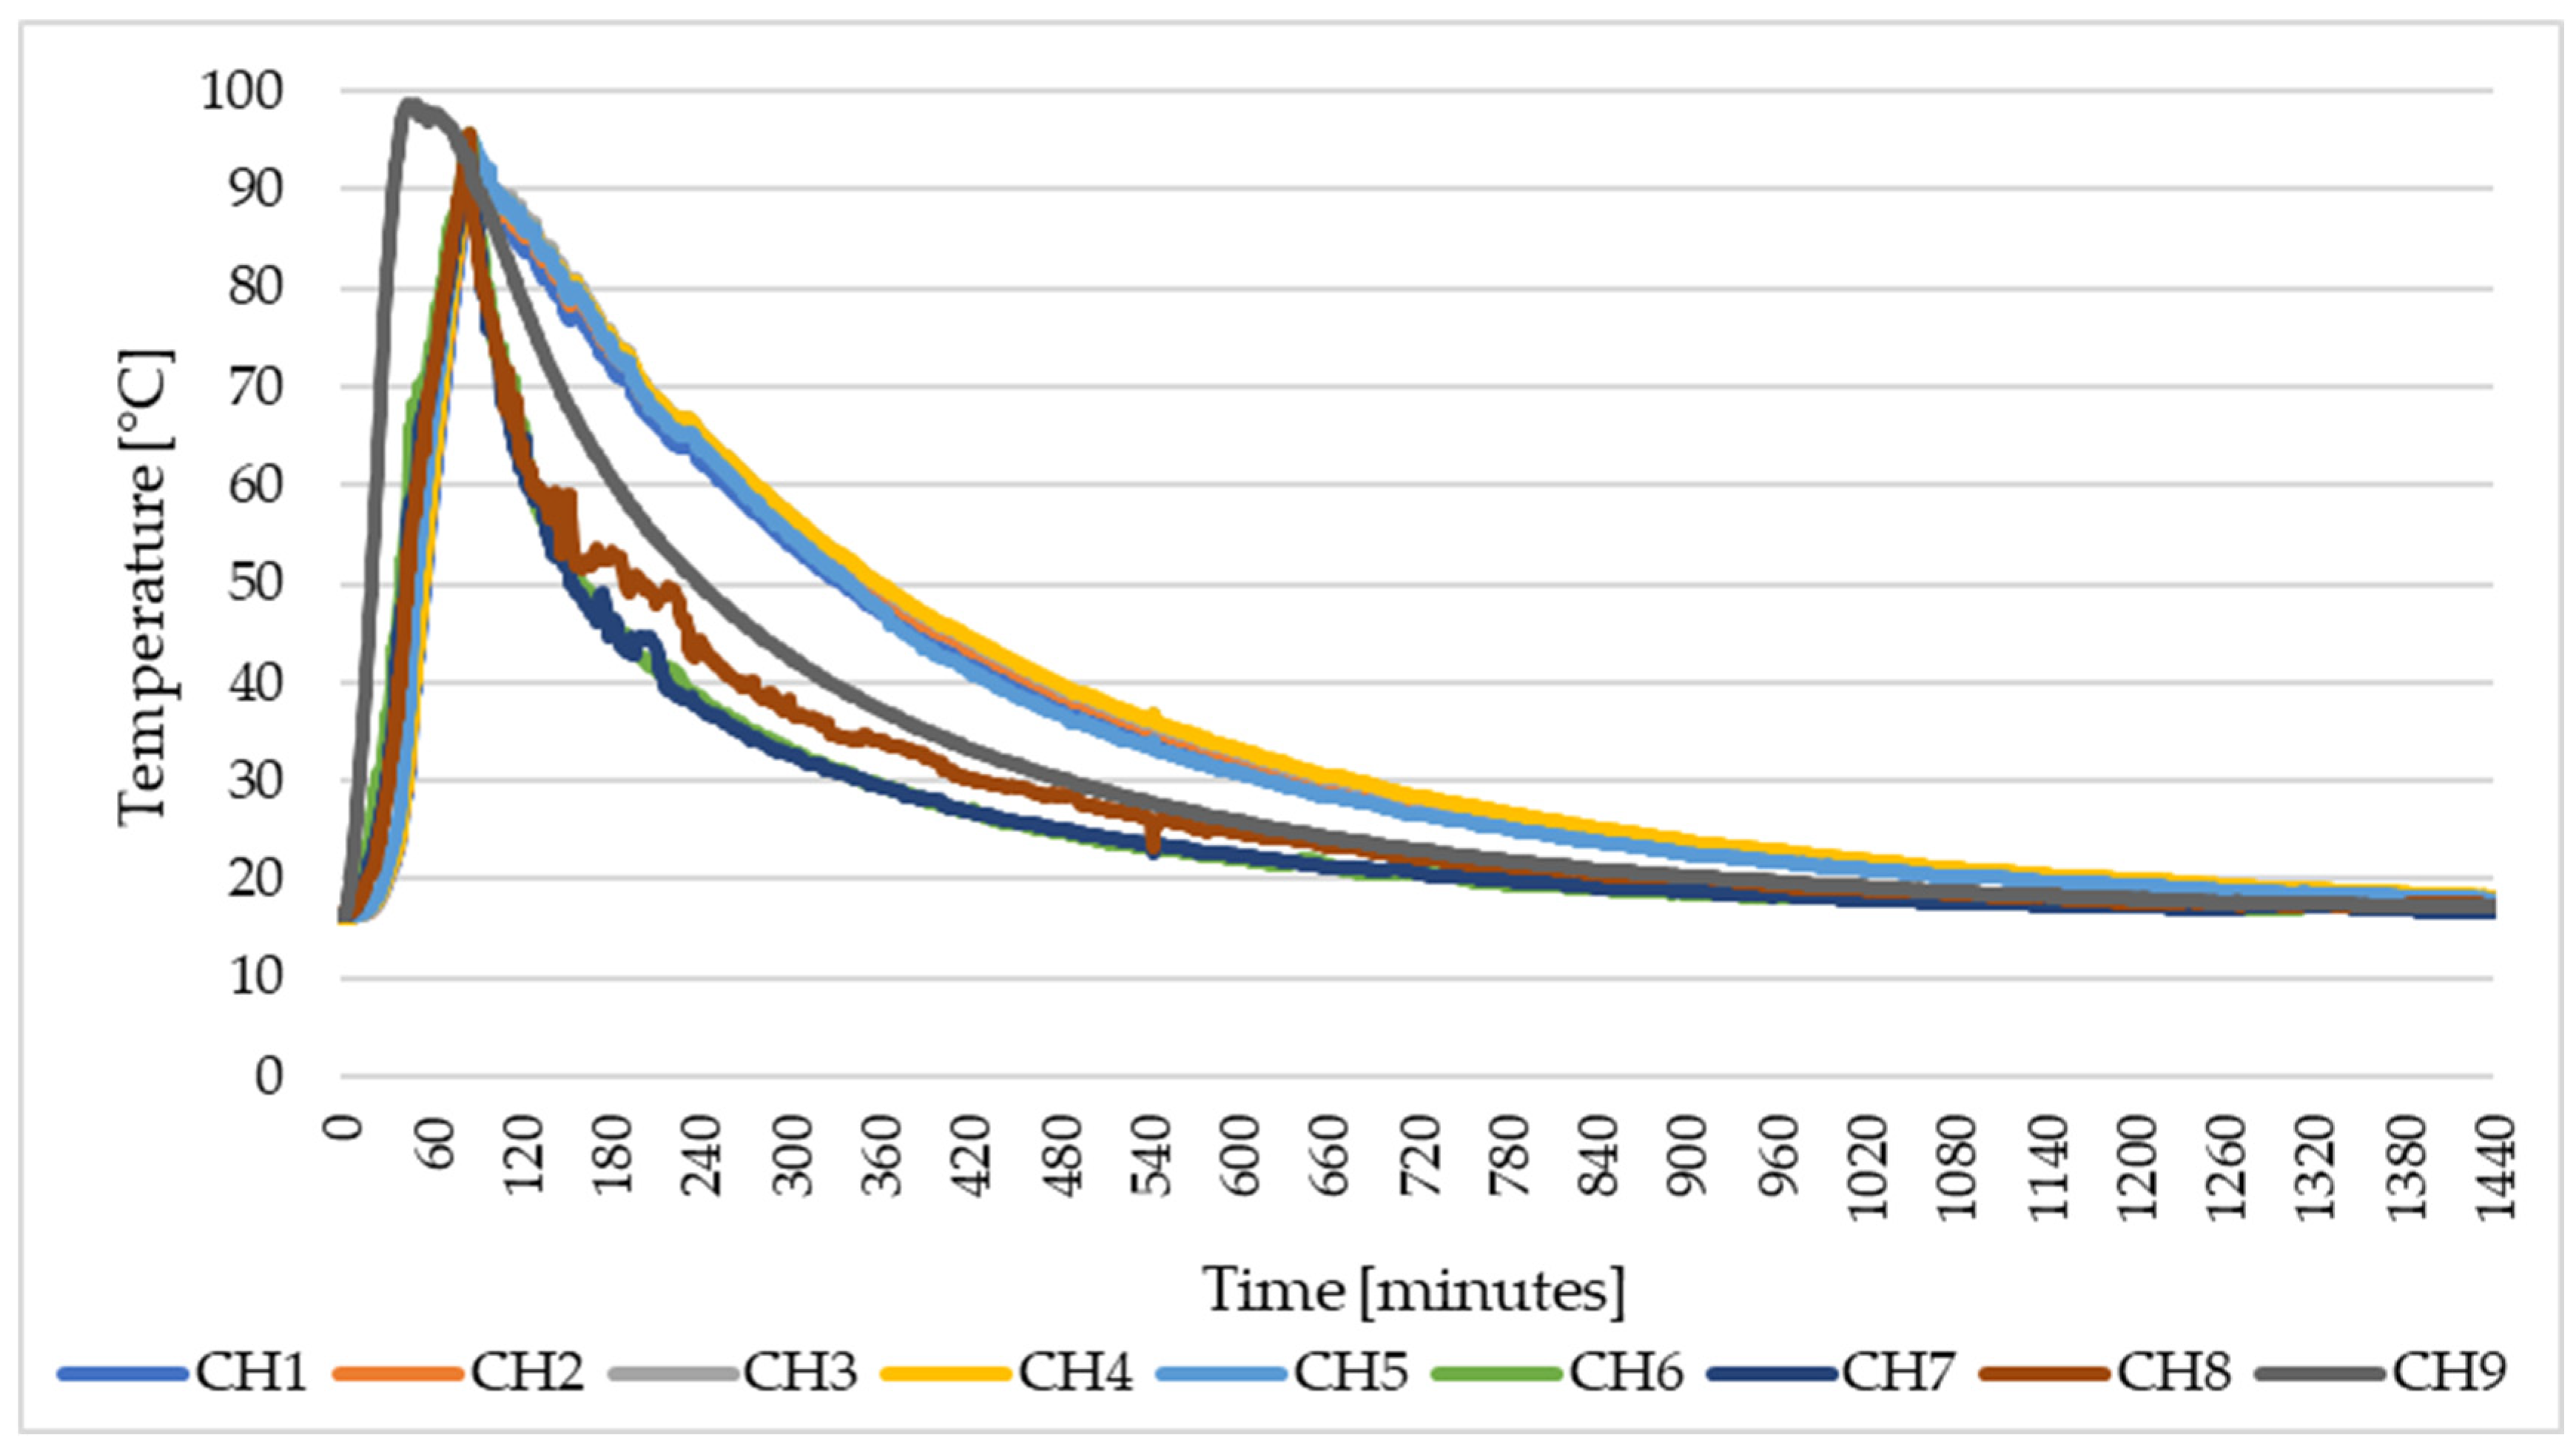
The thermal response of the system was first examined in the configuration without insulation, using the nine temperature probes distributed along the height of the steel cylinder, within the Plexiglas enclosure, and inside the evaporator vessel. The individual sensor readings are shown in
Figure 7.
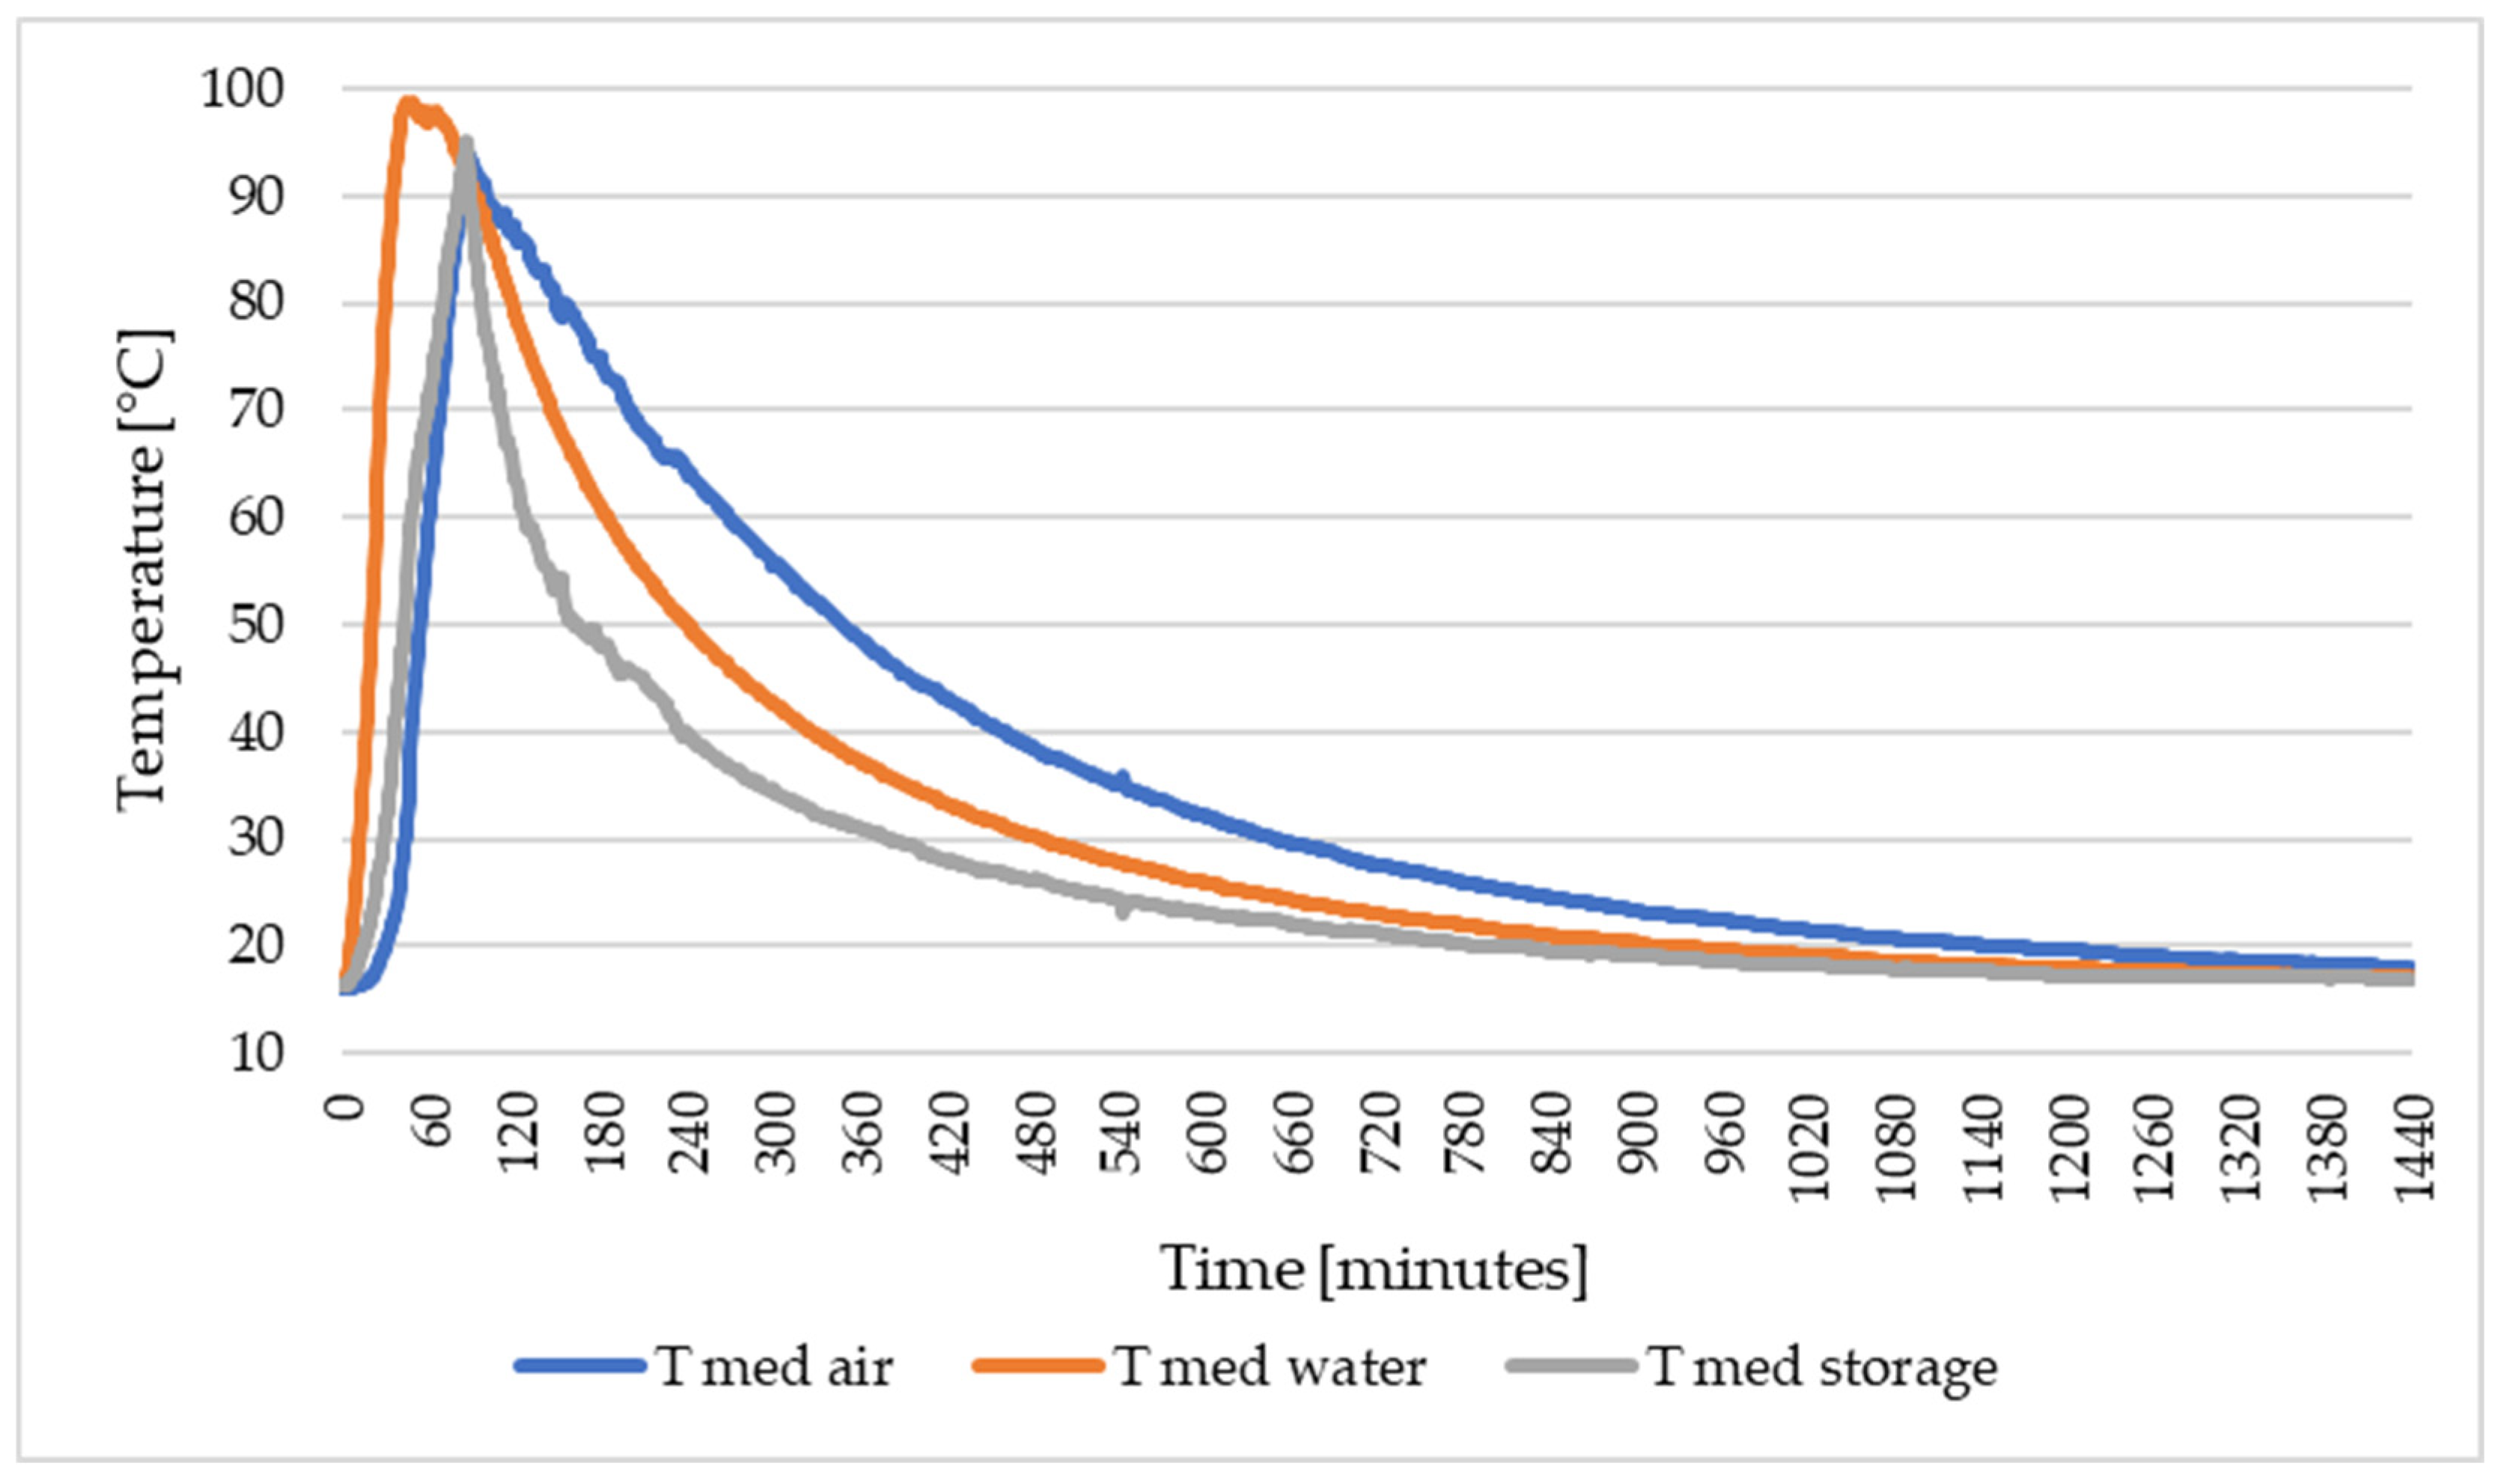
During the natural cooling stage, the probe positioned at the uppermost point of the enclosure (CH8, located 900 mm above the water surface) exhibited the largest temperature fluctuations, indicating strong sensitivity to convective air movements within the tube. In particular, the oscillation visible around 540 min is associated with intermittent buoyancy-driven air currents and local mixing in the upper region of the enclosure during free cooling. To facilitate the interpretation of the overall thermal evolution, average temperatures were computed for the water inside the storage cylinder (mean of CH1–CH5) and for the air in the enclosure and evaporator region (mean of CH6–CH9). These averaged quantities are presented in
Figure 8 and provide a clearer view of the simultaneous heating and cooling of the three thermal masses.
During the heating-up stage, the average temperature of the storage-cylinder water temporarily exceeds the average air temperature inside the enclosure. This behavior arises because the vapor generated in the evaporator preferentially condenses on the steel walls of the storage cylinder, transferring latent heat directly to the stored water, whereas the air within the Plexiglas enclosure remains only partially mixed and thus retains locally cooler regions. The average water temperature is computed from five immersed thermocouples distributed along the cylinder height (CH1–CH5), while the average air temperature is derived from three suspended probes located at the same radial position (CH6–CH8), which provide a consistent indication of the temporal evolution of the air temperature in the central region of the enclosure.
At the beginning of the test, the water in the evaporator, the water within the cylinder, and the air inside the Plexiglas enclosure were all at the laboratory ambient temperature of 16.2 °C. Once the 800 W heater was activated, the evaporator water warmed rapidly and reached its boiling point of 98.7 °C after 42 min. At this point, the increase in temperature within the storage cylinder lagged behind, having reached only 52.7 °C, while the air temperature inside the enclosure was approximately 30.2 °C. The pronounced difference between the temperature of the storage water and that of the air demonstrates the substantial heat losses occurring through the Plexiglas enclosure, which limit the amount of energy transferred to the stored water. Heating continued until the water in the storage cylinder reached its maximum temperature of 95.2 °C, achieved after 1 h 38 min of operation. At that moment, the heater was switched off, marking the beginning of the discharge phase. Over the subsequent 24 h, all three media gradually cooled, with the air stabilizing at 18 °C and both the evaporator water and the stored water returning to approximately 17 °C.
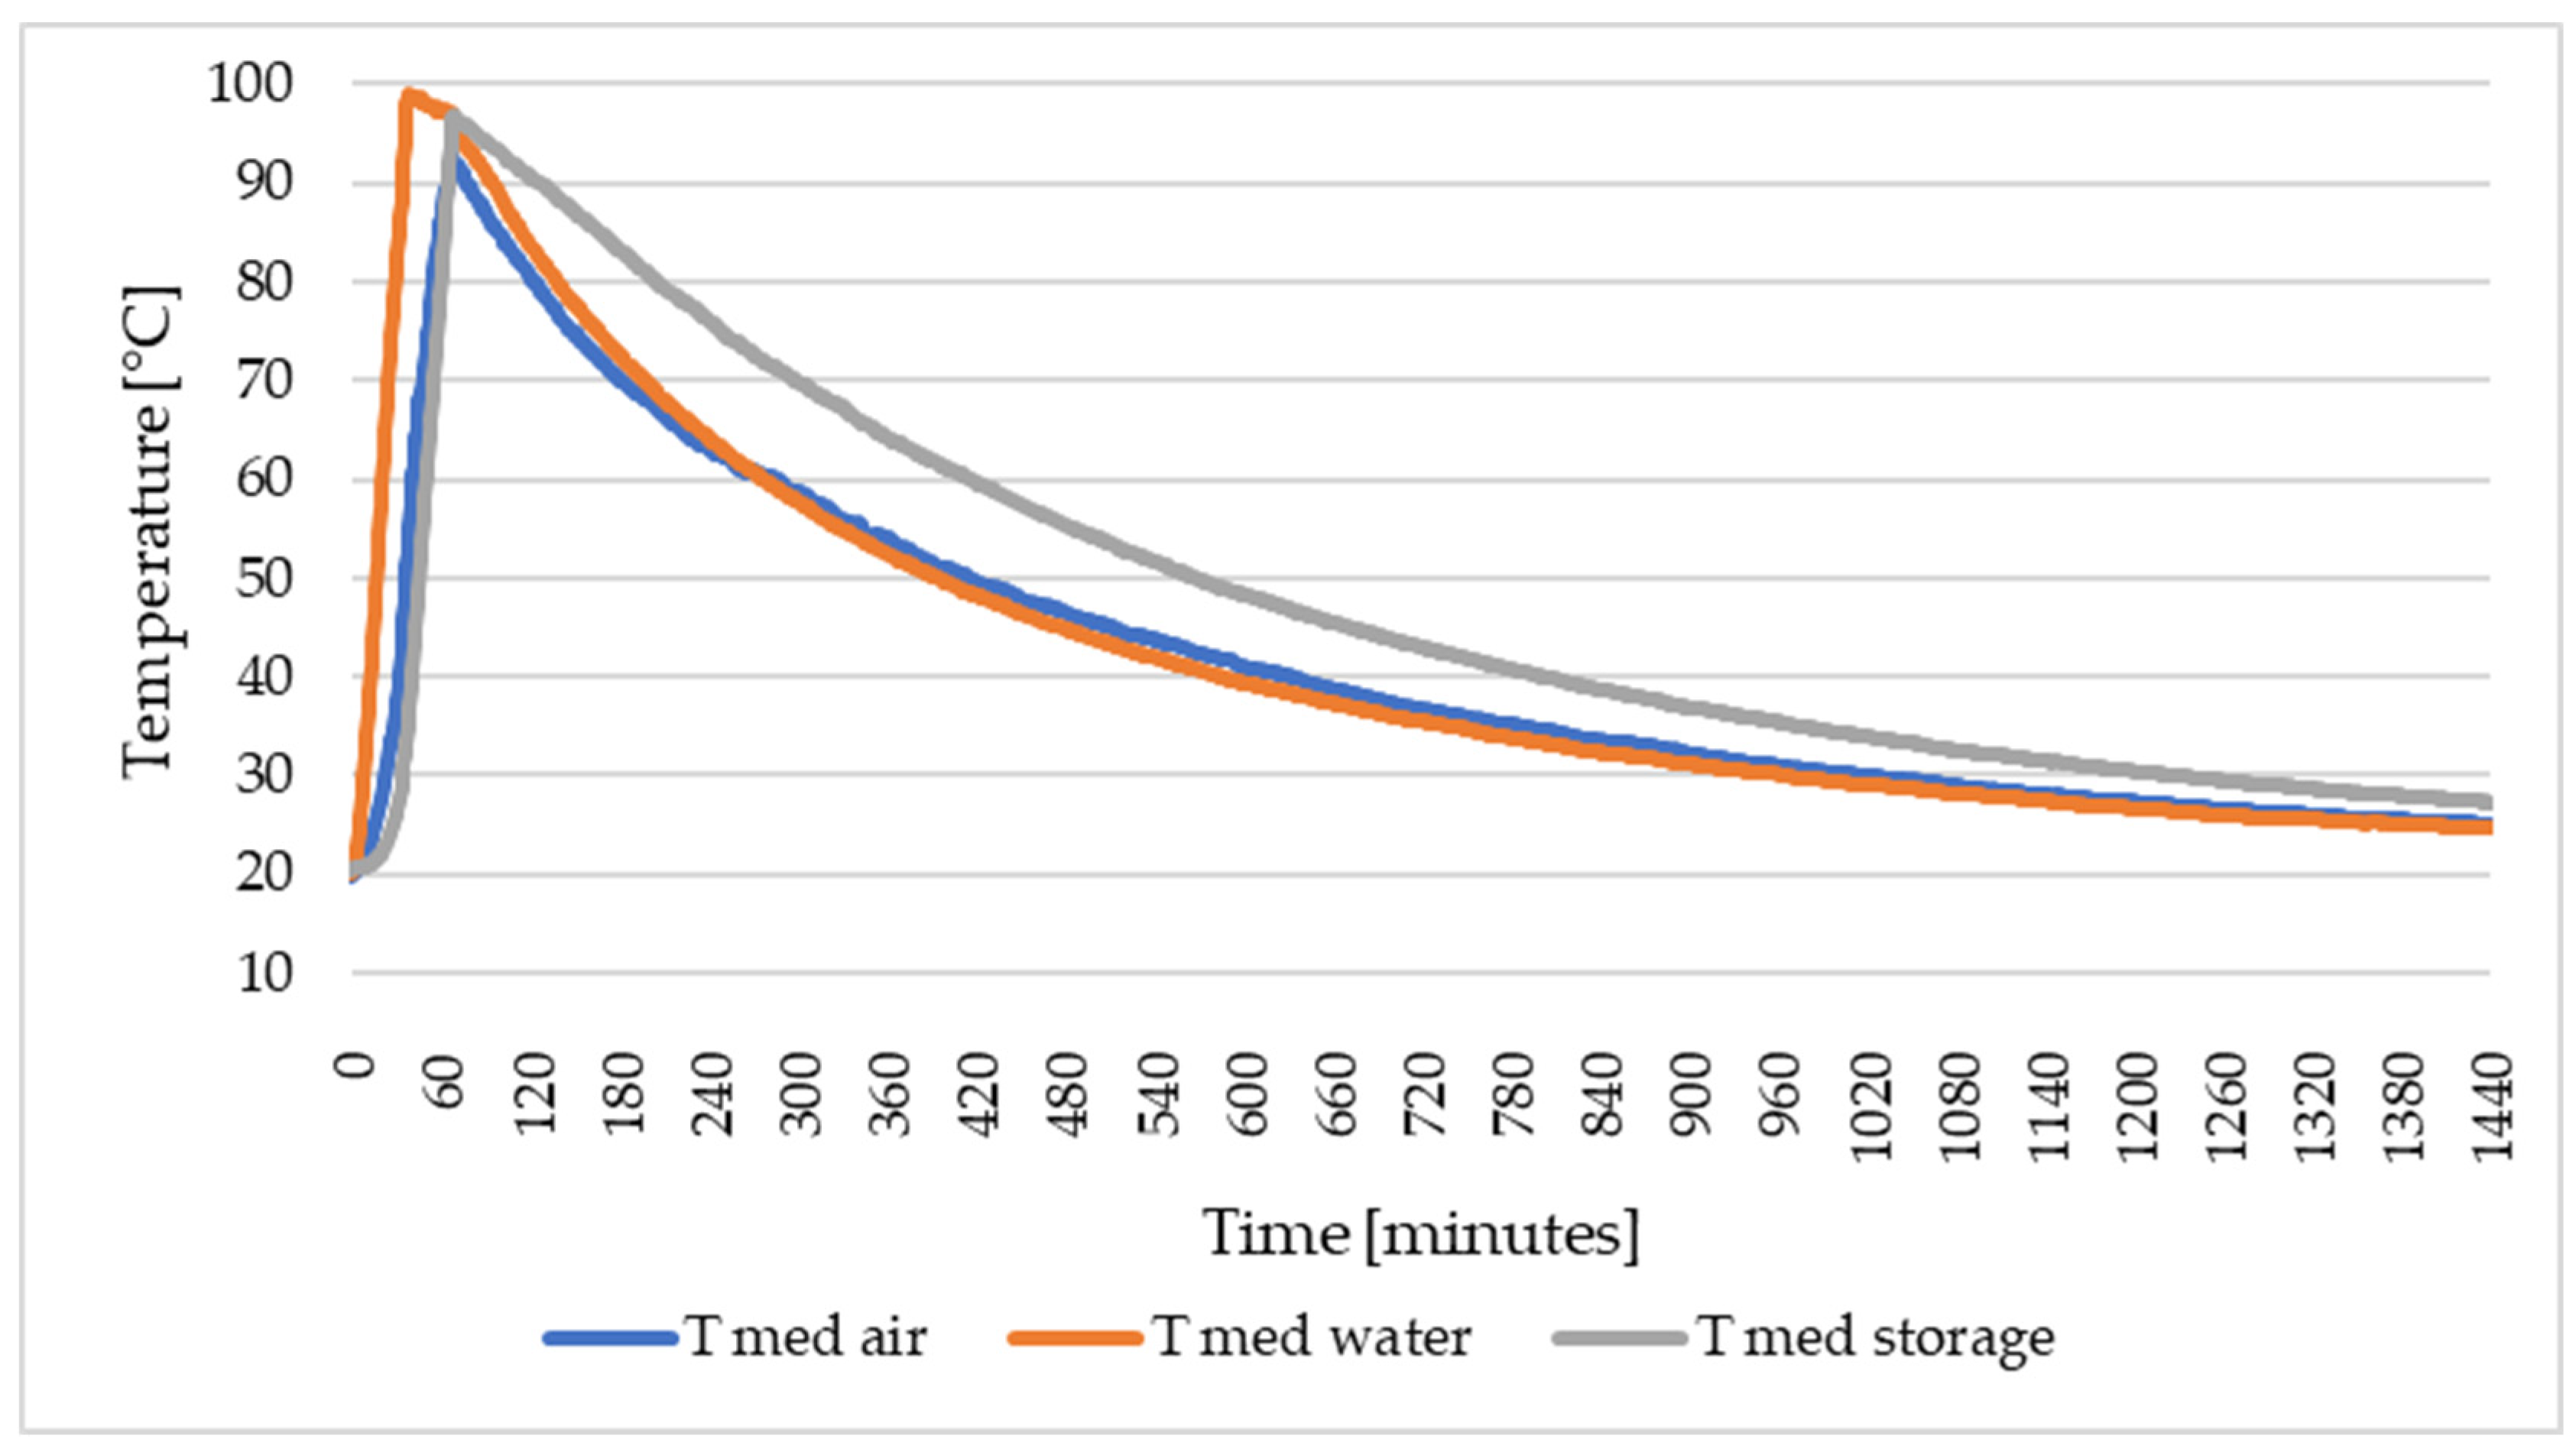
A distinctly different thermal response was obtained when the insulating layer was applied to the exterior of the equipment. In this configuration, boiling occurred four minutes earlier than in the uninsulated case, indicating a reduction in heat loss from the evaporator to the surroundings. The presence of insulation also led to a much stronger thermal buildup inside the enclosure: the air temperature rose to 52.5 °C, significantly higher than that observed without insulation. The water stored in the cylinder reached its peak temperature after 1 h 10 min, at which point the heating phase was concluded and the discharge phase began. The averaged temperature profiles for this configuration, plotted in
Figure 9, show that during cooling, the air and evaporator curves nearly coincide, revealing minimal heat exchange with the external environment.
Throughout the discharge phase, the temperature of the stored water remained consistently higher, by as much as 20 °C, than the air within the enclosure, confirming the effectiveness of the insulation in suppressing heat loss and sustaining elevated temperatures for extended periods. At the end of the 24 h test, the air temperature stabilized at 25.1 °C, the evaporator water at 24.6 °C, and the storage water at 27.3 °C, all substantially above the final temperatures measured in the uninsulated scenario.
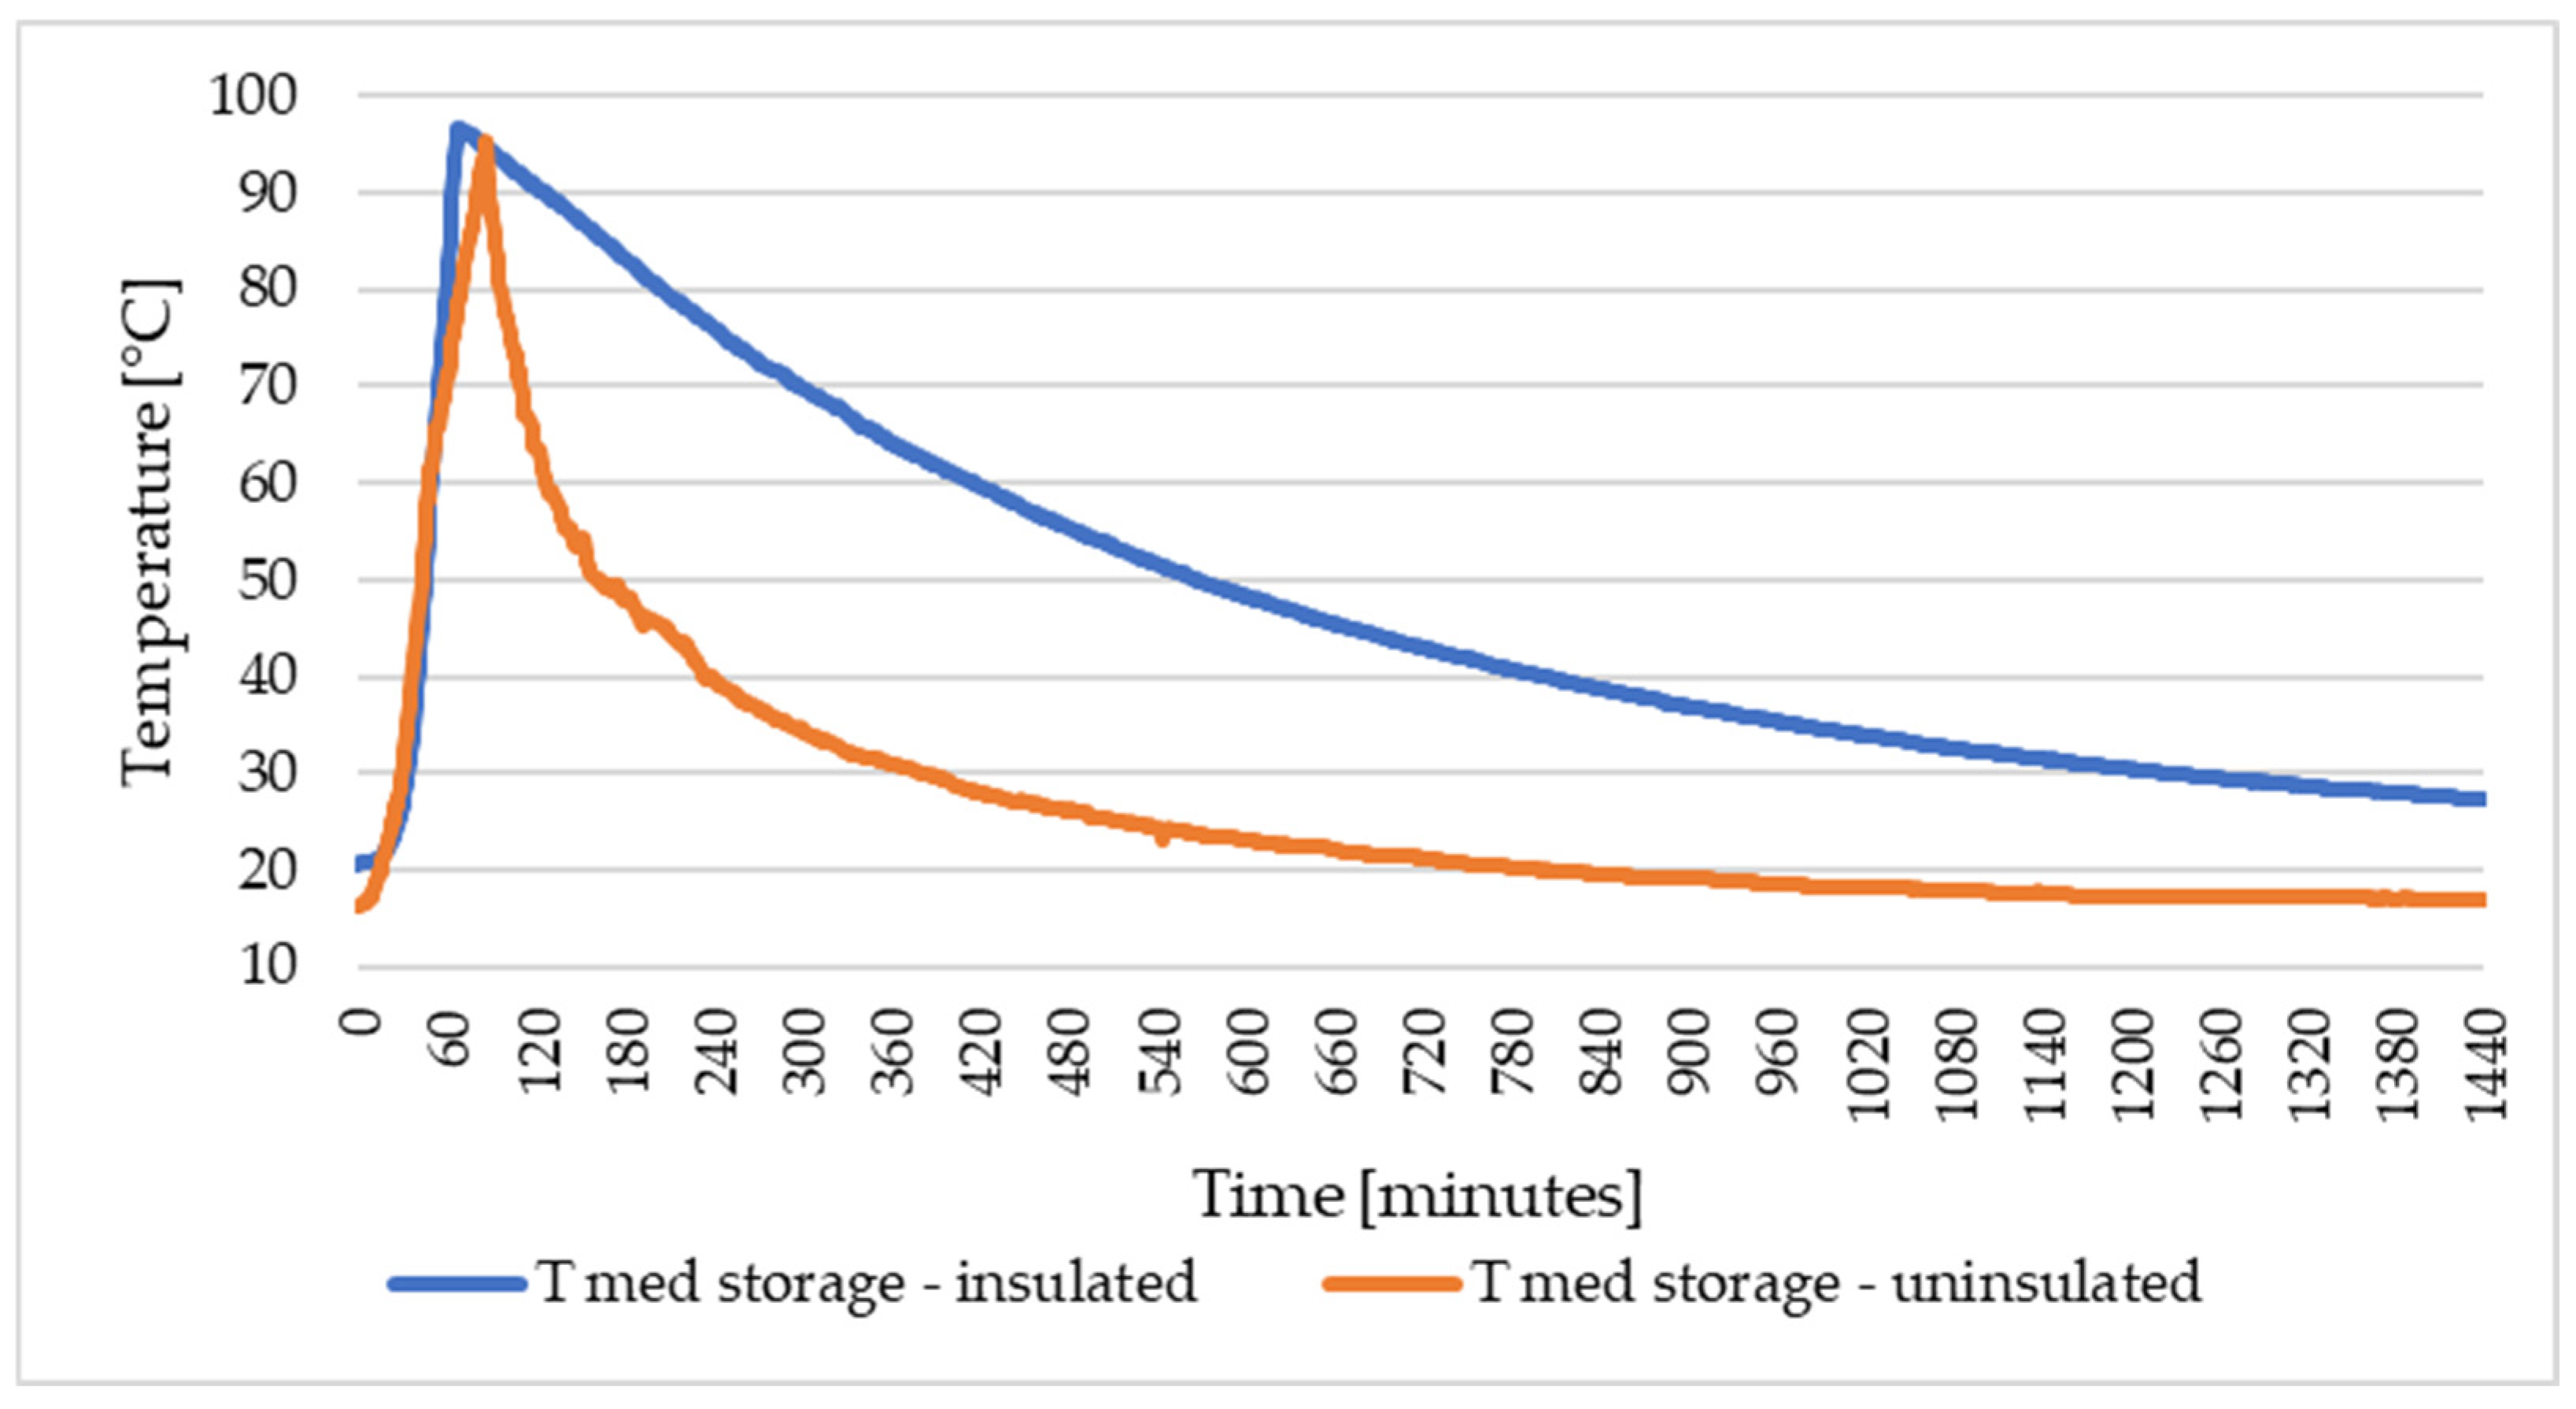
A direct comparison between the two operating modes is provided in
Figure 10, which plots the temporal evolution of the storage-cylinder water for both cases. The contrasting profiles highlight the role of the insulation layer in reducing heat dissipation and preserving thermal energy within the system. The insulated configuration exhibited not only faster heating but also substantially slower cooling, demonstrating a significantly improved capacity to retain stored thermal energy.
Using the measured temperature evolution and the known storage volume of 7.18 L, the sensible heat stored in the cylinder water was estimated from the average water temperature rise above the initial ambient value, together with the water mass and specific heat. For the non-insulated configuration, the electrical input during the 1 h 38 min charging period corresponds to approximately 4700 kJ, of which about 2370 kJ (≈50%) are recovered as sensible heat in the stored water at the end of charging, while only around 24 kJ (≈0.5%) remain after 24 h, when the water temperature has nearly returned to ambient. In contrast, in the insulated configuration, the shorter 1 h 10 min charging period delivers about 3360 kJ of electrical energy, of which roughly 2400 kJ (≈71%) are stored as sensible heat at the end of charging, and approximately 330 kJ (≈10%) are still retained after 24 h, consistent with the elevated terminal water temperature of 27.3 °C.
These energy-balance results allow the effect of insulation to be quantified more clearly. In the non-insulated configuration, only about 0.5% of the electrical input remains stored in the water after 24 h, whereas in the insulated configuration, roughly 10% of the input energy is still retained after the same period, corresponding to almost a twenty-fold increase in the fraction of usable heat preserved over one day when the insulation layer is applied.
3.2. Numerical Simulations Results
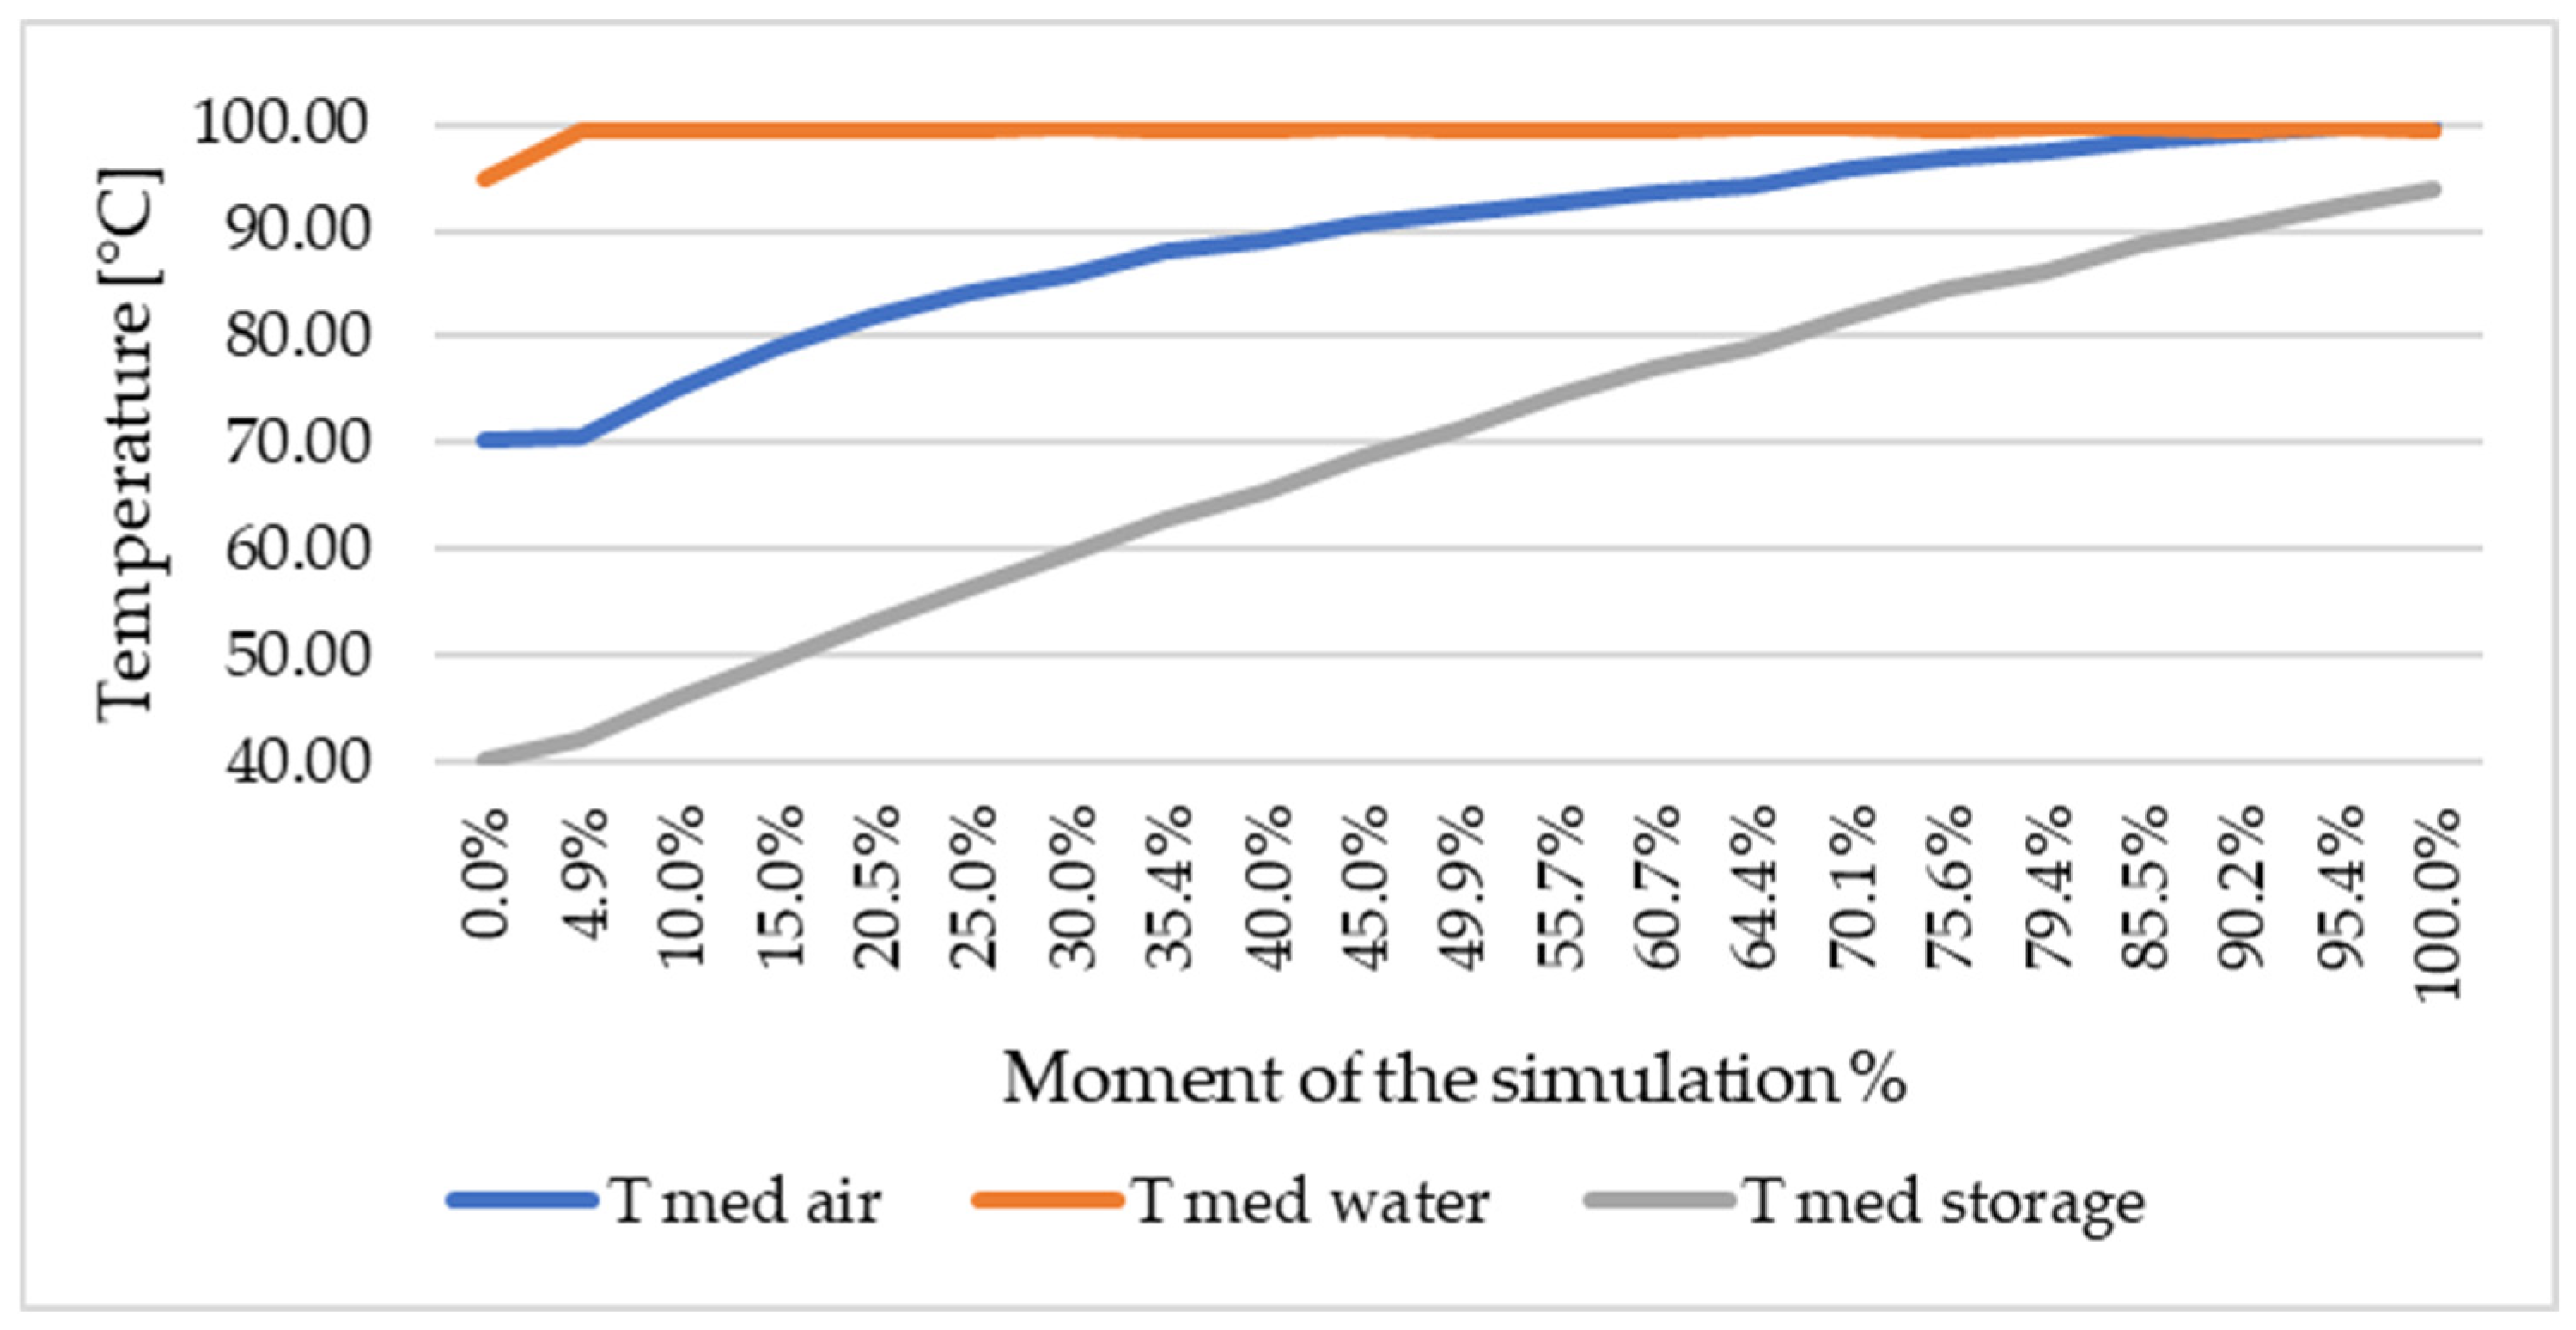
The numerical analysis was carried out to complement the experimental observations and to clarify the coupled heat and mass-transfer mechanisms occurring during the charging phase. The simulation monitored the temporal evolution of three key thermal masses: the water inside the evaporator basin, the air contained in the Plexiglas enclosure, and the water stored in the vertical cylinder. For consistency with the experimental interpretation, the simulation progress was expressed as a normalized scale from 0% to 100%, where 0% corresponds to the beginning of the computation and 100% denotes the point at which the average air temperature inside the enclosure approached the temperature of the evaporator water, indicating a quasi-steady thermal regime. The predicted temperature curves for the three media are shown in
Figure 11.
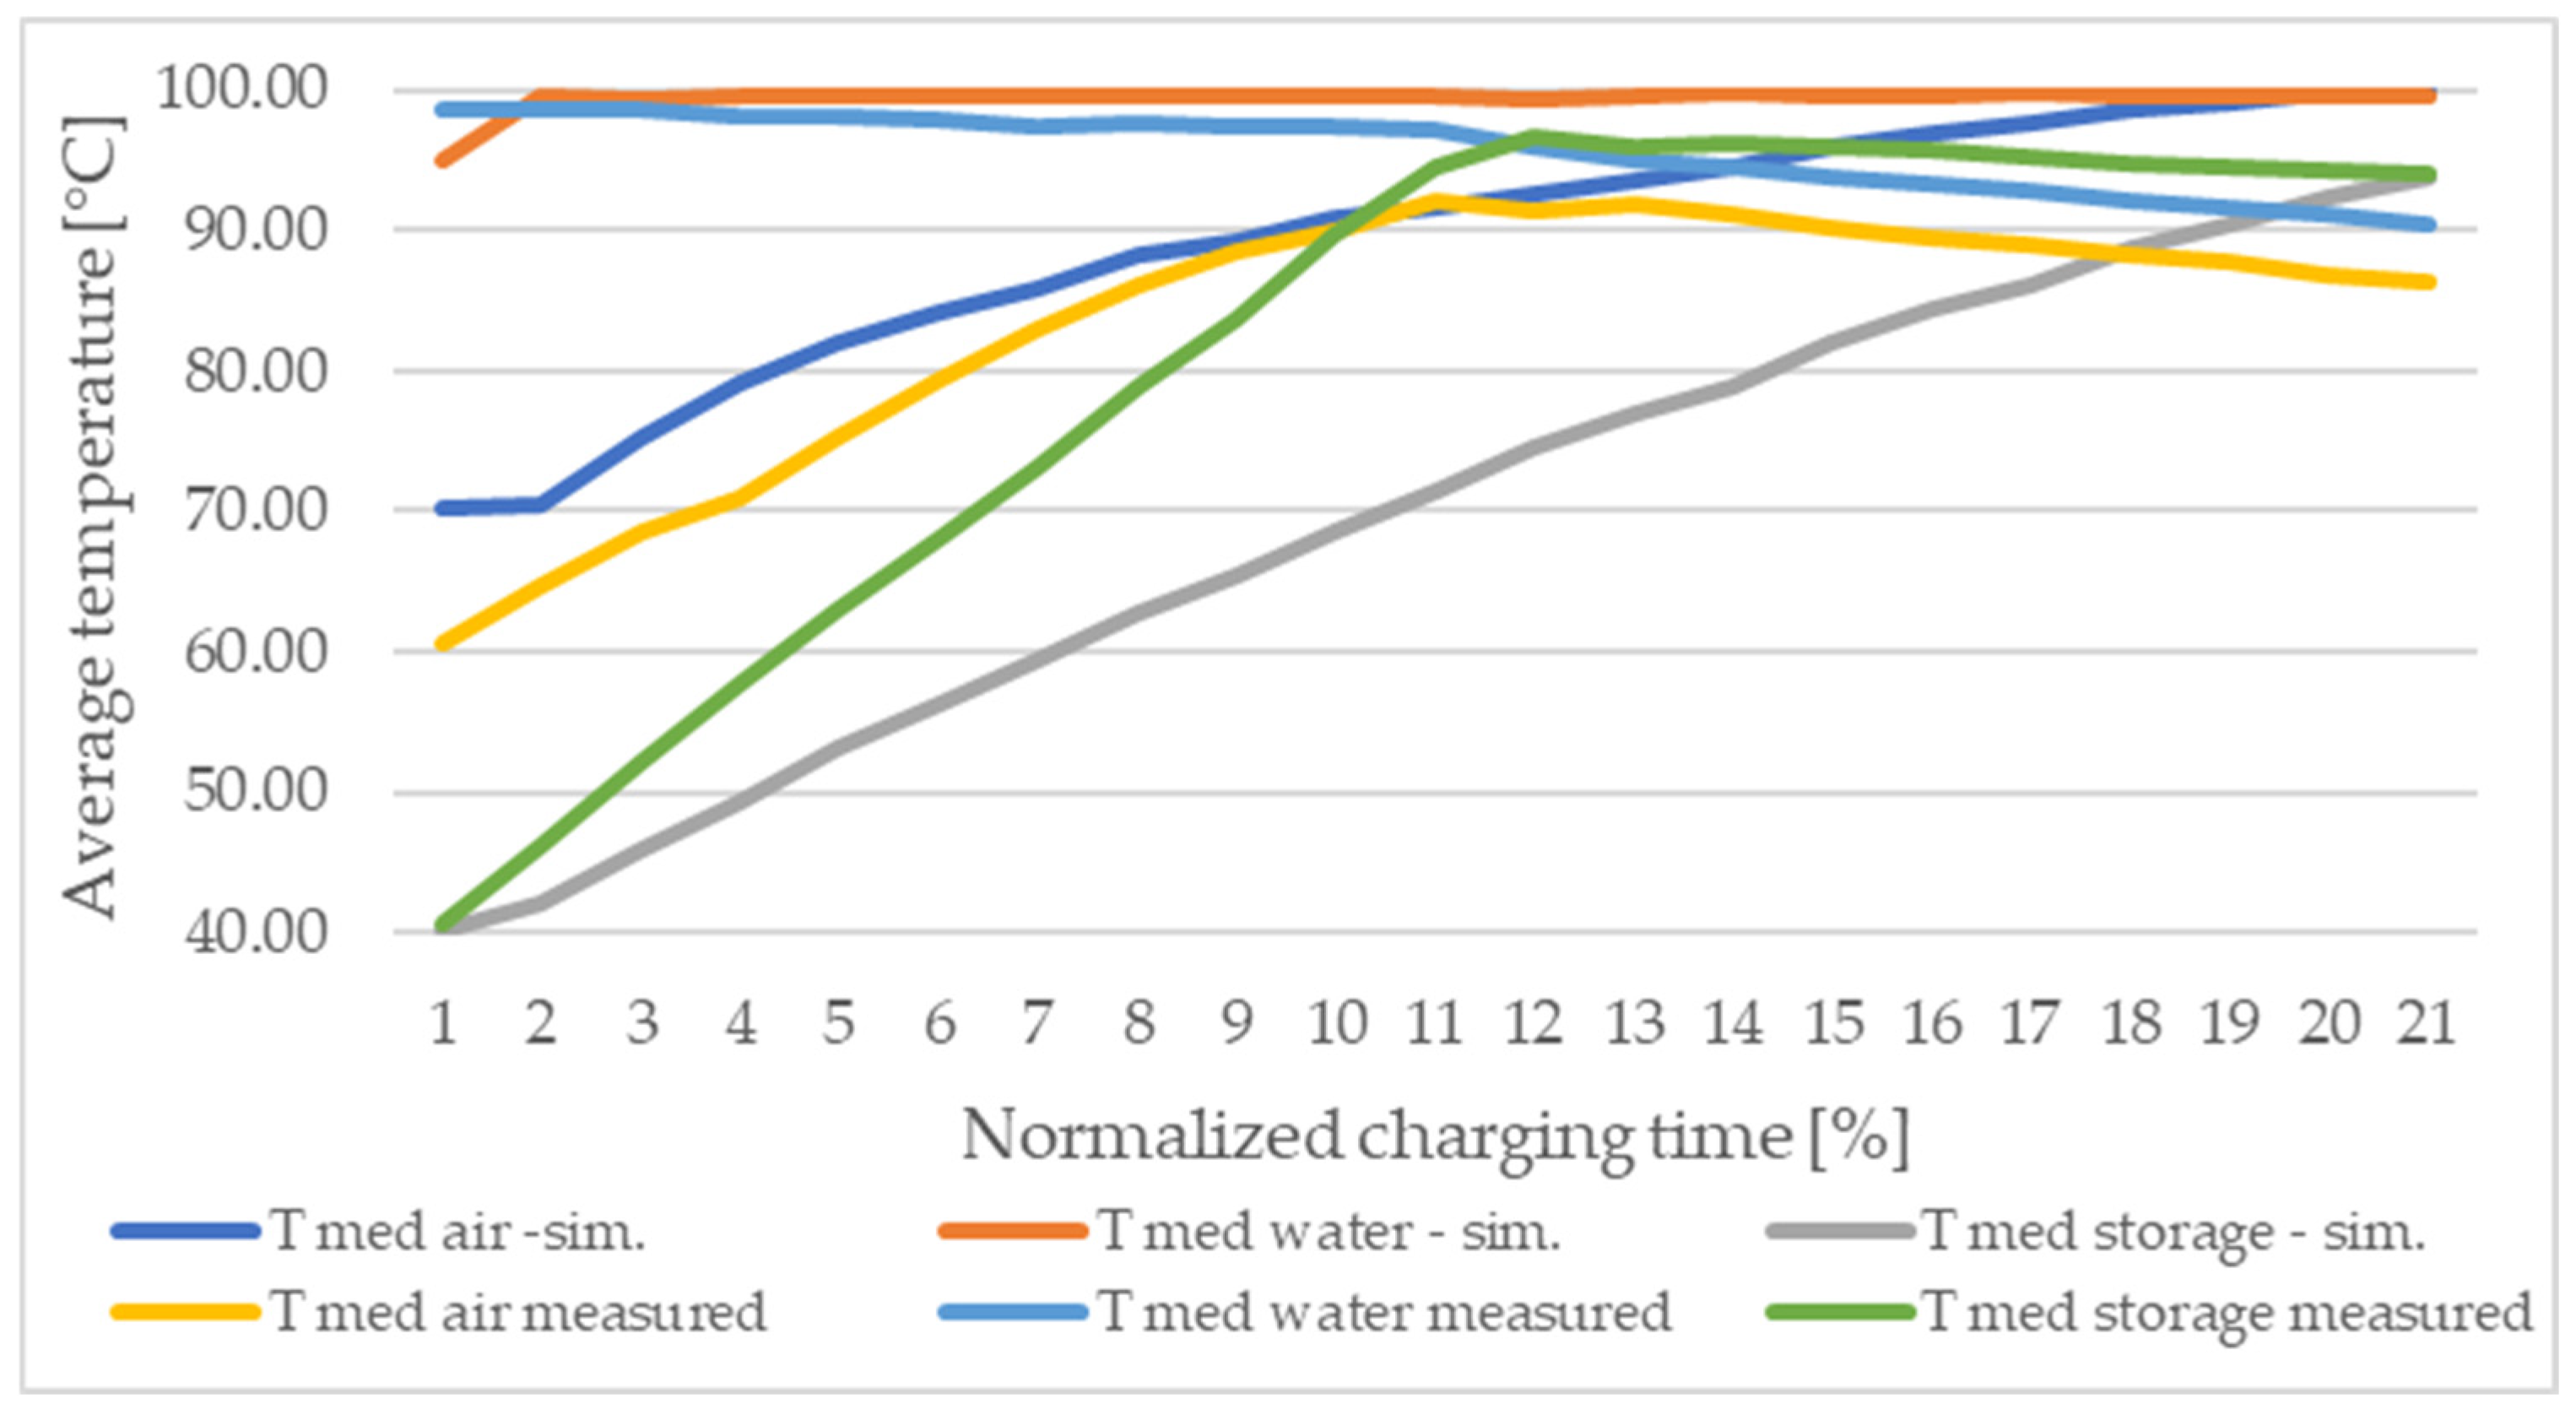
To verify the numerical model against the experimental data,
Figure 12 compares the simulated and measured average temperatures of the storage-cylinder water, the enclosure air and the evaporator water during the charging phase for the non-insulated configuration, plotted as a function of normalized charging time (0% corresponding to a storage-water temperature of 40 °C and 100% to the end of charging). The CFD curves closely follow the experimental heating trajectories and peak temperatures for all three media, with deviations in the average storage-water temperature limited to only a few degrees throughout the charging period, confirming the adequacy of the model for reproducing the transient charging behavior.
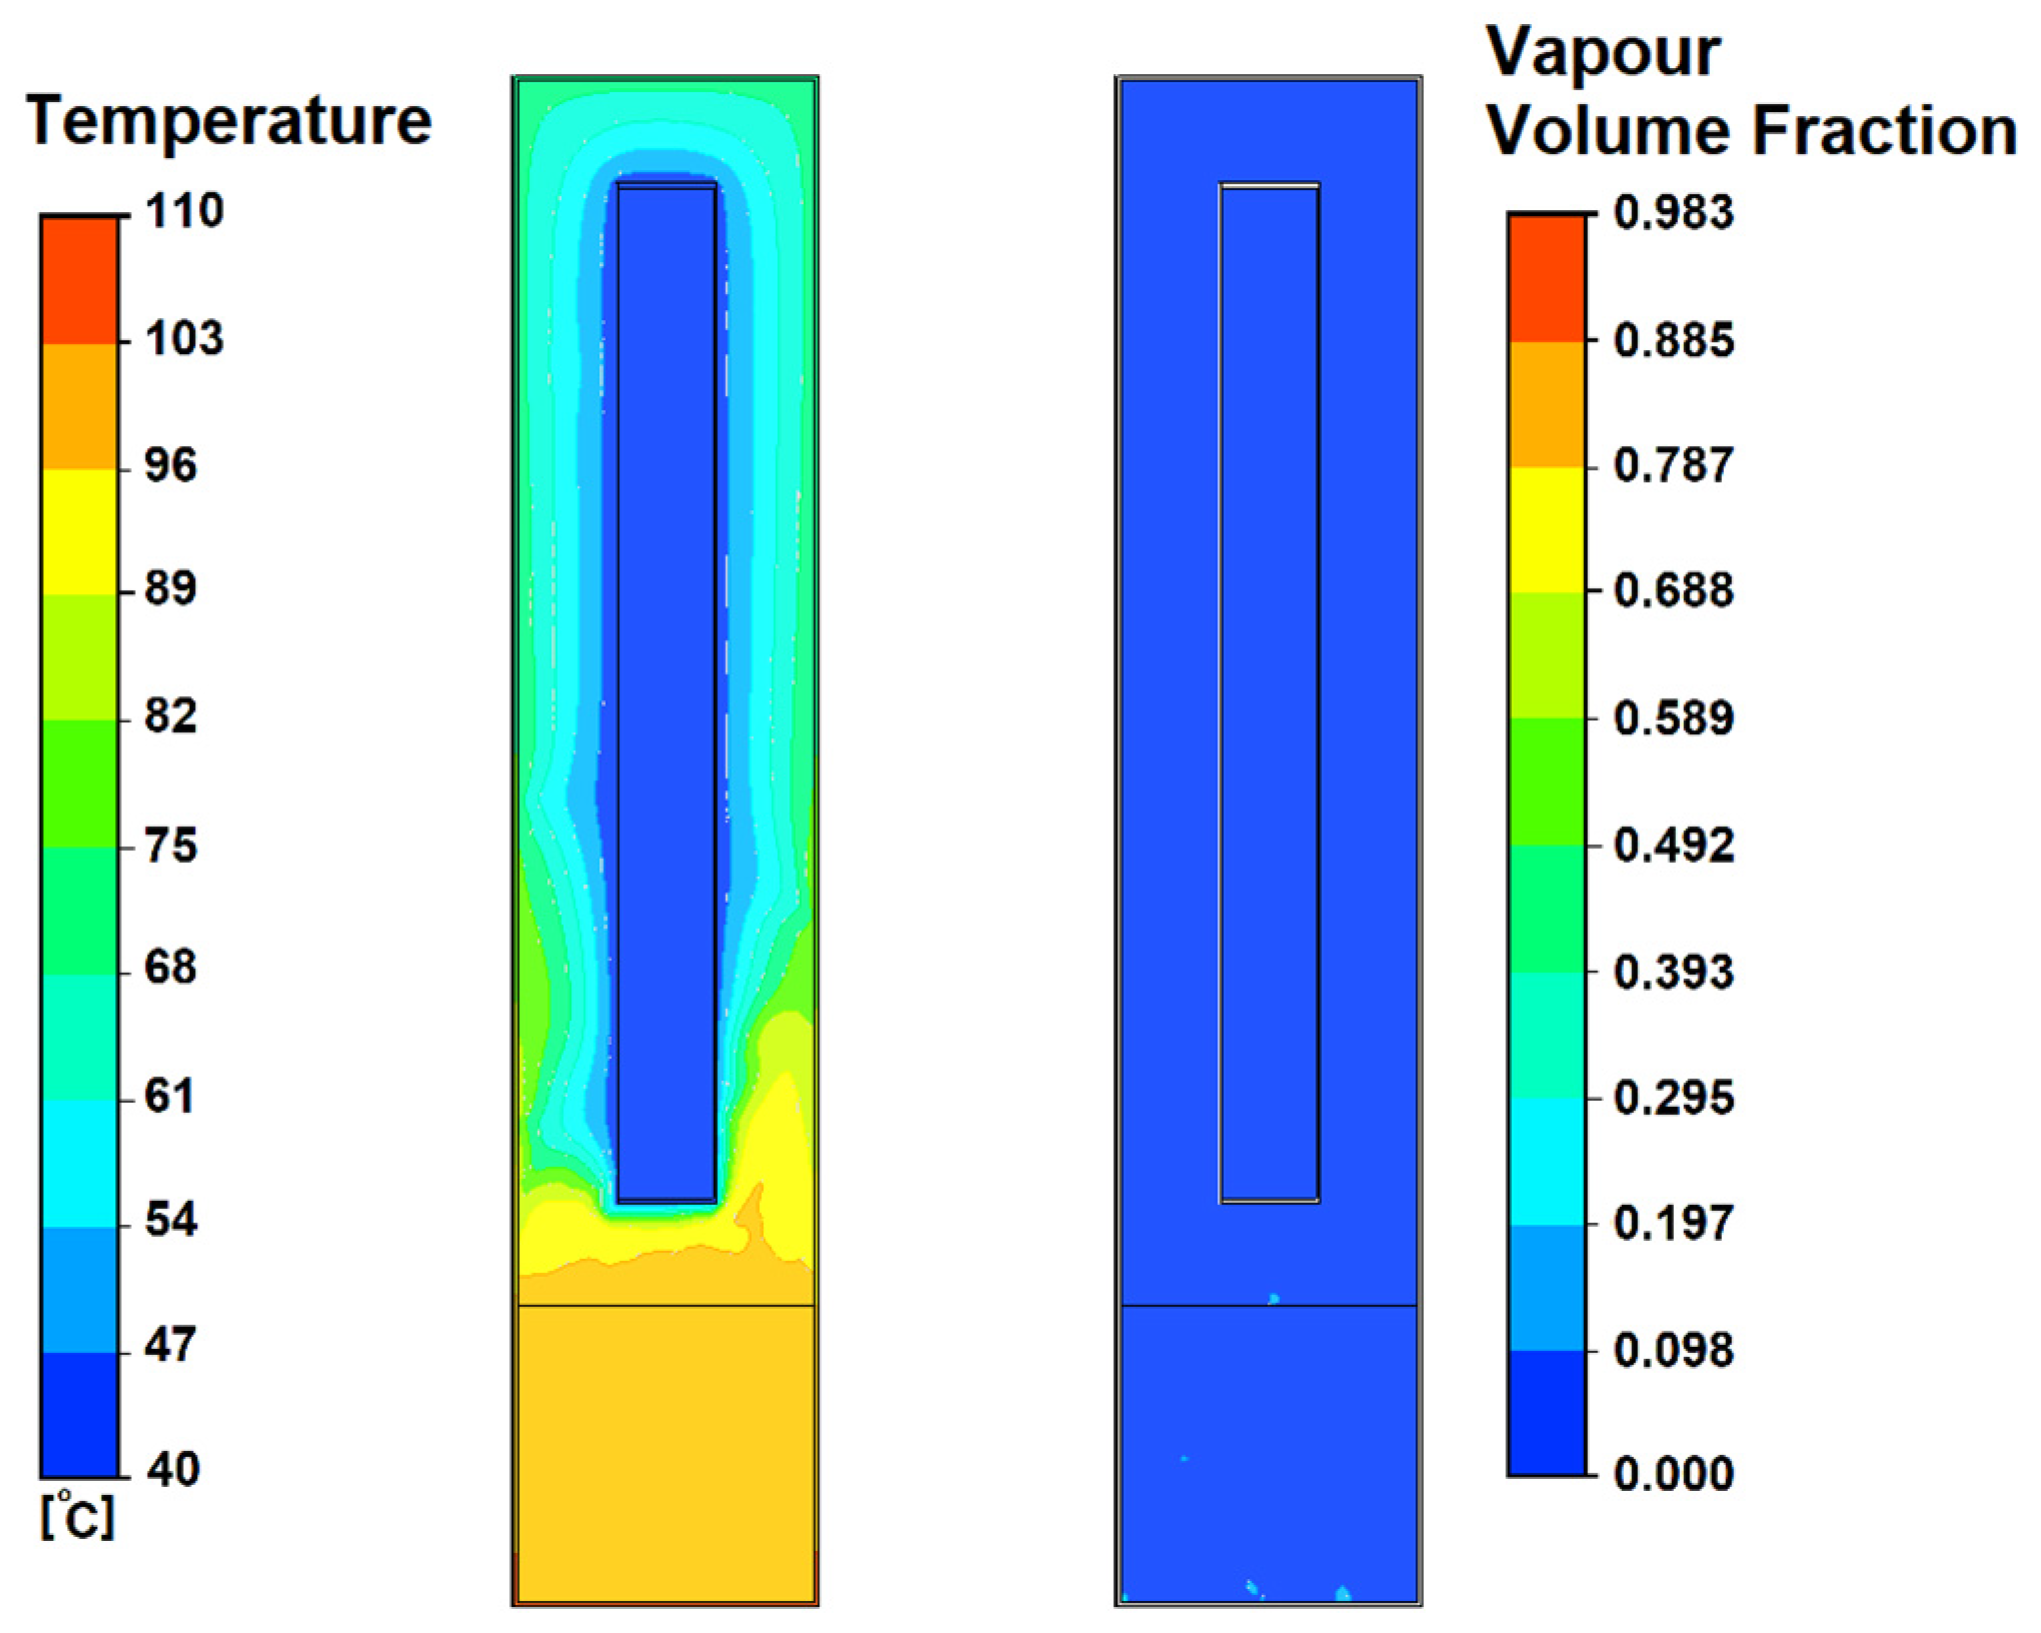
As illustrated in the figure, the rapid rise in the evaporator water temperature initiates the sequence of events that govern the later stages of the process. When the water in the basin reaches 100 °C, vaporization begins, marking the transition from a conduction-dominated regime to one in which phase change plays a decisive role. The onset of visible vapor generation, captured at 3.34% of the total simulation time, is shown in
Figure 13.
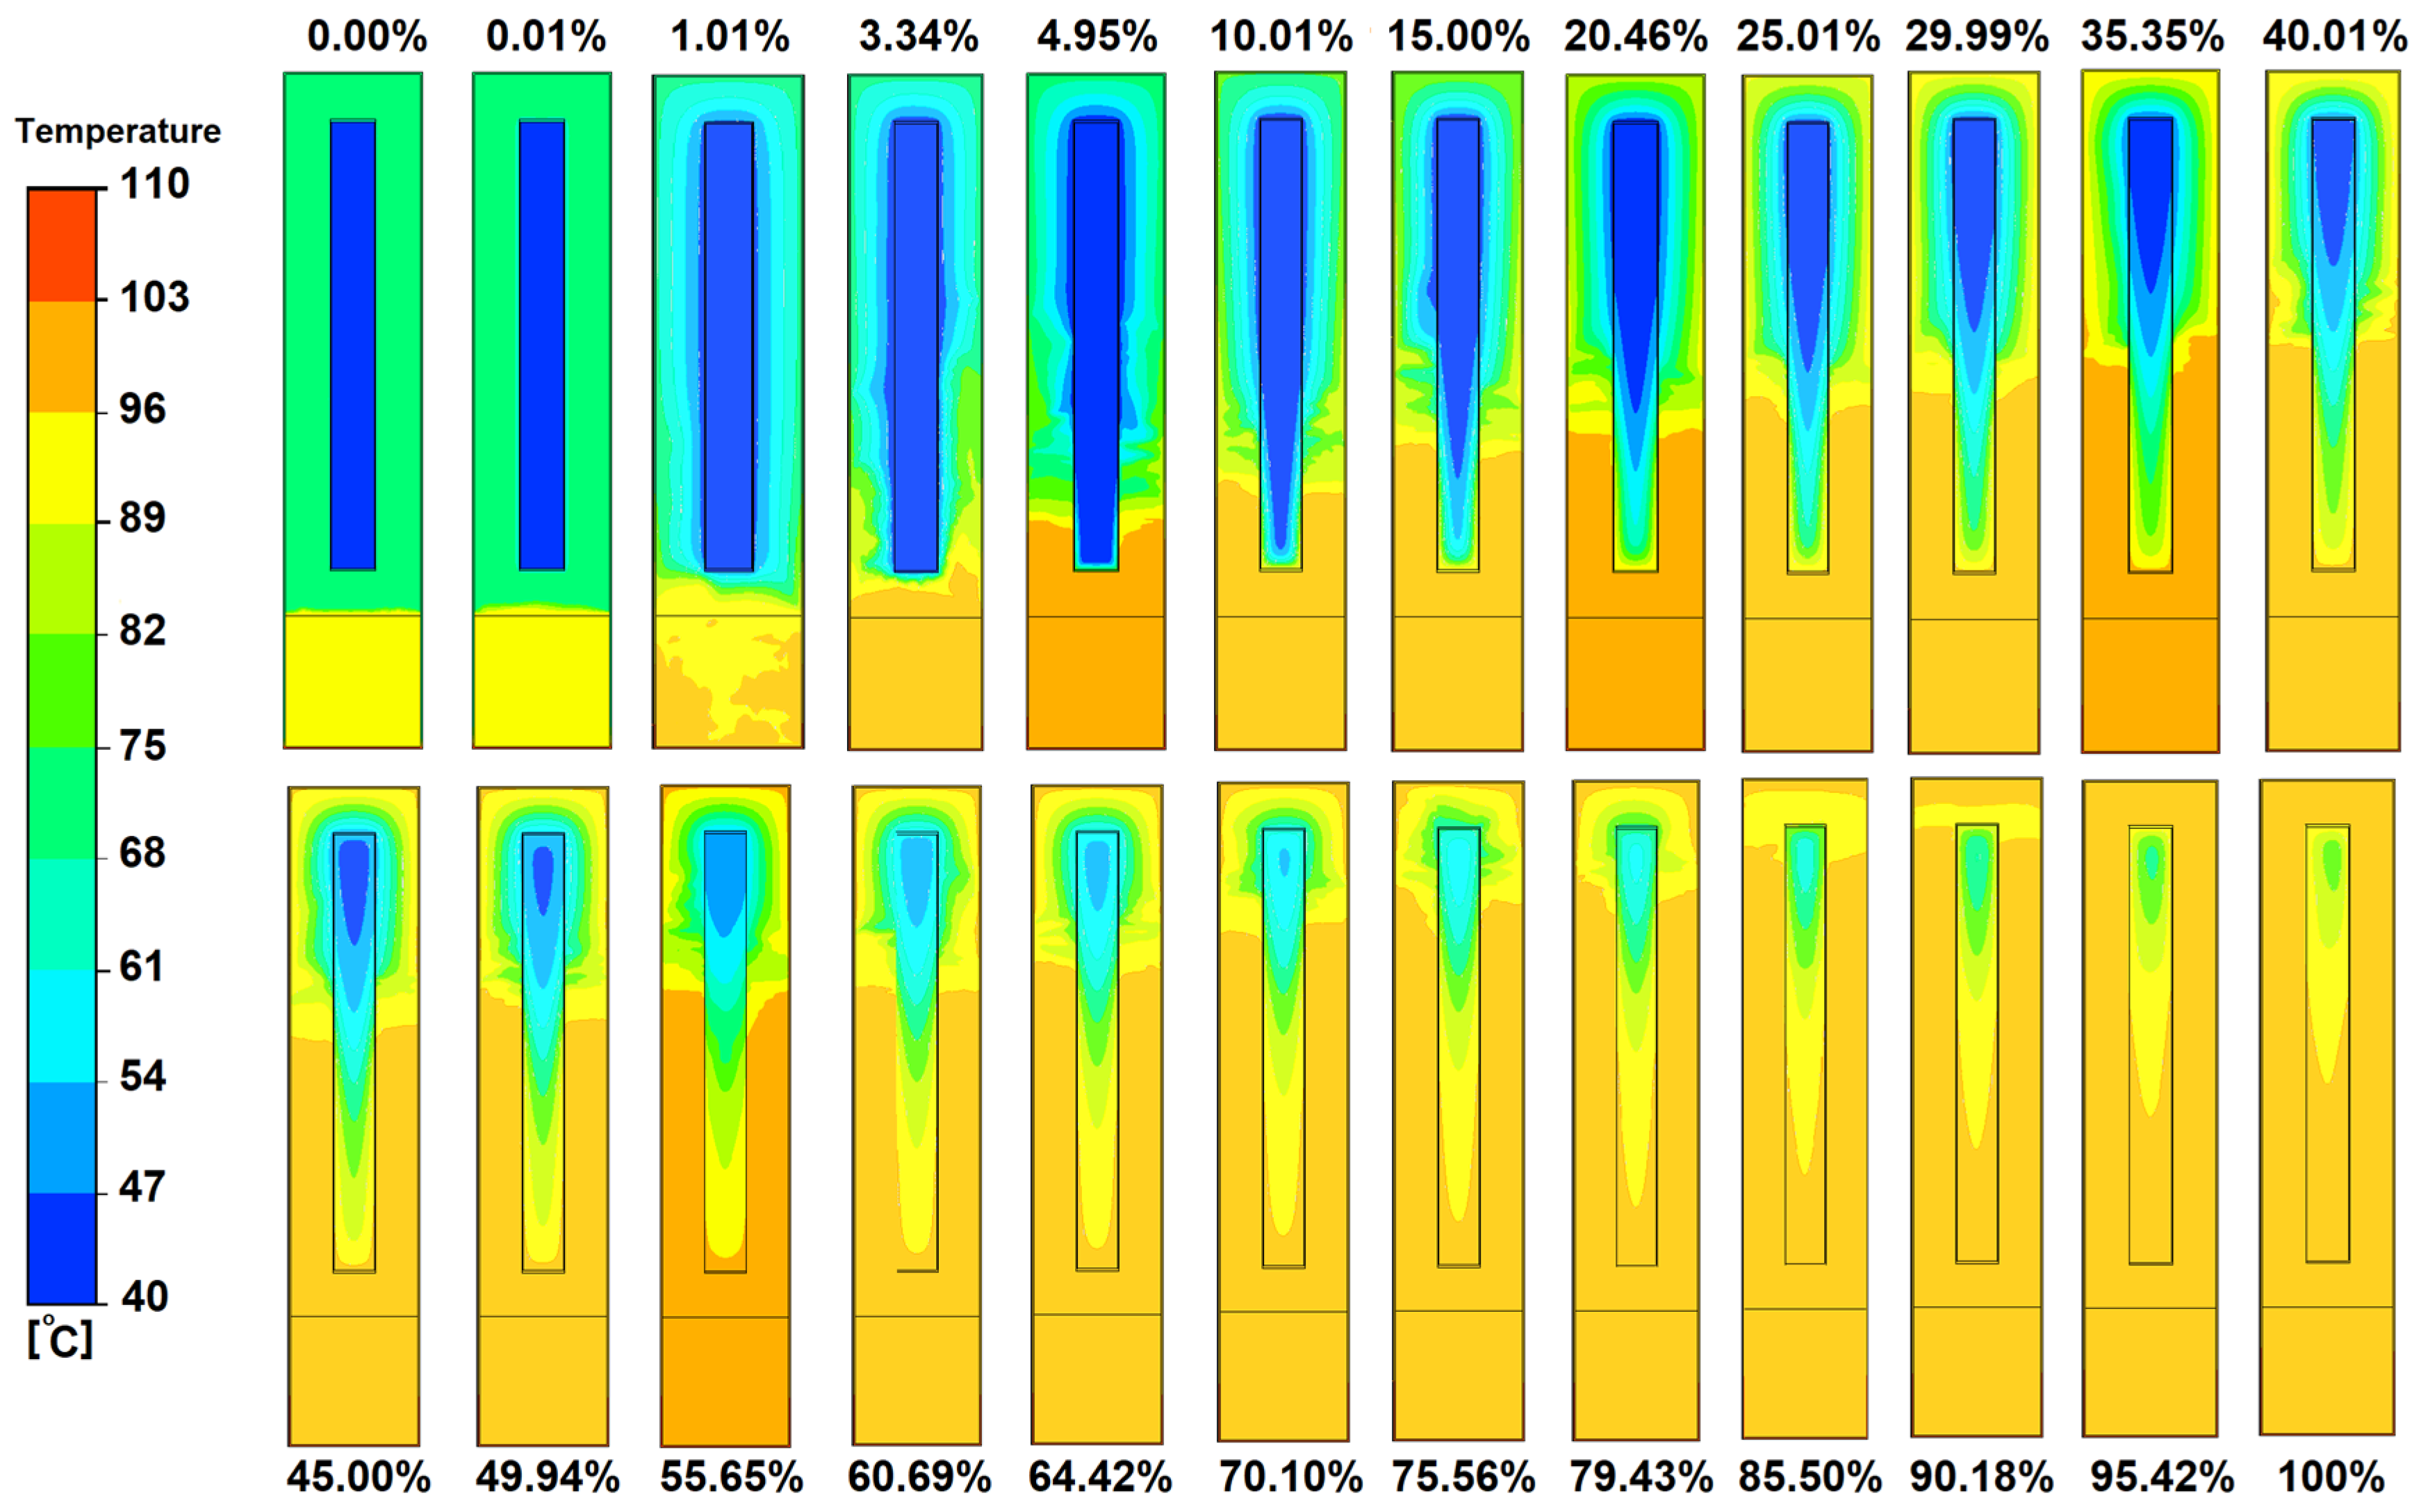
Prior to this moment, heat transfer from the evaporator surface to the surrounding media occurs almost exclusively through conduction, leading to slow and gradual increases in the air temperature and in the temperature of the water stored in the cylinder.
Once vapor bubbles begin to form, the heating behavior changes markedly. This shift is evident in the results presented in
Figure 14, where the temperature of both the enclosure air and the storage water begins to rise more steeply.
The accelerated rate of heating following the onset of vaporization is attributed to the latent heat of phase change and to the enhanced convective transport generated by rising vapor plumes. The vapor phase carries thermal energy away from the evaporator surface far more effectively than conduction through liquid water alone, distributing heat throughout the enclosure and promoting mixing within the cylinder. The associated turbulence further intensifies convective heat transfer, resulting in a faster and spatially more uniform thermal response.
To quantify these multiphase interactions, the vapor volume fraction in both the evaporator region and the enclosure air was extracted at several characteristic instants of the simulation. The corresponding condensate fraction within the Plexiglas enclosure was also evaluated to capture the coupling between vapor formation and condensation. The results are summarized in
Table 2.
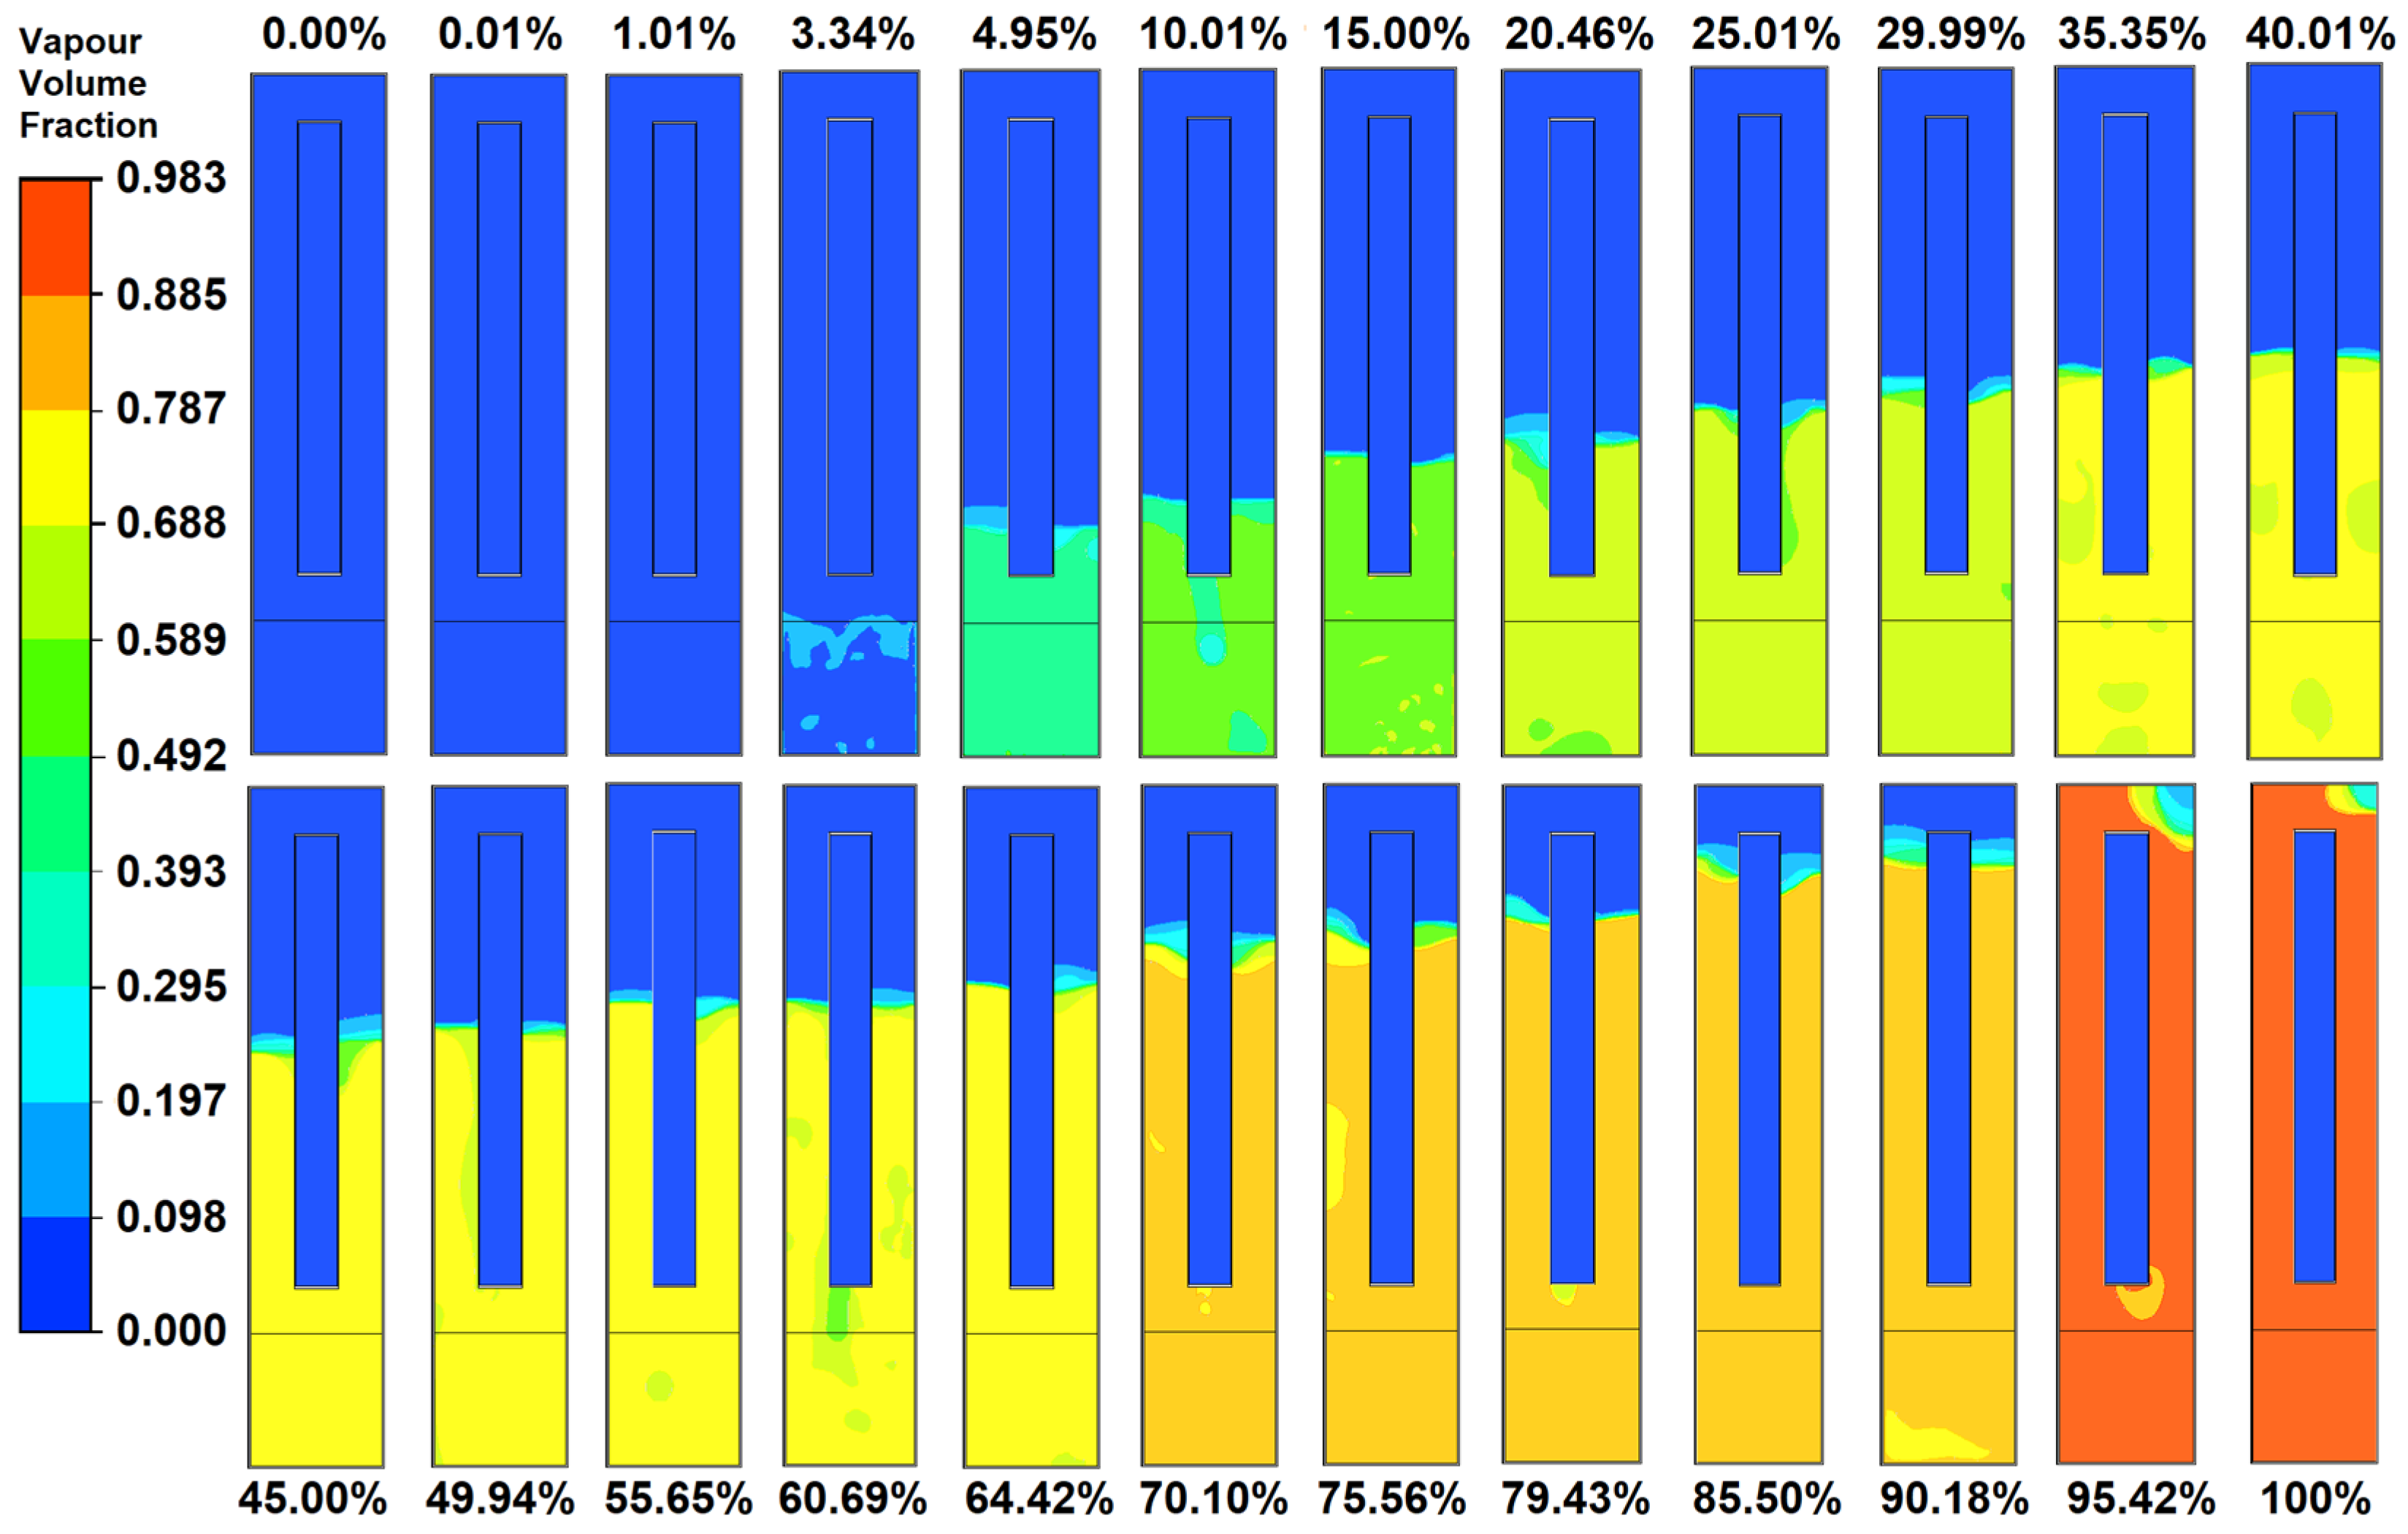
For each of the selected frames, cross-sectional contour plots of the vapor distribution were generated, as presented in
Figure 15.
During the early stage (0–3.34%), the domain remains uniformly liquid, with contours appearing in dark blue, reflecting the absence of vapor. Between 4.95% and 20.46%, localized green and yellow regions appear in the vicinity of the evaporator, marking the emergence of vapor nuclei and the gradual increase in temperature.
As the process advances (25.01–64.42%), the vapor regions expand upward through the enclosure, indicating intensified phase-change activity and greater convective transport. In the final portion of the simulation (70.1–100%), the contours transition to warmer colors, orange and red, corresponding to high vapor volume fractions and elevated temperatures. Throughout these frames, condensation droplets frequently appear in the upper part of the cylinder and along the inner Plexiglas surface; for example, at 60.69%, localized condensation is visible at the lower section of the cylinder wall, represented by green regions.
These results confirm the two-stage heat-transfer behavior observed experimentally: a slow conduction-controlled regime prior to boiling, followed by a rapid convective regime enhanced by vapor generation. The simulation thus provides detailed insight into the mechanisms driving heat distribution during charging and underscores the dominant role of phase change in accelerating thermal equalization.
4. Discussion
The purpose of this study was to characterize the thermal behavior of a compact sensible heat storage unit and to determine how external insulation influences its charging and discharging performance. By integrating controlled laboratory measurements with CFD simulations, the work examined the transition from conduction-dominated heating to vapor-assisted convection and assessed how this shift affects heat-retention efficiency. Taken together, the results provide an experimentally validated picture of how insulation reshapes both the charging dynamics and the long-term cooling behavior of the system, an aspect that has only been explicitly addressed in previous studies.
The comparative experiments highlight the substantial influence of insulation on system performance: in the insulated configuration, boiling occurred four minutes earlier than in the non-insulated setup, the enclosure air reached higher peak temperatures, and the stored water attained its maximum temperature 28 min sooner, reflecting stronger thermal coupling between the evaporator and the storage cylinder. During the discharge phase, the stored water remained up to 20 °C warmer than the enclosure air for extended periods, indicating a clear reduction in both convective and conductive losses when insulation is applied. The divergence of the cooling curves between the two configurations therefore confirms that a significantly larger portion of the accumulated heat is preserved in the insulated case, consistent with previous reports on the role of improved tank insulation in extending TES discharge duration.
The numerical simulations further clarify these phenomena. Before boiling, heat transfer occurs predominantly through conduction, leading to slow thermal propagation in both the enclosure air and the stored water, whereas the onset of vapor generation triggers a rapid shift to a convection-dominated regime in which rising vapor plumes transport heat much more efficiently. The CFD model captures this transition and reproduces the experimentally observed acceleration in temperature rise, while the predicted distribution of vapor and condensate explains the local fluctuations measured at upper air-sensor locations, linking vapor formation, condensation patterns, and vertical thermal stratification. In this way, the simulations complement the measurements by providing spatially resolved insight into the coupled phase-change and convection processes that are difficult to access experimentally.
Although the present work focused on a single insulation material and a fixed heating input, the results establish a validated reference case for vapor-assisted sensible storage under insulated and non-insulated conditions and offer guidance for the design of compact TES units in PV-coupled applications. Future research should investigate scaling strategies such as parallel storage cylinders, alternative insulation materials with lower thermal conductivity, and operation under variable electrical inputs representative of real photovoltaic profiles, in order to further optimize system performance and economic viability. Beyond the general heat-transfer mechanisms involved, the present work contributes by jointly providing: (i) an experimentally validated description of the transition from conduction-dominated heating to vapor-assisted convection in a compact, vertically oriented sensible storage unit, (ii) a coupled CFD analysis that explains the temporal and spatial evolution of temperatures and stratification, including the observed sensor fluctuations, and (iii) a quantitative assessment of the impact of external insulation on the fraction of electrical input recovered as sensible heat at the end of charging and after 24 h of cooling. These elements strengthen the practical relevance of the study for the design and optimization of compact TES units integrated with photovoltaic systems.
5. Conclusions
This study provides a comprehensive experimental and numerical assessment of a vapor-assisted sensible heat storage unit, highlighting the critical role of phase-change mechanisms and external insulation in optimizing thermal performance. The results confirm that the system operates through a distinct two-stage heat transfer behavior, transitioning from an initial conduction-dominated regime to a rapid, vapor-driven convective regime that significantly accelerates thermal homogenization within the storage cylinder. A key finding of the research is that the application of external insulation not only advances the onset of boiling by 4 min but also enables the storage medium to reach its peak temperature 28 min faster than the uninsulated configuration.
Furthermore, the energy retention analysis reveals a nearly twenty-fold increase in the fraction of electrical input preserved as sensible heat after 24 h in the insulated case, rising from a negligible 0.5% (24 kJ) to approximately 10% (330 kJ) of the initial energy. During the discharge phase, the effectiveness of the insulation was further demonstrated by maintaining the stored water at temperatures up to 20 °C higher than the surrounding enclosure air. The high degree of correlation between the experimental heating trajectories and the CFD simulations validates the numerical model as a robust tool for predicting transient phase-change dynamics in compact TES units.
These findings indicate that the proposed configuration is suitable for daily photovoltaic-to-heat buffering, in which surplus electrical energy is converted into storable thermal energy and later released during periods of increased thermal demand. Future work will focus on scaling the storage capacity, exploring alternative insulation solutions with lower thermal conductivity, and assessing performance under variable electrical input profiles representative of real PV generation.




 ,
,