Article

Geoscience–Engineering Integration for Fluid-Property Reclassification in Complex Reservoirs: Application to the Gas-Cap Reservoir in Gongshanmiao Block, Sichuan Basin


1
Institute of Sedimentary Geology, Chengdu University of Technology, Chengdu 610041, China
2
Petro China Southwest Oil & Gasfield Company, Chengdu 610041, China
3
State Key Laboratory of Petroleum Resources and Engineering, Beijing 102200, China
4
College of Petroleum Engineering, China University of Petroleum, Beijing 102200, China
5
Marginal Oil and Gas Development Technology Research Institute, Xi’an Shiyou University, Xi’an 710065, China
6
State Key Laboratory of Oil and Gas Reservoir Geology and Exploitation, Chengdu 610059, China
*
Authors to whom correspondence should be addressed.
Energies 2026, 19(7), 1761; https://doi.org/10.3390/en19071761
Submission received: 9 February 2026 / Revised: 15 March 2026 / Accepted: 24 March 2026 / Published: 3 April 2026
(This article belongs to the Section H1: Petroleum Engineering)

Abstract

Accurate fluid characterization is critical for reservoir development planning and typically relies on pressure-volume-temperature (PVT) experiments. However, in structurally complex reservoirs, fluid classification based solely on laboratory measurements can lead to misinterpretations. In the Gongshanmiao block of the Sichuan Basin, initial PVT analysis suggested that the reservoir was a condensate gas system. Subsequent field development revealed inconsistencies with this interpretation, including abnormal gas–oil ratios and atypical pressure build-up behavior that deviated from expected condensate gas reservoir performance. To resolve this discrepancy, this study proposes a diagnostic framework that integrates geoscience and engineering data, including fluid sampling, 3D structural modeling, production performance analysis, pressure build-up testing, and hydraulic fracturing data. The integrated analysis revised the initial PVT-based interpretation, and the results indicated that the reservoir is more accurately characterized as a saturated oil system with an overlying gas cap, rather than a condensate gas reservoir. Furthermore, the integrated interpretation clarifies the structural trapping mechanism and delineates the spatial extent of the gas cap. Overall, the proposed approach provides an integrated geoscience-engineering workflow for fluid reclassification in structurally complex reservoirs, which reconciles laboratory fluid analysis with field production behavior, offering a systematic framework for fluid interpretation in similar geological settings.

1. Introduction

The determination of reservoir type directly dictates the selection of development strategies [1]. Accurate identification of fluid types plays a decisive role in reservoir development planning, production forecasting, well pattern design, and surface facility engineering [2,3]. Therefore, accurate characterization and discrimination of fluid phases are crucial for optimizing oilfield development. During oil and gas production, an increase in gas-oil ratio (GOR) requires clarification of its underlying cause, particularly whether it results from condensate behavior or gas-cap expansion, so that appropriate development and production strategies can be adopted. In condensate reservoirs, when fluid pressure drops below the dew point, retrograde condensation occurs, causing condensate dropout near the wellbore and an increasing gas phase fraction [4], which significantly elevates the GOR. Because liquid dropout and gas blocking develop near the wellbore, pressure-maintenance measures are often required. Conversely, GOR increase caused by gas cap expansion results in gas coning [1], which markedly reduces oil production rate and requires production drawdown control for management.
In conventional studies, pressure-volume-temperature (PVT) experiments are widely utilized to characterize reservoir fluid types and determine fluid properties. These tests provide key data on oil and gas composition, phase behavior, and the dissolved gas–oil ratio. However, because they rely on single-point sampling and laboratory conditions that differ markedly from in situ reservoir environments [5,6], inaccuracies in fluid property characterization often occur. This phenomenon is particularly pronounced in complex structural settings, or in reservoirs exhibiting phase transition zones or gas caps, where the heterogeneity and dynamic conditions increase the likelihood of misinterpretation.
Accurate identification of reservoir fluid types is essential for effective reservoir management [7]. Existing methods can generally be categorized as direct or indirect. Direct methods include downhole fluid analysis (DFA), PVT testing and nuclear magnetic resonance (NMR), which measure fluid properties under in situ or controlled conditions. DFA, performed using modular dynamic testers (MDT), provides in situ characterization and reservoir-connectivity evaluation, but is costly, time-consuming, and sensitive to sampling heterogeneity [8,9,10,11]. NMR distinguishes oil, gas, and water signals via relaxation and diffusion parameters, such as relaxation times (T1, T2) and diffusion coefficients (D), to construct T2-D spectra; however, it remains difficult to distinguish condensate gas from gas caps [12,13,14].
Indirect methods infer fluid types by measuring comprehensive physical responses (acoustic, optical, electrical, radioactive) combined with empirical formulas or data-driven algorithms. Common indicators include resistivity, hydrocarbon ratios, and seismic elastic parameters such as Vp/Vs [15,16,17]. Pressure transient analysis (PTA) can further assist in identifying phase behavior and reservoir boundaries.
Nevertheless, conventional approaches often struggle to distinguish between closely related fluid systems in structurally complex reservoirs because of compartmentalization, phase transition zones, and gas caps [18]. Well X01 in the Gongshanmiao block of the Sichuan Basin provides a representative example. Early PVT tests classified the reservoir as a condensate gas system, yet subsequent production data revealed anomalies, including abnormal increases in GOR and pressure build-up responses, both of which were inconsistent with the expected behavior of a condensate gas reservoir. These discrepancies complicated production strategy design and raised doubts about the initial fluid classification. Previous studies have shown that integrating multi-source datasets can reduce uncertainty and improve the reliability of reservoir characterization. For example, Diatto [19] demonstrated the value of integrated data analysis for reducing interpretation uncertainty. Hui [20] characterized heterogeneous shale reservoirs and predicted hydraulic fracturing performance by combining core analysis, well logging, geomechanical testing, and microseismic monitoring. Similarly, Ghirfa [21] evaluated reservoir properties in unexplored areas by integrating historical production data, well logs, fluid analysis, and geological information. However, limited attention has been paid to the reclassification of fluid type in structurally complex reservoirs where PVT-based interpretation conflicts with field performance.
In this study, we propose a geoscience–engineering integrated framework that combines structural interpretation, PVT data, production history, pressure build-up tests, and fracturing records. Using a stepwise validation strategy, the preliminary PVT-based fluid classification was first checked against fluid appearance, compositional characteristics, and production performance. When inconsistencies were identified, additional analyses, including offset-well comparison, composite-radius evaluation, and structural interpretation, were performed to reassess the fluid system. Unlike many previous integrated studies that mainly relied on cross-validation among experimental datasets or on single-well observations, this work incorporates laboratory fluid data, geological structural interpretation, and adjacent-well production behavior within the same diagnostic workflow. By synthesizing all available evidence, Well X01 was ultimately interpreted as a saturated oil system with a gas cap, and the spatial extent of the gas cap was delineated.

2. Geological Setting

2.1. Regional Geological Setting

The central Sichuan Basin has been a key area for tight oil exploration and development in recent years. It is located in the northern part of the gentle structural belt of the Central Sichuan Paleo-Uplift. This block contains three oil-bearing intervals, namely the Shaximiao Formation, the Lianggaoshan Formation, and the Da’anzhai Formation, from top to bottom. A major through-going fault, the Gong No. 1 Fault, penetrates downward into the Da’anzhai Formation [22,23]. The Da’anzhai and Lianggaoshan formations act as the main source rocks. In addition, the faults and body transport system formed by the interlayer faults and sand bodies provide favorable conditions for hydrocarbon migration and accumulation in this block. This fault system effectively connects the Es1 reservoir of the Shaximiao Formation with the underlying Lianggaoshan source rocks. As a result, the target interval of Well X01, namely the Es1 member of the Shaximiao Formation, constitutes the main tight oil reservoir in the block.
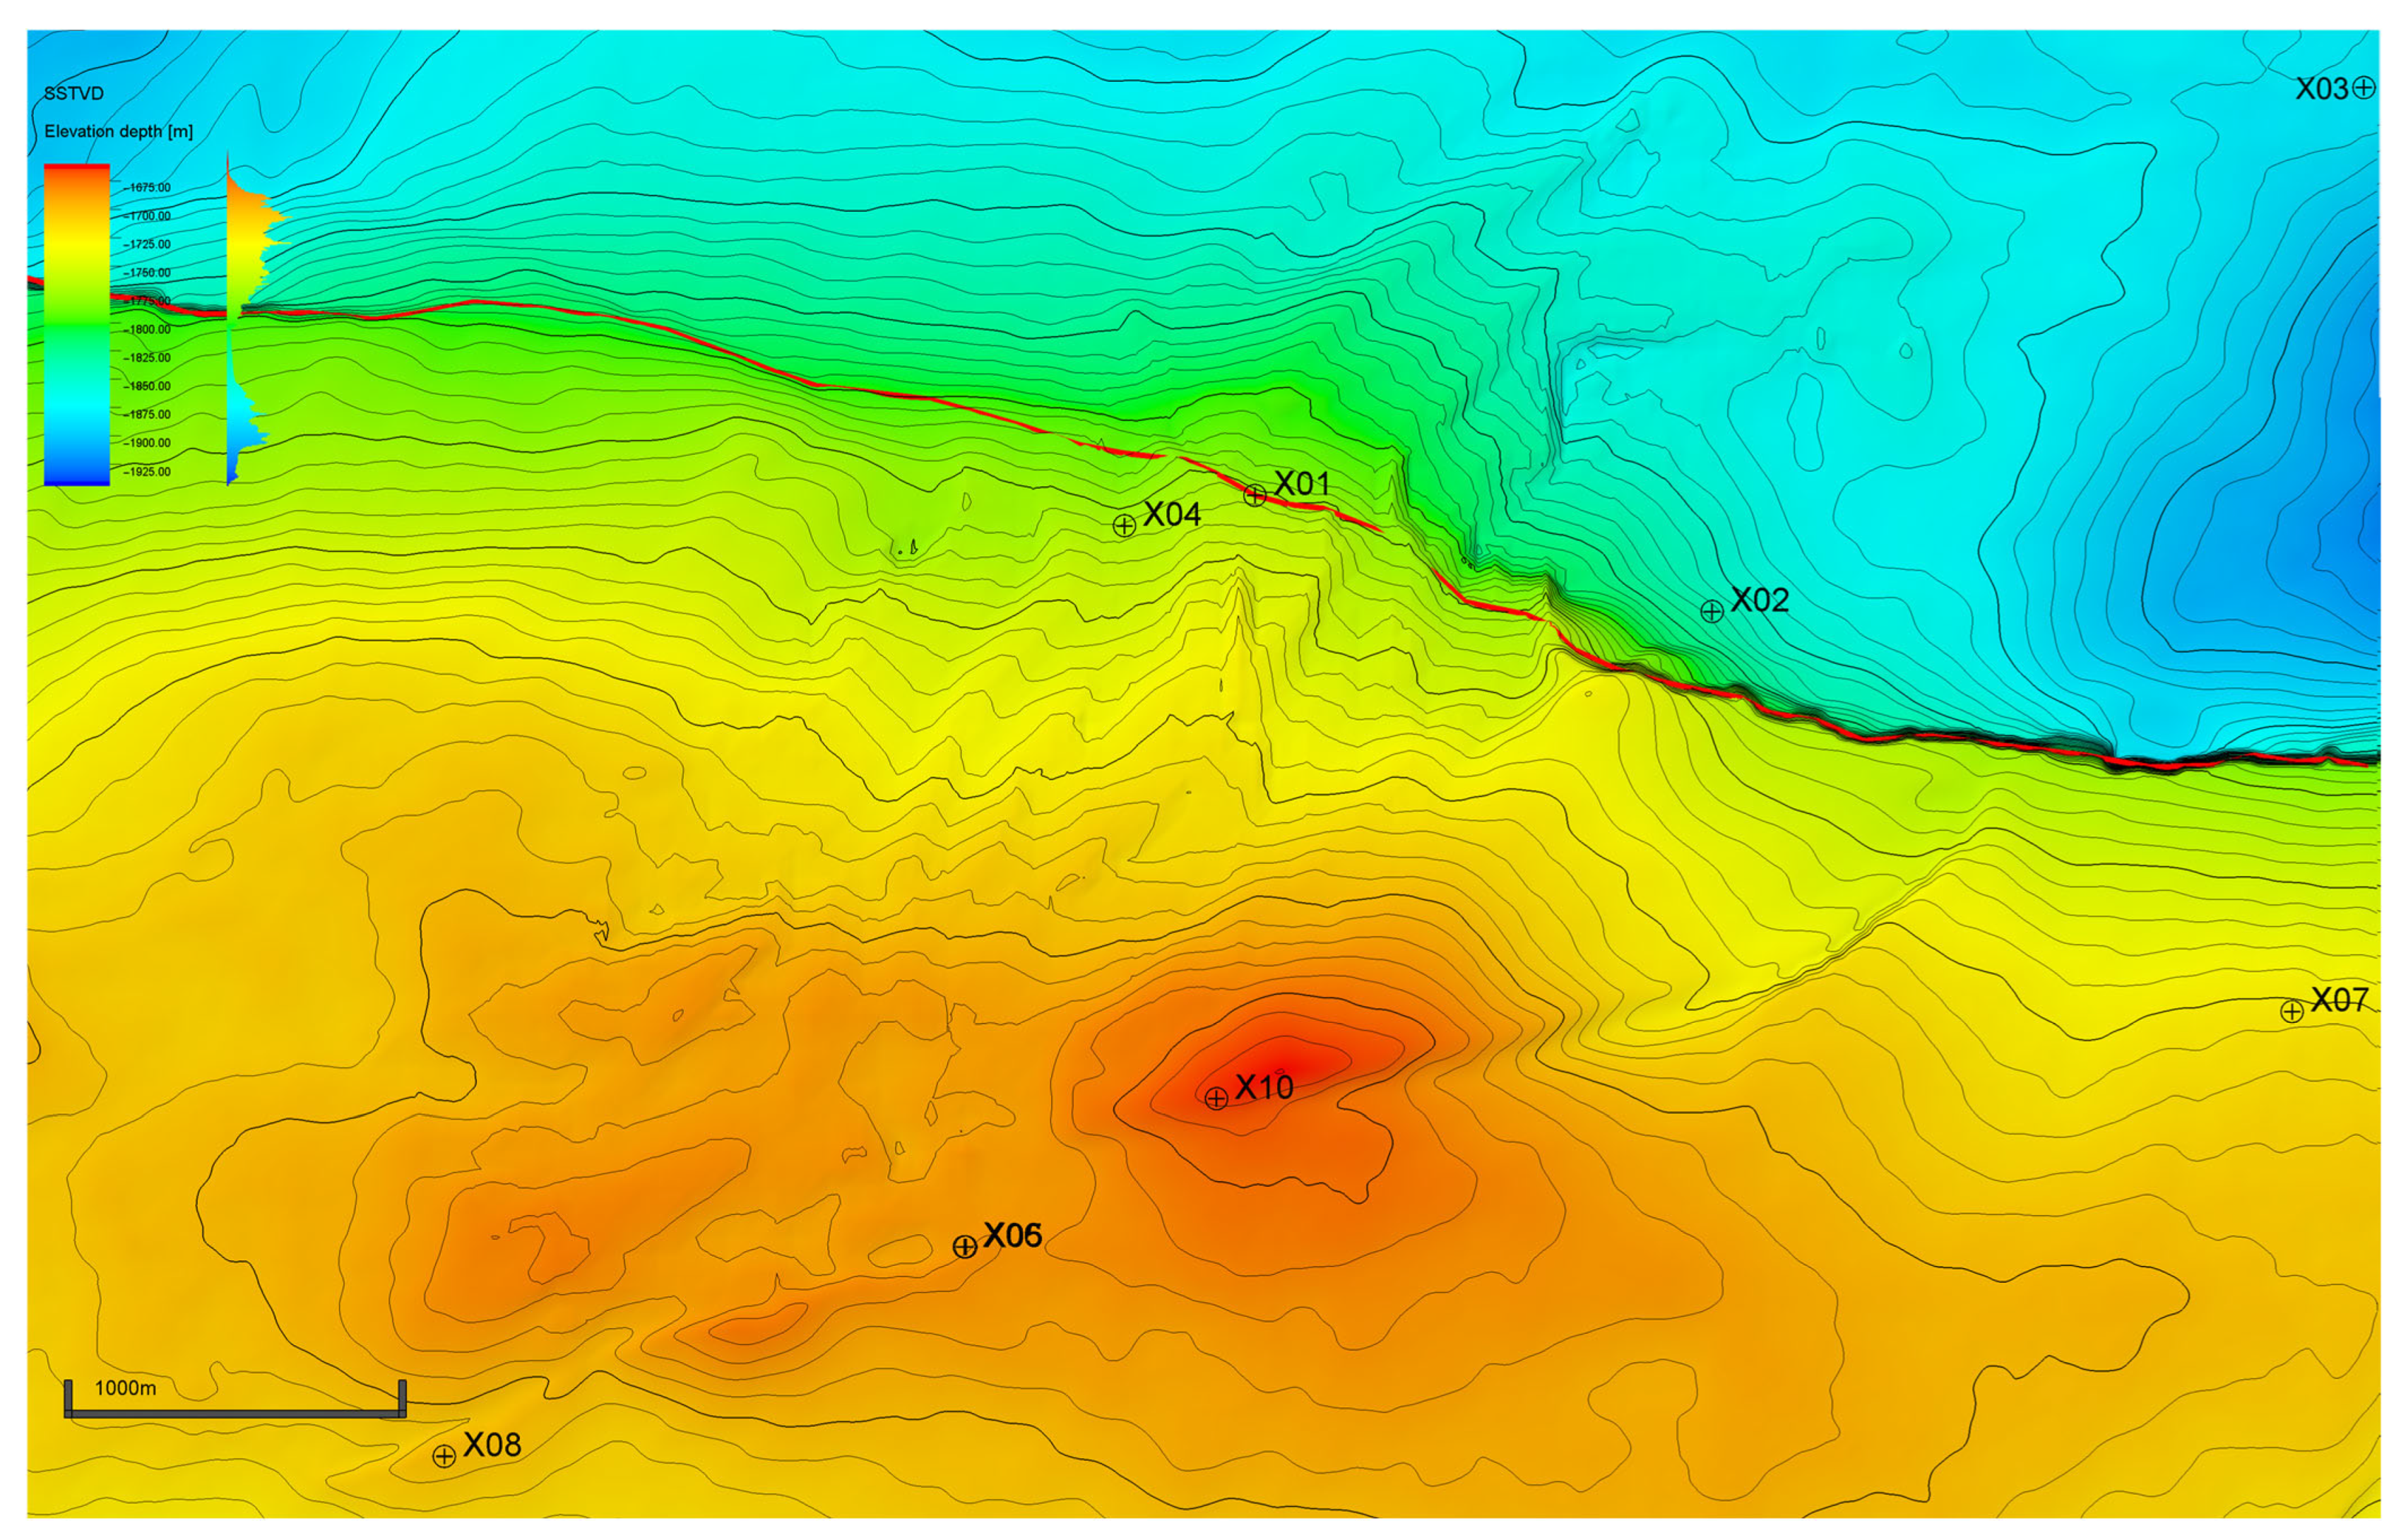
Figure 1 shows the relative locations of the wells in the study area. The study area is dominated by a terrigenous clastic sedimentary system. The target interval is divided into two segments from top to bottom: J2s2 and J2s1, with a total thickness of up to 2000 m. Among these, J2s1 is primarily characterized by alternating gray sandstones with gray and red mudstones, while J2s2 consists of interbedded gray sandstones and purplish-red mudstones. The channel sand bodies generally trend from northeast to southwest. A total of 23 stacked channel-sandbody units are developed in the Shaximiao Formation, including 5 in the Es1 member and 18 in the Es2 member. The reservoirs are controlled by local anticlinal structures, with a series of normal faults developed between the layers.

2.2. Geological Conditions for Condensate Formation

Condensate formation generally occurs in relatively high-temperature and high-pressure conditions, typically at burial depths of 3000–7000 m and formation temperatures of 90–120 °C [24,25]. It is primarily derived from sapropelic kerogen (Type I or II), whose hydrocarbon-generating potential favors the formation of liquid hydrocarbons and condensate during thermal maturation [26,27,28]. Thermal maturity is a key controlling factor in condensate generation. When vitrinite reflectance (Ro) is below 0.5%, the source rock is immature. Between 0.5% and 1.2%, it lies within the oil window. Above 1.2%, crude oil undergoes secondary cracking to generate condensate and wet gas, whereas above 2.0%, hydrocarbon products are dominated by dry gas, primarily methane. In Well X01, the source rock occurs at a burial depth of approximately 2300 m, with a formation temperature of 61 °C. The organic matter is dominated by Type II sapropelic kerogen, and the measured vitrinite reflectance (Ro) ranges from 0.75% to 1.26% (average 1.04%), indicating that the source rock is mainly within the oil window. Table 1 compares the general geological conditions for gas condensate generation with those observed in Well X01.

3. Methods and Data

3.1. Analytical Workflow

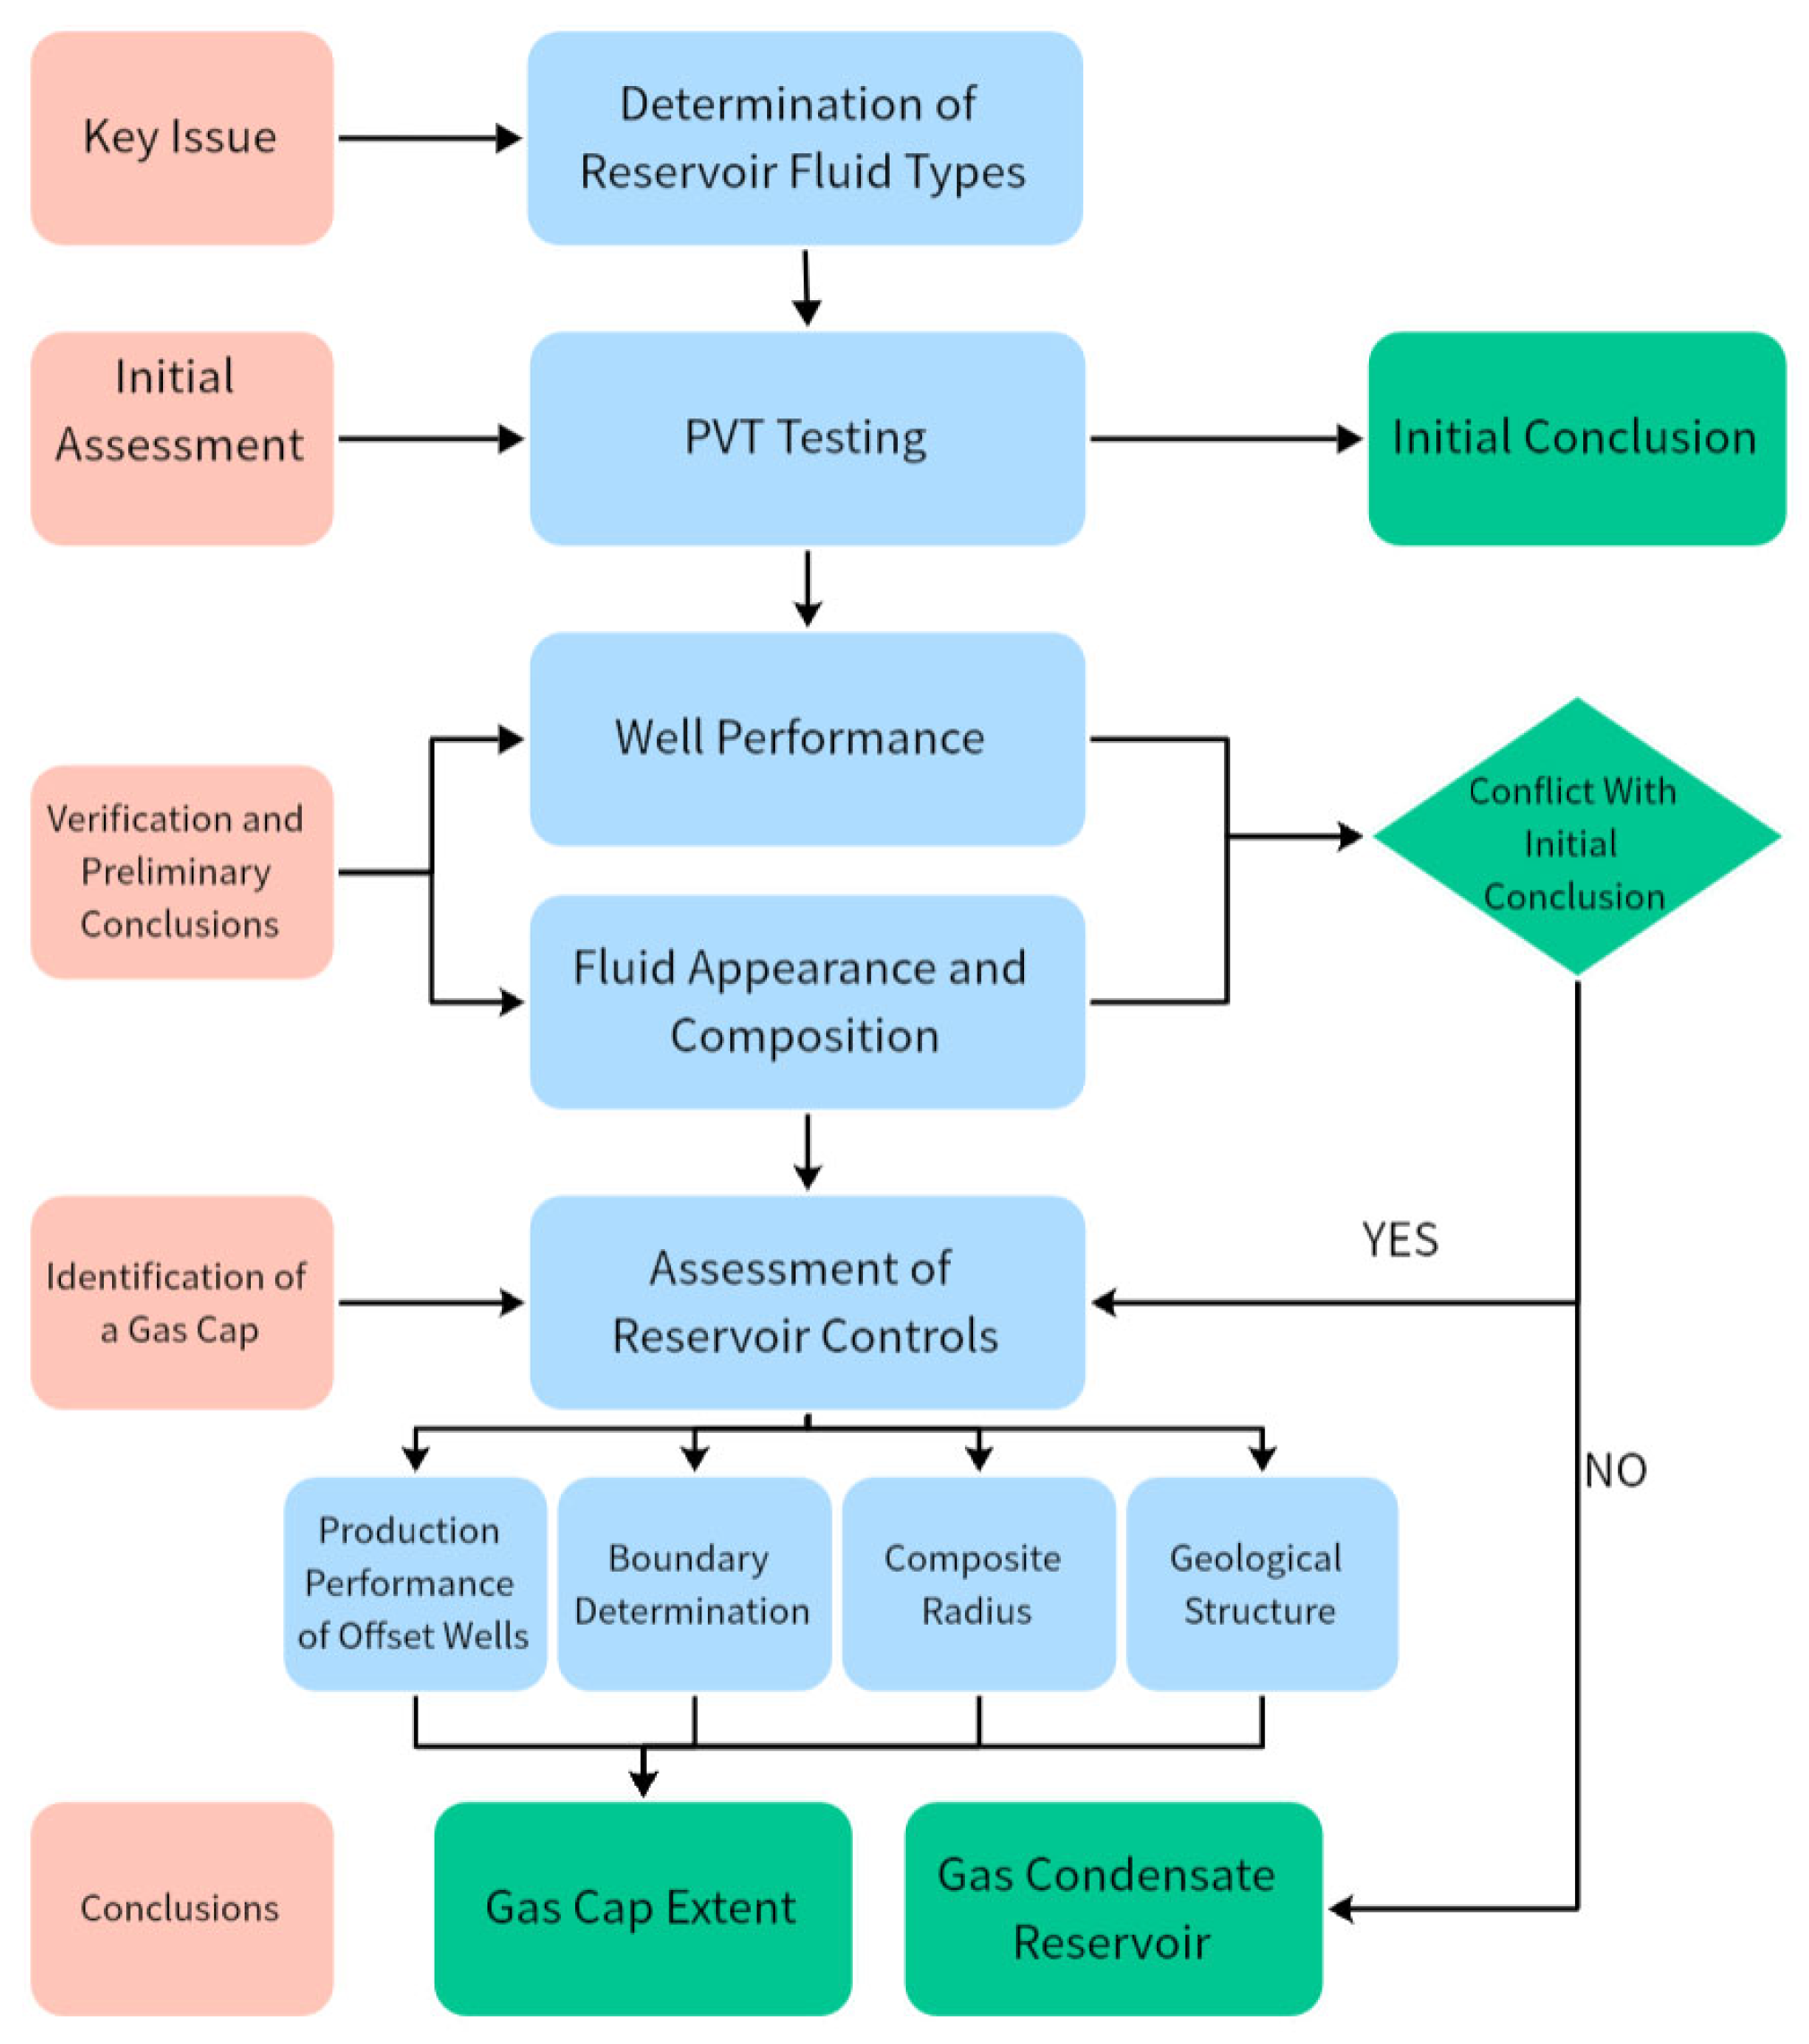
Figure 2 presents the analytical workflow of this study, outlining the stepwise process from preliminary fluid assessment to the final discrimination between a condensate gas reservoir and a gas-cap oil reservoir. Based on this workflow, the datasets required for each analytical stage were collected and organized.

3.2. Data Sources and Analytical Methods

PVT analysis was conducted using an ST-PVT apparatus at an ambient temperature of 24 °C and relative humidity (RH) of 67%. The sample was reconstituted by combining separator gas and stock tank oil according to the producing GOR measured on-site (3700 m3/m3). The reconstituted fluid was then introduced into the PVT system under reservoir conditions (61 °C, 21.43 MPa) to determine its phase behavior and fluid properties. A constant-composition expansion experiment was performed over a pressure range of 3.00–21.43 MPa to determine the dew point pressure (20.20 MPa at 61 °C). A constant-volume depletion test was then carried out using a cold trap maintained at 0.0 °C down to an abandonment pressure of 5.00 MPa, thereby providing the depletion data required for PVT analysis. All analytical procedures followed the Chinese National Standard GB/T 26981-2020 [29].
Data from ten wells in the central Gongshanmiao area of the Sichuan Basin were used in this study. They were provided by the Southwest Oil and Gas Field Company, including regional structure maps, stratigraphic columns, field production data (including pressure build-up test records, fracturing operation data, and production history for each well), as well as wellhead oil samples. These datasets provided the basis for the integrated diagnosis and reclassification of reservoir fluid type.
For compositional comparison, oil and gas samples from Well X01, Well X02, and Well X11 were collected separately on site during production. The samples were then recombined in proportion according to the actual production data, including the measured gas-oil ratio. The same sampling procedure and recombination principle were applied to all three wells to ensure comparability of the analyzed fluid samples.
The pressure build-up test was conducted after 30 days of continuous production at a constant rate, followed by a 23-day shut-in period. Bottom-hole pressure was monitored throughout the pressure recovery process using a downhole pressure gauge. Pressure build-up test data were interpreted using the Saphir module in KAPPA software (version 5.40). Post-fracturing shut-in pressure decline data were recorded over a 22 min period. Initial recordings were obtained at wellhead pressure and then converted to formation pressure by adding the hydraulic pressure of the fluid column. The converted data met the requirements for G-function analysis. This analysis was performed using the Pressure Analysis function within the Kinetix (version 2022) plugin on the Petrel (version 2022) platform.

4. Results and Discussion

4.1. PVT-Based Fluid Characterization

The PVT analysis yielded four main observations. First, the dew-point pressure measured at 20.20 MPa and 61 °C, which is lower than the reservoir pressure of 21.43 MPa. Second, retrograde condensation behavior was observed, and the condensate-liquid volume reached a maximum of 5.49% of hydrocarbon pore volume when pressure declined to 17.00 MPa. Third, the constant-volume depletion test gave a condensate-oil recovery of 29.25% and a natural gas recovery of 80.52% at abandonment pressure. Fourth, the oil sample density increased from 0.7244 g/cm3 at the dew-point pressure to 0.7651 g/cm3 at the abandonment pressure of 5.00 MPa.
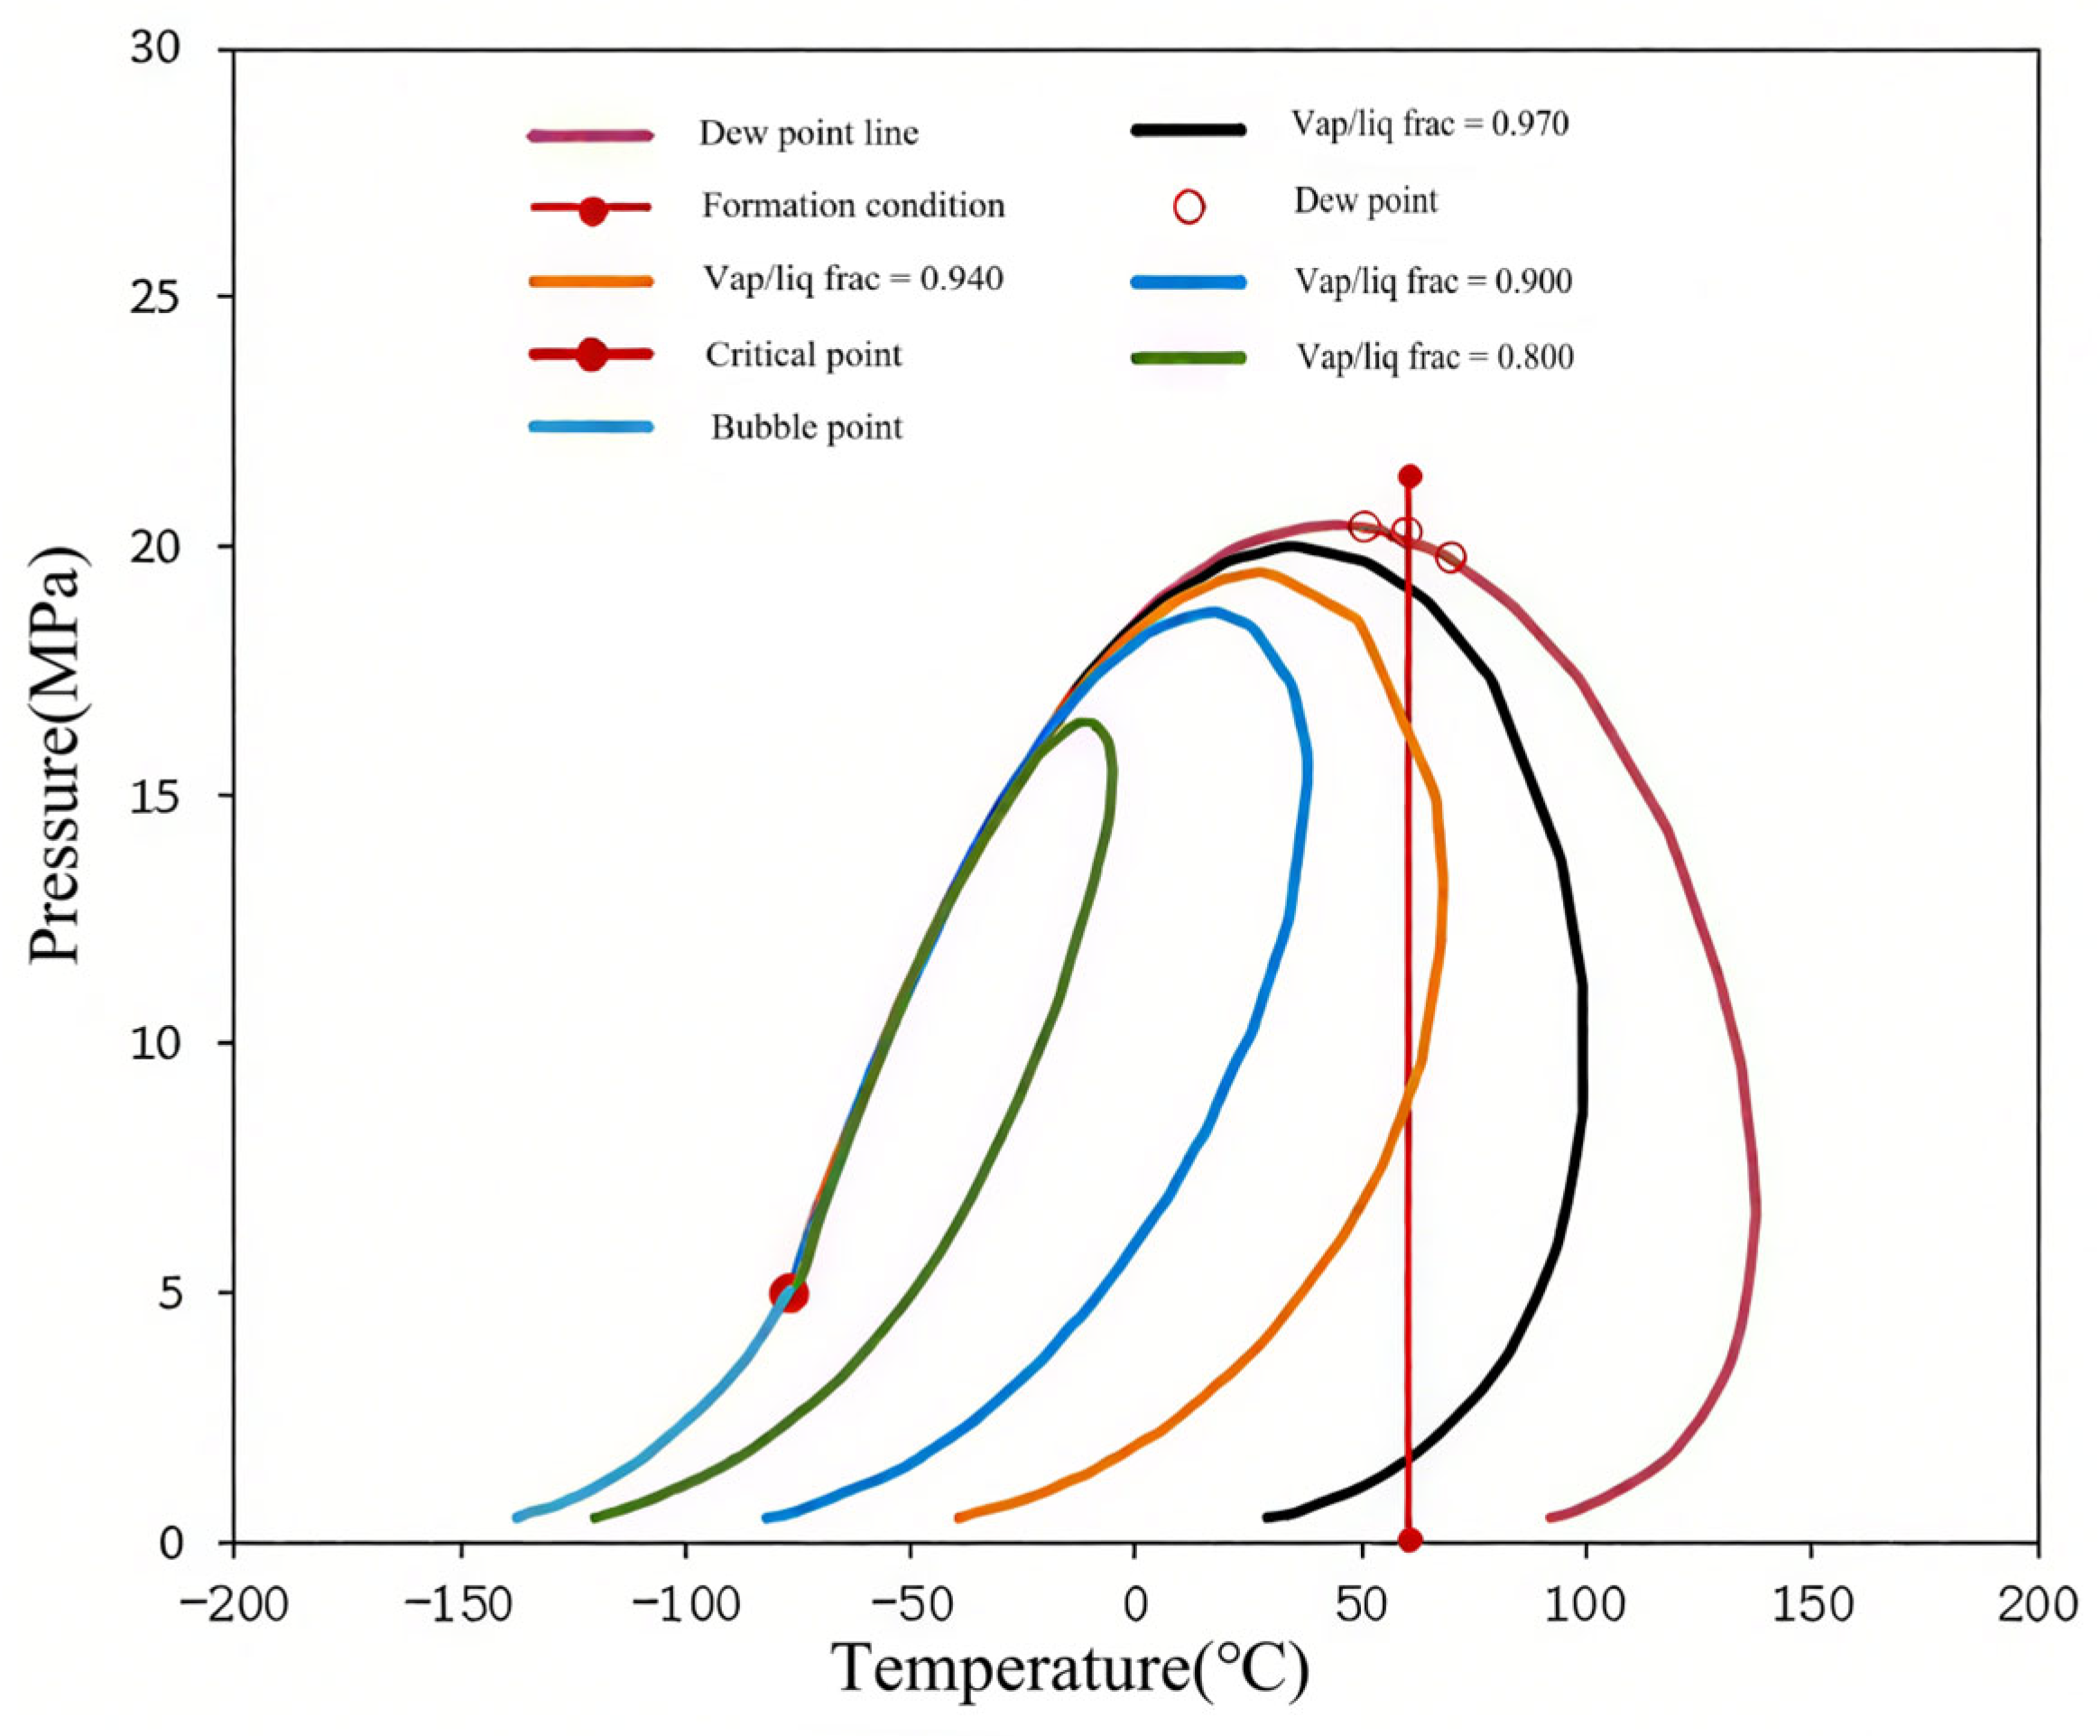
Based on experimental results, a characteristic phase diagram was constructed using phase-behavior simulation together with the oil-sample composition data (methane = 86.50%; C6+ = 3.72%) and the constant-composition expansion results (Figure 3). the phase diagram shows that the reservoir condition of Well X01 (61 °C) lies within the two-phase envelope, while the separator condition also falls within the two-phase region. Additionally, the measured GOR and stock-tank oil density are broadly consistent with the diagnostic ranges of condensate gas reservoirs listed in Table 2: the PVT-measured GOR of 3700 m3/m3 falls within the condensate gas range, and the oil density of 0.7244–0.7651 g/cm3 is also consistent with the typical density range of condensate liquids. Therefore, based on the PVT evidence alone, the reservoir would initially be classified as a condensate gas reservoir.

4.2. Production-Performance Inconsistencies

Subsequent field-performance analysis revealed clear inconsistencies between the PVT-based classification of the reservoir as a condensate gas reservoir and the actual production behavior. These inconsistencies are reflected in the following three aspects.
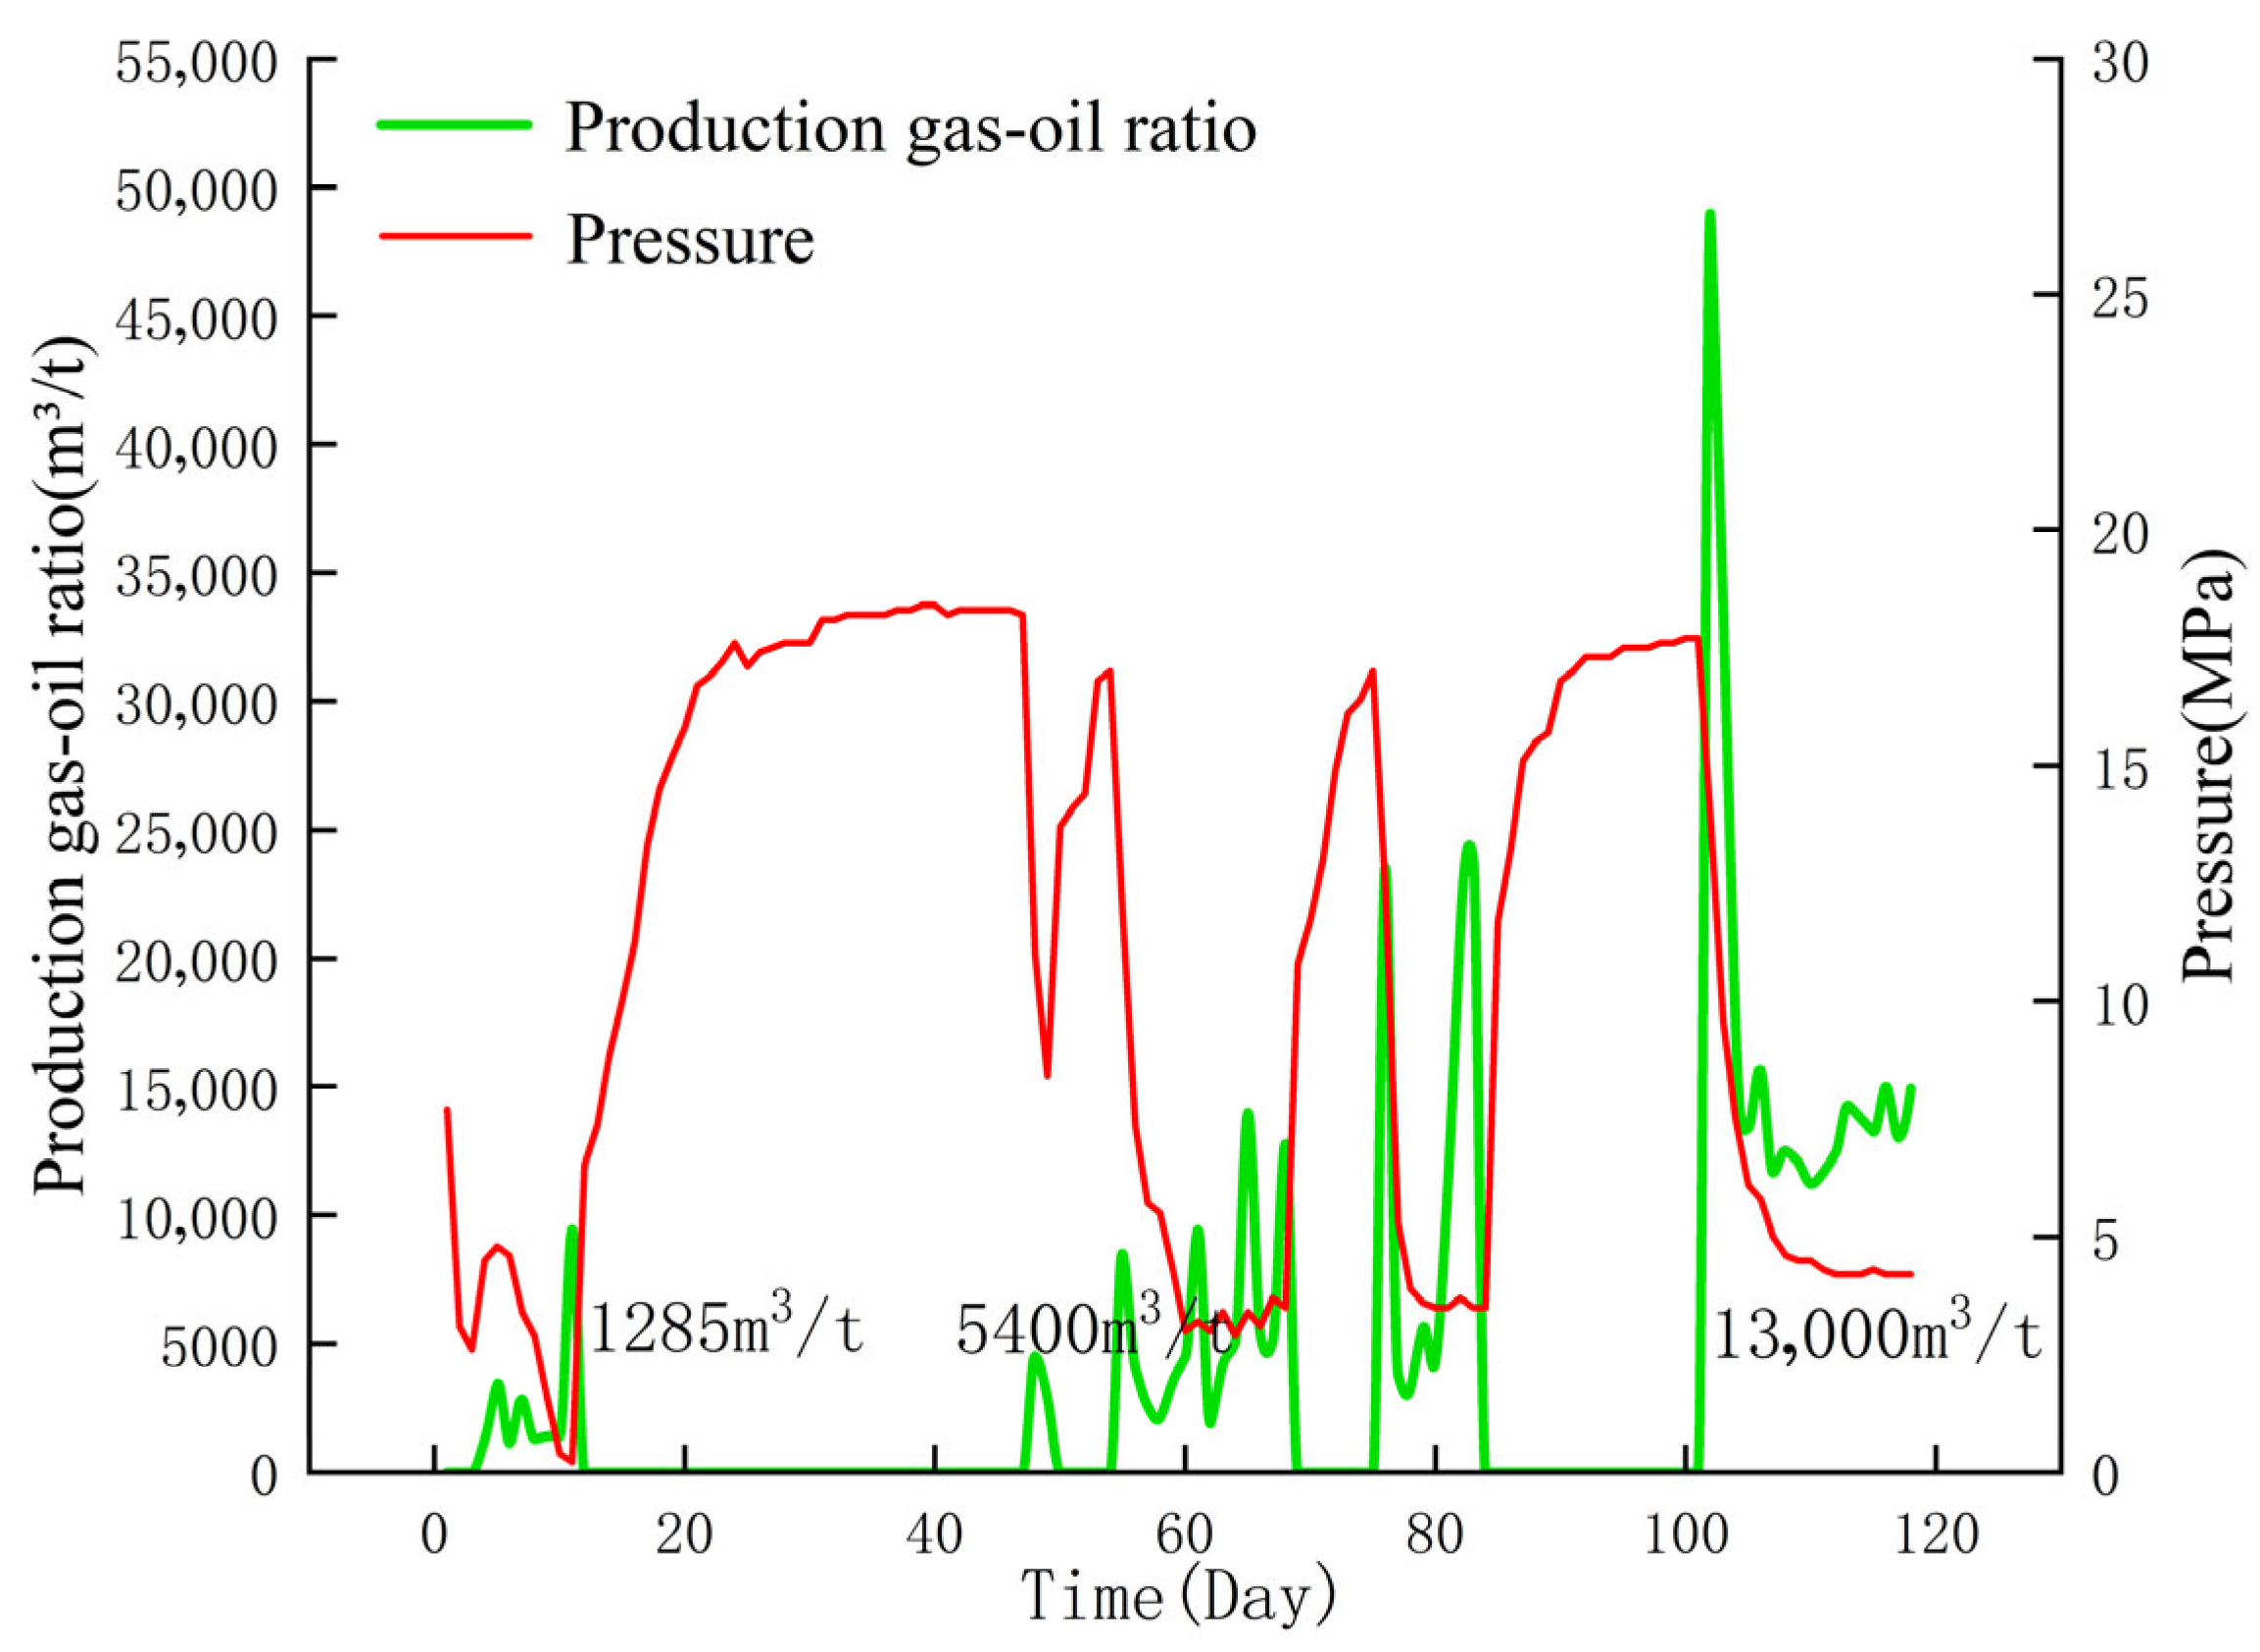
First, the initial GOR of well X01 was 1285 m3/t (as shown in Figure 4). Due to operational management, the well was shut in three times; after each restart, the flowback GOR increased markedly: firstly, 5400 m3/t, then to 13,000 m3/t, and finally stabilized above 10,000 m3/t. This abnormal increasing trend is inconsistent with the typical production behavior of condensate gas reservoirs. Second, pressure build-up test interpretations indicate that the reservoir pressure dynamics and drive mechanisms do not conform to the typical characteristics of condensate gas reservoirs. Third, adjacent wells demonstrate production characteristics consistent with conventional saturated oil reservoirs, which contradict the PVT-based interpretation for well X01.
These contradictions reveal that relying solely on PVT experimental data may lead to misclassification of the reservoir as a condensate gas reservoir, highlighting the need for comprehensive evaluation using multi-source data to redefine the fluid properties.

4.3. Analysis of Field Fluid Samples

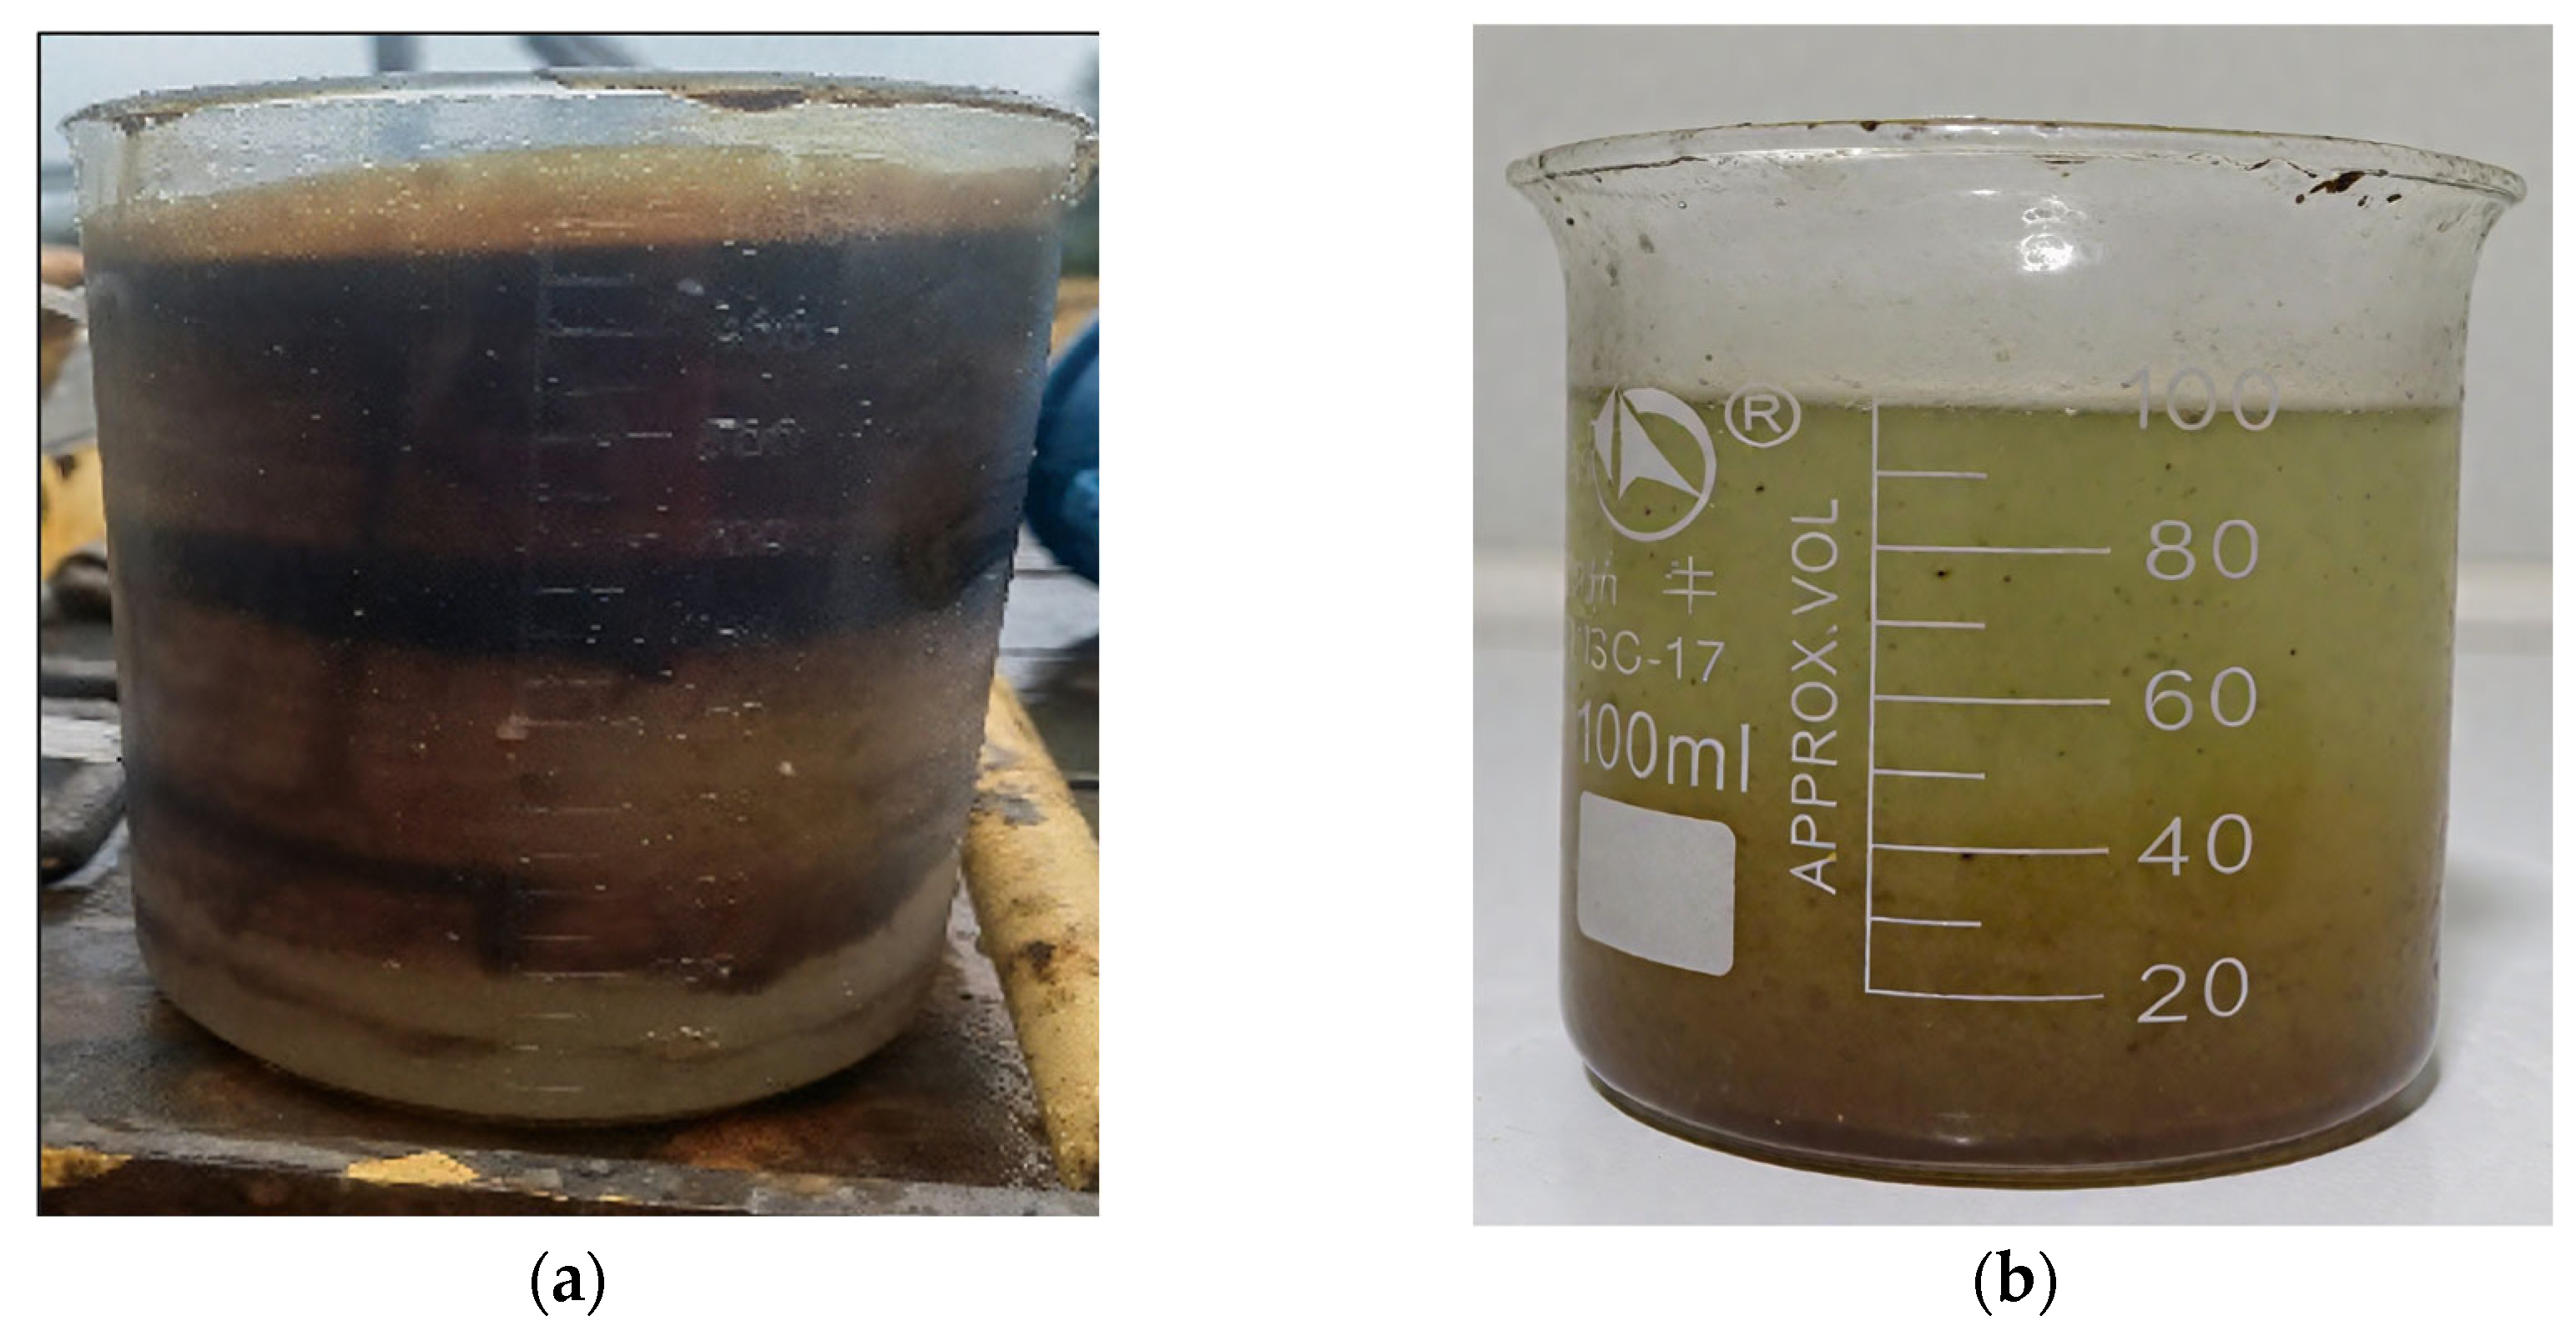
As shown in Figure 5, the fluid sample from Well X01 is dark in color, ranging from brown to nearly black, whereas condensate samples are typically colorless or pale yellow. To verify this difference, samples from condensate gas wells in adjacent blocks were collected on-site for comparison, confirming the lighter color of the condensate oil. The marked difference in appearance indicates that the fluid from Well X01 is inconsistent with the physical characteristics of condensate oil. Fluids in condensate gas reservoirs typically contain a relatively high proportion of intermediate hydrocarbons (C2–C6) and about 5–20% C7+ components [30]. This compositional range gives rise to pressure-sensitive phase behavior, particularly retrograde liquid dropout from the gas phase when pressure declines [10].
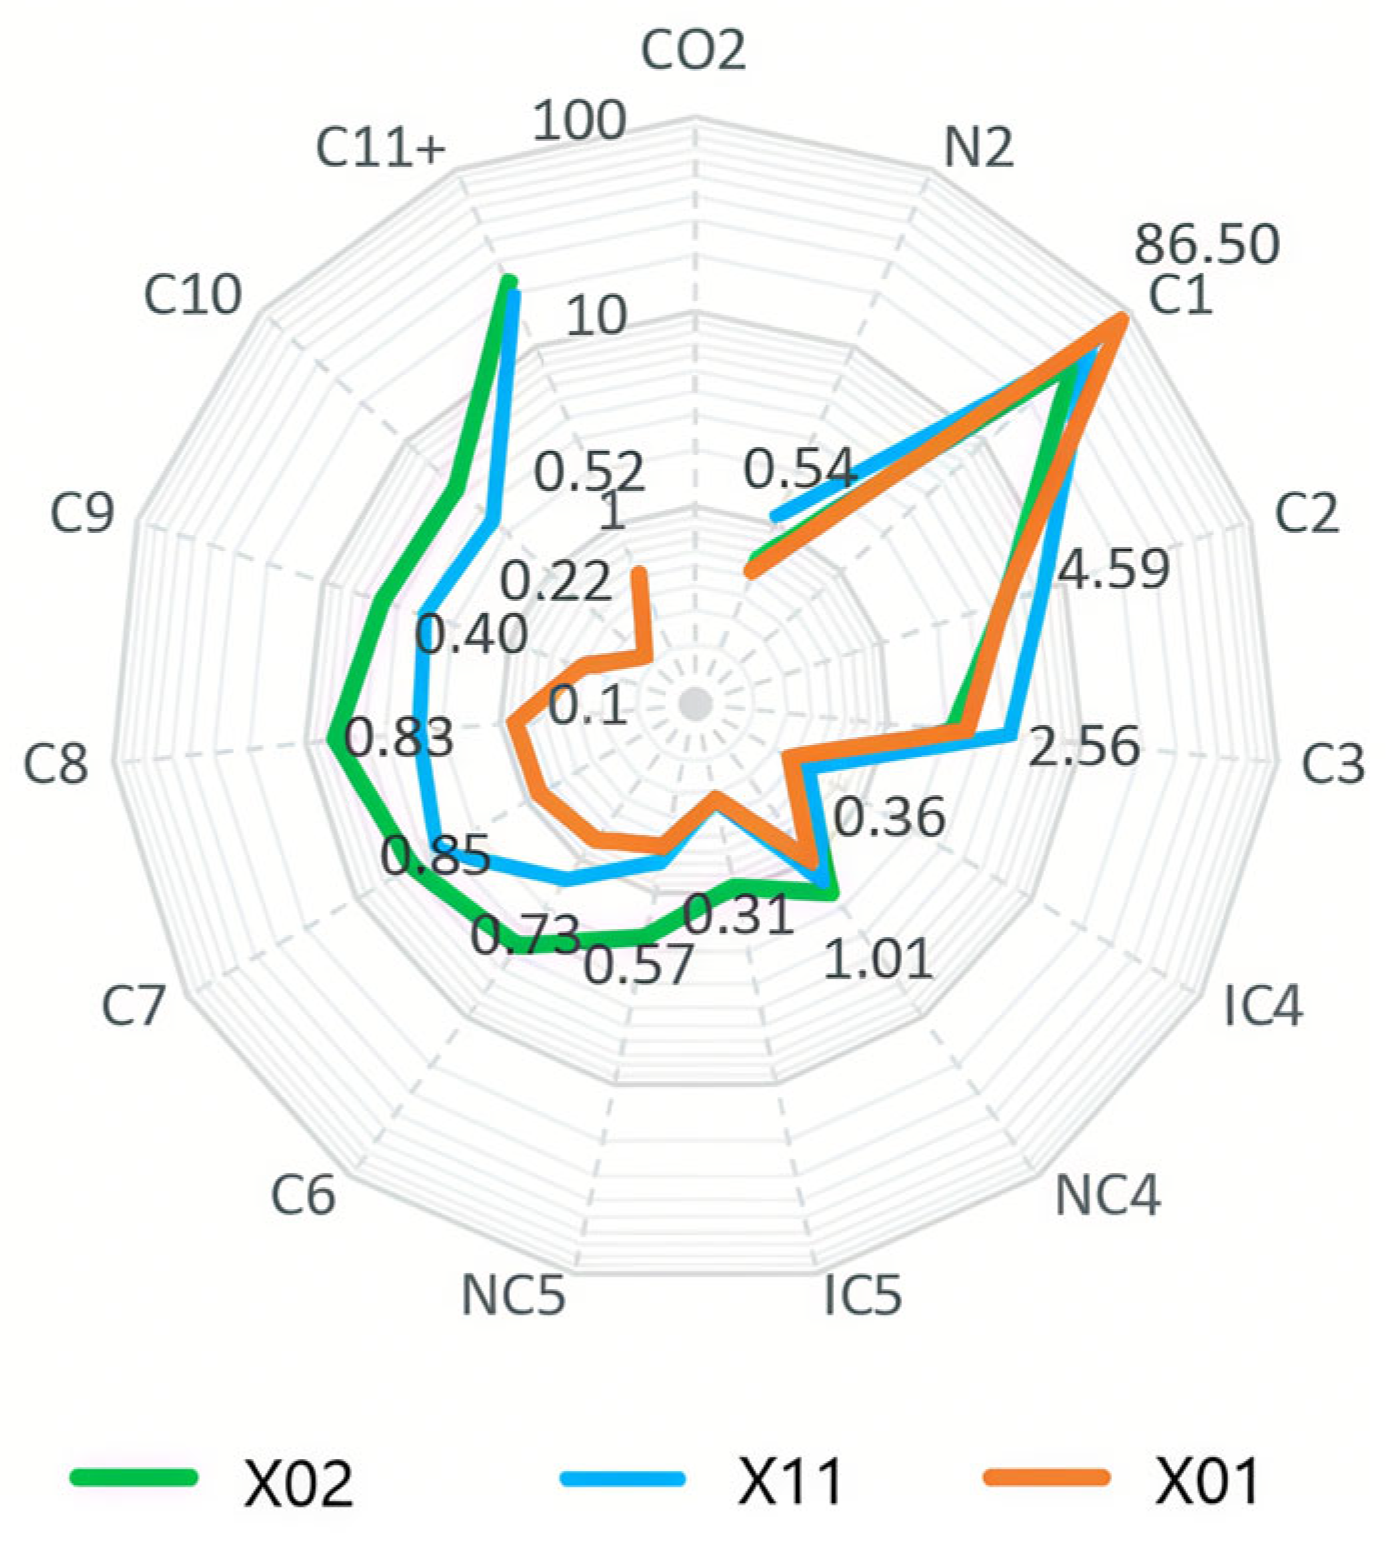
As shown in the fluid composition rose diagrams in Figure 6, the intermediate hydrocarbon content (C2–C6) in wells X01, X02, and X11 is similar, with total mole fractions ranging from 8.5% to 9.5% (X01: 9.28%, X02: 8.76%, X11: 9.27%). However, the C7+ content of well X01 is only 3.72%, with the combined C2–C6 and C7+ totaling 13%, which falls within the condensate gas range. In contrast, adjacent Wells X02 and X11 have much higher C7+ contents of 22.72% and 29.10%, respectively, which are inconsistent with condensate-gas composition and more consistent with crude-oil systems.

4.4. Analysis of Oil Well Production History

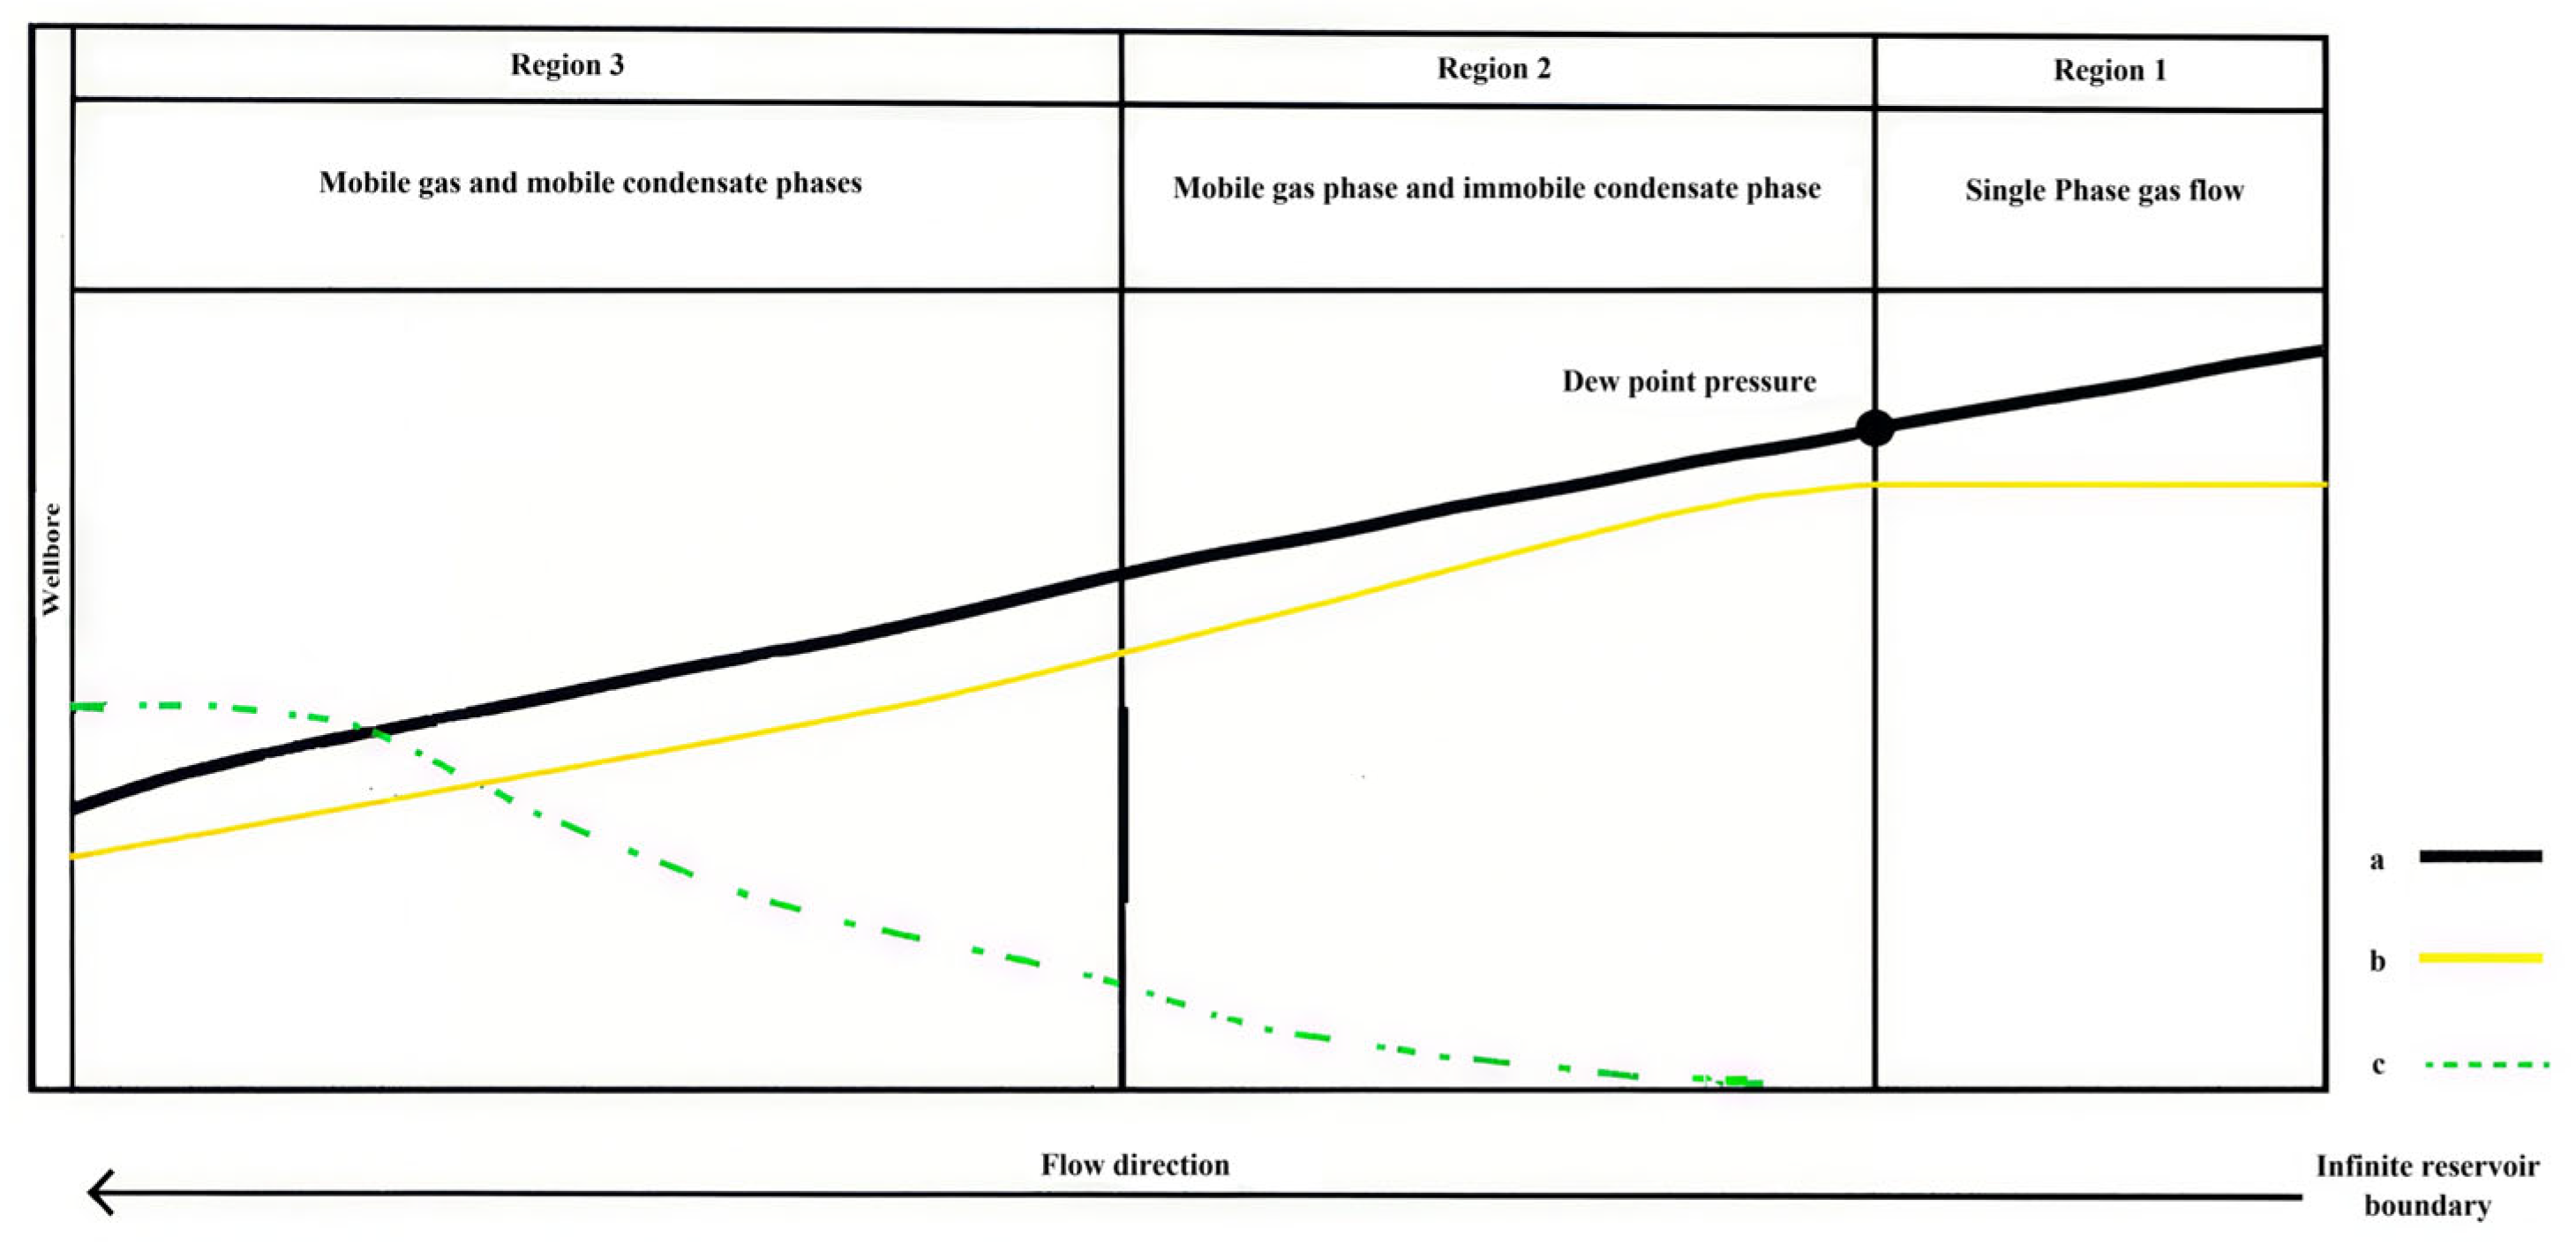
Condensate gas reservoirs exist as a single gas phase under original reservoir conditions. During production, once the bottom-hole flowing pressure drops below the dew-point pressure, heavier hydrocarbon components condense from the gas phase to form liquid condensate, thereby increasing the gas-phase proportion and causing the GOR to rise gradually [31,32]. Production from condensate gas wells typically proceeds through three stages [33,34,35] (Figure 7). In the first stage, reservoir pressure remains above the dew-point pressure, and the gas-oil ratio is generally stable. In the second stage, the bottom-hole flowing pressure falls below the dew point while the average reservoir pressure remains above it, leading to retrograde condensation near the wellbore and an overall increase in GOR, although short-term decreases may occur when condensate liquid is entrained by high-velocity gas flow. In the third stage, the average reservoir pressure also falls below the dew point, large-scale retrograde condensation causes condensate blockage in the reservoir, effective permeability declines sharply, and preferential dry-gas production results in a rapid increase in surface GOR.
Under normal production conditions, once a condensate gas well enters the second or third production stage, the GOR is expected to show a gradual increasing trend. However, Figure 4 and Figure 7 show that the GOR of Well X01 surged abruptly from 1285 m3/t to 13,000 m3/t, displaying a discontinuous increase rather than the gradual rise expected for a condensate gas reservoir. According to theoretical models, once reservoir pressure falls below the dew point pressure, the pressure curve should accelerate its decline. In contrast, during the actual production process of this well, the pressure remained nearly constant, a phenomenon cross-validated by synchronized high-precision electronic pressure gauges installed in two wells. This rapid GOR increase, without the expected pressure drop, deviates from the typical dynamic behavior of condensate gas reservoir exploitation.

4.5. Analysis of Pressure Build-Up Tests

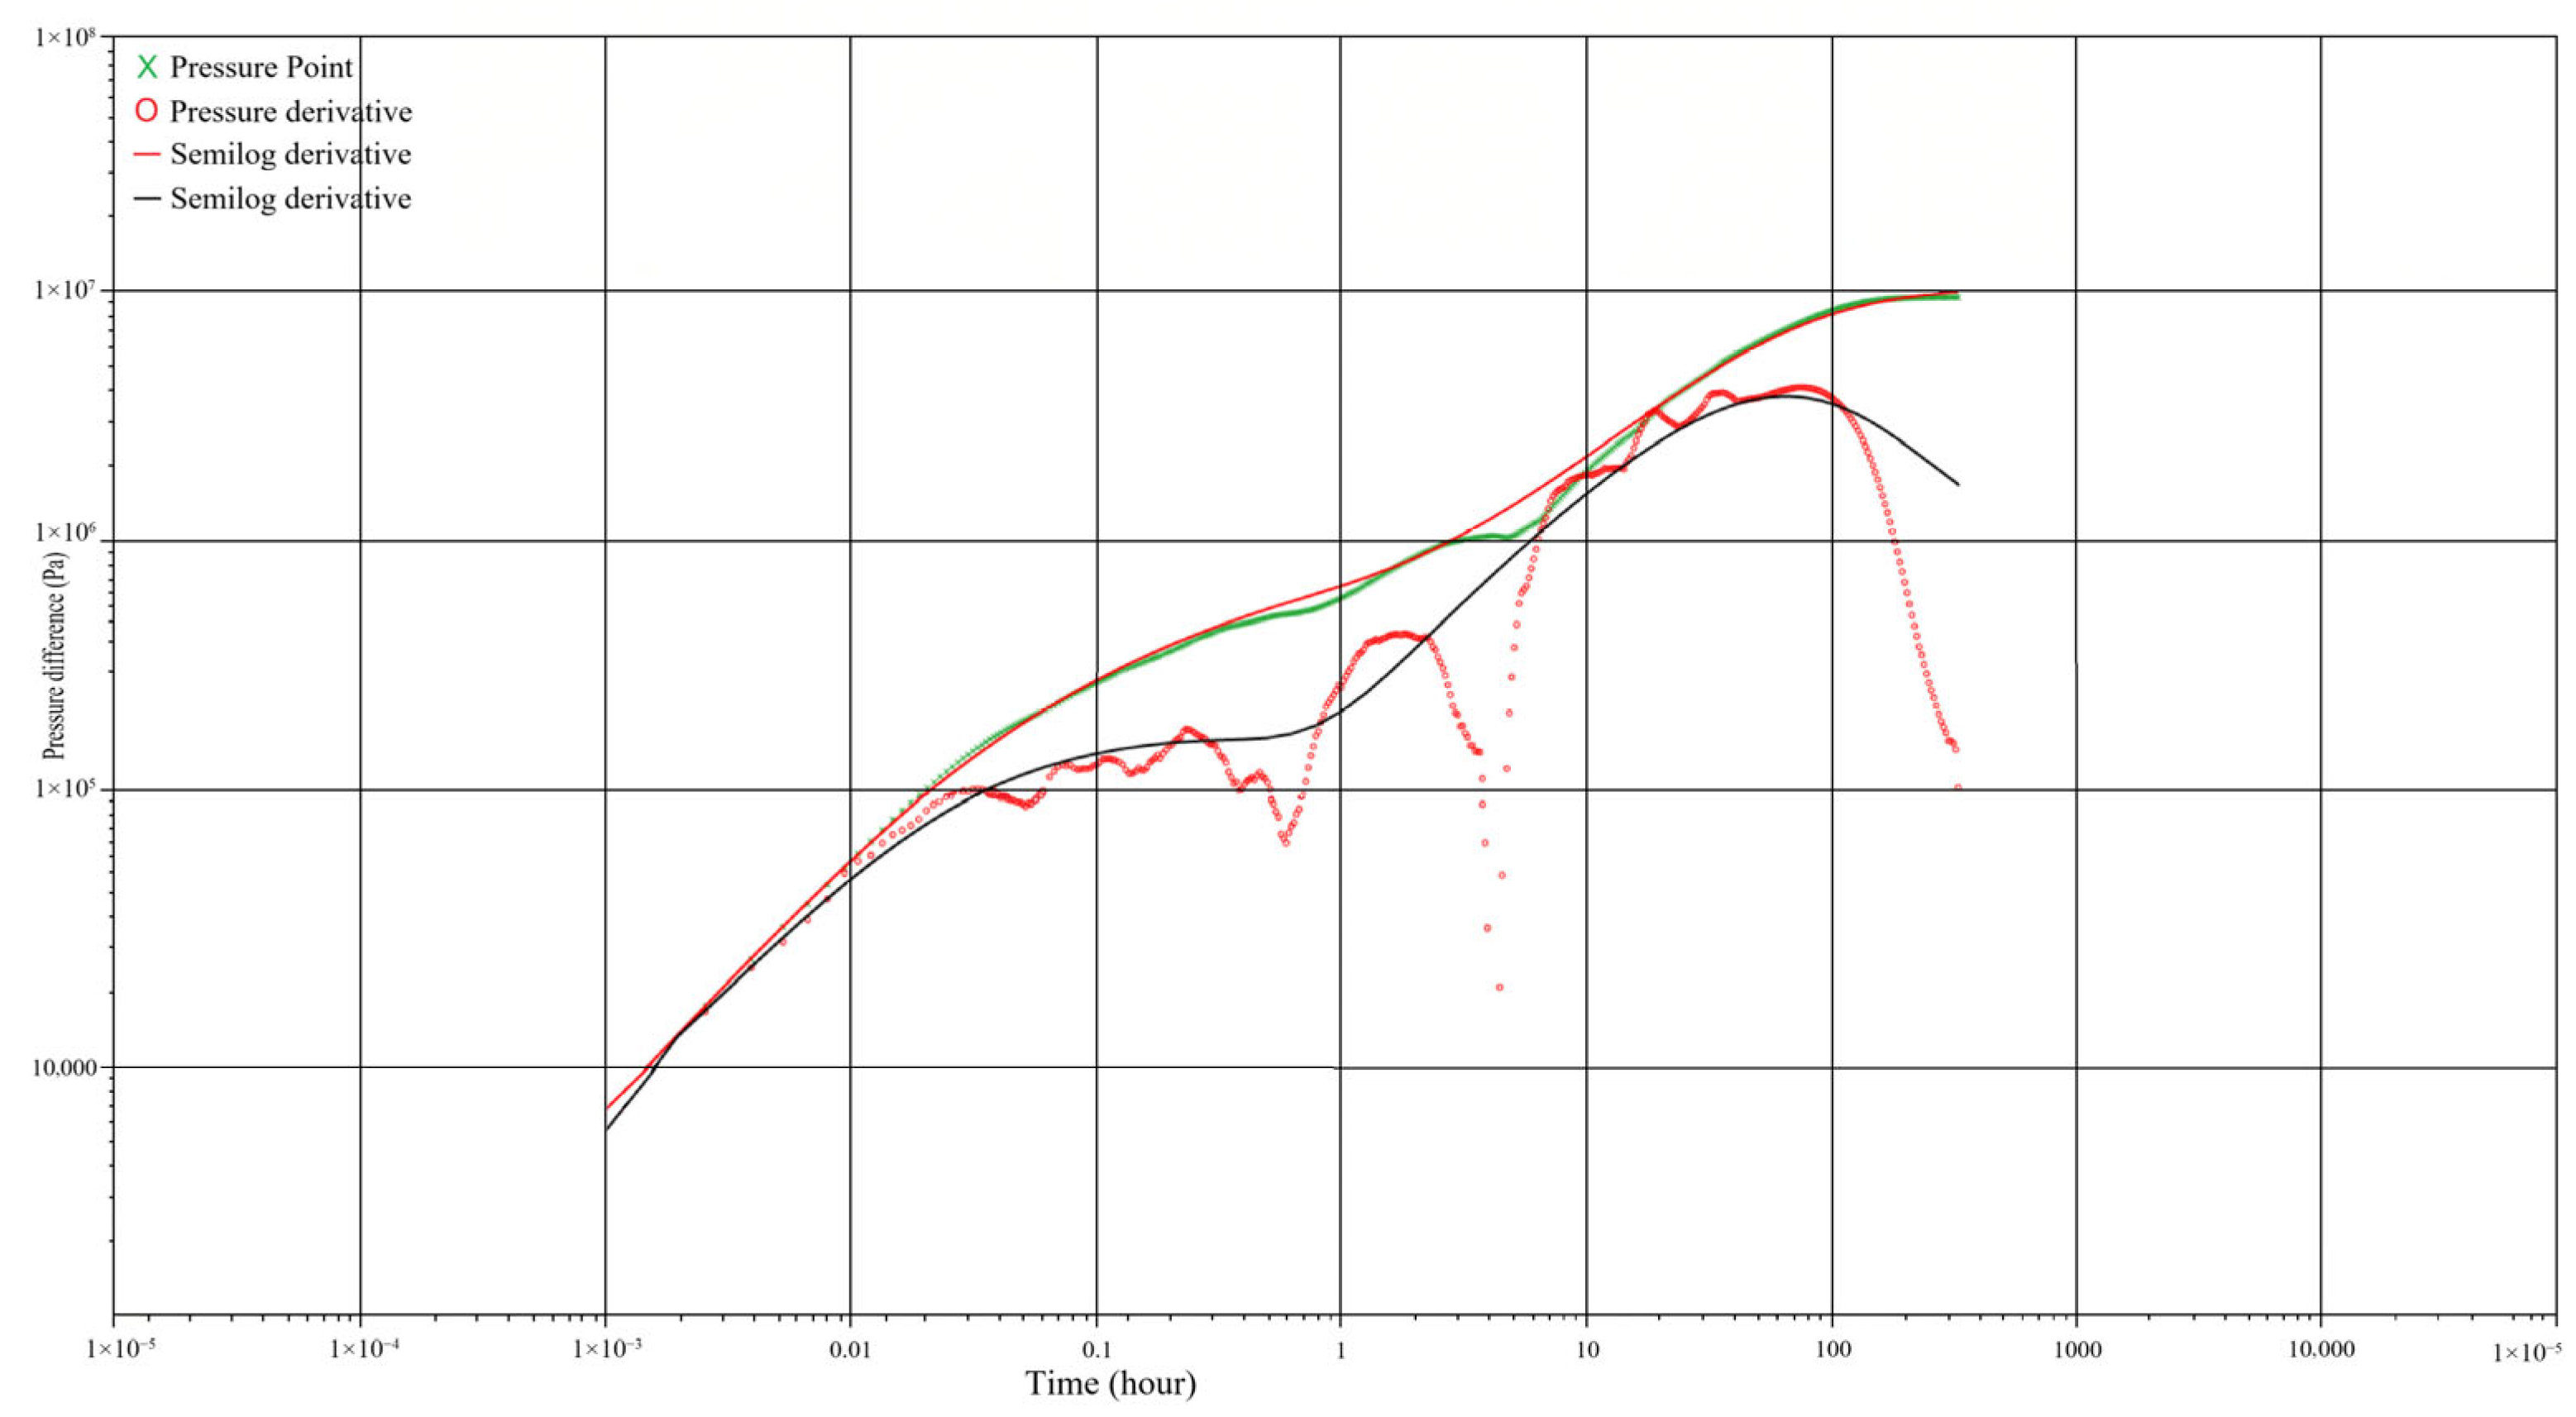
For PTA interpretation, the well was modeled in Saphir as a vertically fractured well with fixed wellbore storage, a composite gas-cap reservoir, and an infinite outer boundary. This model was selected because the observed flow-regime sequence includes an initial wellbore-storage stage, a linear-flow stage, an inner-boundary response, and a smooth late-time decline in the pressure-derivative curve. Compared with other possible mechanisms, this response is more consistent with mobility contrast in a composite reservoir than with retrograde-condensation effects or abrupt fault/fracture-dominated flow. The fitting was performed sequentially by matching wellbore storage, fracture half-length, fracture conductivity, reservoir permeability, and finally the composite-reservoir parameters, including mobility ratio, storativity ratio, and composite radius. Sensitivity analysis of the composite radius within ±20% showed that the best fit was obtained at 21.35 m. In this study, OGIP was mainly constrained by the material-balance method using formation pressure and cumulative gas production.
As shown in Figure 8, the pressure build-up test data acquired during the late production period of the well were used to construct a model comprising a fixed wellbore storage, vertical well hydraulic fracturing, a composite reservoir with a gas cap, and an infinite outer boundary. Using the material balance method for PTA interpretation, the late-time pressure derivative curve exhibited a downward trend. This behavior is primarily attributed to the high mobility of the gas cap. The intermediate discontinuities are interpreted as non-reservoir responses caused by noise and may also be related to the transition from two-phase to single-phase flow as reservoir pressure recovered above the dew point. PTA interpretation yielded a composite radius of 21.35 m. This composite radius is interpreted to represent the dominant dynamic flow pathway between Well X01 and the pre-existing natural gas cap. Combined with geological and structural analysis, this value closely matches the distance from Well X01 to the major G1 fault (23 m), indicating that the gas cap is controlled by the fault. The close agreement between the composite radius and the distance to the G1 fault suggests that the pressure transient response is controlled by fluid flow along the fault-connected fracture pathway. The high mobility ratio of the gas cap (outer-to-inner zone mobility ratio of 5.74) further explains the mechanism of the late-time derivative decline and is consistent with the dynamic response of fluids entering a highly permeable zone. The close correspondence between the composite radius and the distance to the G1 fault also suggests that hydraulic fracturing established effective communication with the fault system, which then acted as the main seepage pathway for gas migration from the natural gas cap into the well. The cumulative gas production of well X01 has reached 9.4 × 10⁵ m3. Based on the material balance equation, the original gas in place (OGIP) of the gas cap is estimated at 116.5–120.6 × 10⁴ m3. However, when estimated using the composite radius of 21.35 m, the gas cap OGIP is significantly smaller than that derived from the material balance equation, and the current production has already exceeded the gas volume that this radius could provide. This indicates that the composite radius primarily reflects the dominant flow channel controlled by fracture belts (i.e., the gas channeling pathway along the high-permeability zone), specifically the G1 fault adjacent to well X01, rather than the true gas cap boundary. The actual gas source is supplied from a much larger gas cap volume, and the supply range requires further clarification by integrating fault system and structural characteristics.

4.6. Analysis of Hydraulic Fracturing Operation Data

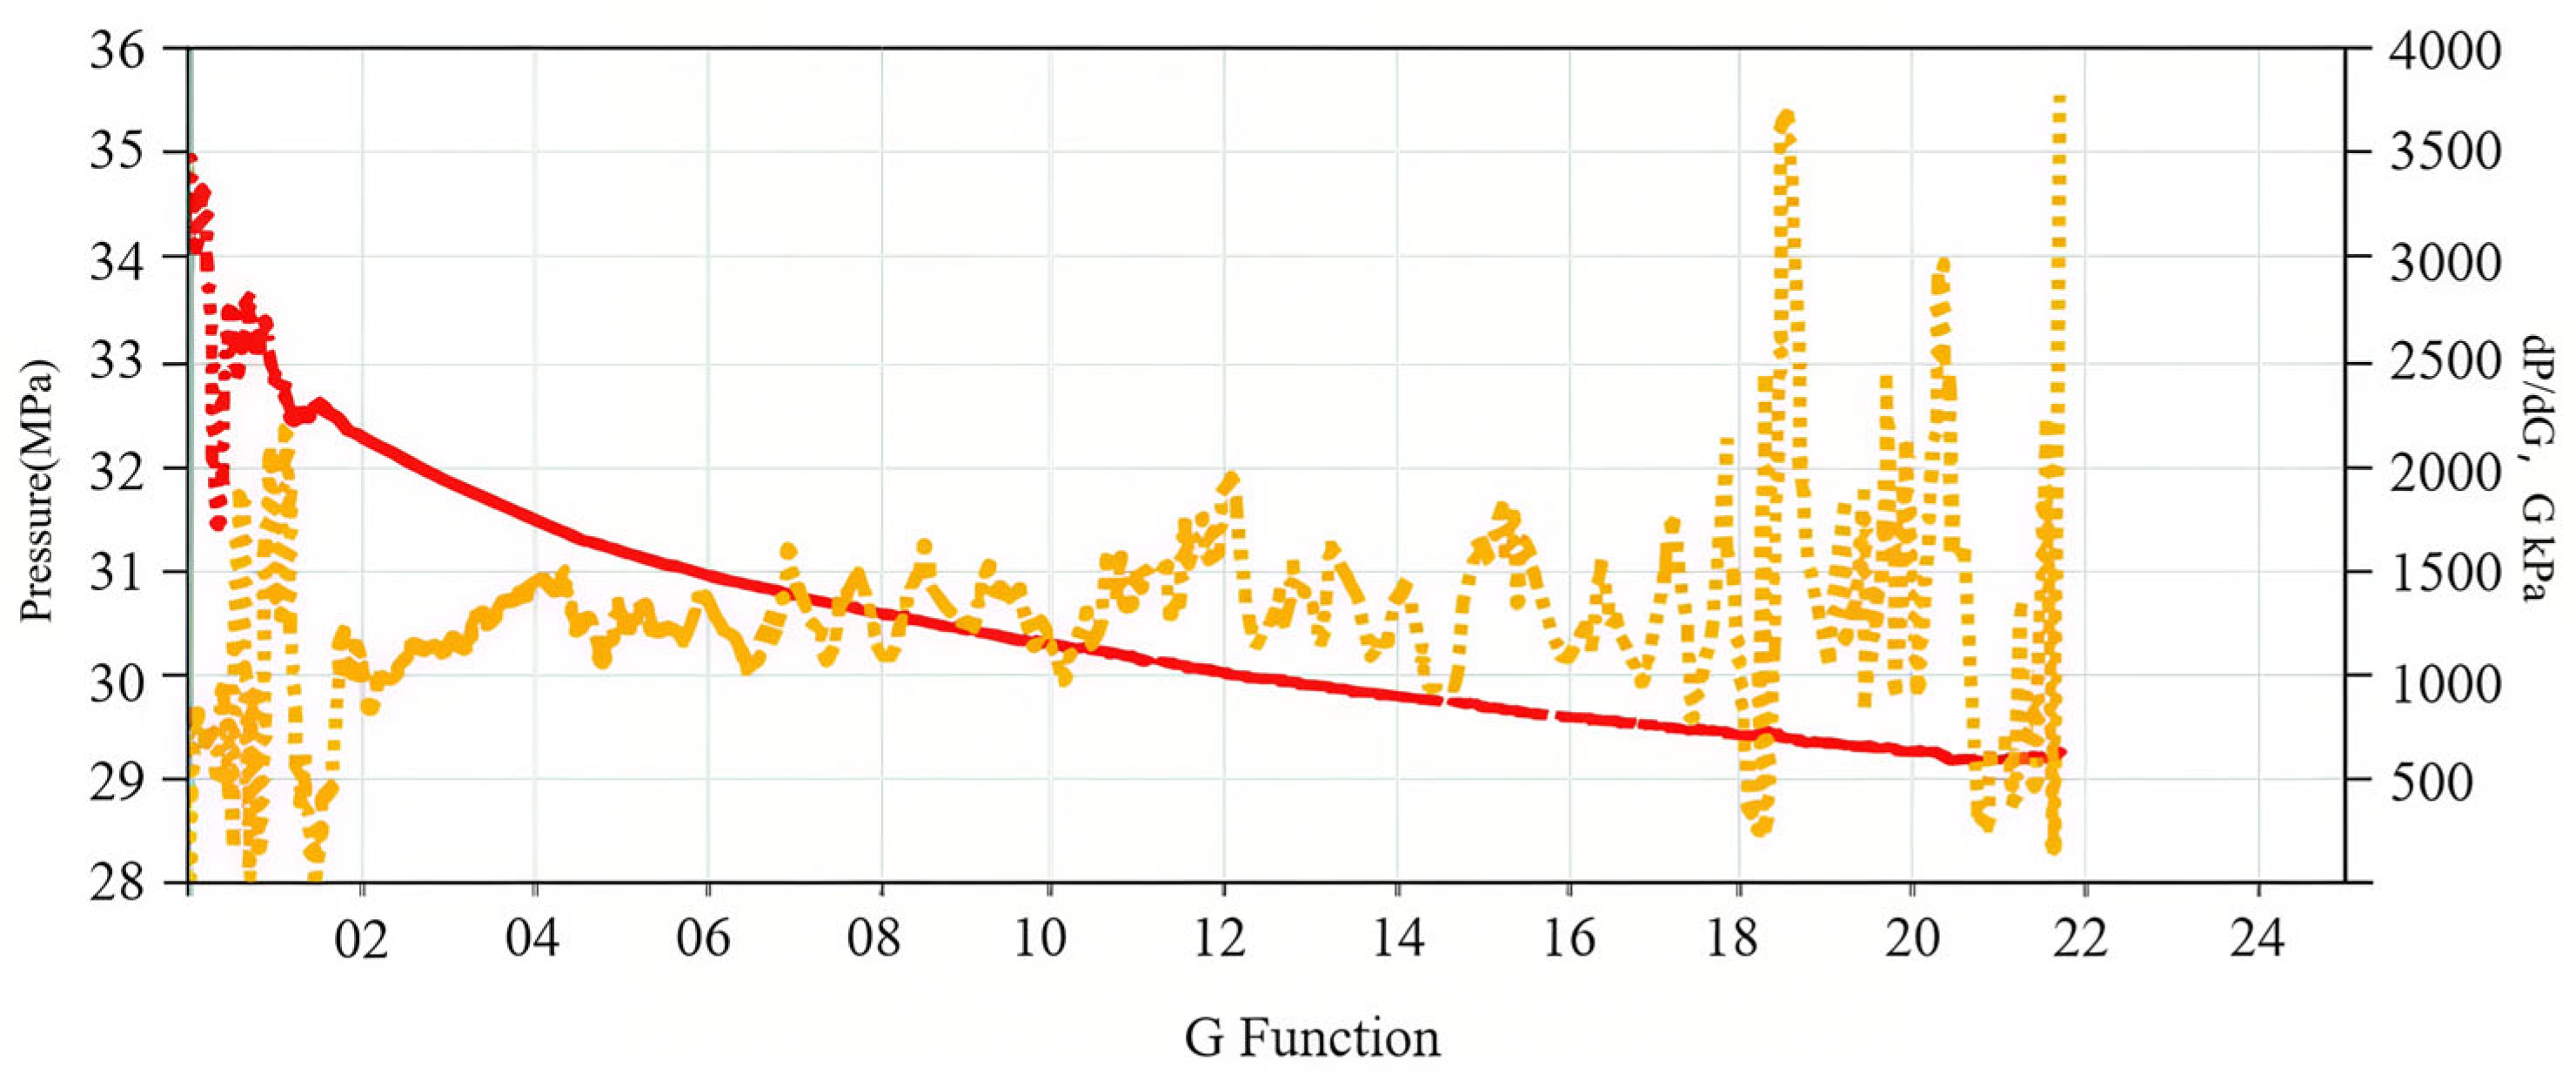
In the geological modeling of this well, the ant-tracking algorithm revealed significant fracture responses around the wellbore, with particularly strong indications in the G1 major fault zone. Given that the ant-tracking method is essentially a stochastic algorithm, a single line of evidence is insufficient to confirm the occurrence of hydraulic fracture–natural fracture communication during fracturing. Therefore, the interpretation was complemented by an analysis of the treatment curves (Figure 9).
The G-function, which evaluates the pressure decline during the post-fracturing shut-in stage, provides insight into fracture system behavior [33]. When hydraulic fractures intersect natural fracture networks, the fracturing fluid leak-off rate exhibits nonlinear acceleration, and the G-function typically displays discontinuous oscillations, such as multi-peak fluctuations or high-frequency sawtooth patterns [36,37]. As presented in Figure 9, G-function analysis during the shut-in phase of fracturing showed clear multi-peak oscillation. Combined with the fracture responses identified by ant-tracking analysis, these observations support the interpretation that the hydraulic fractures connected with natural fracture systems during stimulation. This result supports the interpretation that fracturing established effective communication between Well X01 and the fault-controlled migration pathway, thereby allowing gas from the pre-existing natural gas cap to channel into the well.

4.7. Analysis of Regional Production History

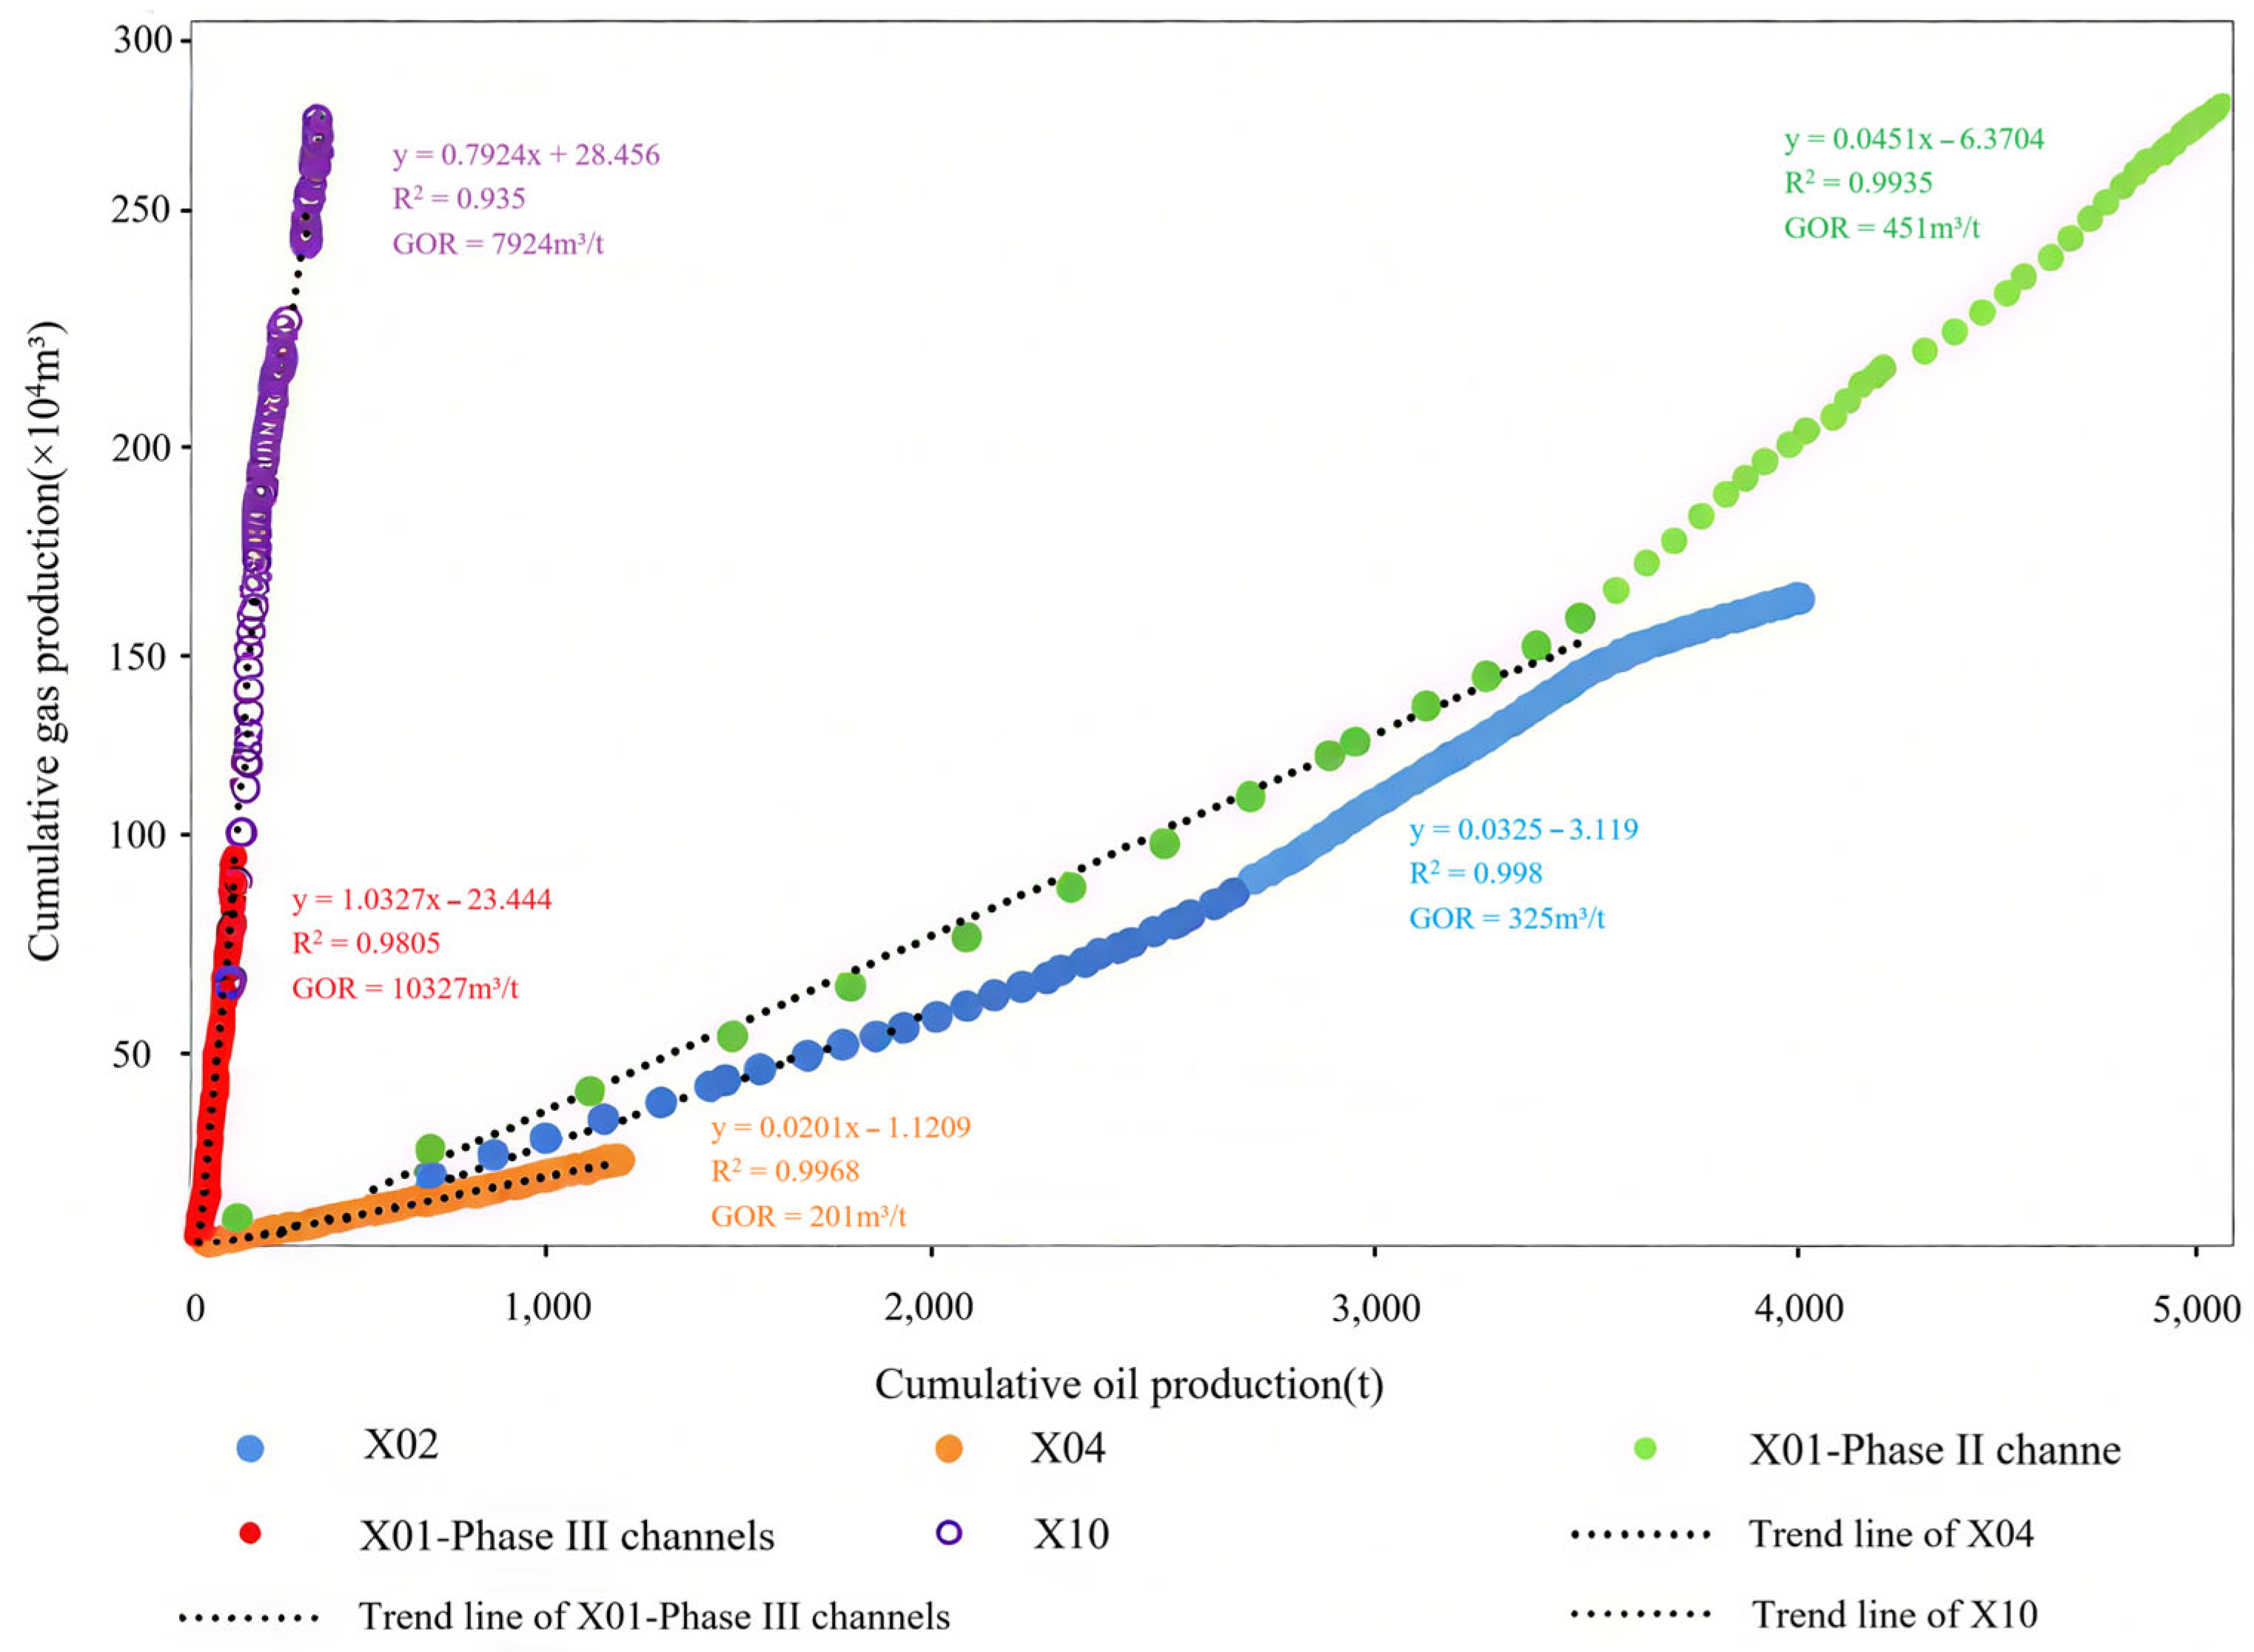
Figure 10 presents GOR statistics for selected wells in the study area (Figure 1). Well X01 intersects both Phase II and Phase III channels of the first member of the Shaximiao Formation, with the Phase II channel overlying the Phase III channel. Wells completed in the Phase II channel (e.g., X02, X04) show GOR values < 500 m3/t, whereas wells completed in the Phase III channel (X01, X10) exhibit GOR values exceeding 7000 m3/t. Well X10 has already been identified as a gas-cap reservoir at a local structural high. The similarly anomalous GOR values in both wells suggest that gas-cap accumulation is likely to be the main control on production in the Phase III channel.
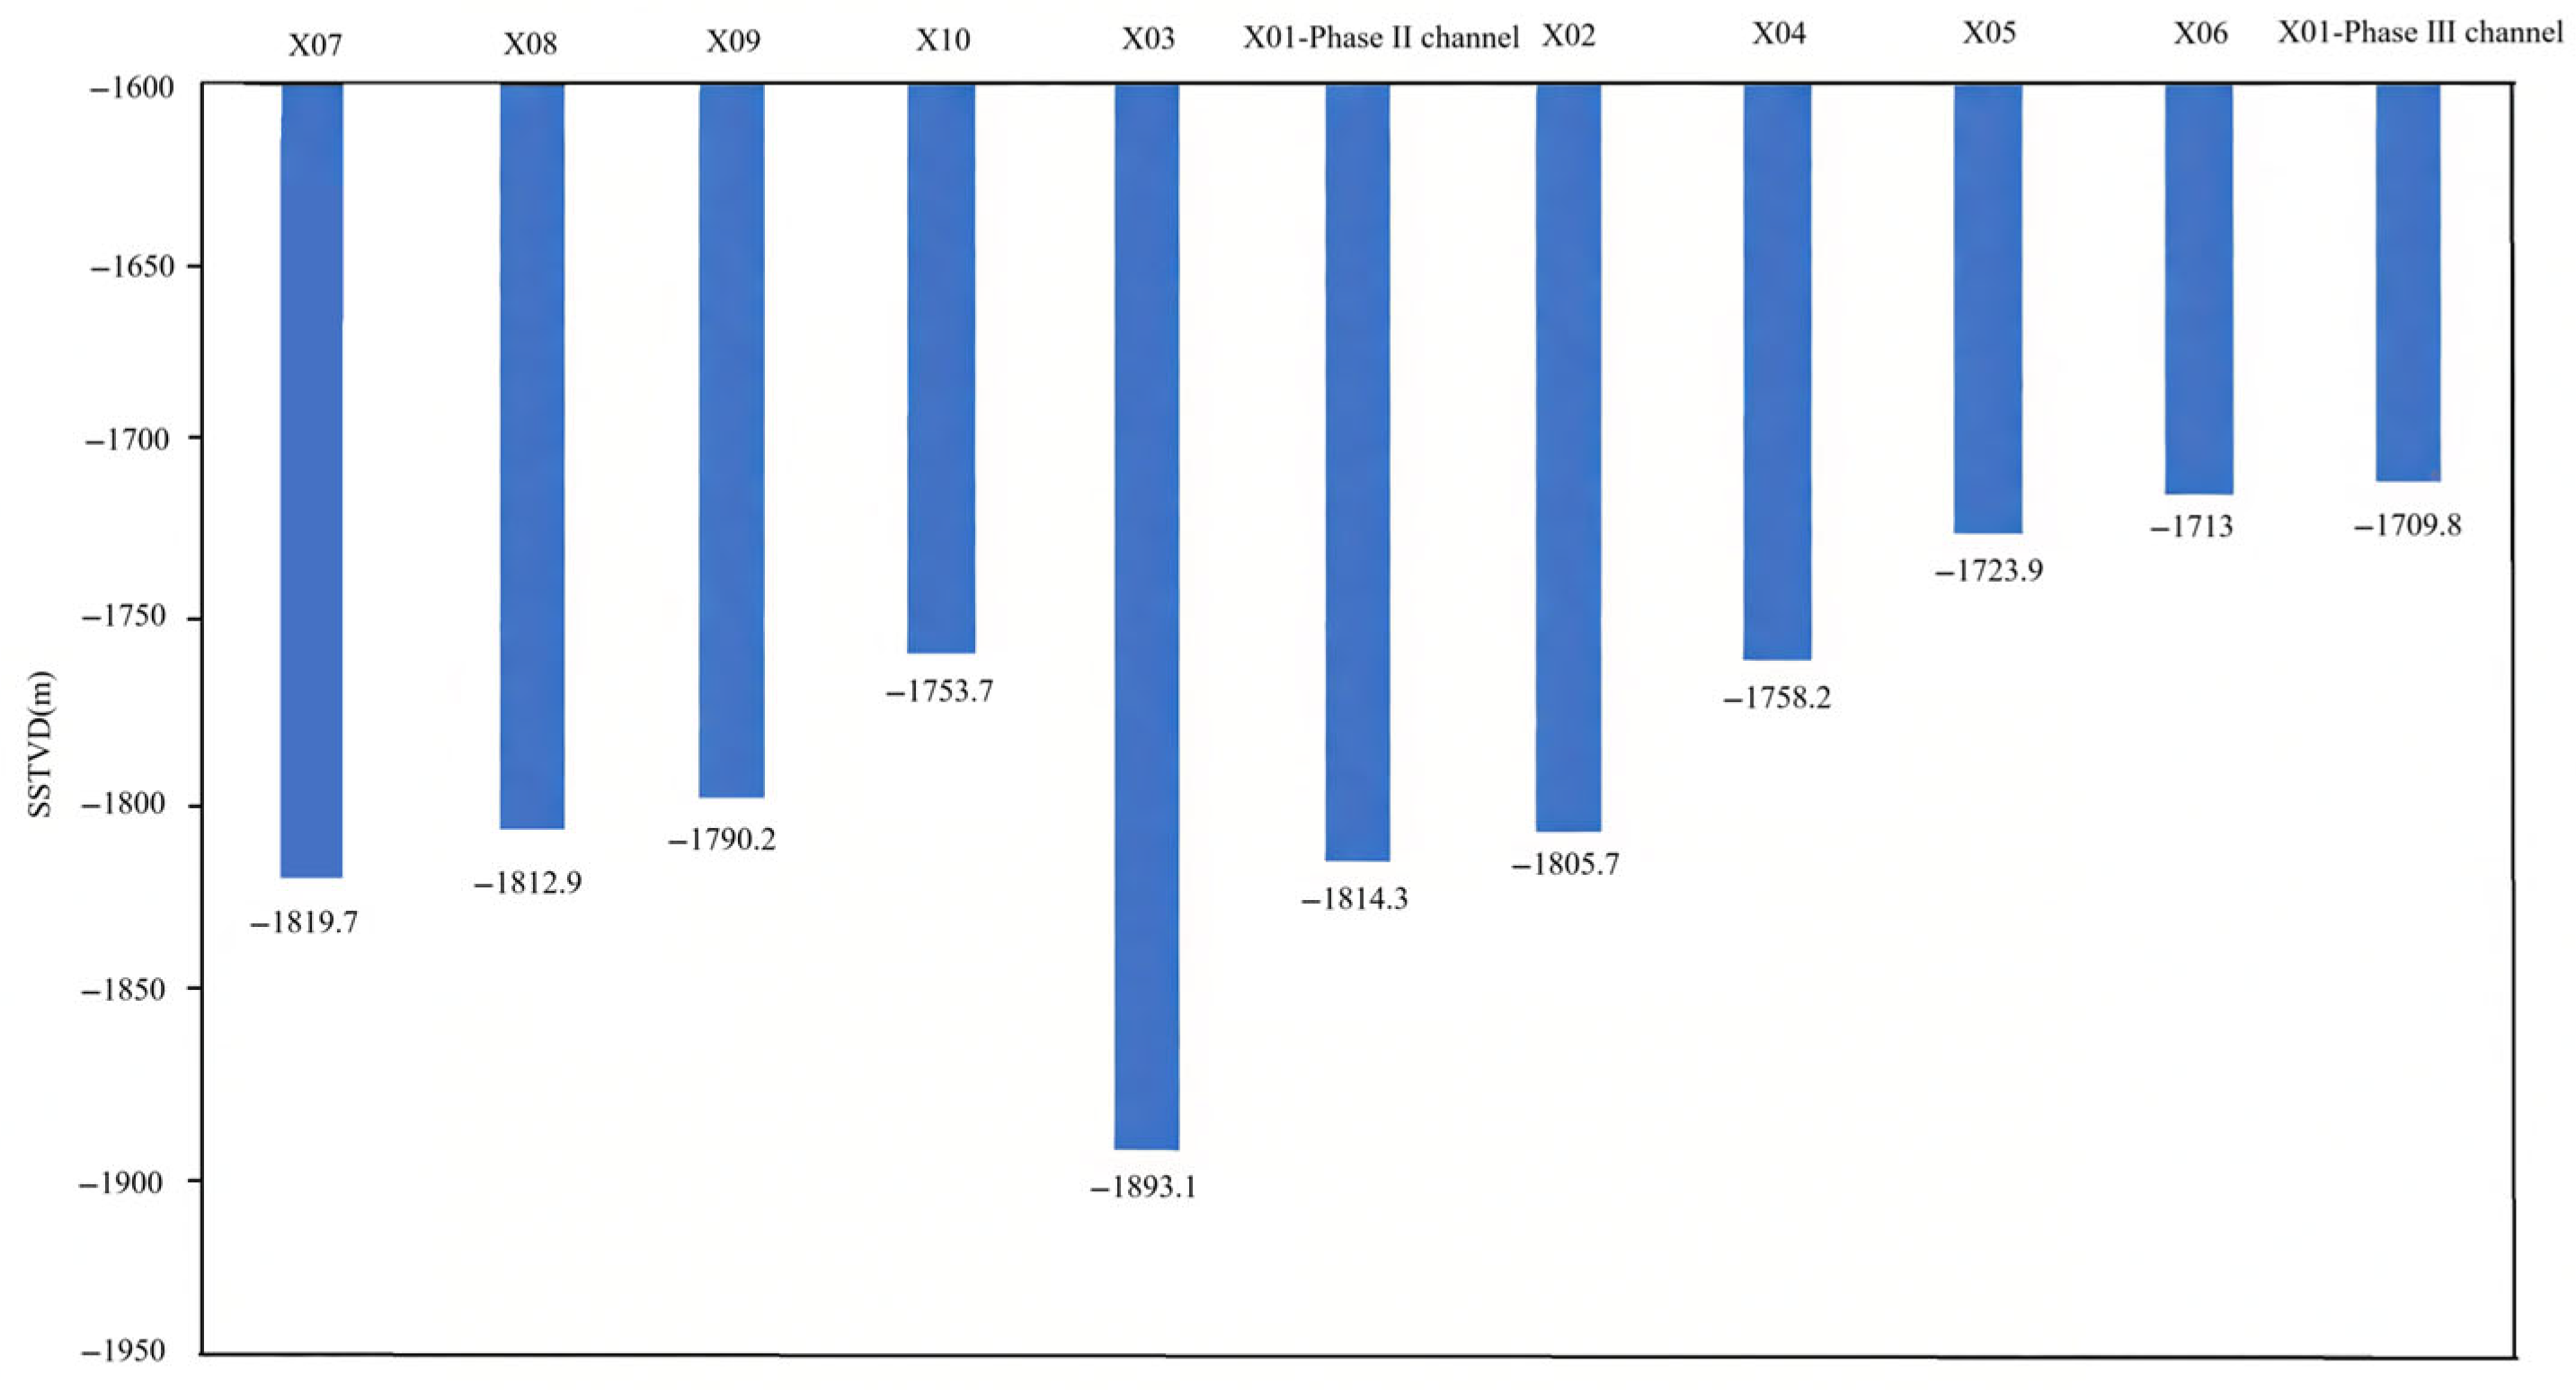
Figure 11 shows the SSTVD distribution of selected wells, aiding in identifying structural highs. Based on SSTVD data from 10 production intervals and the structural interpretation, Well X01 in the Phase III channel (−1709.82 m) and Well X10 (−1753.73 m) are located on two separate local structural highs. In Well X01, the Phase III channel is 104.5 m higher than its Phase II channel (−1814.32 m) and is also structurally higher than nearby wells completed in the same interval, such as X04 and X05. Likewise, Well X10 is structurally elevated relative to wells X07 and X08.
Both highs (SSTVD > 1710 m) coincide with the crests of interpreted anticlines, indicating that the Phase III channel developed local structural highs under paleouplift control. This structural framework, combined with the anomalously high GOR values, provides strong evidence for gas-cap accumulation as the key reservoir control mechanism.

4.8. Determination of Gas Cap Extent

To constrain the extent of the gas cap, a comprehensive analysis of production dynamics from Well X02 was conducted: the formation pressure is equal to the saturation pressure, and the solution gas-oil ratio (Rs) measured by PVT analysis is 130 m3/t, whereas the actual produced GOR ranges from 289 to 617 m3/t, which is 2.3 to 5 times the Rs. Based on these observation, the well is identified to be located within the oil–gas transition zone.
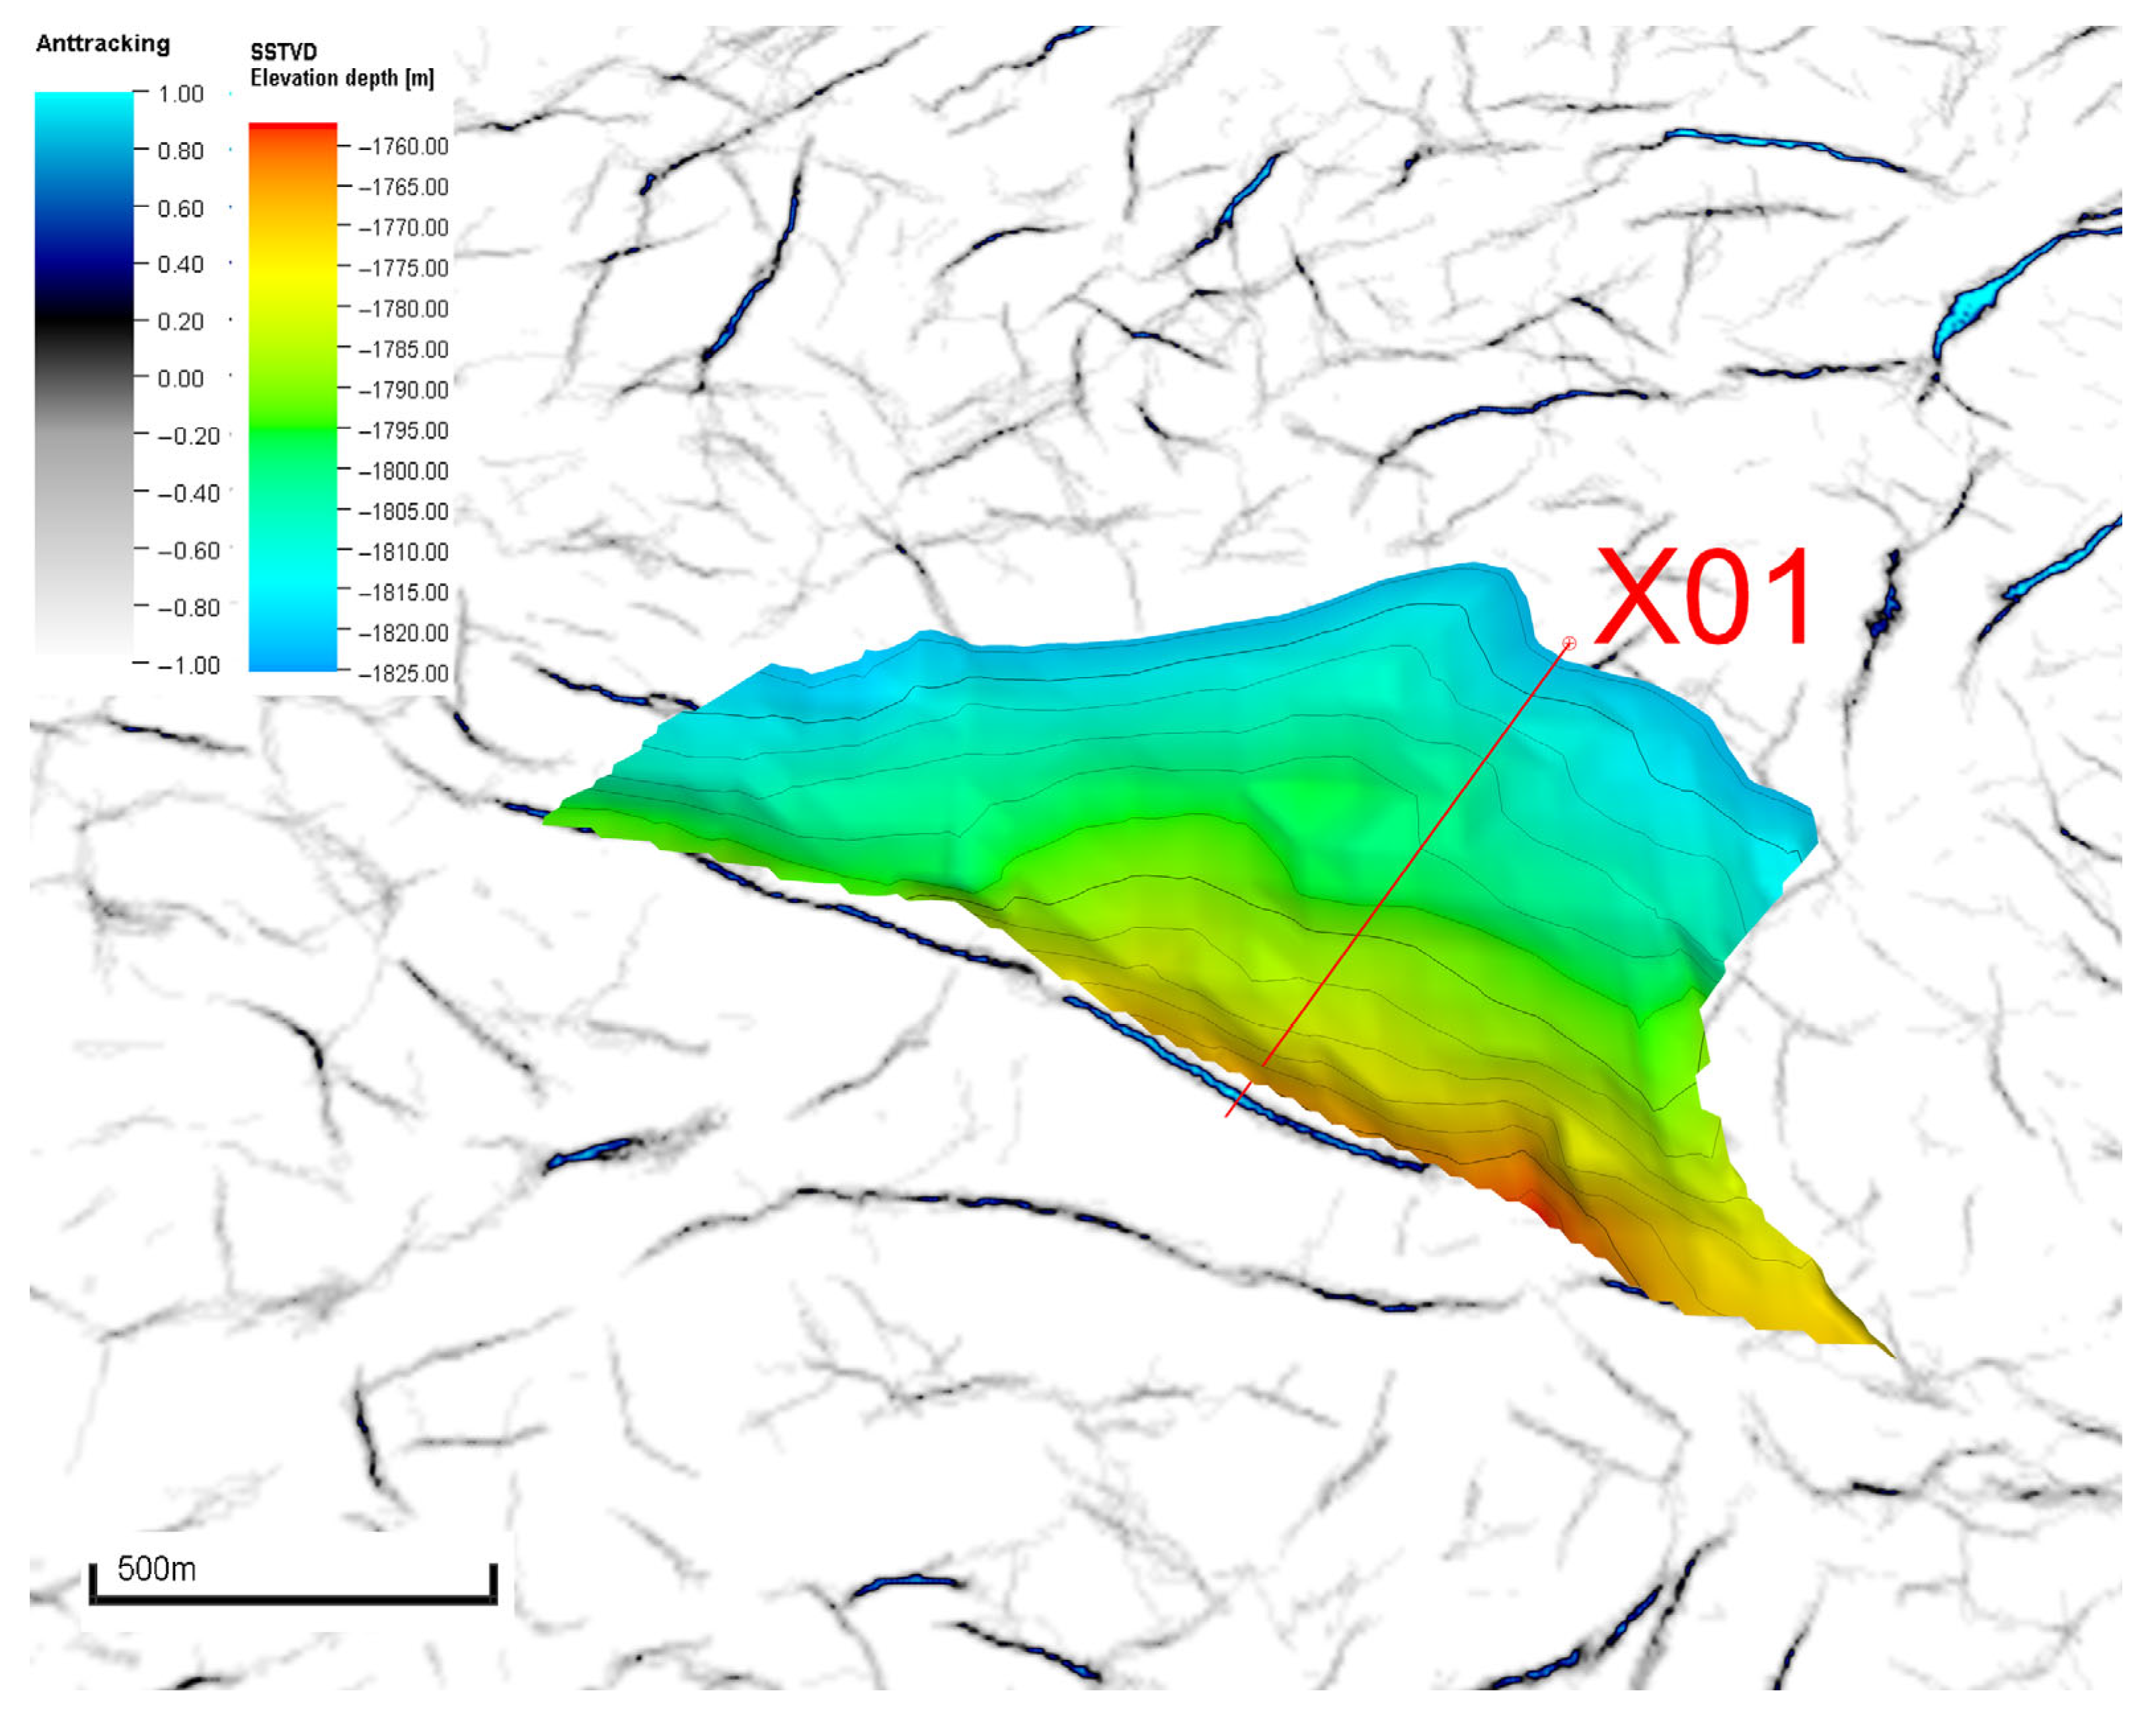
Pressure build-up analysis suggests that the gas-cap boundary is controlled by the major G1 fault. This was supplemented by the OGIP range calculated from material balance equations. By integrating the transition zone delineation at well X02, the structural gradient variations around well X01 (marked by abrupt changes from high to low values), and the identification of structural discontinuities, the gas cap distribution range was ultimately delineated (see Figure 12). This range is consistent with the results of pressure build-up analysis, material-balance calculations, and structural interpretation.
The final interpretation differs from the initial PVT-based classification, reflecting the limitation of laboratory fluid-property analysis when used alone in structurally complex geological settings. Production behavior, fluid-sample appearance, pressure-transient interpretation, fracture communication analysis, and structural relationships collectively support the interpretation that Well X01 is associated with a pre-existing natural gas cap. The abnormal production response is best explained by gas channeling after hydraulic fracturing established communication with the fault/fracture system.
A composite radius of 21.35 m obtained from PTA, together with the G-function response, suggests communication with faults or natural fractures during the fracturing process. This radius closely matches the distance from Well X01 to the major G1 fault, while structural analysis indicates that the well is located within a fault-controlled zone and on a local structural high intersected by faults. The interpretation of structural control is therefore not based on fault proximity alone, but is further supported by the transition-zone evidence from Well X02, the comparable production behavior of Well X10, and the fracture/fault communication revealed during stimulation. Collectively, these observations support the interpretation that Well X01 is a gas-cap oil reservoir controlled by local structure.

5. Conclusions

(1)
Based on PVT analysis alone, Well X01 would initially be classified as a condensate gas reservoir. However, this interpretation does not adequately explain the actual field behavior observed during production.
(2)
Multi-source evidence, including fluid-sample appearance, regional production comparison, pressure build-up interpretation, G-function response, and structural analysis, indicates that Well X01 is better interpreted as a gas-cap oil reservoir.
(3)
The gas cap is closely related to structural control. The composite radius obtained from PTA is consistent with the distance from Well X01 to the G1 major fault, and the well is located on a local structural high favorable for gas-cap development.
(4)
This study combines laboratory fluid data, geological structural interpretation, and adjacent-well production behavior within the same diagnostic workflow. The proposed geoscience-engineering framework therefore provides a practical approach for resolving fluid-type misclassification in structurally complex reservoirs.

Author Contributions

Conceptualization, Y.Y.; Methodology, Q.X. (Qi Xu), C.Z. and C.X.; Software, Q.X. (Qi Xu), Y.P., Y.Y., C.Z. and X.Z.; Validation, S.Z. and C.M.; Formal analysis, K.Y. and Y.P.; Investigation, Y.P. and Y.Y.; Resources, K.Y., H.H., Q.T., C.Q., Q.X. (Qiang Xie) and W.T.; Data curation, K.Y., M.T., B.Z., H.H., Q.T., X.Z., C.Q. and S.Z.; Writing—original draft, K.Y.; Writing—review & editing, Q.X. (Qi Xu), M.T. and C.M.; Visualization, K.Y., Q.X. (Qi Xu), Y.Y. and W.T.; Supervision, B.Z., Q.X. (Qiang Xie) and C.M.; Project administration, C.Z. and C.X.; Funding acquisition, H.H. and C.X. All authors have read and agreed to the published version of the manuscript.

Funding

This research was funded by Research and Experimental Study on Optimization Technologies for Continental Shale Oil Development (No. 2023ZZ15YJ03), Technical Strategies for Jurassic Oil Development in the Sichuan Basin (No. 2024D1ZD-02-02), Science Foundation of State Key Laboratory of Petroleum Resources and Engineering (No. PRE/indep-2512), and Science Foundation of China University of Petroleum, Beijing (No. 2462025YJRC013).

Data Availability Statement

The raw data supporting the conclusions of this article will be made available by the authors on request.

Conflicts of Interest

Authors Kai Yu, Benjian Zhang, Haitao Hong, Qingsong Tang, Xun Zhu, Chunyu Qin, Shaomin Zhang, Qiang Xie were employed by the company Petro China Southwest Oil & Gasfield Company. The remaining authors declare that the research was conducted in the absence of any commercial or financial relationships that could be construed as a potential conflict of interest.

References

  1. Jia, A.; Meng, D.; He, D.; Wang, G.; Guo, J.; Yan, H.; Guo, Z. Technical measures of deliverability enhancement for mature gas fields: A case study of Carboniferous reservoirs in Wubaiti Gas Field, eastern Sichuan Basin, SW China. Pet. Explor. Dev. 2017, 44, 615–624. [Google Scholar] [CrossRef]
  2. Wang, H.; Liao, X.; Lu, N.; Cai, Z.; Liao, C.; Dou, X. A study on development effect of horizontal well with SRV in unconventional tight oil reservoir. J. Energy Inst. 2014, 87, 114–120. [Google Scholar] [CrossRef]
  3. Pratikto, F.; Indratno, S.; Suryadi, K.; Santoso, D. Valuation of an unexplored oilfield under uncertain oil price and reservoir condition: A stochastic dynamic programming approach with simulation-based reward function. Geoenergy Sci. Eng. 2023, 223, 211493. [Google Scholar] [CrossRef]
  4. Chen, S.; Mei, S.; Huang, C.; Chen, W.; Zhang, L.; Shang, H.; Xie, P. Main factors controlling stable production from gas-condensate reservoirs in Block 2 of the Shunbei Oilfield, Tarim Basin. Front. Earth Sci. 2025, 13, 1559057. [Google Scholar] [CrossRef]
  5. Zhao, L.; Zhu, J.; Qin, X.; Gong, R.; Cai, Z.; Zhang, F.; Han, D.H.; Geng, J. Joint geochemistry-rock physics modeling: Quantifying the effects of thermal maturity on the elastic and anisotropic properties of organic shale. Earth-Sci. Rev. 2023, 247, 104627. [Google Scholar] [CrossRef]
  6. Ali, A.A.; Khafeef, K.M. Thermodynamic behavior description of a reservoir fluid by using cubic equations of state. Pet. Chem. 2024, 64, 858–865. [Google Scholar] [CrossRef]
  7. McCain, W.D., Jr. Heavy components control reservoir fluid behavior. J. Pet. Technol. 1994, 46, 746–750. [Google Scholar] [CrossRef]
  8. Al-Marhoun, M.A. PVT correlations for Middle East crude oils. J. Pet. Technol. 1988, 40, 650–666. [Google Scholar] [CrossRef]
  9. Tsiklakov, A.; Weinheber, P.; Wichers, W.; Zimin, S.; Driller, A.; Oshmarin, R. The characterization of heavy oil reservoirs using downhole fluid analysis to determine fluid type and reservoir connectivity. In Proceedings of the SPE Heavy Oil Conference and Exhibition, Kuwait City, Kuwait, 12–14 December 2011. [Google Scholar]
  10. Amjad, K.; Ahsan, S.A.; Sultan, M.A.; Hegazy, G.M. Reservoir fluid identification—A case study of a near critical fluid from low permeability exploratory reservoir. In Proceedings of the Abu Dhabi International Petroleum Exhibition & Conference, Abu Dhabi, UAE, 7–10 November 2016. [Google Scholar]
  11. Kharazi Esfahani, P.; Peiro Ahmady Langeroudy, K.; Khorsand Movaghar, M.R. Enhanced machine learning-ensemble method for estimation of oil formation volume factor at reservoir conditions. Sci. Rep. 2023, 13, 15199. [Google Scholar] [CrossRef]
  12. Wu, B.; Altobelli, S.A.; Fukushima, E. Fluid typing: Efficient NMR well logging with interleaved CPMG sequence at different frequencies. Appl. Magn. Reson. 2017, 48, 981–987. [Google Scholar] [CrossRef]
  13. Liu, C.; Ma, L.; Liu, X.; Li, Y.; Zhang, B.; Ren, D.; Liu, D.; Tang, X. Study and choice of water saturation test method for tight sandstone gas reservoirs. Front. Phys. 2022, 10, 833940. [Google Scholar] [CrossRef]
  14. Jiang, C.; Wang, G.; Song, L.; Huang, L.; Wang, S.; Zhang, Y.; Huang, Y.; Dai, Q.; Fan, X. Identification of fluid types and their implication for petroleum exploration in the shale oil reservoir: A case study of the Fengcheng Formation in the Mahu Sag, Junggar Basin, northwest China. J. Pet. Sci. Eng. 2023, 231, 109386. [Google Scholar] [CrossRef]
  15. Chen, W.; Wang, S.X.; Chuai, X.Y.; Liu, Y. Applications of fluid substitution effect analysis on seismic interpretation. J. Cent. South Univ. 2016, 23, 729–739. [Google Scholar] [CrossRef]
  16. Bai, Z.; Tan, M.; Li, B.; Shi, Y.; Zhang, H.; Li, G. Fluid identification method of nuclear magnetic resonance and array acoustic logging for complex oil and water layers in tight sandstone reservoir. Processes 2023, 11, 3051. [Google Scholar] [CrossRef]
  17. Yang, T.; Uleberg, K.; Cely, A.; Yerkinkyzy, G.; Donnadieu, S.; Kristiansen, V.T. Unlock large potentials of standard mud gas for real-time fluid typing. In Proceedings of the SPWLA 63rd Annual Logging Symposium, Stavanger, Norway, 10–15 June 2022. [Google Scholar]
  18. Bae, H.J.; Jeon, S.W.; Yi, S.J. Case study for effective stimulated reservoir volume identification in unconventional reservoirs. J. Korean Soc. Miner. Energy Resour. Eng. 2018, 55, 127–146. [Google Scholar] [CrossRef]
  19. Diatto, P.; Cerioli Regondi, A.; Doering, S.; Italiano, D.; Maffeis, I.; Marchesini, M.; Martin, M. Regional reservoir fluid analysis and interpretation based on the integration of petroleum systems, organic geochemistry and PVT. In Proceedings of the SPE Reservoir Characterisation and Simulation Conference and Exhibition, Abu Dhabi, United Arab Emirates, 17–19 September 2019. [Google Scholar]
  20. Hui, G.; Chen, Z.; Wang, H.; Wang, M.; Gu, F. An integrated geology-engineering approach to Duvernay shale gas development: From geological modeling to reservoir simulation. In Proceedings of the SPE Canadian Energy Technology Conference and Exhibition, Calgary, AB, Canada, 15–16 March 2023. [Google Scholar]
  21. Ghirfal, T.A.; Alelwani, R.R. Reservoir characterization and dynamic modeling in Dahab Field, Sirte Basin: An integrated approach. In Proceedings of the Mediterranean Offshore Conference, Alexandria, Egypt, 20–22 October 2024. [Google Scholar]
  22. Chen, S.; Yang, Y.; Qiu, L.; Wang, X.; Habilaxim, E. Source of quartz cement and its impact on reservoir quality in Jurassic Shaximiao Formation in central Sichuan Basin, China. Mar. Pet. Geol. 2024, 159, 106543. [Google Scholar] [CrossRef]
  23. Guo, G.; Tang, Q.; Jiang, Y.; Zhu, X.; Fang, R.; Zhou, Y.; Hong, H.; Zhang, L.; Zhang, X. Breakthrough in interlayer-type shale oil exploration and its geological implications for oil and gas: A case study of Well G119H in the central Sichuan Basin. Nat. Gas Ind. 2024, 44, 53–63. [Google Scholar]
  24. Jing, W.L.; Zhang, L.; Li, A.F.; Zhong, J.J.; Sun, H.; Yang, Y.F.; Cheng, Y.L.; Yao, J. Phase behavior of gas condensate in porous media using real-time computed tomography scanning. Pet. Sci. 2024, 21, 1032–1047. [Google Scholar] [CrossRef]
  25. Liu, Y.; Qiu, N.; Hu, W.; Li, H.; Shen, F.; Yao, Q. Temperature and pressure characteristics of Ordovician gas condensate reservoirs in the Tazhong area, Tarim Basin, northwestern China. AAPG Bull. 2019, 103, 1351–1381. [Google Scholar] [CrossRef]
  26. Yi, X.; Lee, K.J.; Chen, Y.; Choi, J. Analyzing the impact of the interaction between hydraulic fracturing fluid and kerogen on its wettability alteration. Appl. Geochem. 2023, 158, 105799. [Google Scholar] [CrossRef]
  27. Eze, S.O.; Onwe-Moses, D.F.; Okoro, A.U.; Aghamelu, O.P. Organic geochemical characterization of the Cenomanian–Turonian Eze-Aku (southern Benue Trough) and Campanian Nkporo shales (Anambra Basin), southeastern Nigeria. Arab. J. Geosci. 2020, 13, 267–274. [Google Scholar] [CrossRef]
  28. Zhao, Q.; Guo, J.; Zhang, Z. A method for judging the effectiveness of complex tight gas reservoirs based on geophysical logging data using the L Block of the Ordos Basin as a case study. Processes 2023, 11, 2195. [Google Scholar] [CrossRef]
  29. GB/T 26981-2020; Analysis method for reservoir fluid physical properties. State Administration for Market Regulation and Standardization Administration of the People’s Republic of China: Beijing, China, 2020.
  30. Yu, H. Development strategy for offshore gas-cap reservoirs with high CO2 content and high condensate-oil content. J. Shandong Univ. Sci. Technol. (Nat. Sci.) 2016, 35, 16–21. [Google Scholar]
  31. Dorhjie, D.B.; Aminev, T.; Mukhina, E.; Gimazov, A.; Babin, V.; Khamidullin, D.; Cheremisin, A. The underlying mechanisms that influence the flow of gas-condensates in porous medium: A review. Gas Sci. Eng. 2024, 122, 205204. [Google Scholar] [CrossRef]
  32. Inyakin, V.V.; Mulyavin, S.F.; Usachev, I.A. Rationale for technological gas-condensate well operating conditions in low-permeability reservoirs. Oil Gas Stud. 2019, 2, 68–72. [Google Scholar] [CrossRef]
  33. Li, Q.; Li, X.; Shan, J.; Dai, C.; Deng, L.; Yin, Y. Analysis of the causes of abnormal gas-oil ratio during the production of condensate gas reservoirs. Nat. Gas Ind. 2011, 31, 63–65, 128. [Google Scholar]
  34. Shams, B.; Yao, J.; Zhang, K.; Zhang, L. Sensitivity analysis and economic optimization studies of inverted five-spot gas cycling in gas condensate reservoir. Open Phys. 2017, 15, 525–535. [Google Scholar] [CrossRef]
  35. Li, S.; Liu, D.; Du, C.; Ma, P.; Li, M.; Gao, H. Graphic template establishment and productivity evaluation model of post-fracturing based on the fluctuation pattern of G-function curve. Processes 2023, 11, 1657. [Google Scholar] [CrossRef]
  36. Zhao, W.; Zhang, S.; Sun, Z.; Zhao, Y.; Yang, Y. Evaluation of post-fracturing fracture complexity based on G-function curve analysis. Sci. Technol. Eng. 2016, 16, 29–33, 45. [Google Scholar]
  37. Wei, C.; Zhang, B.; Li, S.; Fan, Z.; Li, C. Interaction between hydraulic fracture and pre-existing fracture under pulse hydraulic fracturing. SPE Prod. Oper. 2021, 36, 553–571. [Google Scholar] [CrossRef]
Figure 1. The thick red line indicates the G1 Major Fault, and the gray lines denote structural contours. Well X10 is located near the structural high associated with the gas cap, whereas Well X01 is situated on a local structural high in the northern compartment bounded by the G1 major fault.
Energies 19 01761 g001
Figure 2. Integrated workflow for fluid-type discrimination between a condensate gas reservoir and a gas-cap oil reservoir, which consists of PVT analysis, production performance, fluid sampling, pressure-transient interpretation, and structural analysis.
Energies 19 01761 g002
Figure 3. The phase diagram from the PVT test results of Well X01 indicates that the reservoir conditions lie between the critical temperature and the cricondentherm, within the two-phase region, characteristic of the coexistence of oil and gas phases.
Energies 19 01761 g003
Figure 4. The producing GOR profile of Well X01. The segments without GOR values represent shut-in periods. The first shut-in was conducted for a formation pressure build-up test, while the subsequent three shut-ins were due to field management factors. The GOR increased abruptly from 1285 m3/t to 13,000 m3/t within a short period, exhibiting a sharp and discontinuous surge. This behavior is inconsistent with the typical rising trend of GOR in a gas condensate reservoir.
Energies 19 01761 g004
Figure 5. Visual comparison of different types of crude oils: Crude oil sample from Well X01 (a), and gas condensate sample from an adjacent block well (b). The oil sample exhibited a brown color, which significantly differs from typical light-colored gas condensate, and was therefore identified as a non-condensate system.
Energies 19 01761 g005
Figure 6. Rose diagram of fluid composition between X01 well and adjacent wells. The C7+ fraction of Well X01 is only 3.72%, which is lower than the typical compositional standard for gas condensate. In contrast, the C7+ fractions in adjacent Wells X02 and X11 range from 22.72% to 29.10%, significantly higher than the standard for gas condensate and consistent with the characteristics of crude oil.
Energies 19 01761 g006
Figure 7. Production stage characteristics of condensate gas reservoirs, where (a) represents reservoir pressure, (b) gas relative permeability, and (c) condensate oil relative permeability. When gas condensate production enters the second stage, the gas-oil ratio (GOR) gradually increases.
Energies 19 01761 g007
Figure 8. Pressure build-up curve and well-test interpretation for Well X01. The late-time pressure-derivative curve shows a downward trend, consistent with the response expected from a high-mobility outer zone associated with a gas cap.
Energies 19 01761 g008
Figure 9. G-Function Analysis of Pressure Drawdown in Well X01. The red line represents the pressure recording during the pressure falloff period, while the yellow line denotes the pressure derivative curve. The derivative response exhibits a multi-peak fluctuation pattern consistent with interaction between hydraulic fractures and the natural fracture system during stimulation.
Energies 19 01761 g009
Figure 10. Statistical results indicate that the GOR in Well X10 and the X01-Third Phase Channel within the study area range from 8000 to 10,000 m3/t, significantly higher than those of other wells, which range from 200 to 450 m3/t. This distinct production behavior suggests that the reservoir environments of these two wells are fundamentally different from those in other areas.
Energies 19 01761 g010
Figure 11. SSTVD elevations of production intervals in each well. The first four columns in the figure indicate the elevations of the producing zones in Well X10 and its adjacent wells, while the latter seven columns represent the elevations of the producing zones in the X01 Third-Phase Channel and its nearby wells. Both X01 and X10 occupy relatively elevated structural positions.
Energies 19 01761 g011
Figure 12. Interpreted gas-cap extent around Well X01 based on ant-tracking attributes and structural interpretation. The lower panel shows the normalized ant-tracking result, in which blue stripes indicate a higher probability of fault occurrence and light-gray areas indicate weaker fracture development. Well X01 is located approximately 23 m from the G1 major fault.
Energies 19 01761 g012
Table 1. Comparison between ideal conditions for condensate gas generation and actual parameters of Well X01.
Key ParameterIdeal Conditions
for Condensate Gas Generation
Actual Parameters of Well X01Matching Analysis
Structural backgroundStable structural environment (favorable for hydrocarbon preservation)Local anticline structure (favorable for hydrocarbon accumulation)Match
Depth>3000 m (high-pressure environment)~2300 mInsufficient depth
Formation temperature90–120 °C61 °CInsufficient temperature
Kerogen typeType I/II sapropelic kerogenDominantly Type II sapropelic kerogenMatch
Thermal maturity>1.2% Ro (oil cracking stage)0.75–1.26% Ro (average 1.04%)Partially unmet (average < 1.2%)
Formation pressure gradient1.0–1.2 MPa/100 m0.93 MPa/100 mInsufficient pressure
Table 2. Diagnostic criteria for reservoir fluid classification based on production and PVT data.
Black OilVolatile OilCondensate Gas/Retrograde GasWet GasDry Gas
Initial producing GOR, m3/m3178178–1424534–17,800890017,800
Initial stock-tank liquid density, g/cm3>0.80.73–0.80.7022–0.77960.702–0.7389NO liquid
Color of stock tank liquidDarkColoredLightly coloredWater whiteNO liquid
Phase change in reservoirBubble pointBubble pointDew pointNO phase changeNO phase change
Heptane plus>2020–12.5<12.5<4<0.7
Disclaimer/Publisher’s Note: The statements, opinions and data contained in all publications are solely those of the individual author(s) and contributor(s) and not of MDPI and/or the editor(s). MDPI and/or the editor(s) disclaim responsibility for any injury to people or property resulting from any ideas, methods, instructions or products referred to in the content.