Article

Energy Valorisation of Fucus serratus via the Integration of Hydrothermal Carbonisation and Anaerobic Digestion: Influence of Seawater as a Reactant Medium


by
Aaron E. Brown
1,2,
Jessica M. M. Adams
3,
Miller Alonso Camargo-Valero
2,4 and
Andrew B. Ross
1,*
1
School of Chemical and Process Engineering, University of Leeds, Leeds LS2 9JT, UK
2
BioResource Systems Research Group, School of Civil Engineering, University of Leeds, Leeds LS2 9JT, UK
3
Institute of Biological, Environmental and Rural Sciences (IBERS), Aberystwyth University, Gogerddan, Aberystwyth SY23 3EB, UK
4
Environmental Engineering Study Programme, Department of Civil Engineering and Planning, Faculty of Engineering, Universitas Negeri Malang, Malang 65145, Indonesia
*
Author to whom correspondence should be addressed.
Energies 2026, 19(7), 1699; https://doi.org/10.3390/en19071699
Submission received: 5 February 2026 / Revised: 25 February 2026 / Accepted: 19 March 2026 / Published: 30 March 2026

Abstract

Integrating hydrothermal carbonization (HTC) and anaerobic digestion (AD) has the potential to improve energy conversion efficiency (ECE) of biomass with low energy density and high moisture content. This study aims to assess the influence of alkali metals and chlorides by comparing seawater and distilled water as a HTC reactant medium, treating Fucus serratus across a range of processing temperatures (150 °C, 200 °C and 250 °C). All HTC-AD integration options improved ECE of F. serratus compared to AD alone. ECE of F. serratus was similar across temperatures of 150 °C (84–88%) and 200 °C (75–77%) regardless of seawater or distilled water usage. However, HTC processing at 250 °C yielded a greater ECE from F. serratus using distilled water (78%), compared to seawater (57%), due to a higher hydrochar yield and biomethane generation from the process water. Higher HTC processing temperatures significantly reduced slagging and fouling propensity of hydrochars by selectively removing problematic alkali metals. This creates a compromise between process energetics and favourability of hydrochar properties in large-scale conversion systems. Overall, HTC of F. serratus in seawater at 250 °C produces hydrochar suitable for combustion, process water that generates biomethane during AD (168.4 mL CH4/g COD) and a net energy-positive process (energy return on energy investment EROI = 1.53).

1. Introduction

Hydrothermal carbonisation (HTC) is a thermochemical process that converts biomass using hot compressed water (180–280 °C) under autogenous pressure, which shifts the water into a subcritical state [1,2,3]. Subcritical water acts as a reaction medium to facilitate a number of complex and simultaneous reactions, effectively simulating the natural process of coal production [4,5]. Conversion of biomass through HTC results in the production of an energy-densified solid, named hydrochar; an aqueous fraction, named process water; and a small fraction of gas, mainly comprising CO2 [5]. Typically, hydrochar represents the major product of interest from the HTC process. Numerous applications of hydrochars exist, including: as a solid combustion fuel, soil amendment, energy storage, carbon sequestration, capacitors, low-cost sorbents, and as an additive to anaerobic digestion (AD) [1,6,7,8]. The most widely studied application of hydrochars is as a solid combustion fuel, with hydrochars generally displaying increased higher heating values (HHVs) and a reduced propensity for slagging, fouling and corrosion issues, compared to the parent feedstock.
The utilisation of macroalgae, or seaweeds, to generate third-generation biofuels can mitigate many of the disadvantages associated with using first- or even second-generation biomass feedstocks [9]. Macroalgae are considered low-input biomass, as inputs from arable land, freshwater or fertilisers are not required for growth [10]. Furthermore, seaweeds can grow up to 2–20 times faster than terrestrial biomass [11], due to their increased photosynthetic efficiency. Despite these advantages, seaweeds are generally problematic during thermal conversion (combustion, pyrolysis, gasification), as a result of high moisture contents and unfavourable ash chemistry [12]. One of the major advantages of HTC is its inherent capability to directly convert biomass with a high (>30%) moisture content. This capability negates the requirement for energy-intensive drying processes required for other thermal conversion processes, such as pyrolysis [13,14]. Accordingly, over recent years there has been increasing interest in the use of HTC to convert macroalgae into suitable energy vectors [12,15,16,17,18,19,20,21].
HTC has been explored for the conversion of brown, red and green seaweeds, with the majority of work focusing on brown macroalgae [12,17,18]. Most studies have focused on evaluating seaweed-derived hydrochars for use as solid combustion fuels [12,17,18,20,22,23], although some studies have investigated the use of hydrochars as low-cost sorbents [6,24,25]. The HHVs of untreated seaweeds are typically low (10.8–16.1 MJ/kg), which can be typically improved to 18.1–27.5 MJ/kg using HTC [12,17,20]. HTC processing temperature is typically the most influential parameter effecting hydrochar properties [26]. Generally, an increased HTC processing severity (increased temperature and retention time) results in a higher HHV of the hydrochar [20,23,27,28]. Energy densification occurs due to a simultaneous increase in carbon content and reduction in oxygen content—a result of dehydration and decarboxylation reactions [23,29]. Furthermore, HTC can selectively remove problematic alkali metals from seaweed, thereby reducing the potential for slagging and fouling caused by the combustion of seaweed-derived hydrochars [12]. Generally, higher-severity HTC conditions result in an increased removal efficiency of alkali metals, with process conditions of 250 °C for 1 hr resulting in >98% removal of Na and K, compared to the original seaweed [12]. However, the higher fuel quality produced under more severe HTC conditions is compromised with reduced hydrochar yields [12,23]. The hydrochar yields obtained from macroalgae are typically lower than from other biomass types, such as lignocellulosic biomass. Smith et al. [23] report higher hydrochar yields for lignocellulosic biomass at 200 °C (58–70%) and 250 °C (40–46%), compared to macroalgae, which generated yields of 56% (200 °C) and 36% (250 °C). Lower hydrochar yields are potentially linked to the lower hydrolysis temperatures of macroalgal polysaccharides; alginate, laminarin and fucoidan (140–160 °C) [30], compared to lignocellulosic polysaccharides; and cellulose and hemicellulose (180–230 °C) [1]. A reduced hydrochar yield lessens the energetic output obtained during combustion.
Anaerobic digestion (AD) is a biological conversion process involving the microbial degradation of organic matter under oxygen-limited conditions. The main product of AD is biogas, a gaseous fuel comprising methane, carbon dioxide and other trace gases that can be used directly in a combined-heat-and-power (CHP) engine or upgraded to biomethane [31]. The residual slurry from the AD process is a nutrient-rich effluent, named digestate, with applications as a natural fertiliser. Biomethane yields generated from seaweeds exhibit large interspecies variability. Allen et al. [32] compared biomethane yields across ten brown seaweed species, finding large variations in the biodegradability of species, between 19 and 81 percent; Saccharina. latissima produced the highest levels of biomethane (341.7 mL CH4/g VS), whereas the fucoid species F. serratus produced the lowest biomethane yields (107.1 mL CH4/g VS). Brown et al. [18] also reported higher biomethane yields from S. latissima (200 mL CH4/g VS), compared to F. serratus (128 mL CH4/g VS). F. serratus contains higher concentrations of polyphenols [33], which can result in inhibition of AD [34], limiting the energetic conversion efficiency from the seaweed.
More recent work has explored the possibility of integrating HTC and AD, utilising both the hydrochar and process water for energy generation to maximise the overall energetic outputs of the process [18,29,35,36,37]. Numerous HTC-AD integration options have been explored across the literature, with the separation of hydrochars for combustion and process waters for AD identified as a suitable strategy for maximising energetic recovery from a biomass. Previous work by our research group found that using this integrated HTC-AD strategy improved the energetic output of a kelp (S. latissima) and a wrack (F. serratus) by up to 47% and 172% respectively, compared to AD alone [18]. A recently published study by Salgado-Hernández et al. [37] found that a similar HTC-AD integration approach also achieved a higher energy conversion efficiency for Sargassum (88.1%) compared to AD alone (36.6%).
To date, previous studies typically used dried seaweed during experiments; this was likely done to prolong the storage life of the biomass and to ensure sample homogeneity to facilitate experimental repeatability. However, during the scale-up of HTC, it is likely that feedstocks will be processed “as received”, exploiting the capability of HTC to process wet biomass and potentially using seawater as the reactant medium. F. serratus is a marine-based biomass with an associated high moisture content of approximately 67–81% [38]. Utilisation of fresh seaweed and seawater would reduce the fresh water demand of HTC, which previous studies have investigated using strategies such as process water recirculation [19,39]. In addition, processing seaweeds using seawater provides logistical advantages by allowing both biomass and water to be harvested together and used immediately in localised reactors close to the sea, negating the requirement for intensive biomass preservation and transportation. To date, only limited studies have investigated the use of seawater as a HTC reactant medium, focusing on the treatment of marine plastic debris [40] and Ulva biomass [41]. However, a direct comparison of product characteristics between seawater- and freshwater-based HTC has not yet been reported.
The aim of this study is to investigate the comparative use of seawater and freshwater as a reactant medium during HTC of F. serratus and the subsequent effect this has on energy conversion efficiency obtained from integrating HTC-AD. This includes comparing freeze-dried seaweed processed in distilled water and wet “as-received” seaweed processed in seawater. HTC reactions were conducted across three processing temperatures: 150 °C, 200 °C and 250 °C. The novelty of this work lies in comparing the use of seawater and freshwater as a HTC reactant medium and examining the influence this has on integrated HTC-AD, for the first time. This research also provides a further understanding for future applications of HTC.

2. Materials and Methods

2.1. Sample Collection, Storage and Preparation

Macroalgae

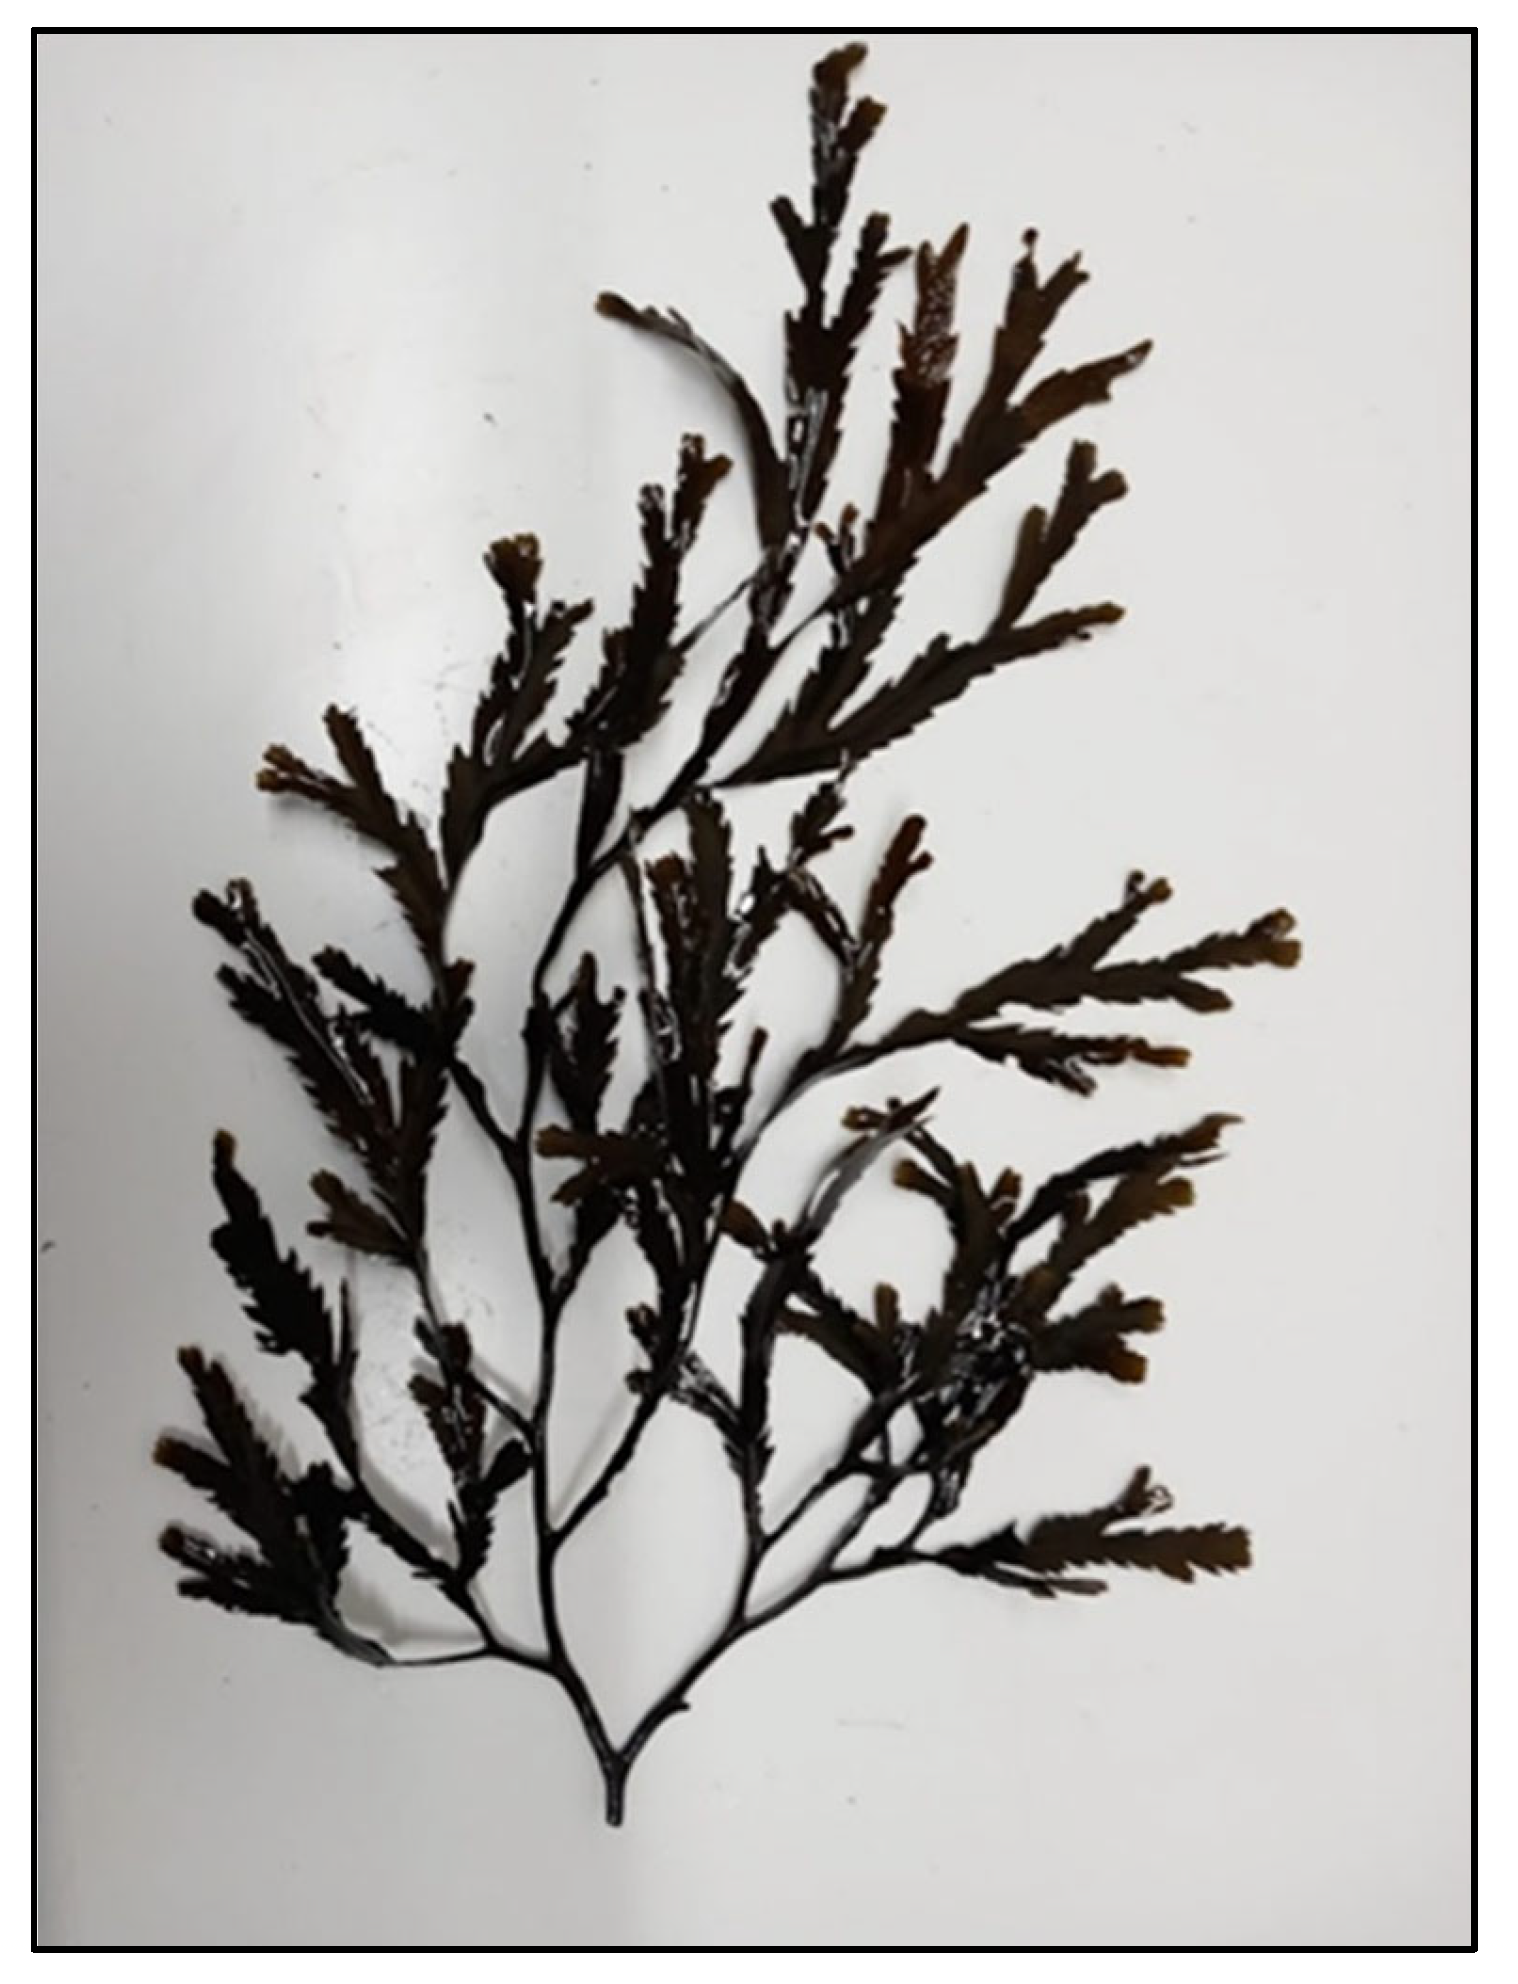
Approximately 10 kg of fresh Fucus serratus (FS) was collected from the coast of Aberystwyth, UK (52°25′11″ N 4°05′16″ W), in July 2019. For reference, a photograph depicting the FS sample utilised in this study is included in Figure A1. Seawater was collected alongside the FS. Around 5 kg of FS was submerged in seawater and stored in a cold room (4 °C) until required. The remaining 5 kg of FS was frozen (−20 °C) and subsequently freeze-dried (SuperModulyo, Edwards, now part of Thermo, Edgbaston, Birmingham, UK). The particle size of the fresh and freeze-dried FS was reduced to between 5 and 10 cm using domestic scissors, for use in HTC reactions. Freeze-dried FS was further milled to <1 mm using a cutting mill (SM300, Retsch, Haan, Germany) for determining the biomethane potential (BMP) of the untreated seaweed. A Cryomill (Retsch, Germany) was used to further reduce the particle size of dried FS and hydrochars to <100 μm for proximate, ultimate and inorganic analysis.

2.2. Hydrothermal Carbonisation (HTC)

2.2.1. HTC Reactions

Hydrothermal carbonisation (HTC) reactions were conducted using a 600 mL bench-top non-stirred reactor (Parr, Moline, IL, USA), within a custom-built quartz glass reactor liner. HTC reactions were conducted at 150 °C, 200 °C and 250 °C, resulting in autogenous pressure readings of approximately 4 bar, 14 bar and 43 bar, respectively. The HTC reactor was heated at approximately 8 °C/min using a proportional–integral–derivative (PID) controlled heating jacket. After a 60 min retention time, the reactor was removed from the heating jacket and cooled to ambient temperature. For HTC reactions using freeze-dried FS, 20 g dried FS was added to 200 mL distilled water to achieve a solid loading ratio of approximately 10%. The moisture content of the fresh FS (76.2 wt%) was determined using a Moisture Analyser (Sartorius MA35, Göttingen, Germany) and this value was used to adjust the solid loading ratio of the fresh FS HTC reactions to 10% through the addition of seawater. HTC reactions of fresh FS processed in seawater are herein described as “FS-SEA-150”, “FS-SEA-200” and “FS-SEA-250”, according to the processing temperature. HTC reactions of freeze-dried FS processed in distilled water are herein described as “FS-DIS-150”, “FS-DIS-200” and “FS-DIS-250”, according to the processing temperature.

2.2.2. HTC Product Yields

Once cooled, gaseous products from the HTC reaction were vented, without further analysis. Gaseous yield was calculated as the percentage difference between input and output masses of the HTC reactions. The solid (hydrochar) and aqueous (process water) fractions were separated by Büchner filtration using a Whatman Grade 4 filter paper (Cytiva, Amersham, Buckinghamshire, UK). Hydrochars were dried at 60 °C and the hydrochar yield (HY) was determined according to Equation (1), where mHC represents the mass, in grams, of residual dried hydrochar and mFS represents the mass, in grams, of dry FS added to the HTC reactor. Process water yield was calculated by difference. Products from duplicate HTC runs were combined and homogenised for analysis.
H Y ( % ) = m H C m F S × 100

2.3. Product Characterisation

2.3.1. Solid Characterisation

Proximate analysis was calculated using thermo-gravimetric analysis (TGA/DSC 1, Mettler Toledo, Columbus, OH, USA). The TGA heating profile was ramped from 35 °C to 105 °C, held for 10 min and then further ramped to 550 °C at 10 °C/min in a nitrogen atmosphere. At 550 °C, the sample was held for 7 min under nitrogen and a further 10 min under air. Ultimate analysis was carried out using a CHNS-O analyser (Flash 2000, Thermo Scientific, Waltham, MA, USA). Oxygen was measured directly. Hydrogen and oxygen values were both corrected for moisture. Higher heating value (HHV) was calculated using Dulong’s equation, Equation (2) [18]. Energy densification (ED) and energy yield (EY) of the hydrochars were calculated according to Equation (3) and Equation (4), respectively.
H H V ( M J k g ) = ( 0.3383 × C ( % ) ) + ( 1.422 × ( H ( % ) ( O ( % ) 8 ) ) )
E D = H H V   o f   H C H H V   o f   F S
E Y = E D × H Y
Inorganic composition was measured using X-ray fluorescence spectrophotometry (XRF, ZSX Primus II, Rigaku, Japan). Samples were prepared for XRF as 35 mm pressed pellets, according to the methodology reported by [35]. Ash fusion testing (AFT) was carried out in accordance with DD CEN/TS 15370-1:2006 [42], using a digital ash fusion furnace (Carbolite, Hope, Derbyshire, UK).

2.3.2. Process Water Characterisation

Chemical oxygen demand (COD), total phenol (TP), total nitrogen (TN) and ammonium nitrogen (NH4+-N) concentrations were quantified using HACH-Lange (Hach, Manchester, UK) cuvettes LCK014, LCK346, LCK338 and LCK303, respectively. Process waters were diluted by 1 in 10 using distilled water for COD measurements to overcome high-bias results from chloride interference, particularly for samples containing seawater [43]. Total organic carbon (TOC) was calculated as the difference between total carbon (TC) and inorganic carbon (IC), measured using a HACH IL 500 TOC-TN analyser (Hach). Sodium and potassium concentrations were measured using Atomic Absorption Spectroscopy (AAS, 240 FS AA, Agilent, Santa Clara, CA, USA) after filtering process waters through a 0.2 µm syringe filter (MilliporeSigma, Burlington, MA, USA). The pH was measured using a HQ11D Digital pH meter (Hach). The total solids (TS) and volatile solids (VS) concentrations of the process waters were determined gravimetrically according to [35], with ash content determined by difference. Volatile fatty acids (VFAs) were measured by gas chromatography with flame ionisation detection (GC-FID), according to [35].

2.4. Biomethane Potential

2.4.1. Anaerobic Digestion Inoculum

Anaerobic digestion inoculum was sourced from the outlet of an AD reactor at Esholt wastewater treatment plant (West Yorkshire, UK). The inoculum was passed through a 1 mm mesh to remove coarse solids and subsequently stored at 4 °C. Before starting BMP tests, the inoculum was incubated at 37 °C for approximately 2 days to minimise residual methane production.

2.4.2. Experimental Biomethane Potential

The biomethane potential (BMP) of HTC process waters was analysed using an AMPTS II, as previously described by [35]. Briefly, a 2:1 inoculum-to-substrate ratio on a COD basis was used by combining 200 mL inoculum diluted to 20 g COD/L and 200 mL process water diluted to 10 g COD/L in each of the AMPTS reactors. The AMPTS was maintained at 37 °C for 30 days. Blank reactors were set up in parallel to account for residual biomethane emissions from the inoculum. Biomethane yields were expressed as mL CH4 normalised at standard conditions (0 °C and 1 Atm) per gram of COD added, and final yields reported at the point of maximum cumulative generation. The BMP of untreated FS was determined using a 2:1 ratio on a VS basis, as described by [44]. VS content of untreated FS was calculated gravimetrically through heating at 105 °C, with subsequent ashing at 550 °C for 2 h [44].

2.4.3. Kinetic Modelling

Digestion kinetics of BMP tests were described using the Modified Gompertz Model, peak fermentation time (Tm) and technical digestion time (T80). Details of these calculations are outlined by [44].

2.5. Energy Balance Calculations

The energy balance of the process was determined according to the calculations outlined by Brown et al. [44]. This includes energy input (EI) of the HTC process and energy output (EO) for the AD of FS, combustion of hydrochars and biomethane production from process waters. The unit of both EI and EO was MJ/kg dry FS. Energy return on energy investment (EROI) was calculated according Equation (5), assuming a 55% energy recovery efficiency based on previously published work by our group [35] and provisional Aspen Plus modelling data (unpublished). Energy conversion efficiency (ECE) was determined using Equation (6).
E R O I = E O ( E I × 0.45 )
E C E ( % ) = E O H H V   o f   F S × 100

2.6. Error and Statistical Analysis

Analytical methods, HTC reactions and BMP tests were conducted in duplicate, with the exception of XRF. Average values are presented alongside the standard deviation, except for BMP tests, where the minimum and maximum values are displayed. Averages and standard deviations were calculated using MS Excel.

3. Results and Discussion

3.1. Hydrochar Characteristics

3.1.1. Proximate, Ultimate and Energy Densification Properties

The yield and compositions of untreated FS and hydrochars are displayed in Table 1. A reduction in hydrochar yield was observed at higher HTC temperatures, consistent with previous observations for seaweeds [12,17,18] and other feedstocks [23]. FS-DIS hydrochar yields are comparable to FS hydrochar yields reported in our previous study: 37.5% (150 °C), 28.4% (200 °C) and 22.0% (250 °C). Table 1 shows that hydrochar yields are generally comparable for FS-SEA and FS-DIS when processed at 150 °C and 200 °C. However, at 250 °C, the hydrochar yield was higher for FS-DIS-250 (28.7%) than FS-SEA-250 (21.9%). The presence of metal chloride salts has been shown to decrease the yield of cellulose-derived hydrochars, particularly at higher temperatures [45]. However, there is limited information on the effect of salts on the HTC of macroalgal-derived carbohydrates.
Table 1 shows that the hydrochars demonstrated a simultaneous decrease in volatile matter (VM) and increase in fixed carbon (FC) content as HTC processing temperature increased. Untreated FS displayed a higher ash content (31.5%) than the hydrochars, indicating that a portion of the inorganics are distributed towards the process water during HTC. Understandably, the ash content of FS-SEA hydrochars (19.9–23.8%) was higher than in the FS-DIS hydrochars (14.6–18.1%), due to the increased presence of inorganics within the seawater.
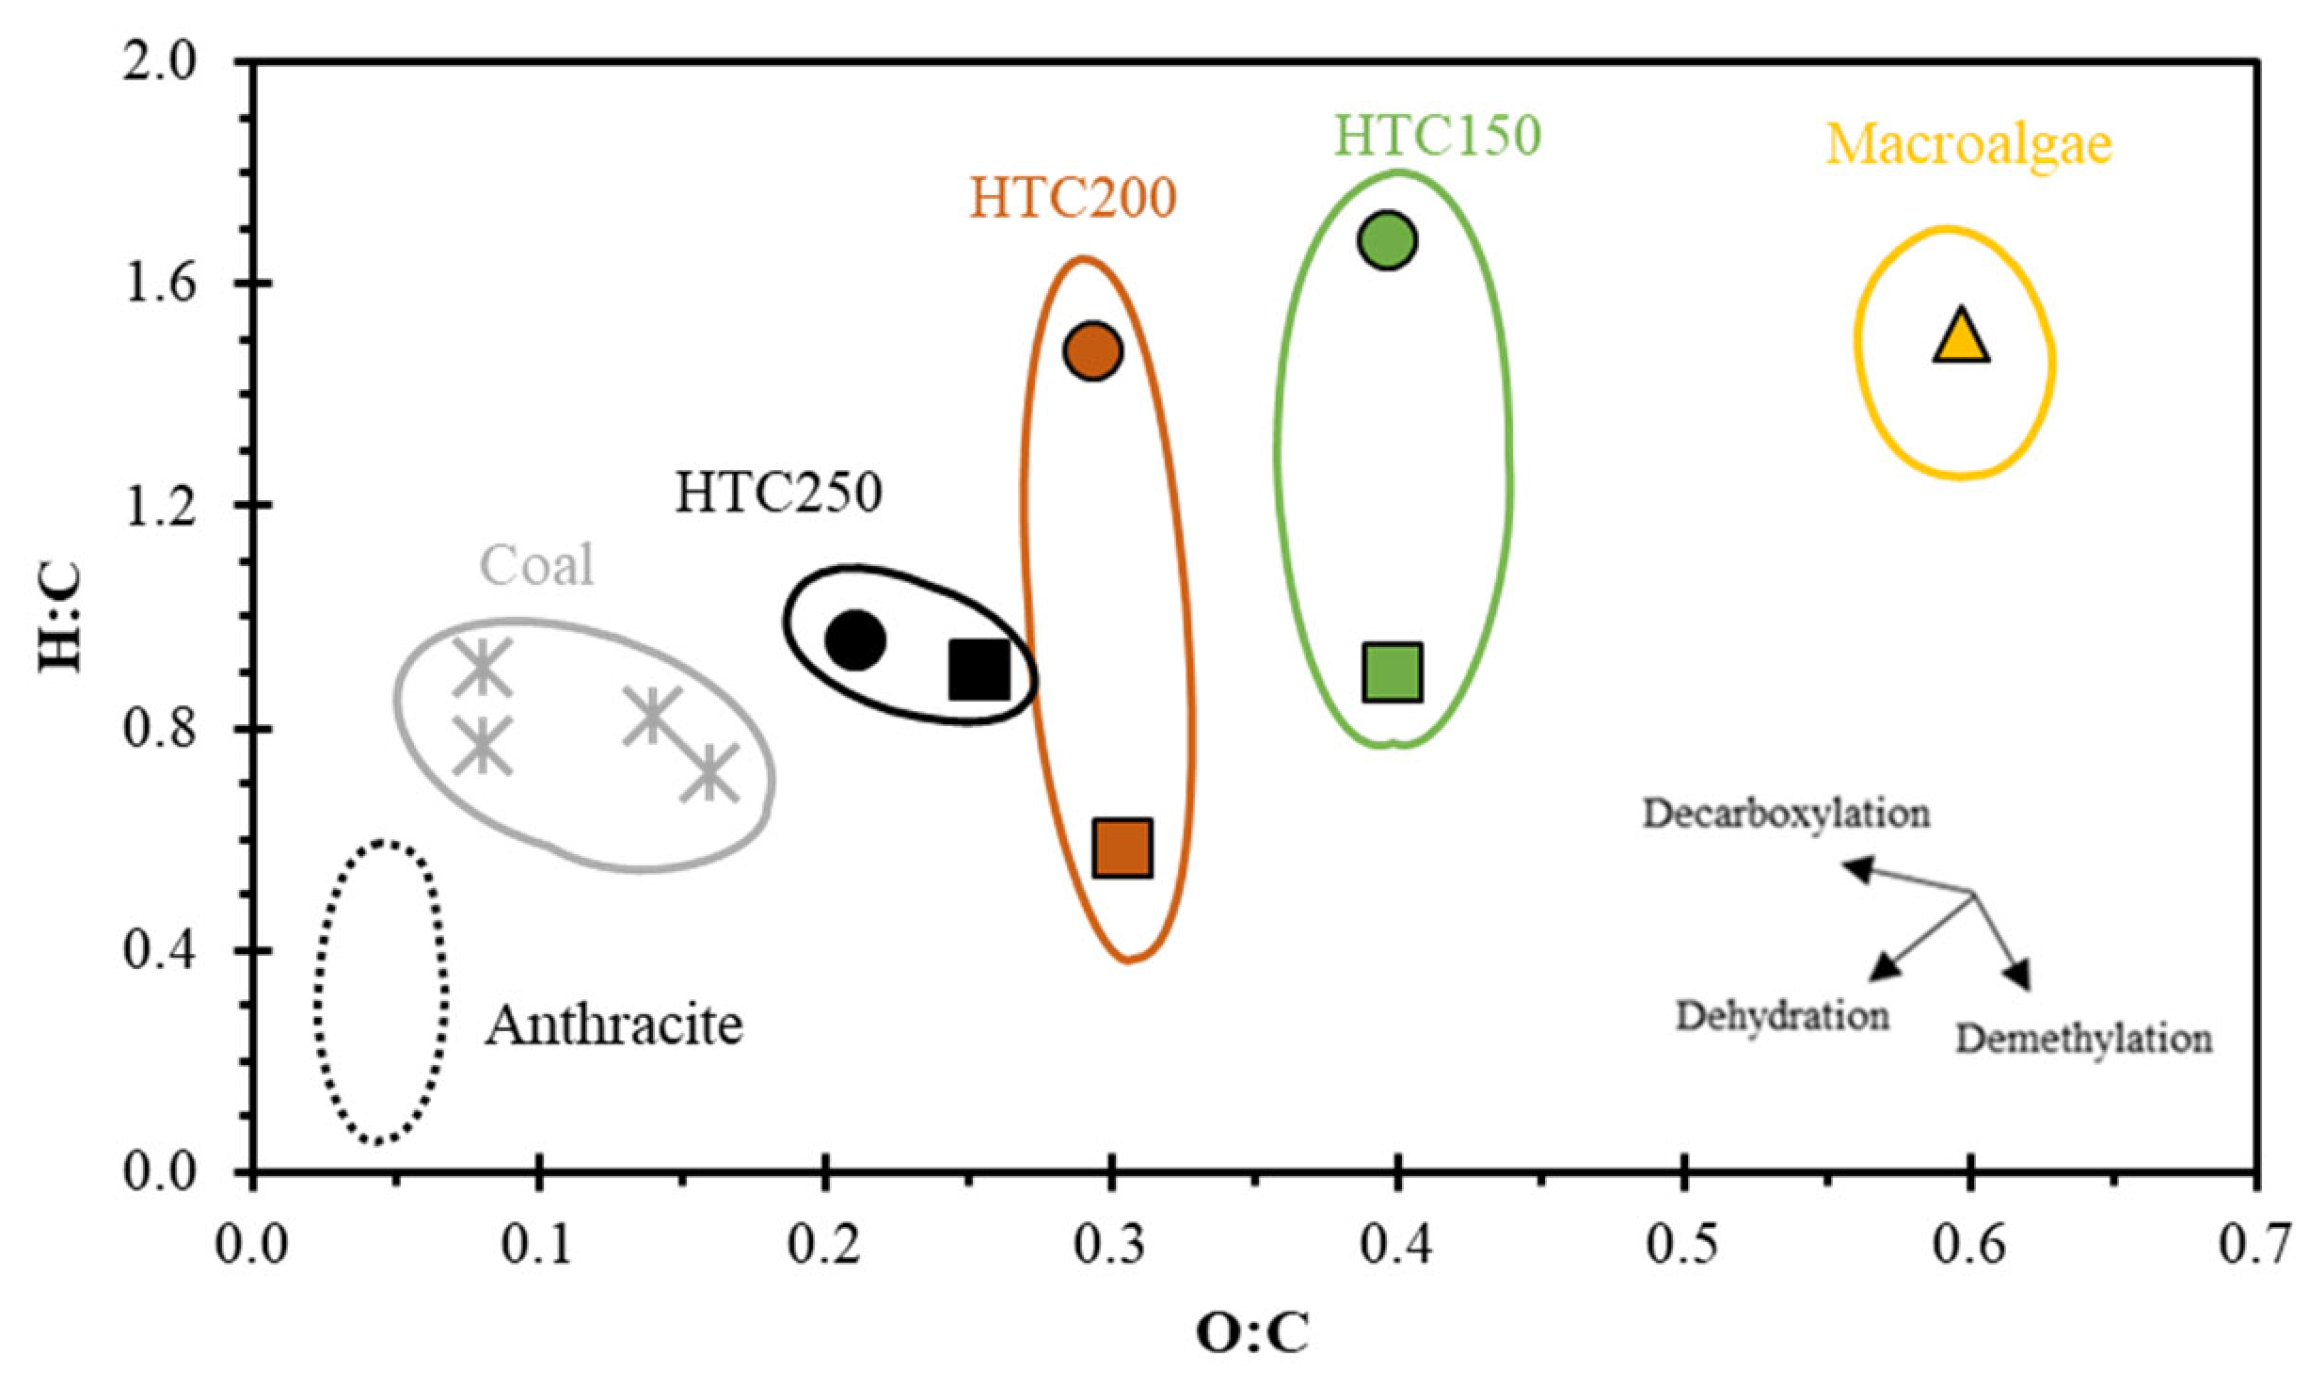
The ultimate analysis presented in Table 1 exemplifies the energy densification potential of HTC. Compared to untreated FS, all hydrochars showed a higher carbon content and lower oxygen content. This trend was increasingly pronounced at higher HTC temperatures, reflecting an increase in dehydration and decarboxylation reactions, which caused a reduction in both H:C and O:C ratios [23]. Figure 1 highlights these hydrochar compositional changes, demonstrating that hydrochars produced at 250 °C most closely resemble the properties of coal.
The HHV, ED and EY values of each hydrochar are displayed in Table 1. All hydrochars displayed a higher HHV (16.0–22.2 MJ/kg) compared to untreated FS (12.6 MJ/kg), with higher HHVs observed at increased HTC temperatures. The HHVs of FS-SEA hydrochars were higher than FS-DIS hydrochars produced at the same temperatures, due to a lower O content. However, despite FS-SEA-250 displaying the highest HHV, its EY (38.4%) remained lower than FS-DIS-250 (47.6%), due to the higher hydrochar mass yield obtained from FS-DIS-250.
Table 1 indicates that the presence of seawater as a HTC reactant medium can improve the HHV of FS-derived hydrochars. The salinity of seawater is typically 3.5 wt%, with the typical inorganic composition presented in Table 2 [46]. Chlorine and sodium represent the most abundant inorganic species in seawater, often present as NaCl. Xu et al. [47] showed that NaCl addition during the HTC of sewage sludge can promote hydrolysis and increase solubilisation into the process water, although it has little effect on the hydrochar HHV. NaCl has also been reported to enhance the depolymerisation and solubilisation of cellulose [48] due to interactions between chlorine ions and glucose intermolecular hydrogen bonds. In addition, CaCl2 has been shown to increase the energy density of lignocellulosic-derived hydrochars [49]; however, such effects have not been reported for macroalgal-derived hydrochars.

3.1.2. Inorganic Composition and Combustion Behaviour

The inorganic compositions of the hydrochars are shown in Table 3, alongside the resultant inorganic removal efficiencies. Untreated FS contained high concentrations of Na (4.1%), Cl (6.6%) and K (3.9%), all of which can result in problematic slagging, fouling and corrosion issues [12,23,50]. All FS-DIS hydrochars showed a reduced Na, K and Cl concentration, compared to untreated FS. Higher temperatures resulted in an increased removal efficiency of Na, K and Cl, up to >85% at 250 °C. This conclusion is supported by Smith et al. [23], who reported removal efficiencies of 87% for Na and 96% for K for seaweed-derived hydrochars produced at 250 °C. Hydrochars prepared in seawater displayed higher concentrations of Na and Cl compared to FS-DIS hydrochars, due the high prevalence of these elements in seawater (Table 2). FS-SEA hydrochars prepared at 150 °C and 200 °C displayed limited removal efficiency of Na and Cl, containing higher concentrations compared to untreated FS. In comparison, FS-SEA-250 contained lower concentrations of Na and Cl compared to untreated FS, with comparable removal efficiencies to FS-DIS-250. Under more severe HTC processing conditions, the dielectric constant of water becomes more exaggerated, further enhancing the selective mineral removal efficiency from biomass. The results displayed in Table 3 indicate that hydrochars produced using higher temperatures (250 °C) experience reduced slagging, fouling and corrosive propensities due to this inorganic loss.
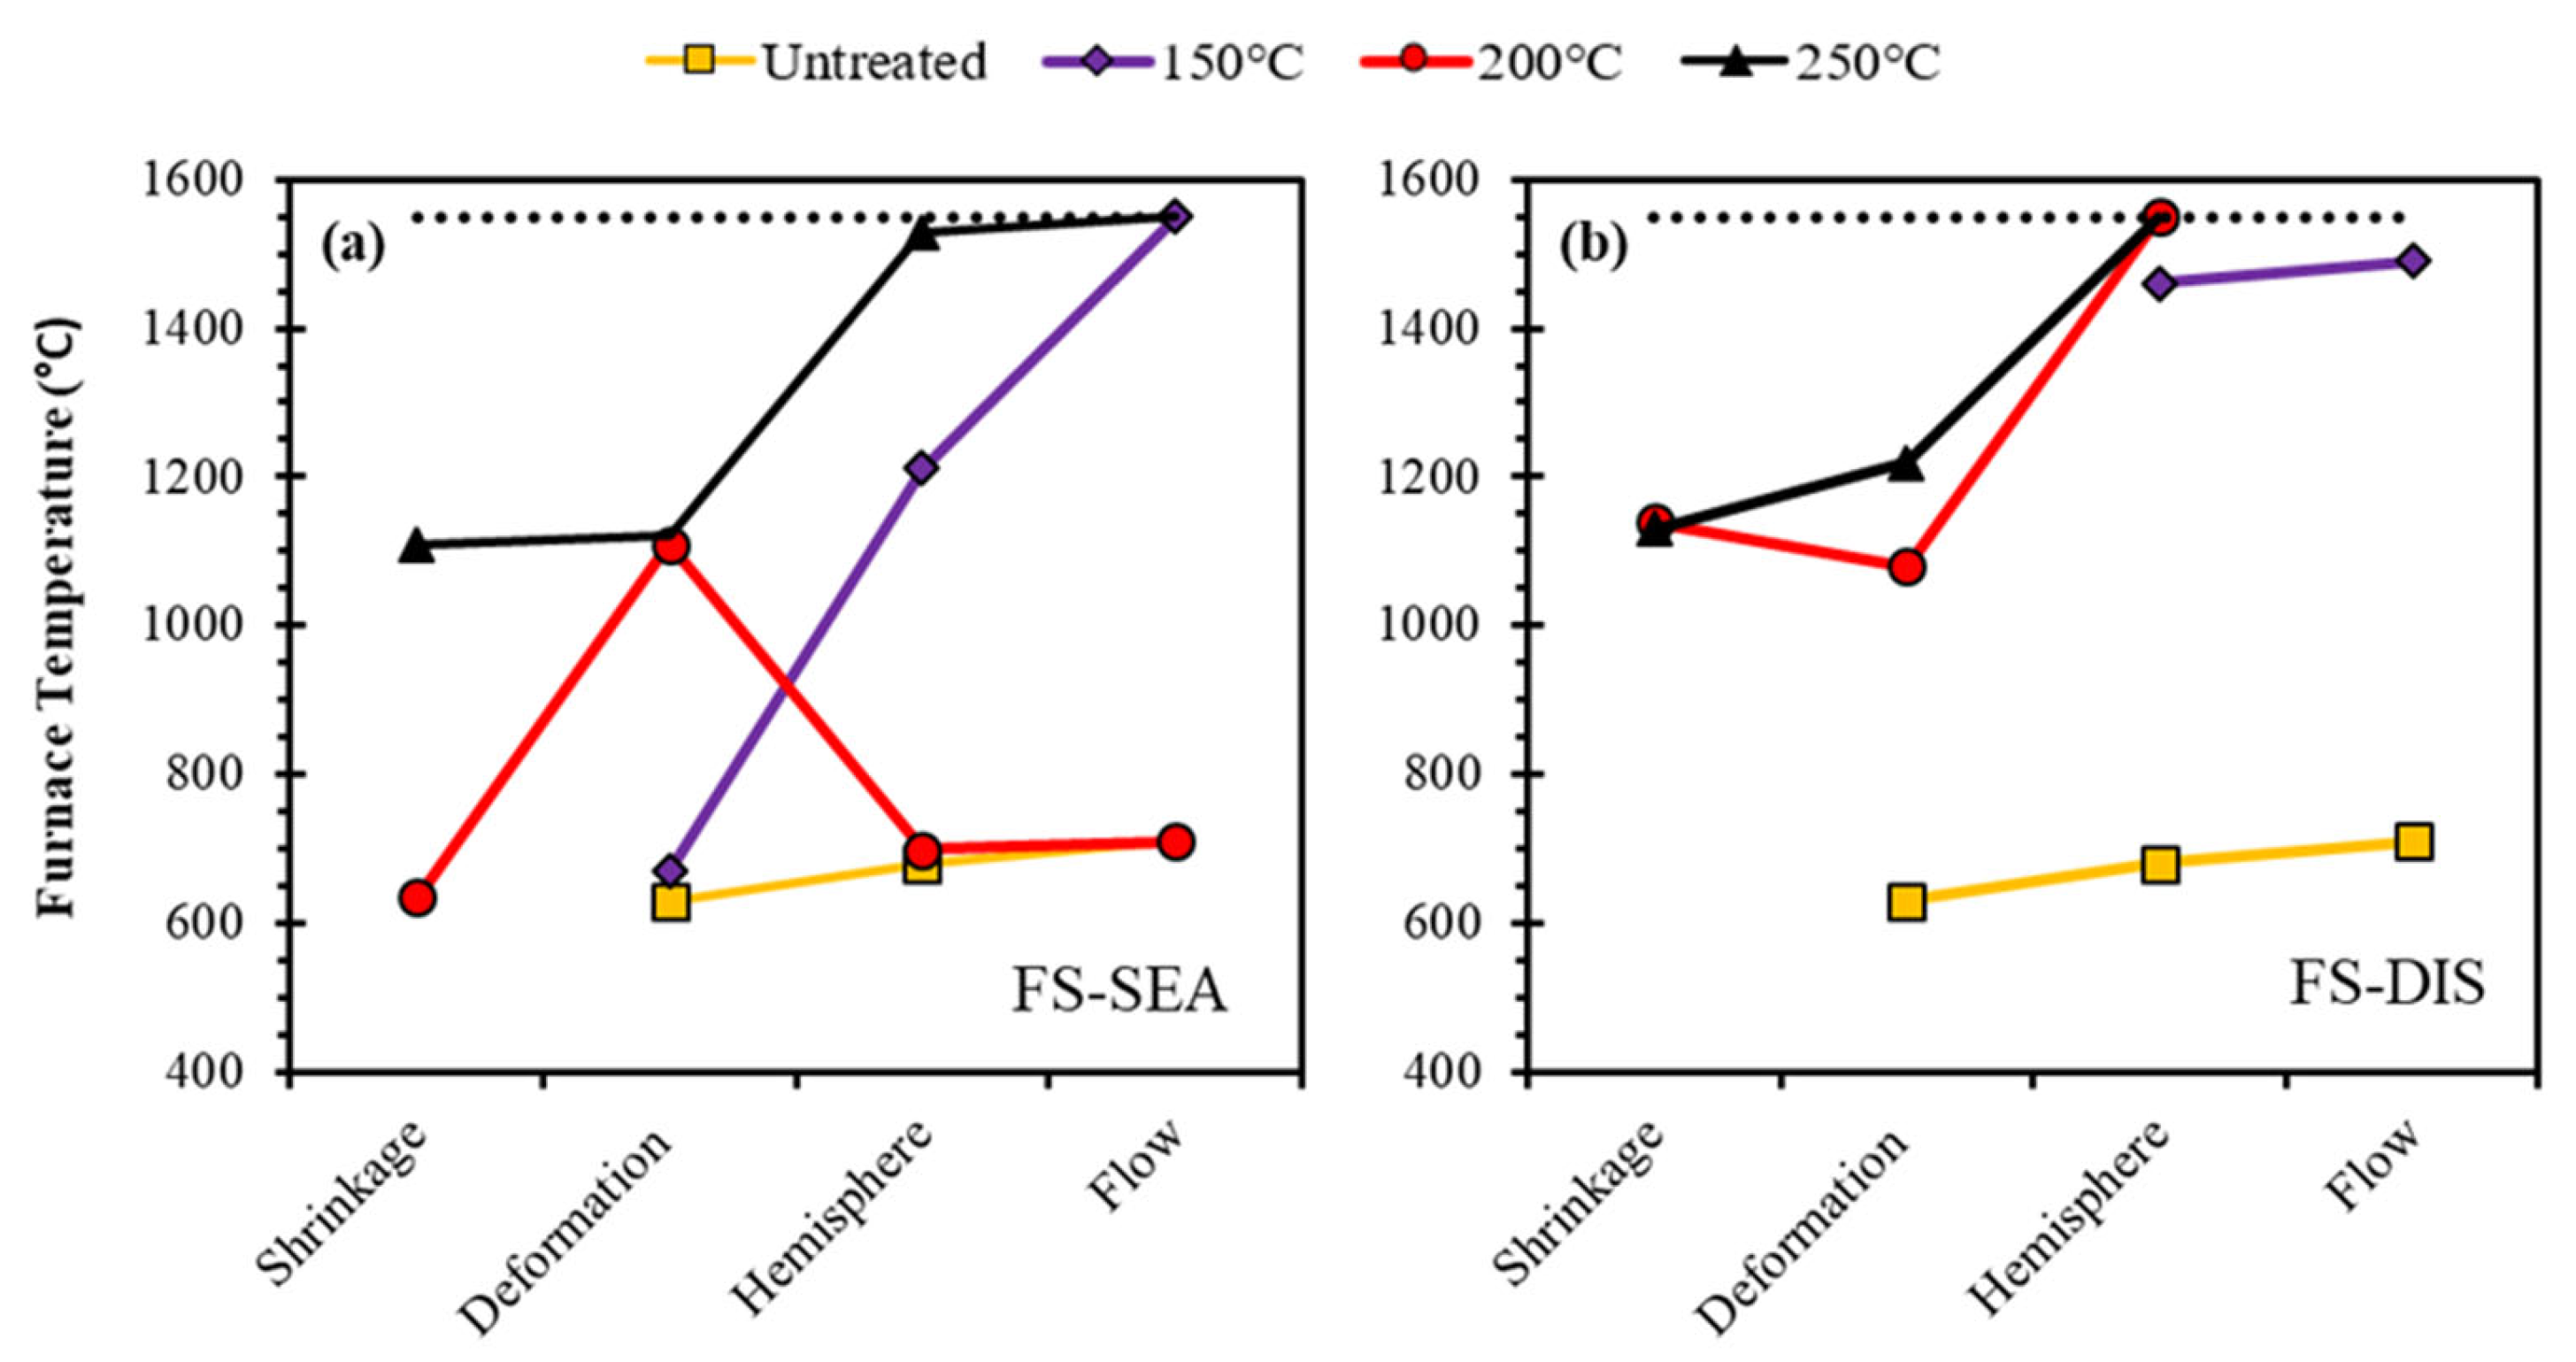
The reduced slagging potential of hydrochars was further explored through ash fusion testing (AFT), as displayed in Figure 2. During AFT, ash pellets undergo characteristic morphological changes, which provide insight into the slagging propensity of a fuel during thermal processing. For example, the deformation temperature indicates when ash becomes tacky and starts to stick to furnace surfaces, whereas the flow temperature represents the ash melting point [23]. Transitional stages recorded at higher temperatures are indicative of a reduced slagging potential.
Untreated FS ash undergoes deformation (630 °C), hemisphere (680 °C) and flow (710 °C) at relatively low temperatures, indicative of a high slagging propensity. Smith and Ross [12] also report similarly low AFT temperatures for seaweeds, a result of high alkali metal contents. Figure 2 shows that most hydrochars exhibited reduced slagging propensities compared to untreated FS. The most significant reduction in slagging potential was observed at a processing temperature of 250 °C, linked to increased Na, K and Cl removal (Table 3). The deformation temperature of FS-250-DIS (1220 °C) was slightly higher than FS-SEA-250 (1120 °C), although hemisphere and flow temperatures were comparable. Therefore, similar slagging propensities were observed between FS-DIS-250 and FS-SEA-250 (Figure 2), despite increased Na, K and Cl concentrations for FS-SEA-250 (Table 3).

3.2. Process Water Composition

Table 4 shows the composition of process waters produced from FS under different HTC reactions. The COD of FS-SEA-150 (39.9 g/L) and FS-DIS-150 (39.2 g/L) are relatively similar. Process waters produced at 200 °C and 250 °C exhibit a lower COD compared to those produced at 150 °C, a trend that is exaggerated when using seawater as a reactant medium, compared to distilled water. Similar behaviour was observed in TOC concentration. COD and TOC concentrations are comparable to those previously reported for F. serratus [18]. FS-SEA process waters display consistently higher TS concentrations compared to FS-DIS process waters, produced at comparable processing temperatures, a result of the higher ash content of FS-SEA process waters. Ash represents 49–62%TS of FS-SEA process waters, compared to 36–41%TS of FS-DIS process waters. The higher ash content of FS-SEA process waters is related to the presence of inorganics in seawater, particularly sodium chloride (Table 2), as evidenced by the increased sodium concentrations shown in Table 4.
The results in Table 4 indicate an increased VFA concentration of process waters produced under more severe reaction temperatures (200 °C and 250 °C), compared to lower-temperature conditions (150 °C). VFAs are precursors to methanogenesis during AD [51]. However, in large-enough concentrations, VFA accumulation can inhibit AD by penetrating microorganismal cell walls, resulting in intracellular pH imbalance [52]. Table 4 shows that process waters produced at 150 °C and 200 °C displayed an acidic pH (4.2–4.8). However, the pH of process waters produced at 250 °C were less acidic (pH 6.3–6.6), despite higher VFA concentrations, indicating a buffering effect at higher temperatures. TN concentrations of process waters are reported to increase with increasing HTC temperature, due to increased breakdown of proteins [36], until a plateau is reached at approximately 240 °C. Similar conclusions are observed in Table 4. Increasing HTC temperature also resulted in an increase in phenols and NH4+-N concentrations in the process water, both inhibitory to anaerobic digestion [53,54]. However, the concentrations of phenols and NH4+-N were comparable between FS-SEA and FS-DIS process waters produced at the same HTC temperature.

3.3. Biomethane Potential of Process Waters

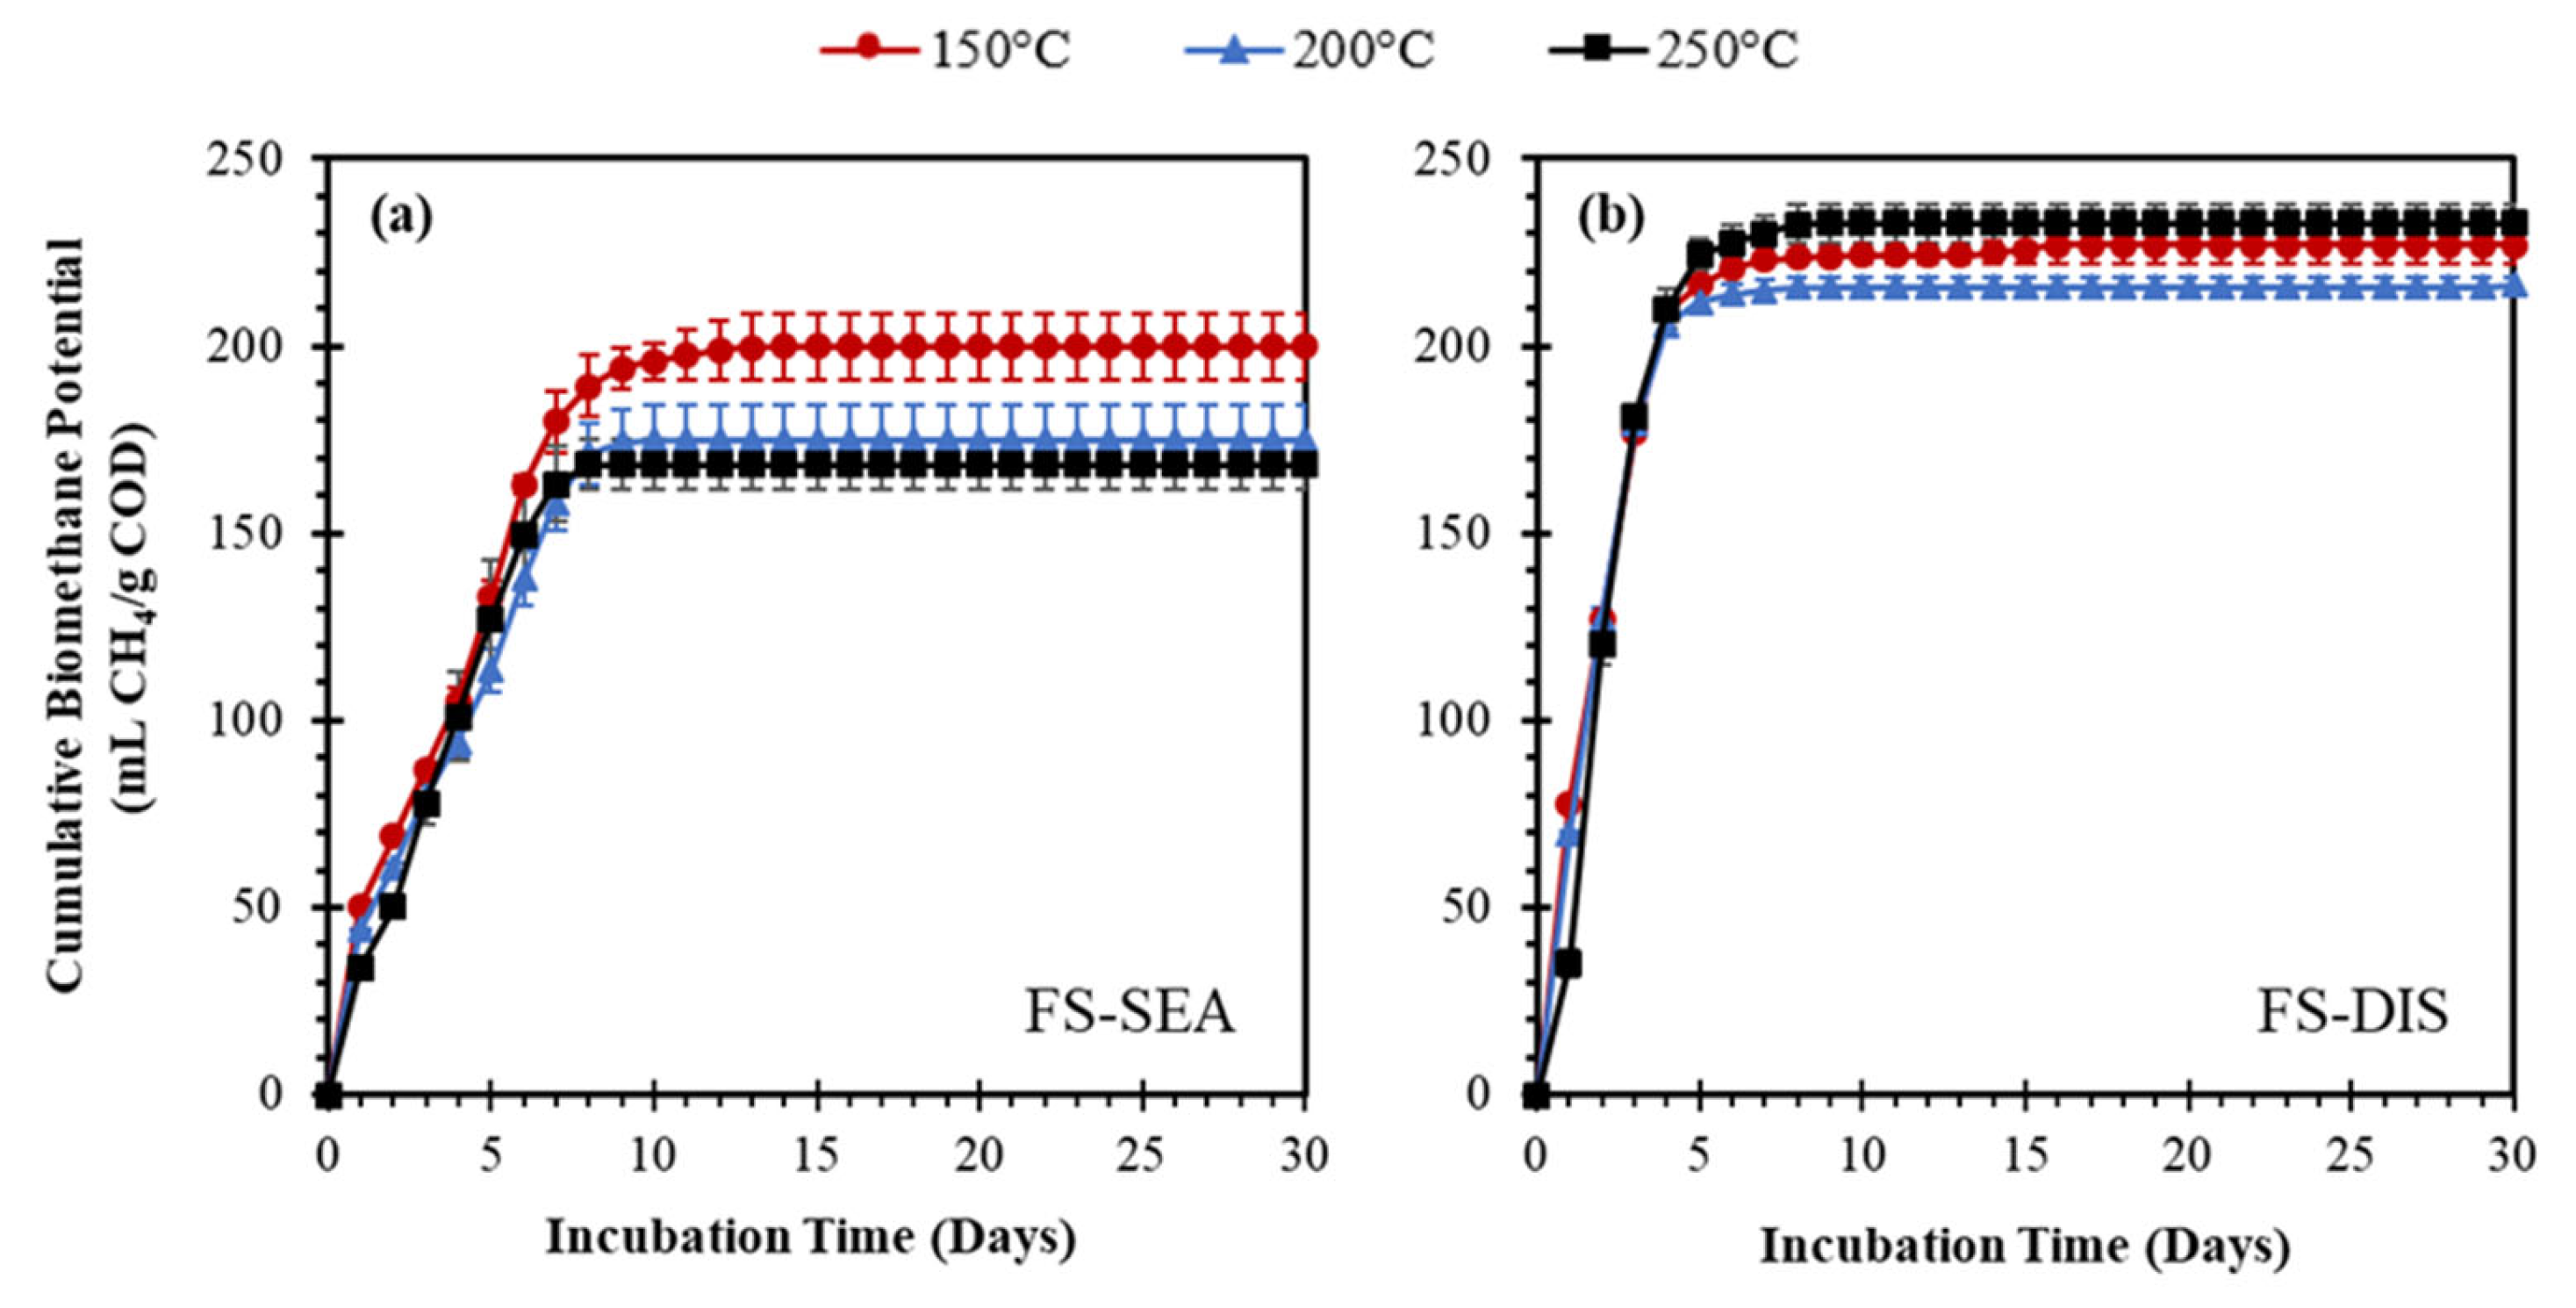
Figure 3 shows the biomethane potential (BMP) yields from FS-SEA process waters (Figure 3a) and FS-DIS process waters (Figure 3b). Table 5 describes the digestion kinetics of process waters. Overall, BMP yields obtained from FS-SEA process waters were lower than FS-DIS process waters. In addition, Table 5 shows that FS-DIS process waters exhibited more favourable digestion kinetics compared to FS-SEA process waters, displaying consistently higher peak biomethane production rate (Rm) and consistently lower peak time of biomethane production (Tm) and technical digestion time (T80), compared to FS-DIS process waters. Consequently, this indicates an inhibitory effect of seawater on the AD process. Table 4 shows that the concentrations of phenol and NH4+-N inhibitors are similar across FS-SEA and FS-DIS process waters produced at the same HTC temperatures. However, the concentrations of inorganics, particularly sodium (assumed sodium chloride), are significantly higher in process waters produced from seawater (FS-SEA). High concentrations of sodium are inhibitory to AD, due to disruption of microbial metabolic pathways and resultant activity [54,55]. Despite this, Figure 3b shows that significant yields of biomethane were produced from FS-SEA process waters at 150 °C, 200 °C and 250 °C: 200 mL CH4/g COD, 174.8 mL CH4/g COD and 168.4 mL CH4/g COD, respectively. Therefore, the inhibitory effect of the seawater is moderate, causing a slight reduction in BMP yields, rather than severe inhibition of AD. High levels of salinity have been previously shown to reduce biomethane production from seaweed [56], though do not result in complete inhibition. Wang et al. [19] investigated biomethane generation from HTC process waters produced from Laminaria by performing multiple HTC cycles in which the same process water was repeatedly used and fresh biomass was added each time. After 12 recirculations, the salinity of Laminaria process water increased from 15.8% (0 recirculations) to 153.3%. Despite the increased salinity, a higher biomethane yield was obtained from the process water produced from 12 recirculations (192.5 mL CH4/g COD), compared to 0 recirculations (171.4 mL CH4/g COD) [19]. Therefore, the results of Figure 3, Table 5 and Wang et al. [19] indicate that high-salinity process waters can generate sufficient yields of biomethane during AD.
Figure 3 shows that FS-SEA-150 generated a higher biomethane yield compared to FS-SEA-200 and FS-SEA-250. Table 4 shows that HTC process waters produced at lower temperatures contain lower concentrations of fermentative inhibitors: phenols and NH4+-N. Higher biomethane yields from HTC process waters produced at lower HTC processing temperatures have been observed as a trend in the literature across a range of feedstocks, including macroalgae (S. latissima) [18], microalgae [29], cow manure [57], orange pomace [58], water hyacinth [44], grass [35] and the organic fraction of municipal solid waste [59]. However, Figure 3b shows that the BMP yields from FS-DIS process waters were similar: 227.0 mL CH4/g COD (FS-DIS-150), 216.2 mL CH4/g COD (FS-DIS-200), and 232.8 mL CH4/g COD (FS-DIS-250). These results reflect a similar range in BMP yields from F. serratus HTC process waters produced at 150 °C, 200 °C and 250 °C of 190–215 mL CH4/g COD [18]. The results of the current study suggest no significant trend between HTC processing temperature and BMP yields for FS-DIS process waters, indicating that the degradation products of FS during HTC may not be as inhibitory to AD as other biomass sources. However, Salgado-Hernández et al. [37] reported that differences in inoculum microbial community can effect biomethane generation from seaweed process waters, with yields varying between 206.5 mL CH4/g COD and 90.4 mL CH4/g COD, using two different inoculum sources. This highlights the complexity of the AD process and the multiple factors influencing biomethane yields.

3.4. Energy Balance Analysis

The data presented in this section outlines the obtainable energy outputs from the combined combustion of hydrochars and biomethane generation from 1 kg of dried FS across each HTC processing temperature and reactant medium source. These values are compared to the calculated energy output obtained from the AD of 1 kg of dried FS to highlight changes in the energy conversion efficiency (ECE) of FS.

3.4.1. Energetic Output and Energy Conversion Efficiency

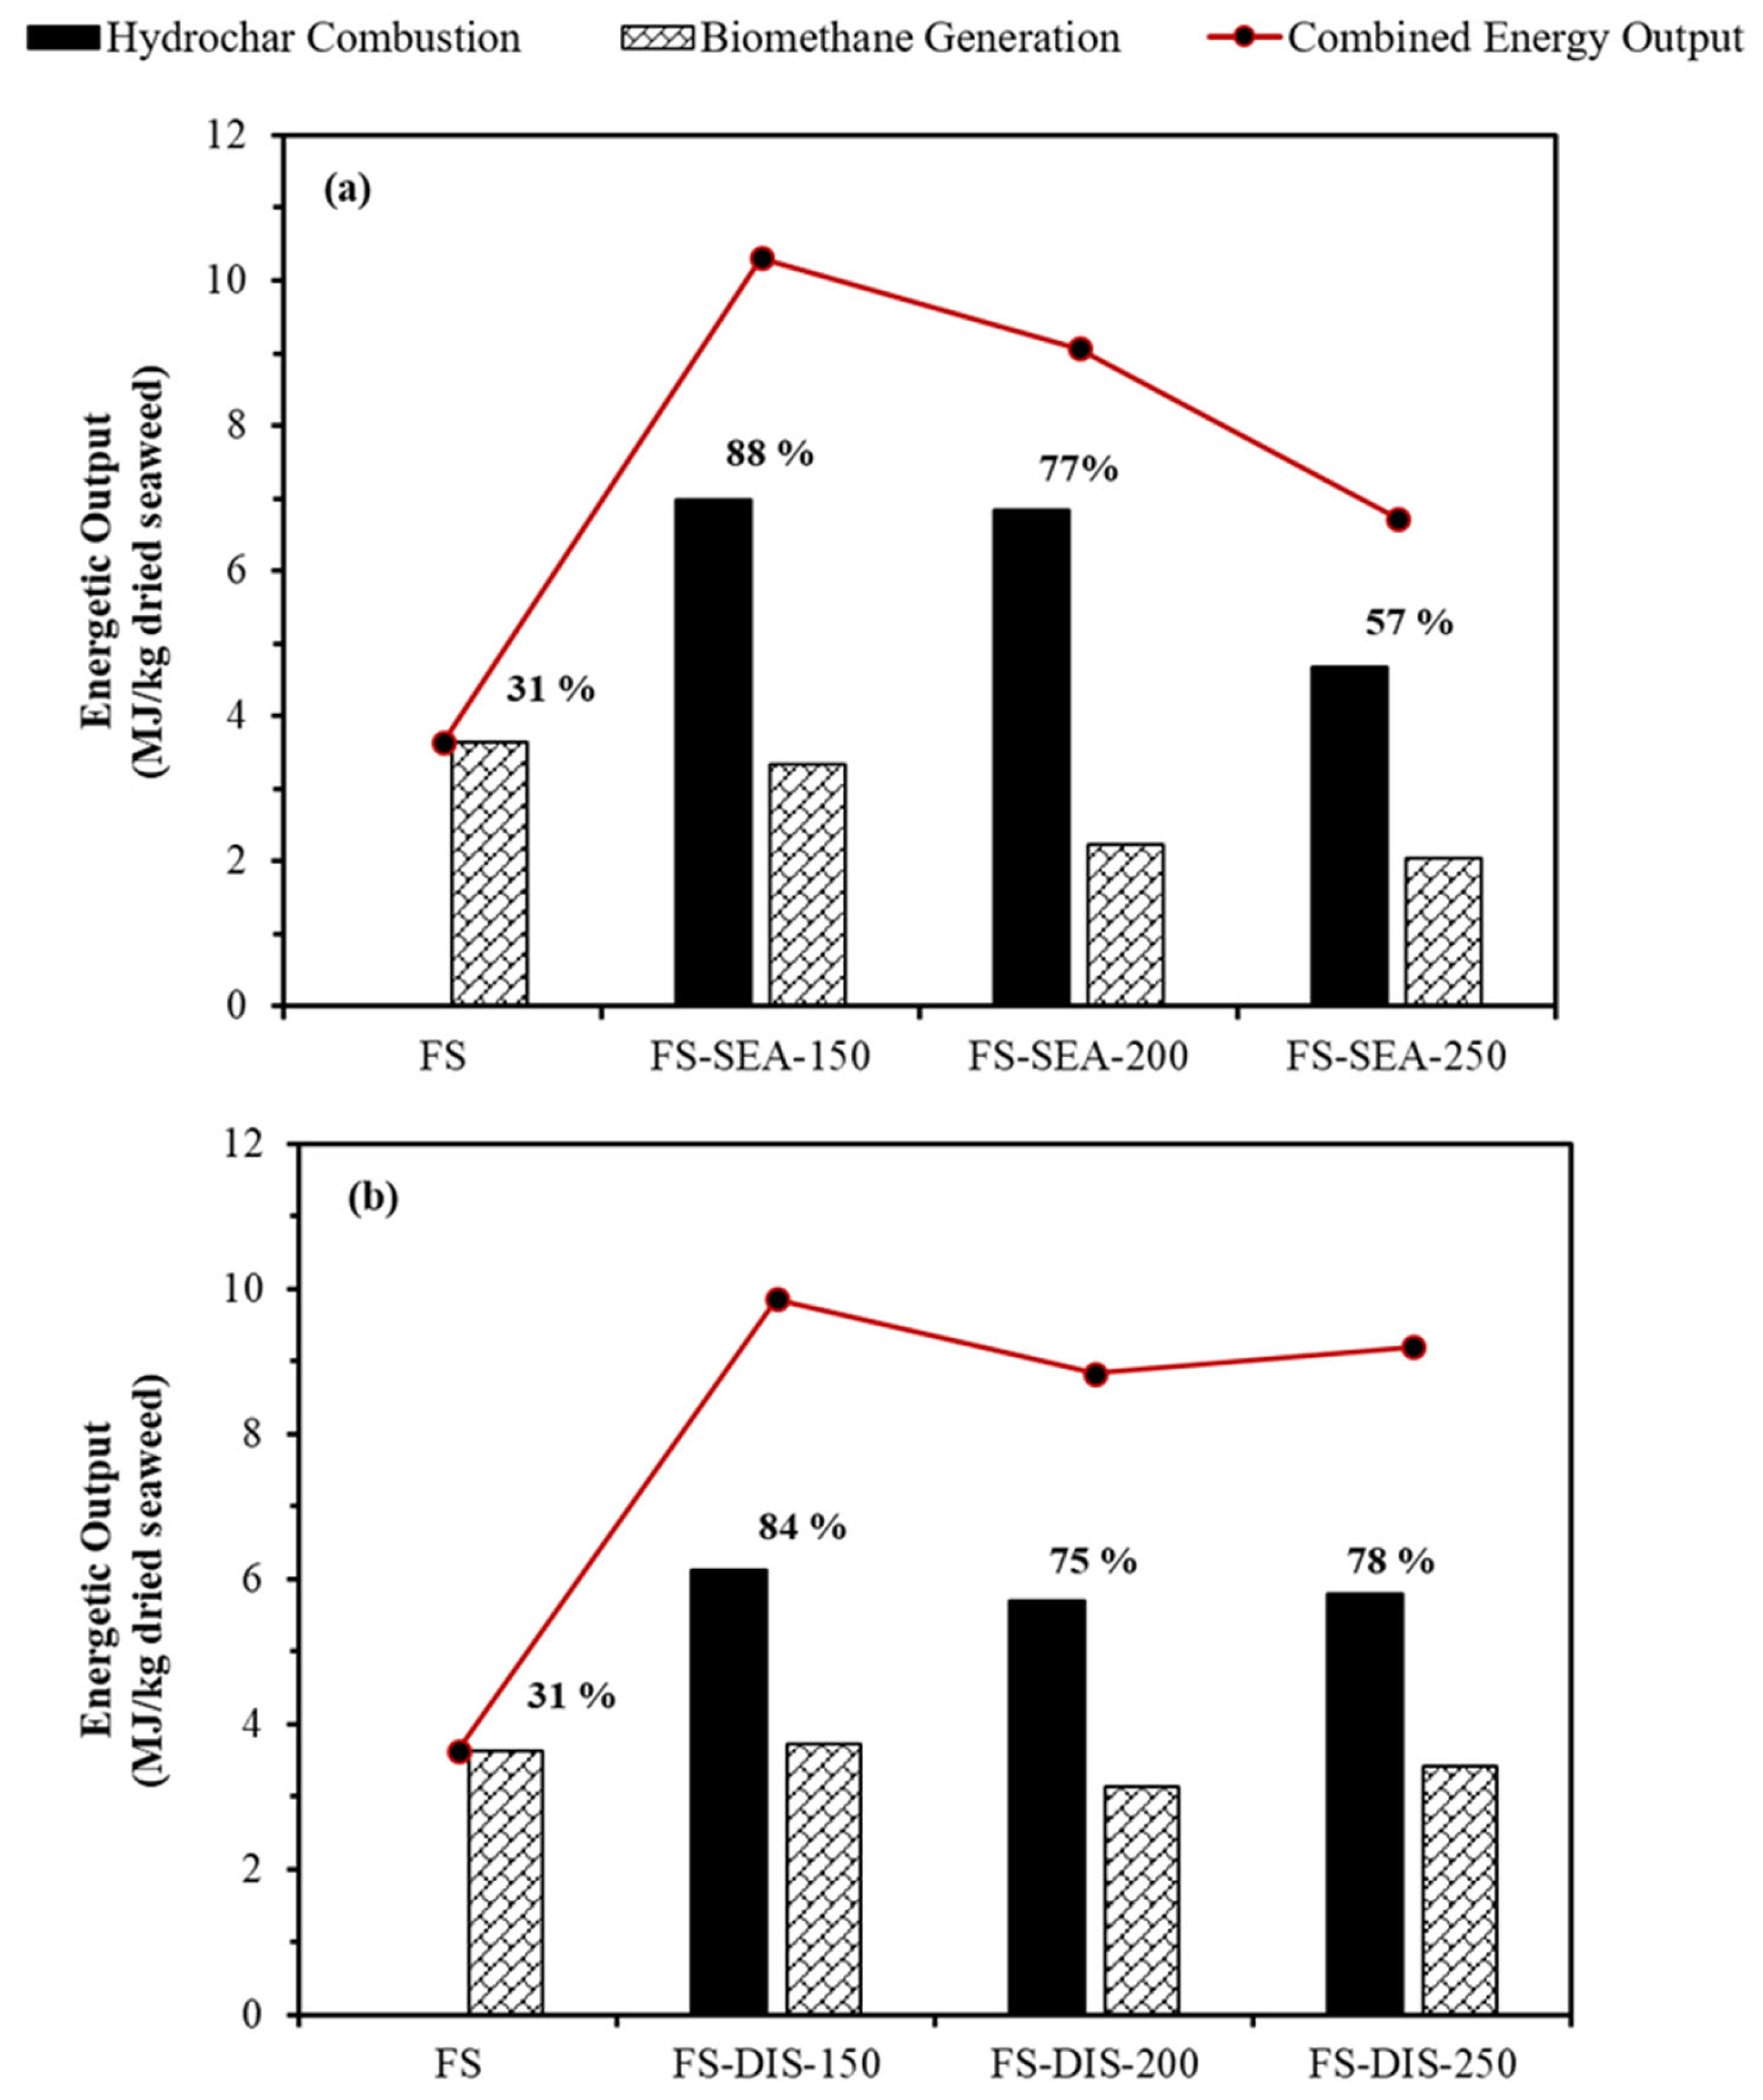
Figure 4 highlights the energy outputs from HTC-AD integration for FS processed in seawater (Figure 4a) and distilled water (Figure 4b). AD of FS yielded an energy output of 3.63 MJ/kg, representing a 31% ECE. All HTC-AD integration strategies improved the ECE of FS compared to AD alone, regardless of whether the HTC reaction medium was seawater or distilled water. Figure 4a shows that the energetic output from HTC-AD integration decreased with increasing HTC processing temperature when using seawater as the HTC reactant medium. Hydrochar combustion represents a greater energy carrier compared to process water AD, amounting to 68–75% of total energy output of FS-SEA HTC-AD integration options. Similar conclusions were observed integrating HTC-AD for Sargassum [37], where hydrochar combustion represented 84% of the total energetic output. However, as HTC temperature increased, the energy output from FS-SEA hydrochar combustion decreased, reducing from 6.97 MJ/kg (FS-SEA-150) to 6.83 MJ/kg (FS-SEA-200) and 4.68 MJ/kg (FS-SEA-250). This reduction is linked to the decreased hydrochar yields, as described in Table 1. AD of FS-SEA-150 process water also yielded a higher energetic output (3.34 MJ/kg) compared to FS-SEA-200 or FS-SEA-250 (2.04–2.23 MJ/kg) due to higher BMP yields (Figure 3a) and COD concentration (Table 4).
Figure 4b shows that FS-DIS-150 represented the greatest ECE compared to FS-DIS-200 and FS-DIS-250. Similarly to Figure 4a, hydrochar represented the greatest energy carrier for FS-DIS HTC-AD integration options. However, the energetic contribution from the AD of process water was greater for FS-DIS (35–38%), compared to FS-SEA (25–32%), due to higher BMP yields, as shown in Figure 3.
A similar ECE was observed at HTC processing temperatures of 150 °C and 200 °C, respectively, when comparing seawater and distilled water as the HTC reactant medium. However, FS-DIS-250 displayed a superior ECE (78%), compared to FS-SEA-250 (57%), due to higher hydrochar yield (Table 1) in addition to higher process water COD concentration (Table 4) and BMP yields (Figure 3).

3.4.2. Energy Return on Energy Investment

Table 6 highlights that all F. serratus HTC-AD integration options yield a positive EROI. Increased HTC processing temperatures resulted in a reduced EROI value, due to larger energy input requirements and generally reduced energy output compared to lower processing temperatures (150 °C). However, HTC processing at 250 °C resulted in the production of hydrochar with more desirable combustion properties. This includes a reduced slagging propensity due to a higher ash melting temperature (Figure 2) and reduced presence of alkali metals (Table 3), alongside lower Cl levels, which can reduce corrosion issues during thermal conversion. Therefore, a compromise occurs between the energetic balance and the performance of the hydrochar in large-scale conversion processes [35].

3.5. Future Considerations

This study examined the use of seawater as a reactant medium for the HTC of F. serratus, evaluating both the combustion properties of resulting hydrochars and AD of the associated process waters. The use of seawater was intended to reflect practical operating conditions while also offsetting the demand for freshwater. Although a few studies have explored the use of seawater in HTC systems [40,41], further investigation is required before the technology can be scaled up.
In this work, HTC experiments were conducted using a 600 mL stainless steel Parr bench-top reactor within a custom quartz liner to facilitate removal of solid products. While suitable for laboratory work, quartz liners are impractical at larger scales, due to added complications to the reactor design and increased cost. However, without a liner, stainless steel reactors are likely to corrode in the presence of seawater, due to increased concentrations of salts. Using alternative materials to construct reactors may be able to mitigate this issue: Castello et al. [60] reported that alumina ceramic linings reduced corrosion in high-temperature hydrothermal systems. However, adoption of these materials would likely increase the capital cost of hydrothermal processing. Accordingly, a comprehensive techno-economic assessment is necessary to assess the feasibility of implementing these reactor types at scale.
The associated issues of salts and Cl also follow through to AD. Figure 3 shows that sufficient volumes of biomethane can be generated from FS-SEA process waters, though volumes were reduced compared to the equivalent FS-DIS samples. This is partially due to microbial inhibition by the salts and Cl, as identified by Adams et al., 2015 [55]. Experiments in this study were conducted using batch BMP tests, which may not necessarily represent long-term continuous AD reactors [61], particularly under inhibitory conditions. However, previous studies have highlighted the capability of AD microorganisms to adapt to high levels of salinity following an acclimation period [62].
AD reduces the carbon fraction of the feedstock as biomethane is produced, concentrating the nutrients and inorganics in the digestate, which is typically used as a natural fertiliser [9]. HTC process waters generated in seawater are likely to contain inherently high ash concentrations, the majority of which is likely salts and Cl. There is evidence to suggest that digestate produced from seaweed-derived HTC process waters can act as an effective fertiliser, increasing Brassica rapa seed germination index by 61% [63]. However, Wang et al. [19] showed that HTC process waters from Laminaria inhibited seed germination, likely due to high salinity and high concentration of toxic organic compounds, such as HMF or furfural. Therefore, HTC process waters generated using seawater are likely to produce digestates that are inhibitory to crop growth and detrimental to soil quality. Natalio et al. [64] investigated the impacts of applying BS PAS 110-compliant food-waste digestate onto soil, which resulted in increased mortality of earthworms (A. chlorotica), likely due to osmotic stress caused by high salinity. However, high-salinity digestate has been proven as an effective fertiliser for rice paddy fields [65], suggesting application of digestate to arable land would have to be assessed on a case-by-case basis. One potential application of this digestate is as a fertiliser in cultivation of future macroalgal or marine microalgal crops, which are inherently tolerant to high-salinity conditions. However, this application requires further investigation.

4. Conclusions

Integration of hydrothermal carbonization (HTC) and anaerobic digestion (AD) allows for improvements in the energy conversion efficiency (ECE) of F. serratus, compared to AD alone. ECE was highest at the lowest HTC processing temperature (150 °C) and was similar between the use of seawater (84%) and distilled water (88%). However, hydrochars produced at lower temperatures possessed significant slagging and fouling risks. At HTC processing temperatures of 250 °C, ECE of F. serratus was higher when using distilled water (ECE = 78%), compared with seawater (ECE = 57%), due to higher hydrochar yields and improved biomethane yields from the process water. Higher processing temperatures improved the selective demineralization of alkali metals from the hydrochars, reducing slagging and fouling propensities. This is particularly important when treating biomass in seawater, due to the higher concentration of solubilised inorganics. Increased salinity of process water produced using seawater resulted in a moderate inhibition of the AD process compared to distilled water. However, significant yields of biomethane were generated. Generally, there is a compromise between favourable energetics of the system and the quality of the hydrochar for use in large-scale operations. Despite this, HTC processing of F. serratus in seawater generates hydrochar suitable for combustion, process water suitable for AD and a net energy-positive process (EROI = 1.53). Overall, this work demonstrates that seawater can be utilised as an effective HTC medium for the processing of seaweed.

Author Contributions

Conceptualisation, A.E.B., J.M.M.A., M.A.C.-V. and A.B.R.; methodology, A.E.B. and J.M.M.A.; validation, A.E.B., J.M.M.A., M.A.C.-V. and A.B.R.; formal analysis, A.E.B.; investigation, A.E.B.; resources, J.M.M.A., M.A.C.-V. and A.B.R.; data curation, A.E.B.; writing—original draft preparation, A.E.B.; writing—review and editing, A.E.B., J.M.M.A., M.A.C.-V. and A.B.R.; visualisation, A.E.B.; supervision, J.M.M.A., M.A.C.-V. and A.B.R.; project administration, M.A.C.-V. and A.B.R.; funding acquisition, M.A.C.-V. and A.B.R. All authors have read and agreed to the published version of the manuscript.

Funding

This research was funded by the Engineering and Physical Sciences Research Council (EPSRC) (grant numbers: EP/L014912/1 and EP/T517860/1).

Data Availability Statement

The original contributions presented in this study are included in the article. Further inquiries can be directed to the corresponding author.

Acknowledgments

The authors would like to thank Simon Lloyd, Adrian Cunliffe, Karine Alves Thorne, and David Elliott for their technical assistance in supporting laboratory work.

Conflicts of Interest

The authors declare no conflicts of interest.

Abbreviations

The following abbreviations are used in this manuscript:
ADAnaerobic digestion
CHPCombined heat and power
CODChemical oxygen demand
ECEEnergy conversion efficiency
EDEnergy densification
EIEnergy input
EOEnergy output
EROIEnergy return on investment
EYEnergy yield
FCFixed carbon
FSFucus serratus
GC-FIDGas chromatography–flame ionisation detector
HHVHigher heating value
HTCHydrothermal carbonisation
ICInorganic carbon
NH4+-NAmmonium nitrogen
TCTotal carbon
TGAThermogravimetric analysis
TOCTotal organic carbon
TNTotal nitrogen
TPTotal phenolics
TSTotal solids
VFAVolatile fatty acid
VMVolatile matter
VSVolatile solids
XRFX-ray fluorescence

Appendix A

Figure A1. Photograph of Fucus serratus (FS) macroalgae used in this study.
Energies 19 01699 g0a1

References

  1. Reza, M.T.; Andert, J.; Wirth, B.; Busch, D.; Pielert, J.; Lynam, J.G.; Mumme, J. Hydrothermal Carbonization of Biomass for Energy and Crop Production. Appl. Bioenergy 2014, 1, 11–29. [Google Scholar] [CrossRef]
  2. Nicolae, S.A.; Au, H.; Modugno, P.; Luo, H.; Szego, A.E.; Qiao, M.; Li, L.; Yin, W.; Heeres, H.J.; Berge, N.; et al. Recent Advances in Hydrothermal Carbonisation: From Tailored Carbon Materials and Biochemicals to Applications and Bioenergy. Green Chem. 2020, 22, 4747–4800. [Google Scholar] [CrossRef]
  3. Kruse, A.; Funke, A.; Titirici, M.M. Hydrothermal Conversion of Biomass to Fuels and Energetic Materials. Curr. Opin. Chem. Biol. 2013, 17, 515–521. [Google Scholar] [CrossRef] [PubMed]
  4. Wirth, B.; Mumme, J. Anaerobic Digestion of Waste Water from Hydrothermal Carbonization of Corn Silage. Appl. Bioenergy 2013, 1, 1–10. [Google Scholar] [CrossRef]
  5. Funke, A.; Ziegler, F. Hydrothermal Carbonization of Biomass: A Summary and Discussion of Chemical Mechanisms for Process Engineering. Biofuels Bioprod. Biorefining 2010, 4, 160–177. [Google Scholar] [CrossRef]
  6. Fang, J.; Zhan, L.; Ok, Y.S.; Gao, B. Minireview of Potential Applications of Hydrochar Derived from Hydrothermal Carbonization of Biomass. J. Ind. Eng. Chem. 2018, 57, 15–21. [Google Scholar] [CrossRef]
  7. Choe, U.; Mustafa, A.M.; Lin, H.; Xu, J.; Sheng, K. Effect of Bamboo Hydrochar on Anaerobic Digestion of Fish Processing Waste for Biogas Production. Bioresour. Technol. 2019, 283, 340–349. [Google Scholar] [CrossRef]
  8. Wang, F.; Wang, J.; Li, Z.; Zan, S.; Du, M. Promoting Anaerobic Digestion by Algae-Based Hydrochars in a Continuous Reactor. Bioresour. Technol. 2020, 318, 124201. [Google Scholar] [CrossRef]
  9. Torres, M.D.; Kraan, S.; Domínguez, H. Seaweed Biorefinery. Rev. Environ. Sci. Biotechnol. 2019, 18, 335–388. [Google Scholar] [CrossRef]
  10. Adams, J.M.M.; Morris, S.M.; Steege, L.; Robinson, J.; Bavington, C. Food-Grade Biorefinery Processing of Macroalgae at Scale: Considerations, Observations and Recommendations. J. Mar. Sci. Eng. 2021, 9, 1082. [Google Scholar] [CrossRef]
  11. Bruhn, A.; Dahl, J.; Nielsen, H.B.; Nikolaisen, L.; Rasmussen, M.B.; Markager, S.; Olesen, B.; Arias, C.; Jensen, P.D. Bioenergy Potential of Ulva lactuca: Biomass Yield, Methane Production and Combustion. Bioresour. Technol. 2011, 102, 2595–2604. [Google Scholar] [CrossRef] [PubMed]
  12. Smith, A.M.; Ross, A.B. Production of Bio-Coal, Bio-Methane and Fertilizer from Seaweed via Hydrothermal Carbonisation. Algal Res. 2016, 16, 1–11. [Google Scholar] [CrossRef]
  13. Kambo, H.S.; Dutta, A. A Comparative Review of Biochar and Hydrochar in Terms of Production, Physico-Chemical Properties and Applications. Renew. Sustain. Energy Rev. 2015, 45, 359–378. [Google Scholar] [CrossRef]
  14. Pauline, A.L.; Joseph, K. Hydrothermal Carbonization of Organic Wastes to Carbonaceous Solid Fuel—A Review of Mechanisms and Process Parameters. Fuel 2020, 279, 118472. [Google Scholar] [CrossRef]
  15. Soroush, S.; Ronsse, F.; Park, J.; Ghysels, S.; Wu, D.; Kim, K.W.; Heynderickx, P.M. Microwave Assisted and Conventional Hydrothermal Treatment of Waste Seaweed: Comparison of Hydrochar Properties and Energy Efficiency. Sci. Total Environ. 2023, 878, 163193. [Google Scholar] [CrossRef]
  16. Soroush, S.; Ronsse, F.; Park, J.; Heynderickx, P.M. Comparison Study on the Water-to-Biomass Ratio in Hydrothermal Carbonization of Fresh Seaweed. Processes 2023, 11, 1123. [Google Scholar] [CrossRef]
  17. Kantarli, İ.C.; Pala, M.; Yildirim, Y.; Yanik, J.; Abreu, M.H. Fuel Characteristics and Combustion Behavior of Seaweed-Derived Hydrochars. Turkish J. Chem. 2019, 43, 475–491. [Google Scholar] [CrossRef]
  18. Brown, A.E.; Finnerty, G.L.; Camargo-Valero, M.A.; Ross, A.B. Valorisation of Macroalgae via the Integration of Hydrothermal Carbonisation and Anaerobic Digestion. Bioresour. Technol. 2020, 312, 123539. [Google Scholar] [CrossRef]
  19. Wang, F.; Wang, J.; Gu, C.; Han, Y.; Zan, S.; Wu, S. Effects of Process Water Recirculation on Solid and Liquid Products from Hydrothermal Carbonization of Laminaria. Bioresour. Technol. 2019, 292, 121996. [Google Scholar] [CrossRef]
  20. Zhang, Y.; Hawboldt, K.; Macquarrie, S.; Thomas, R. Hydrothermal Valorization of Beach-Cast Brown Seaweed Ascophyllum nodosum into Bioactive Compounds and Hydrochar Using Severity Factor as a Design Tool. Chem. Eng. Sci. 2026, 319, 122301. [Google Scholar] [CrossRef]
  21. Hartulistiyoso, E.; Farobie, O.; Anis, L.A.; Syaftika, N.; Bayu, A.; Amrullah, A.; Moheimani, N.R.; Karnjanakom, S.; Matsumura, Y. Co-Production of Hydrochar and Bioactive Compounds from Ulva lactuca via a Hydrothermal Process. Carbon Resour. Convers. 2024, 7, 100183. [Google Scholar] [CrossRef]
  22. Güleç, F.; Samson, A.; Williams, O.; Kostas, E.T.; Lester, E. Biofuel Characteristics of Chars Produced from Rapeseed, Whitewood, and Seaweed via Thermal Conversion Technologies—Impacts of Feedstocks and Process Conditions. Fuel Process. Technol. 2022, 238, 107492. [Google Scholar] [CrossRef]
  23. Smith, A.M.; Singh, S.; Ross, A.B. Fate of Inorganic Material during Hydrothermal Carbonisation of Biomass: Influence of Feedstock on Combustion Behaviour of Hydrochar. Fuel 2016, 169, 135–145. [Google Scholar] [CrossRef]
  24. Danso-Boateng, E.; Fitzsimmons, M.; Ross, A.B.; Mariner, T. Response Surface Modelling of Methylene Blue Adsorption onto Seaweed, Coconut Shell and Oak Wood Hydrochars. Water 2023, 15, 977. [Google Scholar] [CrossRef]
  25. Soroush, S.; Ronsse, F.; Verberckmoes, A.; Verpoort, F.; Park, J.; Wu, D.; Heynderickx, P.M. Production of Solid Hydrochar from Waste Seaweed by Hydrothermal Carbonization: Effect of Process Variables. Biomass Convers. Biorefinery 2024, 14, 183–197. [Google Scholar] [CrossRef]
  26. Nizamuddin, S.; Baloch, H.A.; Gri, G.J.; Mubarak, N.M.; Bhutto, A.W.; Abro, R.; Mazari, S.A.; Ali, B.S. An Overview of Effect of Process Parameters on Hydrothermal Carbonization of Biomass. Renew. Sustain. Energy Rev. 2017, 73, 1289–1299. [Google Scholar] [CrossRef]
  27. Smith, A.M.; Ross, A.B. The Influence of Residence Time during Hydrothermal Carbonisation of Miscanthus on Bio-Coal Combustion Chemistry. Energies 2019, 12, 523. [Google Scholar] [CrossRef]
  28. Heidari, M.; Norouzi, O.; Salaudeen, S.; Acharya, B.; Dutta, A. Prediction of Hydrothermal Carbonization with Respect to the Biomass Components and Severity Factor. Energy Fuels 2019, 33, 9916–9924. [Google Scholar] [CrossRef]
  29. Marin-Batista, J.D.; Villamil, J.A.; Rodriguez, J.J.; Mohedano, A.F.; de la Rubia, M.A. Valorization of Microalgal Biomass by Hydrothermal Carbonization and Anaerobic Digestion. Bioresour. Technol. 2019, 274, 395–402. [Google Scholar] [CrossRef]
  30. Fletcher, H. Microwave Assisted Hydrothermal Extraction of Carbohydrates from Macroalgae and the Impact of Seasonal Variation. Ph.D. Thesis, University of Leeds, Leeds, UK, 2016. [Google Scholar]
  31. Angelidaki, I.; Treu, L.; Tsapekos, P.; Luo, G.; Campanaro, S.; Wenzel, H.; Kougias, P.G. Biogas Upgrading and Utilization: Current Status and Perspectives. Biotechnol. Adv. 2018, 36, 452–466. [Google Scholar] [CrossRef]
  32. Allen, E.; Wall, D.M.; Herrmann, C.; Xia, A.; Murphy, J.D. What Is the Gross Energy Yield of Third Generation Gaseous Biofuel Sourced from Seaweed? Energy 2015, 81, 352–360. [Google Scholar] [CrossRef]
  33. Heffernan, N.; Smyth, T.J.; Fitzgerald, R.J.; Brunton, N.P. Phenolic Content and Antioxidant Activity of Fractions Obtained from Selected Irish Macroalgae Species (Laminaria digitata, Fucus serratus, Gracilaria gracilis and Codium fragile). J. Appl. Phycol. 2015, 27, 519–530. [Google Scholar] [CrossRef]
  34. Rizwan, M.; Xia, A.; Murphy, J.D. Seasonal Variation of Chemical Composition and Biomethane Production from the Brown Seaweed Ascophyllum nodosum. Bioresour. Technol. 2016, 216, 219–226. [Google Scholar] [CrossRef] [PubMed]
  35. Brown, A.E.; Hammerton, J.M.; Camargo-valero, M.A.; Ross, A.B. Integration of Hydrothermal Carbonisation and Anaerobic Digestion for the Energy Valorisation of Grass. Energies 2022, 15, 3495. [Google Scholar] [CrossRef]
  36. Zhou, M.; Taiwo, K.; Wang, H.; Ntihuga, J.-N.; Angenent, L.T.; Usack, J.G. Anaerobic Digestion of Process Water from Hydrothermal Treatment Processes: A Review of Inhibitors and Detoxification Approaches. Bioresour. Bioprocess. 2024, 11, 47. [Google Scholar] [CrossRef]
  37. Salgado-Hernández, E.; Martínez-Hernández, S.; Balderas-caballero, I.D.J.; Alvarado-Vallejo, A.; Alvarado-Lassman, A. Anaerobic Digestion of Process Water Derived from Hydrothermal Carbonization of Pelagic sargassum: Influence of Inoculum Source and Microbial Community Dynamics. Biomass Bioenergy 2026, 207, 108732. [Google Scholar] [CrossRef]
  38. Black, W.A.P. Seasonal Variation in Chemical Composition of Some of the Littoral Seaweeds Common to Scotland. Part II. Fucus serratus, Fucus vesiculosus, Fucus spiralis and Pelvetia canaliculata. J. Soc. Chem. Ind. 1949, 68, 183–189. [Google Scholar] [CrossRef]
  39. Picone, A.; Volpe, M.; Messineo, A. Process Water Recirculation during Hydrothermal Carbonization of Waste Biomass: Current Knowledge and Challenges. Energies 2021, 14, 2962. [Google Scholar] [CrossRef]
  40. Iñiguez, M.E.; Conesa, J.A.; Fullana, A. Hydrothermal Carbonization (HTC) of Marine Plastic Debris. Fuel 2019, 257, 116033. [Google Scholar] [CrossRef]
  41. Polikovsky, M.; Gillis, A.; Steinbruch, E.; Robin, A.; Epstein, M.; Kribus, A.; Golberg, A. Biorefinery for the Co-Production of Protein, Hydrochar and Additional Co-Products from a Green Seaweed Ulva sp. with Subcritical Water Hydrolysis. Energy Convers. Manag. 2020, 225, 113380. [Google Scholar] [CrossRef]
  42. DD CEN/TS 15370-1:2006; Solid Biofuels. Method for the Determination of Ash Melting Behaviour - Characteristic Temperatures Method. British Standards Institution: Loughborough, UK, 2007.
  43. BS 6068-2.34:1988; Water Quality. Physical, Chemical and Biochemical Methods—Method for the Determination of the Chemical Oxygen Demand. The British Standards Institution (BSI): London, UK, 1988.
  44. Brown, A.E.; Adams, J.M.M.; Grasham, O.R.; Camargo-Valero, M.A.; Ross, A.B. An Assessment of Different Integration Strategies of Hydrothermal Carbonisation and Anaerobic Digestion of Water Hyacinth. Energies 2020, 13, 5983. [Google Scholar] [CrossRef]
  45. Hammerton, J.M.; Ross, A.B. Inorganic Salt Catalysed Hydrothermal Carbonisation (HTC) of Cellulose. Catalysts 2022, 12, 492. [Google Scholar] [CrossRef]
  46. Brown, E.; Colling, A.; Park, D.; Phillips, J.; Rothery, D.; Wright, J. Seawater: Its Composition, Properties, and Behaviour, 2nd ed.; Elsevier: London, UK, 1995. [Google Scholar]
  47. Xu, Z.X.; Shan, Y.Q.; Zhang, Z.; Deng, X.Q.; Yang, Y.; Luque, R.; Duan, P.G. Hydrothermal Carbonization of Sewage Sludge: Effect of Inorganic Salts on Hydrochar’s Physicochemical Properties. Green Chem. 2020, 22, 7010–7022. [Google Scholar] [CrossRef]
  48. Jiang, Z.; Yi, J.; Li, J.; He, T.; Hu, C. Promoting Effect of Sodium Chloride on the Solubilization and Depolymerization of Cellulose from Raw Biomass Materials in Water. ChemSusChem 2015, 8, 1901–1907. [Google Scholar] [CrossRef] [PubMed]
  49. Lynam, J.G.; Toufiq Reza, M.; Vasquez, V.R.; Coronella, C.J. Effect of Salt Addition on Hydrothermal Carbonization of Lignocellulosic Biomass. Fuel 2012, 99, 271–273. [Google Scholar] [CrossRef]
  50. Reza, M.T.; Lynam, J.G.; Uddin, M.H.; Coronella, C.J. Hydrothermal Carbonization: Fate of Inorganics. Biomass Bioenergy 2013, 49, 86–94. [Google Scholar] [CrossRef]
  51. Bharathiraja, B.; Sudharsanaa, T.; Bharghavi, A.; Jayamuthunagai, J.; Praveenkumar, R. Biohydrogen and Biogas—An Overview on Feedstocks and Enhancement Process. Fuel 2016, 185, 810–828. [Google Scholar] [CrossRef]
  52. Elbeshbishy, E.; Dhar, B.R.; Nakhla, G.; Lee, H.S. A Critical Review on Inhibition of Dark Biohydrogen Fermentation. Renew. Sustain. Energy Rev. 2017, 79, 656–668. [Google Scholar] [CrossRef]
  53. Monlau, F.; Sambusiti, C.; Barakat, A.; Quéméneur, M.; Trably, E.; Steyer, J.; Carrère, H. Do Furanic and Phenolic Compounds of Lignocellulosic and Algae Biomass Hydrolyzate Inhibit Anaerobic Mixed Cultures? A Comprehensive Review. Biotechnol. Adv. 2014, 32, 934–951. [Google Scholar] [CrossRef]
  54. Yenigün, O.; Demirel, B. Ammonia Inhibition in Anaerobic Digestion: A Review. Process Biochem. 2013, 48, 901–911. [Google Scholar] [CrossRef]
  55. Adams, J.M.M.; Schmidt, A.; Gallagher, J.A. The Impact of Sample Preparation of the Macroalgae Laminaria digitata on the Production of the Biofuels Bioethanol and Biomethane. J. Appl. Phycol. 2015, 27, 985–991. [Google Scholar] [CrossRef]
  56. Tabassum, M.R.; Xia, A.; Murphy, J.D. The Effect of Seasonal Variation on Biomethane Production from Seaweed and on Application as a Gaseous Transport Biofuel. Bioresour. Technol. 2016, 209, 213–219. [Google Scholar] [CrossRef] [PubMed]
  57. Marin-Batista, J.D.; Villamil, J.A.; Qaramaleki, S.V.; Coronella, C.J.; Mohedano, A.F.; de la Rubia, M.A. Energy Valorization of Cow Manure by Hydrothermal Carbonization and Anaerobic Digestion. Renew. Energy 2020, 160, 623–632. [Google Scholar] [CrossRef]
  58. Erdogan, E.; Atila, B.; Mumme, J.; Reza, M.T.; Toptas, A.; Elibol, M.; Yanik, J. Characterization of Products from Hydrothermal Carbonization of Orange Pomace Including Anaerobic Digestibility of Process Liquor. Bioresour. Technol. 2015, 196, 35–42. [Google Scholar] [CrossRef]
  59. Lucian, M.; Volpe, M.; Merzari, F.; Wüst, D.; Kruse, A.; Andreottola, G.; Fiori, L. Hydrothermal Carbonization Coupled with Anaerobic Digestion for the Valorization of the Organic Fraction of Municipal Solid Waste. Bioresour. Technol. 2020, 314, 123734. [Google Scholar] [CrossRef]
  60. Castello, D.; Rolli, B.; Kruse, A.; Fiori, L. Supercritical Water Gasification of Biomass in a Ceramic Reactor: Long-Time Batch Experiments. Energies 2017, 10, 1734. [Google Scholar] [CrossRef]
  61. van Der Berg, D.J.; Teke, G.M.; Görgens, J.F.; van Rensburg, E. Predicting Commercial-Scale Anaerobic Digestion Using Biomethane Potential. Renew. Energy 2024, 235, 121304. [Google Scholar] [CrossRef]
  62. Zhang, J.; Zhang, R.; He, Q.; Ji, B.; Wang, H.; Yang, K. Adaptation to Salinity: Response of Biogas Production and Microbial Communities in Anaerobic Digestion of Kitchen Waste to Salinity Stress. J. Biosci. Bioeng. 2020, 130, 173–178. [Google Scholar] [CrossRef]
  63. Wang, F.; Wang, J.; Li, Z.; Liu, M.; Wu, D. Fed-Batch Processing of Algae Hydrothermal Carbonization Process Water Improves Anaerobic Digestion and Digestate Nutrient Content. Biomass Bioenergy 2023, 170, 106729. [Google Scholar] [CrossRef]
  64. Natalio, A.I.M.; Back, M.; Richards, A.; Jeffery, S. Geoderma The Effects of Saline Toxicity and Food-Based AD Digestate on the Earthworm Allolobophora chlorotica. Geoderma 2021, 393, 115005. [Google Scholar] [CrossRef]
  65. Li, Y.; Qi, C.; Tang, Y.; Liu, B.; Bian, B.; Gao, L.; Fan, L.; Zhao, Z. New Model of Nutrient Utilization and Salt Regulation of Anaerobic Digestate from Food Waste. Desalination 2024, 578, 117447. [Google Scholar] [CrossRef]
Figure 1. Van Krevelen diagram for Fucus serratus and resultant hydrochars. H:C and O:C atomic ratios are presented on a dry ash-free basis. ▲ = untreated FS. ● = FS-SEA. ■ = FS-DIS.
Energies 19 01699 g001
Figure 2. Ash fusion transition temperatures of untreated Fucus serratus and hydrochars for (a) FS-SEA and (b) FS-DIS. The dotted line depicts the furnace temperature limit (1550 °C).
Energies 19 01699 g002
Figure 3. Experimental biomethane potential (BMP) of HTC process waters derived from (a) FS-SEA and (b) FS-DIS. Results are presented as average values with error bars representing the maximum and minimum measurements (n = 2).
Energies 19 01699 g003
Figure 4. Energetic output from hydrochar combustion, anaerobic digestion of process waters and the combined total for (a) FS-SEA and (b) FS-DIS. Calculated based on a starting material of 1 kg dried Fucus serratus. Filled black bars = energy output from hydrochar combustion. Grey-patterned bars = energy output from anaerobic digestion. Red markets = combined energy output. The percentages above the bars represent the energy conversion efficiency (ECE) of each processing condition.
Energies 19 01699 g004
Table 1. Composition of Fucus serratus and resultant hydrochars.
AnalysisFSFS-SEA-150FS-SEA-200FS-SEA-250FS-DIS-150FS-DIS-200FS-DIS-250
HC Yield (%)-40.9 ± 8.133.3 ± 5.021.9 ± 1.640.9 ± 0.534.0 ± 0.228.7 ± 0.8
VM (% db)57.0 ± 0.954.9 ± 0.250.1 ± 0.144.0 ± 0.2 58.9 ± 0.452.1 ± 0.2 48.0 ± 0.1
FC (% db)11.5 ± 0.821.3 ± 0.029.9 ± 0.035.9 ± 0.223.1 ± 0.133.3 ± 0.035.4 ± 0.1
Ash (% db)31.5 ± 1.723.8 ± 0.219.9 ± 0.120.1 ± 0.418.1 ± 0.514.6 ± 0.216.6 ± 0.1
C (% db)33.7 ± 0.241.0 ± 0.148.3 ± 0.155.1 ± 0.745.6 ± 0.352.4 ± 0.254.4 ± 0.0
H (% db)4.2 ± 0.25.8 ± 0.26.0 ± 0.24.4 ± 2.33.4 ± 0.12.6 ± 1.14.1 ± 0.1
N (% db)2.1 ± 0.02.5 ± 0.02.2 ± 0.02.4 ± 0.23.1 ± 0.02.9 ± 0.12.7 ± 0.1
S (% db)1.6 ± 0.41.2 ± 0.11.2 ± 0.00.9 ± 1.31.1 ± 0.0 1.1 ± 0.01.3 ± 0.0
O (% db)26.8 ± 0.021.7 ± 0.318.9 ± 0.115.5 ± 0.624.2 ± 0.321.3 ± 0.218.4 ± 0.4
HHV (MJ/kg db)12.618.221.522.216.017.621.0
ED-1.441.701.751.261.391.66
EY (%)-58.956.638.451.747.347.6
db = dry basis. HC = hydrochar. VM = volatile matter. FC = fixed carbon. HHV = higher heating value. ED = energy density. EY = energy yield. Average values are displayed ± one standard deviation, where applicable.
Table 2. Typical major elemental composition of seawater. Source: based on data from [46].
ElementConcentration (ppm)
Chlorine19,500
Sodium10,770
Magnesium1290
Sulphur905
Calcium412
Potassium380
Table 3. Inorganic concentration and inorganic removal efficiencies from hydrochars, compared to original Fucus serratus.
ElementFSFS-SEA-150FS-SEA-200FS-SEA-250FS-DIS-150FS-DIS-200FS-DIS-250
Inorganic Content (Weight% on a Dry Basis)
Na4.14.84.92.62.31.81.8
Mg0.81.01.01.50.60.51.1
P0.20.10.10.30.20.40.5
Cl6.67.89.04.93.83.23.2
K3.92.02.21.12.92.32.1
Ca1.81.11.02.31.41.71.9
Removal Efficiency of Inorganics, Compared to Untreated Fucus serratus (%)
Na-526086778587
Mg-536162727862
P-768664622320
Cl-515484768486
K-798194708085
Ca-748272696970
Table 4. Composition of HTC process waters.
AnalysisFS-SEA-150FS-SEA-200FS-SEA-250FS-DIS-150FS-DIS-200FS-DIS-250
PW Yield (%)58.1 ± 8.065.6 ± 4.776.4 ± 1.658.3 ± 0.865.2 ± 0.570.2 ± 1.1
COD (g/L)39.9 ± 0.230.6 ± 0.028.7 ± 0.239.2 ± 0.134.7 ± 0.5 35.1 ± 0.4
TOC (g/L)17.0 ± 0.013.1 ± 0.011.8 ± 0.015.6 ± 0.014.2 ± 0.013.8 ± 0.0
TS (g/L)76.5 ± 0.359.9 ± 0.153.1 ± 0.652.9 ± 0.144.8 ± 0.641.9 ± 0.9
VS (g/L)39.2 ± 0.224.3 ± 0.420.4 ± 0.433.6 ± 0.226.5 ± 0.124.9 ± 0.5
Ash (g/L)37.3 ± 0.435.6 ± 0.432.7 ± 0.719.3 ± 0.218.3 ± 0.617.0 ± 1.0
Na (g/L)9.9 ± 0.19.2 ± 0.18.7 ± 0.13.5 ± 0.03.4 ± 0.03.5 ± 0.0
K (g/L)3.3 ± 0.13.2 ± 0.02.9 ± 0.03.6 ± 0.03.5 ± 0.03.4 ± 0.0
Total VFAs (mg/L)333 ± 151458 ± 2772136 ± 30681 ± 41512 ± 3481394 ± 166
Total Phenols (mg/L)142 ± 10171 ± 3236 ± 8143 ± 1224 ± 5289 ± 6
TN (mg/L)561 ± 16672 ± 26662 ± 62593 ± 9753 ± 14763 ± 4
NH4+-N (mg/L)80 ± 2175 ± 2251 ± 1106 ± 1200 ± 2273 ± 6
NH4+-N (%TN)142638182636
pH4.3 ± 0.04.2 ± 0.06.3 ± 0.04.8 ± 0.04.8 ± 0.06.6 ± 0.0
PW = process water. COD = chemical oxygen demand. TOC = total organic carbon. TS = total solids. VS = volatile solids. Na = sodium. K = potassium. VFA = volatile fatty acids. TN = total nitrogen. NH4+-N = ammonium nitrogen. Average values are displayed ± one standard deviation, where applicable.
Table 5. Digestion kinetics of biomethane potential curves, produced by Fucus serratus HTC process waters.
ParameterFS-SEA-150FS-SEA-200FS-SEA-250FS-DIS-150FS-DIS-200FS-DIS-250
Biomethane Potential
BMP (mL CH4/g COD)200.0174.8168.4227.0216.2232.8
Modified Gompertz Model
Hm (mL CH4/g COD)201.3176.4170.0226.2216.1232.6
Rm (mL CH4/g COD)30.426.931.468.272.085.3
λ (d)0.00.00.40.00.10.6
R20.99080.98750.99310.99750.99860.9998
Peak Fermentation Time
Tm (d)2.42.42.41.21.21.6
Technical Digestion Time
T80 (d)676434
BMP = biomethane potential. Hm = maximum biomethane yield. Rm = peak biomethane production rate. λ = lag phase. Tm = peak time of biomethane production. T80 = technical digestion time.
Table 6. Digestion kinetics of biomethane potential curves, produced by HTC process waters.
SampleEnergy Input
(MJ/kg Dry FS)
Energy Output
(MJ/kg Dry FS)
EROI *
FS -3.63-
FS-SEA-1505.4410.314.21
FS-SEA-2007.619.062.65
FS-SEA-2509.796.721.53
FS-DIS-1505.449.854.02
FS-DIS-2007.618.832.58
FS-DIS-2509.799.192.09
* 55% assumed energy recovery efficiency [35]. EROI = energy return on energy investment.
Disclaimer/Publisher’s Note: The statements, opinions and data contained in all publications are solely those of the individual author(s) and contributor(s) and not of MDPI and/or the editor(s). MDPI and/or the editor(s) disclaim responsibility for any injury to people or property resulting from any ideas, methods, instructions or products referred to in the content.