Article

Spatiotemporal Characteristics and Driving Factors of the Energy Carbon Footprint and Vegetation Carbon Carrying Capacity in China

1
College of Materials and Environmental Engineering, Hangzhou Dianzi University, Hangzhou 310018, China
2
School of Automation, The Belt and Road Information Research Institute, Hangzhou Dianzi University, Hangzhou 310018, China
*
Author to whom correspondence should be addressed.
Energies 2026, 19(7), 1618; https://doi.org/10.3390/en19071618
Submission received: 11 February 2026 / Revised: 13 March 2026 / Accepted: 23 March 2026 / Published: 25 March 2026

Abstract

This study systematically quantified the carbon footprint generated by China’s consumption of eight major fossil energy sources (coal, coke, crude oil, petrol, kerosene, diesel, fuel oil, and natural gas), alongside the carbon carrying capacity of four vegetation ecosystems (forest, grassland, wetland, and crop), based on the IPCC inventory methodology. ArcGIS spatial analysis was employed to reveal the spatiotemporal distribution, while the STIRPAT model identified drivers of energy carbon footprint pressure (ECFP). Concurrently, the GM (1,1) model predicted evolution trends for both energy carbon footprint (ECF) and vegetation carbon carrying capacity. Results indicated that: (1) ECF increased from 12,039.89 million tons in 2015 to 13,896.41 million tons in 2022, representing a cumulative growth of 15.42%; (2) vegetation carbon carrying capacity increased from 4710.54 million tons in 2015 to 5300.76 million tons in 2022, representing a cumulative growth of 12.53%; (3) STIRPAT model analysis indicated that economic growth and technological progress were the dominant factors influencing ECFP; and (4) GM (1,1) predicted that the ECF would continue to grow at a slower pace by 2026, while vegetation carbon carrying capacity would steadily increase. It was concluded that optimizing the energy structure and strengthening vegetation conservation could effectively alleviate ECFP, providing crucial support for the carbon neutrality objectives of China.

1. Introduction

Under the backdrop of intensifying global climate change, phenomena such as frequent extreme weather events and glacial melt were posing severe threats to the sustainable development of human society [1]. According to the “2022 Global Carbon Emissions Report” issued by the International Energy Agency (IEA), global energy-related carbon dioxide emissions reached 36.8 billion tons, an increase of 321 million tons compared to 2021 [2]. Specifically, greenhouse gases from fossil fuel combustion accounted for 89% of total emissions, representing the primary driver of climate warming [3]. To control greenhouse gas emissions and mitigate global warming, the international community established a global carbon emissions constraint framework through the United Nations Framework Convention on Climate Change (UNFCCC) and the Paris Agreement. This framework encouraged the setting of emission reduction targets under the principle of common responsibilities, collectively curbing the growth trend of greenhouse gas emissions [4].
As the world’s largest developing country and carbon emitter, China exhibited significant characteristics in the carbon emission profile and carbon carrying capacity. The population grew from 1.38 billion in 2015 to 1.41 billion in 2022, with the vast demographic scale continuously driving substantial energy demand [5]. During this period, the annual consumption of fossil fuels such as coal, petrol, and diesel reached approximately 4.07 billion tons, 1.28 billion tons, and 1.59 billion tons, respectively [6]. Concurrently, China’s complex topography featured a terraced terrain extending from west to east, giving rise to diverse climatic zones and ecological types. Between 2015 and 2022, China’s forest and grassland areas remained stable with average annual forest coverage of approximately 2.7198 million square kilometers and grassland coverage of 2.4473 million square kilometers, collectively forming the primary carbon sink capacity of China’s vegetation ecosystems [7]. In recent years, China further enhanced its ecosystem carbon carrying capacity through strengthened vegetation protection policies [8]. This dual context of energy consumption and ecological conservation not only highlighted the unique nature of China’s “dual carbon” objectives, but also provided a crucial empirical grounding exploration of the dynamic relationship between energy carbon footprint (ECF) and vegetation carbon carrying capacity [9].
Regarding energy consumption and emissions structure, data from China’s National Bureau of Statistics and Ministry of Ecology and Environment indicated that its energy-related carbon footprint accounted for approximately 90% of the nation’s total carbon emissions in 2022 [10]. Eight energy sources—coal, coke, crude oil, petrol, kerosene, diesel, fuel oil, and natural gas—constituted the primary emission sources [11]. Coal, as a foundational energy source, contributed over 60% of energy-related carbon emissions throughout the entire lifecycle, encompassing extraction, transportation, conversion, and utilization [12]. Coke production, notably through coke oven heating and raw material pre-treatment, released CO2 emissions accounting for approximately 10% of total industrial carbon emissions [13]. The extensive use of crude oil and its derivatives in transport and industrial sectors resulted in continuous growth of carbon emissions across the entire petroleum supply chain. Even relatively clean natural gas achieved a significant increase in carbon emissions with the rapidly expanding consumption scale [14].
China demonstrated a high carbon emission pattern dominated by fossil fuels such as coal for energy consumption, while the carbon sink capacity was constrained by factors including wetland reduction, grassland degradation, and the conversion of farmland into carbon sources [15]. This structural contradiction of “high emissions coupled with weak carbon sinks” intensified pressure for carbon reduction, as the imbalance between carbon supply and demand became increasingly pronounced [16]. Therefore, systematically analyzing the carbon emission characteristics of eight major energy sources at national and provincial scales, precisely quantifying the carbon sink potential of four major vegetation systems (forest, grassland, wetland, and crop), and dynamically tracking the evolution patterns of ECF structures and vegetation carbon carrying capacity were not only prerequisites for understanding China’s carbon balance framework, but were also crucial foundations for formulating differentiated regional emission reduction and carbon sink enhancement policies, thereby advancing the steady realization of the dual carbon goals [17].
The primary methodologies for carbon footprint accounting included Life Cycle Assessment (LCA) [18], Input–Output Assessment (IOA) [19], Hybrid Life Cycle Assessment (HLCA), and the IPCC inventory approach based on Intergovernmental Panel on Climate Change guidelines [20]. LCA enabled the systematic assessment of a product’s environmental impacts throughout the entire lifecycle, from raw material extraction to end-of-life disposal. However, the extensive boundaries and substantial data requirements often posed challenges of data scarcity and computational complexity when applied at macro-regional scales. IOA utilized economic input–output tables to map inter-industry relationships, allowing for the macro-level estimation of sectoral-embedded carbon emissions. Yet, it struggled to precisely identify emission characteristics at specific activity or process stages. HLCA combined the strengths of LCA and IOA, reducing truncation errors and enabling a more comprehensive evaluation of product lifecycle carbon emissions, though the model construction was complex and parameter acquisition was difficult. By contrast, the “2019 Revised 2006 IPCC Guidelines for National Greenhouse Gas Inventories” provided a mature and highly compatible accounting framework [21]. Its emission factor system and calculation formulas were relatively standardized and unified, facilitating integration with official energy statistics and land use data. Despite inherent uncertainties, this methodology objectively reflected emission levels from various sources and the carbon carrying capacity of vegetation at the macro scale. Its core logic established a correspondence between specific energy consumption and corresponding carbon emissions through predetermined emission factors, providing a standardized and highly comparable technical pathway for quantifying ECF and vegetation carbon carrying capacities.
The energy carbon footprint served as a core indicator for assessing the impact of human activities on the climate system, reflecting both the direct and indirect carbon pressures associated with fossil energy consumption. Concurrently, vegetation ecosystems fulfilled a critical carbon sink function by absorbing and fixing atmospheric carbon dioxide through photosynthesis. Integrating these two dimensions into a unified analytical framework enabled a comprehensive depiction of the dual pressure pattern shaped by carbon emissions and carbon sequestration. Nevertheless, several limitations persisted in existing studies. Firstly, the research perspective remained incomplete. Most studies focused solely on carbon emissions, without effectively integrating carbon carrying capacity into a composite pressure index at the provincial level [22,23]. As a result, they failed to capture the true balance of regional carbon budgets. Secondly, the spatial scope was constrained. Current analyses were either conducted at the national aggregate level or confined to individual provinces [24,25]. Systematic interprovincial comparisons—particularly in the context of the recent acceleration in energy transition—remained lacking, limiting insights into regional heterogeneity and the contribution to the national carbon balance. Thirdly, there was insufficient integration of driving factors in analytical frameworks [26]. Although the influences of population size, economic growth, and technological progress on carbon pressure were widely examined [27], the combined effects of energy structure and ecological intensity were not quantitatively assessed within a cohesive framework [28].
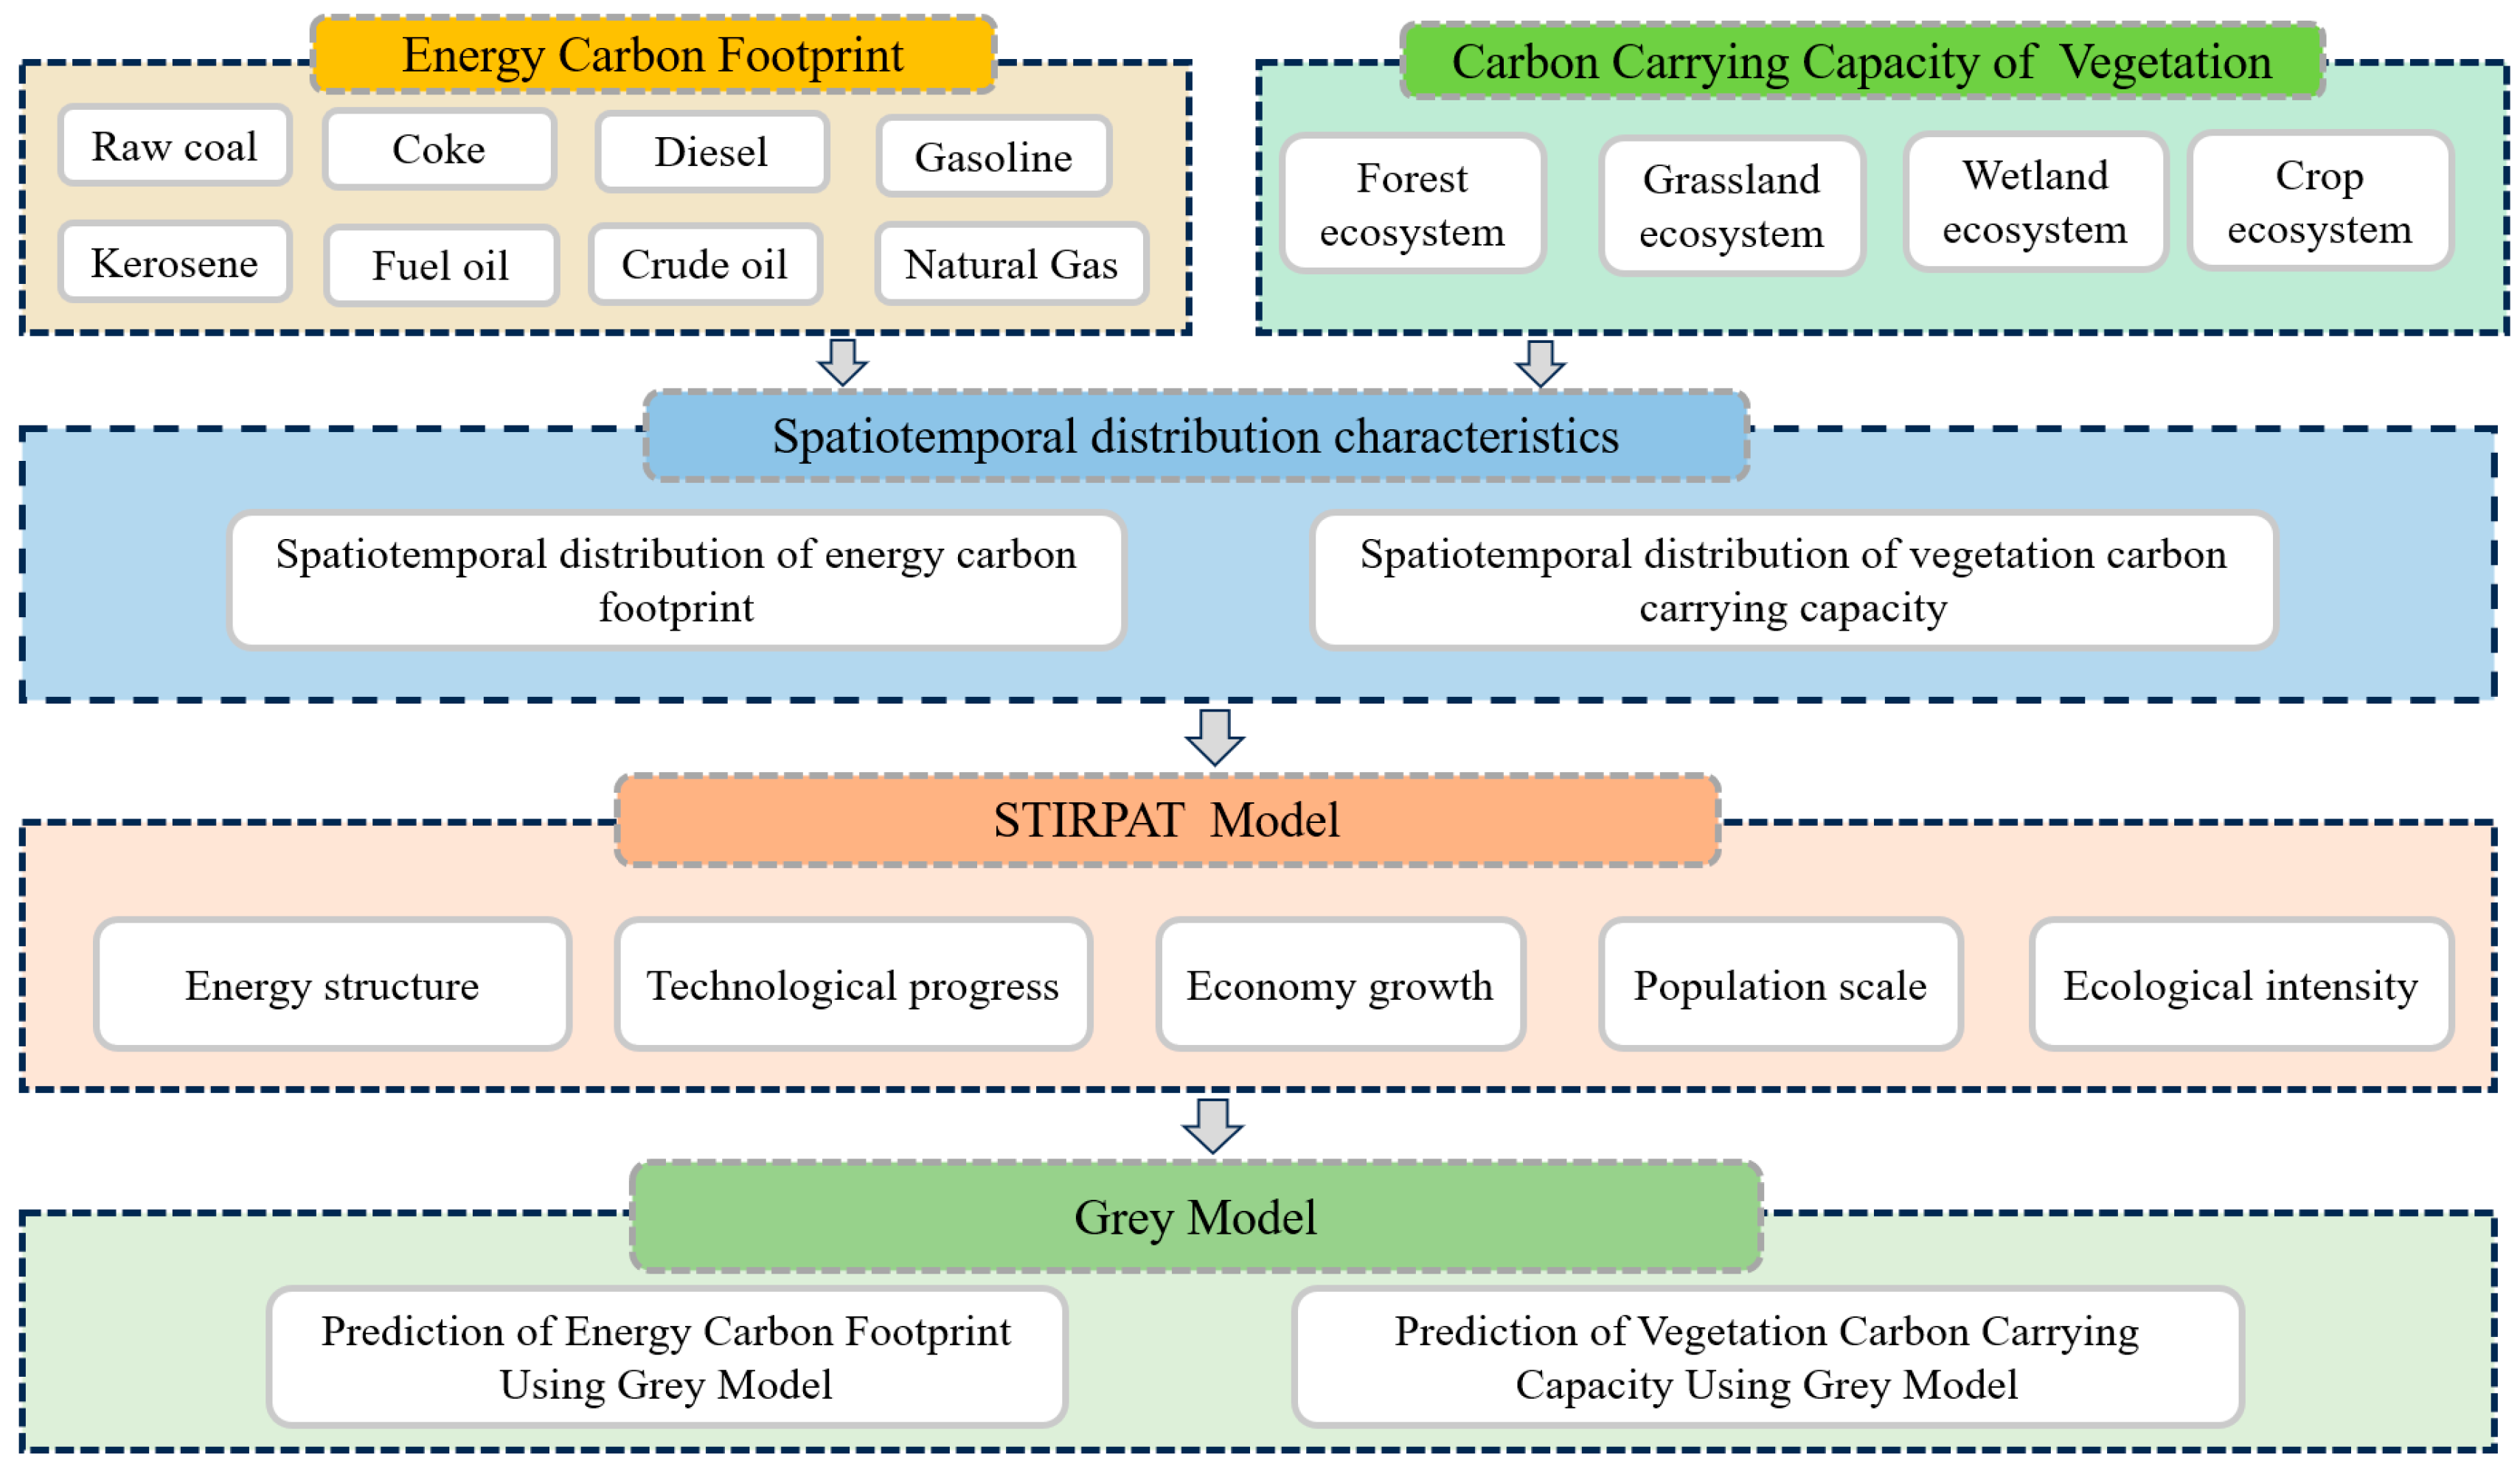
Therefore, this study systematically investigated the spatiotemporal evolution of ECF and vegetation carbon carrying capacity at the national and provincial levels in China, and the overall technical framework is illustrated in Figure 1. The main contributions were as follows: (1) A comprehensive assessment framework encompassing the carbon footprint of eight fossil energy sources and the carbon carrying capacity of four vegetation systems was constructed. Using the IPCC inventory methodology, we uniformly calculated the provincial-level ECF and vegetation carbon carrying capacity of China from 2015 to 2022. The temporal evolution and spatial distribution were revealed, providing a foundational basis for regionally differentiated analysis. (2) Based on the classical IPAT framework, we introduced the variables of energy structure and ecological intensity to extend the STIRPAT model. The driving or inhibiting effects of factors such as energy structure, technological progress, economic growth effect, population scale regulation, and ecological intensity on ECFP were quantitatively analyzed, thereby clarifying the influence of the key driving factors. (3) The grey model GM (1,1) was used to forecast provincial ECF and vegetation carbon carrying capacity for 2024 and 2026. This enabled the calculation of net carbon footprint (NCF) and the exploration of synergistic optimization pathways for “emission reduction and carbon sink enhancement”, providing quantitative evidence and decision-making references for formulating scientifically sound and operationally feasible national and provincial “dual carbon” policies.

2. Materials and Methods

2.1. Study Area

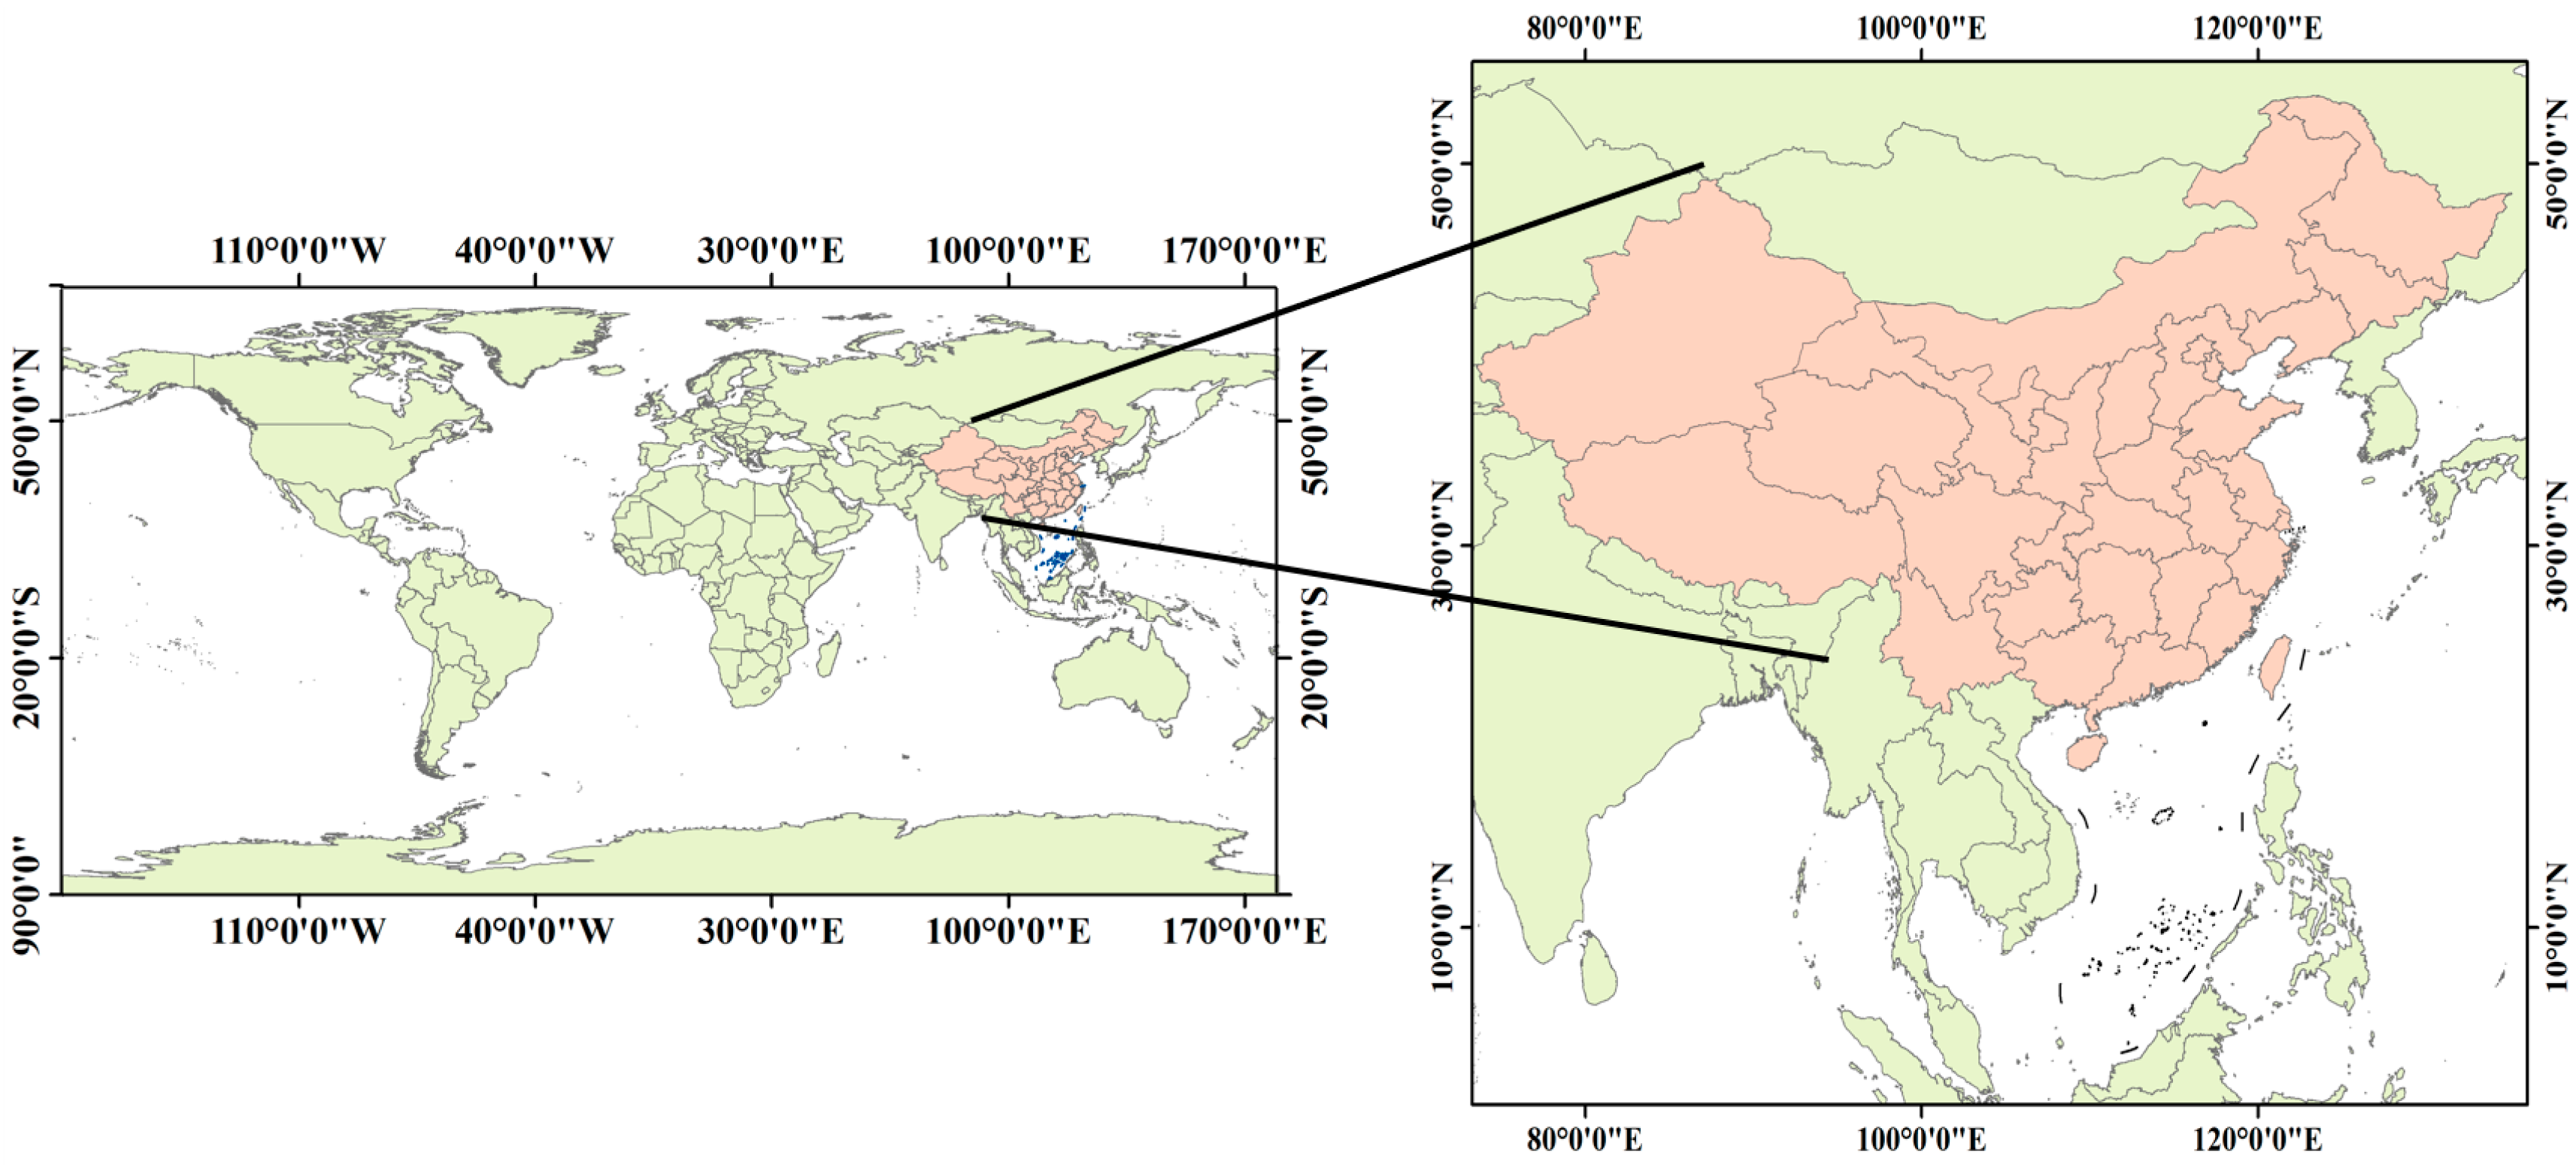
China is located in eastern Asia, on the western shore of the Pacific Ocean, spanning approximately from 3°31′ N to 53°33′ N in latitude and between 73°30′ E and 135°02′ E in longitude, with a total land area of about 9.6 million square kilometers (Figure 2). It comprises 34 provincial-level administrative divisions (including 23 provinces, five autonomous regions, four municipalities directly under the central government, and two special administrative regions). This study mainly focused on 30 provinces (autonomous regions and municipalities) in mainland China and systematically examined the characteristics of ECF and vegetation carbon carrying capacity. Due to statistical gaps in energy data for several remote areas of the Tibet Autonomous Region, and significant differences in statistical standards, and policy frameworks between the Hong Kong and Macao special administrative regions and the Taiwan region compared to mainland China, these areas were excluded from this study to ensure data consistency and the scientific validity of the conclusions.

2.2. Data Sources

This study covered fossil energy consumption, gross domestic product (GDP), and population size from 2015 to 2022. The data were obtained from the “China Energy Statistical Yearbook” and the “China Statistical Yearbook”. Eight major fossil energy types were selected as accounting objects, including coal, coke, crude oil, gasoline, kerosene, diesel, fuel oil, and natural gas.
The vegetation carbon carrying capacity defined in this study encompassed four major ecosystem types: forest, grassland, wetland, and crop. Data on the areas of forest, grassland, and wetland, as well as crop production, were sourced from the “China Environment Statistical Yearbook” and provincial-level statistical records. For a limited number of years or regions with missing data, the interpolation method was applied to supplement the dataset (forestland, grassland, and wetland areas in China for 2018), thereby ensuring the continuity and integrity of the data series.

2.3. ECF Model

The ECF refers to the total amount of carbon dioxide emissions generated by human social and economic activities as a result of energy consumption [29]. In this study, the ECF was quantitatively estimated using the IPCC emission factor method [30]. Specifically, carbon emissions from different energy types were calculated by multiplying the actual energy consumption (i.e., activity data) by the corresponding carbon emission factor. This method enabled a straightforward and reliable estimation of carbon emissions from individual energy sources and provided a solid basis for aggregating total energy-related carbon emissions. The specific calculation is expressed as follows:
ECF   =   i n AD i   ×   EF i ,
where AD i represents the activity level of the i-th energy type (TJ), reflecting the scale of energy consumption induced by human socioeconomic activities, and EF i is the carbon emission factor of the i-th energy type (104 t/TJ), which indicates the amount of carbon dioxide emitted per unit of energy consumed. The activity level characterized the actual intensity of energy consumption, whereas the emission factor reflected the carbon emission characteristics of different energy types. These parameters determined the carbon emissions of individual energy sources. The specific calculation formulas are given as follows:
AD i   =   i n EC i   ×   NCV i ,
EF i = i n CEF i   ×   COR i   ×   44 12 ,
where EC i denotes the consumption of the i-th energy type (104 t); NCV i represents the average net calorific value of the i-th fossil fuel; CEF i refers to the carbon emission coefficient of the i-th fossil fuel; and COR i is the carbon oxidation rate of the i-th fossil fuel. In Equation (3), 44 and 12 correspond to the molecular weights of CO2 and C, respectively. The values of NCV i , CEF i and COR i for the eight energy types were adopted from the “2019 Revised 2006 IPCC Guidelines for National Greenhouse Gas Inventories” [21] and are presented in Table 1.

2.4. Vegetation Carbon Carrying Capacity Model

The accurate assessment of the carbon carrying capacity of vegetation ecosystems was essential for evaluating regional carbon sequestration potential and coordinating economic development with carbon reduction objectives. This study constructed a vegetation carbon carrying capacity accounting framework comprising four ecosystem types: forest, grassland, wetland, and crop.
For ecosystems of forest, grassland, and wetland, net ecosystem production (NEP) was employed as the core indicator to quantify the carbon carrying capacity [31]. NEP represented the net annual carbon exchange between vegetation and the atmosphere per unit area (1 hm2), and the magnitude directly reflected whether an ecosystem functions as a carbon sink or a carbon source.
Given the short growth cycle and pronounced seasonality of crop ecosystems, the carbon carrying capacity was estimated using the biomass-based approach. Specifically, carbon sequestration by crops was calculated based on the yields of major crops and the corresponding carbon content coefficients.

2.4.1. Forest Carbon Carrying Capacity Model

As the dominant carbon pool in vegetation ecosystems, forests played a crucial role in regional carbon sequestration. The carbon carrying capacity of forests was estimated using the NEP model and is expressed as follows:
C f   =     F f   ×   NEP f   ×   44 12 ,
where C f denotes forest carbon carrying capacity;   F f represents forest area (hm2); and NEP f is the average NEP of forests (tC·hm−2), which is the total annual carbon absorbed per hectare of forest.
The N E P f comprehensively considered carbon exchange processes (including forest vegetation growth, litter decomposition, and soil respiration) and was set to 3.8095 tC·hm−2 [32]. The factor 44/12 represented the molecular weight ratio of CO2 to C, serving as the conversion factor.

2.4.2. Grassland Carbon Carrying Capacity Model

The carbon carrying capacity of grassland was estimated based on NEP, and the calculation formula is expressed as follows:
C g   =   F g   ×   NEP g   ×   44 12 ,
where C g denotes the grassland carbon carrying capacity (104 t);   F g represents grassland area (hm2); and NEP g is the average NEP of grassland, indicating the total annual amount of carbon absorbed per hectare of grassland.
The NEP g reflected the carbon balance of grassland between photosynthesis and respiration and was set to 0.9482 tC·hm−2 [33]. The factor 44/12 represented the molecular weight ratio of CO2 to C and was used as the conversion coefficient.

2.4.3. Wetland Carbon Carrying Capacity Model

Due to its unique hydrological conditions and biodiversity, wetland played an important role in carbon storage. The carbon carrying capacity of wetland is calculated as follows:
C w   =   F w   ×   NEP w   ×   44 12 ,
where C w denotes wetland carbon carrying capacity (104 t);   F w represents wetland area (hm2); and NEP w is the average NEP of wetland (tC·hm−2), indicating the total annual carbon absorbed per hectare of wetland.
The value of NEP w was set at 2.725 tC·hm−2 [34]. The factor 44/12 represented the molecular weight ratio of CO2 to C and served as the conversion coefficient.

2.4.4. Crop Carbon Carrying Capacity Model

Considering the short growth cycles of crops and the removal of carbon after harvest, the carbon carrying capacity of crops was estimated using a biomass-based method. The calculation is expressed as follows:
C p   =   λ   ×   γ   ×   44 12   ×   P i Y i ,
where C p denotes the carbon carrying capacity of crops (104 t); λ is a correction coefficient for post-harvest carbon removal and is set to 0.05; γ is a coefficient correcting the conversion from biomass to carbon and is set to 0.5 [35]; P i represents the yield of the i-th crop (t); and Y i is the economic coefficient of the i-th crop, defined as the ratio of economic yield to total biomass.
Eight major crops were considered in this study: rice, wheat, maize, other cereals, soybean, cotton, oil crops, and sugar crops. The respective economic coefficients are summarized in Table 2 [36].

2.4.5. Calculation of Vegetation Carbon Carrying Capacity

The total vegetation carbon carrying capacity was derived from the sum of the capacities of four ecosystem types: forest, grassland, wetland, and crop. It could be expressed as follows:
C   =   C f   +   C g   +   C w   +   C p ,
where C denotes the total vegetation carbon carrying capacity (104 t).

2.5. ECFP and Driving Factor Analysis

2.5.1. Calculation of ECFP and NCF

ECFP was defined as the ratio of ECF to vegetation carbon carrying capacity. The calculation of ECFP is expressed as follows.
ECFP = ECF C ,
In addition, the NCF was used to reflect carbon surplus or deficit, which is calculated as follows.
NCF = ECF C ,

2.5.2. STIRPAT Models

The IPAT framework was widely used to assess the impact of human activities on the natural environment [37]. It could be expressed as follows:
I   =   P   ×   A   ×   T ,
where I denotes the environmental impact; P represents population size; A indicates affluence; and T reflects technology level.
The IPAT model assumed a fixed proportional relationship among variables, which made it difficult to capture the nonlinear characteristics of complex systems. Thus, this study employed the STIRPAT model to further investigate the underlying drivers of changes in China’s ECFP [38]. The STIRPAT model extended the IPAT framework into a stochastic log-linear regression form, allowing for the flexible estimation of the elasticity of each factor with respect to environmental pressure [39]. The STIRPAT model could be expressed as follows:
lnI   =   a   +   blnP   +   clnA   +   dlnT   +   ε i ,
where ln denotes the natural logarithm; a is the intercept; b, c, and d are the elasticity coefficients of population, affluence, and technology, respectively; and ε i reflects the error term.
The STIRPAT model allowed for the inclusion of additional influencing factors to analyze the impact on ECFP. The regression coefficients captured the proportional relationship between each factor and ECFP [40]. To further investigate the determinants of China’s ECFP, this study extended the conventional STIRPAT framework by incorporating energy structure and ecological intensity as additional explanatory variables. The detailed definitions of different variables are provided in Table 3 and the improved model is specified as follows.
lnECFP = a 1 + blnE + clnT + dlnA + flnP + glnS + lne ,

2.6. GM (1,1) Model

The GM (1,1) model is a univariate first-order differential grey prediction model widely applied in forecasting analysis. This model was particularly suitable for situations with small sample sizes, incomplete information, and high system uncertainty [41]. Based on the original data sequence, GM (1,1) performed a first-order-accumulated generating operation (1-AGO) to transform the randomly fluctuating sequence into a smooth and monotonic series. A first-order linear differential equation was then constructed based on the transformed sequence. The original data series was subsequently restored through the inverse-accumulated generating operation (1-IAGO) to obtain forecasts of the original sequence. Finally, the GM (1,1) model could effectively predict the future development trend of the studied system.

2.6.1. The Original Non-Negative Sequence

X ( 0 ) = { x ( 0 ) ( 1 ) ,   x ( 0 )   ( 2 ) , , x ( 0 )   ( n ) , } ,
A new sequence was obtained through the first-order-accumulated generating operation (1-AGO).
X ( 1 ) = { x ( 1 ) ( 1 )   ,   x ( 1 )   ( 2 )   , , x ( 1 )   ( n ) , } ,
X 1 ( k ) = i = 1 k x 1 ( i ) ,
Then, a first-order linear differential equation was constructed as follows:
dx 1 dt + ax 1   =   b ,
where a reflects the development coefficient and b is the grey input. The parameters a and b were estimated using the least squares method. The time response function of the model is given as follows.
x ^ 1 k = x 0 1 b a e a ( k 1 ) + b a ,
By applying the inverse-accumulated generating operation (IAGO) to x ^ 1 , the predicted values of the original sequence x ^ 0 k could be obtained. In this study, the GM (1,1) model was applied to forecast the trends of ECF and vegetation carbon carrying capacity for 2024 and 2026.

2.6.2. Model Accuracy Assessment

To evaluate the predictive accuracy of the GM (1,1) model, this study conducted residual analysis and calculated the posterior error ratio (C) and the small error probability (P). The residual was defined as the difference between the observed value and the predicted value:
ε k   =   x 0 k     x ^ 0 k ,
where x 0 k represents the observed value and x ^ 0 k denotes the predicted value.
The posterior error ratio was defined as follows:
C   =   S 2 S 1 ,
where S 1 and S 2 denote the standard deviations of the original sequence and the residual sequence, respectively. The small error probability was calculated as follows:
P   =   number   of   residuals   | ε k   ε ¯ |   <   0.6745 S 1 n ,
where ε k is the residual at step k, ε ¯ represents the mean of the residuals, S 1 refers to the standard deviation of the original sequence, and n is the total number of observations.
According to traditional grey system theory, level-one accuracy is achieved when C ≤ 0.35 and P ≥ 0.95 [42]. However, the criteria were stringent and suited for stationary, monotonic, exponential-type time series. In this study, the sequences of ECF and vegetation carbon carrying capacity exhibited significant volatility due to energy structure adjustments, industrial fluctuations, and ecological changes. Consequently, a relaxed posterior error assessment standard, following common practice in energy, environmental, and economic forecasting (e.g., population prediction, resource consumption forecasting, and green finance–environmental co-prediction) [43], was adopted to accommodate the inherent variability of the data (Table 4).

3. Results

3.1. Temporal Evolution and Spatial Distribution of ECF

3.1.1. Temporal Evolution of ECF

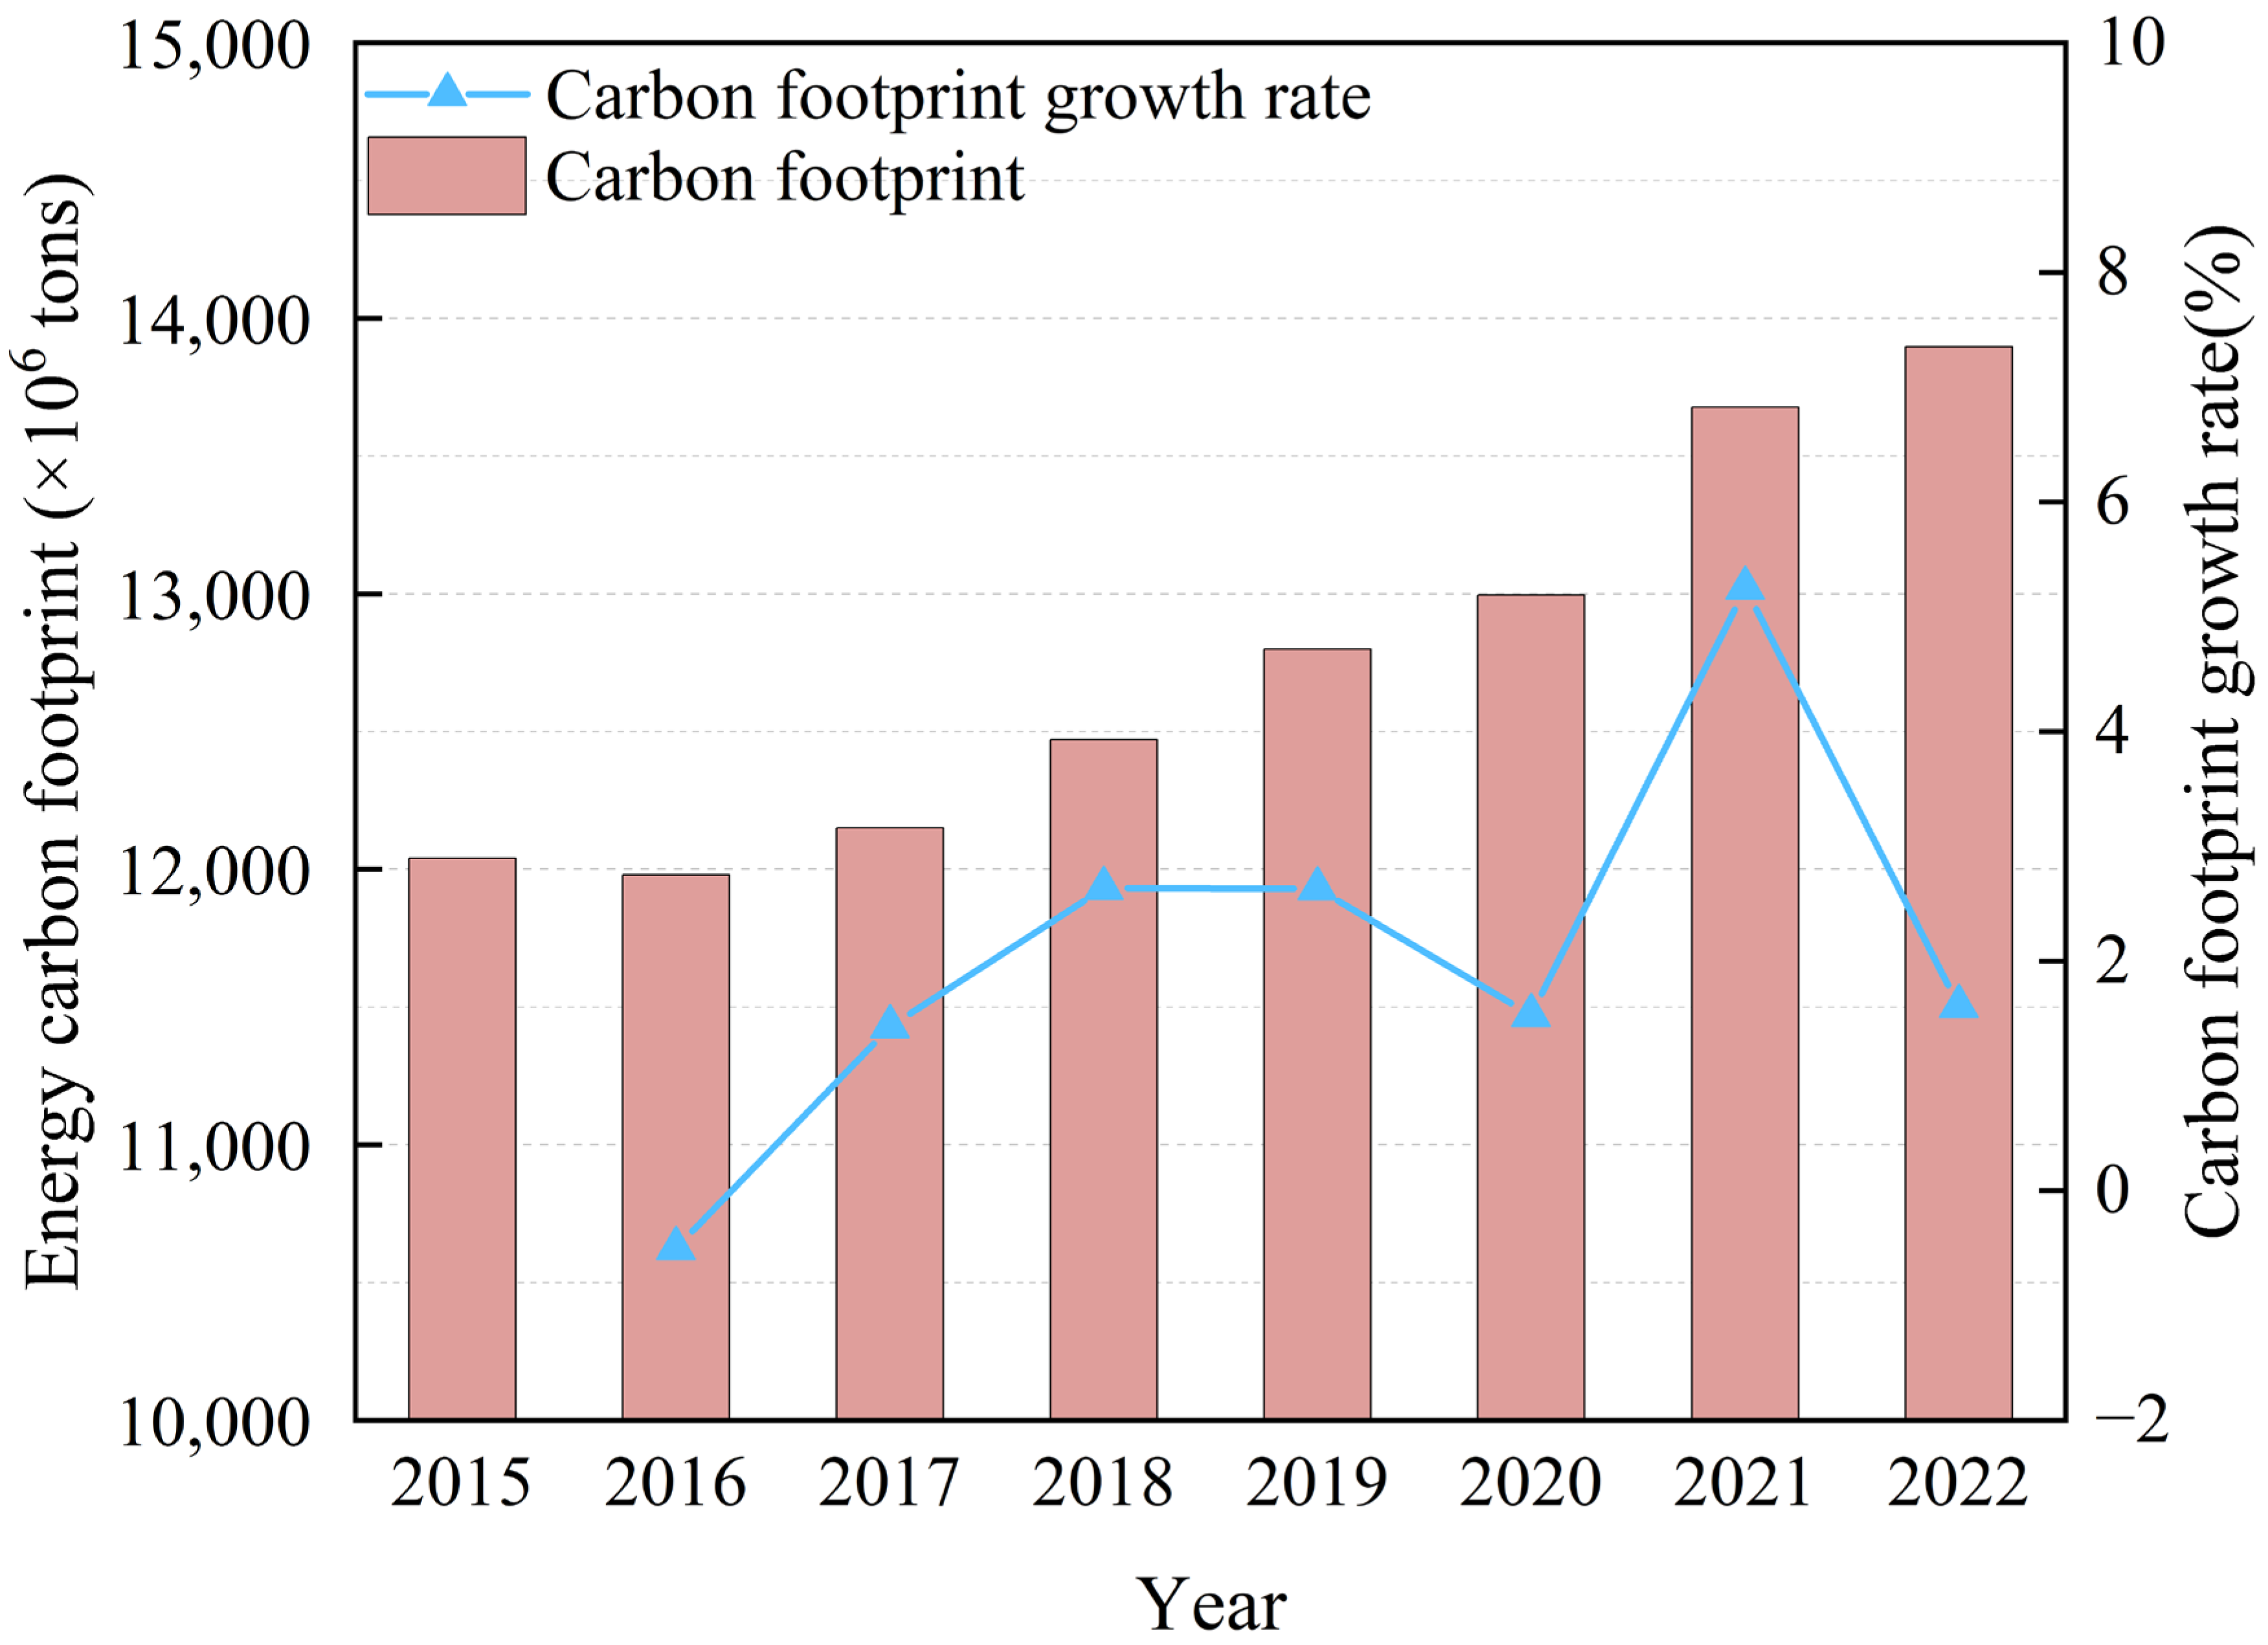
As shown in Figure 3, the ECF of China increased from 12,039.88 million tons in 2015 to 13,896.41 million tons in 2022, representing a cumulative growth of 15.42%. However, the growth of ECF displayed clear stage-specific characteristics from 2015 to 2022. In 2016, the ECF declined by 60.43 million tons compared with 2015, marking the only year of negative growth during the study period. This decrease was closely associated with the implementation of “Opinions on Resolving Excess Capacity in Coal Industry” issued by the State Council in 2016. The share of natural gas consumption increased by approximately 1.3%, while the proportion of coal consumption declined by about 1.6%, leading to a reduction in the carbon intensity of energy consumption.
From 2017 to 2019, the ECF entered a phase of steady growth with an average annual growth rate of 2.67% and an average annual increase of 324.17 million tons. Driven by the “Expansion of Transportation Infrastructure and Promotion of New Energy Vehicles” policy issued by the State Council in 2017, energy demand from industrial production and transportation continued to rise steadily, thereby driving a sustained increase in the ECF.
From 2020 to 2022, the ECF exhibited a pattern characterized by “pandemic shock-rapid rebound-moderate slowdown.” In 2020, the outbreak of COVID-19 led to widespread industrial shutdowns and a sharp decline in transportation activities, causing the ECF growth rate fall to 1.53%. In 2021, energy demand rebounded rapidly with economic recovery and the implementation of growth-stabilizing policies, resulting in an increase of 5.25% and an absolute increment of 682.06 million tons. In 2022, the growth rate of the ECF became moderated under the influence of normalized pandemic control measures and ongoing industrial structure adjustment, returning to a relatively mild growth trajectory. Overall, the ECF of China continued to increase from 2015 to 2022, but the growth rate exhibited notable fluctuations, reflecting the combined influences of macroeconomic cycles, energy structure optimization, and unexpected public health events.

3.1.2. Dynamic Changes in ECF and Proportional Structure Analysis

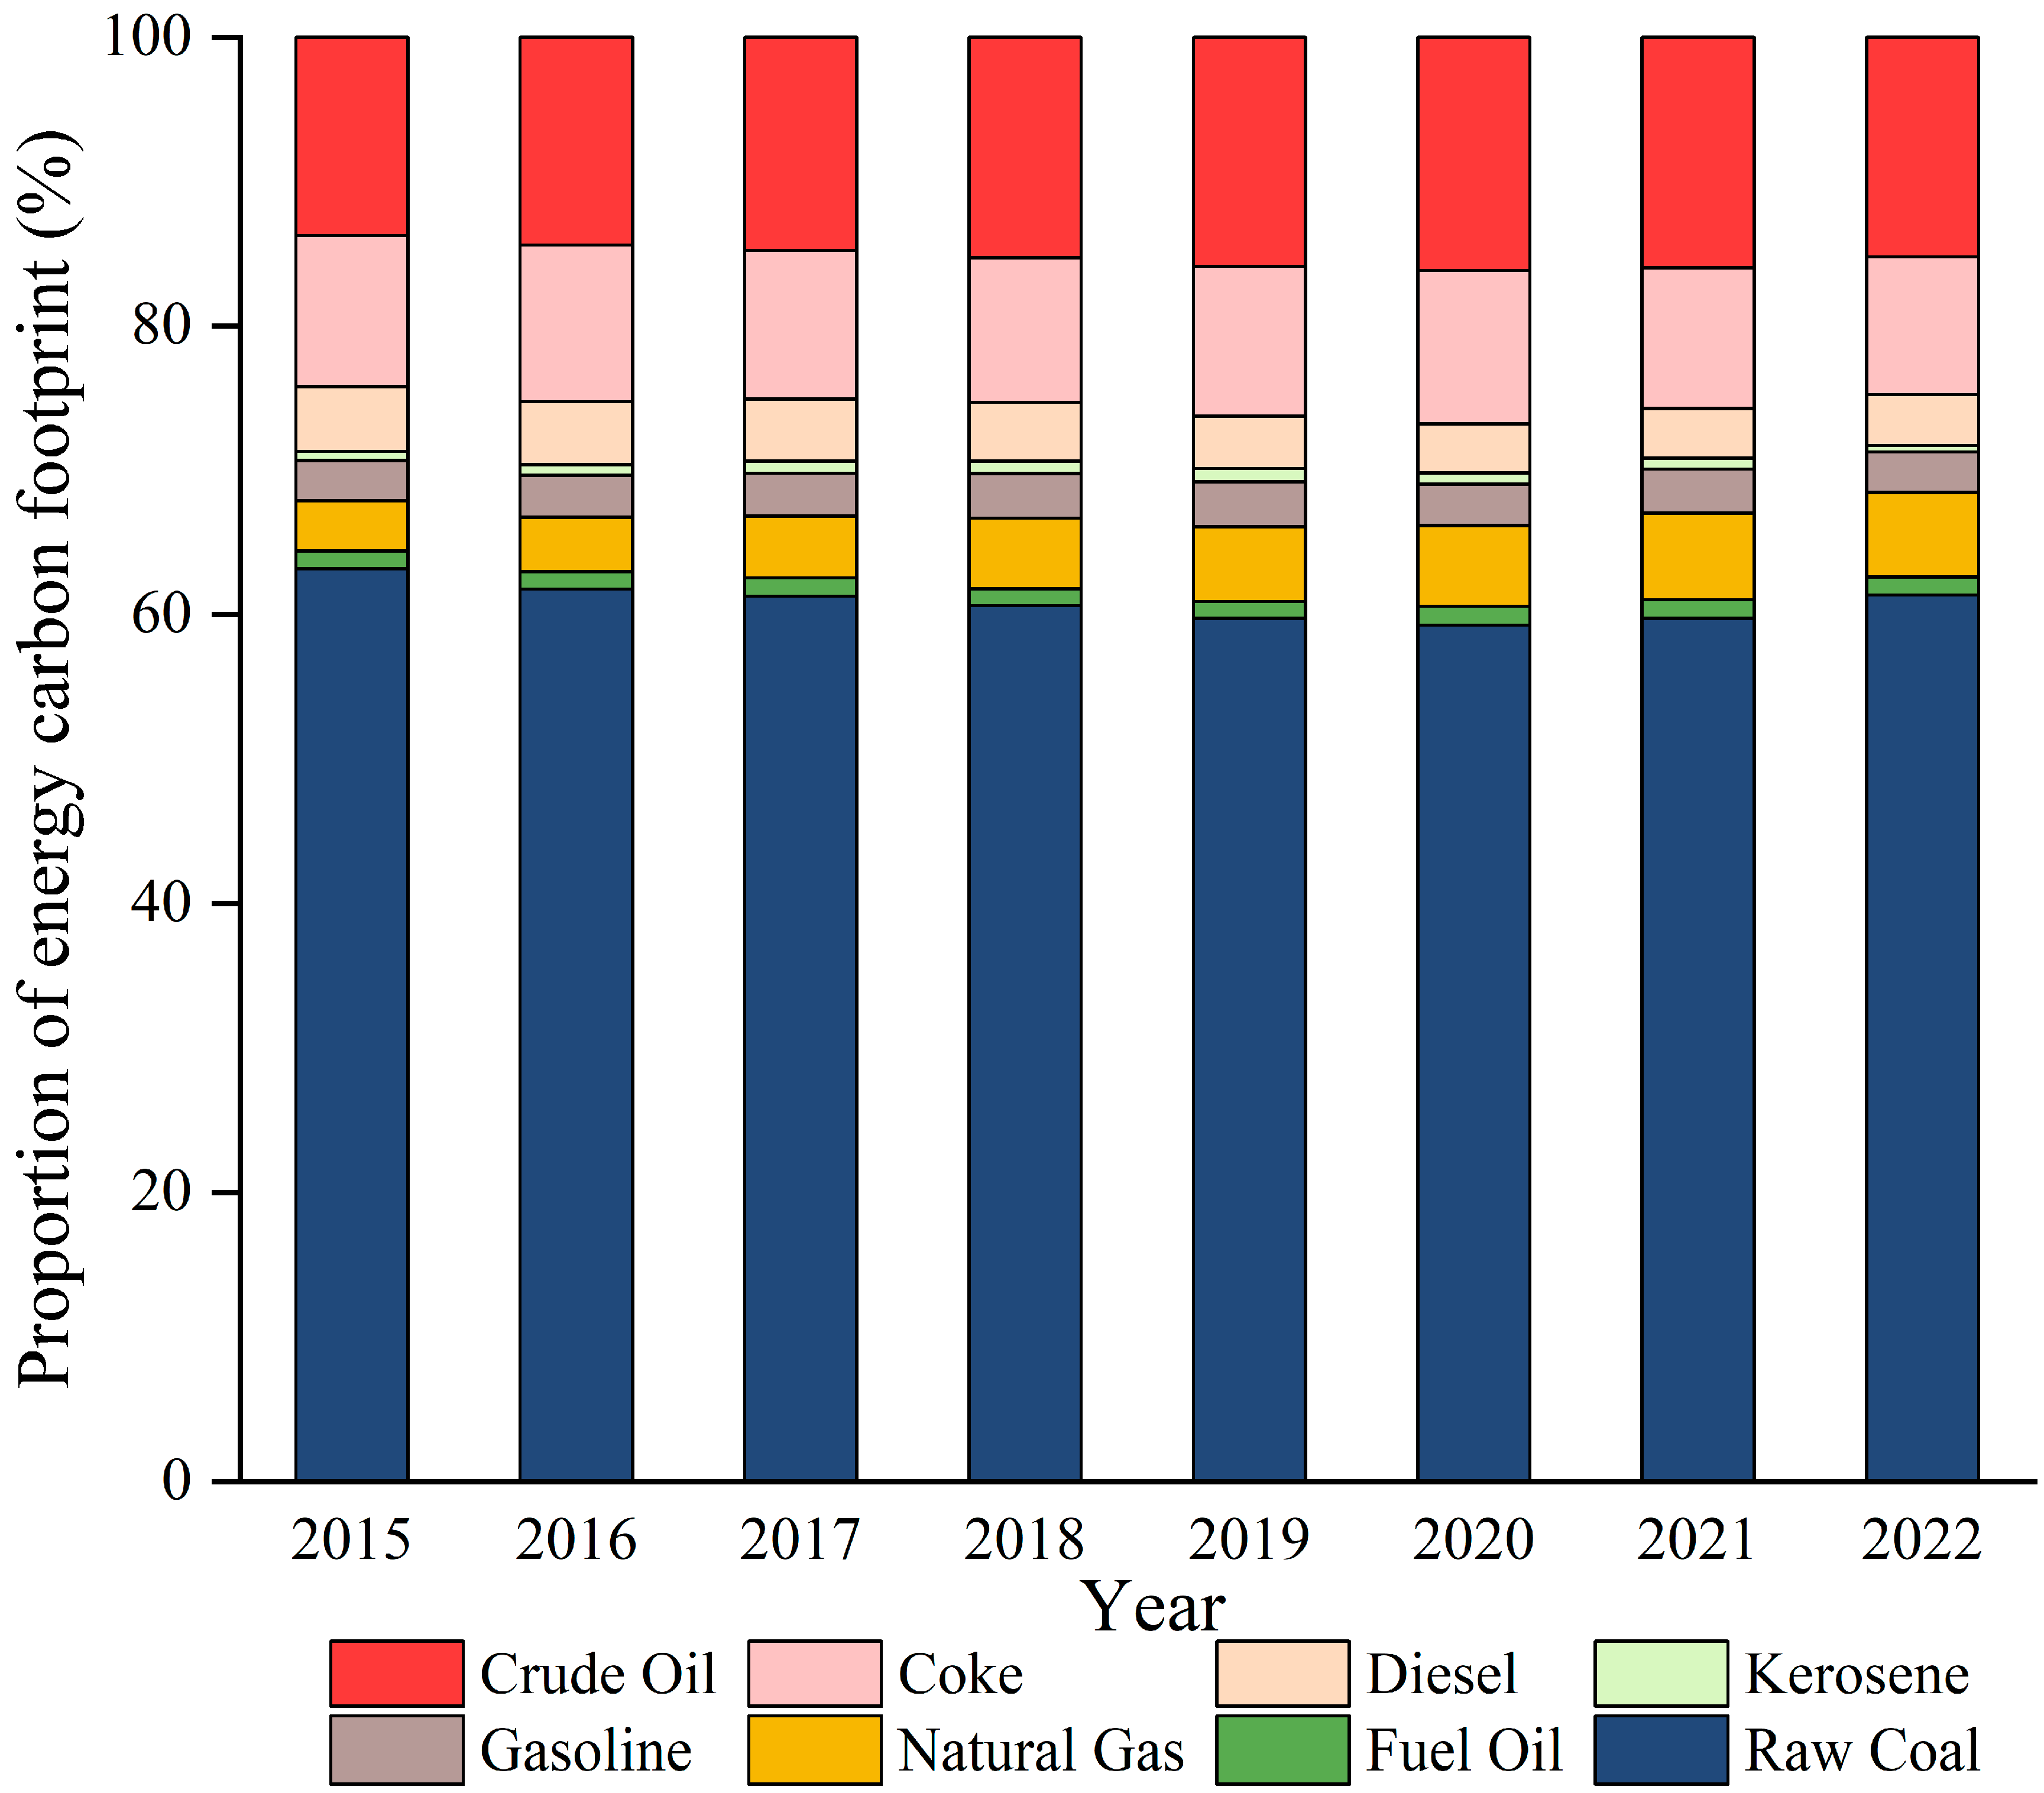
To further elucidate the contribution of different energy sources to the ECF, this study calculated the proportion of carbon footprints from eight fossil energy types from 2015 to 2022. As illustrated in Figure 4, coal consistently dominated the ECF structure with an average contribution of 60.88%, ranking highest among all energy types. Crude oil followed with an average share of 15.18%, while coke accounted for approximately 9.82%. These energy sources contributed more than 85% of the total ECF, constituting the core sources of carbon emissions. Natural gas accounted for about 5% of the total ECF but exhibited the most pronounced growth, with an average annual growth rate of 9.93%. The remaining energy sources—gasoline, diesel, fuel oil, and kerosene—each contributed less than 5%, indicating a relatively minor role in the overall ECF structure. These results suggested that China’s energy structure remained coal-dominated, characterized by the coexistence of multiple energy sources.
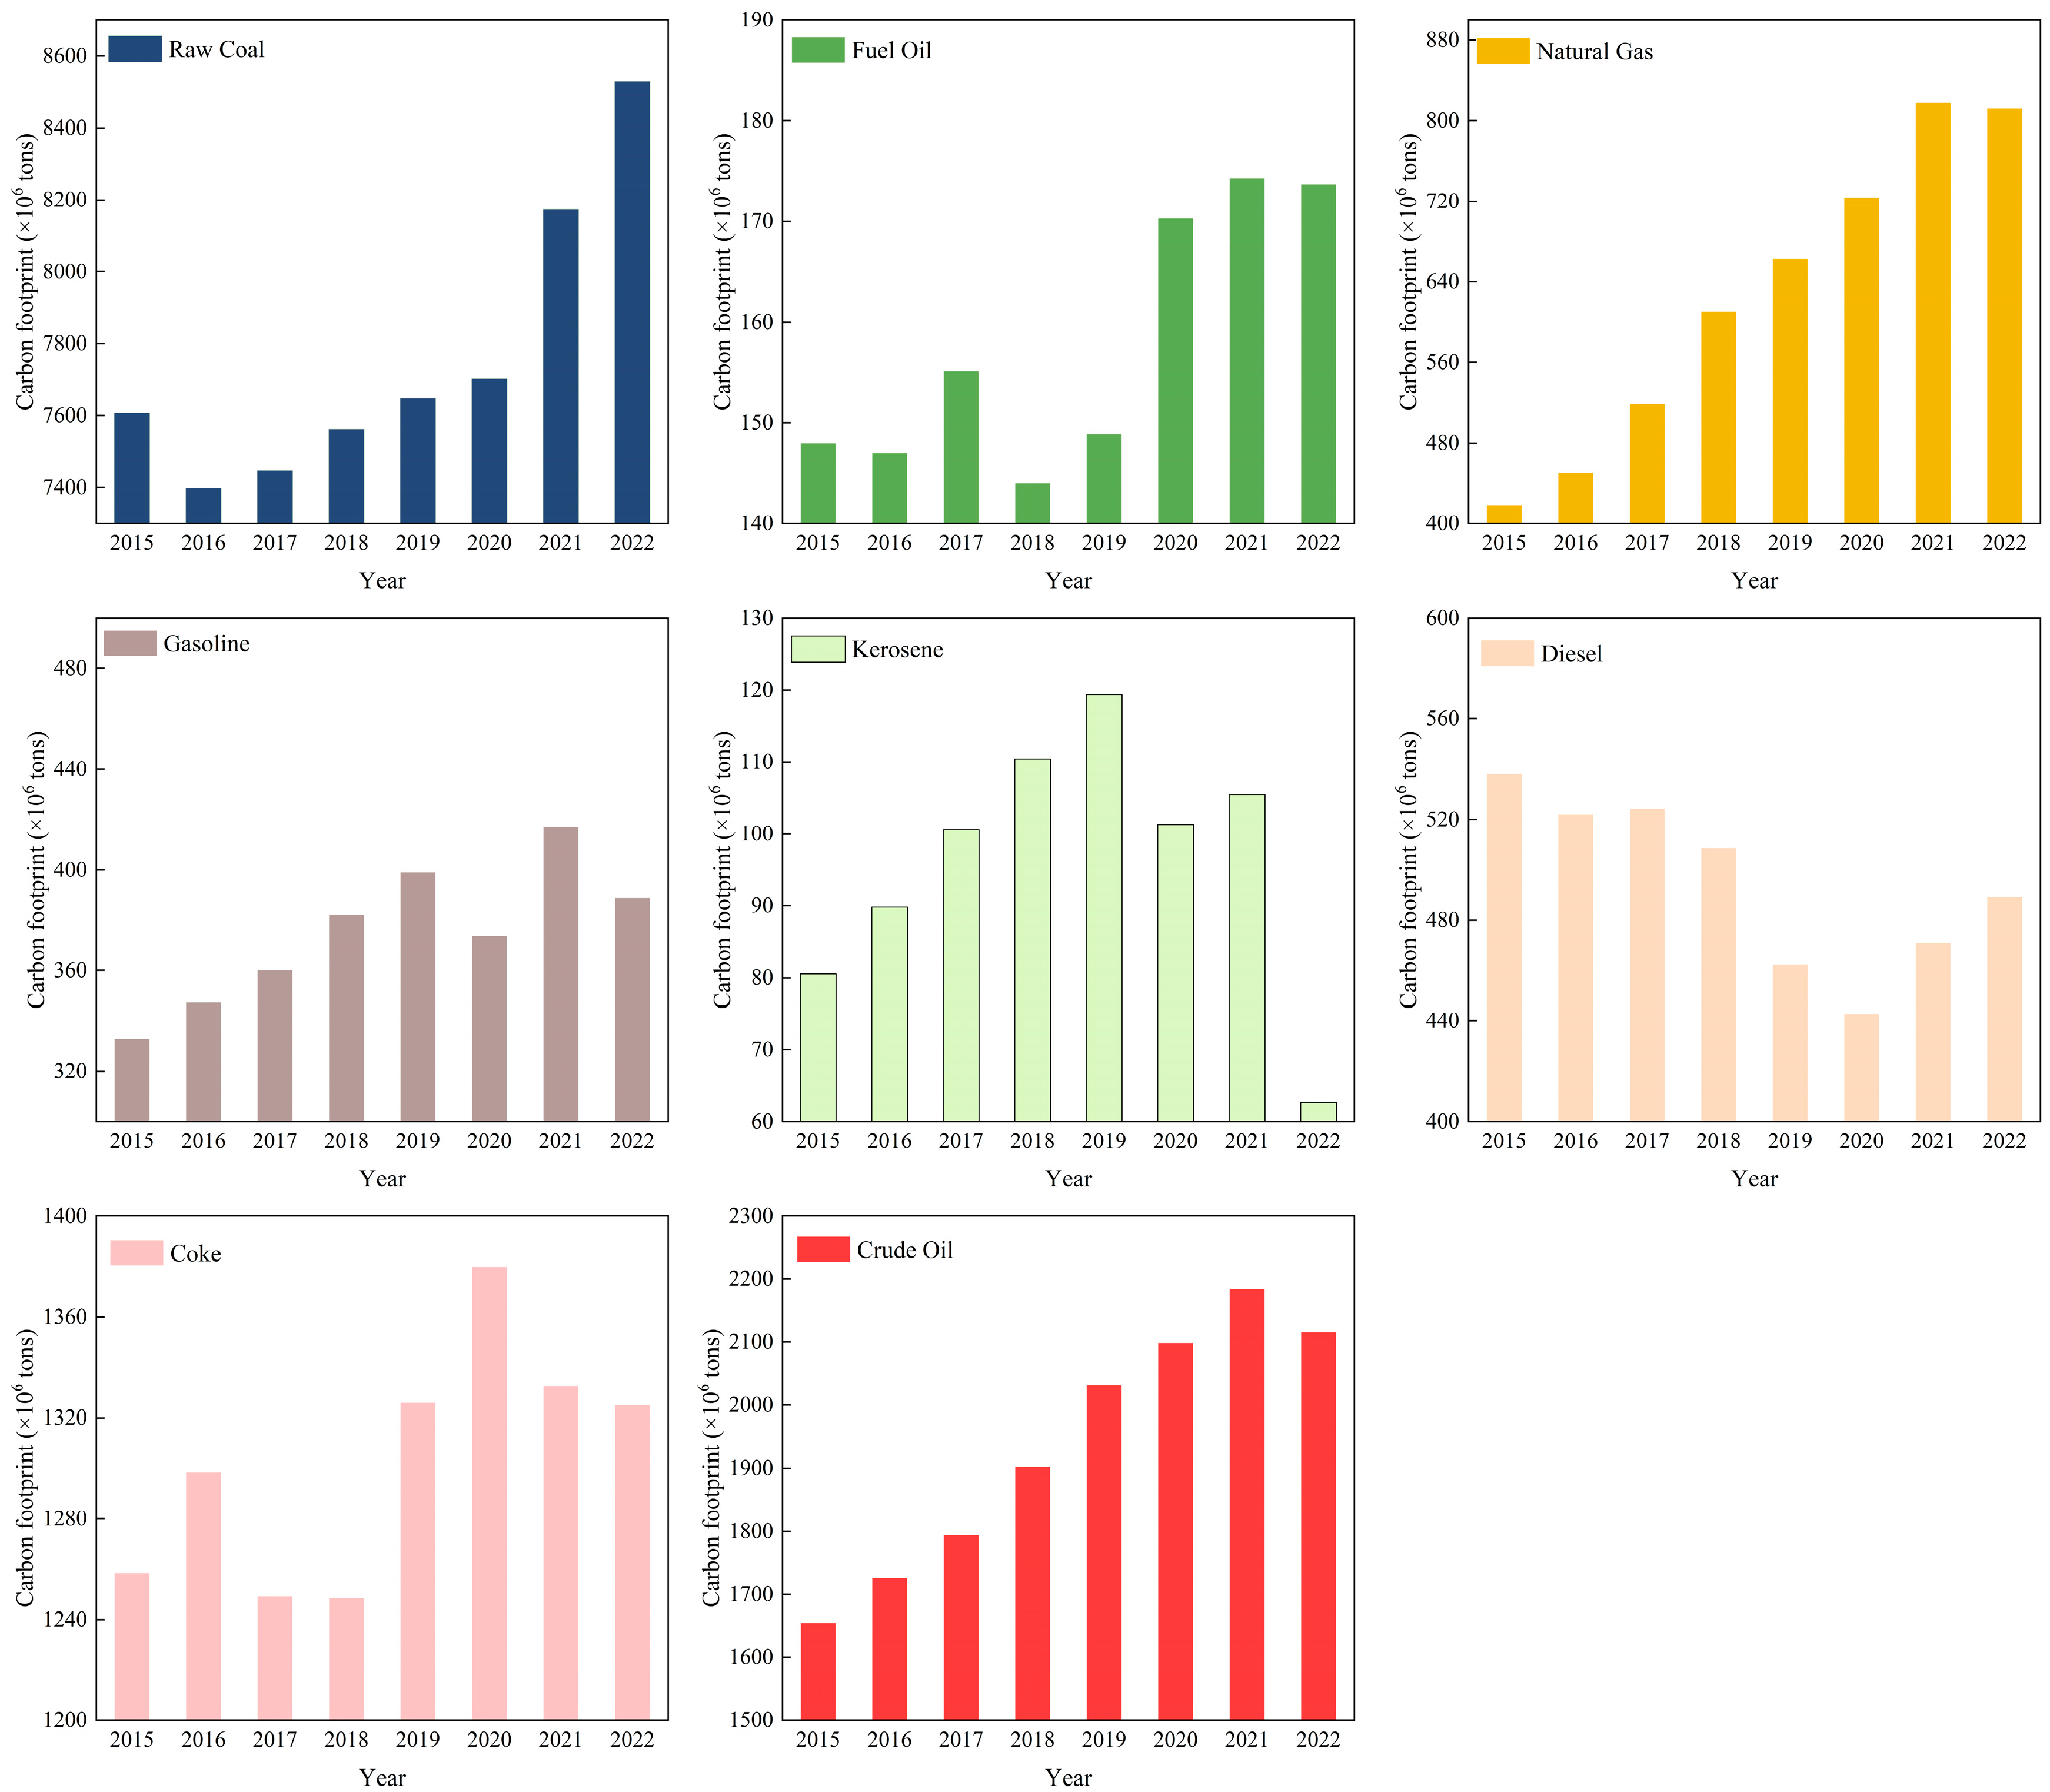
The temporal evolution of carbon footprints associated with the eight energy types is shown in Figure 5. The carbon footprint of coal increased from 7607.64 million tons to 8528.77 million tons, representing a cumulative growth of 12.11%. In 2021, a temporary rebound occurred due to power supply constraints and the release of coal production capacity, highlighting the structural rigidity of China’s coal-based energy system. The carbon footprint of crude oil rose by 27.81% (from 1655.27 million tons to 2115.54 million tons), driven jointly by the expansion of demand for petrochemical feedstocks and increase in fuel consumption in industrial and power generation sectors. As a key input in steelmaking, the carbon footprint of coke increased from 1258.41 million tons to 1325.14 million tons with a cumulative growth of 5.30%. During 2016–2017, capacity reduction policies in the steel industry led to the accelerated exit of outdated coking capacity, resulting in short-term fluctuations in coke-related carbon emissions. After 2018, capacity utilization in the steel sector remained at a relatively high level, stabilizing coke demand and driving a gradual increase in the carbon footprint.
Natural gas was the only energy type that achieved continuous growth throughout the entire study period. Its carbon footprint rose from 418.84 million tons to 812.41 million tons, corresponding to a cumulative increase of 93.97%. This rapid growth was primarily attributable to the implementation of coal-to-gas substitution policies, such as the “Action Plan for Air Pollution Prevention and Control” issued in 2013 and the “Clean Heating Plan for Northern China in Winter” released in 2017, which accelerated the replacement of coal in urban heating, industrial boilers, and power generation.
The carbon footprints of gasoline and fuel oil exhibited steady upward trends with cumulative growth rates of 16.79% and 17.35%, respectively. The increase in gasoline-related emissions was mainly driven by the expansion of private vehicle ownership, which rose from 172 million to 319 million vehicles during the study period. In contrast, the growth in fuel oil emissions was closely linked to the sustained increase in maritime transportation demand at coastal ports. Conversely, the carbon footprint of kerosene declined by 22.15%, decreasing from 80.50 million tons to 62.67 million tons, largely due to the sharp reduction in international air travel caused by the COVID-19 pandemic. Diesel-related emissions experienced a cumulative decline of 9.09%, falling from 538.21 million tons to 489.27 million tons, which could be attributed to freight transport structure optimization, the development of multimodal transport systems integrating road, rail, and waterway modes, and the rapid deployment of new energy heavy-duty trucks. The national stock of new energy heavy-duty trucks exceeded 180,000 units by the end of 2022, representing a year-on-year increase of nearly 60%, which partially substituted traditional diesel-powered vehicles and alleviated carbon emission pressures in the road freight sector.
Overall, the growth of China’s ECF from 2015 to 2022 was primarily driven by high-carbon energy sources, such as coal and crude oil. Concurrently, the rapid expansion of natural-gas-related carbon emissions, along with the decline in diesel and kerosene footprints, reflected the transitional characteristics of China’s energy system from high-carbon to lower-carbon pathways. This evolutionary pattern, characterized by a moderate increase in total emissions alongside gradual structural optimization, provided an important foundation for the subsequent analyses of provincial-level ECF disparities and their coupling relationships with vegetation carbon carrying capacity.

3.1.3. Spatial Distribution of ECF

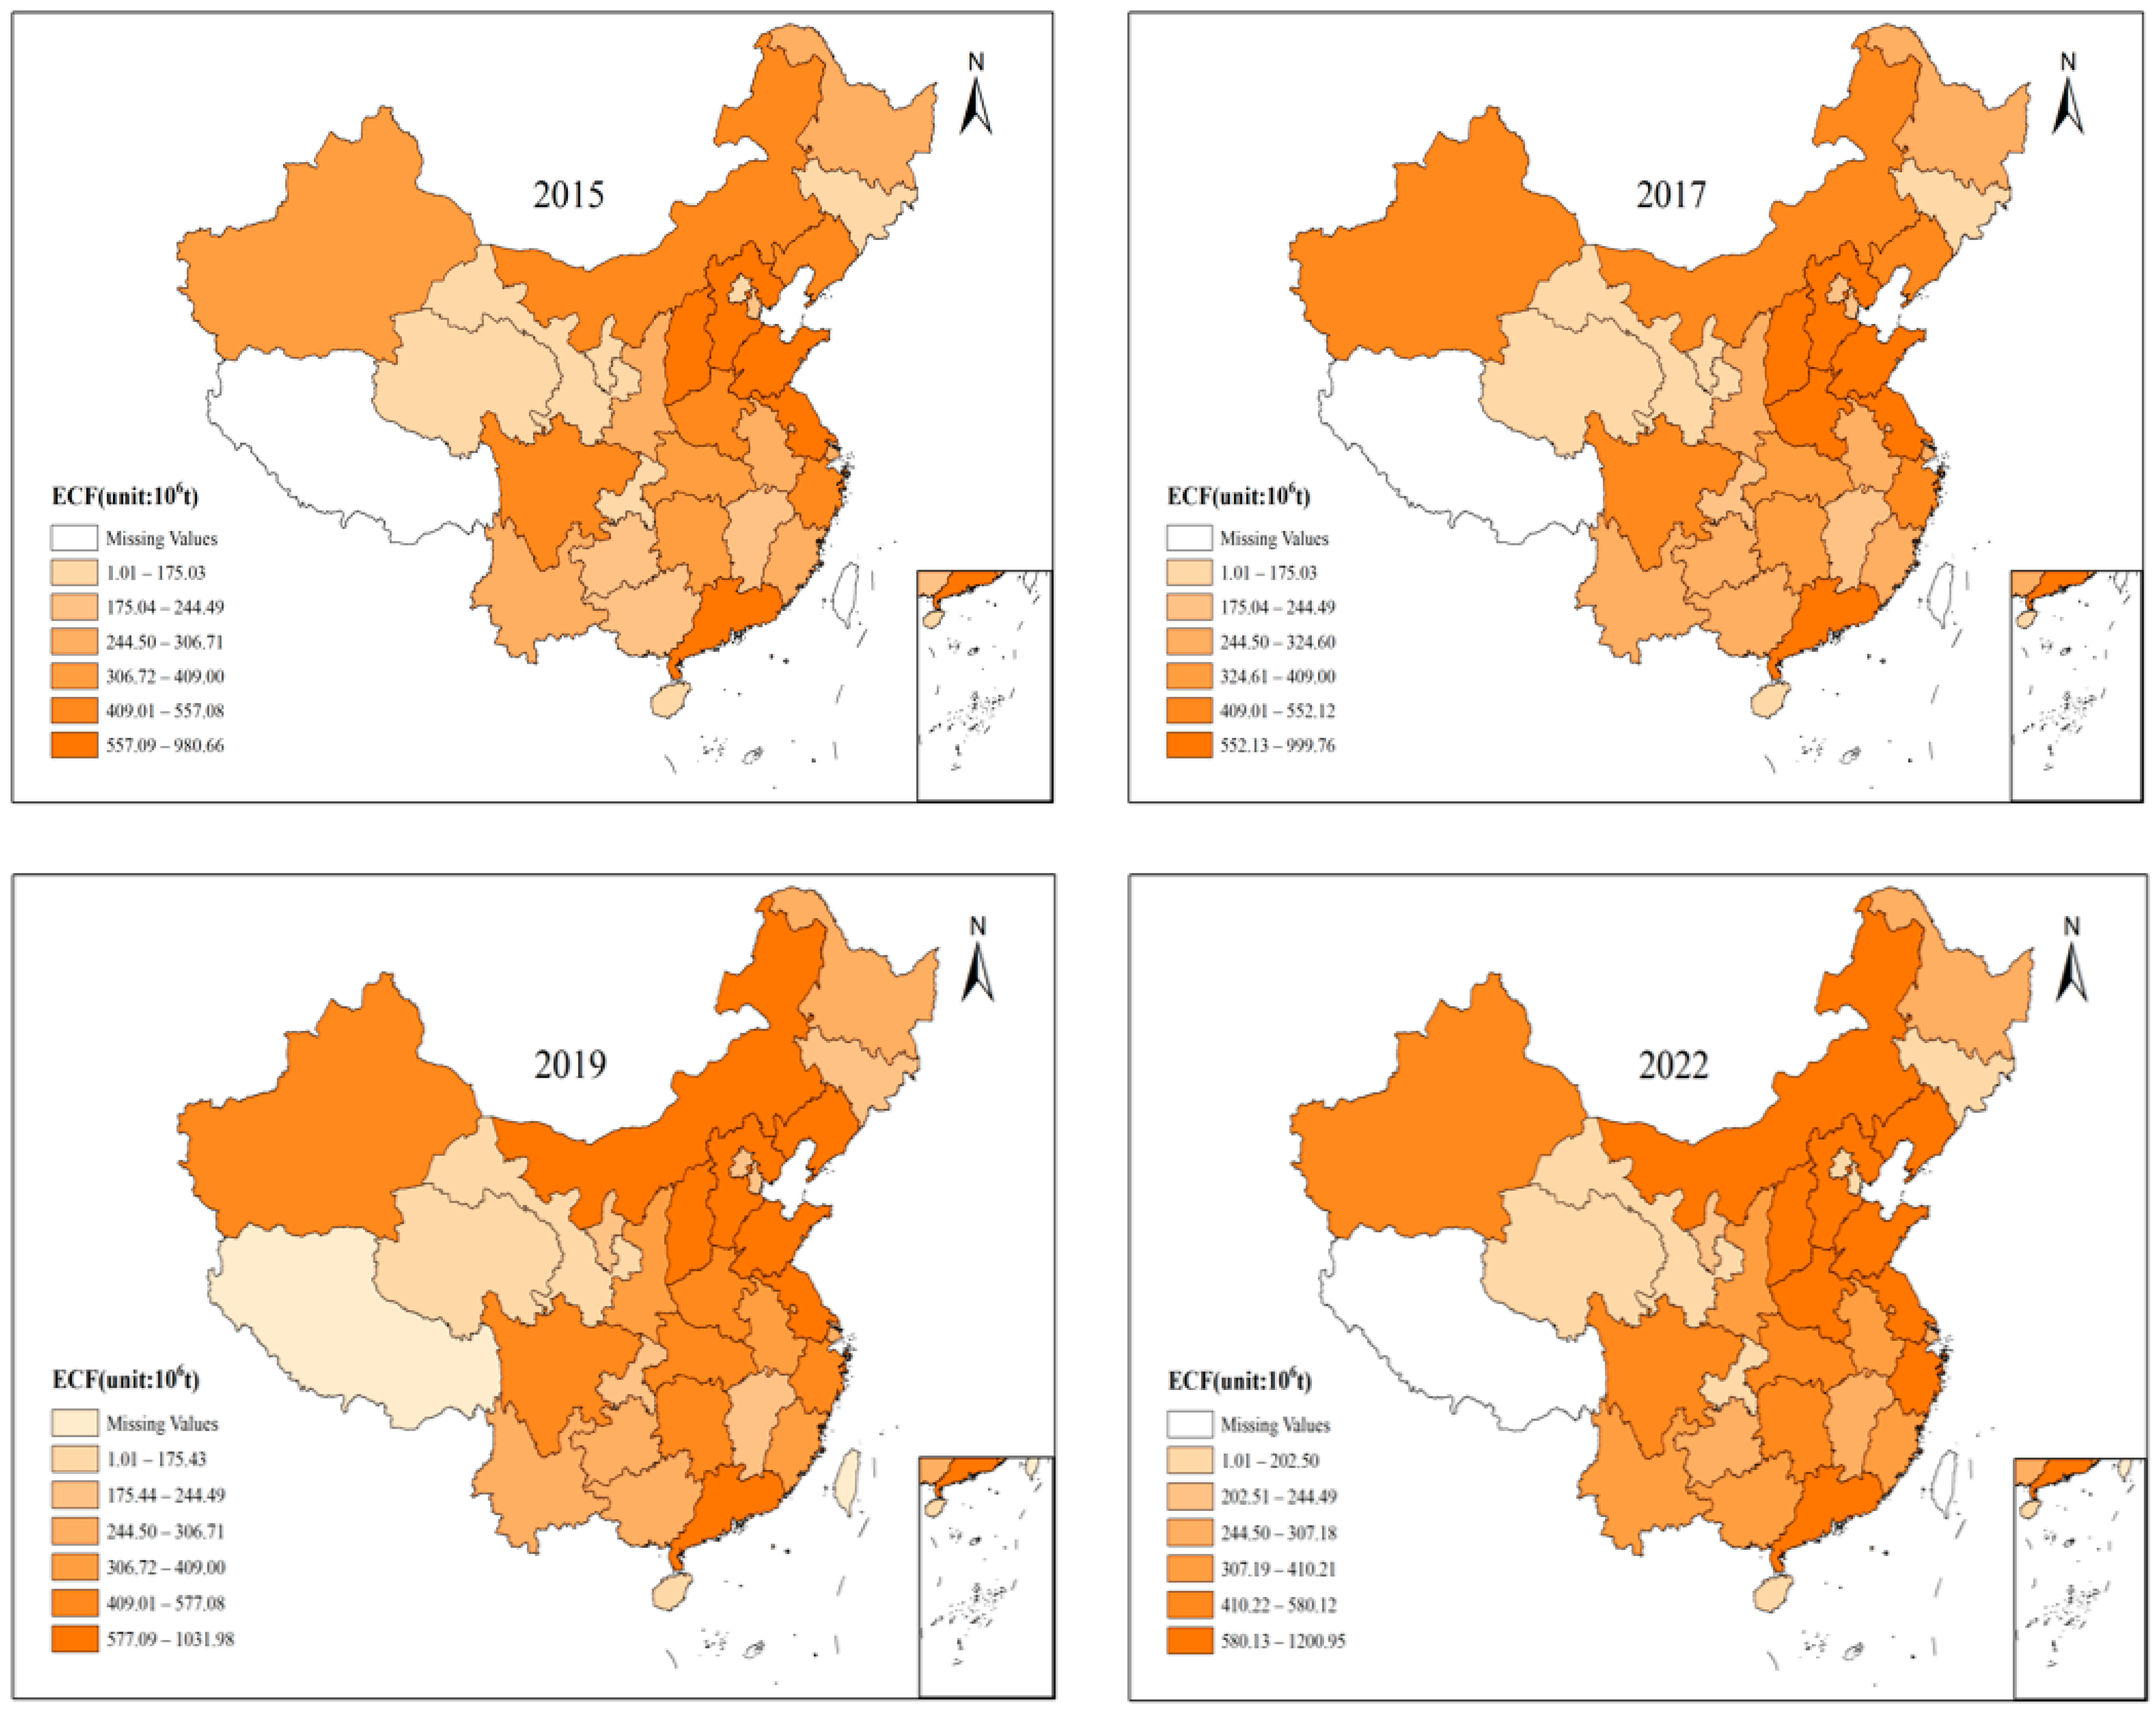
To further reveal the regional characteristics of China’s ECF, this study employed ArcGIS 10.8 (2019) to visualize the provincial-level ECF for the years 2015, 2017, 2019, and 2022, as shown in Figure 6. The results indicated that the spatial distribution of China’s ECF remained generally stable from 2015 to 2022, exhibiting a pronounced pattern of “higher in the north and lower in the south, stronger in the east and weaker in the west”.
High-value regions (annual ECF exceeding 600 million tons) were mainly concentrated in northern China, including Shandong and Shanxi. These provinces shared common features of large-scale industrial systems, energy-intensive industrial structures dominated by sectors like steel, chemicals, and building materials, and substantial total energy consumption. Specifically, Shandong province consistently ranked first nationwide with the ECF increasing from 980.66 million tons in 2015 to 1200.95 million tons in 2022. Shanxi province, a typical coal-resource-based region, recorded an ECF of 955.29 million tons in 2022, representing a 34.36% increase compared with 2015, and remained at a high national level throughout the study period.
Medium-value regions (annual ECF ranging from 244 to 600 million tons) were mainly distributed across Sichuan, Henan, Hunan, Hubei, Shaanxi, Xinjiang, Liaoning, and Fujian. These regions generally featured large economic scales and relatively diversified energy structures, while still retaining a substantial—though declining—reliance on coal. For example, despite a high share of clean energy such as hydropower, the continued expansion of energy-intensive industries in Sichuan province drove the ECF to increase from 456.44 million tons in 2015 to 562.12 million tons in 2022. Hubei, Hunan, and Shaanxi provinces maintained an ECF within the range of 400–600 million tons, reflecting relatively complete industrial systems and high transportation energy demand, which sustained medium-to-high levels of energy-related carbon emissions. The steady growth observed in medium-value regions reflected a transitional stage in which economic expansion and energy structure transformation coexisted in central and western China.
Low-value regions (annual ECF below 244 million tons) were primarily concentrated in municipalities and ecologically oriented provinces, including Beijing, Shanghai, Hainan, Ningxia, and Qinghai. These regions were generally characterized by service-oriented industrial structures, limited industrial scale, or a high proportion of clean energy consumption. For instance, benefiting from an economy dominated by tourism and services and a clean energy share exceeding 45%, Hainan province recorded the lowest ECF nationwide in 2022 (70.61 million tons). Qinghai province, with low population density, limited industrial activity, and a high share of hydropower and photovoltaic generation, maintained an ECF of 11.96 million tons.
Overall, the spatial pattern of China’s ECF remained largely stable from 2015 to 2022. High-value regions were concentrated in resource-based and heavy-industry-dominated provinces, where carbon emissions remained persistently high. Medium-value regions experienced steady growth alongside economic growth, while low-value regions maintained relatively low and stable ECF due to the industrial structure and energy endowment. The fundamental role of regional differences in industrial structure, total energy consumption, and energy composition in shaping the spatial distribution of carbon emissions was highlighted.

3.2. Temporal Evolution and Spatial Distribution of Vegetation Carbon Carrying Capacity

3.2.1. Temporal Evolution of Vegetation Carbon Carrying Capacity

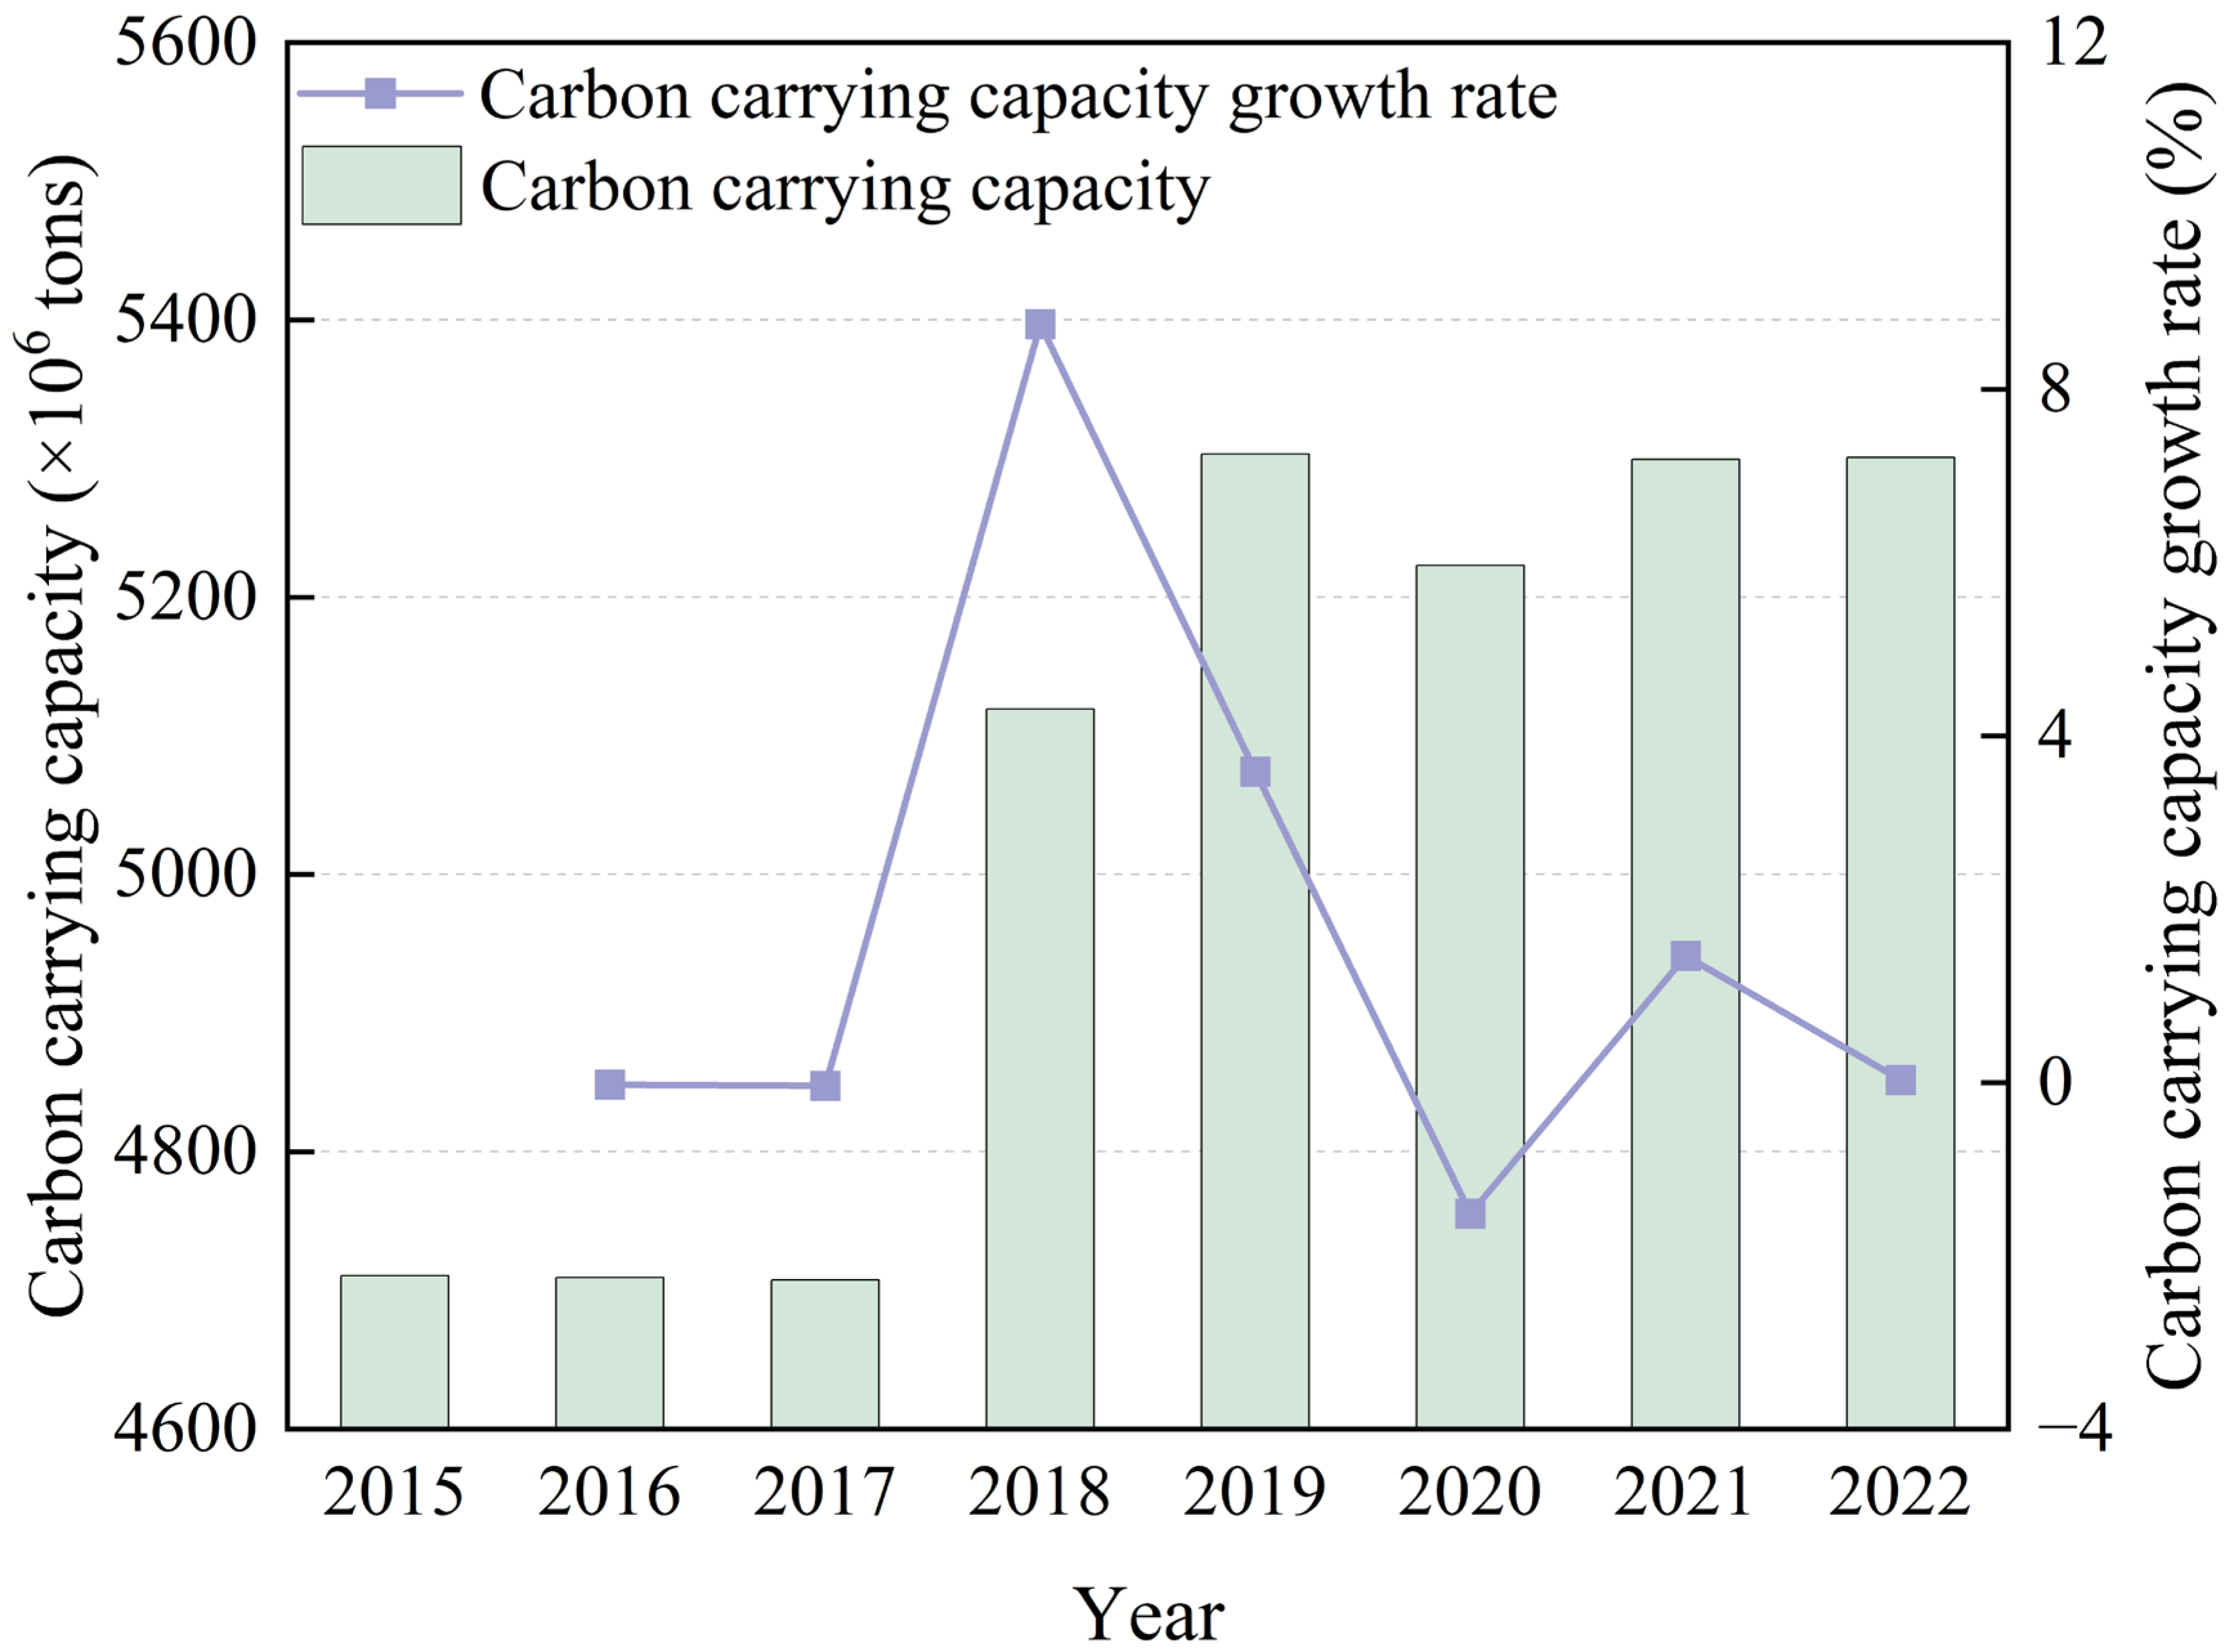
As shown in Figure 7, the total vegetation carbon carrying capacity in China evolved through a pattern of “relative stability-rapid increase-slight high-level fluctuations” from 2015 to 2022. It increased from 4710.53 million tons in 2015 to 5300.76 million tons in 2022, representing a cumulative growth of 12.53% and an average annual growth rate of 1.70%.
From 2015 to 2017, the total vegetation carbon carrying capacity fluctuated slightly around 4710 million tons. In 2018, against the backdrop of the continued implementation of large-scale ecological restoration projects, such as afforestation and the conversion of cropland to forest and grassland, the vegetation carbon carrying capacity increased markedly, rising by 8.75% compared to 2017. This upward trend continued in 2019 with a further increase of 3.59%, suggesting a substantial enhancement of carbon carrying capacity in China’s terrestrial ecosystems during this stage. In 2020, the total vegetation carbon carrying capacity experienced a slight decline of 1.51% relative to 2019, attributable to fluctuations in climatic conditions and localized ecological disturbances. Subsequently, the vegetation carbon carrying capacity rebounded in 2021, increasing by 1.46%, and remained broadly stable in 2022.
Overall, although short-term fluctuations were observed during the study period, China’s vegetation carbon carrying capacity demonstrated a long-term trend of gradual increase on a high-level plateau. This sustained enhancement provided increasingly strong ecological support for offsetting energy-related carbon emissions.

3.2.2. Analysis of the Proportional Structure and Dynamic Changes in Vegetation Carbon Carrying Capacity

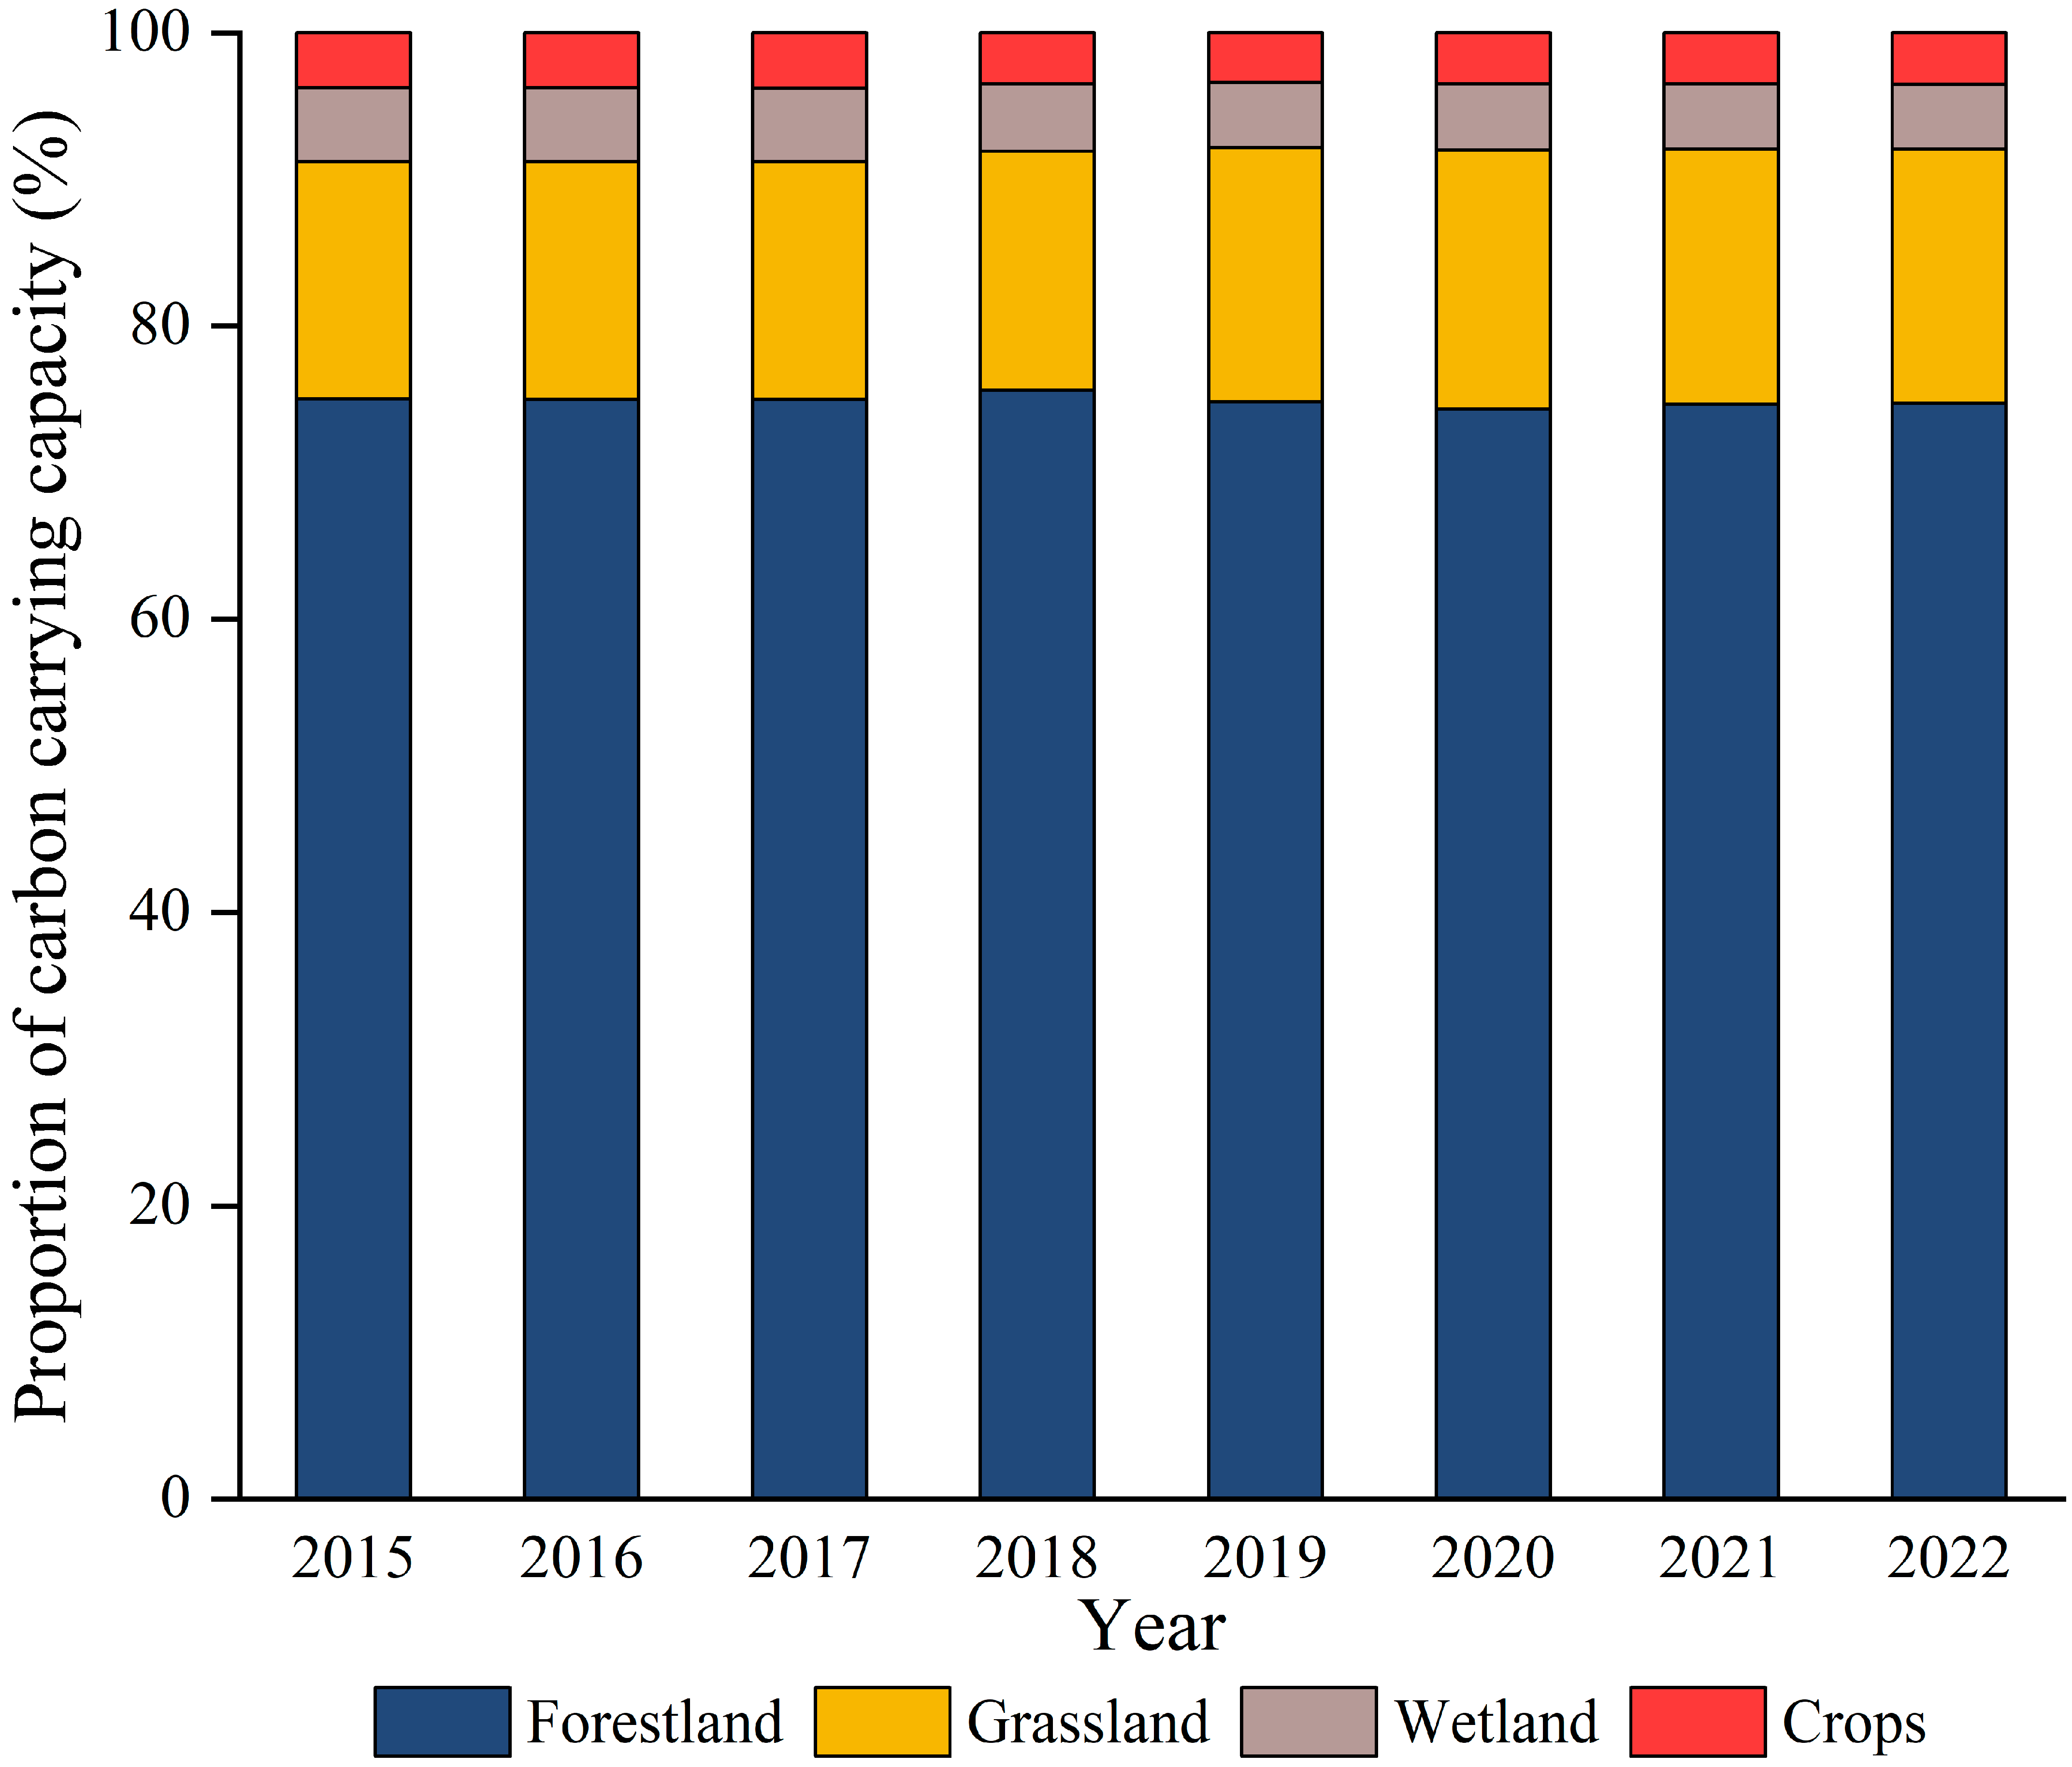
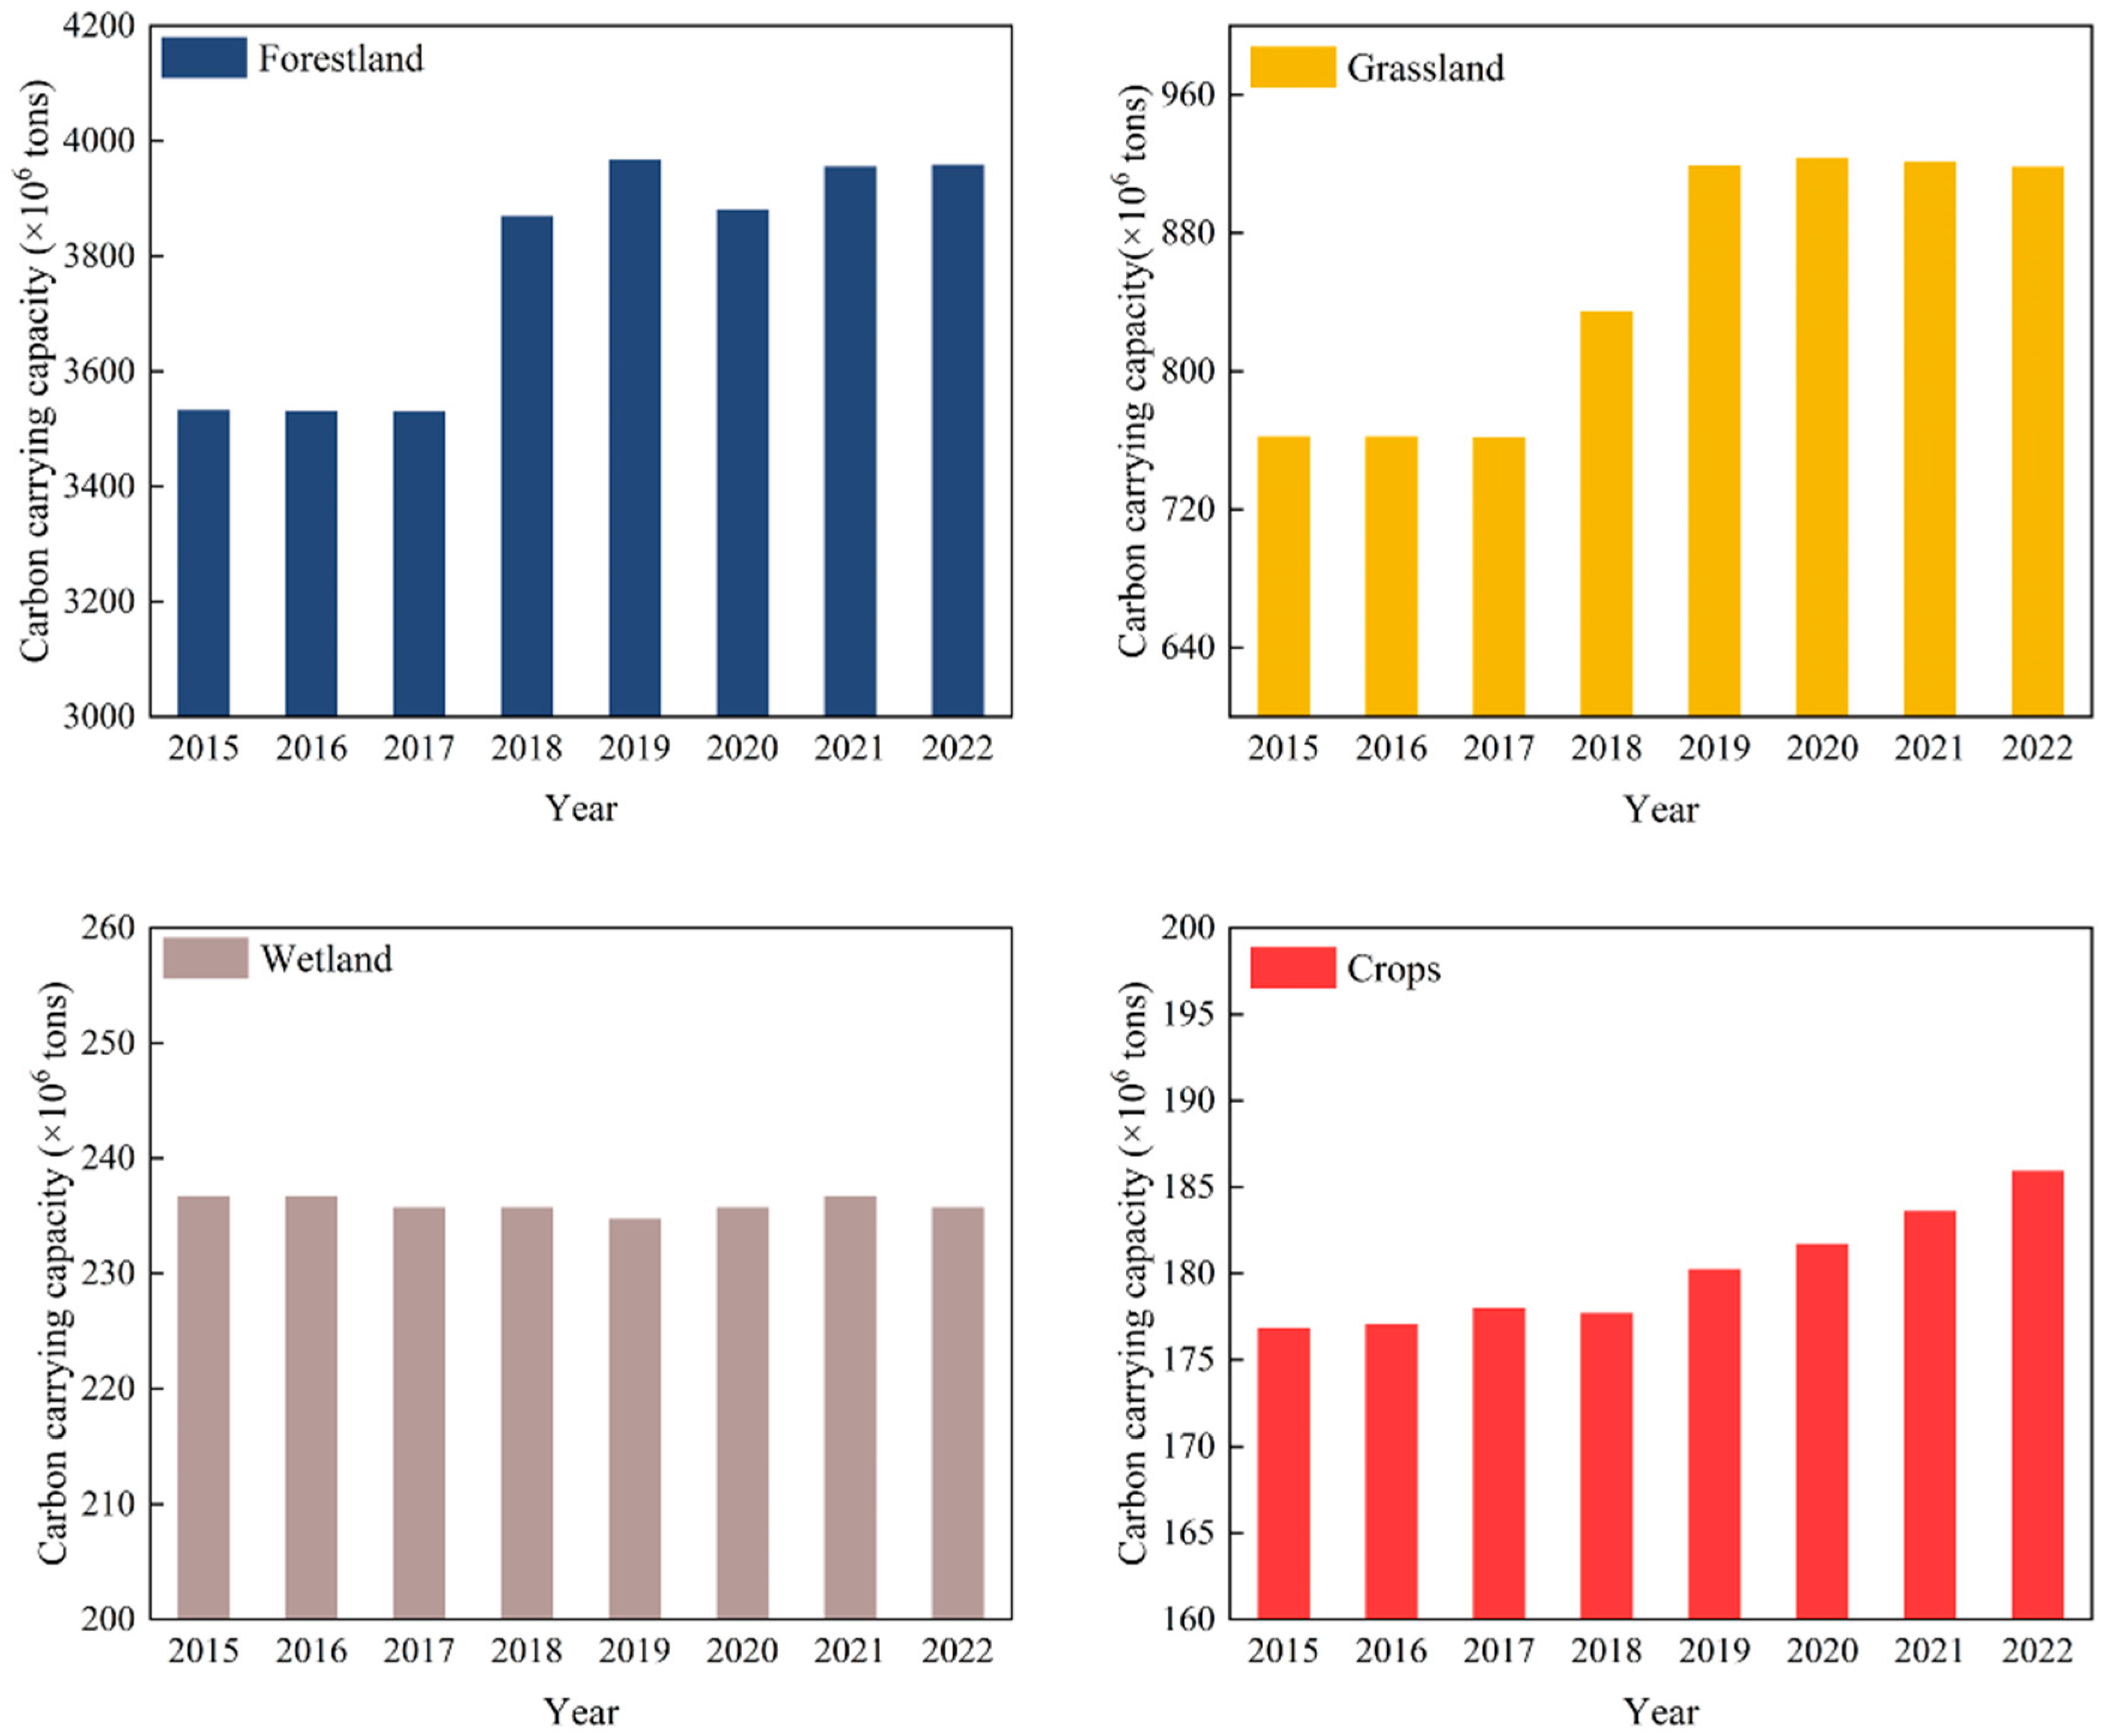
To elucidate the contribution of different vegetation types to the overall carbon carrying capacity, this study analyzed the proportion of carbon carrying capacity associated with four vegetation categories from 2015 to 2022. As shown in Figure 8, forestland accounted for an average of 74.98% of the total vegetation carbon carrying capacity, ranking highest among the four vegetation types. Grassland followed with an average share of 16.77%, while wetland and crops contributed the smallest proportions of 4.68% and 3.57%, respectively. These results clearly indicated that forestland constituted the primary source of vegetation carbon carrying capacity in China.
The variations in carbon carrying capacity for different vegetation types from 2015 to 2022 are presented in Figure 9. Forestland carbon carrying capacity remained largely stable during 2015–2017 with a three-year average of 3532.64 million tons. In 2018, it increased to 3870.68 million tons, representing a growth of approximately 9.61%, and further rose to 3968.46 million tons in 2019, corresponding to a cumulative increase of about 12.4% compared to 2017. This growth phase was closely associated with the continued implementation of afforestation and forest management initiatives such as the “National Land Greening Campaign and the Natural Forest Protection Program”. In 2020, forestland carbon carrying capacity experienced a slight decline (2.19%), but rebounded in 2021–2022 and stabilized at approximately 3958.57 million tons, reflecting an overall increase of about 12.06% compared with 2015 and indicating a pronounced long-term upward trend.
Grassland carbon carrying capacity remained relatively stable from 2015 to 2018 with an average annual value of 762.68 million tons. After 2018, supported by the continued implementation of the “Grassland Ecological Protection Subsidy and Reward Policy” and the large-scale restoration of degraded grassland—covering more than 150 million mu—grassland coverage improved, and carbon carrying capacity gradually increased, reaching 923.76 million tons in 2020. Although slight fluctuations were observed in 2021–2022, grassland carbon carrying capacity remained at a relatively high level. The enhancement of grassland carbon carrying capacity was closely linked to ecological restoration and grazing withdrawal policies implemented in northwest China, the Qinghai–Tibet Plateau, and northern arid and semi-arid regions.
Wetland carbon carrying capacity remained generally stable throughout the study period, fluctuating within a narrow range of 234–237 million tons. This stability reflected the effectiveness of wetland protection redlines and key wetland management systems in maintaining wetland areas and their associated carbon carrying capacity at the national scale.
Crop carbon carrying capacity exhibited a relatively slow but upward trend, increasing from 176.90 million tons in 2015 to 185.98 million tons in 2022. In recent years, optimization of agricultural production structures and improvements in farmland ecological management contributed to enhanced crop carbon uptake. Nevertheless, due to short crop growth cycles and the carbon emissions associated with the agricultural inputs, crops continued to play a supplementary yet non-negligible role in the overall vegetation carbon carrying capacity.
Overall, the vegetation carbon carrying capacity of China exhibited a steady upward trend from 2015 to 2022, characterized by structure dominated by forestland, supplemented by grassland, and complemented by wetland and crops. This growth reflected the tangible outcomes of China’s ecological civilization initiatives and ecosystem restoration programs, providing important ecological support for mitigating the carbon emission pressures associated with energy consumption.

3.2.3. Spatial Distribution of Vegetation Carbon Carrying Capacity

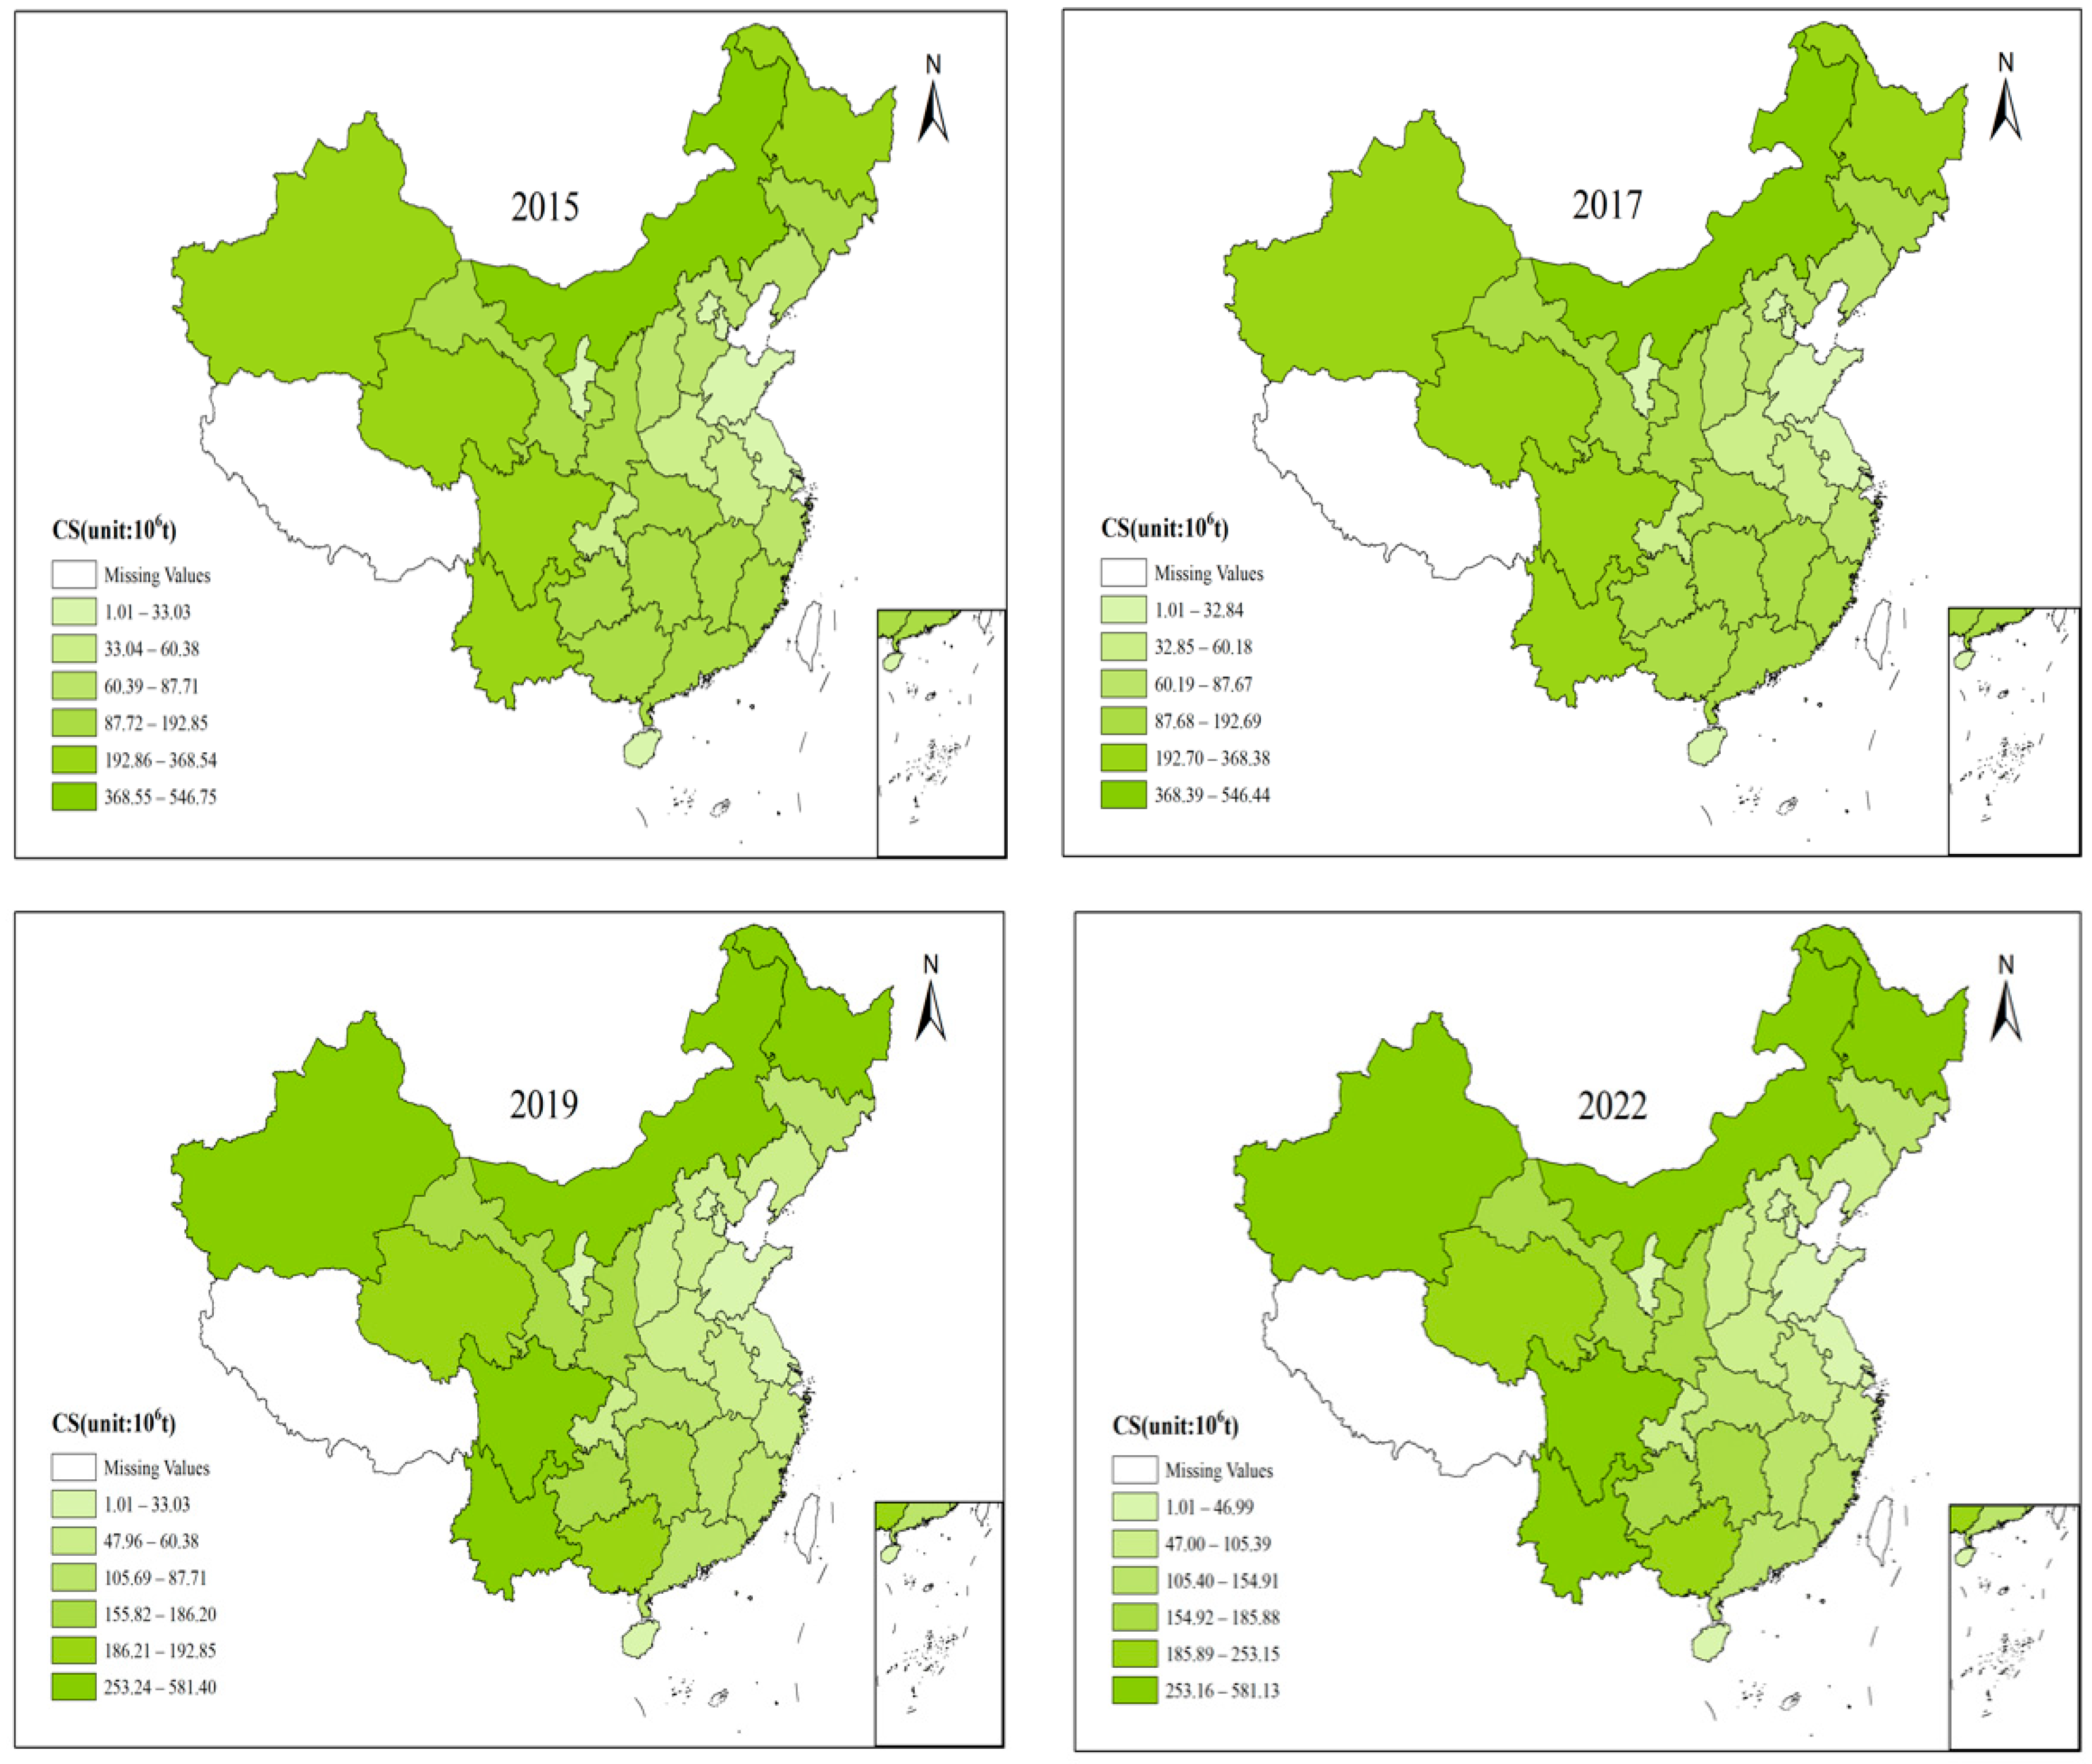
Vegetation carbon carrying capacity, as a critical natural foundation for offsetting the ECF and achieving regional carbon balance, attracted significant attention regarding its spatiotemporal dynamics. Spatial analysis revealed that China’s vegetation carbon carrying capacity exhibited a stable spatial pattern of “high in the west and low in the east” and a temporal evolutionary characteristic of “overall increase with local fluctuations” (Figure 10). This pattern formed a sharp contrast and potential complementarity with the “high in the north and low in the south” distribution of the ECF.
High-value zones (annual carbon carrying capacity exceeding 368 million tons) were primarily concentrated in the southwestern and northwestern ecological barrier regions, such as Inner Mongolia, Heilongjiang, Sichuan, Yunnan, and Qinghai. In 2022, the vegetation carbon carrying capacity in these areas all exceeded 300 million tons, constituting the mainstay of China’s vegetation ecosystem carbon sinks. These regions relied on extensive forest, grassland, and wetland resources, demonstrating robust and sustained carbon carrying capacity. Specifically, Xinjiang experienced the most significant increase in carbon carrying capacity, rising from 271 million tons in 2015 to 371 million tons in 2022.
Medium-value zones (annual carbon carrying capacity between 60 million tons and 367 million tons) were mainly distributed in the hilly and plain regions of central and eastern China, such as Hunan, Jiangxi, and Fujian, where carbon carrying capacity ranged between 100 million tons and 200 million tons. These areas were characterized by composite ecosystems of woodland and farmland, exhibiting relatively stable vegetation carbon absorption capacity. Notably, the carbon carrying capacity in these regions generally showed an upward trend from 2015 to 2022, reflecting the continuous advancement of forest management and ecological restoration projects.
Low-value regions (annual carbon carrying capacity below 60 million tons) were primarily located in economically developed and highly urbanized regions of northern and eastern China, such as Beijing, Tianjin, Shanghai, Jiangsu, and Shandong. Constrained by limited ecological space and intensive land development, their carbon carrying capacity was generally below 50 million tons. These areas restricted forest and grassland coverage, had relatively small ecosystem carbon stocks, and demonstrated a comparatively insufficient carbon sink capacity. As a result, a sharp “high emission-low carrying capacity” contradiction emerged in relation to their substantial ECF, representing a key challenge in achieving regional carbon balance.
Overall, China’s vegetation carbon carrying capacity exhibited a stable spatial pattern characterized by “higher levels in the west and lower in the east with notable north-south differences”. Temporally, it showed an evolutionary trend of “steady growth with localized fluctuations”. This spatial distribution was closely related to China’s natural geographical conditions, land use patterns, and the distribution of ecological projects. Ecological barrier regions in the west and south enhanced their carbon sink functions through ecological restoration and protection measures, whereas densely populated areas in the east and north faced relatively limited carbon carrying capacity due to intensive human activities and constrained ecological space. Systematically enhancing vegetation carbon carrying capacity, particularly by optimizing the spatial alignment with the energy carbon footprint, was critically strategically significant for alleviating regional carbon imbalance and promoting the steady achievement of the “dual carbon” goals.

3.3. STIRPAT Model

3.3.1. Correlation Analysis

Prior to examining correlations among the variables, the original data were log-transformed according to Equation (13) to mitigate scale effects. Subsequently, correlation analysis was performed for all variables using SPSS 27.0.1. As shown in Table 5, ECFP exhibited a significant positive correlation with the P (r = 0.859). However, the correlations among the independent variables were more pronounced. Specifically, the correlation between T and A (r = −0.592) was significant negative. Meanwhile, A also demonstrated significant correlations with P (r = 0.593). These findings indicated the presence of substantial linear relationships among the variables within the STIRPAT model. Although such correlations reflected intrinsic associations among the variables, the potential issue of multicollinearity warranted further investigation.

3.3.2. Ordinary Least Squares (OLS) Regression

To assess whether severe multicollinearity existed among the explanatory variables, this study employed OLS regression to perform a variance inflation factor (VIF) diagnosis on the extended STIRPAT model. As shown in Table 6, the VIF values for all independent variables ranged from 1.552 to 3.492, below the commonly accepted multicollinearity threshold of 10 [44]. These results indicated that, although some correlation existed among the variables, it was not severe enough to undermine the validity of the parameter estimates. Furthermore, the OLS regression yielded a high coefficient of determination (R2 = 0.972), suggesting that the model had strong explanatory power.
Given that the panel data used in this study were collected from 30 provincial-level administrative regions in China (excluding Hong Kong, Macau, Taiwan, and Tibet) over the period of 2015–2022, substantial heterogeneity in resource endowments and development stages across regions was expected. To meet the normative requirements of panel data analysis and to verify the reliability of the results, this study further applied random effects (RE) and two-way fixed effects (FE) models for robustness checks. The Hausman test results (Table 7) showed a p-value significant at the 1% level (p < 0.01), leading to the rejection of the RE null hypothesis. This finding confirmed the presence of significant individual effects across provinces, thereby identifying the FE model as the most appropriate specification. The R2 of the FE model improved to 0.986, and the coefficient signs of the core variables remained consistent across different model specifications, further validating the robustness of the empirical findings.
Based on the regression results obtained from the FE model, the driving effect equation was formulated as follows.
lnECFP = 1.668 + 0.018 lnE + 1.279 lnT + 1.386 lnA + 0.485 lnP 0.161 lnS ,
Based on the estimation results reported in Equation (22), this study could identify both positive and negative key determinants of ECFP. Energy structure (ln E), technological progress (ln T), economic growth (ln A), and population scale (ln P) exerted a promoting effect on ECFP, whereas ecological intensity displayed a significant inhibitory effect. In terms of magnitude, the positive driving factors ranked as follows: economic growth > technological progress > population scale > energy structure.
Firstly, economic growth exerted the most pronounced influence on the ECFP, with a regression coefficient of 1.386. Between 2015 and 2022, provinces in China experienced sustained and rapid economic growth. The concurrent expansion of high-energy-consumption industries, the acceleration of large-scale infrastructure construction, and the upgrading of residential end-use consumption collectively drove the continuous increase in the ECF. This finding indicated that economic growth was a primary positive factor contributing to the rise in ECFP.
Secondly, technological progress exhibited a significant promoting effect on ECFP, with a regression coefficient of 1.279. In this study, energy intensity (defined as energy consumption per unit of GDP) was employed as a proxy for technological progress. Higher energy intensity indicated greater energy consumption per unit of economic output and a relatively lower level of technological advancement. Accordingly, regions with higher energy intensity tended to exhibit larger ECFP values. Between 2015 and 2022, the widespread adoption of green industrial technologies and improvements in energy efficiency management contributed to a general decline in energy intensity. The data showed that average energy consumption per unit of GDP decreased from approximately 0.779 tons of standard coal per 10,000 RMB in 2015 to 0.5 tons of standard coal per 10,000 RMB in 2022, representing a cumulative reduction of 35.8%. This sustained decline in energy intensity generated substantial emission reduction effects, effectively offsetting the additional energy consumption and emissions associated with economic expansion. These findings further underscored the critical role of continuously reducing energy intensity in alleviating carbon footprint pressures.
Thirdly, population scale also exerted a significant positive influence on ECFP with a coefficient of 0.485. In this study, a population pressure index was constructed as total population per unit of vegetation area to reflect the spatial compression of natural carbon sinks caused by population growth. The increase in population not only directly elevated residential energy consumption, but also indirectly intensified ECFP by expanding built-up areas at the expense of ecological space. However, the effect magnitude was smaller than that of economic growth, suggesting that population influenced ECFP primarily through indirect pathways, such as land use changes, rather than direct energy consumption.
Fourthly, the energy structure also posed a positive effect on ECFP, with a coefficient of 0.018. In this study, this indicator was defined as the proportion of coal-related carbon footprint to the ECF. From 2015 to 2022, the share of coal consumption in China exhibited a steady decline from 64% to 56%, indicating notable progress in energy structure optimization. Further promoting the transition away from coal and accelerating the shift toward clean energy sources—such as wind, solar, and hydropower—was identified as a critical strategy to mitigate high-carbon lock-in effects and reduce ECFP at the source.
Fifthly, ecological intensity exhibited a negative effect on ECFP with a coefficient of −0.161, which indicated that the improvement of ecological quality achieved a significant inhibitory effect on the growth of ECFP. Forest was recognized as one of the most significant carbon sinks in terrestrial ecosystems. An increase in forest coverage rate generally resulted in enhanced carbon carrying capacity and improved ecological regulation functions, thereby alleviating the carbon emission pressures resulting from the growth of energy consumption. These findings further indicated that strengthening forest protection and promoting ecological restoration measures, such as afforestation and reforestation, played a critical role in reducing ECFP and maintaining regional carbon ecological balance.

3.4. Prediction of ECF and Vegetation Carbon Carrying Capacity

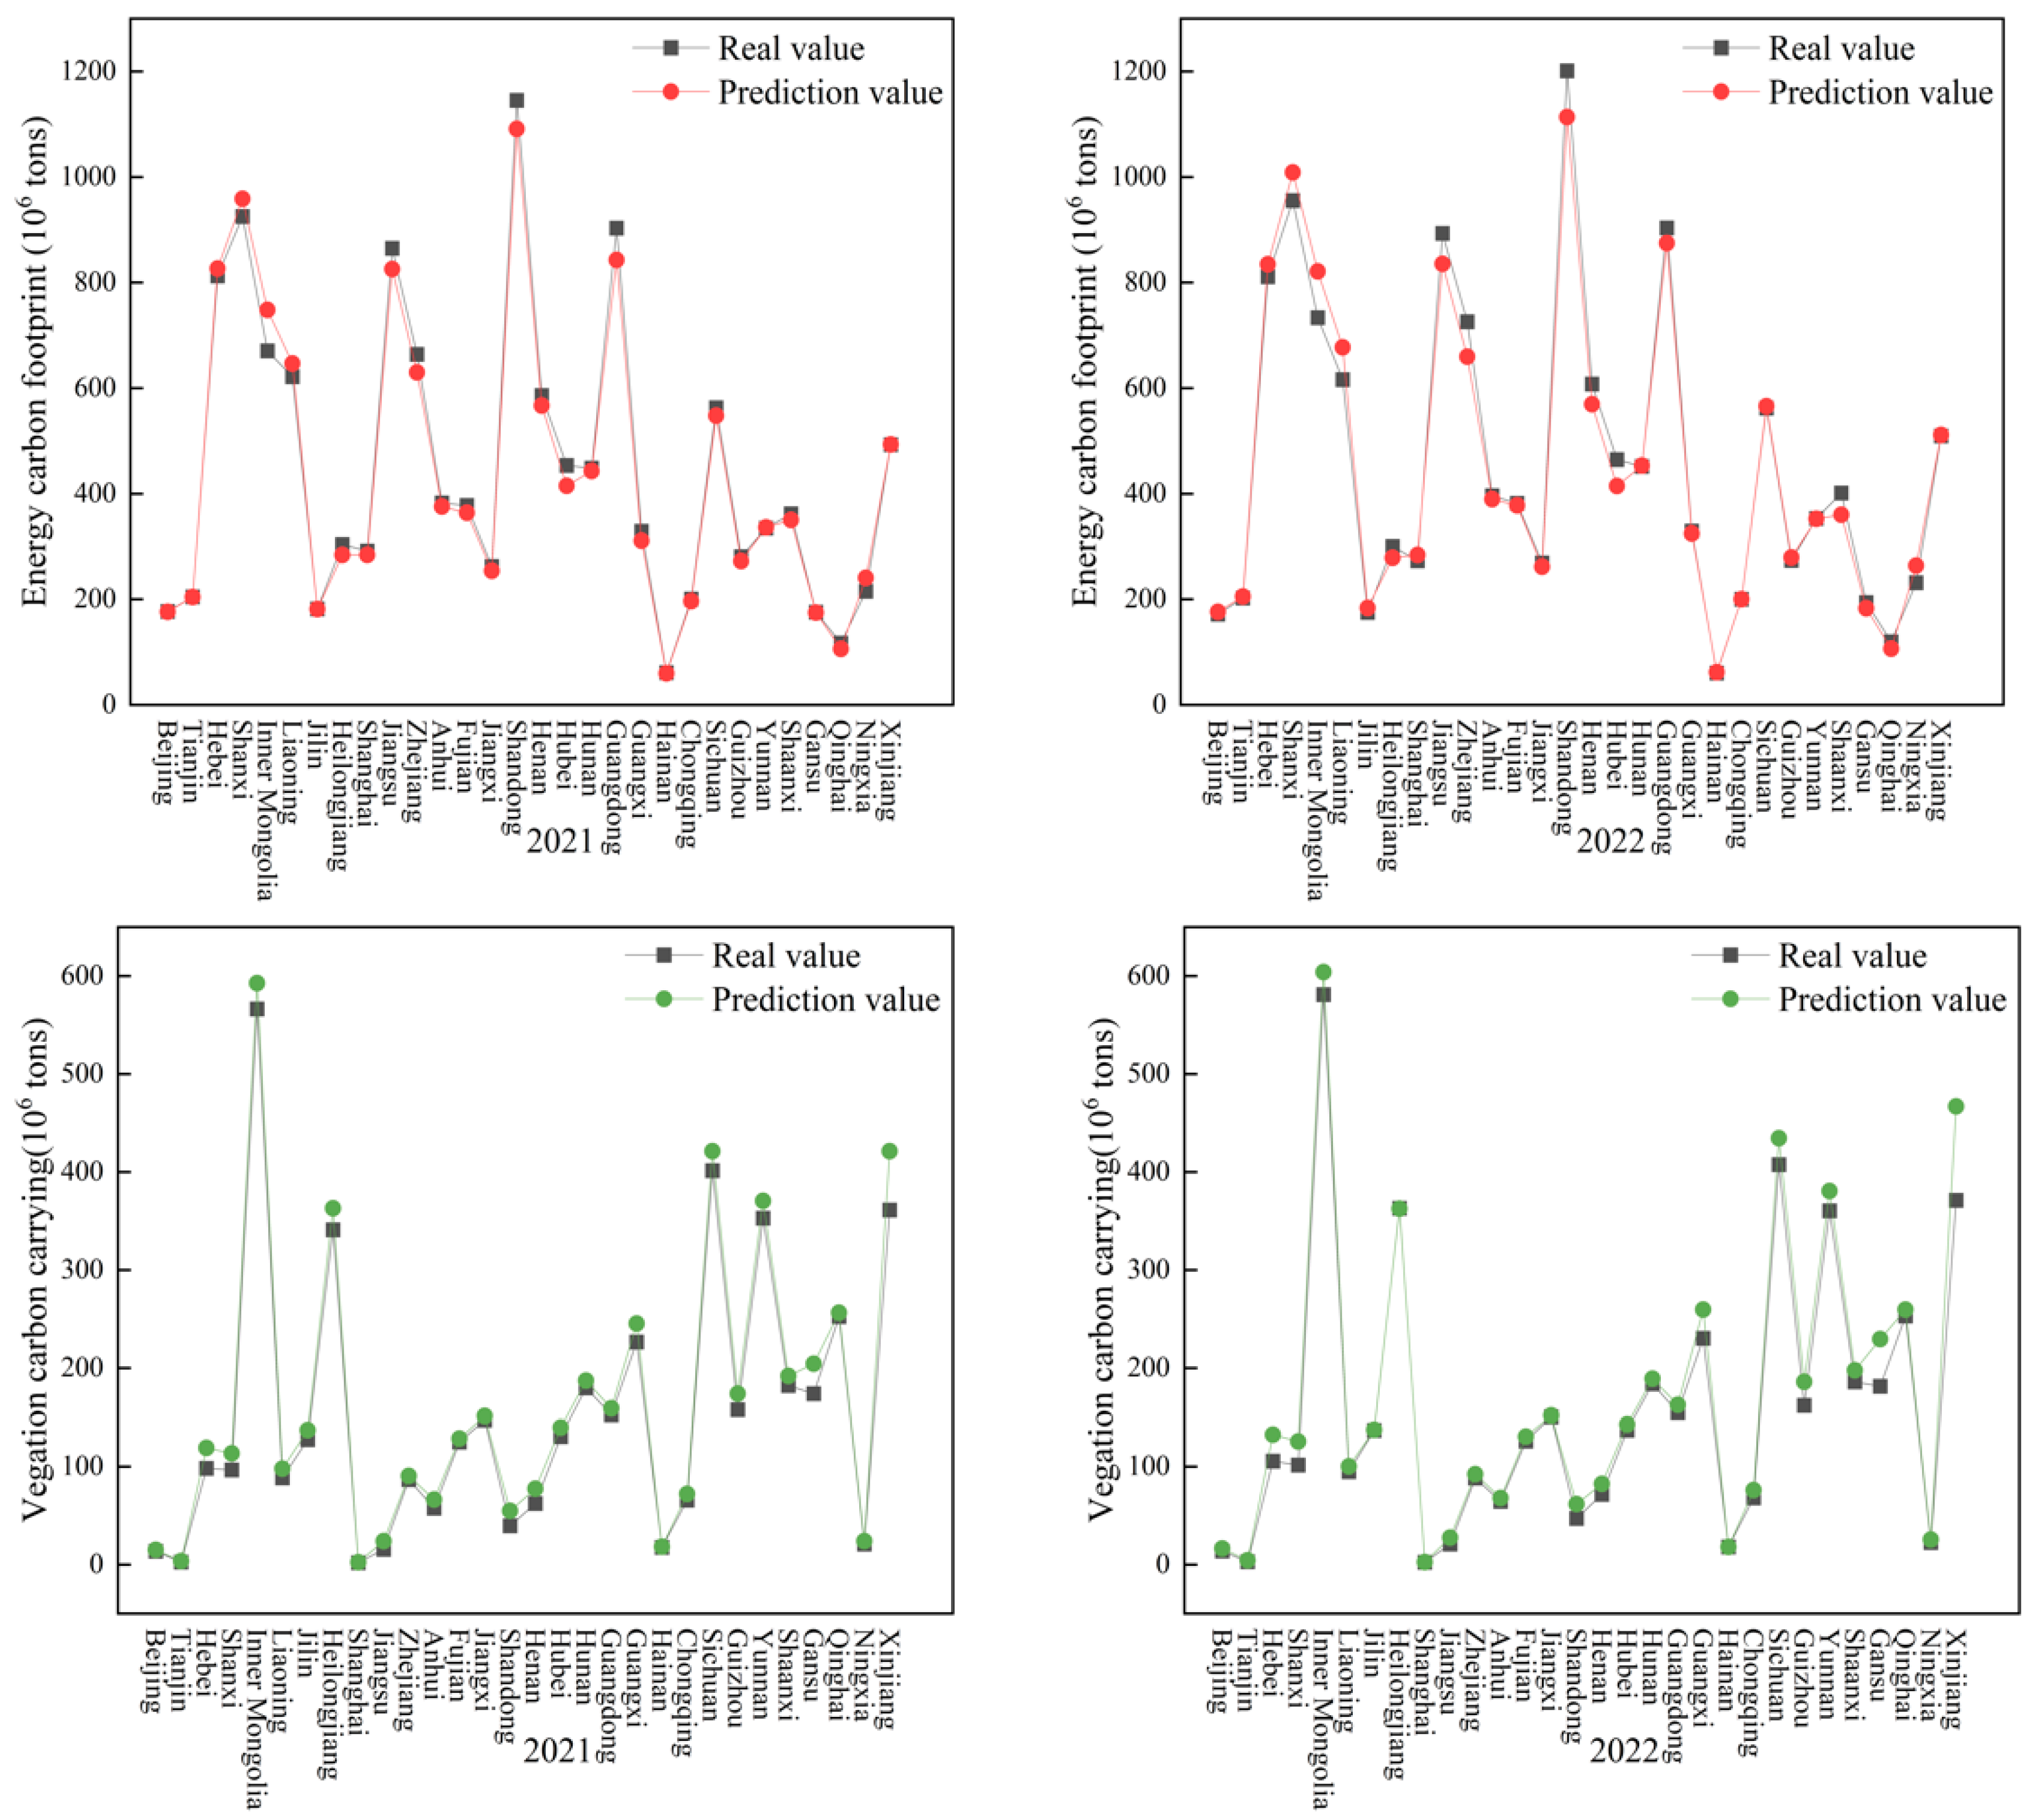
The GM (1,1) model was employed to project the ECF and vegetation carbon carrying capacity across 30 provinces in China. Data from 2015 to 2020 were used as the training sample for model fitting, while data from 2021 to 2022 served as the test set to validate predictive performance. As illustrated in Figure 11, a high level of consistency was observed between the GM (1,1) model predictions and the actual values of ECF and vegetation carbon carrying capacity across 30 provinces in China from 2021 to 2022, thereby confirming the applicability and reliability of the model.
The posteriori error tests were conducted to evaluate the predictive accuracy of the model. As shown in Table 8, the model demonstrated good fitting stability: the mean absolute percentage error (MAPE) remained below 10%, and all provinces met the first-level accuracy criteria (Table 4) in terms of the posterior variance ratio (C) and the small error probability (P). These results indicated that the GM (1,1) model was capable of effectively capturing the temporal evolution of both ECF and vegetation carbon carrying capacity, providing reliable forecasts with substantial value for subsequent analyses.

3.4.1. ECF Prediction and Spatial Distribution Analysis

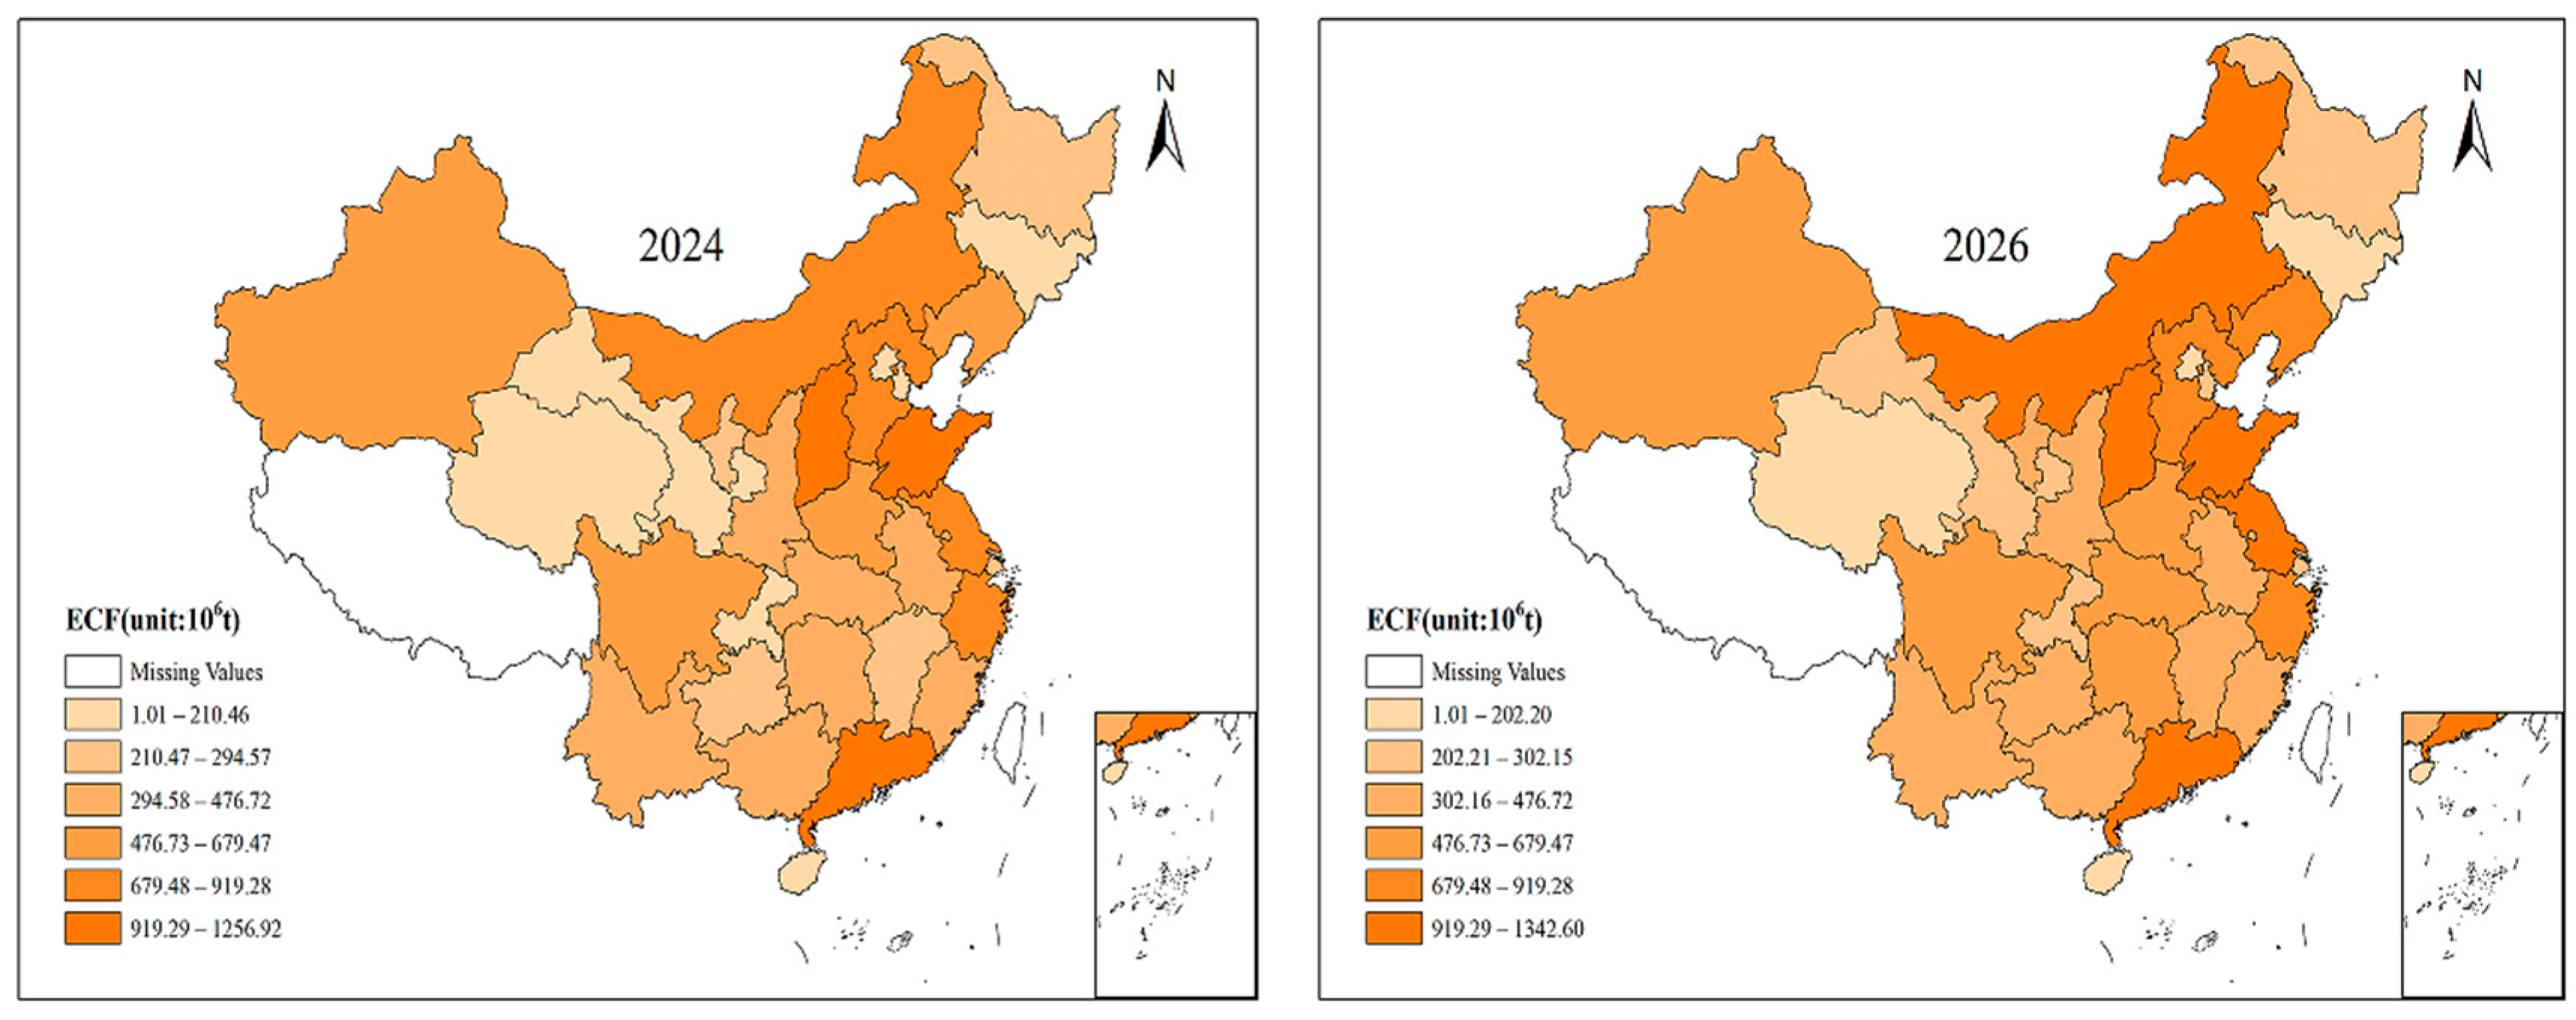
As shown in Figure 12, the forecast indicated that the ECF of China would maintain an upward trajectory from 2023 to 2026. Spatially, the distribution was expected to maintain the pattern of “higher in the north and lower in the south, stronger in the east and weaker in the west”, representing pronounced regional heterogeneity.
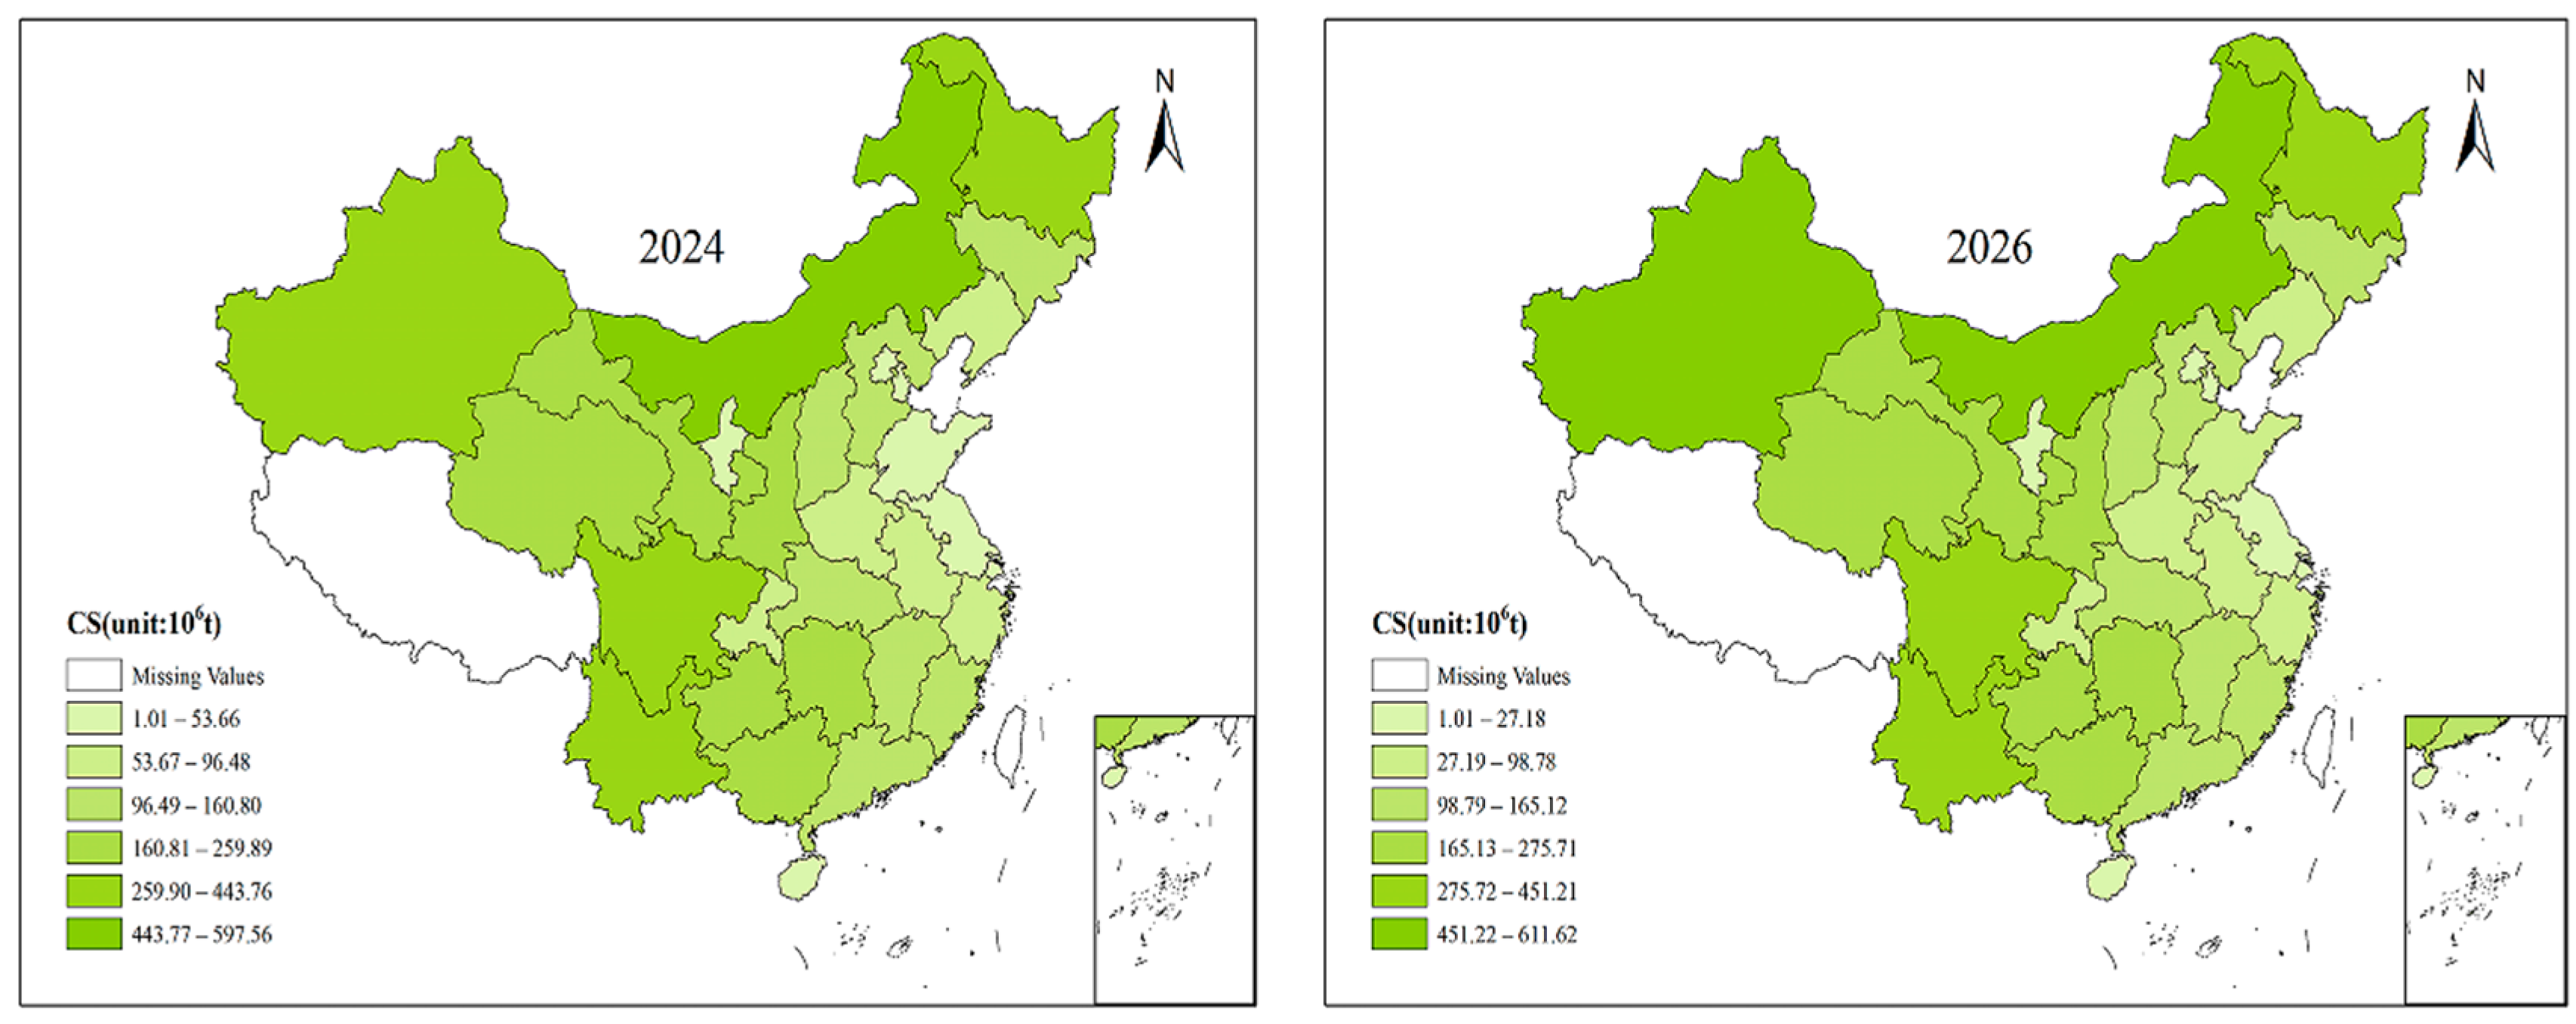
High-value regions were concentrated in resource-intensive and heavy-industry-dominated provinces, including Shanxi, Shandong, and Inner Mongolia. In 2024, Shandong was projected to reach the highest ECF of 1256.92 million tons, followed by Shanxi (1052.68 million tons) and Inner Mongolia (855.57 million tons). In 2026, it was expected to further increase, reaching 1342.59 million tons for Shandong, 1143.83 million tons for Shanxi, and 984.15 million tons for Inner Mongolia. These provinces shared an energy structure with coal accounting for over 60% of the mix and a high concentration of energy-intensive industries, resulting in persistent and significant short-term decarbonization challenges.
Medium-value regions included eastern coastal and central provinces, where ECF were expected to maintain steady growth. For example, Jiangsu and Zhejiang were projected to increase from 919.28 million tons and 801.64 million tons in 2024 to 962.83 million tons and 909.11 million tons in 2026, respectively. Central provinces such as Henan and Hubei would show relatively moderate growth, consistent with ongoing regional policies aimed at industrial restructuring, energy conservation, and emission reduction.
Low-value regions remained clustered in the southwest and northwest. Notably, Sichuan, Guizhou, and Ningxia provinces, although starting from a low base, exhibited a clear upward trend in ECF, reflecting expanding energy consumption. By 2026, the ECF of these regions were projected to reach 650.41 million tons, 310.19 million tons, and 310.18 million tons, respectively. Other consistently low-value regions included Hainan and Qinghai, with Hainan’s ECF projected to be around 70.61 million tons in 2026, consistent with its relatively clean energy structure and service-dominated economy.
Overall, China’s ECF was expected to sustain the current spatial distribution from 2024 to 2026, with high-emission regions becoming increasingly concentrated in resource-based and heavy-industry-dominated provinces. The spatial pattern showed signs of stabilizing structurally. Controlling emission growth would require accelerating the energy transition and industrial upgrading in high-emission regions, while proactively integrating green energy strategies into the development pathways of central and western provinces to avoid carbon lock-in and the spatial transfer of high-carbon industries.

3.4.2. Prediction of Vegetation Carbon Carrying Capacity

The projections indicated that the vegetation carbon carrying capacity of China would show a trend of slow increase or remain largely stable from 2023 to 2026, which aligned with the inherent inertia of ecosystem evolution and the cumulative nature of vegetation recovery (Figure 13). Spatially, high-value regions were consistently distributed across provinces rich in ecological resources. Inner Mongolia, Xinjiang, Heilongjiang, Sichuan and Yunnan continued to lead the country in carbon carrying capacity. By 2026, the carbon carrying capacity of these provinces was projected to reach approximately 611.62, 346.39, 502.19, 451.21, and 391.37 million tons, respectively, collectively underpinning the fundamental structure of China’s vegetation carbon carrying capacity.
Medium-value regions, such as Guangxi, Guizhou, Hunan, and Jiangxi in central and western China, showed a gradual upward trend in carbon carrying capacity. In 2026, the projected values for Guangxi, Guizhou, and Hunan were approximately 275.71, 199.36, and 187.98 million tons, respectively, forming an important supplement to the national vegetation carbon carrying capacity.
Low-value regions were concentrated in eastern coastal areas and certain provincial-level municipalities. In 2026, the projected vegetation carbon carrying capacity for Beijing, Tianjin, and Shanghai was approximately 17.75, 4.38, and 2.81 million tons, respectively, while Hainan was projected to reach about 16.69 million tons. The overall scale in these regions showed a notable gap compared to ecologically advantaged areas in central and western China. This spatial pattern corresponded to the limited available ecological space, high proportion of built-up land, and relatively low natural vegetation coverage in these areas.
Overall, China’s vegetation carbon carrying capacity was expected to exhibit a slow upward trend temporally and a relatively stable spatial pattern from 2023 to 2026. Ecologically resource-rich regions continued to play a critical supporting role in the national terrestrial carbon sink system. Although the gradual increase in vegetation carbon carrying capacity was unlikely to fully offset the rise in carbon emissions, it would help alleviate carbon balance pressure. This provided an important basis for subsequent carbon gap calculations and the development of regionally coordinated emission reduction strategies.

3.4.3. Prediction of NCF

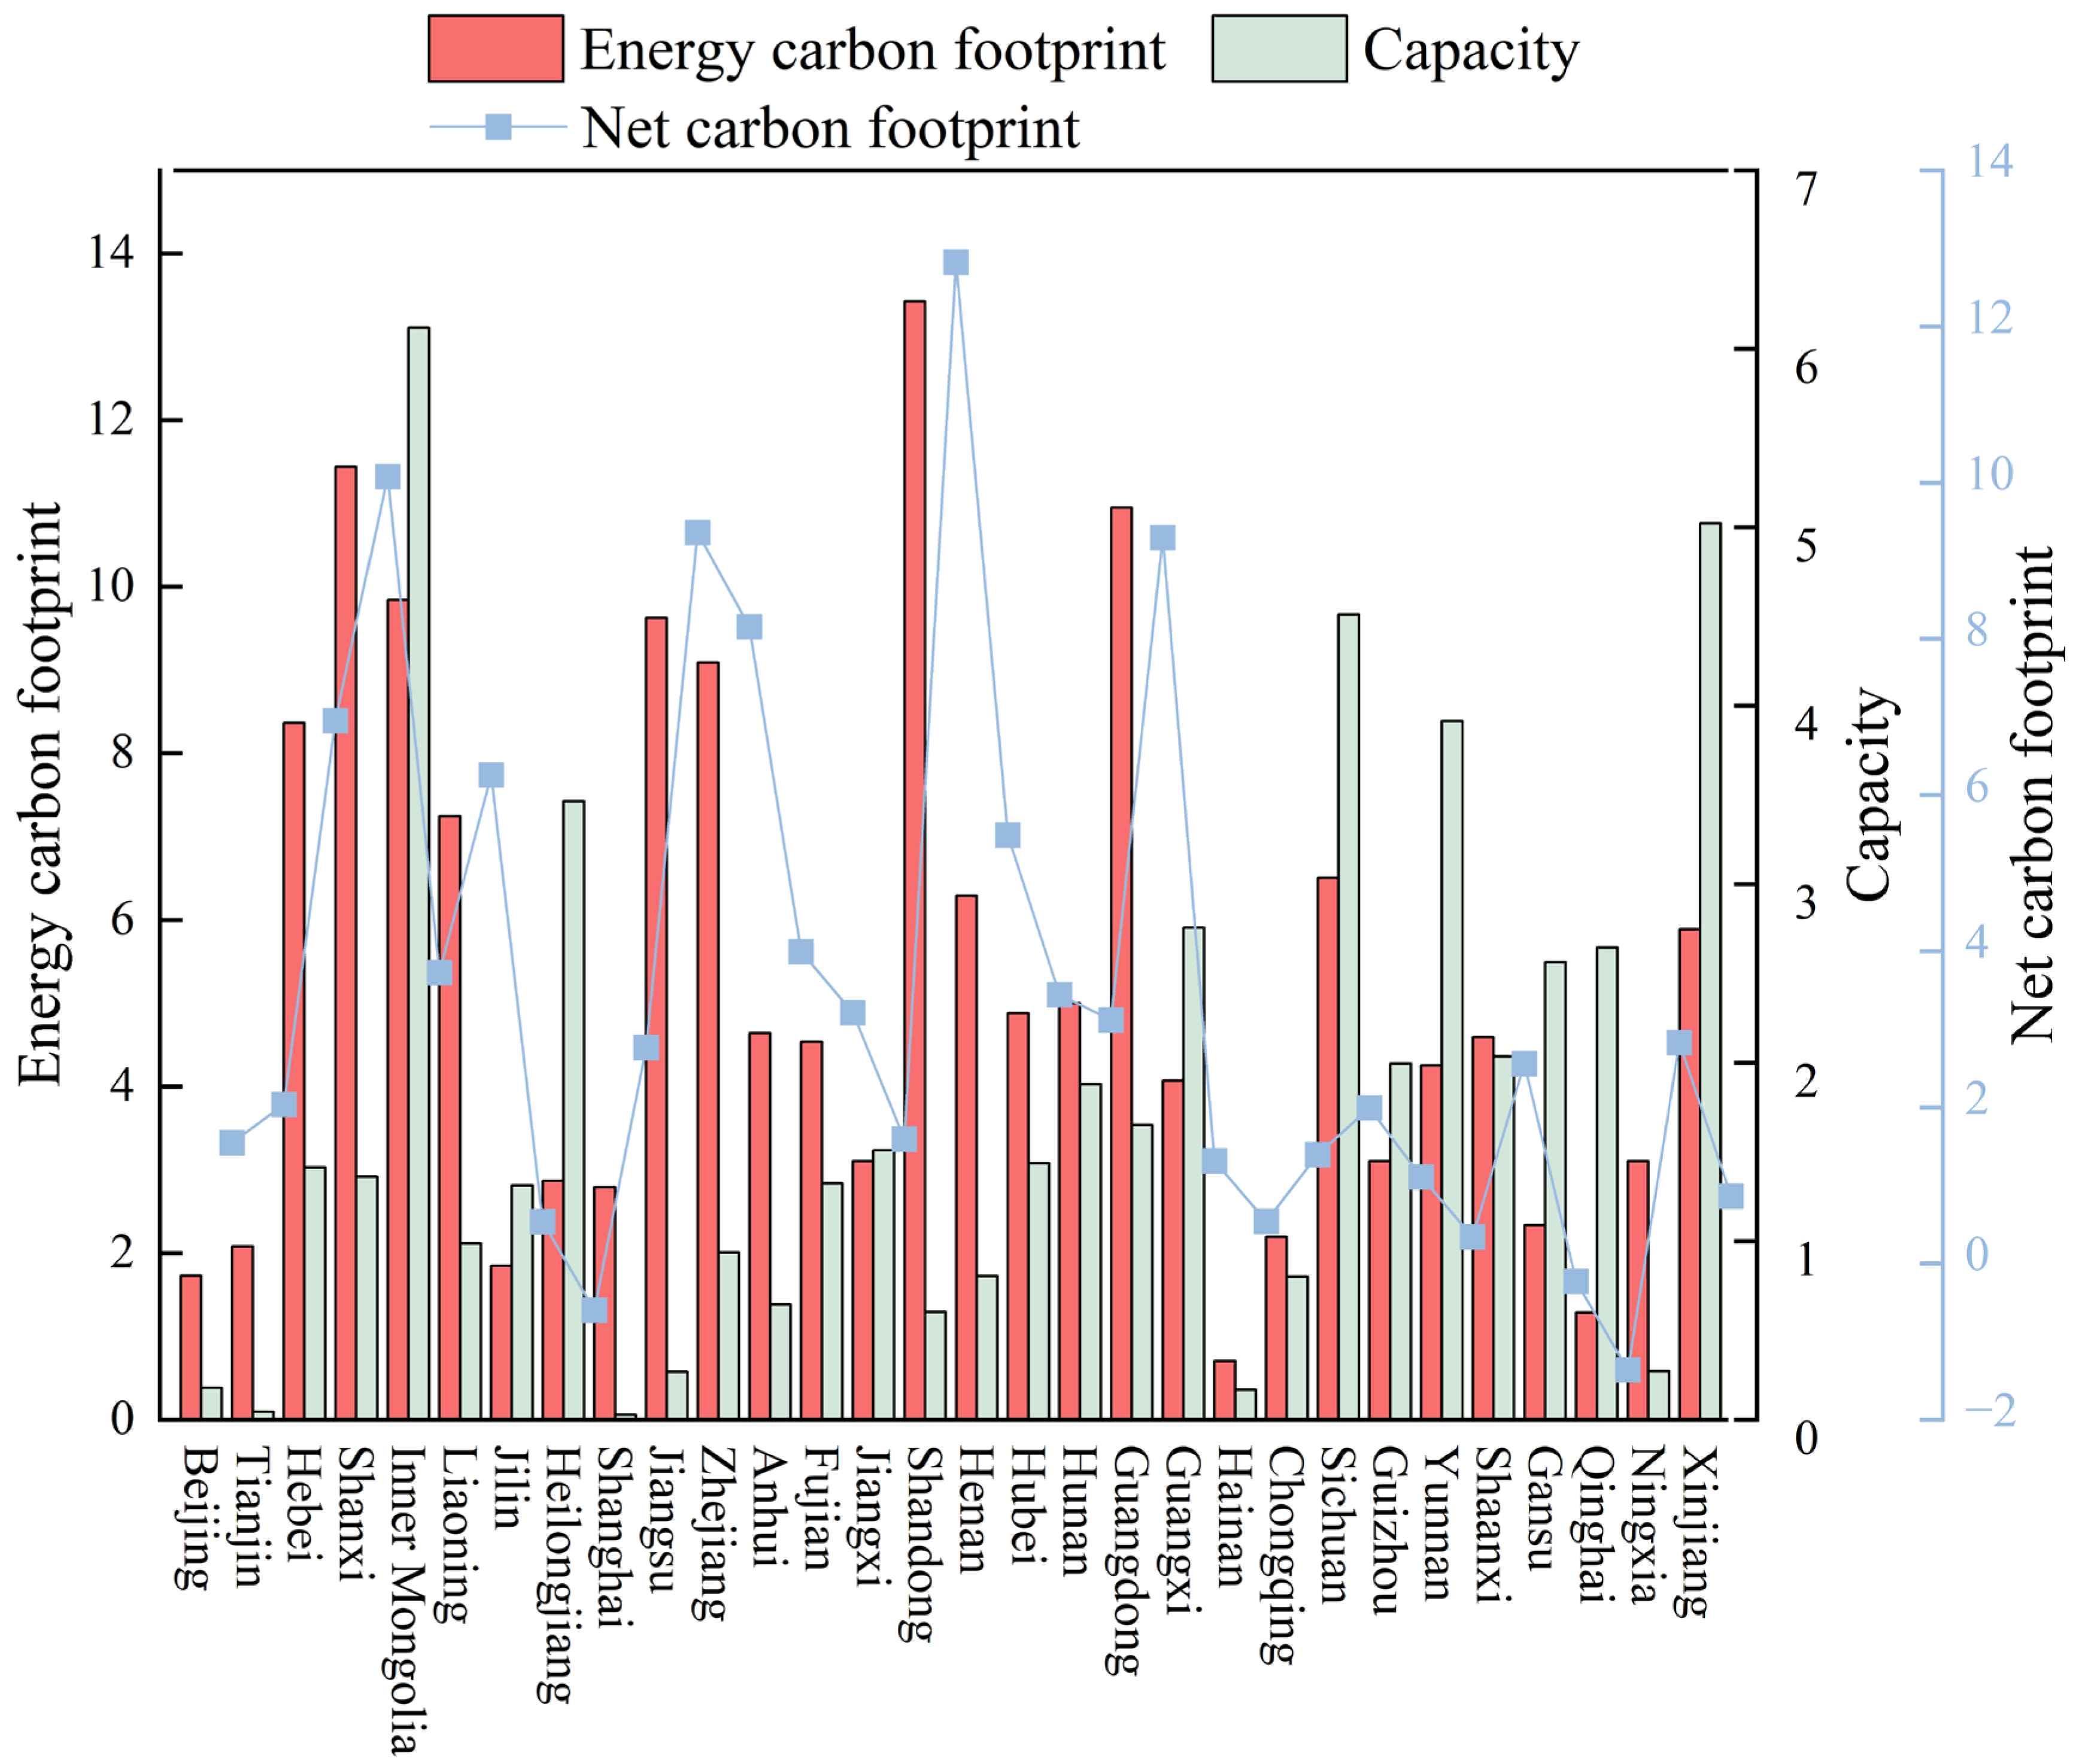
Figure 14 presented the forecasted trends of ECF, vegetation carbon carrying capacity, and NCF across provinces in 2026. It was found that the NCF remained positive for most provinces throughout the prediction period. This suggested that energy-related carbon emissions continued to exceed the instantaneous carbon carrying capacity of vegetation ecosystems, resulting in a persistent “carbon deficit”. The NCF of Shandong, Jiangsu, Guangdong, and Zhejiang in 2026 was projected to be approximately 1.282 billion tons, 0.936 billion tons, 0.929 billion tons, and 0.816 billion tons, respectively. It was indicated that these regions would face substantial ECFP, highlighting the need for continued efforts in energy structure optimization and energy efficiency improvements.
In contrast, several western ecological barrier regions exhibited relatively strong vegetation carbon carrying capacity. For example, the projected NCFs for Xinjiang and Yunnan in 2026 were approximately 86 million tons and 34 million tons, respectively. Although the ECF in these regions was expected to increase, they were partially offset by the comparatively high carbon carrying capacity of local vegetation. A few provinces may even achieve a “carbon surplus,” such as Gansu and Qinghai, with projected NCFs of approximately −23 million tons and −136 million tons in 2026, respectively, indicating that vegetation carbon carrying capacity exceeded ECF and contributed positively to China’s overall carbon balance.
Overall, the forecasted spatial patterns of ECF and vegetation carbon carrying capacity revealed a clear regional mismatch. Provinces characterized by “high footprint-low carrying capacity” were concentrated in the eastern coastal and parts of central regions, whereas “low footprint-high carrying capacity” provinces were predominantly located in western ecological barrier areas. This interprovincial disparity underscored the need for regionally differentiated mitigation strategies, including strengthening emission reduction constraints in high-footprint areas and enhancing carbon sequestration functions in ecologically advantageous regions, to progressively narrow the regional NCF gap and improve the overall resilience of the national carbon balance.

4. Conclusions, Limitations and Recommendations

4.1. Conclusions

This study systematically assessed the spatiotemporal evolution, driving factors, and future trends of provincial-level ECF and vegetation carbon carrying capacity in China. The main findings are summarized as follows:
  • The ECF exhibited rigid growth and spatial consolidation.
Temporally, China’s ECF increased from 12,039.88 million tons in 2015 to 13,896.41 million tons in 2022, representing a cumulative growth of 15.42%. Coal remained dominant throughout the period, accounting for an average of 60.88% of total ECF, followed by crude oil (15.18%) and coke (9.82%). Spatially, the “high in the north, low in the south; strong in the east, weak in the west” pattern remained highly stable.
2.
Vegetation carbon carrying capacity exhibited pronounced endowment differences and spatial mismatch with ECF.
Temporally, the vegetation carbon carrying capacity of China experienced moderate growth from 2015 to 2022, driven by sustained ecological protection policies and steady improvements in vegetation coverage, with forests and grassland as the primary contributors. Forests accounted for the largest share, followed by grassland, which supported regional carbon carrying capacity. Wetland and crops contributed relatively less but maintained steady growth. At the provincial level, vegetation carbon carrying capacity exhibited a distinct “high in the west, low in the east” pattern, with high-value regions concentrated in ecologically advantageous provinces such as Inner Mongolia, Yunnan, and Tibet.
3.
Economic growth and technological progress were core drivers of ECFP.
The STIRPAT model analysis revealed that economic growth and technological progress were the primary positive drivers of ECFP, indicating that the expansion of economic scale and the intensification of production activities were accompanied by synchronous increases in energy consumption and associated carbon emissions. In contrast, ecological intensity exerted a suppressive effect on ECFP, suggesting that ecological conservation and vegetation restoration measures enhanced carbon carrying capacity, thereby alleviating the ecological pressure resulting from increased carbon footprints.
4.
Future trends of ECF and carbon carrying capacity were clear.
GM (1,1) model forecasts indicated that the ECF of China from 2023 to 2026 would continue to rise, though at a slower pace. The high-emission regions further concentrated in resource-based and heavy-industry-dominated provinces, and the spatial distribution pattern remained stable. Vegetation carbon carrying capacity was projected to maintain moderate growth, with carbon sequestration potential gradually released in ecologically advantageous provinces. Overall, the national-level carbon balance would remain in a “carbon deficit” state, but coordinated efforts in emission reduction and carbon sink enhancement were expected to gradually narrow the carbon gap.

4.2. Limitations

Although this study revealed the spatiotemporal patterns between the ECF and vegetation carbon carrying capacity in China, and quantitatively identified the key driving factors of ECFP, several research limitations remained that warrant further investigation and refinement in future work.
Firstly, constrained by the availability of macro-scale data, this study adopted the fixed NEP in estimating carbon carrying capacity. This approach could not fully capture the differences in carbon carrying capacity among vegetation types (e.g., coniferous versus broadleaf forests), forest age structures (e.g., young versus mature forests), and climatic regions, potentially introducing biases in the estimation of carbon sinks. Future studies should incorporate high-resolution remote sensing inversion data (e.g., MODIS GPP) in combination with forest inventory data to develop dynamic NEP models that would account for vegetation type, forest age structure, and climatic differentiation, thereby improving the spatiotemporal accuracy of carbon carrying capacity assessments.
Secondly, regarding the accounting boundaries, this study primarily focused on fossil energy consumption and did not incorporate emissions from industrial processes or carbon emissions embodied in inter-provincial trade into the analytical framework, which may result in an underestimation of the ECF of manufacturing provinces. Future research could introduce a multi-regional input–output (MRIO) model to conduct a full life cycle carbon footprint assessment, thereby providing a comprehensive understanding of the true scale of regional ECF.
Thirdly, the GM (1,1) model was employed to forecast the ECF and vegetation carbon carrying capacity. Although this model was suited for small-sample time series data, the short observation period (2015–2022) limited the ability to capture structural changes that may arise from external shocks, major policy interventions, or technological breakthroughs in the long term. Consequently, the projected results were primarily interpreted as trend references rather than precise predictions, with uncertainties expected to accumulate as the forecasting horizon extended. Future studies could incorporate scenario analysis frameworks coupled with system dynamics models to conduct multi-scenario simulations, thereby enabling a more comprehensive assessment of the potential ranges of future carbon balance.

4.3. Recommendations

Based on a comprehensive analysis of spatial distribution, driving factors, and future trends of ECF and vegetation carbon carrying capacity, the following targeted policy recommendations were proposed to support the achievement of carbon neutrality.
  • Develop differentiated emission reduction strategies.
High-ECF regions with entrenched emissions (e.g., Shandong, Shanxi, Inner Mongolia): Implement a dual strategy of “strict controlling of incremental emissions and optimization of existing stocks.” Enforce combined constraints on energy consumption and carbon emissions, and establish absolute reduction roadmaps based on peak targets. Key measures included breaking the “coal-electricity” industrial loop, leveraging national major project layouts, and the mandating integration of non-fossil energy sources such as wind, solar, hydrogen, and storage. The aim was to create zero-carbon industrial demonstration zones and shift energy bases from “fuel supply” toward “green energy and materials.”
Economically developed high-emission provinces (e.g., Jiangsu, Zhejiang, Guangdong): Utilize technological advantages to implement advanced energy efficiency and carbon standards in high-growth sectors such as data centers and transportation. Focus on electrification and intelligent system upgrades. Additionally, explore carbon accounting and management systems based on supply chains and final consumption.
Rapidly growing midwestern and western provinces: Apply environmental access and energy efficiency standards in eastern regions during early-stage industrial planning. Avoid constructing high-carbon infrastructure to prevent the formation of new emission lock-ins.
2.
Strengthen ecological environments and enhance carbon carrying capacity reserves.
Ecologically advantageous provinces (e.g., Sichuan, Tibet, Inner Mongolia): Enhance the per-unit-area carbon sequestration of existing forests and grassland through scientific management, restoration, and prevention of degradation. Establish operational inter-regional ecological compensation and carbon sink trading mechanisms to convert ecological benefits into economic incentives.
Carbon-deficit eastern provinces: Explore local carbon sequestration potential by mandating increased green spaces in urban planning, developing urban forest, and promoting carbon-sequestering agriculture. Incorporate regional carbon sink increments into local ecological performance assessments to incentivize local carbon enhancement.
3.
Improve coordination mechanisms and promote integrated “dual-carbon” goals.
Develop province-specific carbon balance plans, encouraging high-carbon provinces (e.g., Shandong, Guangdong) to cooperate with carbon-surplus provinces (e.g., Sichuan, Tibet) in cross-regional carbon sink initiatives. Strengthen carbon trading markets and introduce incentive policies to guide social capital toward low-carbon sectors, fostering nationwide participation in carbon reduction. Promote systemic economic and social transformation.
Integrate carbon emission constraints systematically into land use planning, industrial policy, and financial regulation. Continuously leverage economic instruments such as carbon pricing and green finance to incentivize energy structure optimization and technological innovation, thereby fundamentally reducing the dependence of economic growth on high energy consumption.


Author Contributions

Conceptualization, S.D., Y.H. and H.L.; Methodology, S.D., C.G. and M.Z.; Software, C.G.; Validation, C.G.; Formal analysis, S.D., Y.H. and Y.Z.; Investigation, S.D., Y.H. and Y.Z.; Resources, S.D. and X.X.; Data curation, S.D. and M.Z.; Writing—original draft, S.D.; Writing—review & editing, W.H.; Visualization, W.H. and P.H.; Supervision, J.H. and H.L.; Project administration, W.H. and X.X.; Funding acquisition, W.H., J.H. and P.H. All authors have read and agreed to the published version of the manuscript.

Funding

This work was supported by Zhejiang Provincial Natural Science Foundation of China (LTGS23E080007), Scientific and Technological Innovation Activities Plan for College Students in Zhejiang Province in 2025 (New Talents Program) (2025R407A021) and National Key Research and Development Project (2022YFE0210700).

Data Availability Statement

The authors sincerely thank the National Bureau of Statistics of China for providing access to the open database of China Statistical Yearbook, China Environmental Statistical Yearbook, China Energy Statistical Yearbook and provincial statistical yearbooks for noncommercial purposes.

Conflicts of Interest

The authors declare no conflict of interest.

References

  1. Labaran, Y.H.; Mathur, V.S.; Muhammad, S.U.; Musa, A.A. Carbon footprint management: A review of construction industry. Clean. Eng. Technol. 2022, 9, 100531. [Google Scholar] [CrossRef] [Scilit]
  2. Liu, Z.; Deng, Z.; Davis, S.J.; Ciais, P. Global carbon emissions in 2023. Nat. Rev. Earth Environ. 2024, 5, 253–254. [Google Scholar] [CrossRef] [Scilit]
  3. Bilgili, M.; Tumse, S.; Nar, S. Comprehensive overview on the present state and evolution of global warming, climate change, greenhouse gasses and renewable energy. Arab. J. Sci. Eng. 2024, 49, 14503–14531. [Google Scholar] [CrossRef] [Scilit]
  4. Jiang, F.; Chen, B.; Li, P.; Jiang, J.; Zhang, Q.; Wang, J.; Deng, J. Spatio-temporal evolution and influencing factors of synergizing the reduction of pollution and carbon emissions-Utilizing multi-source remote sensing data and GTWR model. Environ. Res. 2023, 229, 115775. [Google Scholar] [CrossRef] [Scilit]
  5. Sun, K.; Tong, K.; Xu, J.; Shan, Y. Developing a novel city-wide useful energy demand model based on detailed energy conversion processes. Energy 2025, 323, 135833. [Google Scholar] [CrossRef] [Scilit]
  6. Zhang, Z.; Dai, X.; Xie, Z.; Yu, C.; Liao, Z.; Li, J.; Jiang, F.; Liu, Y.; Liu, Z.; Zhang, Q. Spatiotemporal variation characteristics and influencing factors of air quality in Sichuan-Chongqing region, China, 2016–2020. Environ. Earth Sci. 2025, 84, 115. [Google Scholar] [CrossRef] [Scilit]
  7. Guo, X.; Liu, Y.; Xie, T.; Li, Y.; Liu, H.; Wang, Q. Impact of Ecological Restoration on Carbon Sink Function in Coastal Wetlands: A Review. Water 2025, 17, 488. [Google Scholar] [CrossRef] [Scilit]
  8. Yang, Y.; Shi, Y.; Sun, W.; Chang, J.; Zhu, J.; Chen, L.; Wang, X.; Guo, Y.; Zhang, H.; Yu, L. Terrestrial carbon sinks in China and around the world and their contribution to carbon neutrality. Sci. China Life Sci. 2022, 65, 861–895. [Google Scholar] [CrossRef] [Scilit]
  9. Hakkak, M.; Altintaş, N.; Hakkak, S. Exploring the relationship between nuclear and renewable energy usage, ecological footprint, and load capacity factor: A study of the Russian Federation testing the EKC and LCC hypothesis. Renew. Energy Focus 2023, 46, 356–366. [Google Scholar] [CrossRef] [Scilit]
  10. Zhang, Y.; Yue, Q.; Wang, H.; Wang, H.; Du, T.; Wang, Q.; Ji, W. Analysis of carbon emission and energy consumption transfer characteristics of China’s iron and steel industry. Energy 2025, 318, 134924. [Google Scholar] [CrossRef] [Scilit]
  11. Tian, L.; Chai, J.; Zhang, X.; Pan, Y. Spatiotemporal evolution and driving factors of China’s carbon footprint pressure: Based on vegetation carbon sequestration and LMDI decomposition. Energy 2024, 310, 133299. [Google Scholar] [CrossRef] [Scilit]
  12. Gao, T.; Jin, P.; Song, D.; Chen, B. Tracking the carbon footprint of China’s coal-fired power system. Resour. Conserv. Recycl. 2022, 177, 105964. [Google Scholar] [CrossRef] [Scilit]
  13. Liu, H.; Guo, W. Comparative study on life cycle energy consumption, carbon emissions and economic performance of various coke-oven gas utilization schemes. Fuel 2023, 332, 125706. [Google Scholar] [CrossRef] [Scilit]
  14. Jie, H.; Khan, I.; Alharthi, M.; Zafar, M.W.; Saeed, A. Sustainable energy policy, socio-economic development, and ecological footprint: The economic significance of natural resources, population growth, and industrial development. Util. Policy 2023, 81, 101490. [Google Scholar] [CrossRef] [Scilit]
  15. Cheng, J.; Huang, C.; Gan, X.; Peng, C.; Deng, L. Can forest carbon sequestration offset industrial CO2 emissions? A case study of Hubei Province, China. J. Clean. Prod. 2023, 426, 139147. [Google Scholar] [CrossRef] [Scilit]
  16. Zhao, X.; Ma, X.; Chen, B.; Shang, Y.; Song, M. Challenges toward carbon neutrality in China: Strategies and countermeasures. Resour. Conserv. Recycl. 2022, 176, 105959. [Google Scholar] [CrossRef] [Scilit]
  17. Chen, B.Z.; Chen, F.H.; Ciais, P.; Zhang, H.F.; Lü, H.G.; Wang, T.; Chevallier, F.; Liu, Z.; Yuan, W.P.; Peters, W. Challenges to achieve carbon neutrality of China by 2060: Status and perspectives. Sci. Bull. 2022, 67, 2030–2035. [Google Scholar] [CrossRef] [Scilit]
  18. Brandão, M.; Levasseur, A.; Kirschbaum, M.U.; Weidema, B.P.; Cowie, A.L.; Jørgensen, S.V.; Hauschild, M.Z.; Pennington, D.W.; Chomkhamsri, K. Key issues and options in accounting for carbon sequestration and temporary storage in life cycle assessment and carbon footprinting. Int. J. Life Cycle Assess. 2013, 18, 230–240. [Google Scholar] [CrossRef] [Scilit]
  19. Henriques, C.O.; Sousa, S. A review on economic input-output analysis in the environmental assessment of electricity generation. Energies 2023, 16, 2930. [Google Scholar] [CrossRef] [Scilit]
  20. Fu, W.; Luo, M.; Chen, J.; Udimal, T.B. Carbon footprint and carbon carrying capacity of vegetation in ecologically fragile areas: A case study of Yunnan. Phys. Chem. Earth 2020, 120, 102904. [Google Scholar] [CrossRef] [Scilit]
  21. Abbasi, K.R.; Shahbaz, M.; Zhang, J.; Irfan, M.; Alvarado, R. Analyze the environmental sustainability factors of China: The role of fossil fuel energy and renewable energy. Renew. Energy 2022, 187, 390–402. [Google Scholar] [CrossRef] [Scilit]
  22. Yang, P.J.; Peng, S.; Benani, N.; Dong, L.Y.; Li, X.M.; Liu, R.P.; Mao, G.Z. An integrated evaluation on China’s provincial carbon peak and carbon neutrality. J. Clean. Prod. 2022, 377, 134497. [Google Scholar] [CrossRef] [Scilit]
  23. Feng, Q.; Zhang, X.; Wu, J.; Fu, Z.; Wu, N.; Wang, Y. Provincial–level evaluation of pollution reduction and carbon mitigation in China based on Driving Force–Pressure–State–Impact–Response framework. Atmos. Pollut. Res. 2025; in press. [CrossRef] [Scilit]
  24. Wang, J.; Chen, L.; Chen, L.; Zhao, X.; Wang, M.; Ju, Y.; Xin, L. City-level features of energy footprints and carbon dioxide emissions in Sichuan Province of China. Energies 2019, 12, 2025. [Google Scholar] [CrossRef] [Scilit]
  25. Liu, Z.; Deng, Z.; He, G.; Wang, H.; Zhang, X.; Lin, J.; Qi, Y.; Liang, X. Challenges and opportunities for carbon neutrality in China. Nat. Rev. Earth Environ. 2022, 3, 141–155. [Google Scholar] [CrossRef] [Scilit]
  26. Fan, W.; Huang, S.; Yu, Y.; Xu, Y.; Cheng, S. Decomposition and decoupling analysis of carbon footprint pressure in China’s cities. J. Clean. Prod. 2022, 372, 133792. [Google Scholar] [CrossRef] [Scilit]
  27. Huang, Y.; Yu, Q.; Wang, R.R. Driving factors and decoupling effect of carbon footprint pressure in China: Based on net primary production. Technol. Forecast. Soc. Change 2021, 167, 120722. [Google Scholar] [CrossRef] [Scilit]
  28. Zhou, W.; Cao, X.; Zhen, D.X. The effects of carbon-related news on carbon emissions and carbon transfer from a global perspective: Evidence from an extended STIRPAT model. J. Clean. Prod. 2023, 425, 138974. [Google Scholar] [CrossRef] [Scilit]
  29. Shan, Y.; Liu, J.; Liu, Z.; Xu, X.; Shao, S.; Wang, P.; Guan, D. New provincial CO2 emission inventories in China based on apparent energy consumption data and updated emission factors. Appl. Energy 2016, 184, 742–750. [Google Scholar] [CrossRef] [Scilit]
  30. Zhao, Y.; Wang, T.; Yi, W. Emergy-accounting-based comparison of carbon emissions of solid waste recycled concrete. Constr. Build. Mater. 2023, 387, 131674. [Google Scholar] [CrossRef] [Scilit]
  31. Mancini, M.S.; Galli, A.; Niccolucci, V.; Lin, D.; Bastianoni, S.; Wackernagel, M.; Marchettini, N. Ecological footprint: Refining the carbon footprint calculation. Ecol. Indic. 2016, 61, 390–403. [Google Scholar] [CrossRef] [Scilit]
  32. Chen, W.; Zhang, Q.; Wang, C.; Li, Z.; Geng, Y.; Hong, J.; Cheng, Y. Environmental sustainability challenges of China’s steel production: Impact-oriented water, carbon and fossil energy footprints assessment. Ecol. Indic. 2022, 136, 108660. [Google Scholar] [CrossRef] [Scilit]
  33. Peng, B.; Li, Y.; Elahi, E.; Wei, G. Dynamic evolution of ecological carrying capacity based on the ecological footprint theory: A case study of Jiangsu province. Ecol. Indic. 2019, 99, 19–26. [Google Scholar] [CrossRef] [Scilit]
  34. Wang, Y.; Xie, T.; Yang, S. Carbon emission and its decoupling research of transportation in Jiangsu Province. J. Clean. Prod. 2017, 142, 907–914. [Google Scholar] [CrossRef] [Scilit]
  35. Fan, W.; Song, X.; Liu, M.; Shan, B.; Ma, M.; Liu, Y. Spatio-temporal evolution of resources and environmental carrying capacity and its influencing factors: A case study of Shandong Peninsula urban agglomeration. Environ. Res. 2023, 234, 116469. [Google Scholar] [CrossRef] [Scilit]
  36. Yang, X.; Bai, B.; Bai, Z. Research on Spatiotemporal Changes in Carbon Footprint and Vegetation Carbon Carrying Capacity in Shanxi Province. Forests 2023, 14, 1295. [Google Scholar] [CrossRef] [Scilit]
  37. Wang, C.; Wang, F.; Zhang, X.; Yang, Y.; Su, Y.; Ye, Y.; Zhang, H. Examining the driving factors of energy related carbon emissions using the extended STIRPAT model based on IPAT identity in Xinjiang. Renew. Sustain. Energy Rev. 2017, 67, 51–61. [Google Scholar] [CrossRef] [Scilit]
  38. Majeed, M.T.; Khan, S.; Tahir, T. Analytical tool for unpacking the driving forces of environmental impact: An IPAT analysis of Pakistan. Geojournal 2022, 87, 1439–1451. [Google Scholar] [CrossRef] [Scilit]
  39. Usman, A.; Ozturk, I.; Naqvi, S.M.M.A.; Ullah, S.; Javed, M.I. Revealing the nexus between nuclear energy and ecological footprint in STIRPAT model of advanced economies: Fresh evidence from novel CS-ARDL model. Prog. Nucl. Energy 2022, 148, 104220. [Google Scholar] [CrossRef] [Scilit]
  40. Jiang, H.D.; Liu, L.J.; Dong, K.Y.; Fu, Y.W. How will sectoral coverage in the carbon trading system affect the total oil consumption in China? A CGE-based analysis. Energy Econ. 2022, 110, 105996. [Google Scholar] [CrossRef] [Scilit]
  41. Sapnken, F.E. A new hybrid multivariate grey model based on genetic algorithms optimization and its application in forecasting oil products demand. Grey Syst. Theory Appl. 2023, 13, 406–420. [Google Scholar] [CrossRef] [Scilit]
  42. Liu, S.; Yang, Y.; Xie, N.; Forrest, J. New progress of grey system theory in the new millennium. Grey Syst. Theory Appl. 2016, 6, 2–31. [Google Scholar] [CrossRef] [Scilit]
  43. Wu, G.; Hu, Y.-C.; Chiu, Y.-J.; Tsao, S.-J. A new multivariate grey prediction model for forecasting China’s regional energy consumption. Environ. Dev. Sustain. 2023, 25, 4173–4193. [Google Scholar] [CrossRef] [Scilit]

  44. Kalnins, A. Multicollinearity: How common factors cause Type 1 errors in multivariate regression. Strateg. Manag. J. 2018, 39, 2362–2385. [Google Scholar] [CrossRef] [Scilit]
Figure 1. Flowchart and research method of the energy carbon footprint and vegetation carbon carrying capacity in China.
Energies 19 01618 g001
Figure 2. The geographical location of the study area.
Energies 19 01618 g002
Figure 3. Energy carbon footprint and growth rate of China from 2015 to 2022.
Energies 19 01618 g003
Figure 4. Average and proportion of carbon footprint of eight energy sources in China from 2015 to 2022.
Energies 19 01618 g004
Figure 5. Temporal evolution of energy carbon footprint from 2015 to 2022.
Energies 19 01618 g005
Figure 6. Spatial distribution of energy carbon footprint of China for 2015, 2017, 2019, and 2022.
Energies 19 01618 g006
Figure 7. The vegetation carbon carrying capacity and growth rate from 2015 to 2022.
Energies 19 01618 g007
Figure 8. The carbon carrying capacity of forest, grassland, wetland and crops from 2015 to 2022 in China.
Energies 19 01618 g008
Figure 9. Temporal evolution of carbon carrying capacity of four vegetation types from 2015 to 2022 in China.
Energies 19 01618 g009
Figure 10. The vegetation carbon carrying capacity of China for 2015, 2017, 2019, and 2022.
Energies 19 01618 g010
Figure 11. Comparison of observed and predicted energy carbon footprint and vegetation carbon carrying capacity values across 30 provinces in China (2021–2022).
Energies 19 01618 g011
Figure 12. Projections of China’s energy carbon footprint for 2024 and 2026.
Energies 19 01618 g012
Figure 13. Projections of China’s vegetation carbon carrying capacity for 2024 and 2026.
Energies 19 01618 g013
Figure 14. Spatial distribution of predicted energy carbon footprint, carrying capacity, and net carbon footprint across provinces of China in 2026.
Energies 19 01618 g014
Table 1. Values of of NCVi, CEFi and CORi of various energy sources.
EnergyNCV (kJ/kg kJ/m3)CEF (tc/TJ)COR (%)Standard Coal Coefficient (kgce/kg)/(kgce/m3)
Coal20,934.4226.37940.71
Coke28,470.3729.42930.97
Crude oil41,871.6920.08891.43
Gasoline43,127.6218.9981.47
Kerosene42,129.0919.5981.47
Diesel42,711.3920.2981.46
Fuel oil41,877.4121.1981.43
Natural gas38,988.4215.32991.33
Table 2. Economic coefficients of the main crops.
Main CropsEconomic Coefficient
Rice0.47
Wheat0.35
Corn0.35
Other Cereal0.40
Beans0.18
Cotton0.35
Oilseeds0.39
Sugar Crops0.84
Table 3. Description of variables used in the analysis of the STIRPAT model.
VariablesSymbolDefinition
Energy structureECoal carbon footprint per total energy carbon footprint
Technological progressTEnergy consumption per unit of gross domestic product
Economic growthAGross domestic product divided by population
Population scalePPermanent population per unit ecological area in the region
Ecological intensitySForest coverage rate
Table 4. Accuracy levels of GM (1,1) model fit for energy carbon footprint and vegetation carbon carrying capacity.
Small Error Probability P CriterionPosterior Error ratio C CriterionDescription of Predictive Accuracy
Level 1P ≥ 0.80C ≤ 0.50Highest predictive accuracy; excellent model fit; trend is highly reliable
Level 2P ≥ 0.70C ≤ 0.65High predictive accuracy; results are reliable; trend can be referenced
Level 3P ≥ 0.60C ≤ 0.80Moderate predictive accuracy; errors are somewhat larger; trend can be used for preliminary assessment
Level 4Did not meet the above criteriaDid not meet the above criteriaLow predictive accuracy; trend reliability is insufficient
Table 5. Correlation analysis of driving factors for energy carbon footprint pressure.
Ln ECFPLn ELn TLn ALn PLn S
Ln ECFP1.000
Ln E−0.2311.000
Ln T−0.2720.5281.000
Ln A0.616−0.518−0.5921.000
Ln P0.859−0.381−0.6480.5931.000
Ln S−0.223−0.115−0.5340.0260.2131.000
Table 6. Ordinary least squares results of energy carbon footprint pressure driving factors.
VariablesUnstandardized Coefficientst-StatisticVIF
C−2.578−33.694
Ln E0.1346.1671.552
Ln T0.98624.8153.492
Ln A0.99122.4812.116
Ln P1.09182.2131.966
Ln S−0.437−18.7591.745
Notes: R2: 0.972, F-statistic: 1972.17.
Table 7. Comparison of regression results and model selection.
VariablesRandom EffectsTwo-Way Fixed Effects
C−2.290−1.668
Ln E0.0690.018
Ln T1.0811.279
Ln A0.9691.386
Ln P0.9800.485
Ln S−0.286−0.161
Hausman test (p-value)--<0.01
R20.9780.986
Table 8. Prediction accuracy of GM (1,1) model for energy carbon footprint and vegetation carbon carrying capacity.
ProvincesMAPE (%)PCAccuracy Level
Beijing3.120.940.28Level 1
Tianjin4.050.920.35Level 1
Hebei5.630.890.41Level 1
Shanxi6.240.870.45Level 1
Inner Mongolia4.870.910.36Level 1
Liaoning3.950.930.32Level 1
Jilin5.120.900.39Level 1
Heilong
jiang
6.480.850.48Level 1
Shanghai2.860.950.25Level 1
Jiangsu3.740.940.30Level 1
Zhejiang3.420.930.29Level 1
Anhui4.880.900.37Level 1
Fujian4.260.910.35Level 1
Jiangxi5.340.890.42Level 1
Shandong3.910.920.33Level 1
Henan5.680.880.44Level 1
Hubei4.720.900.38Level 1
Hunan4.510.910.36Level 1
Guangdong3.270.940.28Level 1
Guangxi5.620.880.41Level 1
Hainan3.840.920.32Level 1
Chongqing4.620.910.36Level 1
Sichuan4.150.910.34Level 1
Guizhou5.970.870.46Level 1
Yunnan5.430.890.42Level 1
Tibet6.810.850.50Level 1
Shaanxi4.760.900.37Level 1
Gansu5.890.870.45Level 1
Qinghai6.550.860.49Level 1
Ningxia4.680.900.38Level 1
Disclaimer/Publisher’s Note: The statements, opinions and data contained in all publications are solely those of the individual author(s) and contributor(s) and not of MDPI and/or the editor(s). MDPI and/or the editor(s) disclaim responsibility for any injury to people or property resulting from any ideas, methods, instructions or products referred to in the content.