Article

Assessing Collective Self-Consumption in Early Urban Planning Stages: What Matters Most? †

1
Laboratoire des Sciences de l’Ingénieur pour l’Environnement (LaSIE UMR CNRS 7356), La Rochelle University, 23 Avenue Albert Einstein, BP 33060, 17031 La Rochelle, France
2
TERAO, 37 Rue de Lyon, 75012 Paris, France
*
Authors to whom correspondence should be addressed.
This paper is an extended version of our paper published in Building Simulation 2023: 18th Conference of IBPSA, Shanghai, China, 4–6 September 2023; pp. 2882–2889.
Energies 2026, 19(6), 1550; https://doi.org/10.3390/en19061550
Submission received: 30 January 2026 / Revised: 11 March 2026 / Accepted: 13 March 2026 / Published: 20 March 2026

Abstract

The deployment of distributed renewable energy systems at the neighborhood scale is a key lever for urban decarbonization. In Europe, the regulatory framework now enables collective self-consumption, allowing multiple end-users to share locally produced energy. However, the complexity and early-stage uncertainties of such projects, especially in new district development, pose challenges for feasibility assessment and investor confidence. This study proposes a method to identify the impact of numerous technical, economic, and social parameters that may affect the feasibility of a project and that are uncertain at the early design stage, across multiple key performance indicators, thus addressing the concerns of various stakeholders. A key objective is to provide an integrated method applicable during the early stages of district development, when the integration of a collective self-consumption scheme is under consideration. The developed tools and methods are compatible with the available data at this stage and provide a basis for multi-criteria analysis. The simulation workflow was built around URBANopt and enhanced with probabilistic occupancy modeling, energy sharing mechanisms, and financial analysis modules. It was further complemented by sensitivity and risk analysis layers. The method was applied to a pre-design case study, illustrating how key design and operational uncertainties influence project viability. The results showed that despite the uncertainties on a wide array of parameters, reliable risk assessment per KPI could be performed on only a handful of parameters, which were identified through a sensitivity analysis using the Morris screening method.

1. Introduction

In the context of global warming, decarbonizing urban areas is crucial since the built environment accounts for a significant share of global greenhouse gas emissions [1]. Mitigating these emissions requires reducing energy consumption through energy sufficiency, enhancing energy efficiency (e.g., improved building insulation and HVAC systems), and expanding renewable energy sources [2]. Despite meeting widespread support, the deployment of renewable energy remains insufficient to meet the pressing challenges of the climate crisis. In France, for example, the current pace of renewable energy development falls short of achieving carbon neutrality, even under scenarios incorporating the lowest renewable energy targets [3].
Renewable Energy Community (REC) projects emerge as a promising mechanism to accelerate renewable energy expansion [4,5,6,7,8,9]. By pooling financial resources and involving a larger number of end-users, more ambitious projects can be undertaken, particularly in contexts where individual initiatives might struggle, such as installing solar PV systems on multi-residential buildings [10,11]. Beyond technical advantages, RECs generate socio-economic benefits by providing locally produced energy at favorable rates, thereby stimulating local economies. Within the European Union (EU), RECs commonly adopt the Collective Self-Consumption (CSC) framework, which involves the shared generation and consumption of energy among two or more end-users [12].
Despite its attractive prospects, CSC faces several barriers to implementation, such as high initial investments, a lack of clear benefits for both investors and end-users (especially with a regulatory framework that is still evolving), and a lack of experience from stakeholders [10,13]. These challenges are particularly pronounced in new urban developments, where CSC analyses must be conducted early in the design phase when many parameters remain uncertain. However, these new developments are ideal for CSC projects because they inherently involve a large number of future end-users and allow for the seamless integration of renewable energy systems into urban planning. Essentially, the development of a CSC project takes time. A reliable early-stage vision, even if simplified, is crucial to set the project on the right track [13]. The objective of this work is to explore analytical methods applicable to these stages of urban development projects to assist engineers, planners, and investors in their decision-making processes. This work is an extended version of our paper published in the 18th Conference of IBPSA, Building Simulation 2023 [14].
Numerous studies have examined the feasibility, financial and organizational models, and socio-economic impacts of CSC projects. For instance, studies by d’Adamo et al. [15] and Villalonga-Palou et al. [16] highlighted the critical roles of investment costs, government incentives, tariffs, and profit distribution in the viability of CSC projects. Other research has emphasized the importance of considering user satisfaction, not only through economic benefits but also via the environmental benefits of cleaner energy [17]. Investigations by Minuto et al. [18] and Eisner et al. [19] reveal that the rules governing benefit distribution can significantly affect the outcomes for different participants, particularly when they vary in size and type. Musilek and Hussein [20] explain that CSC can provide access to green energy for lower-income populations, but this requires the integration of equity into analyses. The issue of equity in RECs and CSC is complex, and a substantial body of research has delved into methods to assess and maximize equity among participants [21,22].
While these studies provide valuable insights, they typically focus on a limited set of parameters or objectives (economic viability, technical feasibility, or equity). Nevertheless, CSC projects are multi-criteria endeavors with diverse and sometimes conflicting objectives. For example, some studies have shown that cost minimization may conflict with maximizing self-consumption [23], or that the financial interests of a PV project investor may diverge from those of end-users [24]. In the context of urban development, it is therefore essential to integrate the interests of all stakeholders from the earliest design stages. Additionally, early-stage urban development projects are marked by numerous uncertainties, ranging from technical (solar production, building thermal performance, HVAC systems) to programmatic (number, size, and types of buildings), economic (tariffs, CAPEX/OPEX, inflation), and social (user consumption habits, willingness to participate in CSC). All of these factors can influence the performance of a CSC project by affecting the balance of consumption/production and collective or individual economic outcomes. Certain studies leverage sampling methods to include the stochastic nature of uncertain parameters [19,25,26,27], especially for end-user load profiles. While this kind of method is relevant and encouraged [28], it can quickly become too expensive computationally if applied to a larger set of parameters. Therefore, sensitivity analyses combined with risk assessment are relevant for techno-economic feasibility analyses for CSC projects. A sensitivity analysis is very valuable as it provides the stakeholders with a list of important parameters to secure in early design stages. Nonetheless, despite the range of parameters at play, studies on distributed renewable energy systems often rely on sensitivity analyses of a limited number of parameters using local methods [21]. While this may suffice for feasibility studies of existing districts with fewer uncertainties, it falls short for new developments still in the early design phases (e.g., the schematic design phase). Optimization methods have been used to guide design choices for maximizing specific objectives [29,30,31], yet these solutions are vulnerable to deviations in initial assumptions [32]. One way to overcome this issue is to perform optimization under uncertainty [28]. However, uncertainties persist, especially when there is a considerable period between the feasibility studies and the project delivery. In these circumstances, even when an optimal design is proposed, a thorough risk analysis is still recommended. Hence, it is essential to acquire a comprehensive understanding of the impact of different factors, identify the most influential ones, and quantify their potential effects. Extensive sensitivity analysis is an efficient tool to perform this task.
To our knowledge, no prior study has applied a global sensitivity analysis to CSC operations for urban development projects at the schematic design stage. Therefore, the following research questions arise: how can extensive sensitivity analysis be used to support decision-making for Collective Self-Consumption projects in early-stage urban development contexts characterized by multiple uncertainties and diverse stakeholder objectives? How can such analysis be implemented in a workflow compatible with practitioners’ design and planning processes?
To bridge this gap, the present paper presents a new integrated methodology, complementing existing UBEM tools with modules for CSC simulation, economic analysis, and sensitivity and risk analyses. The novelty lies in the proposition of tools and methods compatible with the data available in real-world projects that are still at the schematic design phase. The present work aims to set the path for a multi-criteria analysis approach of CSC projects that accounts for the variability of numerous technical, economic, and social parameters. A key objective is to build a simulation methodology usable during the early design stages of urban projects, integrated with a global sensitivity analysis, to reliably identify critical factors affecting the performance assessments of CSC projects. Such an analysis is important for investors who risk their capital, the engineering firm that stands behind the results of its study, and the end-users who take part in the operation. The proposed approach involves modeling a CSC project with the data available at early design stages, conducting long-term operational simulations (e.g., over 20 years), and performing a comprehensive sensitivity analysis across multiple key performance indicators (KPIs). The simulation architecture developed was then adapted for uncertainty and risk analyses to perform sampling on the key parameters identified.
The remainder of the article is organized as follows. Section 2 outlines the selected KPIs, the simulation framework, the sensitivity analysis, and the risk assessment methodology. Then the case study and the results are presented in Section 3, followed by a discussion that outlines the key findings in Section 4. Finally, the main conclusions and insights for further research are provided.

2. Methodology

2.1. Assessing Collective Self-Consumption at the Schematic Design Phase

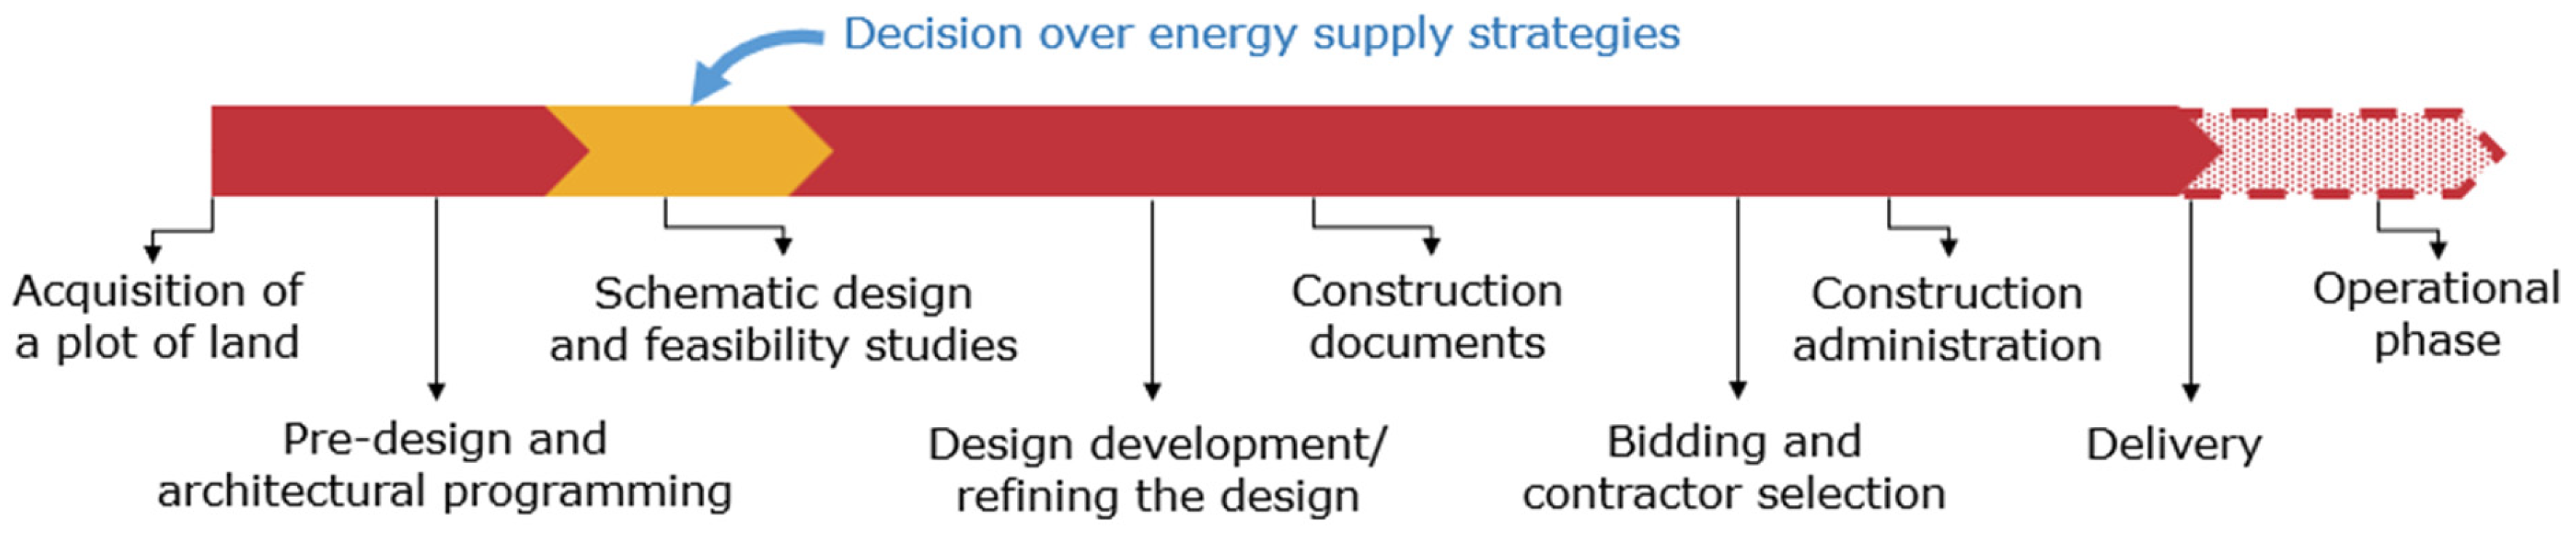
In a new district development project, the energy supply strategy is typically defined during the early design phases. Initial feasibility studies are conducted during the schematic design or early design development stages. While the later stages, such as the end of design development and beyond, allow for refinement and optimization, the key strategic decisions are generally already in place by then (see Figure 1). The decisions are based on the results from those early feasibility studies, but they inherently entail uncertainties since many parameters can still evolve until the operational stage. After the schematic design phase, the district development project goes through detailed design phases (design development and preparation of construction documents) during which details and refinements are brought to the initial design. Then, the construction phase follows, during which some final adjustments may still occur. This stage also carries the risk of improper installation, which can compromise aspects such as the actual thermal performance of the building envelope. Finally, the operational phase introduces inherent uncertainties related to factors such as incorrect use or maintenance of HVAC systems, variability in occupant presence and behavior, and changing meteorological conditions. In this study, the viability of CSC operation was evaluated during the schematic design phase, or, at the latest, the early design development stage. At this point, the district’s key design parameters are defined and constitute the reference baseline. All subsequent modifications (up to and including the operational phase) are treated as variable factors within the sensitivity analysis. Thus, techno-economic assumptions are considered uncertain, but their variation is constrained within a range deemed plausible between the early design and operational phases. The parameters considered in this study covered a wide range of topics, from technical characteristics to macro and micro-economics, occupant behavior, and climate conditions. These are listed in Section 3, along with their variation ranges, which reflect the degree of uncertainty during the schematic design phase.

2.2. The Key Performance Indicators

A variety of stakeholders are involved in a CSC operation, with potentially different or even opposite objectives. Local authorities, for instance, may prioritize the integration of renewable energy within their jurisdiction to reduce GHG emissions and ensure access to cleaner, cost-stable energy sources. Conversely, urban development stakeholders, such as project developers and future plant operators, seek guarantees of financial viability before committing to the project. The Distribution System Operator (DSO), responsible for ensuring the seamless integration and operation of distributed energy resources (DER) within the grid, may also influence the project design by imposing requirements for appropriate system sizing to avoid grid disruptions. Finally, end-users prioritize a reliable and affordable energy supply. As such, the design of a collective self-consumption project is inherently a techno-economic challenge, requiring the evaluation of diverse key performance indicators (KPIs) to balance these varying objectives effectively. Table 1 summarizes the selected KPIs, with examples of the main stakeholders concerned.

2.3. Modeling and Simulation

In recent studies, CSC was investigated without relying on energy modeling, instead using either measured data, generic load profiles, or roughly estimated self-consumption rates [15,21,39,44,45,46,47,48]. While this approach can make the analysis simpler and still effective for analyzing CSC projects in general, the data is often either too broad or too context-specific to be applicable during pre-design feasibility studies for other specific real-world projects with substantially different characteristics. For a CSC project planned within an already existing district, leveraging on-site consumption data is relevant, as it grounds the analysis in actual conditions. However, when the neighborhood is yet to be built, and information about future residents and businesses is uncertain, modeling energy consumption is needed. In cases where only the consumption from electric appliances is concerned, a load profile generator may suffice, like in [16,18], as long as the generated profiles are representative of end-users involved in the project (e.g., households’ consumption patterns vary from one country to another). However, when thermal uses, like space heating, cooling, or domestic hot water (DHW), are also incorporated and rely on electric systems, a dynamic thermal model is required. With the ongoing electrification of thermal uses [49], it is all the more important to integrate building energy modeling into the workflow.
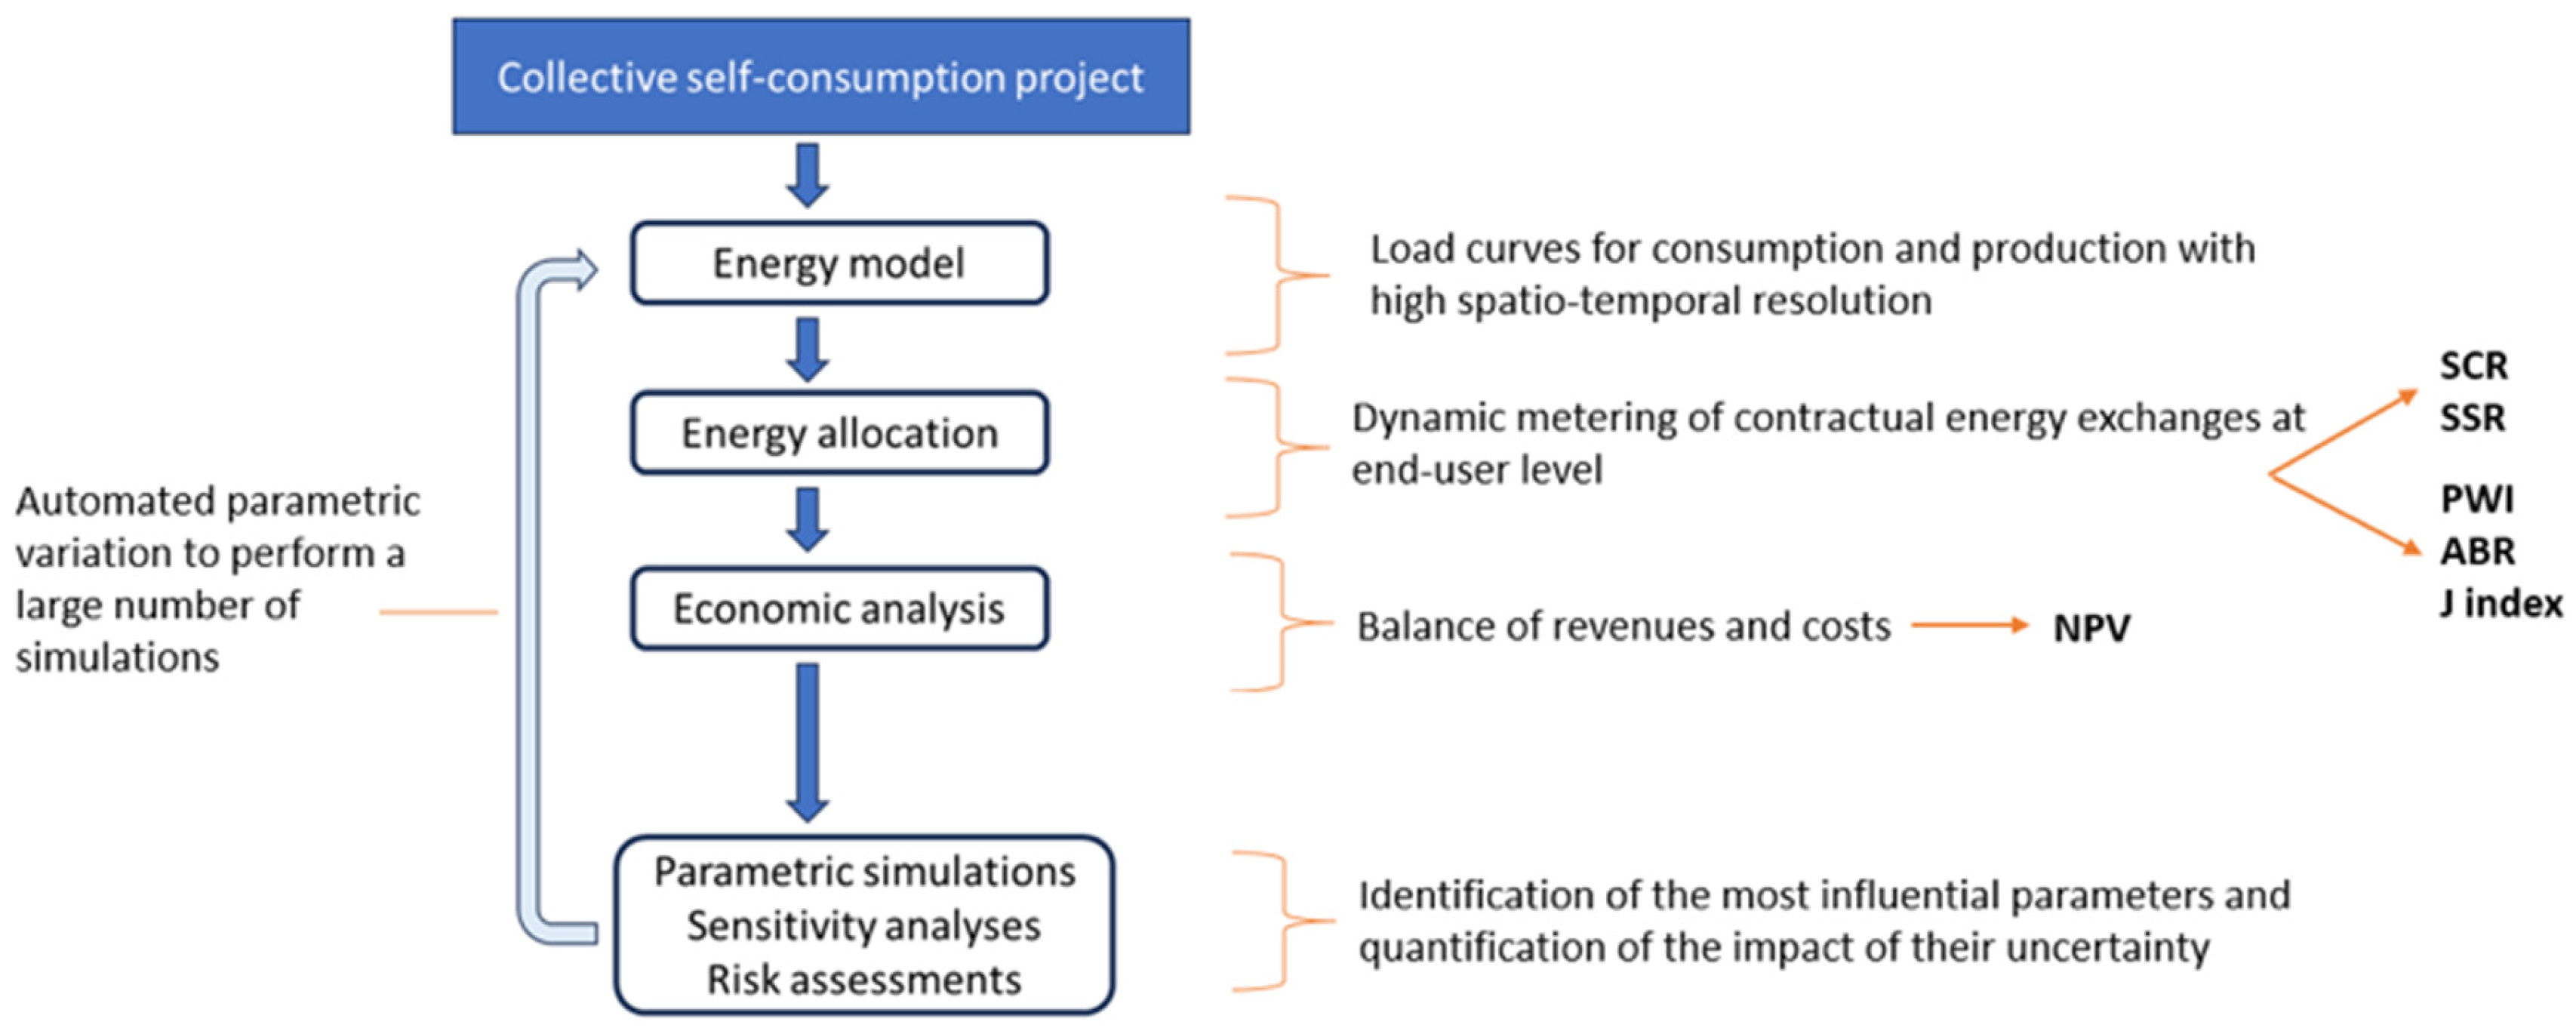
The simulation process developed in the present work begins by generating electricity load profiles using an energy model, which includes both a plug-load profile generator and building energy models. These load curves are then processed by an energy allocation module that simulates the CSC mechanism, followed by an economic analysis module. Finally, a parametric module is employed to carry out sensitivity analyses and risk assessments. A schematic view of the simulation workflow is illustrated in Figure 2.

2.4. Urban Building Energy Model

Given that CSC projects are likely to encompass multiple buildings, urban building energy modeling (UBEM) methods and tools are recommended. UBEM extends the principles of building energy modeling beyond individual buildings to larger scales, such as neighborhoods and districts. The goal is to simulate multiple buildings simultaneously, using appropriate modeling strategies that balance computational efficiency with sufficient accuracy. While modeling just a few buildings can already increase the simulation time, sensitivity analyses and risk assessments often require running hundreds, if not thousands, of simulations. This necessitates a trade-off between model precision and computational cost. Depending on the district size and the extent to which energy systems are mutualized, such as heating and DHW, certain simplifications can be made to reduce the computation time while maintaining an adequate degree of accuracy [50]. Based on these considerations, the following modeling choices were adopted:
-
A 15-min timestep in order to properly model the energy allocation, which corresponds to the counting timestep in CSC operations in France. It is recommended to work at a high temporal resolution to avoid the overestimation of self-consumption rates [51];
-
The granularity of electric appliances’ load curves goes down to the end-user level (i.e., household level in the current case), and thermal loads are calculated on the basis of an aggregation of one thermal zone per story. Certain KPIs like the ABR, the PWI, and the JI require working at the end-user level, but when combined with a high temporal resolution, it can result in a computationally heavy energy model. The aggregation of the thermal load is the main loss of precision with the present compromise, which we consider as an acceptable trade-off for multi-residential buildings with centralized heating and DHW systems. Nonetheless, this choice may need to be revised if the sensitivity analysis highlights that space-heating and DHW related parameters are highly influential;
-
The electric load of central air-to-water heat pumps (AWHP) for space heating is modeled with a dynamic coefficient of performance, defined as a function of the supply and outdoor air temperature, applied to heating loads;
-
The DHW system, including an AWHP, consists of a stratified storage tank and a recirculation loop of hot water (modeled as a non-adiabatic insulated pipe);
-
The electricity production comes from rooftop solar PV, directly integrated on the highest rooftops in the building energy models. A simple PV model was chosen, which converts incident solar radiation to electricity using a static efficiency coefficient for PV cells and inverters.
To work adequately with the aforementioned modeling choices, a bottom-up methodology was adopted. This approach offers the greatest flexibility in terms of the level of detail and precision with which a project can be modeled. While top-down methods can significantly reduce the computation time, they are generally less suited for analyses requiring high spatio-temporal resolution or disaggregated data [52]. For this work, the URBANopt platform [53] was selected (version 0.6.4 of the software was used in the present work). It leverages EnergyPlus as its core, a widely recognized and validated thermal simulation engine. One of its key advantages lies in the ability to define spatial and temporal resolution directly within the modeling process. Furthermore, being open-source, URBANopt allows for easier integration with other tools, enhancing interoperability.
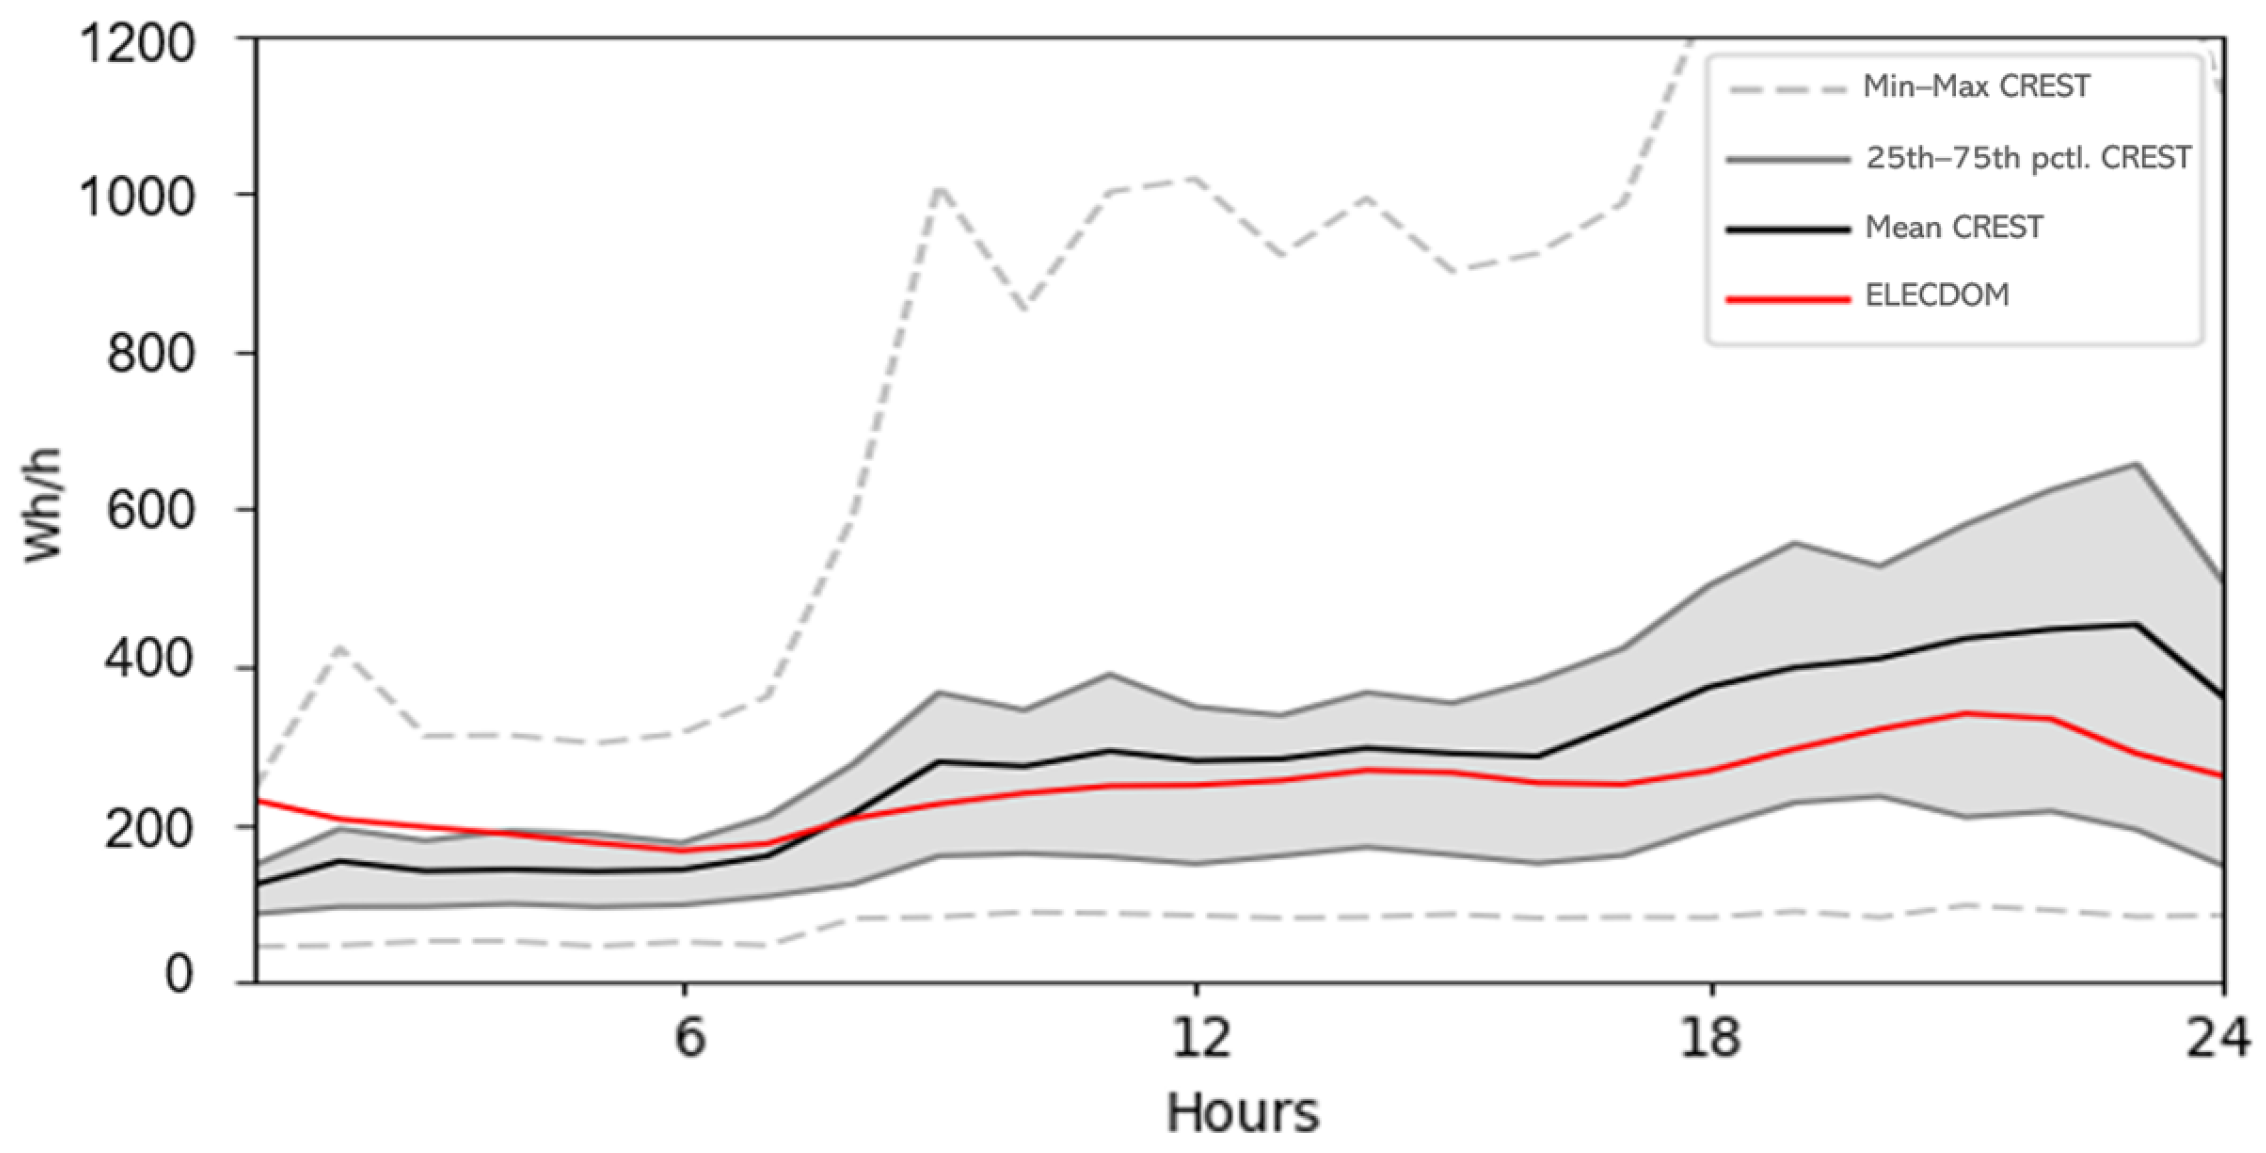
A load curve generator is employed to simulate both the presence and domestic electricity consumption of end-users, and the resulting data are integrated into the main energy model. As previously discussed, capturing energy exchanges at the end-user scale requires disaggregated data with high temporal resolution. Moreover, a sufficient diversity of load profiles is necessary to reflect variations in user behavior and to avoid unrealistically coincident consumption patterns. This calls for the use of probabilistic load profiles. Additionally, these profiles must also be contextually relevant, in the present case, representative of a French population. To meet these requirements, the CREST demand model [54] was adopted. This stochastic model, based on Time of Use Surveys (TUS), can generate high-resolution load profiles with a time step of up to one minute. It is an open-source, widely cited tool in literature [55], and it also produces occupant presence data, which is useful for incorporating metabolic loads into the thermal simulation. Although originally developed using British TUS data, several studies proved that the model can be adapted to other national contexts. Similar to the approach of Wills et al. [56], key statistical inputs, such as average annual electricity consumption per dwelling, household size, appliance ownership, and usage intensity were adjusted to align with French data. The adapted model was then validated using measured data from a study involving approximately 100 French dwellings [57], as shown in Figure 3.

2.5. Energy Allocation

In shared energy frameworks, a distinction of physical and financial flows of energy is usually made, especially in the absence of a dedicated local grid for exchanging on-site electricity production [4]. From the French legislation’s point of view, the CSC framework functions as a contractual way of sharing energy rather than a physical one. Since the technical sizing and operation of the electric grid was beyond the scope of the present work, only the financial layer of energy exchanges was modeled here.
In France, residential smart meters record electricity consumption data at 15-min intervals and transmit it to the grid operator, along with the amount of electricity simultaneously produced and available for each participant. The allocation of locally generated energy is then determined by a distribution key (DK), a predefined rule collectively agreed upon at the start of the CSC project. The two most common DK types are the default dynamic DK (also known as pro rata of consumption) and the static DK (e.g., equal sharing). In the dynamic approach, each participant receives, at each time step, a share of the simultaneously produced electricity, proportional to their share of the total consumption at that time. Conversely, static DKs rely on fixed coefficients established at the outset of the project. These are often based on equal sharing but can also reflect other criteria, such as each participant’s financial contribution. Numerous DK variants have been explored in the literature, and in principle, there is no technical limitation to how a DK can be defined as long as it operates on the regulatory metering time step and its calculation method remains transparent [40]. A notable alternative is the hybrid DK, which initially distributes energy equally among all participants, then allocates the remaining energy proportionally to their consumption. Additionally, a DK can specify whether locally produced energy should first cover collective uses (e.g., central DHW systems) or be directed to individual end-users. In this study, this allocation priority rule is termed the “uses priority”.
Since the current work focuses exclusively on the financial layer, the energy allocation can be simulated in post-processing, after the electricity consumption and production load curves have been generated. This approach avoids the complexity of co-simulation and simplifies the simulation workflow. The energy allocation module is implemented as a post-processing step using Python (v3.11) scripts.

2.6. Economic Analysis

The energy simulation introduced above is run over a one-year period. However, one year is insufficient for financial analyses when longer-term factors come into play, such as inflation and discount rates. Consequently, the financial analysis is performed over a 20-year period. Although a PV panel’s lifespan averages 25 to 30 years, generally, investors seek return on investment on a shorter term, hence selecting a shorter period. This is an arbitrary choice, however, and can be modified based on the needs of a given study. To save computational costs, the generation of energy demand and production was performed once. However, the PV production load was altered each year of the financial analysis in order to account for the loss of efficiency of the PV systems (by a −0.5%/year factor).
The financial parameters, including grid and feed-in tariffs, inflation and discount rates, investment and maintenance costs, are based on statistical data from previous years (see details in Section 3). The local electricity selling price is set between the grid and feed-in tariffs: it cannot be lower than the feed-in tariff (or selling locally would be less attractive) nor higher than the grid tariff (or buying locally would be less attractive for consumers). The baseline is defined as the midpoint between the two tariffs, and a coefficient x is introduced in the sensitivity analysis to reflect potential negotiation dynamics, shifting the local tariff toward either end of the range. Equation (7) defines the CSC electricity tariff:
t a r i f f C S C =   t a r i f f g r i d +   t a r i f f f e e d - i n 2 + x t a r i f f g r i d   t a r i f f f e e d - i n  
where t a r i f f C S C is the price of locally produced electricity, t a r i f f g r i d is the price of electricity purchased on the grid, t a r i f f f e e d - i n is the compensation for excess produced electricity injected to the grid, and x is a negotiation factor (value between −0.5 and 0.5) that tilts the price in favor of the consumer or producer depending on its value.

2.7. Sensitivity Analysis

The Sobol method is a common global sensitivity analysis method that provides detailed global sensitivity analysis and captures parameter interactions. It is, however, computationally expensive. The Morris screening method can classify input parameters in the same order as the Sobol method for a fraction of the computational costs [32,58]. It is less precise regarding parameter interaction and can only indicate whether non-linearities or parameter interaction occur but not characterize them. Nonetheless, considering the number of input parameters studied, the Morris screening method is leveraged here to perform the sensitivity analysis in the first place. In practice, Morris is often used first to filter out low-impact parameters before applying Sobol analysis to a reduced set if needed [32,58].
The number of trajectories (randomized experimental designs) and levels (number of uniformly spaced values for each input) was a compromise between precision and computational costs. A combination of 10 trajectories and 4 levels was applied, which is commonly used in the literature [59,60]. In our case, there were 22 input parameters (see Table 2), which resulted in 230 simulations. A reasonably higher number of trajectories and levels did not bring significant gains in precision. The list of parameters and their intervals of variation are summarized in Table 2. As mentioned earlier, the variation ranges were determined as plausible changes between the early design and the operational phases of the project, which reflects the degree of uncertainty at the schematic design phase. Though the site plan was not considered as a variable in the study (floor area ratio, building density, and building spacing remain fixed), uncertain parameters like the level of energy consumption per dwelling and the rate of participation in the CSC operation were considered, which determine the size of the energy community. The Morris screening evaluates the elementary effects of each parameter, which corresponds to the difference in model output divided by the variation of the modified input parameter (Equation (8)). Once the simulations are run and the elementary effects derived, a quantitative measure of the impact of each parameter on the model output is provided by μ* and σ, respectively the absolute mean and the standard deviation of elementary effects (Equations (9) and (10)). For a given parameter, the higher the μ*, the greater the parameter’s influence on the model’s outputs. The standard deviation σ indicates the degree of non-linearity or parameter interactions. If σ is low, the elementary effects remain similar regardless of the trajectory undertaken, so the parameter influence is not affected by the variation of other parameters. However, if σ is high, it implies non-linearities and/or that the influence of the parameter is dependent on the variation of other parameters. The relative importance of non-linearity or interactions is commonly quantified by the σ/μ* ratio. The parameter presents moderate non-linearities or interactions if the σ/μ* ratio is lower than 0.5, and high if it is higher than 1. More detailed explanations of the Morris screening method can be found in [60,61].
E E j ( X i ) = Y X 1 ,   ,   X i 1 ,   X i + Δ ,   X i + 1 ,   X k Y ( X ) Δ
μ i * = 1 r j = 1 r E E j ( X i )
σ = 1 r 1 j = 1 r E E j X i μ i 2
where EE is the elementary effect, Y is the model, and X is the parameter.

2.8. Risk Assessment Results

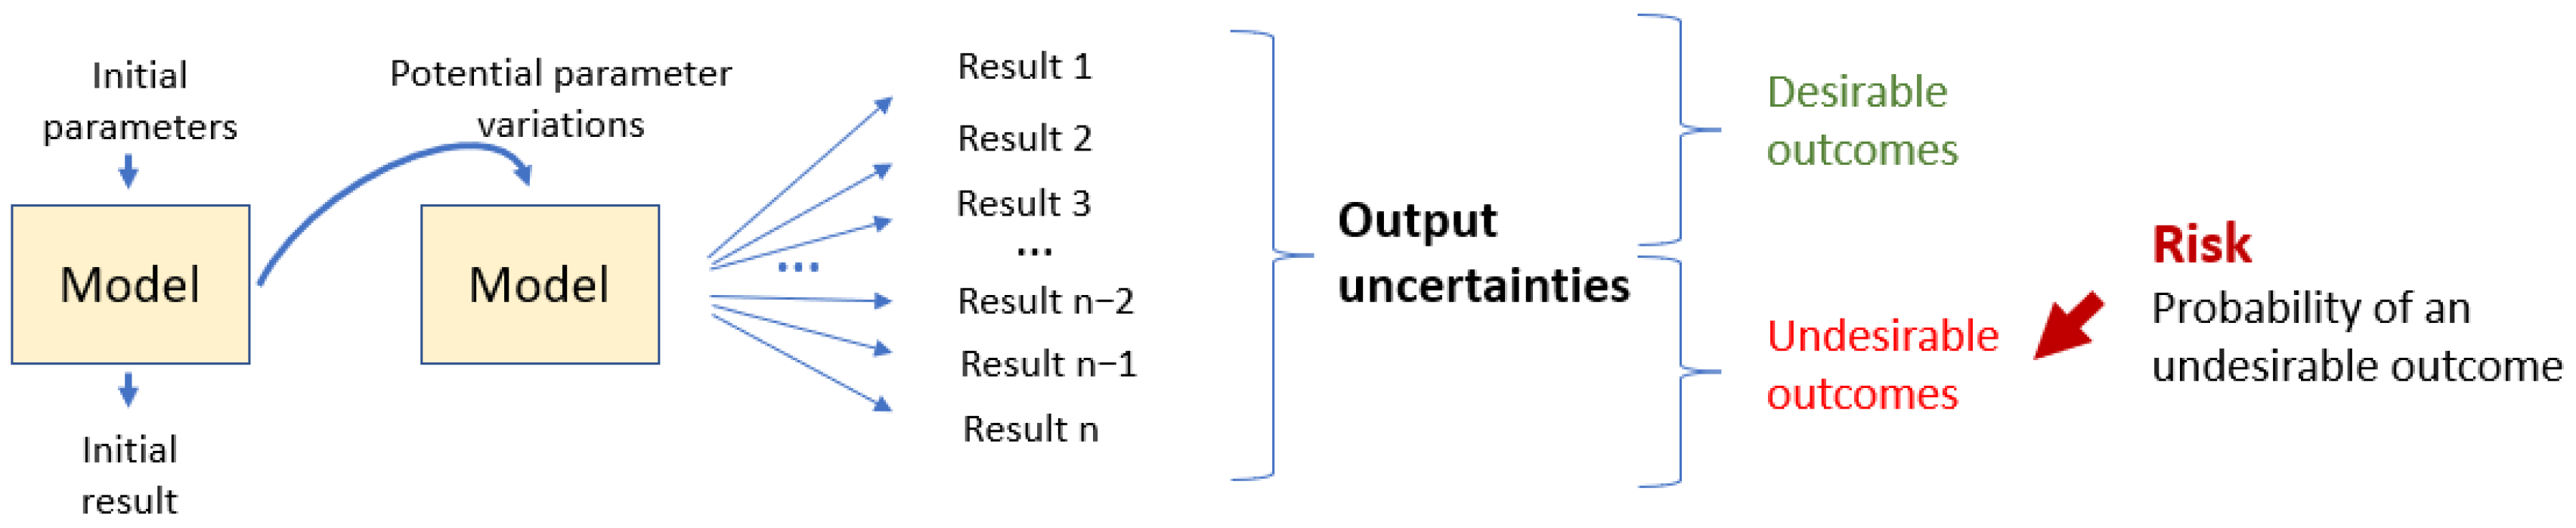
Although various methods have been explored in the literature, the common thread guiding risk assessments remains generally the same and is illustrated in Figure 4, where the risk is defined as the likelihood of obtaining an undesired outcome [62]. Basically, the risks need to be quantified, and then a decision-making scheme is followed to decide whether the risk is acceptable. For multidimensional problems, a common method to assess the risk is to sample a large number of possible input parameter combinations (the scenarios), leveraging methods like the well-known Monte Carlo Sampling (MCS) or Latin Hypercube Sampling (LHS), and then performing a simulation for the scenario. These methods are widely used for uncertainty and risk analysis throughout various fields, like structural engineering [63] and nuclear safety [64], for example. These are well-suited for renewable energy and building performance simulation applications [32,58,62,65], enabling the exploration of a large number of possible scenarios, and then obtaining the probability of achieving undesirable outcomes, in other words, the risk. For this study, the LHS method was chosen.

3. Case Study and Results

3.1. The Case Study

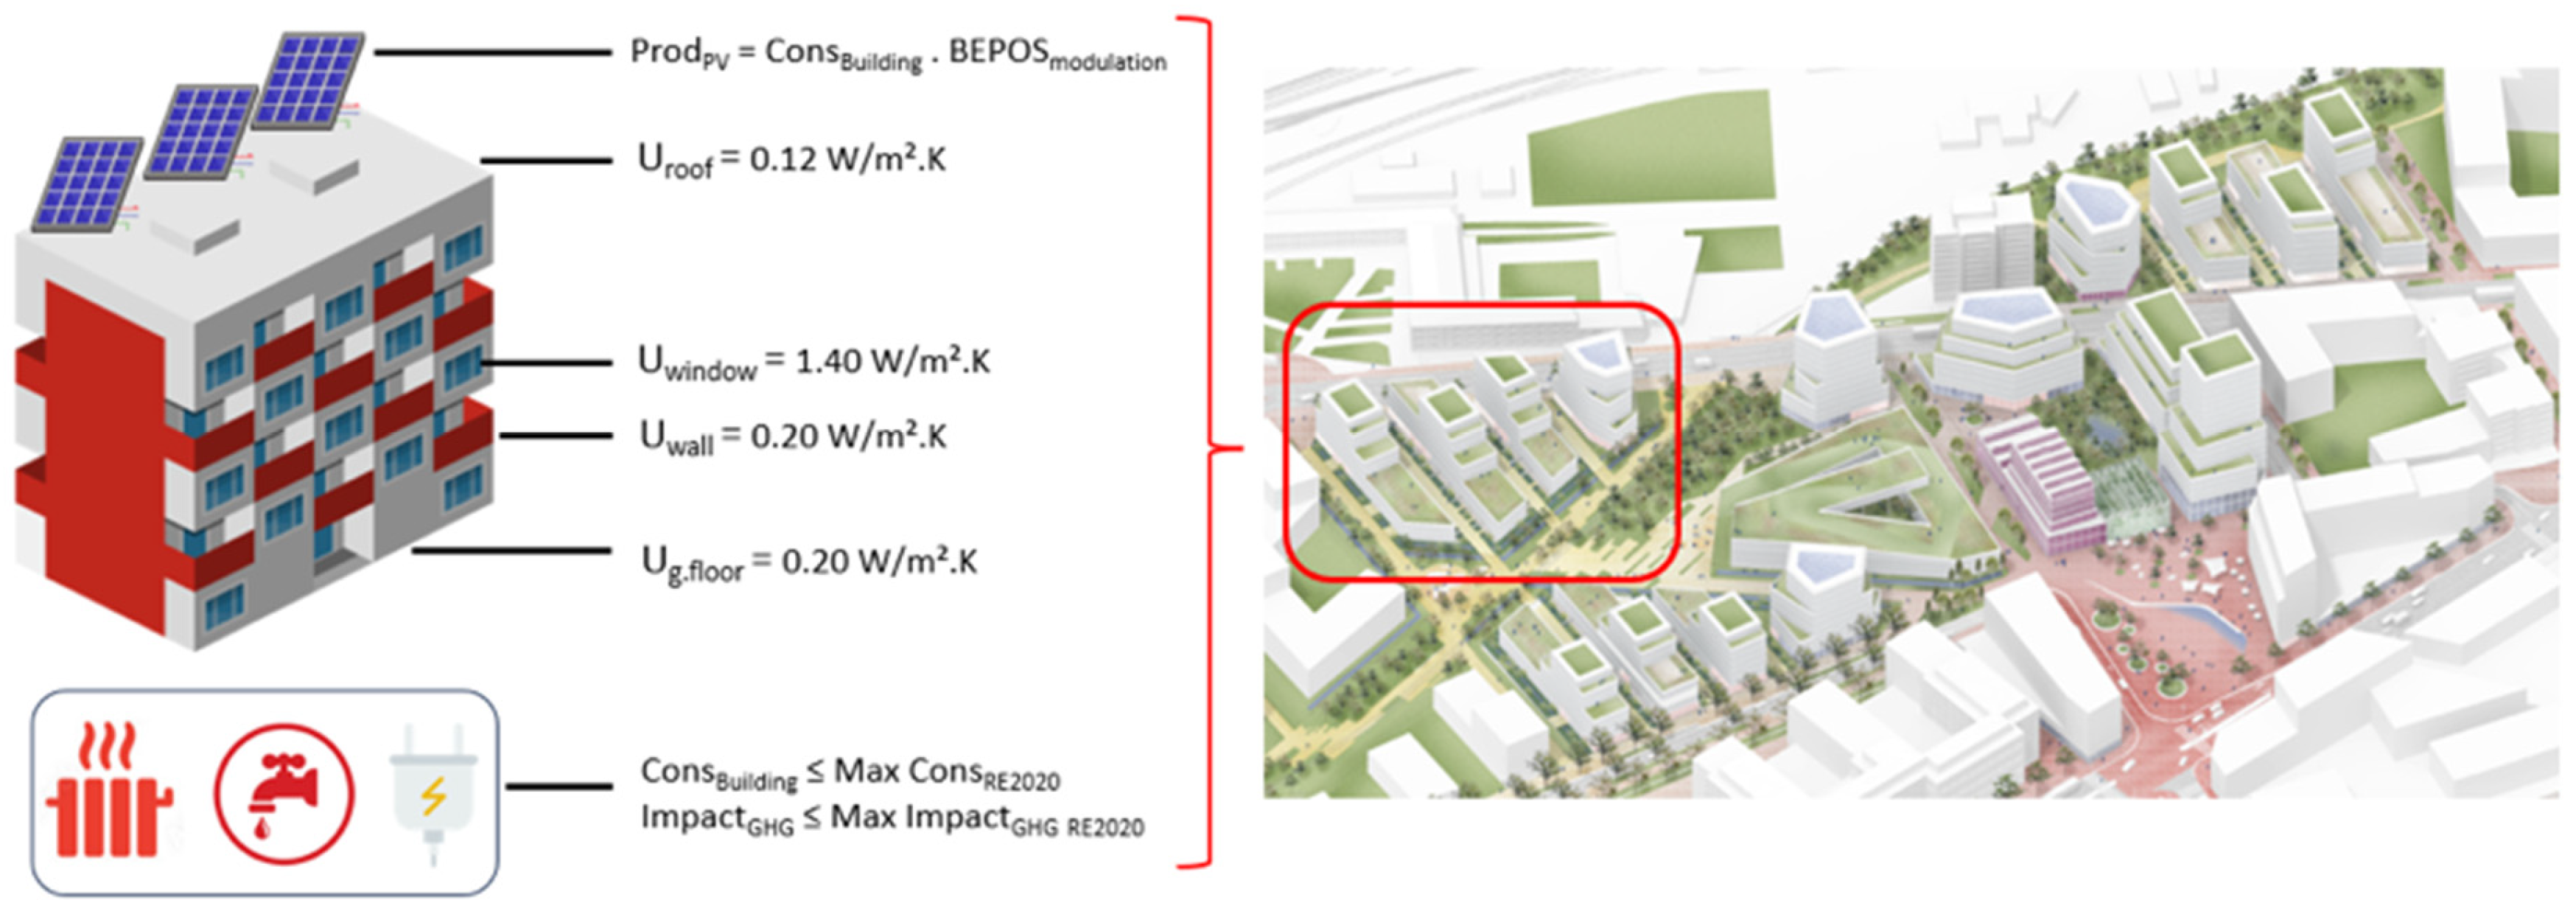
A case study simulating a typical neighborhood development project in its early design phase, where the potential for a CSC operation is evaluated, was used both to structure the methodology addressing our research questions and to serve as a testing ground for its application (see Figure 5). The case study was inspired by the recently built district (“Les Groues”) in the city of Nanterre, close to Paris, France. This district is divided into 5 blocks, mostly for residential purposes, with a few commercial spaces on the ground floors. For the present work, one of those blocks was studied, with four seven-story buildings composed only of apartments. The total apartment floor area is 9600 m2, resulting in 132 apartments of 70 m2 on average. While based on an existing project, certain modifications were made in the present work to make the case study representative of a typical modern residential neighborhood development in France.
The main assumptions of the case study are summed up here and in Table 2:
  • Project location: Nanterre, France;
  • Total living area, number of apartments: 9600 m2, 132 apartments;
  • Energy performance of the buildings in line with the current French building regulations (RE2020);
  • Central heating and semi-accumulative domestic hot water (DHW) produced by electric air-to-water heat pumps (AWHPs);
  • PV production sized to comply with the French BEPOS label (positive energy building label)—installed capacity 166 kWp;
  • The power plant is financed and managed by a dedicated entity, acting as an additional energy supplier for residents.

Table 2. Summary of the design of experiments used for the sensitivity analysis.
CategoryParameterBaseline ValueVariation RangeDetails/Assumptions
PV power plantPV nominal power166 kWpBaseline ±20%The variation ranges are defined by potential changes between the design and operational stages, for example, unplanned slight variation of usable roof area, rated efficiency, and disposition of PV panels. Varying PV power while keeping CAPEX fixed makes it possible to represent variations in system performance, such as reduced output due to excessive soiling or the occurrence of equipment failures. The PV panels are exclusively installed on rooftops in the given case study.
Panel orientation0° (south)[−45°; +45°]
Panel tilt35°[15°; 55°]
Building designInsulation levelU values in W/m2·K
Uwalls 0.20
Ufloor 0.20
Uroof 0.12
Uwindows 1.40
Baseline ±20%The range of variation accounts for slight changes that may occur between the design and operational phases, as well as a potential decrease in performance due to human error during construction.
For the DHW storage tank, the variation range is applied to the storage volume per standard apartment. The power of the heating system is then calculated according to the volume of the storage tank, with sizing recommendations from the COSTIC, an institution publishing recommendations for building HVAC design [66].
Window-to-floor area ratio19%[16%; 22%]
Rated COP for space heating AWHP 4[3.5; 4.5]
Rated COP for DHW AWHP 4[3.5; 4.5]
DHW storage tank3000 L for a building with 30 standard apartments[Nb apts × 100;
Nb apts × 150]
Energy allocationDistribution key (DK) α0%[0%; 100%]0% corresponds to a DK fully based on the prorate of consumption; 100% corresponds to a fully hybrid DK, which is based on an egalitarian allocation first, and then a prorate allocation of surpluses to participants who can still receive energy; 50% corresponds to a case where 50% of the energy is allocated with a prorate of consumption DK and 50% with a hybrid DK.
Priority of uses ratio 0%[0%; 100%]0% corresponds to an energy allocation in priority to end-users; 100% corresponds to an energy allocation in priority for collective uses (DHW in our case); 50% corresponds to half of the energy produced allocated to end-users, and the other half to collective uses. The surplus from one category can be allocated to the other, as long as the respective volumes of consumption have not been fully covered yet.
Electricity tariffsCSC electricity tariff0.150 €/kWhx = [−0.5, 0.5]Average grid and feed-in tariffs values in 2024 and variation intervals based on French governmental statistics over recent years, VAT excluded [67,68].
The CSC electricity tariff is defined by Equation (7). The variation is applied to x, which accounts for potential negotiations that can move the tariff closer to the feed-in or grid tariffs.
Grid tariffs0.187 €/kWh
(individual)
0.180 €/kWh
(condominium)
Baseline ±20%
Feed-in tariff0.115 €/kWh[0.098 €/kWh; 0.132 €/kWh]
Investment & maintenance costsPV CAPEX1100 €/kWp[1000 €/kWp; 1500 €/kWp]Observed values in benchmarks and reports on the costs of renewable energy systems [68,69,70,71].
PV OPEX16 €/kWp[15 €/kWp;
20 €/kWp]
Economic contextDiscount rate5%[4%; 6%]Usual discount rate and variation range used by the ADEME for a rooftop PV power plant within the 100–500 kWp range [70].
Inflation rate2%[1.60%; 2.40%]Long-term inflation rate (e.g., 20-year period), based on French statistics [72], from which the standard error is calculated to estimate variability as recommended by [73].
End-users energy habits/behaviorMean annual electric load per dwelling per year2200 kWh/yearBaseline ±20%Baseline value determined from French national statistics and surveys from ADEME [57].
CSC participation rate80%[60%; 100%]Baseline value based on the fact that over 80% of the French population has a positive opinion about solar PV [74,75].
Ventilation 0.6 ACH[0.6 ACH; 0.8 ACH]0.6 ACH corresponds to common mechanical ventilation outdoor air flows in recent buildings in France. An increase of up to 0.80 (average value for the entire building) is selected here to account for additional ventilation due to longer window opening.
Thermostat setpoint20 °C[18 °C; 22 °C]The baseline value is a typical heating setpoint for a French dwelling [76].
Solar resourcessolar radiation1150 kWh/m2/yearBaseline ±2%Value taken for the PARIS–ORLY weather station, and the variation range is based on the standard error of the annual radiation measurement on a horizontal surface over a period of 20 years [77].
The simulated heating consumption was close to an estimation made with the 3CL-DPE method [78], despite slightly different scenarios of occupation and set-point (comparison provided in Table 3). Similarly, domestic hot water and plug-load consumption were of the correct order of magnitude. Although this result is deemed satisfactory at the current stage of development of the simulation tool, further validation should be performed with real-world data.

3.2. Sensitivity Analysis Results

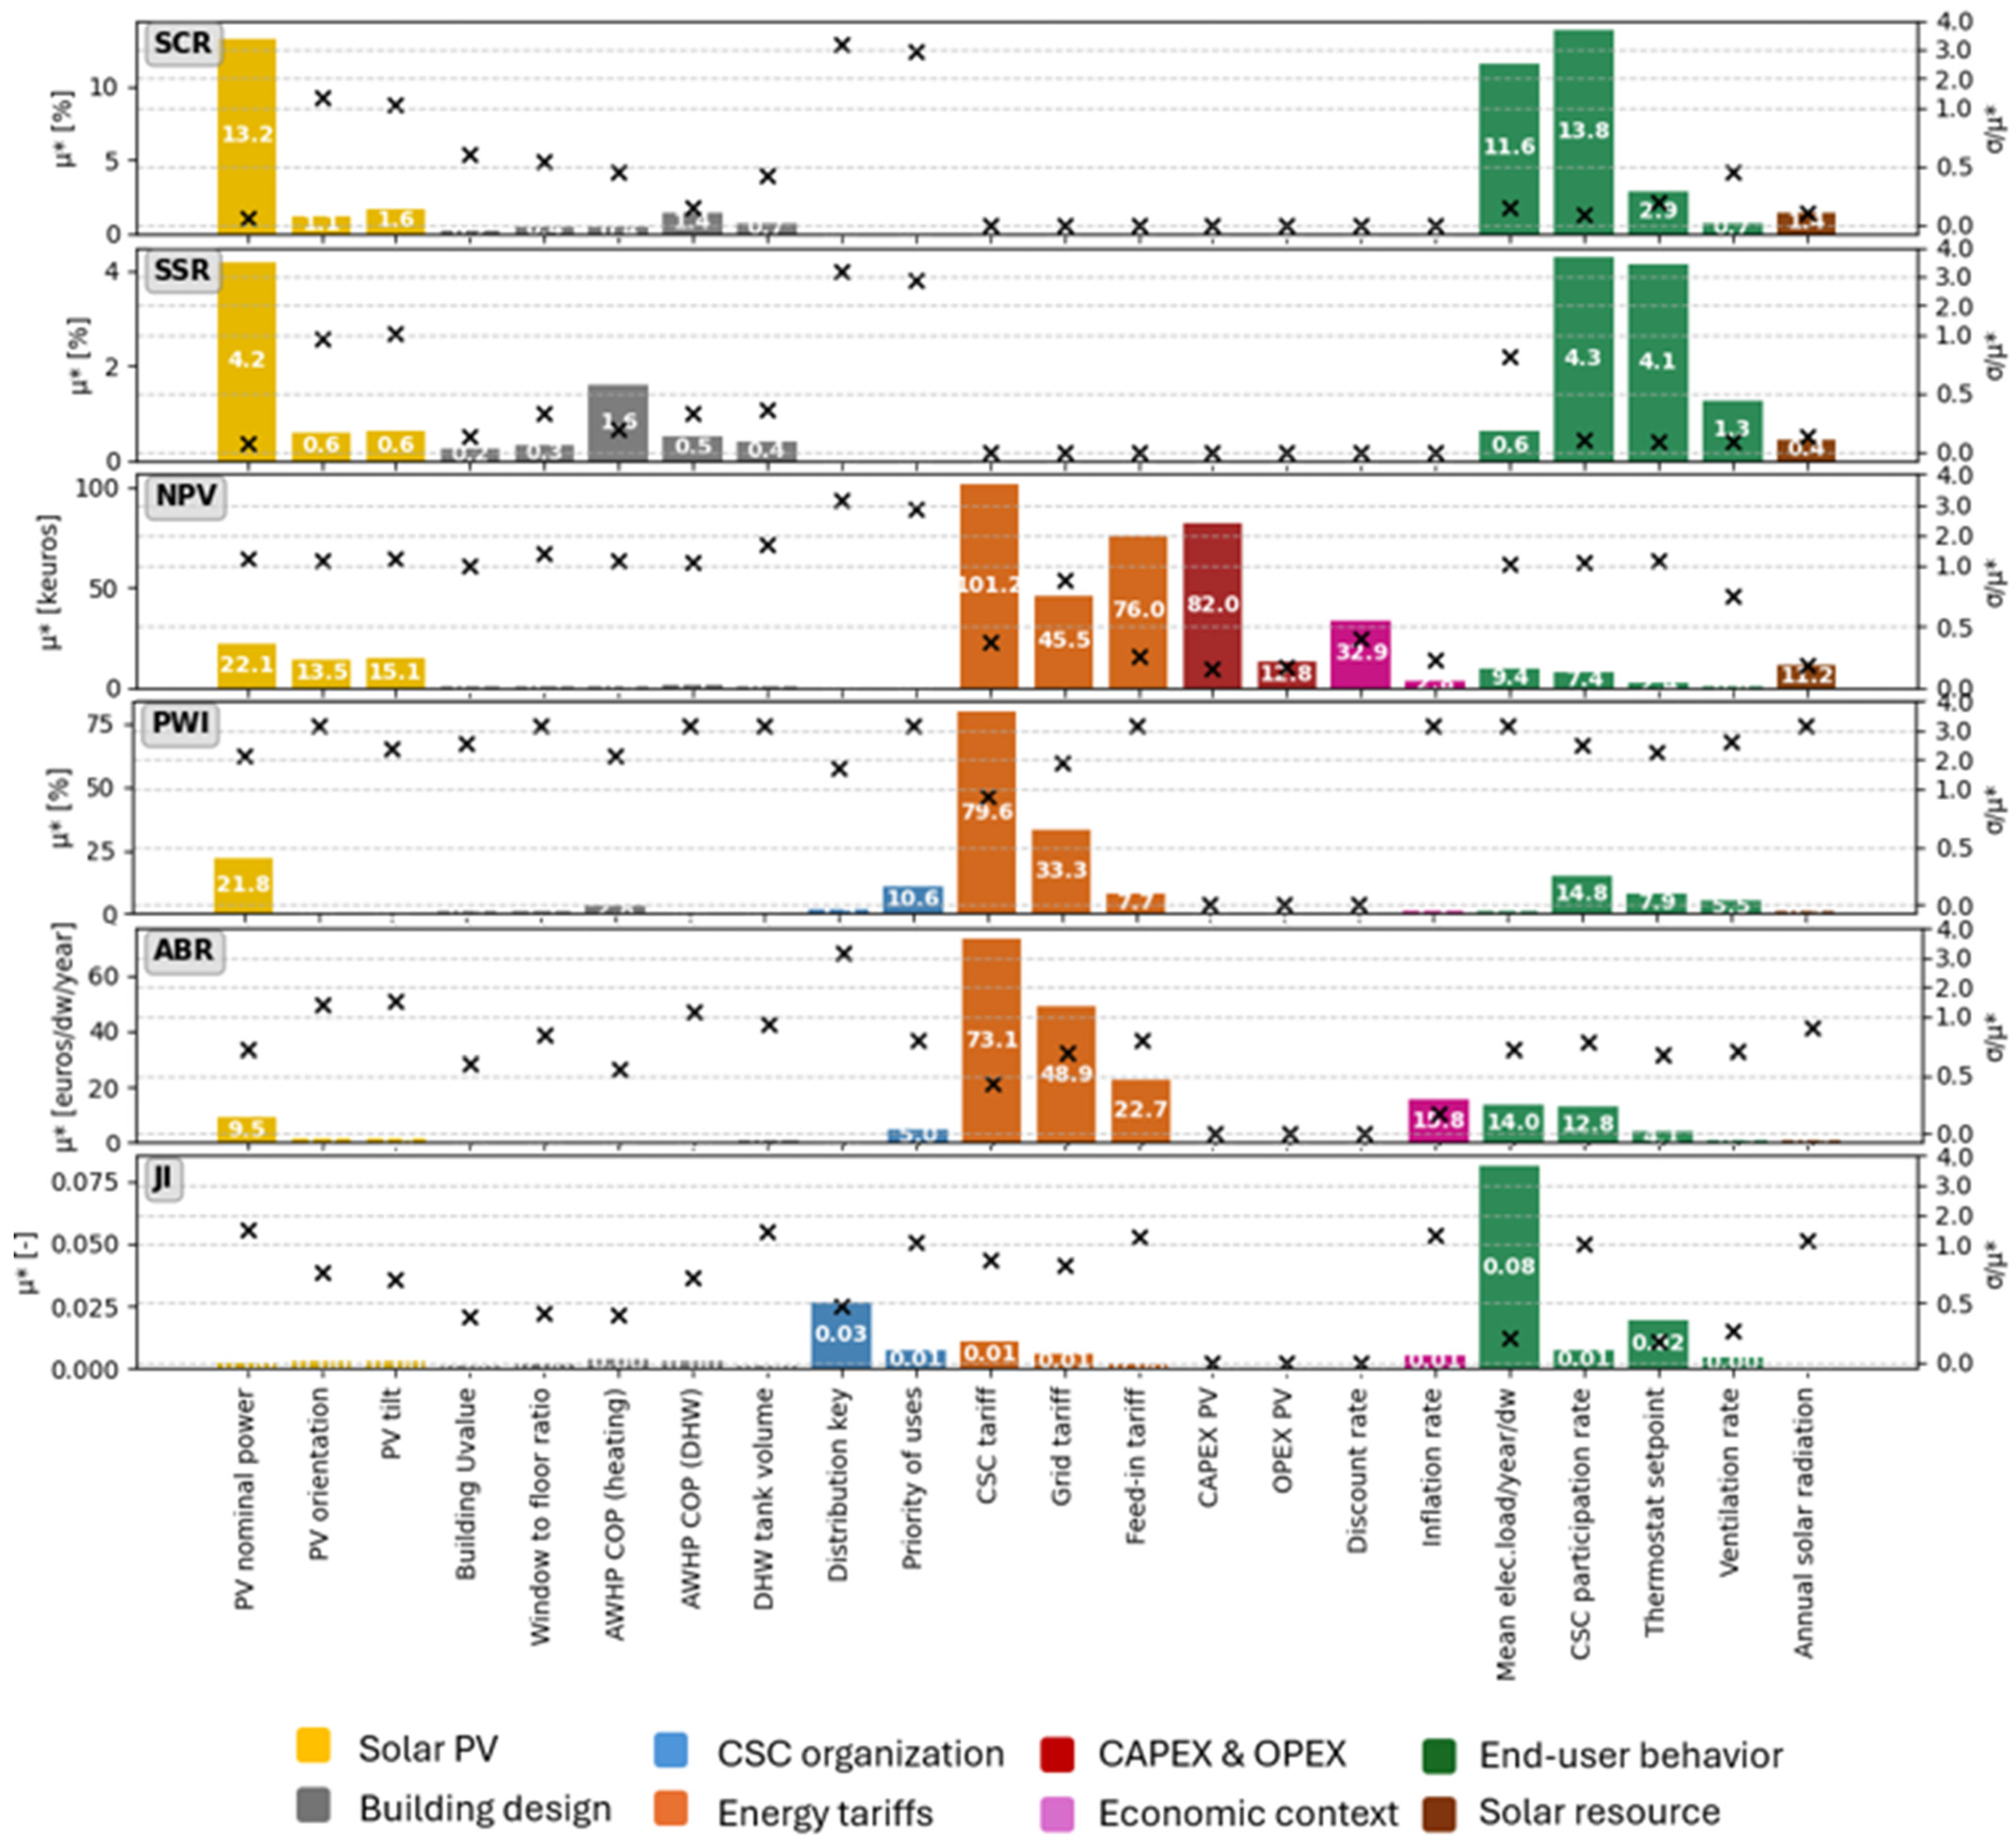
The objective of the present study was to conduct an extensive sensitivity analysis that frames the design of a CSC operation from the perspectives of multiple stakeholders, with potentially conflicting objectives. This was achieved by performing a sensitivity analysis across several key performance indicators (KPIs) simultaneously. The results of the sensitivity analysis are presented in Figure 6, which displays the mean elementary effects (μ* displayed as a bar chart) of each parameter across all KPIs, along with the ratio of the standard deviation (σ) to the mean effect (displayed with the × marker).
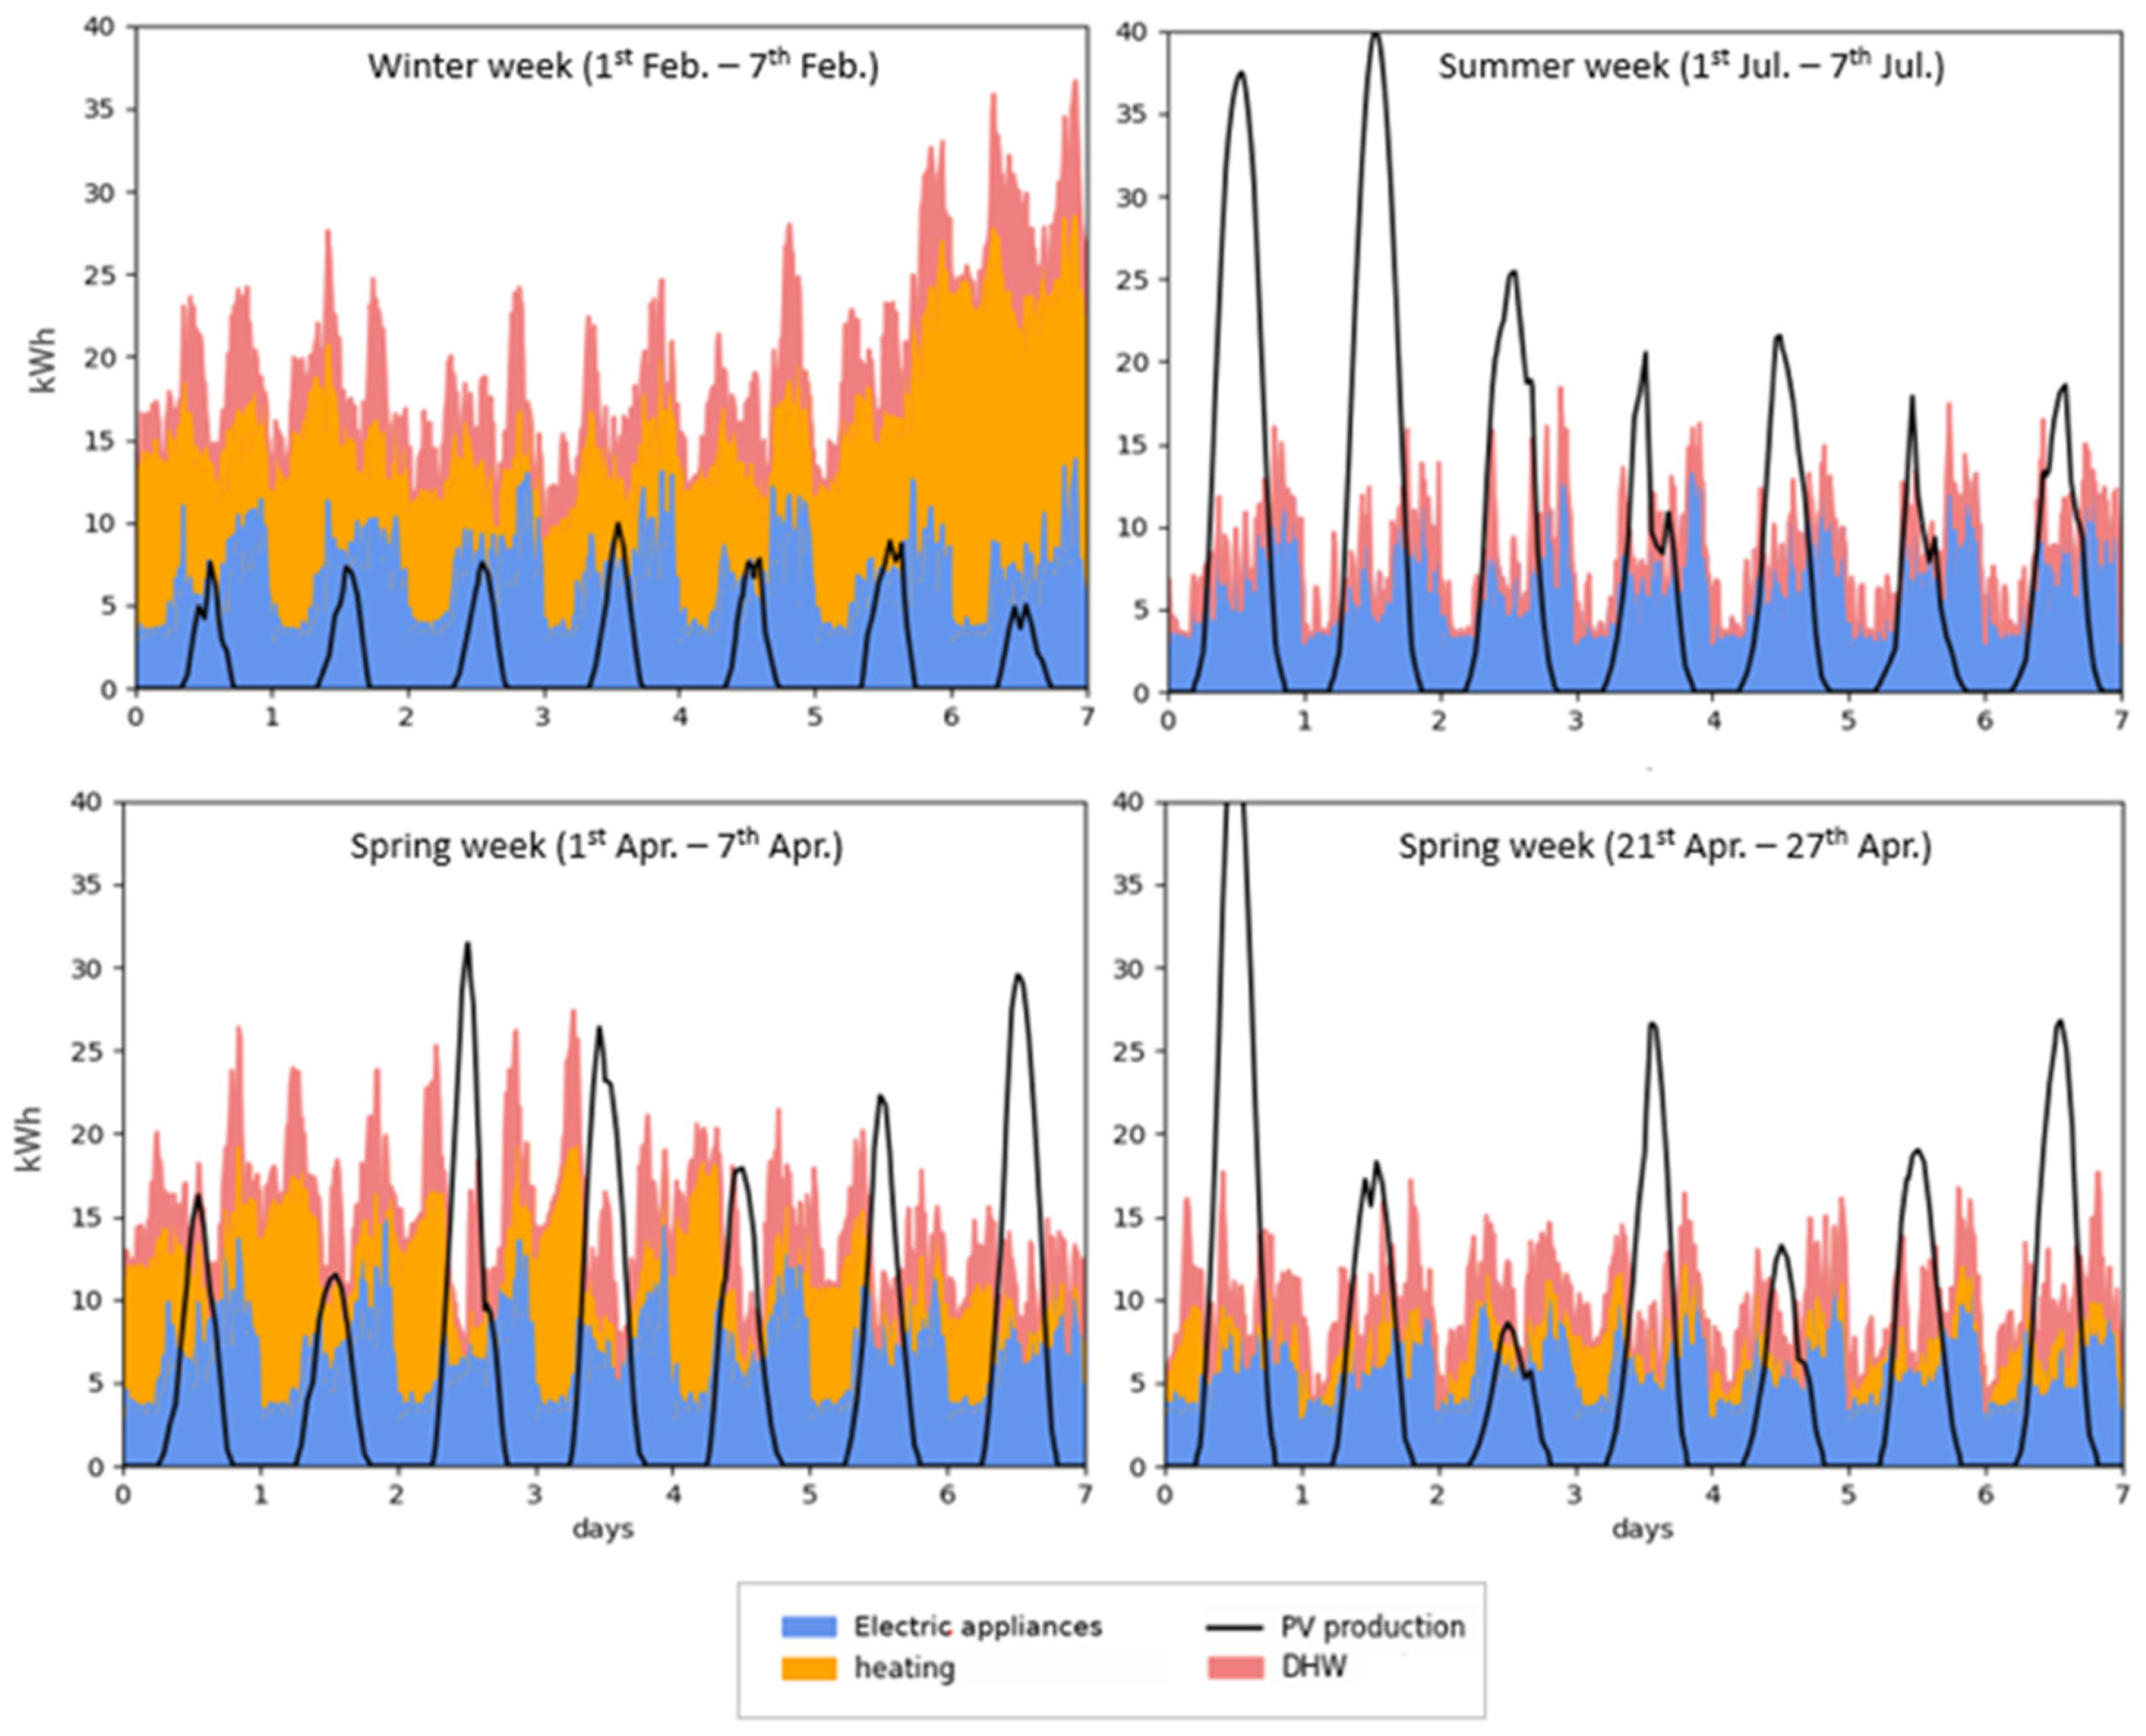
For the Self-Consumption Rate (SCR) and Self-Sufficiency Rate (SSR), the most influential parameters were the participation rate, the installed PV capacity, and the mean domestic appliance electricity consumption. This was expected, as these parameters directly dictate the balance between electricity supply and demand. Interestingly, building design parameters, such as thermal insulation levels or the coefficient of performance (COP) of space heating systems, exhibited limited influence on SCR and SSR. A closer investigation of the load curves showed that this was primarily due to their effect on electricity demand, being the most pronounced during winter, when PV generation is low. As illustrated in Figure 7, winter and inter-seasonal PV production is generally absorbed by domestic electricity consumption, limiting the relevance of building performance for these KPIs. As a result, building design parameters showed low sensitivity across all KPIs. This indicates that, given the preliminary definition of the building and its HVAC systems at the pre-design stage, variations in building-related uncertain parameters (within their expected boundaries) are unlikely to significantly affect the overall performance. However, if the design is still evolving and subject to significant modifications (such as installation of air-conditioning), wider parameter ranges should be considered to adequately capture potential variability.
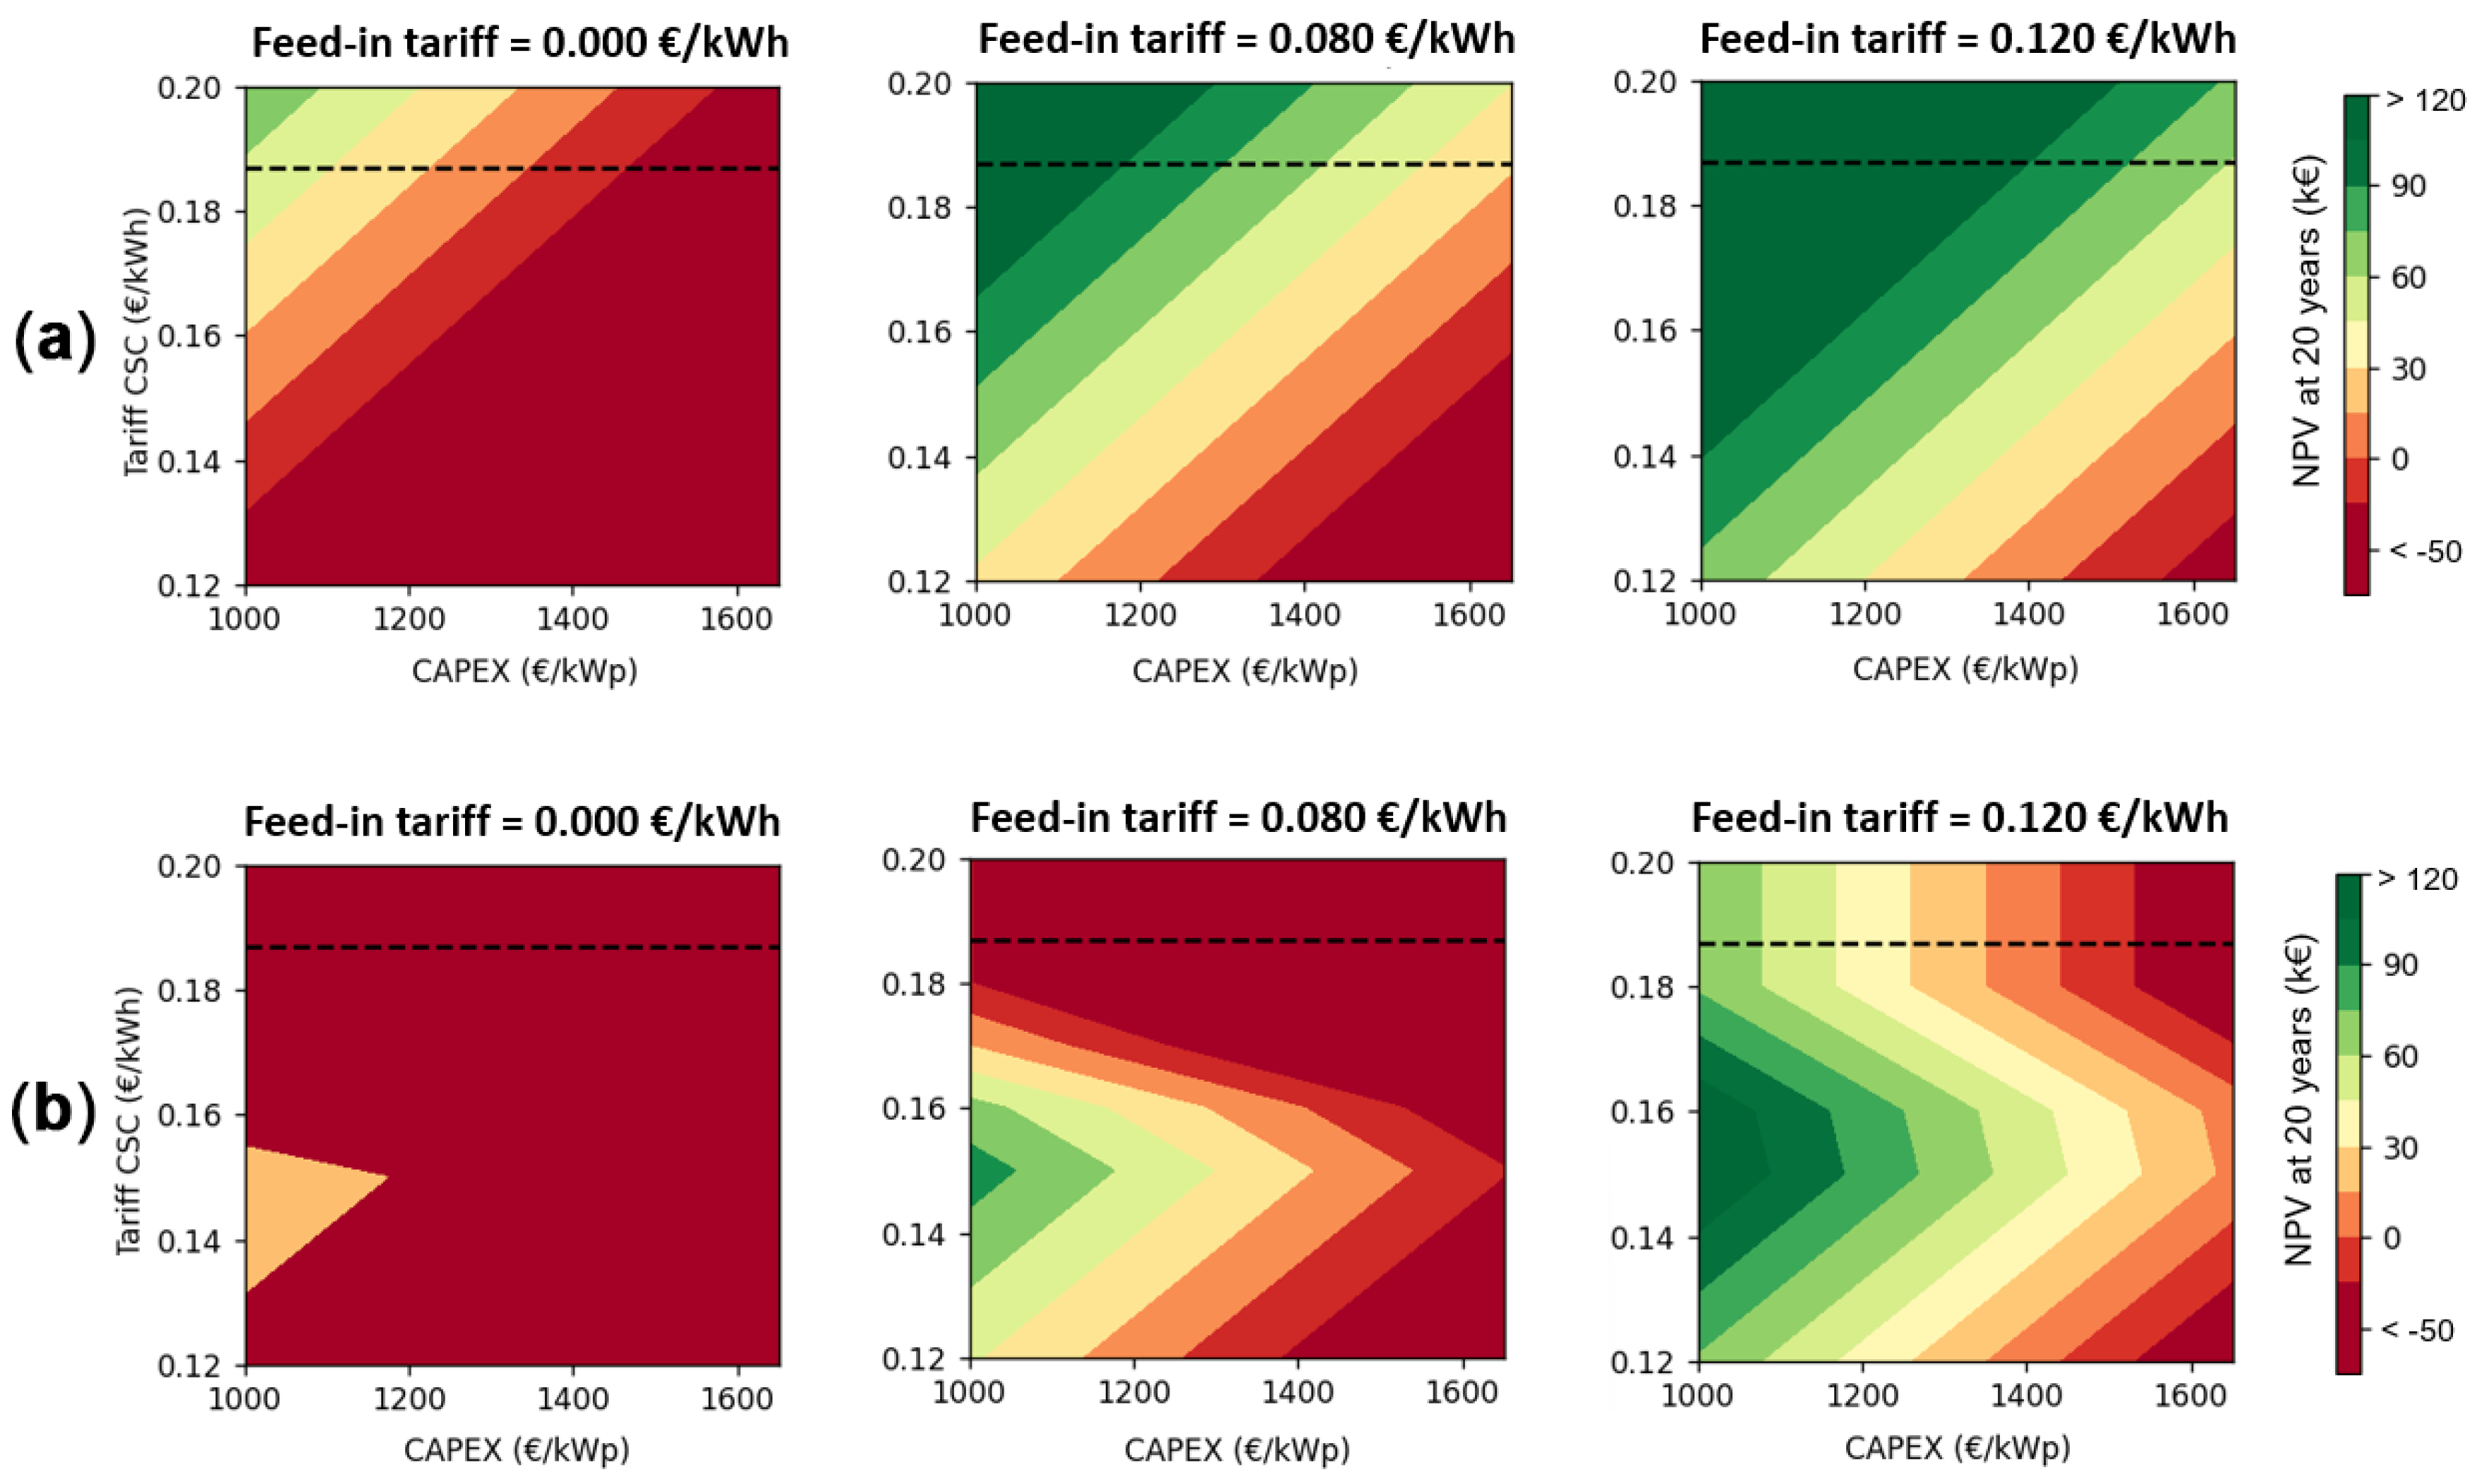
In the current model, electricity demand is not modulated by tariffs, meaning that economic parameters do not affect SCR or SSR. However, as observed in Figure 6, they play a dominant role in determining the Net Present Value (NPV), Average Bill Reduction (ABR), and the Participation Willingness Index (PWI). Their influence on the NPV was particularly strong, which is intuitive given the economic nature of the metric. The magnitude of this dominance is noteworthy: it suggests that, assuming a good foundation for the technical design, the economic viability of the proposed CSC project is primarily governed by the economic context. For instance, if the CSC tariff is higher than the feed-in tariff, higher SCR values translate into higher NPVs. However, when the margin between these two tariffs narrows, the influence of SCR on NPV diminishes. Consequently, parameters that heavily impact the SCR, while still relevant, exert a significantly lesser influence on the NPV than economic variables such as tariffs and cost assumptions. Similarly, tariffs have the greatest impact on ABR and PWI, since these indicators are closely tied to end-user electricity bills. A high CSC tariff will increase profit for the investors and PV production operators, but it will also negatively impact end-user satisfaction. Therefore, it is valuable to monitor indicators such as the ABR and PWI during the design phases. Then, the energy availability, determined by PV capacity and total demand (itself shaped by participation rate and average consumption), also influences these KPIs. If local generation is insufficient to meet the demand, end-users may not experience substantial benefits, which could lead to low participation rates and, in turn, a lower SCR. As long as the feed-in tariff is high, the project’s economic viability is generally preserved for the investor. However, this also implies a strong dependency on that tariff, making the CSC operation vulnerable to significant reductions in its value. Figure 8 presents the NPV outcomes as a function of the CSC tariff, the feed-in tariff for surplus electricity, and the CAPEX. The outcome was estimated first without taking end-user satisfaction (a) and then with (b). End-user satisfaction was incorporated by conducting a two-step analysis: first, assuming a 100% participation rate, and then by adjusting the participation rate to match the PWI obtained in the initial iteration (so that all participants get at least a 5% decrease in their electricity bill). The results show that a high feed-in tariff can sustain a positive NPV even with low end-user participation, which can reassure the investors. However, as the feed-in tariff decreases, financial viability becomes increasingly sensitive to the CSC tariff and CAPEX levels. In this example, feed-in tariff values beyond the original range defined in the Morris screening were deliberately included to illustrate the extent to which the feed-in tariff can support project profitability. It can also be observed that the CSC tariff cannot be increased indefinitely to offset profit losses, as this would reduce end-user satisfaction, leading to a lower participation rate, eventually reducing the self-consumption rate, and ultimately, diminishing profitability.
The inflation rate also significantly affected the ABR (Figure 6). When the CSC tariff remains constant, higher inflation leads to greater relative savings for end-users compared to rising grid tariffs. This highlights the financial protection role a stable CSC tariff can offer against external electricity tariff increases.
The Jain Index (JI), used to assess equity in CSC, was mainly influenced by the average domestic electricity consumption, followed by the choice of distribution key (DK). Two DKs were considered: a proportional method based on consumption and a hybrid method combining equal sharing and proportional redistribution. A parameter called DKα was introduced to represent varying mixes of the two for the sensitivity analysis. While DKs can amplify disparities, especially the proportional one, the analysis shows that consumption heterogeneity among participants is the primary source of inequality. However, since the case study focused on residential users, relatively homogeneous consumers, disparities remain limited.
Finally, it can be observed that several parameters had either non-linearities or inter-dependent influences. In Figure 6, the parameters that exert a strong influence on the SCR are associated with relatively high σ/μ* values (greater than 1) for the NPV, which likely reflects the underlying parameter interaction effects. As already discussed, the influence of these parameters on the NPV evolves with the feed-in tariff. The comparison in Figure 8 between fixed and variable end-user participation rates revealed that the influence of other parameters shifts depending on whether this rate is held constant or allowed to vary. Generally, the analysis revealed substantial non-linear behavior and interaction effects between parameters (σ/μ* values above 0.5). A better understanding of all non-linearities and parameter interactions could be obtained with variance-based methods, like the Sobol method mentioned earlier. However, in the present case, the parameters with the highest μ* values generally showed low parameter interaction or non-linearities, except for the PWI KPI. Moreover, for noteworthy parameters like those in the previous examples with feed-in tariff and end-user participation, parameter interaction can be relatively easily identified. Therefore, applying the Sobol method is not necessary here. It could be eventually leveraged in a case where parameter interactions appear more complex, though its use would be recommended in a second-stage sensitivity analysis, after a first screening, in order to reduce the domain and save computational costs.

3.3. Risk Assessment

The sensitivity analysis clearly identified the most influential parameters among a wide range of inputs for each KPI. Since conducting risk assessments through large-scale sampling can be computationally expensive, restricting this step to a relevant shortlist of parameters is highly beneficial. Given that a project’s continuation is often highly dependent on its economic feasibility, the NPV is taken as an example for a risk assessment.
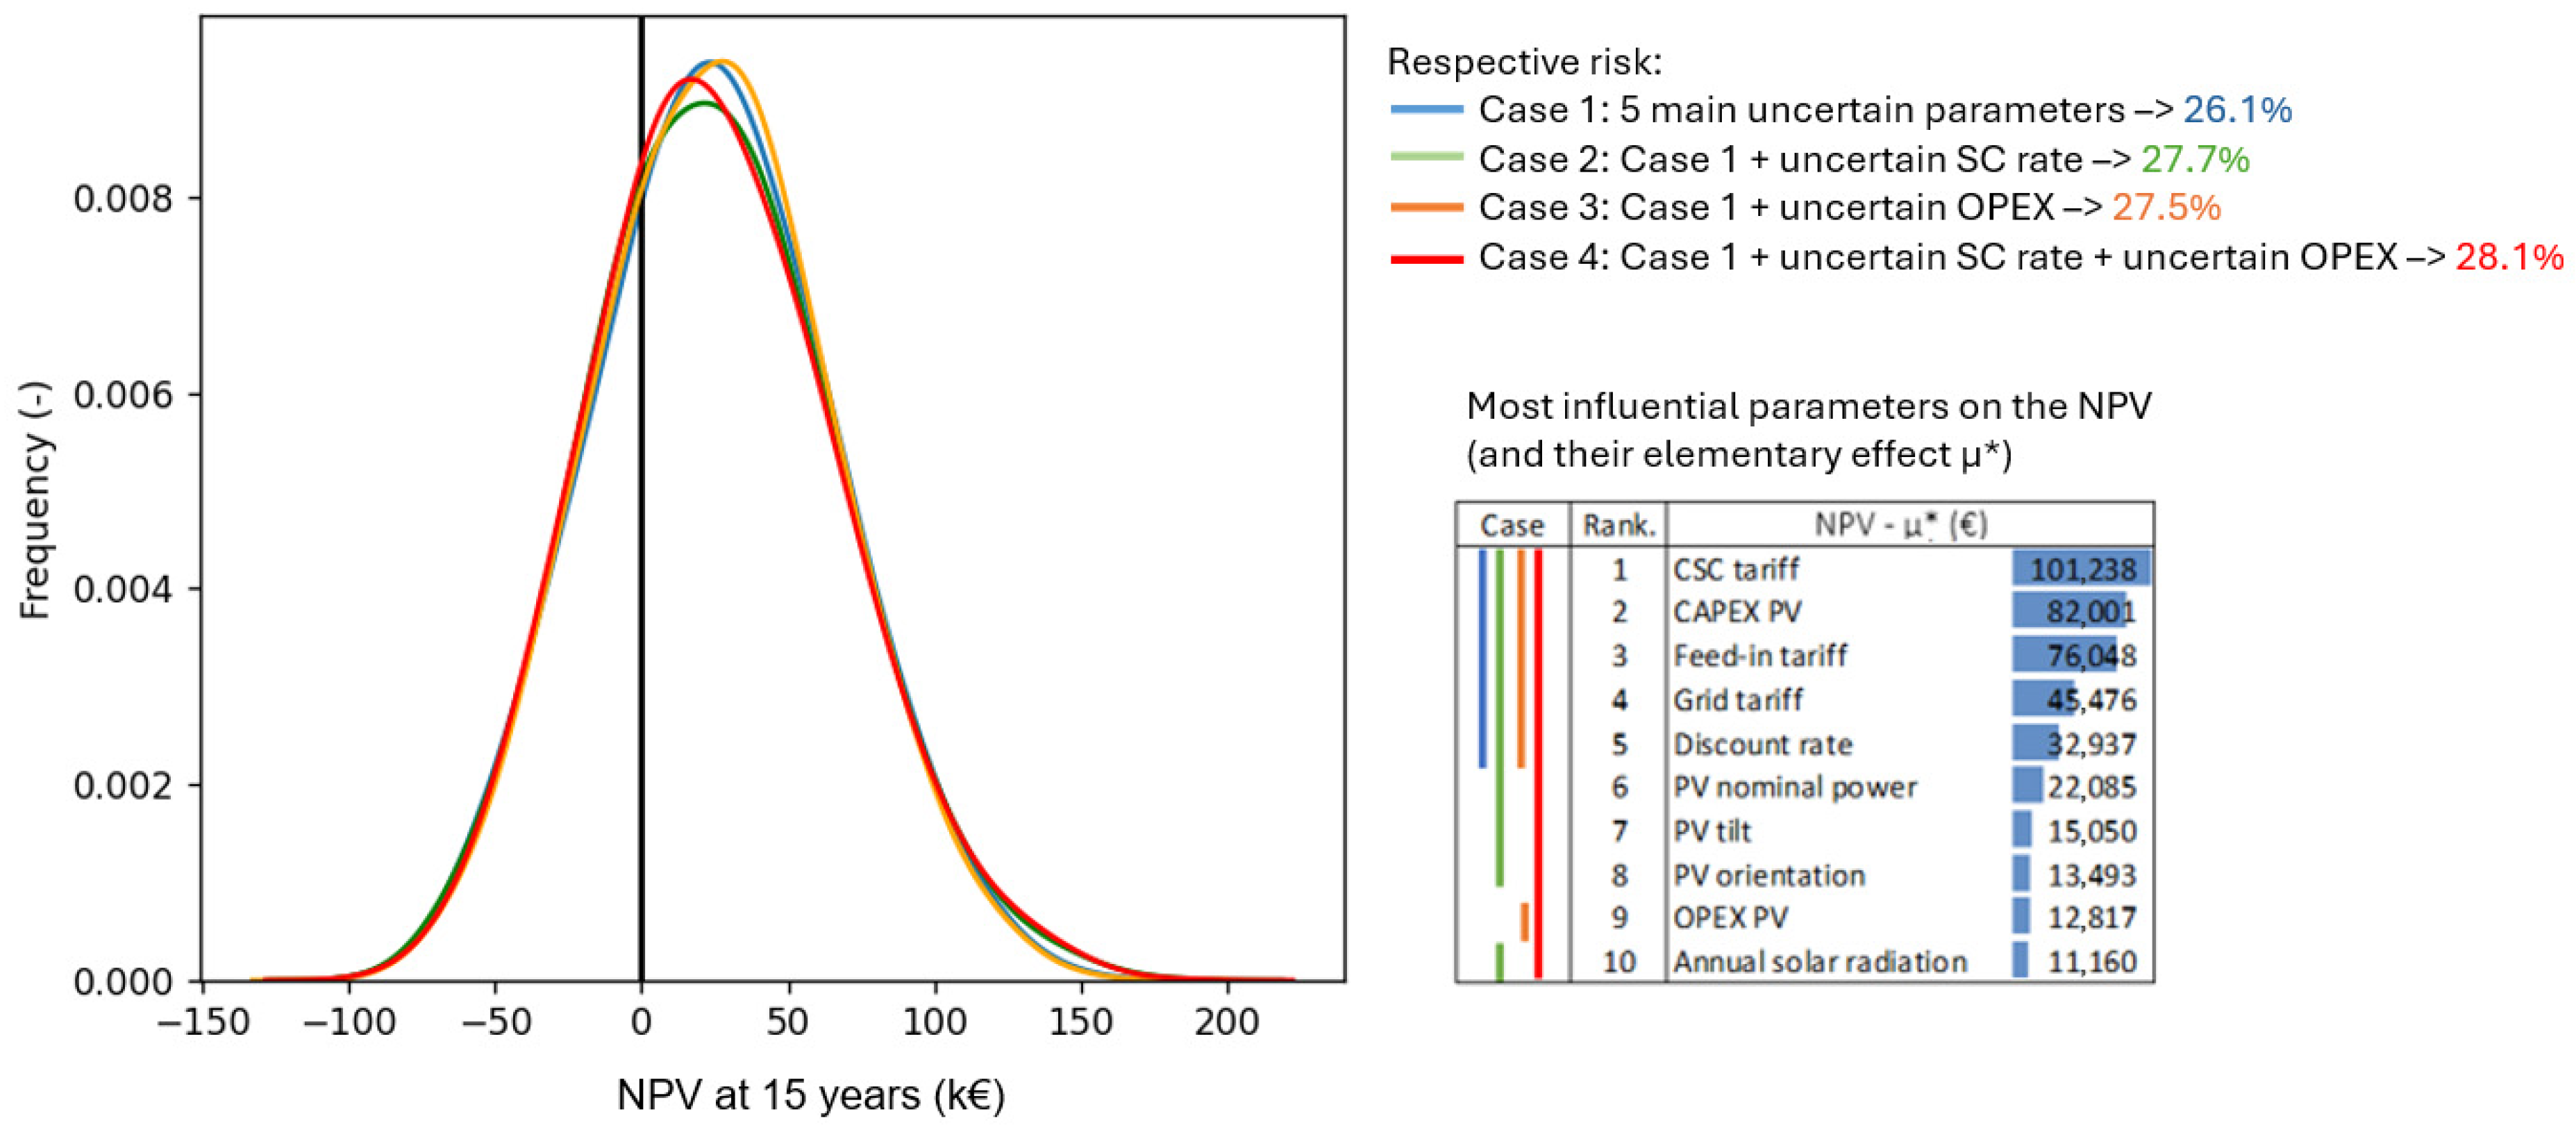
The sensitivity analysis revealed that economic parameters are, by a significant margin, the most dominant regarding the outcome of the NPV. Therefore, at an early design stage, it may be appropriate to limit the risk assessment to those parameters alone. For example, Figure 9 presents the outcomes of a risk assessment based on Latin Hypercube Sampling with a uniform probability density function.
This figure compares results obtained by progressively including up to ten of the most influential parameters identified in the sensitivity analysis. It shows that beyond the top five parameters, the estimated risk remained relatively stable. If only economic parameters are sampled, the energy model does not need to be run again, thus saving substantial computational costs. This finding confirms the effectiveness of the sensitivity analysis in identifying the key drivers of the NPV and suggests that a reliable risk estimate can be obtained by focusing the sampling efforts primarily on the main economic parameters.
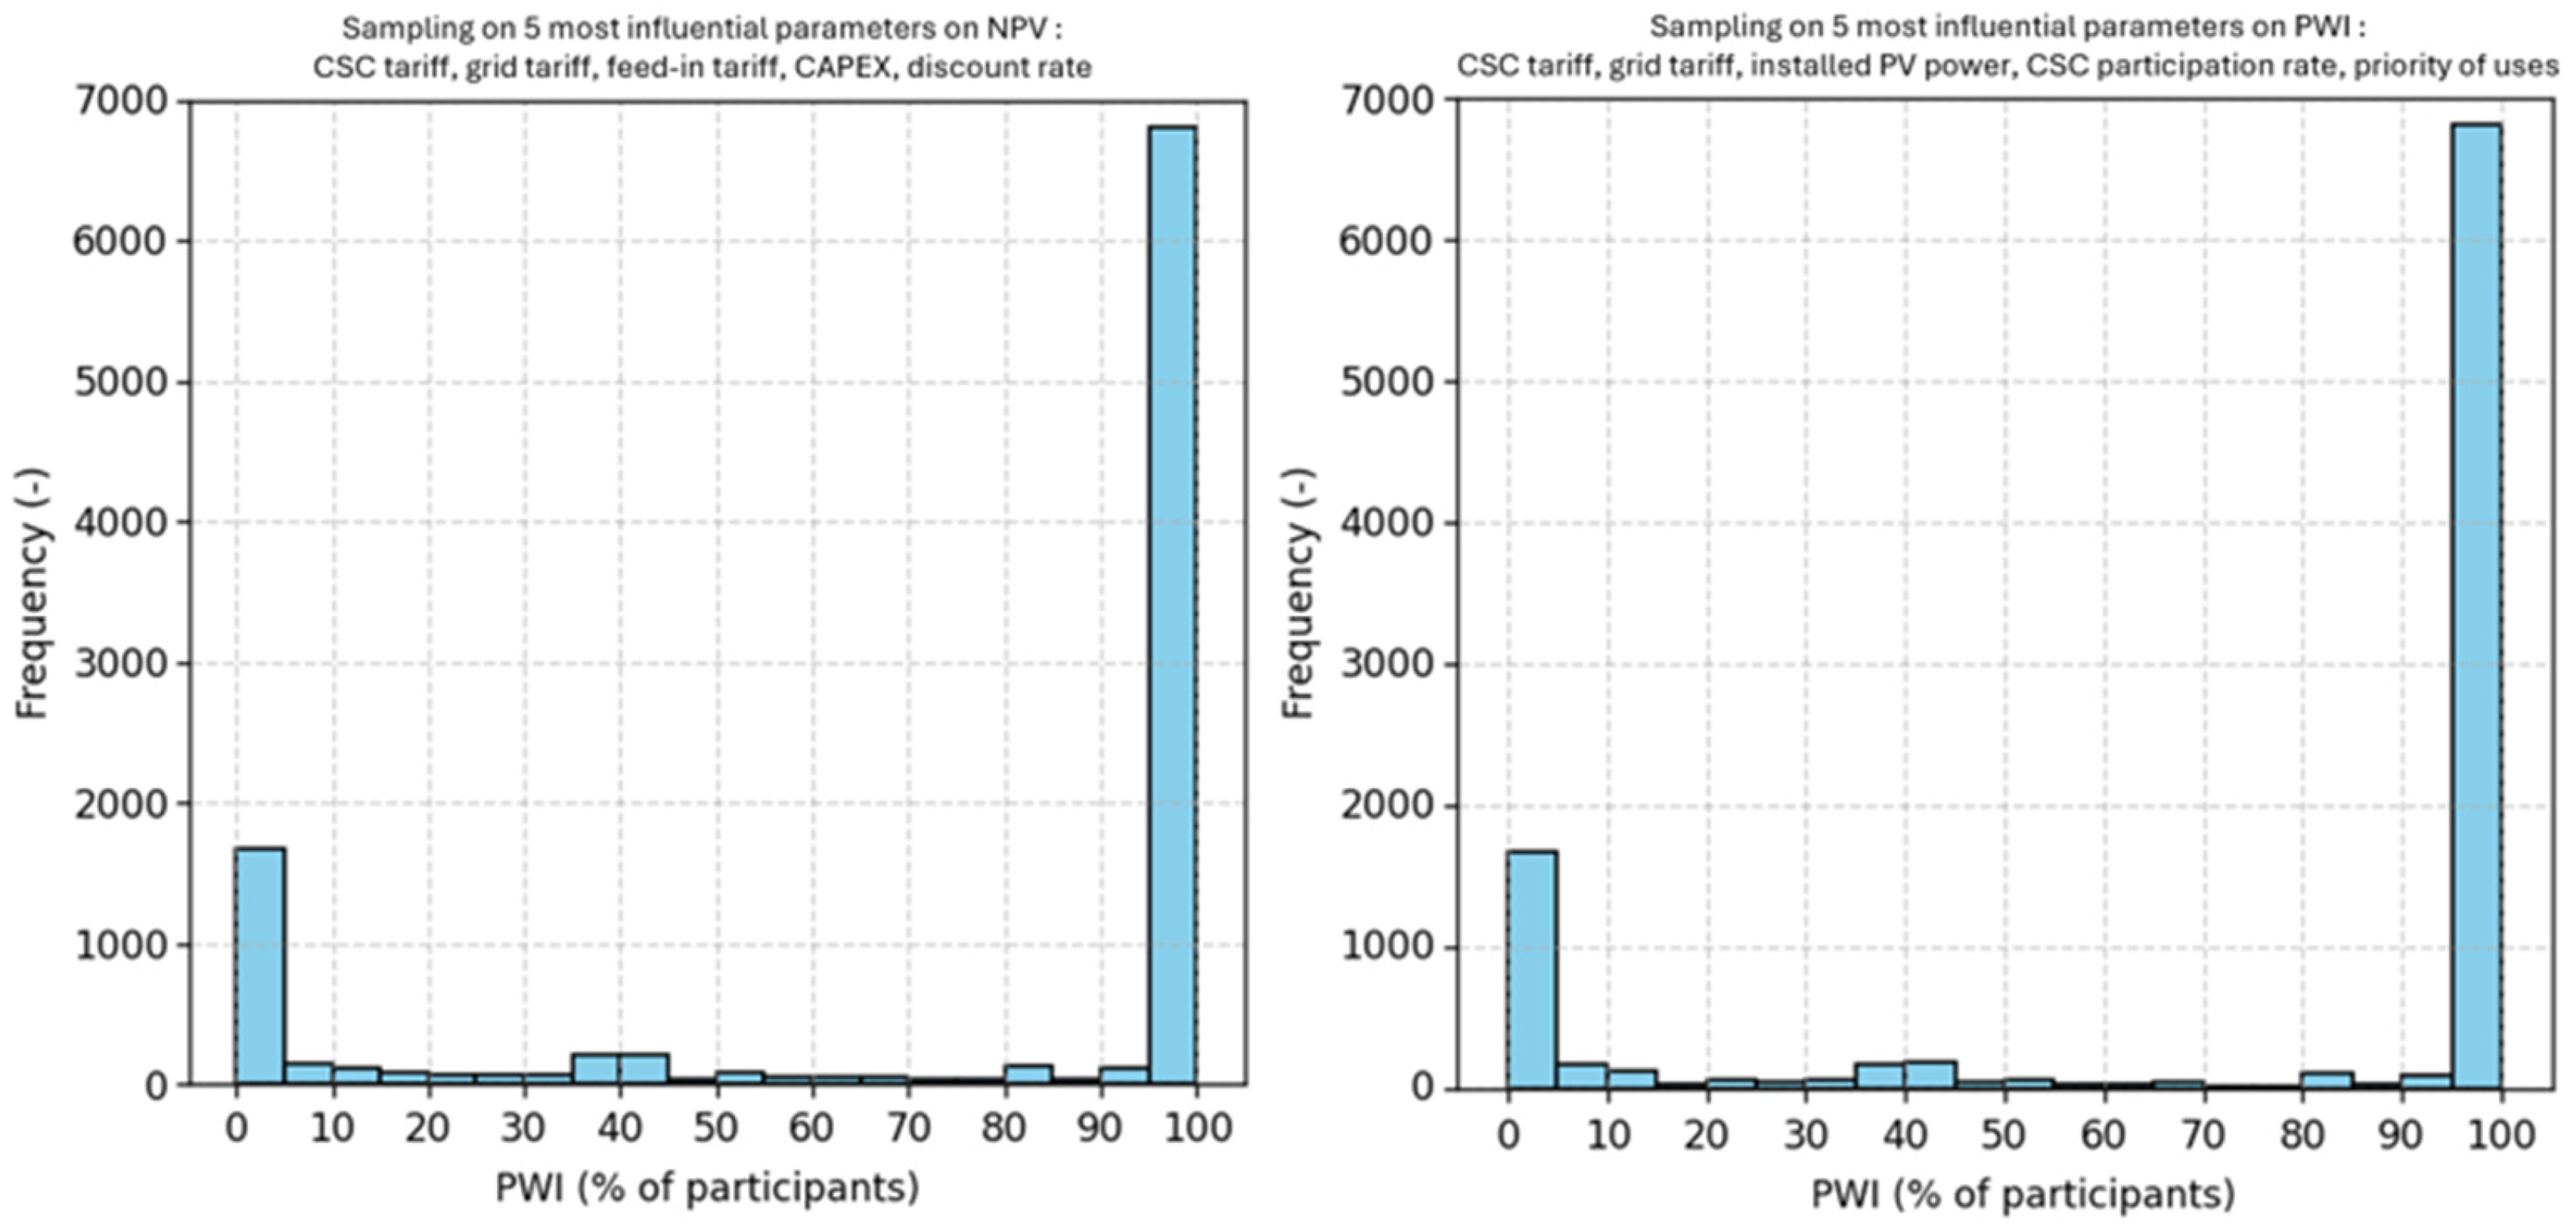
Lastly, as discussed throughout this article, it is valuable to evaluate the project performance from the perspectives of the various stakeholders involved. The sensitivity analysis revealed that certain parameters (e.g., the CSC tariff, grid tariff, and installed PV capacity) are among the most influential for both the Net Present Value (NPV) and the Participation Willingness Index (PWI). There were some differences, however. The CSC participation, for example, had little impact on the NPV, but was among the most influential parameters for the PWI. While this parameter may not be critical for assessing the risk on the NPV, it may be important when considering end-user satisfaction. Figure 10 compares the PWI result distributions obtained from the sampling used for NPV risk assessment (with the five most influential parameters) and from a separate sampling focused on the five most influential parameters for the PWI. In the end, the outcomes between the two sampling approaches were similar. This can be attributed to the dominant influence of the CSC and grid tariffs on the PWI, which significantly outweighs the impact of other parameters. Thus, the risk to end-user satisfaction can be analyzed alongside the financial risk (NPV) relatively easily. However, the distribution also revealed that a substantial portion of PWI results fell near 0%, which is a major concern not only for the design team, but also for investors and end-users. This outcome suggests that within the defined input parameter ranges, certain combinations can lead to highly undesirable scenarios. In the current case, the PWI fell to 0% when the CSC tariff equaled or exceeded the grid tariff, therefore not providing value in joining the CSC operation for potential consumers. This occurs when no balanced tariff for locally generated electricity can simultaneously provide adequate returns for the investor and remain competitive with grid prices for consumers.
These outcomes stemmed mostly from unfavorable combinations of grid and feed-in tariffs and the negotiated CSC tariff. Although the resulting CSC tariff may be sufficient to recover investment costs, it may not be low enough to attract consumers. Assessing the likelihood of such scenarios is critical: even if the investment appears financially sound, the absence of participating users could ultimately undermine the entire business case. Studying the causes of unsatisfied end-users helps in identifying problematic configurations and enables the design team to avoid them. This finding reinforces the importance of assessing multiple KPIs simultaneously to ensure a robust design that aligns with the expectations of all stakeholders.

4. Discussion

The sensitivity analysis conducted in this study offers a comprehensive view of how various parameters influence multiple KPIs. This information is particularly valuable for the project development team, as it helps identify the critical parameters to prioritize and secure during the early design phases, in alignment with the project’s objectives. However, it was observed that parameter influence can be highly context dependent. Therefore, the results of this sensitivity analysis cannot be directly generalized for all CSC projects, and underscore the value of a flexible modeling and simulation workflow that can be adapted with relative ease to the specific context of a given project. While this paper focused on a single case study, exploring other configurations will be the subject of future work.
For the present case study, the sensitivity analysis highlighted the following key insights:
-
Energy performance (SCR & SSR): For assessing renewable energy integration and the balance of supply and demand, self-consumption rate (SCR) and self-sufficiency rate (SSR) are key indicators. These metrics are important for the project owner and the design team, as they provide information on the adequate sizing of the renewable energy production. For the entity investing in the systems and then selling the energy, a high SCR serves as a safety measure for a secure investment. As observed, a high SCR diminishes the impact of the feed-in tariff on the cost-efficiency of the investment, a parameter that is external to the project and that cannot be controlled. The DSO, responsible for the good operation of the grid, is also likely interested in the estimated SCR, because high volumes of energy surplus can be a source of grid instability. For the district in the present case study, small variations in design parameters have a limited impact. Instead, the accurate estimation of domestic electricity demand, PV capacity, and prospective participation rate is critical. Therefore, the stakeholders should focus on those.
-
Financial feasibility (NPV): Economic parameters are the primary drivers of profitability, so they are essentially directed towards the investors, but also to the project owner (if different from the investor), who needs to find investors to ensure the project development. When the feed-in tariff is high, the SCR has limited influence on the net-present value (NPV), thereby reducing the impact of technical parameters that affect the SCR. The profit margin for the PV operator is shaped by grid tariffs, CAPEX, and OPEX, which determine the CSC tariff. These parameters are less controllable and represent a key source of risk. If the feed-in tariff drops significantly, profitability becomes more sensitive to SCR, making technical factors more important. Thus, once the main design is outlined, parametric analyses shall be directed at the economic parameters.
-
Social welfare performance (ABR, PWI, JI): While these indicators are mainly oriented towards end-users, they are still of importance to the project owner and the investors. The financial success of the CSC operation relies on sufficient engagement from potential consumers, thus joining a CSC operation must be attractive. To encourage end-user participation in CSC operations, the local tariffs offered must be low enough to achieve a sufficiently attractive Average Bill Reduction (ABR), thereby ensuring a high Participant Willingness Index (PWI). As a result, the CSC tariff is a key influencing factor. However, mismatches between energy production and demand, highlighted by the influence of participation rate and PV capacity, can negatively affect both ABR and PWI. For instance, increasing the number of participants without a corresponding increase in PV generation can lead to smaller energy shares per user, making the benefits of joining the CSC operation appear insufficient. In fully residential contexts, where consumption patterns are relatively uniform, both dynamic and static distribution keys (DKs) generally ensure fair energy allocation (observed with the Jain Index, JI). In contrast, this balance may not be held in mixed-use neighborhoods, where varying consumption profiles could challenge perceived fairness.
The sensitivity analysis conducted in this study proves to be a valuable preliminary step to risk assessment, offering clear guidance on which parameters should be prioritized in further evaluations. By identifying the most influential design and operational factors affecting the selected KPIs, it helps streamline subsequent uncertainty analyses and optimize computational resources. Such findings are particularly useful for risk assessments aimed at testing design reliability and reassuring stakeholders.
Recommendations for investors and planners: According to the present case study, unless major design changes occur, uncertainties in technical design parameters exert only a limited impact on the project’s financial viability. The equilibrium between grid and CSC tariffs is actually crucial. Indeed, on the one hand, the CSC tariff must be high enough so that investment costs can be recovered in a reasonable time. On the other hand, it needs to be low enough to obtain user satisfaction, otherwise, an insufficient participation rate could jeopardize the return on investment, especially in a low feed-in tariff scenario. The participation rate has a strong impact on the SCR, and it is important to note that, indeed, the importance of the SCR on the economic feasibility of the project increases substantially when the feed-in tariff decreases. Therefore, maximizing the SCR helps reduce the risk, which further highlights the importance of considering consumer satisfaction. Hence, while the NPV is the main factor to assess the economic outcome, the consumers’ point of view must also be looked at in order to maximize subscription to the project. The ABR and the PWI are metrics that allow for gauging the benefits for the consumers, and eventually, the equity can also be observed through the Jain Index, for instance. Nonetheless, a sound tariff equilibrium is not necessarily easy to reach depending on the state of the energy market. Additionally, as the grid and feed-in tariffs are variables that cannot be controlled by the investors and planners, it is therefore recommended to perform a risk assessment to assess the NPV through a broad range of scenarios. Thanks to the sensitivity, the uncertainty on technical parameters can be ruled out, thus rendering large-scale sampling possible in a reasonable time, through Latin hypercube sampling, for example.
As noted earlier, this article focused on a single case study, which served as a test-bed for the proposed methodology. Additional case studies should be investigated, including more extreme scenarios within the same district as well as different districts varying in size, end uses (mixed-use communities), and location. With the methodology and workflow now developed, these extensions represent clear directions for future work. Furthermore, the Morris screening method was selected for computational efficiency. However, more detailed methods, such as the Sobol method, could be applied to a shortlisted set of influential parameters already identified, enabling a deeper examination of interactions among the most critical variables.

5. Conclusions

Collective self-consumption facilitates the integration of renewable energies in the built environment and provides direct access to them to a wider range of end-users. Incorporating CSC projects during the early phases of new neighborhood development offers an opportunity to seamlessly integrate renewable energy systems in urban areas. However, designing a CSC operation at this stage can be particularly challenging due to the significant uncertainty surrounding numerous design and operational parameters. The lack of clarity regarding the impact of their variability complicates the assessment of feasibility and performance, thus hindering the adoption of CSC projects. The aim of this work was to propose a methodology for identifying the key parameters that significantly influence the performance of a CSC operation, which can be used by modelers for specific projects.
The proposed methodology was built on a simulation framework that integrates an energy model to estimate consumption and production data, a CSC model to simulate energy allocation, and an economic analysis to evaluate cost-effectiveness. A wide range of input parameters was stochastically implemented to account for their variability. This simulation framework was then utilized in a sensitivity analysis, employing the Morris screening method, to conduct a large-scale evaluation of all variable parameters. The analysis was performed across a selection of KPIs simultaneously, providing valuable insights into outcomes relevant to various stakeholders involved in a CSC project.
A case study representing a CSC project for a new neighborhood development in France was used as a testbed for the proposed methodology. Using the Morris screening method, 230 simulations were conducted, enabling a comprehensive sensitivity analysis of all variable parameters. The results highlighted that the significance of parameters varied considerably across different KPIs. For this specific case study and context, the cost-effectiveness of the CSC project was found to depend almost entirely on financial parameters, with technical factors and consumption habits playing a negligible role. A notable explanation is the relatively high feed-in tariffs, which help maintain project profitability even under lower self-consumption rates. Furthermore, the building’s technical characteristics affect electricity demand during the winter months, when PV production is significantly reduced and largely absorbed by the consumption of domestic electrical appliances. It was then shown that focusing the sampling efforts during the risk assessment only on the main economic parameters provides satisfactory results. Therefore, if cost-effectiveness is the primary objective, risk assessments can be performed with low computational costs by focusing solely on key financial parameters while maintaining reliable results. However, if other indicators, such as levels of self-consumption or end-user satisfaction, are prioritized, additional factors, such as the productivity of the PV plant and overall consumption levels, cannot be overlooked.
This extensive sensitivity analysis on multiple KPIs provides valuable insights into the parameters that subsequent analyses, such as risk assessments, should prioritize depending on the project’s primary goals. This provides a good foundation for multi-criteria decision analysis later on in the project. In the context of multi-objective driven projects, next steps could take the shape of a multi-objective optimization strategy carried out using, for example, an evolutionary algorithm such as NSGA-II, and then decision-making using a multi-criteria analysis algorithm [80,81].
Nonetheless, it is important to note that the current work does not aim to provide universal guidelines for designing CSC projects, as the findings are limited to a single case study and its specific context. Applying the proposed methodology and workflow to a broader range of case studies remains an important direction for future research.
The main objective was the development of a flexible methodology suitable for integration into the workflow of engineering firms collaborating with urban developers. Future research will focus on expanding the scope of this work by applying the methodology to a broader range of case studies.

Author Contributions

Conceptualization, S.P., A.N., J.L.D. and C.I.; methodology, S.P., J.L.D. and C.I.; software, S.P. and J.L.D.; validation, J.L.D., C.I. and A.N.; formal analysis, S.P.; investigation, S.P. and J.L.D.; resources, J.L.D., C.I. and A.N.; data curation, S.P.; writing—original draft preparation, S.P.; writing—review and editing, J.L.D., C.I. and A.N.; visualization, S.P.; supervision, J.L.D., C.I. and A.N.; project administration, C.I.; funding acquisition, A.N. and C.I. All authors have read and agreed to the published version of the manuscript.

Funding

This work was supported by ANRT under contract CIFRE 2020/0459.

Data Availability Statement

The data presented in this study are available from the corresponding author upon reasonable request. Most of the data originated from publicly accessible resources cited in the bibliography. The tools and code developed during this research are proprietary and are not publicly available due to confidentiality and commercial restrictions. Limited access to parts of these materials may be granted upon request, subject to agreement on their intended use.

Acknowledgments

The authors have reviewed and edited the output and take full responsibility for the content of this publication.

Conflicts of Interest

Authors S.P. and A.N. were employed by the company TERAO. The remaining authors declare that the research was conducted in the absence of any commercial or financial relationships that could be construed as a potential conflict of interest.

Abbreviations

The following abbreviations are used in this manuscript:
ACHAir change per hour
ABRAverage annual bill reduction
AWHPAir -to-water heat pump
CAPEXCapital expenditure (investment costs)
COPCoefficient of performance
COSTICComité scientifique et technique des industries climatiques, which can be translated as Scientific and Technical Committee for the Air-Conditioning Industry
CSCCollective self-consumption
DHWDomestic hot water
DKDistribution key
DSODistribution system operator
EUEuropean Union
GHGGreenhouse gas
HVACHeating, ventilation and air-conditioning
KPIKey performance indicator
kWpKilowatt peak, metric for the nominal capacity of solar modules
LHSLatin Hypercube sampling
NPVNet present value
OPEXOperational expenditure (operation and maintenance costs)
PVPhotovoltaic
PWIParticipation willingness index
RECRenewable Energy Community
SASensitivity analysis
SCRSelf-consumption rate
SSRSelf-sufficiency rate
TUSTime-of-Use Survey
UBEMUrban building energy modeling
U-valueThermal transmittance, the rate of transfer of heat through a surface or structure
VATValue added tax

References

  1. Pörtner, H.-O.; Roberts, D.C.; Tignor, M.M.B.; Poloczanska, E.S.; Mintenbeck, K.; Alegría, A.; Craig, M.; Langsdorf, S.; Löschke, S.; Möller, V.; et al. (Eds.) IPCC, 2022: Climate Change 2022: Impacts, Adaptation and Vulnerability. Contribution of Working Group II to the Sixth Assessment Report of the Intergovernmental Panel on Climate Change; Cambridge University Press: Cambridge, UK; New York, NY, USA, 2023; 3056p. [Google Scholar] [CrossRef]
  2. Association négaWatt. La Transition Energétique au Cœur D’une Transition Sociétale, Synthèse du Scénario negaWatt 2022; AssociationnégaWatt: Valence, France, 2021; Available online: https://negawatt.org/IMG/pdf/synthese-scenario-negawatt-2022.pdf (accessed on 30 January 2026).
  3. RTE. Bilan Prévisionnel de L’équilibre Offre-Demande D’électricité en France, 2017th ed.; RTE: La Défense, France, 2017; Available online: https://assets.rte-france.com/prod/public/2020-06/bp2017_complet_vf_compressed.pdf (accessed on 30 January 2026).
  4. Dudjak, V. Impact of local energy markets integration in power systems layer: A comprehensive review. Appl. Energy 2021, 301, 117434. [Google Scholar] [CrossRef]
  5. Vivian, J.; Chinello, M.; Zarrella, A.; De Carli, M. Investigation on Individual and Collective PV Self-Consumption for a Fifth Generation District Heating Network. Energies 2022, 15, 1022. [Google Scholar] [CrossRef]
  6. Tushar, W.; Yuen, C.; Saha, T.K.; Morstyn, T.; Chapman, A.C.; Alam, M.J.E.; Hanif, S.; Poor, H.V. Peer-to-Peer Energy Systems for Connected Communities: A Review of Recent Advances and Emerging Challenges. Appl. Energy 2021, 282, 116131. [Google Scholar] [CrossRef]
  7. Frieden, D.; Tuerk, A.; Roberts, J.; D’Herbemont, S.; Gubina, A.F.; Komel, B. Overview of Emerging Regulatory Frameworks on Collective Self-Consumption and Energy Communities in Europe. In Proceedings of the 2019 16th International Conference on the European Energy Market (EEM), Ljubljana, Slovenia, 18–20 September 2019; IEEE: New York, NY, USA; pp. 1–6.
  8. Inês, C.; Guilherme, P.L.; Esther, M.-G.; Swantje, G.; Stephen, H.; Lars, H. Regulatory Challenges and Opportunities for Collective Renewable Energy Prosumers in the EU. Energy Policy 2020, 138, 111212. [Google Scholar] [CrossRef]
  9. Viti, S.; Lanzini, A.; Minuto, F.D.; Caldera, M.; Borchiellini, R. Techno-Economic Comparison of Buildings Acting as Single-Self Consumers or as Energy Community through Multiple Economic Scenarios. Sustain. Cities Soc. 2020, 61, 102342. [Google Scholar] [CrossRef]
  10. European Commission; Directorate General for Energy; Trinomics; Schoenherr; Fraunhofer ISI; Enerdata. Study on Mapping of Regulatory Frameworks and Barriers for Individual and Collective Renewables Self-Consumption in EU Member States; Publications Office: Luxembourg, 2024. [Google Scholar]
  11. Lab2051. Favoriser le Passage à L’échelle de L’autoconsommation Collective. 2022. Available online: https://www.ecologie.gouv.fr/sites/default/files/Lab2051_Autoconsommation_collective_Incubation.pdf (accessed on 17 December 2024).
  12. Frieden, D.; Tuerk, A.; Antunes, A.R.; Athanasios, V.; Chronis, A.-G.; d’Herbemont, S.; Kirac, M.; Marouço, R.; Neumann, C.; Pastor Catalayud, E.; et al. Are We on the Right Track? Collective Self-Consumption and Energy Communities in the European Union. Sustainability 2021, 13, 12494. [Google Scholar] [CrossRef]
  13. Sia Partners, EnergyLab, L’autoconsommation Collective. Etat Des Lieux, Cas D’usage et Conditions de Développement. 2019. Available online: https://www.sia-partners.com/fr/publications/publications-de-nos-experts/lautoconsommation-collective (accessed on 17 December 2024).
  14. Pawlak, S.; Le Dréau, J.; Inard, C.; Novel, A. Designing renewable energy production at district scale: A sensitivity analysis. In Proceedings of the 2023 18th Building Simulation International Conference of IBPSA, Shanghai, China, 4–6 September 2023; pp. 2882–2889. [Google Scholar] [CrossRef]
  15. D’Adamo, I.; Gastaldi, M.; Morone, P. Solar Collective Self-Consumption: Economic Analysis of a Policy Mix. Ecol. Econ. 2022, 199, 107480. [Google Scholar] [CrossRef]
  16. Villalonga Palou, J.T.; Serrano González, J.; Riquelme Santos, J.M.; Álvarez Alonso, C.; Roldán Fernández, J.M. Sharing Approaches in Collective Self-Consumption Systems: A Techno-Economic Analysis of the Spanish Regulatory Framework. Energy Strategy Rev. 2023, 45, 101055. [Google Scholar] [CrossRef]
  17. Marino, C.; Nucara, A.; Panzera, M.F.; Pietrafesa, M. Energetic and Economic Advantages of Energy Communities: A Case Study Referred to a Southern Italian Town. Energy Rep. 2024, 12, 6072–6081. [Google Scholar] [CrossRef]
  18. Minuto, F.D.; Lanzini, A. Energy-Sharing Mechanisms for Energy Community Members under Different Asset Ownership Schemes and User Demand Profiles. Renew. Sustain. Energy Rev. 2022, 168, 112859. [Google Scholar] [CrossRef]
  19. Eisner, A.; Neumann, C.; Manner, H. Exploring Sharing Coefficients in Energy Communities: A Simulation-Based Study. Energy Build. 2023, 297, 113447. [Google Scholar] [CrossRef]
  20. Musilek, P.; Hussain, A. Equity-Oriented Power Sharing and Demand Response for Enhancing Green Energy Access in Mixed Communities. Energy Build. 2024, 308, 114029. [Google Scholar] [CrossRef]
  21. Gjorgievski, V.Z.; Cundeva, S.; Markovska, N.; Georghiou, G.E. Virtual Net-Billing: A Fair Energy Sharing Method for Collective Self-Consumption. Energy 2022, 254, 124246. [Google Scholar] [CrossRef]
  22. Dynge, M.; Nilsen Anfinnsen, E.; Cali, U. Evaluating Fairness Indicators for Local Energy Markets. TechRxiv 2023. [Google Scholar] [CrossRef]
  23. Reis, I.F.G.; Gonçalves, I.; Lopes, M.A.R.; Antunes, C.H. Collective Self-Consumption in Multi-Tenancy Buildings–To What Extent Do Consumers’ Goals Influence the Energy System’s Performance? Sustain. Cities Soc. 2022, 80, 103688. [Google Scholar] [CrossRef]
  24. Duchesne, L.; Cotnélusse, B.; Savelli, I. Sensitivity Analysis of a Local Market Model for Community Microgrids. In Proceedings of the 2019 IEEE Milan PowerTech, Milan, Italy, 23–27 June 2019; pp. 1–6. [Google Scholar] [CrossRef]
  25. Awad, H.; Gül, M. Optimisation of Community Shared Solar Application in Energy Efficient Communities. Sustain. Cities Soc. 2018, 43, 221–237. [Google Scholar] [CrossRef]
  26. D’Adamo, I.; Mammetti, M.; Ottaviani, D.; Ozturk, I. Photovoltaic Systems and Sustainable Communities: New Social Models for Ecological Transition. The Impact of Incentive Policies in Profitability Analyses. Renew. Energy 2023, 202, 1291–1304. [Google Scholar] [CrossRef]
  27. Calabrese, M.; Ademollo, A.; Carcasci, C. A Statistical Method to Evaluate the Impact of Electrical Consumption Uncertainty in a Renewable Energy Community. SSRN 2024. [Google Scholar] [CrossRef]
  28. Mavromatidis, G.; Orehounig, K.; Carmeliet, J. A Review of Uncertainty Characterisation Approaches for the Optimal Design of Distributed Energy Systems. Renew. Sustain. Energy Rev. 2018, 88, 258–277. [Google Scholar] [CrossRef]
  29. Tercan, S.M.; Demirci, A.; Gokalp, E.; Cali, U. Maximizing Self-Consumption Rates and Power Quality towards Two-Stage Evaluation for Solar Energy and Shared Energy Storage Empowered Microgrids. J. Energy Storage 2022, 51, 104561. [Google Scholar] [CrossRef]
  30. Morriet, L. Conception Multiacteur de Systèmes Energétiques Locaux Bas-Carbone: Outils, Modèles et Analyses Qualitatives. Ph.D. Thesis, Université Grenoble Alpes, Grenoble, France, 2021. Available online: https://theses.hal.science/tel-03285666 (accessed on 3 December 2024).
  31. Pickering, B.; Choudhary, R. District Energy System Optimisation under Uncertain Demand: Handling Data-Driven Stochastic Profiles. Appl. Energy 2019, 236, 1138–1157. [Google Scholar] [CrossRef]
  32. Mavromatidis, G.; Orehounig, K.; Carmeliet, J. Uncertainty and Global Sensitivity Analysis for the Optimal Design of Distributed Energy Systems. Appl. Energy 2018, 214, 219–238. [Google Scholar] [CrossRef]
  33. Albouys-Perrois, J.; Sabouret, N.; Haradji, Y.; Schumann, M.; Charrier, B.; Reynaud, Q.; Sempé, F.; Inard, C. Multi-Agent Simulation of Collective Self-Consumption: Impacts of Storage Systems and Large-Scale Energy Exchanges. Energy Build. 2022, 254, 111543. [Google Scholar] [CrossRef]
  34. Mutani, G.; Santantonio, S.; Beltramino, S. Indicators and Representation Tools to Measure the Technical-Economic Feasibility of a Renewable Energy Community. The Case Study of Villar Pellice (Italy). Int. J. Sustain. Dev. Plan. 2021, 16, 1–11. [Google Scholar] [CrossRef]
  35. Todeschi, V.; Marocco, P.; Mutani, G.; Lanzini, A.; Santarelli, M. Towards Energy Self-Consumption and Self-Sufficiency in Urban Energy Communities. Int. J. Heat Technol. 2021, 39, 1–11. [Google Scholar] [CrossRef]
  36. Talavera, D.L.; Muñoz-Cerón, E.; de la Casa, J.; Lozano-Arjona, D.; Theristis, M.; Pérez-Higueras, P.J. Complete Procedure for the Economic, Financial and Cost-Competitiveness of Photovoltaic Systems with Self-Consumption. Energies 2019, 12, 345. [Google Scholar] [CrossRef]
  37. Canova, A.; Lazzeroni, P.; Lorenti, G.; Moraglio, F.; Porcelli, A.; Repetto, M. Decarbonizing Residential Energy Consumption under the Italian Collective Self-Consumption Regulation. Sustain. Cities Soc. 2022, 87, 104196. [Google Scholar] [CrossRef]
  38. Drury, E.; Denholm, P.; Margolis, R. Impact of Different Economic Performance Metrics on the Perceived Value of Solar Photovoltaics; NREL/TP-6A20-52197; National Renewable Energy Laboratory: Golden, CO, USA, 2011; p. 1028528. [Google Scholar]
  39. Roy, A.; Olivier, J.-C.; Auger, F.; Auvity, B.; Bourguet, S.; Schaeffer, E. A Comparison of Energy Allocation Rules for a Collective Self-Consumption Operation in an Industrial Multi-Energy Microgrid. J. Clean. Prod. 2023, 389, 136001. [Google Scholar] [CrossRef]
  40. Mustika, A.D.; Rigo-Mariani, R.; Debusschere, V.; Pachurka, A. A two-stage management strategy for the optimal operation and billing in an energy community with collective self-consumption. Appl. Energy 2022, 310, 118484. [Google Scholar] [CrossRef]
  41. Zhou, Y.; Wu, J.; Long, C. Evaluation of Peer-to-Peer Energy Sharing Mechanisms Based on a Multiagent Simulation Framework. Appl. Energy 2018, 222, 993–1022. [Google Scholar] [CrossRef]
  42. Moret, F.; Pinson, P. Energy Collectives: A Community and Fairness Based Approach to Future Electricity Markets. IEEE Trans. Power Syst. 2019, 34, 3994–4004. [Google Scholar] [CrossRef]
  43. Oliveira, C.; Botelho, D.F.; Soares, T.; Faria, A.S.; Dias, B.H.; Matos, M.A.; de Oliveira, L.W. Consumer-Centric Electricity Markets: A Comprehensive Review on User Preferences and Key Performance Indicators. Electr. Power Syst. Res. 2022, 210, 108088. [Google Scholar] [CrossRef]
  44. Reis, V.; Almeida, R.H.; Silva, J.A.; Brito, M.C. Demand Aggregation for Photovoltaic Self-Consumption. Energy Rep. 2019, 5, 54–61. [Google Scholar] [CrossRef]
  45. Fonteneau, T. Autoconsommation collective ou solidarité nationale? L’adaptation controversée de la tarification du réseau d’électricité pour les autoconsommateurs. Flux 2021, 126, 52–70. [Google Scholar] [CrossRef]
  46. Luthander, R.; Nilsson, A.M.; Widén, J.; Åberg, M. Graphical Analysis of Photovoltaic Generation and Load Matching in Buildings: A Novel Way of Studying Self-Consumption and Self-Sufficiency. Appl. Energy 2019, 250, 748–759. [Google Scholar] [CrossRef]
  47. Gallego-Castillo, C.; Heleno, M.; Victoria, M. Self-Consumption for Energy Communities in Spain: A Regional Analysis under the New Legal Framework. Energy Policy 2021, 150, 112144. [Google Scholar] [CrossRef]
  48. Stephant, M.; Abbes, D.; Hassam-Ouari, K.; Labrunie, A.; Robyns, B. Distributed Optimization of Energy Profiles to Improve Photovoltaic Self-Consumption on a Local Energy Community. Simul. Model. Pract. Theory 2021, 108, 102242. [Google Scholar] [CrossRef]
  49. RTE. Bilan Electrique 2022. 2023. Available online: https://analysesetdonnees.rte-france.com/bilan-electrique-synthese (accessed on 17 December 2024).
  50. Garreau, E. Développement D’une Méthodologie D’analyse de la Parcimonie Pour la Simulation Energétique Urbaine. Ph.D. Thesis, Université Paris Sciences et Lettres, Paris, France, 2021. Available online: https://archivesic.ccsd.cnrs.fr/CEES/tel-03403586v1 (accessed on 3 December 2024).
  51. Heendeniya, C.B.; Sumper, A.; Eicker, U. The multi-energy system co-planning of nearly zero-energy districts—Status-quo and future research potential. Appl. Energy 2020, 267, 114953. [Google Scholar] [CrossRef]
  52. Johari, F.; Peronato, G.; Sadeghian, P.; Zhao, X.; Widén, J. Urban Building Energy Modeling: State of the Art and Future Prospects. Renew. Sustain. Energy Rev. 2020, 128, 109902. [Google Scholar] [CrossRef]
  53. El Kontar, R.; Polly, B.; Charan, T.; Fleming, K.; Moore, N.; Long, N.; Goldwasser, D. URBANopt: An Open-Source Software Development Kit for Community and Urban District Energy Modeling. In Proceedings of the 2020 Building Performance Analysis Conference and Simbuild, Virtual, 29 September–1 October 2020; pp. 293–301. [Google Scholar]
  54. Richardson, I.; Thomson, M.; Infield, D.; Clifford, C. Domestic Electricity Use: A High-Resolution Energy Demand Model. Energy Build. 2010, 42, 1878–1887. [Google Scholar] [CrossRef]
  55. Dabirian, S.; Panchabikesan, K.; Eicker, U. Occupant-Centric Urban Building Energy Modeling: Approaches, Inputs, and Data Sources—A Review. Energy Build. 2022, 257, 111809. [Google Scholar] [CrossRef]
  56. Wills, A.D.; Beausoleil-Morrison, I.; Ugursal, V.I. Adaptation and Validation of an Existing Bottom-up Model for Simulating Temporal and Inter-Dwelling Variations of Residential Appliance and Lighting Demands. J. Build. Perform. Simul. 2018, 11, 350–368. [Google Scholar] [CrossRef]
  57. ENERTECH; ADEME; RTE. Panel Usages Electrodomestiques, Faits et Chiffres, Librairie ADEME. 2021. Available online: https://librairie.ademe.fr/changement-climatique-et-energie/4473-panel-usages-electrodomestiques.html (accessed on 17 December 2024).
  58. Rivalin, L.; Stabat, P.; Marchio, D.; Caciolo, M.; Hopquin, F. A Comparison of Methods for Uncertainty and Sensitivity Analysis Applied to the Energy Performance of New Commercial Buildings. Energy Build. 2018, 166, 489–504. [Google Scholar] [CrossRef]
  59. Franczyk, A. Using the Morris Sensitivity Analysis Method to Assess the Importance of Input Variables on Time-Reversal Imaging of Seismic Sources. Acta Geophys. 2019, 67, 1525–1533. [Google Scholar] [CrossRef]
  60. Campolongo, F.; Cariboni, J.; Saltelli, A. An effective screening design for sensitivity analysis of large models. Environ. Model. Softw. 2007, 22, 1509–1518. [Google Scholar] [CrossRef]
  61. Morris, M.D. Factorial Sampling Plans for Preliminary Computational Experiments. Technometrics 1991, 33, 161–174. [Google Scholar] [CrossRef]
  62. Mills, E.; Kromer, S.; Weiss, G.; Mathew, P.A. From Volatility to Value: Analysing and Managing Financial and Performance Risk in Energy Savings Projects. Energy Policy 2006, 34, 188–199. [Google Scholar] [CrossRef]
  63. Bastidas-Arteaga, E.; Stewart, M.G. Economic Assessment of Climate Adaptation Strategies for Existing Reinforced Concrete Structures Subjected to Chloride-Induced Corrosion. Struct. Infrastruct. Eng. 2016, 12, 432–449. [Google Scholar] [CrossRef]
  64. Iooss, B.; Marrel, A. An Efficient Methodology for the Analysis and Modeling of Computer Experiments with Large Number of Inputs. In Proceedings of the UNCECOMP 2017 2nd ECCOMAS Thematic Conference on Uncertainty Quantification in Computational Sciences and Engineering, Rhodes Island, Greece, 15–17 June 2017; pp. 187–197. [Google Scholar] [CrossRef]
  65. Drury, E.; Jenkin, T.; Jordan, D.; Margolis, R. Photovoltaic Investment Risk and Uncertainty for Residential Customers. IEEE J. Photovolt. 2014, 4, 278–284. [Google Scholar] [CrossRef]
  66. COSTIC. Le Dimensionnement des Systèmes de Production D’eau Chaude Sanitaire en Habitat Individuel et Collectif; COSTIC: Saint-Rémy-lès-Chevreuse, France, 2019; ISBN N°978-2-36301-015-5. [Google Scholar]
  67. Ministère de la Transition Ecologique et de la Cohésion des Territoires. Catalogue Dido—Données et Etudes Statistiques Pour le Changement Climatique, L’énergie, L’environnement, le Logement, et les Transports, Conjoncture Mensuelle de L’énergie. Available online: https://www.statistiques.developpement-durable.gouv.fr/catalogue?page=dataset&datasetId=631b03afb61e5c6479370169 (accessed on 17 December 2024).
  68. CRE. Arrêtés Tarifaires Photovoltaïques en Metropole, Open Data. Available online: https://www.cre.fr/documents/open-data/arretes-tarifaires-photovoltaiques-en-metropole.html (accessed on 20 December 2024).
  69. Photovoltaique.info. Connaître les Coûts et Evaluer la Rentabilité. Available online: https://www.photovoltaique.info/fr/preparer-un-projet/quelles-demarches-realiser/choisir-son-modele-economique (accessed on 18 December 2024).
  70. ADEME. Coûts Des Energies Renouvelables et de Récupération en France, Faits et Chiffres, Librairie ADEME. 2022. Available online: https://librairie.ademe.fr/energies-renouvelables-reseaux-et-stockage/5460-couts-des-energies-renouvelables-et-de-recuperation-en-france.html (accessed on 17 December 2024).
  71. Ramasamy, V.; Feldman, D.; Desai, J.; Margolis, R.U.S. Solar Photovoltaic System and Energy Storage Cost Benchmarks: Q1 2021; NREL/TP-7A40-80694; MainId:77478; National Renewable Energy Laboratory: Golden, CO, USA, 2021; p. 1829460.
  72. Insee. Taux D’inflation—Données Annuelles de 1991 à 2022. Available online: https://www.insee.fr/fr/statistiques/4268033 (accessed on 18 December 2024).
  73. U.S. Bureau of Labor Statistics. Variance Estimates for the Consumer Price Indexes. Bureau of Labor Statistics. Available online: https://www.bls.gov/cpi/tables/variance-estimates/home.htm (accessed on 18 December 2024).
  74. Fourquet, J.; Jussian, L. Les Français et les Energies Renouvelables: Sondage Ifop Pour le Syndicat Des Energies Renouvelables. 2021. Available online: https://www.ifop.com/publication/les-francais-et-les-energies-renouvelables-3/ (accessed on 4 December 2024).
  75. Pratviel, E. Les Français et L’électricité. 2017. Available online: https://www.ifop.com/publication/les-francais-et-lelectricite/ (accessed on 4 December 2024).
  76. Ministère de L’environnement, de L’énergie et de la Mer. En Charge des Relations Internationales Sur Le Climat, les Ménages et la Consommation D’énergie. 2017. Available online: https://www.statistiques.developpement-durable.gouv.fr/sites/default/files/2018-10/thema-01-menages.pdf (accessed on 5 December 2024).
  77. World Radiation Data Centre. Available online: http://wrdc.mgo.rssi.ru/ (accessed on 15 December 2024).
  78. Ministère de la transition écologique. Arrêté du 8 Octobre 2021 Modifiant la Méthode de Calcul et les Modalités d’établissement du Diagnostic de Performance Energétique. Annexe 1: Méthode de Calcul 3CL-DPE; Journal Officiel De La République Française: Paris, France, 2021.
  79. LENOX; COSTIC. Règles de l’Art Grenelle Environnement (RAGE) 2012, Installations D’eau Chaude Sanitaire Confort, Prévention des Risques et Maîtrise Des Consommations; COSTIC: Saint-Rémy-lès-Chevreuse, France, 2014; ISBN 978-2-35443-264-5. [Google Scholar]
  80. Perez, N.; Riederer, P.; Inard, C. Development of a multiobjective optimization procedure dedicated to the design of district energy concept. Energy Build. 2018, 178, 11–25. [Google Scholar] [CrossRef]
  81. Fonseca, J.A.; Nguyen, T.A.; Schlueter, A.; Marechal, F. City Energy Analyst (CEA): Integrated framework for analysis and optimization of building energy systems in neighborhoods and city districts. Energy Build. 2016, 113, 202–226. [Google Scholar] [CrossRef]
Figure 1. Representative timeline of an urban development project (in yellow, the stage on which we focus in this work).
Energies 19 01550 g001
Figure 2. Schematic view of the proposed CSC simulation workflow.
Energies 19 01550 g002
Figure 3. Comparison of the average daily profile of appliances consumption for a sample of 100 dwellings from the measured data (ELECDOM [57]) and modeled with CREST.
Energies 19 01550 g003
Figure 4. Illustration of the distinction between project uncertainties and risk.
Energies 19 01550 g004
Figure 5. Group of buildings used in the case study and their technical characteristics.
Energies 19 01550 g005
Figure 6. Results of the Morris screening for the 6 KPIs. The bars present the mean elementary effect (μ*) for each input parameter, and the crosses indicate the ratio of the standard deviation to the mean effect (σ/μ*). The scale for the latter metric was adjusted for better readability.
Energies 19 01550 g006
Figure 7. Consumption and production load profiles at a 15-min timestep over a week at different periods of the year.
Energies 19 01550 g007
Figure 8. Variation of the NPV at 20 years in relation to PV CAPEX, CSC tariff, and feed-in tariff. The results are provided without (a) and with (b) the end-user satisfaction taken into consideration (quantified with the PWI), which affects the participation rate.
Energies 19 01550 g008
Figure 9. Evolution of the estimated risk of achieving a negative NPV in relation to the number of parameters considered as uncertain, thus sampled randomly (10,000 simulations for each case, sampled with the Latin hypercube method).
Energies 19 01550 g009
Figure 10. Distribution of Participation Willingness Index results from Latin hypercube sampling on the 5 most influential parameters on the NPV (left) and on the PWI (right). Each sampling corresponds to 10,000 simulations.
Energies 19 01550 g010
Table 1. List and description of key performance indicators (KPIs) used in the present study.
KPIDescriptionReferences
SCRSelf-consumption rate:
Ratio of total self-consumed energy over the total self-produced energy.
Concerned stakeholders: Project owner and design team, CSC investors/operators, DSO.
[9,23,33,34]
S C R = T o t a l   E n e r g y   s e l f c o n s u m e d T o t a l   E n e r g y   s e l f p r o d u c e d (1)
SSRSelf-sufficiency rate:
Ratio of the total self-consumed energy over the total energy demand.
Concerned stakeholders: Project owner and design team, CSC investors/operators, DSO.
[9,23,33,34]
S S R = T o t a l   E n e r g y   s e l f c o n s u m e d T o t a l   E n e r g y   d e m a n d (2)
NPVNet-present Value:
The difference between the present value of cash inflows and outflows generated by the investment over the lifetime of the project, considering the time value of money.
Concerned stakeholders: Project owner and design team, CSC investors/operators.
[9,29,35,36,37,38]
N P V = n = 0 N b y e a r s P V i n c o m e n P V O P E X n 0 × 1 + i n 1 + d n P V C A P E X (3)
where d   and   i   are   respectively   the   discount   rate   and   inflation   rate ,   n   is   the   year ,   n 0   is   the   first   year ,   and   N b y e a r s   is   the   analysis   period .   P V i n c o m e is the income received from selling PV electricity to local end-users and injecting surplus into the grid. P V C A P E X   and   P V O P E X are investment and maintenance costs, respectively.
ABRAverage annual bill reduction:
Average difference in electricity bills over Nbyears between participating end-users with and without the CSC operation.
Concerned stakeholders(s): Local authorities, end-users.
[15,21,23,39,40]
A B R = 1 N b p × N b y e a r s p = 1 N b p B i l l p , C S C B i l l p , d e f a u l t (4)
where p is for participant, N b p is the number of participants in the CSC project, N b y e a r s is the number of years the analysis is carried out (for example 20 years). B i l l p , C S C   and   B i l l p , d e f a u l t are the invoices related to the end-users’ electricity purchases, with and without PV, respectively.
PWIParticipation willingness index:
Ratio of prosumers gaining a minimal desired outcome over the total of participants. In this study, 5% reduction in the yearly bill (calculated over Nbyears) is considered as the minimal satisfactory outcome.
Concerned stakeholders(s): Local authorities, CSC investors/operators.
[41]
P W I = N b p s a t i s f i e d N b p (5)
where N b p s a t i s f i e d is the total number of participants achieving satisfying savings
JIJain index:
An indicator assessing resource allocation fairness (sometimes referred to quality-of-service indicator).
Concerned stakeholders(s): Local authorities, end-users.
[21,22,42,43]
J I = p = 1 N b p B i l l p , C S C B i l l p , d e f a u l t   2 N b p p = 1 N b p ( B i l l p , C S C B i l l p , d e f a u l t ) 2   (6)
Table 3. Comparison of the simulated consumption results from the URBANopt simulation and reference values.
URBANoptReferenceSource
Heating consumption (kWh/m2)1512[78]
Domestic hot water demand (kWh/m2)2825–30[79]
Plug load consumption (kWh/dwelling)2201.002228.00[57]
Disclaimer/Publisher’s Note: The statements, opinions and data contained in all publications are solely those of the individual author(s) and contributor(s) and not of MDPI and/or the editor(s). MDPI and/or the editor(s) disclaim responsibility for any injury to people or property resulting from any ideas, methods, instructions or products referred to in the content.